Abstract
Development of electromobility in urban areas requires an appropriate level of vehicle charging infrastructure. Numerous methods for siting of charging stations have been developed to date, and they appear to be delivering diverse outcomes for the same area, which is why local authorities face the problem of choosing the right station layout. The solution proposed in this article is to use a travel planner to evaluate the distribution of charging stations over the area of a metropolis. The decision making support is achieved by determining optimal travel routes for electric vehicles according to their initial state of charge for the three selected station siting methods. The evaluation focused on the following three aspects: (1) number of travels that cannot be made (due to the lack of a charging station at a certain distance around the start point), (2) extension of the travel caused by the need to recharge the vehicle on-route, and (3) additional energy consumption by electric vehicles required to reach the charging station (necessity of departing from the optimal route). An analysis of the results has made it possible to determine a solution which is superior to others. For the case study analysed in the paper, i.e., the territory of the Metropolis of Upper Silesia and Dabrową Basin (Górnośląsko-Zagłębiowska Metropolia, GZM), the distribution of charging stations established in line with method I has returned the best results. What the method in question also makes possible is to indicate a safe minimum energy reserve to complete the travel by eliminating situations of unexpected vehicle immobilisation due to on-route energy depletion and by minimising the phenomenon referred to as range anxiety.
1. Introduction
Transport leaves a significant mark on the natural environment. The negative impact of transport takes diverse forms, primarily including the emission of harmful substances, noise, and the resulting traffic obstructions caused by congestion. Research explicitly shows that the world is largely dependent on petroleum (in terms of mobility and transport) [1,2]. At the same time, the right to mobility is considered as an important value, and in accordance with the relevant guidelines, minimisation of negative environmental impact of transport cannot be pursued through mobility limiting, but rather through efficient utilisation of natural resources [3]. Current trends pertaining to the sphere of alternative fuels highlight electricity as a viable option, among other solutions. It is possible to accelerate the desired changes in the share of alternative fuels in transport through infrastructure development, implementation of shared technical specifications, as well as changes in the image of the related technologies (consumer acceptance).
In order to effectively manage a municipality, numerous factors that are considerably related to transport and energy must be taken into account. What stands out in this respect is the need for proper planning of development in both these spheres as well as for mutual coexistence within an organism, such as a city.
The increase in the number of electric cars observed in municipal roads is determined by such factors as the existing support infrastructure. On the other hand, further development of electromobility requires decisions concerning the siting of new charging stations to be made on a continuous basis. The problem of optimised arrangement of charging stations within the given territory is often addressed in the literature of the subject (among others [4,5,6,7,8,9,10]). Authors take numerous criteria into consideration, while the actual application of the methods they propose brings different outcomes (due to differences in the infrastructure setup in individual cities). One of the subjects commonly addressed is the relations between vehicle transfers and the existing electrical network, different parking space policies, or use of the existing petrol stations as sites for charging stations, etc. Facing such circumstances, local authorities have a difficult choice to make, and not only with regard to the in-city locations where charging stations are to be installed, but also when considering the method assumed to deliver good results in the given case. This issue was the research gap which required an adequate method of support for the decision making process to be developed by comparing specific potential layouts of charging stations.
The method proposed in this article is intended to support local authorities in choosing between different arrangement variants for charging stations. This proves particularly important when considering areas of low electromobility development maturity. The method is based on the use of a tool which is one of the deliverables of an international project the “Electric travelling—platform to support the implementation of electromobility in Smart Cities based on ICT applications” within the scope of ERA-NET CoFund Electric Mobility Europe Programme financed among others from the means of the National Centre for Research and Development. Main goal of the project is to accelerate the development of electromobility in cities. It is an original travel planner, known as ETPlanner, which has been used to study a number of proposed spatial arrangements of charging stations. The territory analysed under the research is a metropolitan area in the south of Poland, characterised by a dense transport network. It was divided into ca. 300 zones in which locations corresponding to the origin and destination points of travel were subsequently established. Using a set compiled in such a manner, optimum travelling routes were then identified using ETPlanner, assuming that they were to be covered by means of an electric car with its battery charged to different levels. The results thus obtained have been analysed and discussed in this paper.
In light of the above goals, the article has received the following structure: Section 2 is a review of the existing methods for optimal siting of electric vehicle charging stations, and the selected ones have been implemented against a defined area (Section 3); details of the method proposed for evaluation of the layout of charging stations using the multimodal travel planner in question, i.e., ETPlanner, have been provided in Section 4; the layouts of charging stations were studied by the method proposed, while the selected research results have been provided in Section 5 and discussed in Section 6; and Section 7, which concludes the article, provides specific insights and defines future research plans for the body of problems addressed in the paper.
2. Optimal Siting of Electric Vehicle Charging Stations—Review of Selected Methods
The development of electromobility requires special attention to be paid to the infrastructure used for charging of electric vehicles (EV). The low number of stations, their inefficient siting and poor parameters, when combined, constitute a barrier to further popularisation of electric vehicles. There are also fundamental infrastructural problems connected with the charger type in use, the location of EV charging stations as well as their number that should be located within the given area. In light of these issues, attempts were made to identify the locations where electric vehicle charging stations should be established. To this end, the existing methods for siting of charging stations were reviewed, and three of them were selected for application in practice. The testing ground chosen for the studies was the GZM Metropolis (Górnośląsko-Zagłębiowska Metropolia) situated in the southern part of Poland. The studies on the optimal method for siting of charging stations constituted input data for a multimodal travel planner enabling evaluation of the arrangement of charging stations based on the results obtained for various travel scenarios.
2.1. Overview of the Methods Used for Optimal Siting of Charging Stations
The literature of the subject mentions numerous approaches to the problem of optimal siting of electric vehicle charging stations.
The authors of article [11] performed a three-dimensional analysis of a territory using a multi-criteria factor analysis and a method of hierarchical process analysis. The paper elaborates upon a method used to determine the weights of the factors; however, it disregards the way in which ratings are to be assigned. The greatest weight was attributed to the factors associated with the distance to green areas (as much as 32%), while the second most important factor was the one that which described the quality of the given area. The analyses employed in the method were performed on the basis of interpolation of pixel values, and the results were presented as a heat map.
A different concept of a method for determining the locations of charging stations was discussed in paper [12], with the potential locations being analysed with reference to the existing infrastructure. The Voronoi diagram was used to divide the area subject to analysis and search for new charging station sites. Additionally, the locations characterised by the longest time of waiting for vehicle charging were identified using the vehicles’ positioning data. A similar approach was presented in paper [13], where the matter of accessibility of the existing charging stations was analysed against the distance in the road network.
A charging station siting method based on input data connected with the number of travels made and the vehicle use intensity was proposed in [14]. What was also attempted under that study was a search for locations intended for public and private charging points. The results of the relevant analyses were presented for large administrative regions.
The authors of paper [15] proposed a two-stage method for charging station siting through an analysis first performed in a macro-scale (in the case described, the territory was entire Hungary), and in the micro-scale in the second stage (the Budapest district). The analysis they proposed was based on hexagon-shaped primary areas. The conclusions thus formulated imply that it is necessary to install the charging stations at Park and Ride facilities and near locations with highly concentrated service points, while the locations of the existing petrol stations are not good sites for charging stations.
In the study described in paper [16], a fuzzy hierarchical analysis of the process was applied. The outcome was a comparison of the identified potential sites with the existing infrastructure of charging stations. Based on 15 factors grouped into three categories (environment, economy, and urban planning), six weight assignment scenarios were proposed, combined with verification of changes in the utility of the parcels assumed for the charging station sites. The authors highlighted that the scenario should be ultimately chosen on account of the relevance of the factors, as perceived by the given decision maker.
Paper [17] proposes a different approach to the problem of siting of charging stations for electric vehicles, namely two-step linear programming. The purpose of this approach is minimisation of the costs incurred by the charging station owners. The method described in the said paper is based on using the electricity distribution network. Paper [18] provides an analysis of the sites chosen for hybrid stations using renewable energy sources. The charging stations subject to the study are designed for both electric vehicles and natural gas vehicles.
The method described in paper [19] is characterised by a large amount of input data, namely the factors subject to analysis, being as many as 34, divided into aspects that positively and negatively affect the potential location of charging stations. The factors were checked to establish if they occurred in the given squares, and then the layer of results was built—one which concerned the overall evaluation of the given square. On such a basis, the utility of the given space assumed as a potential charging station site was established.
The paper submitted under the Joint Research Centre of the European Commission [20], elaborating upon a search for an optimal site for electric vehicle charging stations, was divided into two parts addressing the national and municipal level. The former entailed searching for potential charging station locations along national roads, considering the directionality of the road network and the auxiliary infrastructure. This part was not taken into account in the selected methods, since it did not meet the pre-assumed conditions. The latter part, pertaining to the city level, included a division of the analysed area into a grid of 100 × 100 m, and introduced factors increasing the area’s potential for the siting of charging stations. Additionally, special buffers reflecting the impact of the given factor on the area were taken into account, while the factors themselves were expressed in point- and polygon-based ratings. The study in question covered the territory of the Italian town of Bolzano.
The method presented in paper [21] is based on a multi-criteria analysis of input factors combined with a fuzzy hierarchical analysis of the process. The authors proposed 10 factors affecting the charging station siting potential of the analysed areas. Unlike in the other methods, a factor was analysed not only for whether or not it was present in the area in question, but also in terms of the distance of the given area from the factor in a straight line, and that provided grounds for ratings. The AHP (analytic hierarchy process) analysis was divided into two scenarios concerning environmental impact and accessibility, followed by a fuzzy hierarchical analysis aimed to deliver the final weights for the selected factors.
Based on the foregoing review of the methods proposed in the literature of the subject as the means to search for optimal locations of electric vehicle charging stations, three were selected and applied in the metropolitan area subject to the research. The choice of the methods for further investigation was related to the assumptions previously adopted:
- The selected method should comprise a complete description enabling it to be applied in any area (other than that described in the literature).
- The method must not be based on the existing EV charging infrastructure, and the territories subject to analysis must not be larger than 100 m × 100 m (making it possible to establish the potential charging station location on the map with a relatively high accuracy).
- The selected methods should be universal in nature, highlighting areas of high potential from the EV charging perspective.
As discussed further on in this paper, the said methods for siting of charging stations were chosen with reference to papers [19,20,21], and then used in practice in the GZM Metropolis.
The chosen methods represent diversified approaches to the searching optimal sites for EV charging stations. Method [19] takes the largest number of station siting factors (24) into consideration, being the only one among those selected which also identifies negative factors that are unfavourable to the charging infrastructure. A single pre-defined rating is assigned when the given factor emerges in the primary area. On the other hand, method [20] takes the fewest factors (6) into account, but they are more extensive, e.g., a single factor comprises multiple public utility buildings. It is also the sole method which includes buffer zones of the given factor’s impact on its environment. The overall rating of the given factor under this method does not result directly from the ratings it has been assigned, but stems from the number of occurrences of the given factor in the primary area, which is subsequently normalised (Equation (1)). Method [21] comprises 10 factors, being the only one where ratings are based on a 1–5 grading scale and depend on degree to which the given condition has been met. The method is also the only one which takes into account the straight line distance between specific factors and centroids of primary areas.
2.2. Description of the Selected Methods
Three methods were selected for further research, and their detailed assumptions as well as the outcomes of their application in the area subject to analysis have been presented in the following section of the paper. The chosen methods share some common features, such as the identical base area of analysis forming a grid of 100 m × 100 m, and the application of vector-based geo-information recorded as polygons and points.
2.2.1. Method I
The first of the selected methods was described in article [19]. The authors originally assumed using 34 layers of factors associated with the territorial division of the analysed area. With such a division in mind, for the purpose of this article, 24 layers of factors were left, and they have been provided in Table 1.

Table 1.
Factors with ratings, affecting the potential of the primary area for siting of an EV charging station as per method I, based on [19].
The authors divided these factors on account of their either positive or negative impact on the primary area’s potential to host an EV charging station. Individual elements of the environment were given negative rating points to reduce the potential of low-utility areas. Moreover, the existing charging stations were also assigned negative rating points to avoid close distances between stations. The authors also decided to give negative rating points to residential areas, since they had assumed that private EV charging facilities would exist in these locations. The population’s rating for the given primary area was assigned on the basis of the mean value of all primary areas in the analysed territory [15].
Each layer with the data concerning the factors in question (Table 1) was transformed into a grid corresponding to an area of 100 m × 100 m. Where an element of the given factor intersected with the grid, an assessment rating was given as per Table 1. In the final step, the grids containing individual ratings were superimposed to obtain the final result with a sum of ratings for all primary areas of the territory subject to the analysis.
2.2.2. Method II
The authors of the second method put into practice, described in paper [20], used the 6 factors presented in Table 2. The analysis was conducted for a territory divided into primary areas of 100 m × 100 m. All input data were buffered in order to account for the impact of the given factor on the surrounding area. An example of a buffer zone has been shown in Figure 1.
Table 2.
Factors affecting the potential of the primary area for siting of an EV charging station as per Method II, based on [20].
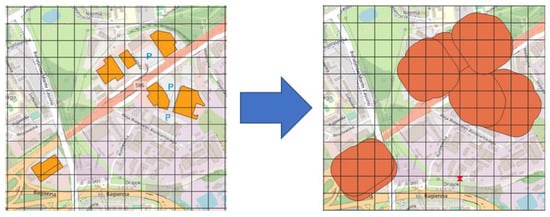
Figure 1.
Example of buffering of the polygon layer of commercial buildings.
For the electrical network, the buffer was 50 m (it was assumed that longer transfers could be difficult to complete), while for other items in Table 2 a value of 100 m was assigned on account of the maximum acceptable walking distance of 300 m (example provided in Figure 2).
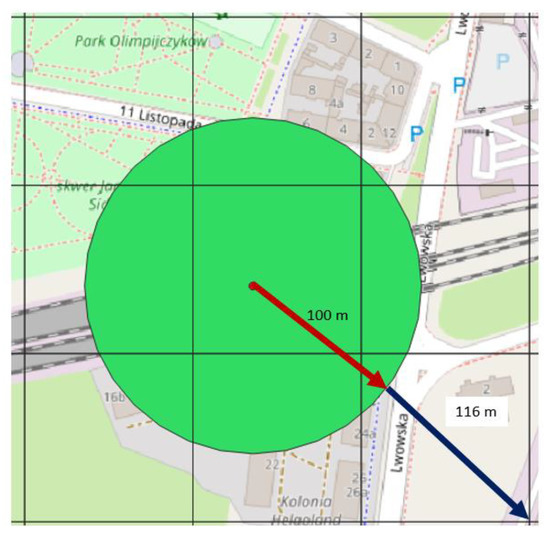
Figure 2.
Maximum distance from the centre of a polygon or a point to the nearest corner of an intersecting primary area.
Figure 2 illustrates a geometrical analysis where the point buffer radius (100 m) combined with 100 × 100 m cells results in a maximum Euclidean distance of less than 300 m between the centre of a point and the outermost corner of the adjacent cell.
Once the factors have been buffered, the number of instances of the given factor in the primary area is counted. This procedure was identical to all the factors except the electrical network, for which only zeroes or ones were assigned depending on whether or not the infrastructure was present, as well as for the population, for which the actual value established for the given primary area is assigned. Then the number of instances of the given factor in the cell was normalised (Equation (1)).
where
SCORE(i) = value(i) × 10/max,
i—number of the given primary area,
value(i)—value of the given factor in the primary area, and
max—maximum value of the given factor for all primary areas of the given layer.
Once the results had been normalised, factor evaluation values were determined to range between 0 and 10. In the next step, the final evaluation was calculated for each basic area (Equation (2)) comprising the layers of individual factors and their weights.
Layer_electricty_network × (layer_file1 × factor1+layer_file2 × factor2+ …),
The authors of method [16] proposed that equal weights of 0.2 should be used for each layer; however, they also stressed that this method can be modified as needed to obtain results which account for the greater impact of the given factor on the choice of the charging station site. Furthermore, what was proposed in the article is that this factor is to be disregarded as needed and depending on how accurate the mapping of the electrical network layer is.
2.2.3. Method III
The authors of method [21] introduced 10 factors (C1–C10) in their analysis aimed at finding an optimal site for charging stations (Table 3). A rating method was assigned to each factor. The territory of analysis was divided into primary areas of 100 m × 100 m each. The data obtained for the monetary factors were provided in the Turkish currency, as in the original article. It was then converted into the Polish currency to match the conditions of the territory subject to examination. For the road factor, the distance between centroids and national as well as regional roads was checked. With regard to public transport stations, the entire selection of the means of public transport was taken into account along with all places enabling passengers to travel.
Table 3.
Factors affecting the potential of the primary area for siting of an EV charging station as per method III, including the rating method [21].
According to this method, in the first stage, individual factors are assigned ratings to account for their occurrence in the given primary area and their distance from the centre of the primary area. Figure 3 provides an example of how a straight line distance from each primary area centroid to the nearest object located in the layer of the analysed factor was determined.
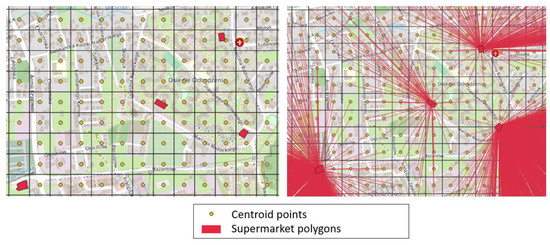
Figure 3.
Example of determination of a straight line distance from each primary area centroid to the nearest object located in the layer of the analysed factor.
Next, the AHP analysis [21] was performed, broken down into two scenarios concerning the environmental impact and accessibility of charging stations. The final stage was a fuzzy hierarchical analysis of the process aimed at obtaining the final factor weights. Table 4 summarises the weights obtained for two scenarios as well as the final weights delivered by the fuzzy AHP analysis.
Table 4.
Weights of the factors affecting the potential of the primary area for siting of an EV charging station as per method III [21].
The highest value of the environmental impact scenario weights was obtained for the green areas factor (0.5583), which was due to the attempt to make transport more distant from green areas as well as the low utility value of the areas indicated. For the final weights, this factor gained the highest value; however, its impact on the results was lower, −0.1590. For the accessibility scenario, the maximum value was obtained for the distance between the centroid and the main roads.
3. Case Study
The area of analysis is the GZM Metropolis which currently consists of 26 municipalities (of which 13 have the rights of an administrative district—Polish “powiat”), 2 urban-rural communes, and 13 rural communes. It lies in the central part of the Silesian Province (Polish województwo śląskie) and an area of 2553 km2, which accounts for ca. 20.70% of the entire province area. The territory of the GZM Metropolis is inhabited by 2,244,850 people. It is diversified in terms of the population density, ranging between communes with ca. 3000 persons per km2 and those with a very low population density, barely reaching 100 (persons/km2). Figure 4 shows the location of the Metropolis against the Silesian Province. The territory is located in the south of Poland.
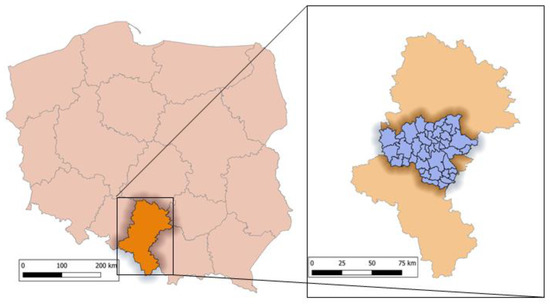
Figure 4.
Location of the research area against the entire Silesian Province and Poland.
The polygon, point and raster input data required to apply the methods in question were obtained from the following sources:
- web-based portal: OpenStreetMap®,
- open-source data from the GZM website: https://otwartedane.metropoliagzm.pl/dataset,
- data on public transport from the Board of Metropolitan Transport,
- inclinations established on the basis of the area’s numerical terrain model,
- terrain parameters based on the data of the Central Statistical Office,
- inhabitants’ income based on the data of the Central Statistical Office,
- population density based on the data of the Central Statistical Office, and
- data concerning the electricity distribution network and individual transformer sites according to the data made available by the electricity distributors operating in specific municipalities of the Metropolis.
3.1. Results of Application of the Charging Station Siting Methods in the Territory of the GZM Metropolis
Figure 5 illustrates the results obtained in respect of the potential of the primary areas for siting of electric vehicle charging stations according to the three aforementioned methods (and for two variants for the second method) with regard to the analysed territory of the GZM Metropolis.
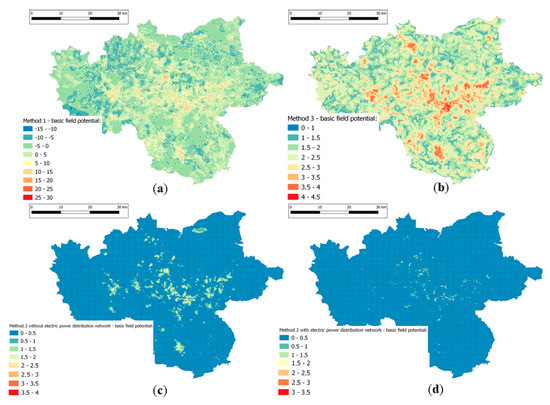
Figure 5.
Results concerning the potential of the primary areas as per the selected methods: (a) method I; (b) method III; (c) method II—variant disregarding the electricity distribution network; and (d) method II—variant considering the electricity distribution network.
An analysis of Figure 5 highlights evident differences between the potentials of primary areas depending on the method used. Method I is characterised by an even distribution of high-potential primary areas in space. The results of method III form large clusters of primary areas of similar potential. In method II, the fact of having included the electricity distribution network clearly affects the results and limits the potential sites for the charging stations to a considerable extent.
3.2. Number of Charging Stations Along with Potential Locations
In the next stage of the research, the number of charging stations expected to suffice to service the given area of analysis was to be defined. In this respect, one must take into account the Polish Act of 11 January 2018, on electromobility and alternative fuels, which defines the number of charging stations that should be built in municipalities by the end of 2020 depending on their population [22]. In accordance with this law, cities with more than 100,000 inhabitants should have charging stations. On such grounds, a statistical analysis of the number of inhabitants was performed for the GZM Metropolis cities, and the number of charging points was determined. Table 5 compares the municipalities of the GZM Metropolis with more than 100,000 inhabitants and states the number of chargers that should be installed in the respective cities.
Table 5.
Population, number of charging stations, and area of the municipalities of the GZM Metropolis with more than 100,000 inhabitants [22].
The cities where charging stations should be installed occupy an area of ca. 36.07% of the total area analysed, while the inhabitants of these areas account for ca. 66.86% of the entire population of the GZM Metropolis. Based on the analysis of the relevant provisions of the said act, it was established that the total number of charging stations in the research area should be 740. Two variants were adopted on such grounds:
- siting of charging stations in accordance with the act (number and municipalities), and
- siting of charging stations without taking the municipality-related restrictions into account (the established number of 740 stations remains but applies to the entire territory of the GZM Metropolis).
Figure 6 provides a comparison of the results obtained by methods I and III for the two variants, indicating 740 primary areas with the highest potential: without any restrictions for the entire GZM Metropolis and with the restrictions imposed on the towns indicated in Table 5.
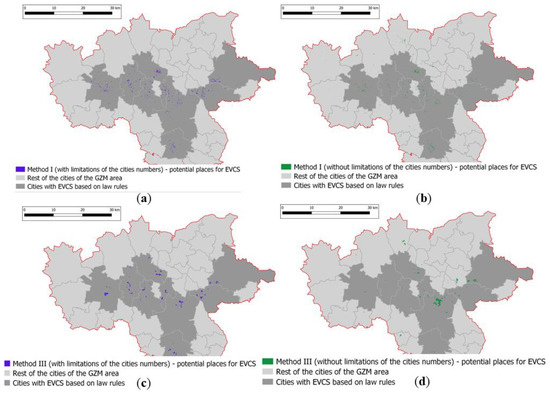
Figure 6.
Results obtained for 740 primary areas of the highest potential as per the following methods: (a) method I taking into account the restrictions imposed by the law on the municipalities; (b) method I without taking into account the restrictions imposed by the law on the municipalities; (c) method III without taking into account the restrictions imposed by the law on the municipalities; and (d) method III without taking into account the restrictions imposed by the law on the municipalities.
An analysis of Figure 6 clearly highlights the clusters of sites with the highest potential as per method III, while method I distribute the potential sites more evenly across the analysed area. In Figure 6b,d, where the entire area is analysed, only a small number of potential sites are outside the major towns listed in Table 5 (marked in dark grey). Under method I, 30% of all primary areas are to be found outside the major towns, and 20.4% of them under method III. For a large fraction of the area subject to analysis (63.93% of the whole), the methods have pointed at a small number of potential charging station sites due to the low values of the factors which strengthened the potential of the primary areas.
Figure 7 provides a comparison of the results obtained under method II for two scenarios (regarding and disregarding the electricity distribution network) and variants, identifying 740 primary areas of the highest potential in each, without restrictions for the entire GZM Metropolis and with those restrictions imposed on the municipalities indicated in Table 5.
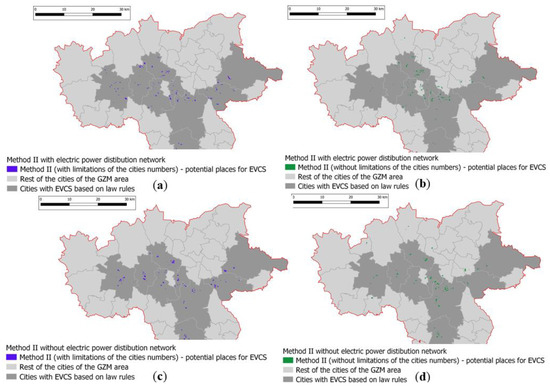
Figure 7.
Results obtained for 740 primary areas of the highest potential under method II for the variant that takes into account the restrictions imposed by the law on the municipalities (a,c), and without taking into account the restrictions imposed by the law on the municipalities (b,d); Figures (a,b) illustrate the scenario which accounts for the electricity distribution network, while Figures (c,d)—the scenario which disregards the electricity distribution network.
Under the scenario which takes the electricity distribution network into consideration and disregards the municipality-related restrictions, 20.5% of the charging stations are to be found outside the major towns, while 19.86% of the primary areas have been identified under the scenario which disregard the electrical network. For all the results thus obtained, there are similarities in the distribution of the primary areas showing the highest potential, which is due to having taken into account similar factors affecting the area rating.
4. Using a Travel Planner to Assess the Distribution of Charging Stations over the Area of a Municipality
The siting of charging stations in a municipal area depends on their intended use. They may be designed for EV recharging during long-distance journeys, in which case charging stations are best located along major transit routes and at motorways. However, this article focuses on the stations installed in an urban development system, whose purpose is to enable ad hoc recharging on short routes or leaving the vehicle in the charging mode once it has arrived at the destination point. The choice of the right method for siting of charging stations can be supported by a numerical analysis of the impact of the charging station arrangement on travelling by means of electric vehicles. One of the applications developed under the Electric Travelling project was used to assess the distribution of charging stations over a specific area (the GZM Metropolis, in this case). ETPlanner is an elaborate and multimodal travel planner which extends the features of the tool described in paper [23]. The algorithms implemented in the program make it possible to find optimal travelling routes for a dozen or so modes of travelling, including the use of an electric vehicle. Moreover, the planner suggests to the travelling person which charging station would be optimal for the selected travel criterion when the vehicle’s energy level is too low to cover the entire distance of the journey. The latter property was used for purposes of the method proposed. The planner’s operating principle is a server-based query processing service. Queries can be submitted by the travelling person using a graphical user interface available on a webpage. In this case, a query is initially built via the interface by selecting the right options, such as the means of transport, the start and end point, the optimisation criterion, and optionally some additional parameters depending on the chosen means of transport, whereupon the query is submitted. An alternative is sending commands directly to the server via the tool’s software (ready-to-use query structure), which enhances the fast result processing and storage capability.
The planner’s road layout is described by a network graph. The shape of the graph depends on the Open Street Map (OSM) data [24]. Individual vertices and arcs of the graph are assigned parameters which enable different optimised route search criteria to be applied. In order for the origin-to-destination route optimisation algorithms to function properly, the travel planner must process a road network parameterised by information on individual edges of the graph, including data defining the road section length and permissible speed (the planner can also take into account some dynamic data of the average speed recorded in the road sections, provided that they can be retrieved from the town’s Smart Transport System) available in OSM, inclination data extracted from the numerical terrain model, as well as temperature (actual or seasonal average). Depending on the travelling mode examined, what the tool requires is either the timetables and locations of stops for individual means of public transport, or the current location of the available vehicles being dynamically uploaded for the car sharing services. Most importantly, the tool makes it possible to simulate different layouts of charging stations, as imported by the user into the planner’s network graph.
Consequently, the method in question proceeds in two stages:
- Stage I—collecting data on the potential travelling routes between defined points of origin and destination, independently for all the examined charging station layout variants, and
- Stage II—comparison and analysis of results.
The method used to evaluate the spacing of the charging stations required a large number of queries about optimal routes, taking different EV battery charge levels into account. The locations of the points of origin and destination were centroids of 304 transport districts (zones) into which the territory in question was divided, meaning that 92,112 queries were submitted to the travel planner in each series. These querying series comprised the following scenarios:
- Travelling with an electric vehicle assuming that there is no charging station,
- travelling with an electric vehicle assuming the layout of charging stations as per method I,
- travelling with an electric vehicle assuming the layout of charging stations as per method II in the variant which accounts for the electricity distribution network,
- travelling with an electric vehicle assuming the layout of charging stations as per method III,
- travelling with an electric vehicle assuming diverse initial battery charge level, and
- two vehicle segments.
For each method, the distribution of the charging station sites was assumed to disregard the restrictions imposed on the actual municipalities (740 stations scattered over the entire territory of the GZM Metropolis). What the authors also assumed was that the charging stations were identical, i.e., Type 2 with 7.4 kW of power capacity (mentioned as the most popular type, e.g., in [25,26,27]). Such a distribution is more natural, which has made it possible to present the method as a universal approach to this kind of analysis (with the prospect of the method implementation for other areas).
The possibility of completing a transfer by means of an electric vehicle was studied on different vehicle battery charge levels, starting from 50% and assuming a 1% increment/decrement. Additionally, a minimum charge level, below which the vehicle could not be started, was set at 5% (approx. 15 km).
The relevant tests were performed using vehicles of the two most popular segments:
- Segment B, including BMW i3, Hyundai Kona, Kia Niro, Kia Soul Electric, and Renault Zoe; and
- Segment C, including Hyundai Ioniq Electric, Nissan Leaf, and Volkswagen e-Golf.
The route optimisation criterion was assumed to be time, which is also the main criterion taken into account by the travelling population [28].
A total of 360 series of input data combinations were tested, resulting in more than 33 million queries submitted to ETPlanner. The submitted queries comprised data of a specific location, namely, geographical coordinates of the start and end points of the travel, as well as the date and time of the travel beginning. Defining a day and a specific time of that day for the query to be generated affects the characteristics of the transfers made in the simulated transport system. The fixed parameters assumed for the query were the means of transport, namely an electric vehicle, distinguishing between two popular segments, and the optimisation criterion based on the travel time minimisation, including electric vehicle charging as required. With regard to the characteristics of the electric vehicle’s power source and its charging at the simulated stations, what the queries submitted to the ETPlanner application defined was the initial vehicle battery level, the minimum permissible battery level for which the route seeking procedure was performed, as well as the plug type. Further parameters that were also defined, affecting the function of the vehicle charging and discharging, included the battery capacity, number of phases, vehicle weight, and ambient temperature.
Having read a route planning query from a file, ETPlanner generates an output file, and having received 33 million queries, it analogically provided 33 million replies. The output files contain information which describe the completed travels in a direct form, as well as information on the possibility of completing the travel, its duration, route, actual distance, energy consumption, need for charging and charging time, all with reference to individual travels. Through aggregation, division, and statistical operations performed on the set of data thus obtained, one can create various collations, including those described in Section 5.
In order to prepare such a large set of queries, a tool for generating queries of pre-defined parameters needed to be developed and implemented, as described above, in the Visual Studio 2017 programming environment suitable for the C++ language. This programming environment was further used to develop and implement a tool that compared the 33 million replies previously obtained in an aggregated form making it possible to effectively determine correlations and formulate conclusions on the basis of the simulated arrangements of charging stations over the given area, as well as to apply the matrix of travels.
5. Results
The data on travelling between individual zones within the area subject to analysis made it possible to prepare the collations provided in this section of the paper. The test results were compared by taking the following three aspects into consideration:
- Number of travels that cannot be made—this translates into limitation of mobility with regard to electric vehicles (on a specific vehicle battery charge level).
- Travel extension due to the need for vehicle recharging on-route—depending on the locations of the charging stations, they may cause the necessity of significantly departing from the original (optimal) route.
- Energy consumption by electric vehicles—also in this case, specific arrangement of the charging stations can trigger higher energy consumption which makes travelling longer (longer charging time), but first and foremost, causes higher total energy consumption, which can be important for the city.
Table 6 compares the basic values measured for the analysed travels made by means of an electric vehicle which did require on-route recharging (the battery charge level sufficed to cover the entire distance with a 5% energy reserve). The mean travel length was 24.5 km.
Table 6.
Total values obtained for the transfers on the test routes, assuming no need for on-route recharging.
Table 7 and Table 8 provide the data of the travels which can be completed assuming that there are no charging stations available and when comparing their diverse layouts. For the B-segment vehicles, the need for on-route recharging was identified starting from a 30% battery charge level. For the C-segment vehicles, this level was 38%. The inability to recharge the vehicle depending on which method of the charging station siting had been used was identified at a much lower battery charge level, i.e., 8–9% for the B-segment vehicles and 10–11% for the C-segment vehicles. The share of the travels not completed and those successfully made with recharging has been illustrated in Figure 8 and Figure 9.
Table 7.
Number of travels completed under all the scenarios analysed, compared for an area without charging stations and an area with the three alternative layouts of charging stations. Results obtained for the B-segment vehicles.
Table 8.
Number of travels completed under all the scenarios analysed, compared for an area without charging stations and an area with the three alternative layouts of charging stations. Results obtained for the C-segment vehicles.
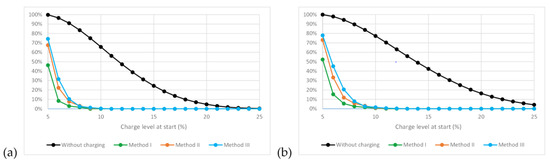
Figure 8.
Percentage of non-completed travels in the absence of charging stations within the area, and for the three analysed charging station siting methods depending on the vehicle battery charge level at the travel start: (a) B-segment vehicles; (b) C-segment vehicles.
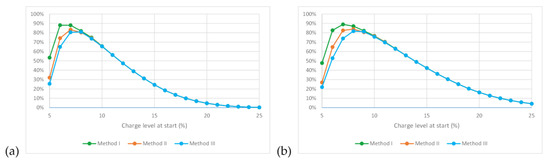
Figure 9.
Percentage of recharged vehicles as per the three analysed charging station siting methods depending the vehicle battery charge level at the travel start: (a) B-segment vehicles; (b) C-segment vehicles.
On account of the recharging necessity, some of the travels needed to be extended by the distance required to reach the charging station. The route extension values have been illustrated with a factor that compares the length of the transfer completed with the visit at the charging station and the unaltered route (assuming that the vehicle had departed the point of origin fully charged). Selected combinations of these values have been provided in Table 9 and Table 10 and in Figure 10. The maximum value of the mean route extension was recorded for the charging station layout established using method III, but even so the value did not exceed 9%. However, one should note that depending on the vehicle battery charge level at the time of departure from the travel start point, the length of the selected routes could even be greater than twice the optimal route.
Table 9.
Comparison of the travel route extension factors on account of the on-route recharging necessity for the three charging station layouts—values obtained for the transfers which required recharging. Results obtained for the B-segment vehicles.
Table 10.
Comparison of the travel route extension factors on account of the on-route recharging necessity for the three charging station layouts—values obtained for the transfers which required recharging. Results obtained for the C-segment vehicles.
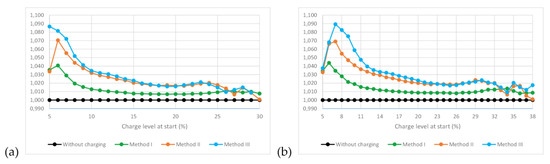
Figure 10.
Route extension factor values obtained for the transfers completed with recharging as per the three analysed charging station siting methods depending the vehicle battery charge level at the travel start: (a) B-segment vehicles; (b) C-segment vehicles.
The last group of results pertains to energy consumption. It was decided that, in this case, the energy consumption increase would be established as the difference between the energy consumed by an electric vehicle that needed to be recharged on-route and the energy it would have consumed without recharging (assuming that the vehicle had been fully charged when departing from the travel start point). Depending on the layout of the charging stations, this value determined the additional energy needed to reach the charging station. Table 11 and Table 12 summarise these values for the different EV battery charge levels. What the tables clearly highlight is the increase in the mean value of the additional energy consumption as the pre-travel vehicle battery charge level declines (Figure 11).
Table 11.
Comparison of the values of energy consumption increase on account of the on-route recharging necessity for the three charging station layouts—values obtained for the transfers which required recharging. Results obtained for the B-segment vehicles.
Table 12.
Comparison of the values of energy consumption increase on account of the on-route recharging necessity for the three charging station layouts—values obtained for the transfers which required recharging. Results obtained for the C-segment vehicles.
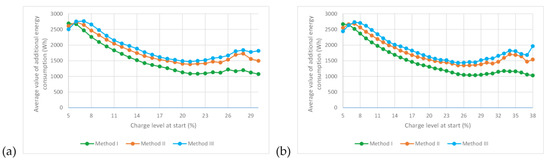
Figure 11.
Mean additional energy consumption values obtained for the transfers completed with recharging as per the three analysed charging station siting methods depending the vehicle battery charge level at the travel start: (a) B-segment vehicles; (b) C-segment vehicles.
6. Discussion
The research discussed in the paper has revealed differences in the utility value of charging stations as per the diverse scenarios of their siting in the town. Bearing in mind the need to promote eco-friendly solutions, electromobility, including electric vehicles, is one of the trends which calls for further promotion [29]. One of the reasons why the development of electromobility is hampered appears to be the travelling population’s anxiety about the limitations caused by the necessity of the vehicle recharging on-route, referred to as range anxiety (more broadly discussed in [30,31], inter alia). At the same time, it should be noted that vehicle recharging by means of municipal charging stations usually proceeds much faster than charging at home. Therefore, when assessing the distribution of charging stations over the area of a municipality, it is important to determine the share of travels which cannot be completed. The research performed by the authors implies that the locations chosen as potential charging station sites by application of the three analysed methods are all characterised by high efficiency, since the inability to reach the destination point was recorded only for some vehicles, and only when their initial battery charge level was lower than 8–9% (B-segment vehicles) or 10–11% (C-segment vehicles) at the start of the travel. The conclusion that follows is that users of electric vehicles should maintain a larger energy reserve in order to be sure that they reach the destination. The author of certain papers made an assumption that the minimum state of charge should be kept at 20% [32]. However, depending on how long the travel was to be, the need for onroute recharging was observed starting from 30% (B-segment vehicles) and 38% (C-segment vehicles). Nevertheless, it should be noted that, in this respect, the travels could be successfully completed despite the on-route recharging.
Every need for recharging makes it necessary to depart from the optimal route and additionally head for a charging station. The tool used in the research, namely the travel planner, made it possible to select a specific charging station, considering the given layout of charging stations, for which the total travel time would be the shortest and the travel could be completed in reality (i.e., the vehicle battery charge level upon the arrival at the charging station would not fall below the safe reserve of 5%). However, the analyses performed by the authors showed the degree to which the route should be extended in order to make the travel completion possible. For the vehicle battery charge level at the travel start ranging up to more than 12%, the mean route extension on the charging station layout as per method I did not exceed 1%. When using methods II and III, the mean route extension was higher, reaching 2.7% and exceeding 3%, respectively. However, for some travels, it was determined that the distance of twice the optimal route length was significantly exceeded. Figure 12 and Figure 13 summarise and compare the route extension factors in histograms of the series of data distribution for successive vehicle battery charge levels at the travel start.
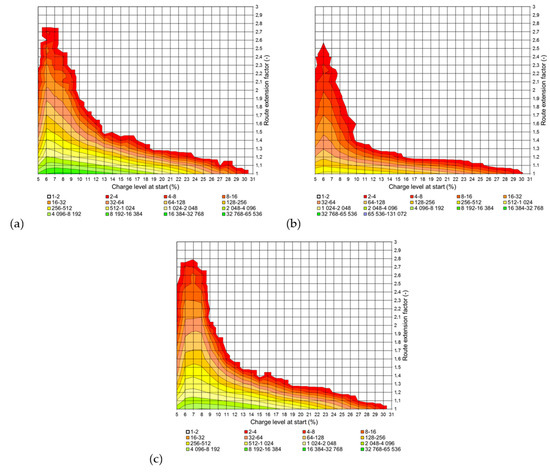
Figure 12.
Route extension factor values aggregated in series of distribution depending of the vehicle battery charge level at the travel start (B-segment vehicles) for different charging station layouts as per (a) method I, (b) method II, (c) method III, respectively.
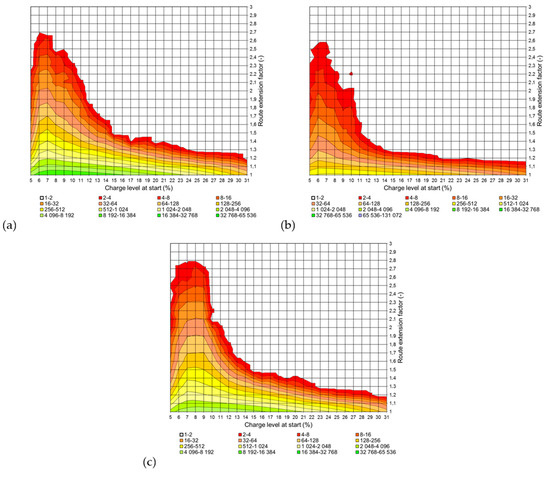
Figure 13.
Route extension factor values aggregated in series of distribution depending of the vehicle battery charge level at the travel start (C-segment vehicles) for different charging station layouts as per (a) method I, (b) method II, (c) method III, respectively.
When analysed for the B-segment vehicles, the graphs (Figure 12) clearly imply aggregation of the number of route extension factors in the initial histogram formation range, i.e., for a 7–8% vehicle battery charge level at the travel start, regardless of the methods proposed for the siting of charging stations. At the same time, the graph behaviour (Figure 12a, method I) indicates that the route extension factor increases the least under methods II and III, as illustrated in Figure 12b,c, respectively.
For the C-segment vehicles, analogically to the B-segment ones, the analysis of the above graphs implies aggregation of the number of route extension factors in the initial histogram formation range, i.e., for a 7–8% vehicle battery charge level at the travel start, regardless of the methods proposed for the siting of charging stations. At the same time, the graph behaviour (Figure 13a, method I) indicates that the route extension factor increases the least under methods II and III, as illustrated in Figure 13b,c, respectively. Thus, the layout of the charging stations proposed as per method I, regardless of the vehicle segment assumed, is characterised by the best distribution of the stations over the territory of the GZM Metropolis subject to the research, which is confirmed by a lower number of route extension cases.
Different spatial arrangement of the charging stations entails differences in the energy consumption by the electric vehicles performing transfers with necessary recharging. From the perspective of municipalities, this is an important decision making factor affecting the choice of the charging station siting method. The research results have showed that, for the travels completed with on-route vehicle recharging, assuming the basic battery charge level (above 11% of the battery capacity), where method I was used, the mean consumption increase ranged at 1–2 kWh, while for the charging station layout obtained by methods II and III, the additional energy consumption was ca. 1 kWh higher.
This provides local authorities with valid information concerning the total energy consumption. However, since the research covered only selected travels (between 304 transport territories in the area subject to analysis), such collations have not been included in this article, since they do not exhaust the actual demand—the actual number of travels within the analysed area. The evaluation method proposed in this paper basically focuses on the accessibility of charging stations over the entire area. However, it should be noted that the total number of battery electric vehicles currently in operation in Poland does not exceed 7000 (data as of the end of June 2020 [33]), which—in the authors’ option—makes the analysis covering over 92 thousand transfers performed within a relatively small area a convincing sample for the chosen part of the country’s territory (ca. 8.2% of the area of Poland, ca. 5.8% of the total population of Poland).
The methods analysed in the article for in-city siting of electric vehicle charging stations have ultimately made it possible to establish the potential according to which a given area of 100 m × 100 m could be assessed as more or less relevant to installation of charging stations. Therefore, for the sake of the most transparent presentation of the method proposed for the evaluation of the layout of charging stations, it was assumed that, in the areas of the highest potential, identical Type 2 charging stations with a capacity of 7.4 kW would be installed. However, it should be noted that such a mode of evaluation can also be applied to charging stations of different types when using the travel planner. The layout of the charging stations, including specification of their plug types, power capacity, and the current station occupancy, provides the input to the network graph in the travel planning tool. Considering the present unavailability of the given charging station, the travel planner can take into account not only the physical occupancy by an electric vehicle being charged, but also the current grid overloading (having received the relevant information form the electricity distribution network operator).
7. Conclusions and Further Research
The authors of the article have proposed that a travel planner should be used to analyse the alternative scenarios for siting of charging stations. This would provide local authorities with significant decision making support. In the case study discussed in the paper, the optimum layout of charging stations from the perspective of the potential to complete travels was produced by method I. However, it should be noted that such a result does not necessarily mean that this siting method will prove superior in other urban areas. What the research results take into account is the local conditions, and primarily the road network layout, and the evaluation process should definitely be repeated for another area.
Having determined an adequate layout of charging stations by taking the specifics of the given area into consideration, one can continue to mould the development of the municipal electrical power supply and distribution system in such a manner as to deliver energy to the designated locations intended for installation of charging stations.
The method proposed in the paper can also be used to increase the travelling population’s confidence in the use of electric vehicles in the given area, even in situations when the vehicle is not 100% charged. The route calculation process takes the vehicle recharging option into account. Research makes it possible to identify a safe energy reserve for a travel to be completed without recharging as well as for a travel that includes on-route recharging in a manner which ensures that the vehicle is not immobilised on the way, thus minimising the phenomenon referred to as range anxiety.
It is planned that the analyses to be performed under further research should account for the actual transfers performed by the travelling population (field surveys), which does not affect the method itself, but may increase the accuracy of the results it delivers. The series of travels pre-assumed for and examined in the article are combinations of centroids of 304 transport territories, and when combined with the review of the available travelling alternatives, they reflect a wide range of individual transfers. As demonstrated in the article, the current size of the fleet of battery electric vehicles in Poland substantiates the approach adopted by the authors. For a large number of such vehicles operated in a relatively small area, using the matrix of travels based on real-life data makes it possible to take also some other research problems into consideration, like those related to charging station sharing during the day. One of further important problems to be addressed in the future research is the need for scheduling of vehicle charging procedures, while temporary occupancy of each charging station makes it necessary for vehicle users to either queue or to plan a visit to another charging station, more distant from the optimal route. However, in order to account for this problem in a simulation of a series of travels, one must know not only the actual traffic streams, but also their distribution in time (variability over the day).
Author Contributions
Conceptualization, G.S.; methodology, G.S., M.S., and M.J.K.; software, G.S. and M.S.; validation, G.S. and M.S.; formal analysis, G.S. and M.S.; investigation, G.S. and M.S.; resources, M.S. and M.J.K.; data curation, M.S.; writing—original draft preparation, G.S., M.S., and M.J.K.; writing—review and editing, G.S., M.S., and M.J.K.; visualization, G.S., M.S., and M.J.K.; supervision, G.S.; and project administration, G.S. All authors have read and agreed to the published version of the manuscript.
Funding
This research was funded by National Centre for Research and Development grant number EME/02/ELECTRICTRAVELLING/2018 and The APC was funded by National Centre for Research and Development.
Acknowledgments
The present research has been financed from the means of the National Centre for Research and Development as a part of the international project within the scope of ERA-NET CoFund Electric Mobility Europe Programme “Electric travelling—platform to support the implementation of electromobility in Smart Cities based on ICT applications”.

Conflicts of Interest
The authors declare no conflict of interest.
References
- White Paper: Roadmap to a Single European Transport Area—Towards a Competitive and Resource Efficient Transport System. Available online: https://ec.europa.eu/transport/themes/strategies/2011_white_paper_en (accessed on 1 August 2020).
- White Paper on the Future of Europe, Reflections and Scenarios for the EU27 by 2025. Available online: https://euagenda.eu/publications/white-paper-on-the-future-of-europe (accessed on 1 August 2020).
- Communication from the Commission to the European Parliament, the Council, the European Economic and Social Committee and the Committee of the Regions: Clean Power for Transport: A European Alternative Fuels Strategy. Available online: https://eur-lex.europa.eu/legal-content/EN/ALL/?uri=CELEX%3A52013PC0017 (accessed on 1 August 2020).
- Lin, X.; Sun, J.; Ai, S.; Xiong, X.; Wan, Y.; Yang, D. Distribution Network Planning Integrating Charging Stations of Electric Vehicle with V2G. Int. J. Electr. Power Energy Syst. 2014, 63, 507–512. [Google Scholar] [CrossRef]
- Kazemi, M.A.; Sedighizadeh, M.; Mirzaei, M.J.; Homaee, O. Optimal Siting and Sizing of Distribution System Operator Owned EV Parking Lots. Appl. Energy 2016, 179, 1176–1184. [Google Scholar] [CrossRef]
- Shareef, H.; Islam, M.M.; Mohamed, A. A Review of the Stage-Of-The-Art Charging Technologies, Placement Methodologies, and Impacts of Electric Vehicles. Renew. Sustain. Energy Rev. 2016, 64, 403–420. [Google Scholar] [CrossRef]
- Alhazmi, Y.A.; Mostafa, H.A.; Salama, M.M.A. Optimal Allocation for Electric Vehicle Charging Stations Using Trip Success Ratio. Int. J. Electr. Power Energy Syst. 2017, 91, 101–116. [Google Scholar] [CrossRef]
- Fernández, G.; Torres, J.; Cervero, D.; García, E.; Alonso, M.A.; Almajano, J.; Machín, S.; Bludszuweit, H.; Sanz, J.F. EV Charging Infrastructure in a Petrol Station, Lessons Learned. In Proceedings of the 2018 International Symposium on Industrial Electronics (INDEL), Banja Luka, Republic of Srpska, 1–3 November 2018; pp. 1–6. [Google Scholar]
- Hayajneh, H.S.; Zhang, X. Evaluation of Electric Vehicle Charging Station Network Planning via a Co-Evolution Approach. Energies 2020, 13, 25. [Google Scholar] [CrossRef]
- Staniek, M.; Sierpiński, G. Charging Station Distribution Model - The Concept of Using the Locations of Petrol Stations in the City. In Modern Traffic Engineering in the System Approach to the Development of Traffic Networks; Macioszek, E., Sierpiński, G., Eds.; Advances in Intelligent Systems and Computing; Springer: Cham, Switzerland, 2020; Volume 1083, pp. 99–113. [Google Scholar]
- Guler, D.; Yomralioglu, T. Optimal Location Selection for Electric Vehicle Charging Stations Using GIS. In Proceedings of the 7th International Conference on Cartography and GIS, Sozopol, Bulgaria, 18–23 June 2018; pp. 340–345. [Google Scholar]
- Qiao, Y.; Huang, K.; Jeub, J.; Qian, J.; Song, Y. Deploying Electric Vehicle Charging Stations Considering Time Cost and Existing Infrastructure. Energies 2018, 11, 2436. [Google Scholar] [CrossRef]
- Gagarin, A.; Corcoran, P. Multiple domination models for placement of electric vehicle charging stations in road networks. Comput. Oper. Res. 2018, 96, 69–79. [Google Scholar] [CrossRef]
- Namdeo, A.; Tiwary, A.; Dziurla, R. Spatial Planning of Public Charging Points Using Multi-Dimensional Analysis of Early Adopters of Electric Vehicles for a City Region. Technol. Forecast. Soc. Chang. 2014, 89, 188–200. [Google Scholar] [CrossRef]
- Csiszár, C.; Csonka, B.; Földes, D.; Wirth, E.; Lovas, T. Urban Public Charging Station Locating Method for Electric Vehicles Based on Land Use Approach. J. Transp. Geogr. 2019, 74, 173–180. [Google Scholar] [CrossRef]
- Erbaş, M.; Kabak, M.; Özceylan, E.; Çetinkaya, C. Optimal Siting of Electric Vehicle Charging Stations: A GIS-Based Fuzzy Multi-Criteria Decision Analysis. Energy 2018, 163, 1017–1031. [Google Scholar] [CrossRef]
- Faridpak, B.; Gharibeh, H.F.; Farrokhifar, M.; Pozo, D. Two-Step LP Approach for Optimal Placement and Operation of EV Charging Stations. In Proceedings of the 2019 IEEE PES Innovative Smart Grid Technologies Europe (ISGT-Europe), Bucharest, Romania, 29 September–2 October 2019; pp. 1–5. [Google Scholar]
- Faridpak, B.; Alahyari, A.; Farrokhifar, M.; Momeni, H. Toward Small Scale Renewable Energy Hub-Based Hybrid Fuel Stations: Appraising Structure and Scheduling. IEEE Trans. Transp. Electrif. 2020, 6, 267–277. [Google Scholar] [CrossRef]
- Zhang, Y.; Iman, K. A Multi-Factor GIS Method to Identify Optimal Geographic Locations for Electric Vehicle (EV) Charging Stations. Proc. Int. Cartogr. Assoc. 2017, 1, 127. [Google Scholar] [CrossRef]
- Gkatzoflias, D.; Drossinos, Y.; Zubaryeva, A.; Zambelli, P.; Dilara, P.; Thiel, C. Optimal Allocation of Electric Vehicle Charging Infrastructure in Cities and Regions. Available online: https://ec.europa.eu/jrc/en/publication/eur-scientific-and-technical-research-reports/optimal-allocation-electric-vehicle-charging-infrastructure-cities-and-regions (accessed on 16 July 2020).
- Dogus, G.; Yomralioglu, T. Suitable Location Selection for the Electric Vehicle Fast Charging Station with AHP and Fuzzy AHP Methods Using GIS. Ann. GIS 2020, 26, 169–189. [Google Scholar]
- Lasocki, K.; Michajlow, P. Act of 11 January 2018 on Electromobility and Alternative Fuels. Available online: https://www.lexology.com/library/detail.aspx?g=d8293bd4-b4fc-4d0d-a5e9-fb4cfb0db75d (accessed on 16 July 2020).
- Sierpiński, G. Technologically advanced and responsible travel planning assisted by GT Planner. In Contemporary Challenges of Transport Systems and Traffic Engineering; Macioszek, E., Sierpiński, G., Eds.; Lecture Notes in Network and Systems; Springer: Cham, Switzerland, 2017; Volume 2, pp. 65–77. [Google Scholar]
- Open Street Map. Available online: http://www.openstreetmap.org (accessed on 3 August 2020).
- Spöttle, M.; Jörling, K.; Schimmel, M.; Staats, M.; Grizzel, L.; Jerram, L.; Gartner, J. Research for TRAN Committee-Charging Infrastructure for Electric Road Vehicles. 2018. Available online: https://www.europarl.europa.eu/thinktank/en/document.html?reference=IPOL_STU(2018)617470 (accessed on 16 July 2020).
- European Alternative Fuels Observatory. Available online: https://www.eafo.eu/alternative-fuels/electricity/charging-infra-stats (accessed on 13 July 2020).
- Ślusarczyk, B. Electromobility for Sustainable Transport in Poland. In Energy Transformation Towards Sustainability; Tvaronavičienė, M., Ślusarczyk, B., Eds.; Elsevier: Amsterdam, The Netherlands, 2019; pp. 199–218. [Google Scholar]
- Jayasinghe, A.; Sano, K.; Kasemsri, R.; Nishiuchi, H. Travelers’ Route Choice: Comparing Relative Importance of Metric, Topological and Geometric Distance. Procedia Eng. 2016, 142, 18–25. [Google Scholar] [CrossRef][Green Version]
- Tucki, K.; Orynycz, O.; Świć, A.; Mitoraj-Wojtanek, M. The Development of Electromobility in Poland and EU States as a Tool for Management of CO2 Emissions. Energies 2019, 12, 2942. [Google Scholar] [CrossRef]
- Philipsen, R.; Brell, T.; Biermann, H.; Ziefle, M. Under Pressure—Users’ Perception of Range Stress in the Context of Charging and Traditional Refueling. World Electr. Veh. J. 2019, 10, 50. [Google Scholar] [CrossRef]
- Chen, R.; Liu, X.; Miao, L.; Yang, P. Electric Vehicle Tour Planning Considering Range Anxiety. Sustainability 2020, 12, 3685. [Google Scholar] [CrossRef]
- Mao, T.; Zhang, X.; Zhou, B. Intelligent Energy Management Algorithms for EV-charging Scheduling with Consideration of Multiple EV Charging Modes. Energies 2019, 12, 265. [Google Scholar] [CrossRef]
- Electromobility Counter. Polish Alternative Fuels Association. Available online: http://pspa.com.pl/ (accessed on 3 August 2020).


© 2020 by the authors. Licensee MDPI, Basel, Switzerland. This article is an open access article distributed under the terms and conditions of the Creative Commons Attribution (CC BY) license (http://creativecommons.org/licenses/by/4.0/).