Article

Non-Intrusive Identification of Load Patterns in Smart Homes Using Percentage Total Harmonic Distortion

by
Hari Prasad Devarapalli
1,2,*,
V. S. S. Siva Sarma Dhanikonda
2 and
Sitarama Brahmam Gunturi
1
1
Tata Consultancy Services, Hyderabad 500081, T.S., India
2
Department of Electrical Engineering, National Institute of Technology Warangal, Warangal 506004, T.S., India
*
Author to whom correspondence should be addressed.
Energies 2020, 13(18), 4628; https://doi.org/10.3390/en13184628
Submission received: 3 August 2020 / Revised: 29 August 2020 / Accepted: 3 September 2020 / Published: 6 September 2020
(This article belongs to the Special Issue Demand Response in Smart Grids)

Abstract

:
Demand Response (DR) plays a vital role in a smart grid, helping consumers plan their usage patterns and optimize electricity consumption and also reduce harmonic pollution in a distribution grid without compromising on their needs. The first step of DR is the disaggregation of loads and identifying them individually. The literature suggests that this is accomplished through electric features. Present-day households are using modern power electronic-based nonlinear loads such as LED (Light Emitting Diode) lamps, electronic regulators and digital controllers to reduce the electricity consumption. Furthermore, usage of SMPS (Switched-Mode Power Supply) for computing and mobile phone chargers is increasing in every home. These nonlinear loads, while reducing electricity consumption, also introduce harmonic pollution into the distribution grid. This article presents a deterministic approach to the non-intrusive identification of load patterns using percentage Total Harmonic Distortion (THD) for DR management from a Power Quality perspective. The percentage THD of various combinations of loads is estimated by enhanced dual-spectrum line interpolated FFT (Fast Fourier Transform) with a four-term minimal side-lobe window using a LabVIEW-based hardware setup in real time. The results demonstrate that percentage THD identifies a different combination of loads effectively and advocates alternate load combinations for recommending to the consumer to reduce harmonic pollution in the distribution grid.

Graphical Abstract

1. Introduction

Demand Response (DR) provides an opportunity for consumers to play a significant role in the operation of the electric grid by reducing or shifting their electricity usage from peak time to off peak and/or altering their usage pattern in response to time-based tariffs or other forms of financial incentives to improve Power Quality (PQ). DR also plays an important role in a smart grid in helping consumers plan their consumption pattern and optimize electricity usage without compromising on their needs [1,2,3], and is made possible through (i) identification of unnecessary consumption of electricity at an individual appliance level, (ii) alerting consumers with timely information that helps to balance the load between appliances and (iii) leading to reduced bills. DR is approached through the following four steps:
  • Identification of load features;
  • Load disaggregation;
  • Developing insights into consumption behavior;
  • Actionable recommendations.

1.1. Identification of Load Features

In the past 30 years, researchers have tried several diverse electrical and non-electrical features to uniquely identify all types of home appliances with different operation modes [4]. Event-based techniques have been employed to identify turn-on and turn-off events.
The identification of electrical appliances is possible through their electrical behavior (active power (P) reactive power (Q), voltage (V), current (I), harmonics, power factor (pf), phase angle, etc.). Moreover, PQ and VI trajectories were used as described in [5,6,7]. These parameters can be at a steady state or transient (turned on). There is some research using non-electrical behaviors such as light emitted (lumens), heat generated (joules), vibration and sound (noise), EMF (Electromagntic Field) produced, etc. If we employ non-electrical behavior to recognize appliances, then we need respective sensors to collect data for analysis. While this method can be considered as non-intrusive from an electricity point of view, it is an expensive proposition and may be invasive from a personal privacy point of view.
A detailed literature review was presented by Antonio Ruano et al. in [4]. As per the review article, the observations of various load features for disaggregation are 1. active power and reactive power, 2. voltage, current and fundamental phase angle, 3. average displacement power factor, 4. VI trajectory and current vectors, 5. steady-state current transients, 6. PQ disturbance trajectories, 7. third and fifth harmonic amplitudes, 8. average Total Harmonic Distortion (THD), 9. the maximum magnitude of the first eight harmonics 10. The rate of change of transient signals, 11. Shannon and Reini entropies, 12. the spectral band energy of the current spectrum, 13. wavelet transform coefficients, 14. features of power spectrum density, 15. occupancy data, 16. usage patterns and 17. Electro-Magnetic Interference (EMI) signals.
It is quite evident that, initially, researchers tried the active power of the load and its steady-state active power (P) features that are readily available in an energy meter for load disaggregation, which requires a low sampling rate at the time of data acquisition. Later, it was found that, due to the additive nature of active power, it is only useful and deterministic when the power ratings of appliances are distinct, and the sum of the power ratings of various combinations of appliances in operation is also distinct. Therefore, the active power feature is suitable mostly for high-power appliances and is not helpful to discern the simultaneous operation of appliances with the same ratings. Later, researchers employed transient power features [8] (ON slope at the start and step changes) to detect appliance status at a higher sampling frequency (high to very high). Load features such as steady-state power characteristics versus transient power characteristics, capturing events like turn-on step changes, are quite cumbersome. Some researchers used multiple harmonics [9] and the harmonic phase [10,11], since they are induced by nonlinear loads, which are small in amplitude.

1.2. Load Disaggregation

Once the features are decided as discussed above, they are used to discern the start time and duration of operation of the appliances. There have been several attempts by various researchers to disaggregate loads using multiple electrical and non-electrical features [4]. Usually, a power supplier provides a single energy meter outside the premises and records the cumulative energy consumption since its installation. Periodic billing (bill cycles) is calculated by subtracting the current reading from the reading taken at the previous bill cycle and applying a tariff. This procedure does not allow the consumer (i) to realize opportunities for saving energy at an appliance level and (ii) to prevent unnecessary consumption before it happens. The most effective method for load disaggregation is to meter the power at every appliance, termed appliance-level monitoring (ALM) [12]. G.W. Hart [13] recognized that ALM is highly prohibitive due to (a) the high number of appliances in use, (b) the various types of appliances and (c) inconsistent times and durations of operation of appliances at home. He proposed, for the first time, in 1992 that there is a need for identifying individual loads without sub-metering [13,14] and termed this Non-Intrusive Appliance Load Monitoring (NIALM), which is now referred to as Non-Intrusive Load Monitoring (NILM).
There are various ways to discern appliances using digital signal processing (DSP), wavelet transform (WT) and artificial intelligence (AI). Recently, machine learning (ML) [15] and deep learning (DL) techniques have been trialed for this purpose. In particular, two types of ML, namely supervised learning (e.g., classification) and unsupervised learning (e.g., clustering), have been widely used for NILM [16,17,18,19,20,21,22,23,24]. Load features and the selected disaggregation technique decide the sampling rate for data acquisition for the desired accuracy.
A concise and updated review of the various features reported in the literature for NILM and a comprehensive feature selection from a benchmarked dataset are reported in [25]. A multi-objective evolutionary algorithm is proposed in [26], where five objective functions using active power, apparent power, reactive power, current waveform, and harmonics as load signatures are established to identify several electrical appliances. Antonio Ruano et al. [4] carried out an exhaustive review of disaggregation approaches, including the most recent ones, namely machine learning and deep learning, and they are 1. the Hidden Markov Model (HMM), 2. Deep Neural Networks (D-NN), 3. k-NN (K-nearest neighbors) classifiers, 4. Naïve Bayes Classifiers, 5. Tensor and Matrix Factorization, 6. NN auto encoders, 7. Graphic Signal Processing, 8. Multi-Layer Perceptron, 9. linear searches of databases, 10. Maximum a Posteriori probability, 11. fuzzy “C” means, 12. Discriminative Disaggregation Sparse Coding, 13. The Factorial Hidden Markov Model, 14. hierarchical HMM, 15. variants of HMM, 16. Viterbi Decoding, 17. density-based spatial clustering of applications with noise, 18. quadratic discriminant analysis, 19. Modified Combinatorial Optimization, 20. Long- and Short-Term Memory Recurrent Neural Networks, 21. Karhunen–Loève Spectral Decomposition, 22. iterative subsequence dynamic time warping, 23. particle filtering, 24. Maximum a Posteriori (MAP) criteria, 25. Gaussian Process Classifiers, 26. rule-based classifiers, 27. decision trees, 28. Adaboost classifiers, 29. several supervised classifiers, 30. Self-Optimizing Mapping (SOM), 31. Particle Swarm Optimization, 32. Ant Colony Optimization, 33. Siamese Artificial NN, 34. PCA (Principal component analysis), 35. location-aware energy disaggregation frameworks, and microscopic power features and pattern recognition (reported for NILM in [27]).
It is noted that all of these methods are non-deterministic and hence non-repeatable, which are useful for predictions with some certainty, but not to the extent that the inferences and insights of these methods are beneficial for their deployment in production for consumers to respond in real time and realize the benefits then and there. Furthermore, these methods draw correlations, not causations, to effectively convince consumers to change their behavior.
A comparison between traditional non-deterministic NILM methods versus proposed deterministic methods is illustrated in Table 1, and gives reasons for the limitations of machine learning and deep learning techniques over the proposed deterministic experimental approach.
The realization of benefits and the value of DR lie in the accurate measurement of a load feature that could be used by employing a suitable load feature that can determine, with certainty, the consumer demand and suggest alternate propositions for a better response, either from an energy conservation or PQ perspective.

1.3. Developing Insights on Consumption Behavior for Reducing Harmonic Pollution

Most often, the purpose of NILM is stated as potential savings in energy consumption [28]. All the techniques listed in the previous section are data intensive and require high computing power for application in real-time DR and are uneconomical for this purpose. Moreover, these methods are developed for energy conservation only. DR requires a simplification of the approach and should be fast enough to recommend possible opportunities for savings.

1.4. Actionable Recommendations

After disaggregation, the appliance usage pattern of consumers should be analyzed to ascertain opportunities for energy savings or PQ improvement and should recommend the same. The consumer may decide to act upon these recommendations. The consumer benefit lies in the reduction in the unnecessary usage of high-power appliances such as geysers, air conditioning and HVAC (heating, ventilation, and air conditioning). However, the power ratings of these appliances are becoming greener and smarter day by day. At the same time, energy savings on account of the usage of low-power appliances (SMPS, mobile chargers, CFL (compact fluorescent lamp), LED) are not remunerative enough to the consumer. By reviewing the previous literature [29], Kelly, J. et al. assessed that the reduction in domestic electricity consumption on average is 0.7–4.5% only. Usually, consumers are conscious about the usage of high-power appliances, whereas low-power appliances are not considered from an energy savings point of view. Zhuang, M. [30] highlights that there are other good reasons why we need NILM of appliances that employ electronic controls for load demand forecasting accuracy, to provide better criteria for utilities to decide on generation. For the grid operators, NILM additionally allows flexible resource management for DR and tackles the uncertainty derived from renewable sources, apart from energy savings.

1.5. Summary and Proposal

Interestingly, all of the research is focused on energy savings from the high-power appliances of a household, which are usually not a big concern for utilities. The simplification of the DR approach with reasonable accuracy and reliability is the main characteristic that drives its adoption. A schematic of the DR management system is shown in Figure 1, and the generic process is self-explanatory.
The literature suggests that harmonics, harmonic phasors and percentage THD features are used for NILM. A.S. Bouhouras et al. [31] employed a simple lookup table and used the summation of the first three odd harmonic phasors. A non-intrusive discriminant analysis of loads based on PQ data was reported in [32], where classifiers based on linear and quadratic discriminant analysis were implemented. Household appliance classification using lower odd-numbered harmonics and the bagging decision tree approach was detailed in [33]. A.S. Bouhouras et.al [34] employed entropies and spectral band energy to specified frequency bands of the current spectrum to simplify the identification of appliances and accomplished good results. All of these methods adopted deep learning, machine learning and/or statistical methods. Moreover, these approaches considered DR management from an energy conservation perspective but not from a PQ perspective.
Consumers are not paying for the harmonic power induced by nonlinear appliances, which are up to 20% above their real consumption, as energy meters ignore harmonic currents. Harmonics, due to the low electronic power loads of consumers, are disregarded due to their low power consumption; however, the harmonic diction levels are very high. This issue was highlighted by a survey report in 2015 by the Government of India in the name of Swachh Power [35]. There are various ISO(International Organization for Standardization) standards and guidelines such as IEC (International Electrotechnial Commission) 61000-3-2, 61000-4-30 and IEEE (The Institute of Electrical and Electronics Engineers) 519-2014 for harmonic estimation and control [35].
The THD percentages of loads were established by O Deepu et.al [36] for three different loads—CFL, personal computer, and uninterrupted power supply—and were found to be distinct. The percentage THD of current harmonics for these loads is found to be 72, 125, and 35, respectively. Marko Dimitrijević [17] measured the first 39 harmonics for six different appliances and various combinations of these appliances in operation.
In the opinion of authors of this article, the quality of power is more critical for utilities than for power savings in smart homes. The authors would like to approach DR from a PQ point of view rather than to reduce power consumption. If any conventional methods or intrusive methods are used to identify the load patterns, they would not throw light on the harmful impact of harmonics introduced by the pervasive use of low-power nonlinear loads, and hence would not lead to improving PQ from a harmonics perspective. Two standards, namely, IEEE 519-2014 and IEC 61000-3-2 and the Central Electricity Authority guidelines recommend reducing the percentage THD from both utility and consumer perspectives. The understanding of the authors of this article is that this approach is very much needed to impress upon consumers and utilities the urgency of this issue. The industry can adopt this solution if percentage THD is measured, and we offer insights into further actions that can be taken.
Low-power non-linear load harmonic compensation is not addressed individually; therefore, the authors understand that accurate estimation of low-power harmonics and their corresponding percentage THD will identify the consumer loads effectively. The authors propose to use the percentage THD of steady-state harmonics, which is distinct for individual appliances and different combinations of appliances. In this article, the authors propose a novel solution that uses the uniqueness of percentage THD to identify which set of appliances is in operation at any point in time without any ambiguity. This solution is the first of its kind, to the best of our knowledge, that establishes the efficient disaggregation of energy consumption at the appliance level. DR management using percentage THD is depicted in Figure 2.
NILM has been applied mostly to high-power appliances (50 W and above) from a power conservation perspective. There is insufficient research on percentage THD conservation induced by low-power nonlinear loads (less than 100 W), which is a big challenge of today in our distribution systems. For the first time, we tackle a problem that is not addressed as required by IEEE 519-2014, IEC 61000-3-2 standards and Central Electricity Authority guidelines. NILM is discussed in this article to bring the state-of-the-art research into context and to contrast with the proposed approach.
The major contributions are:
  • The measurement of percentage THD using enhanced dual-spectrum line interpolated FFT (EDLIFFT) with a four-term minimal side-lobe window (4MSW) [37] for various real-world loads.
  • The development of real-time load pattern identification for DR using a LabVIEW-based virtual instrumentation test bed.
  • The recommendation of load patterns for DR management using a lookup table.
This paper is organized as follows: Section 2 discusses the method for the measurement of percentage THD. Section 3 describes the real-time measurement of percentage THD using EDLIFFT with a 4MSW on NI-LabVIEW for various combinations of real-world appliances. Section 4 discusses the results and establishes that percentage THD is a reliable single feature to identify the load consumption pattern; Section 5 concludes with a brief recap.

2. Measurement of Percentage THD, a Single Feature for Load Consumption Pattern Identification

PQ data are useful not only for assessing the quality of power for consumption and compensation aspects, but also for load pattern identification [32]. In particular, harmonic data can be found among PQ data. Among harmonic data, such as harmonic amplitudes, harmonic phases and percentage THD, the latter is found to be helpful to uniquely identify load patterns. Therefore, accurate measurement of percentage THD is essential for load identification. In general, the percentage THD of a current’s harmonic signal is measured using FFT. If the measurements of harmonic orders are not accurate then the percentage THD value will be erroneous. FFT measurements have limitations such as spectral leakage and the picket fence effect [37,38]. Recently, EDLIFFT with a 4MSW for real-time harmonic estimation was proposed in [37], which overcame both the drawbacks of FFT. By using this algorithm, the harmonic orders are measured and the percentage THD of any given load pattern is computed as in Equation (1) [39,40]:
P e r c e n t a g e   C u r r e n t   T H D =   n = 2 H I n I f u n d
where
  • H = harmonic order
  • In = nth harmonic current
  • Ifund = fundamental current
Thus, we can employ percentage THD as a simple database lookup to find which combinations of appliances are in operation at any point in time. The rated power of all appliances is a known value, so we can compute the energy consumed by individual appliances for the time they spend operation. This lookup table is used to create the disaggregated load by appropriating the rated power of the appliance. The total sum of the active power at any point is compared to the power measured at the energy meter. This information, when applied with contextual data like occupancy, ambient temperature, etc., can deduce unnecessary use of appliances and can be shared with the customer suggest potential savings.

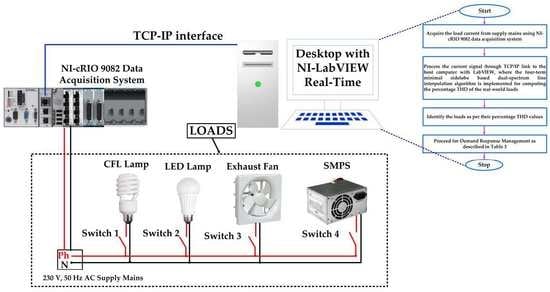
3. Real-Time Experimentation for Non-Intrusive Identification of Load Pattern (NIILP) Using Percentage THD Measurement

In this section, real-time experimentation for NIILP using percentage THD measurement is described. A National Instruments (NI) compact reconfigurable input–output system (cRIO) 9082-based virtual instrumentation experimental setup is developed for validating the proposed NIILP. It is one of the potential real-time hardware tools for percentage THD measurement, as per the requirements of international standards such as IEEE 519,1159 and IEC 61000-4-60. The NI-cRIO 9082 has a Field-Programmable Gate Array (FPGA) architecture which is equipped with an Intel Core-i7 dual-core Central Processing Unit (CPU) with a frequency of 1.33 GHz, 2 GB of DRAM (Dynamic random access memory), 32 GB of ROM (read only memory), and a Xilinx Spartan-6 LX150 FPGA. It consists of a reconfigurable embedded chassis with an integrated intelligent real-time controller and data acquisition modules for analog signal acquisition [41,42]. EDLIFFT with 4 MSW was deployed in the LabVIEW-configured host computer and interfaced to the NI LabVIEW-powered NI-cRIO 9082 through the TCP/IP interface, as illustrated in Figure 3. Most of the typical real-world loads are CFL, LED, fan and PC. Hence, the CFL, LED, exhaust fan and SMPS of the personal computer, which is connected to the single-phase 230 V, 50 Hz utility supply mains, are considered for computing the percentage THD using EDLIFFT with a 4MSW. The load current waveforms are acquired from supply mains and processed to the NI-cRIO 9082 using the NI-9227 current input module.
A detailed flow-chart of the percentage THD measurement method is described in Figure 4. The percentage THD is measured by using the data obtained from EDLIFFT with 4 MSW. The individual switches turn the loads ON and OFF to verify the different load combinations. Thereby, the percentage THD of each combination is computed by the algorithm given in Figure 4.

4. Results and Discussion

The real-world load current waveforms acquired by the NI-cRIO 9082 for various load combinations are depicted in Figure 5, Figure 6 and Figure 7. Initially, single-load operation is acquired and the individual load current waveforms of the CFL, LED, exhaust fan and SMPS of the PC are illustrated in Figure 5. From the individual load waveforms depicted in Figure 5a–d, it can be observed that no two waveforms are found to be the same shape due to the harmonic pollution. Moreover, these waveforms are highly nonlinear. Therefore, the percentage THD values of these loads are found to be unique in nature.
Any two real-world load combinations are monitored by turning ON their corresponding load switches. The waveforms acquired from the NI-cRIO 9082 for any two real-world load combinations are shown in Figure 6. From the figures, it is observed that no two waveforms are found to be the same shape due to the harmonic distortion. Therefore, the percentage THD values of these load patterns are found to be unique in nature.
Any three load combinations are monitored by turning ON their corresponding load switches and the three load combination waveforms of the CFL, LED, exhaust fan and SMPS of the PC are depicted in Figure 7. It is observed from Figure 7 that no two waveforms are found to be the same due to the harmonic pollution.
The load waveform at the supply mains when all the loads are active is illustrated in Figure 8. This waveform is also found to be quite different from the other load pattern waveforms.
From single-load operation to four-load operation, the load current waveforms are unique, indicating that the percentage THD is different for all load combinations. Therefore, percentage THD can be safely used for load identification effectively. The percentage THDs measured by EDLIFFT with a 4MSW using an NI-cRIO 9082 data acquisition system described in Figure 4 are tabulated in Table 2.
Our experiment was conducted and established that percentage THD uniquely identifies all combinations of loads. The standard deviations of the percentage THD values indicate that they are all uniquely different. Hence, they are used in the primary key of a lookup table to discern the loads in operation based on the percentage THD. A load power versus percentage THD plot is depicted in Figure 9, where the percentage THDs are relatively different for the different load powers. The actionable recommendations are based on the possible shifting of load demand from the red region to the yellow region and from the yellow region to the green region for a better response in order to reduce harmonic pollution to the extent possible in the load consumption scenarios.
The recommendation chart for DR management in Table 3 establishes the opportunity to reduce percentage THD within premises. The consumer benefits from the increased life of his appliances and utilities benefit from the increased life of their equipment in the distribution system.
The change in power consumption and the change in percentage THD columns show these direct benefits by responding positively to the proposed recommendations, as appropriate.
C. Nalmpantis et al. [15] proposed qualitative and quantitative metrics for NILM, and the authors of this study applied the same metrics, which are presented in Table 4 below. The quantitative metrics clearly demonstrate the effectiveness of the proposed experimental approach over non-deterministic NILM methods.

5. Conclusions

This paper presents a deterministic approach, using percentage THD to identify load consumption patterns through EDLIFFT with a 4MSW in the NI-LabVIEW program, for various combinations of loads in real time, and demonstrates that the percentage THD value effectively identifies various load combinations. The proposed method for the non-intrusive identification of the load pattern is essential for responsible electricity consumption, as it contributes to raising awareness about the quality of electricity, encourages countries/companies to use harmonic-free devices and calls for policy changes to promote harmonic-free appliances (compensation at the source) so the grid can become free of harmonics. Harmonics contribute 20% more than the real consumption billed to the consumer, which can be reduced to help with the cost of energy for utilities, leading to better margins, which are otherwise considered as losses. Utilities and consumers also benefit from the increased lifetime of their equipment and appliances, respectively. Our DR chart highlights the change in power and the change in percentage THD, then the customer acts on the DR management system’s recommendations. Standard deviation, a measure of the dispersion of values, indicates the differentiation of load patterns without ambiguity. Since both percentage THD against all possible combinations of loads are measured and put into a lookup table and recommendations are also chosen in advance, the performance of DR is fairly good for real-time DR management from a PQ perspective.

Author Contributions

Conceptualization, H.P.D.; formal analysis, H.P.D. and S.B.G.; investigation, H.P.D. and S.B.G.; methodology, H.P.D.; project administration, H.P.D.; resources, V.S.S.S.S.D.; supervision, V.S.S.S.S.D. and S.B.G.; validation, H.P.D. and V.S.S.S.S.D.; writing—original draft, H.P.D.; writing—review and editing, V.S.S.S.S.D. and S.B.G. All authors have read and agreed to the published version of the manuscript.

Funding

This research received no external funding.

Acknowledgments

The authors gratefully acknowledge the Department of Electrical Engineering, National Institute of Technology, Warangal, for their support.

Conflicts of Interest

The authors declare no conflict of interest.

References

  1. Siano, P. Demand response and smart grids—A survey. Renew. Sustain. Energy Rev. 2014, 30, 461–478. [Google Scholar] [CrossRef]
  2. Du, P.; Lu, N.; Zhong, H. Demand Response in Smart Grids; Springer Nature: Cham, Switzerland, 2019. [Google Scholar]
  3. D’Hoop, G.; Deblecker, O.; Thomas, D. Power quality improvement of a microgrid with a demand-side-based energy management system. In Micro-Grids—Applications, Operation, Control and Protection; Intech Open: London, UK, 2019. [Google Scholar]
  4. Ruano, A.; Hernandez, A.; Ureña, J.; Ruano, M.; Garcia, J. NILM techniques for intelligent home energy management and ambient assisted living: A review. Energies 2019, 12, 2203. [Google Scholar] [CrossRef] [Green Version]
  5. Iksan, N.; Sembiring, J.; Haryanto, N.; Supangkat, S.H. Appliances identification method of non-intrusive load monitoring based on load signature of VI trajectory. In Proceedings of the 2015 International Conference on Information Technology Systems and Innovation (ICITSI), Bandung, Indonesia, 16–19 November 2015; IEEE: New Jersey, NJ, USA, 2015; pp. 1–6. [Google Scholar]
  6. Baptista, D.; Mostafa, S.S.; Pereira, L.; Sousa, L.; Morgado-Dias, F. Implementation strategy of convolution neural networks on field programmable gate arrays for appliance classification using the voltage and current (VI) trajectory. Energies 2018, 11, 2460. [Google Scholar] [CrossRef] [Green Version]
  7. Bouhouras, A.S.; Gkaidatzis, P.A.; Chatzisavvas, K.C.; Panagiotou, E.; Poulakis, N.; Christoforidis, G.C. Load signature formulation for non-intrusive load monitoring based on current measurements. Energies 2017, 10, 538. [Google Scholar] [CrossRef]
  8. Le, T.T.H.; Kim, H. Non-intrusive load monitoring based on novel transient signal in household appliances with low sampling rate. Energies 2018, 11, 3409. [Google Scholar] [CrossRef] [Green Version]
  9. Djordjevic, S.; Simic, M. Nonintrusive identification of residential appliances using harmonic analysis. Turk. J. Electr. Eng. Comput. Sci. 2018, 26, 780–791. [Google Scholar] [CrossRef]
  10. Đorđevic, S.D.; Dimitrijević, M.; Litovski, V. A non-intrusive identification of home appliances using active power and harmonic current. Facta Univ. Ser. Electron. Energetics 2016, 30, 199–208. [Google Scholar]
  11. Shi, X.; Ming, H.; Shakkottai, S.; Xie, L.; Yao, J. Nonintrusive load monitoring in residential households with low-resolution data. Appl. Energy 2019, 252, 113283. [Google Scholar] [CrossRef]
  12. Haq, A.U.; Jacobsen, H.A. Prospects of appliance-level load monitoring in off-the-shelf energy monitors: A technical review. Energies 2018, 11, 189. [Google Scholar] [CrossRef] [Green Version]
  13. Hart, G.W. Non-intrusive load monitoring. Proc. IEEE 1992, 80, 1870–1891. [Google Scholar] [CrossRef]
  14. Zoha, A.; Gluhak, A.; Imran, M.A.; Rajasegarar, S. Non-intrusive load monitoring approaches for disaggregated energy sensing: A survey. Sensors 2012, 12, 16838–16866. [Google Scholar] [CrossRef] [Green Version]
  15. Nalmpantis, C.; Vrakas, D. Machine learning approaches for non-intrusive load monitoring: From qualitative to quantitative comparation. Artif. Intell. Rev. 2019, 52, 217–243. [Google Scholar] [CrossRef]
  16. Chang, H.H. Non-intrusive demand monitoring and load identification for energy management systems based on transient feature analyses. Energies 2012, 5, 4569–4589. [Google Scholar] [CrossRef] [Green Version]
  17. Dimitrijević, M.; Stošović, M.A.; Stevanović, D. Classification of Nonlinear Loads using Current Spectrum. Power 2019, 1, 2. [Google Scholar]
  18. Zheng, Z.; Chen, H.; Luo, X. A supervised event-based non-intrusive load monitoring for non-linear appliances. Sustainability 2018, 10, 1001. [Google Scholar] [CrossRef] [Green Version]
  19. Çavdar, İ.H.; Faryad, V. New design of a supervised energy disaggregation model based on the deep neural network for a smart grid. Energies 2019, 12, 1217. [Google Scholar] [CrossRef] [Green Version]
  20. Fagiani, M.; Bonfigli, R.; Principi, E.; Squartini, S.; Mandolini, L. A non-intrusive load monitoring algorithm based on non-uniform sampling of power data and deep neural networks. Energies 2019, 12, 1371. [Google Scholar] [CrossRef] [Green Version]
  21. Wu, Q.; Wang, F. Concatenate convolutional neural networks for non-intrusive load monitoring across complex background. Energies 2019, 12, 1572. [Google Scholar] [CrossRef] [Green Version]
  22. Kim, J.G.; Lee, B. Appliance classification by power signal analysis based on multi-feature combination multi-layer LSTM. Energies 2019, 12, 2804. [Google Scholar] [CrossRef] [Green Version]
  23. Rafiq, H.; Shi, X.; Zhang, H.; Li, H.; Ochani, M.K. A Deep Recurrent Neural Network for Non-Intrusive Load Monitoring Based on Multi-Feature Input Space and Post-Processing. Energies 2020, 13, 2195. [Google Scholar] [CrossRef]
  24. Puente, C.; Palacios, R.; González-Arechavala, Y.; Sánchez-Úbeda, E.F. Non-Intrusive Load Monitoring (NILM) for Energy Disaggregation Using Soft Computing Techniques. Energies 2020, 13, 3117. [Google Scholar] [CrossRef]
  25. Sadeghianpourhamami, N.; Ruyssinck, J.; Deschrijver, D.; Dhaene, T.; Develder, C. Comprehensive feature selection for appliance classification in NILM. Energy Build. 2017, 151, 98–106. [Google Scholar] [CrossRef] [Green Version]
  26. Li, L.; Yang, L.; Chen, H.; Li, M.; Zhang, C. Multi-objective evolutionary algorithms applied to non-intrusive load monitoring. Electr. Power Syst. Res. 2019, 177, 105961. [Google Scholar] [CrossRef]
  27. de Souza, W.A.; Garcia, F.D.; Marafão, F.P.; Da Silva, L.C.P.; Simões, M.G. Load disaggregation using microscopic power features and pattern recognition. Energies 2019, 12, 2641. [Google Scholar] [CrossRef] [Green Version]
  28. Chui, K.T.; Lytras, M.D.; Visvizi, A. Energy sustainability in smart cities: Artificial intelligence, smart monitoring, and optimization of energy consumption. Energies 2018, 11, 2869. [Google Scholar] [CrossRef] [Green Version]
  29. Kelly, J.; Knottenbelt, W. Does disaggregated electricity feedback reduce domestic electricity consumption. A systematic review of the literature. arXiv 2016, arXiv:1605.00962. [Google Scholar]
  30. Zhuang, M.; Shahidehpour, M.; Li, Z. An overview of non-intrusive load monitoring: Approaches, business applications, and challenges. In Proceedings of the 2018 International Conference on Power System Technology (POWERCON), Guangzhou, China, 6–8 November 2018; IEEE: New Jersey, NJ, USA, 2018; pp. 4291–4299. [Google Scholar]
  31. Bouhouras, A.S.; Gkaidatzis, P.A.; Panagiotou, E.; Poulakis, N.; Christoforidis, G.C. A NILM algorithm with enhanced disaggregation scheme under harmonic current vectors. Energy Build. 2019, 183, 392–407. [Google Scholar] [CrossRef]
  32. Jimenez, Y.; Cortes, J.; Duarte, C.; Petit, J.; Carrillo, G. Non-intrusive discriminant analysis of loads based on power quality data. In Proceedings of the 2019 IEEE Workshop on Power Electronics and Power Quality Applications (PEPQA), Manizales, Colombia, 30–31 May 2019; pp. 1–5. [Google Scholar]
  33. Kang, H.; Kim, H. Household Appliance Classification using Lower Odd-Numbered Harmonics and the Bagging Decision Tree. IEEE Access 2020, 8, 55937–55952. [Google Scholar]
  34. Bouhouras, A.S.; Milioudis, A.N.; Labridis, D.P. Development of distinct load signatures for higher efficiency of NILM algorithms. Electric Power Syst. Res. 2014, 117, 163–171. [Google Scholar] [CrossRef]
  35. Available online: https://www.powergridindia.com/sites/default/files/footer/climate_change/Swachh_Power.pdf (accessed on 16 June 2019).
  36. Deepu, O.; Sindhu, T.K. Modeling of Nonlinear Loads and Analysis of Harmonics in a Small Scale IT Park. Resonance 2013, 100, 7. [Google Scholar]
  37. Varaprasad, O.V.S.R.; Sarma, D.V.S.S.S.; Paredes, H.K.M.; Simões, M.G. Enhanced Dual-Spectrum Line Interpolated FFT with Four-Term Minimal Sidelobe Cosine Window for Real-Time Harmonic Estimation in Synchrophasor Smart-Grid Technology. Electronics 2019, 8, 191. [Google Scholar]
  38. Varaprasad, O.V.S.R.; Sarma, D.V.S.S.S.; Panda, R.K. Advanced windowed interpolated FFT algorithms for harmonic analysis of electrical power system. In Proceedings of the 2014 Eighteenth National Power Systems Conference (NPSC), Guwahati, India, 18–20 December 2014; IEEE: New Jersey, NJ, USA, 2018; pp. 1–6. [Google Scholar]
  39. Khokhlov, V.; Meyer, J.; Grevener, A.; Busatto, T.; Rönnberg, S. Comparison of Measurement Methods for the Frequency Range 2–150 kHz (Supraharmonics) Based on the Present Standards Framework. IEEE Access 2020, 8, 77618–77630. [Google Scholar] [CrossRef]
  40. IEEE. Recommended practices and requirements for harmonic control in electric power systems. In IEEE Std 519-2014 (Revision of IEEE Std 519-1992); IEEE: New York, NY, USA, 2014. [Google Scholar]
  41. Available online: http://www.ni.com/pdf/manuals/376904a_03.pdf (accessed on 9 August 2018).
  42. Kelly, J.; Aldaiturriaga, E.; Ruiz-Minguela, P. Applying international power quality standards for current harmonic distortion to wave energy converters and verified device emulators. Energies 2019, 12, 3654. [Google Scholar] [CrossRef] [Green Version]
Figure 1. Schematic of Demand Response (DR) management.
Energies 13 04628 g001
Figure 2. DR management in view of load monitoring using % Total Harmonic Distortion (THD).
Energies 13 04628 g002
Figure 3. Hardware schematic for percentage THD computation.
Energies 13 04628 g003
Figure 4. Flow chart for percentage THD computation.
Energies 13 04628 g004
Figure 5. Individual single loads. (a) CFL load waveform; (b) LED load waveform; (c) exhaust fan waveform; (d) SMPS of the PC waveform.
Energies 13 04628 g005
Figure 6. Any two loads. (a) CFL + LED load waveform; (b) CFL + exhaust fan load waveform; (c) CFL + SMPS of the PC load waveform; (d) LED + exhaust fan load waveform; (e) LED + SMPS of the PC load waveform; (f) exhaust fan + SMPS of the PC load waveform.
Energies 13 04628 g006
Figure 7. Any three loads. (a) CFL + LED + exhaust fan load waveform; (b) CFL + LED + SMPS of the PC load waveform; (c) LED + exhaust fan + SMPS of the PC load waveform; (d) CFL + exhaust fan + SMPS of the PC load waveform.
Energies 13 04628 g007
Figure 8. All four loads. CFL + LED + exhaust fan + SMPS of the PC load waveform.
Energies 13 04628 g008
Figure 9. Load power versus percentage THD of the demand.
Energies 13 04628 g009
Table 1. Comparison between traditional non-deterministic Non-Intrusive Load Monitoring (NILM) methods versus proposed deterministic method.
FactorNon-Experimental, Statistical ApproachExperimental Approach
EstablishesCorrelationsCausation
Deals withAggregates, general understandingIndividuals, hence specific
ApplicationUnderstanding of macroscopic phenomenaReal-time measurement and micro-level control
BiasNot easy to eliminate biasUnbiased
DataApproximationsReal data
ResultsProbability, hence not conclusiveExact, so conclusive
Regularity and repeatabilityMostlyAlways
Table 2. Percentage THD for all 15 load patterns in real time.
S.NoCombinations of Different AppliancesCODEPower (Watts)%THD
1CFL1 0 0 085123.395
2LED0 1 0 0919.7279
3Exhaust Fan0 0 1 02021.3272
4SMPS of PC0 0 0 120092.763
5CFL + LED1 1 0 094112.457
6CFL + Exhaust Fan1 0 1 010572.007
7CFL+ SMPS of the PC1 0 0 1285105.402
8LED + Exhaust Fan0 1 1 02920.3095
9LED + SMPS of the PC0 1 0 120986.1947
10Exhaust FAN + SMPS of the PC0 0 1 122059.6673
11CFL+ LED + Exhaust Fan1 1 1 011468.3618
12CFL+ LED + SMPS of PC1 1 0 1294101.076
13LED + Exhaust Fan + SMPS of PC0 1 1 122957.0561
14CFL+ Exhaust Fan + SMPS of PC1 0 1 130580.1096
15CFL+ LED + Exhaust Fan + SMPS of PC1 1 1 131477.6529
Standard Deviation33.069
Table 3. Actionable insights for DR management.
Actionable Insights and Benefits
Demand ResponseBenefits
S.NoCODEPower%THDActionable InsightsS.NoCODEPower%THDChange in %THDChange in Power
11 0 0 085123.395Turn off CFL20 1 0 0919.7279−84.0124−89.4118
20 1 0 0919.7279NR 1NR0 1 0 0919.727900
30 0 1 02021.3272NRNR0 0 1 02021.327200
40 0 0 120092.763Turn off LED for daytime90 0 0 120986.1947−7.080734.5
51 1 0 094112.457Turn off CFL20 1 0 0 919.7279−82.4574−90.4255
61 0 1 010572.007Turn off CFL80 1 1 02920.3095−71.7951−72.381
71 0 0 1285105.402Turn off CFL for daytime40 0 0 120092.763−11.9912−29.8246
80 1 1 02920.3095Turn off LED for daytime30 0 1 02021.32725.010955−31.0345
90 1 0 120986.1947Turn off LED for daytime-0 1 0 120986.194700
100 0 1 122059.6673NR-0 0 1 122059.667300
111 1 1 011468.3618Turn off CFL80 1 1 02920.3095−70.2912−74.5614
121 1 0 1294101.076Turn off CFL90 1 0 120986.1947−14.7229−28.9116
130 1 1 122957.0561Turn off LED for daytime100 0 1 022059.66734.576548−3.93013
141 1 0 130580.1096Turn off CFL130 1 1 122957.0561−28.7774−24.918
151 1 1 131477.6529Turn off CFL130 1 1 122957.0561−26.5242−27.0701
1 NR = no recommendation.
Table 4. Quantitative metrics for NILI–percentage THD.
Quantitative Metric CategoryQuantitative Metrics%THDOther NILM Methods
Feature selectedTHD Sampling rateMediumHigh
AccuracyDisaggregation percentage(D)100<100
Disaggregation Error (DE)0>0
Precision(P)–TP 1/(TP + FP 2)1<1
Recall (R)-P/TP+FN1<1
Accuracy (Acc) = (TP + TN 3)/(TP+TN+FP+FN 4)1<1
F-measure (f1) 2 *P *R/(P + R)1<1
No trainingUser interactionLow
Real-time capabilitiesDepends on algorithm’s computational complexity (computational cost)LowLow
ScalabilityAlgorithm computational complexity (simple algorithm scales better)HighHigh
Identification factorStandard deviation (FATσ) of %THD33.069NA
GeneralizationGeneralization over unseen housesHighMedium
1 TP = true positive; 2 FP = false positive; 3 TN = true; 4 FN = false negative.

