Article

Influence of Thermal Retrofitting on Annual Energy Demand for Heating in Multi-Family Buildings

by
Anna Życzyńska
1,
Zbigniew Suchorab
2,* and
Dariusz Majerek
3
1
Faculty of Civil Engineering and Architecture, Lublin University of Technology, 40 Nadbystrzycka Str., 20-618 Lublin, Poland
2
Faculty of Environmental Engineering, Lublin University of Technology, 40B Nadbystrzycka Str., 20-618 Lublin, Poland
3
Faculty of Fundamentals of Technology, Lublin University of Technology, 38 Nadbystrzycka Str., 20-618 Lublin, Poland
*
Author to whom correspondence should be addressed.
Energies 2020, 13(18), 4625; https://doi.org/10.3390/en13184625
Submission received: 20 August 2020 / Revised: 2 September 2020 / Accepted: 3 September 2020 / Published: 5 September 2020
(This article belongs to the Special Issue Energy Performance of Buildings)

Abstract

:
The paper presented the analysis of heat consumption for heating in multi-family residential buildings before and after thermal retrofitting. The analysis involved four groups of buildings, i.e., 43 buildings in total, located in various localities, belonging to one weather station. The predicted level of energy savings resulting from thermal retrofitting was achieved from the energy audits. The actual heat consumption, following the calculation into so-called external standard conditions, was obtained based on the readouts from heat-meters. For each building, the values of heat consumption over the periods of 6–10 years were read. The performance measurements involved the periods before, during, and after thermal retrofitting. The following statistical tests were used for data analysis: Wilcoxon–Mann–Whitney, Shapiro–Wilk, Bartlett, ANOVA, Kruskal–Wallis, Dunn and Holm post-hoc. The performed analyses showed that the mean value of energy savings predicted by audits reached 38.5% when the real mean value of savings, achieved from heat-meters, equaled 30.3%. The annual energy demand factors for heating were calculated for final energy and non-renewable primary energy factors. It was established that most of the analyzed objects fulfilled the primary energy factor requirements found in the Polish technical and construction regulations, which were valid at the time of investment.

1. Introduction

For several decades, numerous countries around the world, Poland included, have striven to improve the energy efficiency in various branches of the economy [1,2]. One of the methods for this involves reducing the energy demand while simultaneously meeting the demands of energy recipients and maintaining appropriate technical parameters of the building, as well as using adequate technological systems [3,4]. The demand of buildings for energy and its various carriers constitutes a significant share of the total energy balance of the country’s economy. Therefore, comprehensive actions aimed at reducing the energy consumption in buildings have been taken in Poland and in other European countries for over 20 years [5,6,7,8,9]. Such actions should not deteriorate the room use conditions. In the energy balance of a building, depending on its functions, the energy requirements are diverse. In the case of residential multi-family buildings having no cooling system, the highest energy demand throughout the year is connected with meeting the heating requirements while maintaining thermal comfort in rooms. Increasingly stringent requirements related to the thermal insulation of wall barriers and efficiency of heating systems had been applied while designing new buildings [10,11,12,13,14,15]. In turn, the existing buildings, due to their energy intensity, underwent comprehensive thermal retrofitting [8,16,17,18,19,20]. The main aim of thermal retrofitting corresponds to reducing the heat demand in a building by significantly decreasing the heat transfer coefficients of wall barriers and improving the total efficiency of the heating system in a building, if required [21]. Diverse strategies and modernization plans in terms of optimizing the costs of thermal retrofitting have been devised in different countries around the world [21,22,23]. Modernization of the existing buildings in order to reduce the energy consumption and mitigate the CO2 emission constitutes one of the main topics, enabling us to achieve sustainable development [24]. The target technical parameters and the actual energy effects of thermal retrofitting are of great importance. Prior to making the decision on realization of investment, technical and economic analyses were conducted in order to indicate optimal solutions, simultaneously meeting the requirements stated and described in relevant legal acts. One of the documents usually prepared prior to thermal retrofitting, is the energy audit of a building [8,25,26]. It contains, the analysis of the current state, as well as assessment of a building and its technical equipment in relation to the energy issues, a list and description of the possible technical solutions reducing the energy consumption within a building and improving its energy efficiency and an analysis of the investment and operational costs. The energy analysis of a building is conducted assuming the standard indoor and outdoor environment conditions. The calculations are carried out according to the applicable methodology based on the standards and requirements of different countries [26]. This means that an audit contains the theoretical calculations of the energy balance of a building before and after thermal retrofitting. The predicted energy effects calculated as part of the audit are comparable with the actual effects obtained during the building operation following thermal retrofitting. The relations between the expected and obtained values obtained under operational conditions are diverse [8,25,27,28,29,30]. The predicted energy savings are often achieved; however, the results which are superior to those stated in an audit, are seldom obtained [8,27]. In the buildings in which the thermal comfort parameters are not maintained, the actual effects may be worse than predicted [8]. It can be assumed that it results from the attempts of bringing the indoor environment parameters in a building to meet the standard requirements. In many countries, audits constitute one of the elements of implementing the national programs towards achieving energy savings and improving the energy efficiency in buildings. The actions recommended for particular buildings are then indicated in audits. The scope of these actions is dependent on the thermal insulation state of wall barriers and the total efficiency of the heating system within a building. Favorable effects are usually achieved, since there are numerous types of operations that can be performed to achieve energy savings [28,29].
The Polish and international literature confirms the favorable influence of thermal retrofitting on the energy efficiency of buildings. One of the examples includes the study presented in the paper [31], in which the authors investigated a place of worship, in which the retrofitting enabled to reduce the energy consumption by 31–66%. Another example is related to the buildings presented in the paper by Biserni et al. [28], in which the influence of particular thermal retrofitting stages on the energy savings were investigated. It was proven that the replacement of windows alone enables 13% in energy savings. When it was coupled with improved thermal insulation of outer walls, the savings reached about 50%, whereas the additional roof insulation further enhanced the level of savings to 70%.
The effects of thermal retrofitting performed in the buildings constructed using traditional technologies in the 1960s and 1970s were presented in the paper [32]. The process involved increasing the thermal insulation of external wall barriers and replacement of some windows. This contributed to the savings, ranging from 16.3 to 21.5%, and in most cases, the limit values of the primary energy factor were not met. In an earlier paper by Życzyńska et al. [8], the energy efficiency of thermo-modernized educational buildings was compared. The efficiency of thermal retrofitting was proven on the basis of heat meter readouts and theoretical calculations performed for an energy audit. It was indicated that, depending on the type of the building, the mean savings in energy consumption range between 34 and 56% were based on the heat meter readouts, accounting for the heating period harshness, whereas, in the case of theoretical considerations, they amounted up to 70–82%. Similar relations were noted in the world literature, e.g., Marone et al. [27] stated that thermal retrofitting enabled to achieve 33% energy savings, while the theoretical considerations suggested savings at a level of approximately 40%.
Thermal retrofitting enables to achieve better energy effects in the buildings characterized by high energy intensity. This is often related to the period of building construction. The older the non-modernized building, the better the obtained effects [8]. This stems from the fact that, in the past, lesser attention was given to the thermal parameters of a building or to the efficiency of its heating system. The energy demand or consumption in a building were not analyzed. The energy market and prices of energy carriers were different. There were fewer technical solutions and available technologies enabling a reduction in energy consumption in a building. Ecological problems were not attributed to the issues connected with the broadly understood energy consumption within a building.

2. Materials and Methods

The following paper focuses on energy consumption for heating in multi-family buildings before and after comprehensive thermal retrofitting. The actual factors for annual final energy consumption and non-renewable primary energy resources were defined. The obtained results were compared to the limit values required in Poland during thermal retrofitting [26]. The limit values in the technical building regulations at that time were defined as a function of the building shape factor.
The analysis covered 43 multi-family buildings, raised in the 1970s and 1980s, situated in the Eastern Poland, located in medium-sized towns scattered over an area of 50 km, and administered by four different entities. All the objects were characterized by the similar population density—about 2.5–3 inhabitants/per flat. The surface areas of the majority of flats ranged between 40 and 60 m2. The buildings were supplied with energy from different district heating systems. Prior to thermal retrofitting, energy audits were conducted for each building, according to the methodology used in Poland since 1998 [5]. Before thermal retrofitting, the objects were non-insulated and the building envelopes of the specific buildings were characterized by different heat transfer coefficients, which varied between 0.93–1.18 W/(m2∙K) in the case of the external walls and between 0.8 and 1.07 W/(m2∙K) in the case of the flat roofs. Those values fulfilled the local requirements that were valid at the time of construction. In contrast, after thermal retrofitting, the values of coefficients were similar or frequently the same. In order to designate the energy coefficients for the specific buildings, the following data were taken into account: heat meter readouts from the years before and after thermal retrofitting, the year of thermal retrofitting, the aspect ratio values, heated usable surface area, and the energy savings level for heating according to the audit (Table 1).
Annual energy meter readouts from different time series, comprising the period of several years, were used in the analysis. The heat-meter readouts covered only energy demand, as the hot water consumption was measured separately. The measured values were corrected with the coefficient, considering the variability of the number of degree days, which is characteristic in the particular year in relation to the number of degree-days determined under standard conditions in the given location. The measured values of heat consumption were obtained from the building administrators, whereas the data for designating the correction coefficient were acquired from the heat supplying companies.
In all the buildings, the thermal retrofitting operations included: thermal insulation of outer building walls (with polystyrene) and flat roofs (mineral wool granulate or cellulose based material), as well as modernization of central heating systems (if it was required). Computational coefficients of heat transfer through wall barriers after their thermal insulation: for walls U = 0.24 ÷ 0.25 W/(m2·K); for flat roofs U = 0.20 ÷ 0.22 W/(m2·K). Central heating systems are in technically sound condition, the radiators are equipped with thermostatic radiator valves, and the distributing pipes are thermally insulated, according to the national guidelines. After retrofitting, the heating systems were hydraulically balanced in all cases, which improved the distribution of heat to particular rooms.
The data characteristic for each group are shown in Table 1.
Each group of objects is found in different locality (towns), but they belong to a single weather station. The A/V ratio corresponds to the building shape coefficient, i.e., ratio of total surface areas of wall barriers constituting the balance boundary of a building to the heated cubic volume of a building calculated by the external outline, 1/m. wH describes the coefficient of non-renewable primary energy input assumed according to Polish regulations [33], according to Polish regulations [33]. As it can be seen from the Table 1, the period before retrofitting was between 1 and 7 years and after the modernization was between 3 and 5 years.

2.1. Method of Determining the Energy Coefficients

In order to determine the energy effects of thermal retrofitting and determine the annual energy consumption factors following thermal retrofitting of buildings, the following algorithm was employed:
(1)
Acquisition of data from legalized heat meters operating under actual conditions, collected for each building over the period of several years, i.e., measurement of heat consumption for heating in main pipes, before dividers (Qp, GJ/year).
(2)
Collection of the data from heating suppliers, pertaining to the length of the heating period and mean monthly outdoor air temperatures in a given location.
(3)
Calculation of the number of degree-days for each analyzed year, according to the following dependency:
S d = ( θ int , H θ e , m ) L d m
where:
  • Sd is the number of degree-days calculated for a particular year, day·K/year;
  • θe,m is the mean monthly outdoor air temperature in a given year, °C;
  • θint,,H is theindoor air temperature in the heated zone, assumed at 20 °C;
  • Ldm is thenumber of heating days in a given month of a given year, day.
(4)
Calculation of a correction coefficient resulting from the variability of the number of degree days according to the following dependency:
φ = S d 0 S d
where:
  • φ is the correction coefficient;
  • Sd0 is the number of degree-days in the standard year, calculated on the basis of mean monthly outdoor air temperatures obtained from multiannual measurements and theoretical length of the heating season (222 days), which, in the case of the location of the analyzed buildings amounts to 3825.2 (day·K)/year.
    Table 2 contains the values of correction coefficient in a given group and a given year, as well as the years for which the heat consumption measurements were conducted.
(5)
Correction of the measured consumed heat values to the standard year conditions performed in line with the following dependency:
Q 0 = Q p φ
where:
  • Q0 is the adjusted annual heat consumption, i.e., adjustment to standard conditions, GJ/year;
  • Qp is the measured annual heat consumption, GJ/year.
(6)
Collection of the data from energy audits conducted for the analyzed buildings, pertaining to the predicted level of energy savings obtained through thermal retrofitting.
(7)
Determining the final energy savings in accordance with the following dependencies:
ΔQ% = (Q01,avgQ02,avg)/Q01,avg ·100
where:
  • Δ Q % ¯ , ΔQ%,min, and ΔQ%,max are the mean, minimal, and maximal (respectively) obtained reduction in final energy consumption following thermal retrofitting related to the value of mean annual final energy consumption prior to thermal retrofitting of the building, %;
  • Q01,avg is the mean annual final energy consumption before thermal retrofitting under standard conditions, GJ/year;
  • Q02,avg is the mean annual final energy consumption after thermal retrofitting under standard conditions, GJ/year.
(8)
Comparison of the energy savings level obtained under the operational conditions with the level predicted in energy audits.
(9)
Calculation of the annual final energy factor for heating after thermal retrofitting under operational conditions, according to the following dependencies:
F E F H = 10 6   ·   Q 0   3600 ·   A f
where:
  • FEFH is the annual final energy factor for heating, kWh/(m2·year);
  • Af is the heated usable surface area of the building, m2;
  • 106 is the unit converter, kJ/GJ;
  • 3600 is the unit converter, s/h.
(10)
Determination of the annual non-renewable primary energy factor for heating after thermal retrofitting under operational conditions, in line with the following dependence:
PEFH = wH ·FEFH
(11)
Calculation of the boundary value of the factor of annual non-renewable primary energy demand for heating as a function of building shape coefficient, according to the national regulations for new and modernized buildings, at a time of thermal retrofitting, in line with the following dependence:
new buildings PEFH,0 = 55 + 90 · (A/V)
modernized buildings PEFH,0 = 1.15 · [55 + 90 · (A/V)]
where:
  • PEFH,0 is the maximum value of annual non-renewable primary energy factor for heating, kWh/(m2·year)
(12)
Comparison of the factor of the annual non-renewable primary energy factor for heating after thermal retrofitting under operational conditions with the limit values established in Polish regulations [34] at the time of investment.

2.2. Description of the Data Analysis Methods

The analysis of the data obtained from calculations and measurements was performed using appropriate descriptive statistics, including position measures, central tendency measures, and dispersion measures. The employed position measures, combined with violin and box plots, enabled us to comprehensively evaluate the distributions of investigated features. The comparative analysis of operational coefficients before and after building modernization, such as annual energy consumption or factors of annual final energy FEFH and primary energy PEFH consumption, was performed by means of the Wilcoxon–Mann–Whitney test, which is a non-parametric counterpart of the Student’s t-test for dependent samples [35]. This test was employed, because the assumptions of normality of dependent variables distribution and lack of homogeneity of variance were not met. These assumptions were verified by means of the Shapiro–Wilk test [36,37] and Bartlett’s test [38], respectively. The comparative analysis of dependent variables was additionally supplemented with the effect size estimator r = Z / n , where Z is the test statistic of the Wilcoxon–Mann–Whitney test and n is the number of compared observation pairs [39]. The comparisons of central tendency measures, in the case of a greater number of independent variable classes, were performed by means of the Kruskal–Wallis test, which is a non-parametric counterpart of the ANOVA test [40]. This test was selected, since the assumptions of the parametric ANOVA test were not met. However, in the cases where the assumptions pertaining to the normality of dependent variable distribution and homogeneity of variance in groups were met, the ANOVA test was used for comparisons. The size of effects of independent variables were evaluated using the ϵ 2 coefficient [41]. If the global ANOVA or the Kruskal–Wallis test indicated significance of differences, the analysis was carried out by means of post-hoc Dunn’s test with the Holm’s method [42].
All comparative analyses were presented as graphs, simultaneously including the test results and sizes of effects that were appropriate for a given comparison. The violin and box plots enabled assessing of the shape of distribution, concentration of the analyzed values, and comparison of the central tendency measures.
All statistical analyses and visualizations of results were performed in R; an environment for statistical computing [43] using additional packages expanding the computational capacity of the basic software [44,45,46].

3. Results

In order to illustrate the calculation methods, the exemplary results of heat consumption readouts were presented below. Due to a large number of analyzed objects, selected buildings were presented in Table 3, Table 4, Table 5 and Table 6, one for each group.
The results shown in Table 3, Table 4, Table 5 and Table 6 present the annual, corrected heat consumption readouts, as well as the final and primary energy factors in the particular years of building operations, in which the measurements were taken. The years in which the thermal-modernization was performed were marked in bold. Additionally, the values of average corrected heat consumption before and after thermal retrofitting were presented and the percentage gains resulting from thermal retrofitting were defined. The savings per audit were obtained from the energy audits. Those are the theoretical, calculated values of energy savings, according to the Polish regulations [6]. In the case of the measured (real) savings, they were calculated according to the previously described methodology and finally calculated using Formula (4). In each case shown in the Table 3, Table 4, Table 5 and Table 6, declining trends can be observed in the years after performing thermal retrofitting.

4. Discussion

In each of the 43 cases, final energy consumption for heating decreased as a consequence of thermal retrofitting. It should also be noted that different levels of energy saving were obtained, resulting from the differences in thermal-insulating power of the wall barriers before thermal retrofitting. Comparing the results obtained by the analysis, it is noticeable that the final energy savings achieved under the operating conditions were predominantly lower than the projected ones calculated in the building energy audits, as shown in Table 7.
The chart presented in Figure 1 shows statistically significant differences of the corrected annual heat consumption values. All the analyzed buildings exhibited decreasing energy consumption after modernization, the effect of which was estimated as high (r = 0.87). Since the corrected annual heat consumption is characterized by the positive skewness (see Figure 1) and, simultaneously, the variances of both populations were significantly different (verified by the Barlett’s test), the non-parametric equivalent of the Student t-test for dependent samples, i.e., the Wilcoxon–Mann–Whitney test was used for comparing the consumption.
The actual energy savings are slightly higher than assumed in the audit, but only in few cases. This mainly concerns the buildings for which low savings were predicted. In the buildings for which the audit indicated a high reduction in energy demand, this decrease was in fact much lower (Figure 2.). It should be noted that the discrepancies between the actual and expected effect vary in each of the analyzed groups of buildings, which are administered by different entities.
The comparison of the percent decrease of corrected annual energy consumption estimated on the basis of meter readouts with the expected drop in consumption obtained in the audit showed the significance of differences approximating 8%. The estimated effect was significant (r = 0.60). Although the distribution of corrected annual consumption estimated on the basis of meter readouts was comparable to the normal one, the distribution from the audit was not. Therefore, the non-parametric test was used for the comparison of means. Another argument for the selection of Wilcoxon’s test was the lack of homogeneity of variance of both populations, which investigated with the Bartlett’s test.
Analyzing the mean and median values in groups G1 and G2, the effects obtained under operational conditions were similar to those calculated in the audit, i.e., the result of the audit was comparable to an average actual effect (Figure 3). In turn, noticeable differences occurred in groups G3 and G4 between the predicted results and those obtained under operational conditions. The actual effects were significantly lower than assumed, which is presented in Figure 3. This may stem from the fact that lower temperatures than required were maintained in rooms prior to thermal retrofitting (due to excessive heat losses), which was confirmed by the building administrators. After thermal retrofitting, the temperatures were adjusted to ensure thermal comfort, which was achieved by increasing the heat consumption in the building. Another reason might be the supply of excessive amounts of heat due to the lack of the devices limiting the flow of the heating medium to the building (information obtained from building administrators) and omission of the hydraulic regulation of the heating installation following the change in energy demand of particular rooms. This may cause overheating of rooms and unnecessary increase in heat consumption for heating. As a result, both phenomena will contribute to lower actual savings.
The comparison of the actual drop in energy consumption with the reduction predicted based on the audit for particular groups was performed separately. Figure 3 indicates that the actual decreases in energy consumption in two groups of buildings were comparable to those predicted based on the audit (groups G1 and G2), whereas, in the other two groups (G3 and G4), the actual yield was much lower than predicted.
The decreases in corrected annual heat consumption in particular investigated groups of buildings were analyzed separately. The comparison showed that the differences in the samples were not statistically significant, despite slight variations in central tendency measures. The graph presented in Figure 4 shows the deviations from normal distribution and a lack of homogeneity of variance in the particular groups; hence, the non-parametric Kruskal–Wallis test was used to compare the decreases in energy consumption. Aside from the slight differences in mean decreases of energy consumption between groups of buildings, it is worth noting that they differed significantly in terms of variability. The difference in dispersion between groups G1 and G4 is significant.
The minimal, maximal, and mean values of the FEFH factor in particular groups of buildings after thermal retrofitting, calculated on the basis of operational measurements and usable surface area, are presented in Table 8. The best results were obtained in groups G1 and G2. In turn, in G4, although the values of the A/V coefficient and the heat transfer coefficient of wall barriers in the final state were similar to those in other groups, the indices were less favorable. The mean in G4 was approximately twice as high as that obtained in G1. Similarly, as it was mentioned above, it may result from the lack of rational management of energy in the building. The buildings were managed by different business entities. The obtained levels of energy savings may be different due to diversified heat transfer coefficients of wall barriers prior to thermal retrofitting. However, after thermal retrofitting, the buildings should be characterized by a similar FEFH factor, because they had very similar technical parameters affecting the heat demand for heating in a building.
The analysis of annual final energy consumption factors (FEFH) is presented in Figure 5.
The employed non-parametric Kruskal-Wallis test indicates the statistical significance of differences in the annual final energy consumption between the groups of buildings. The highest consumption was obtained for G4. In the graph, the results of post-hoc tests, indicating the significance of differences between groups, were marked as well (the values above brackets). The Holm’s correction was used for multiple comparisons. These tests indicated that G4 forms a homogenous group, because it is significantly different from the other groups of buildings. Moreover, G3 significantly differs from G1.
The values of the building shape coefficient A/V vary in the range 0.31 to 0.50 (Table 1). At such A/V values, the required (theoretical) limit value of the PEFH,0 factor for the buildings being modernized during the period of studies, calculated according to Dependence (8), varies in the range 95.34 ÷ 115.00 kWh/m2·year. This constitutes about 21% in relation to a higher value. The obtained minimal, maximal, and mean values of the PEFH factor in particular groups are presented in Table 9, together with the mean PEFH,0 values for each group of buildings.
The values presented above indicate that all the buildings that underwent retrofitting in groups G1 and G2 are characterized by the PEFH factor, which is lower than the minimal limit value, whereas, in groups G3 and G4, the values that are much higher than maximum limit were obtained for some buildings (Figure 6 and Figure 7). In addition to the reasons enumerated while describing the percent decrease in energy consumption and FEFH factor, the coefficient of non-renewable primary energy input (wH), assumed to be in line with the technical and construction guidelines, also significantly affected the PEFH factor. This coefficient was characteristic for the given method of heat supply in a building and the type of energy carried and used as the heat source. In groups G1 and G2, the wH coefficient amounted to 0.8, whereas in G3 and G4 it was much higher and reached 1.3, which significantly affected the PEFH factor (Figure 7).
Since the heating systems supplying particular groups of buildings differed in terms of the non-renewable primary energy input, the annual primary energy consumption factor (PEFH) after retrofitting was compared with the aforementioned input coefficient. In Figure 7, PEFH was compared with the maximal boundary annual non-renewable primary energy demand factors for new and modernized buildings PEFH,0. It should be noted that, in the case of groups G1 and G2 with input coefficient wH = 0.8, the measured average value of PEFH factor (57 kWh/(m2·year)) was significantly smaller from the boundary values (104.9 and 101.5 kWh/(m2·year), respectively). In the case of groups G3 and G4 with wH = 1.3, the boundary values (110 and 104.8 kWh/(m2·year), respectively) were exceeded.
The difference in the factors of annual primary energy consumption after retrofitting was statistically significant. The buildings with lower non-renewable primary energy input coefficient were characterized with lower primary energy consumption by over 84 kWh/(m2·year), on average. There is also a visible discrepancy in the variability of features in both groups. The buildings with higher non-renewable primary energy input coefficient were characterized by greater variance; thus, the Kruskal–Wallis test was used to compare the central tendencies.
The comparison of the annual primary energy consumption factor after the retrofitting of a building to the boundary conditions determined separately for the new and modernized buildings indicates that none of the buildings exceeded the limit level in the case where the wH coefficient was equal to 0.8.
In the buildings analyzed in this paper, it was not possible to change the method of heat generation and supply. This means that the conducted thermal retrofitting had no influence on the value of the wH coefficient and thus on the values of the FEFH and PEFH factors. Therefore, in some cases, even though higher final energy savings and lower FEFH factor values were obtained, the value of PEFH can be higher than for a building with a greater FEFH factor. This stems from the fact that the assessment energy efficiency of a building and comparison of the building quality, its elements, and technical systems, should be based on the final energy factor (FEFH) rather than on the primary energy factor (PEFH). The primary energy consumption factor should instead be used in the evaluation of the environmental impact of a building in ecological terms, especially pertaining to the emission of carbon dioxide and particulate matter into the atmosphere.
The results of the studies presented above, similar to the case of the analyses conducted in this paper, confirm the efficiency of thermal retrofitting in terms of energy savings. They also indicate that, in the majority of cases, the actual efficiency, measured on the basis of heat meter readouts, is lower than the efficiency predicted by means of theoretical considerations.

5. Conclusions

The following conclusions can be drawn on the basis of the conducted studies and calculations:
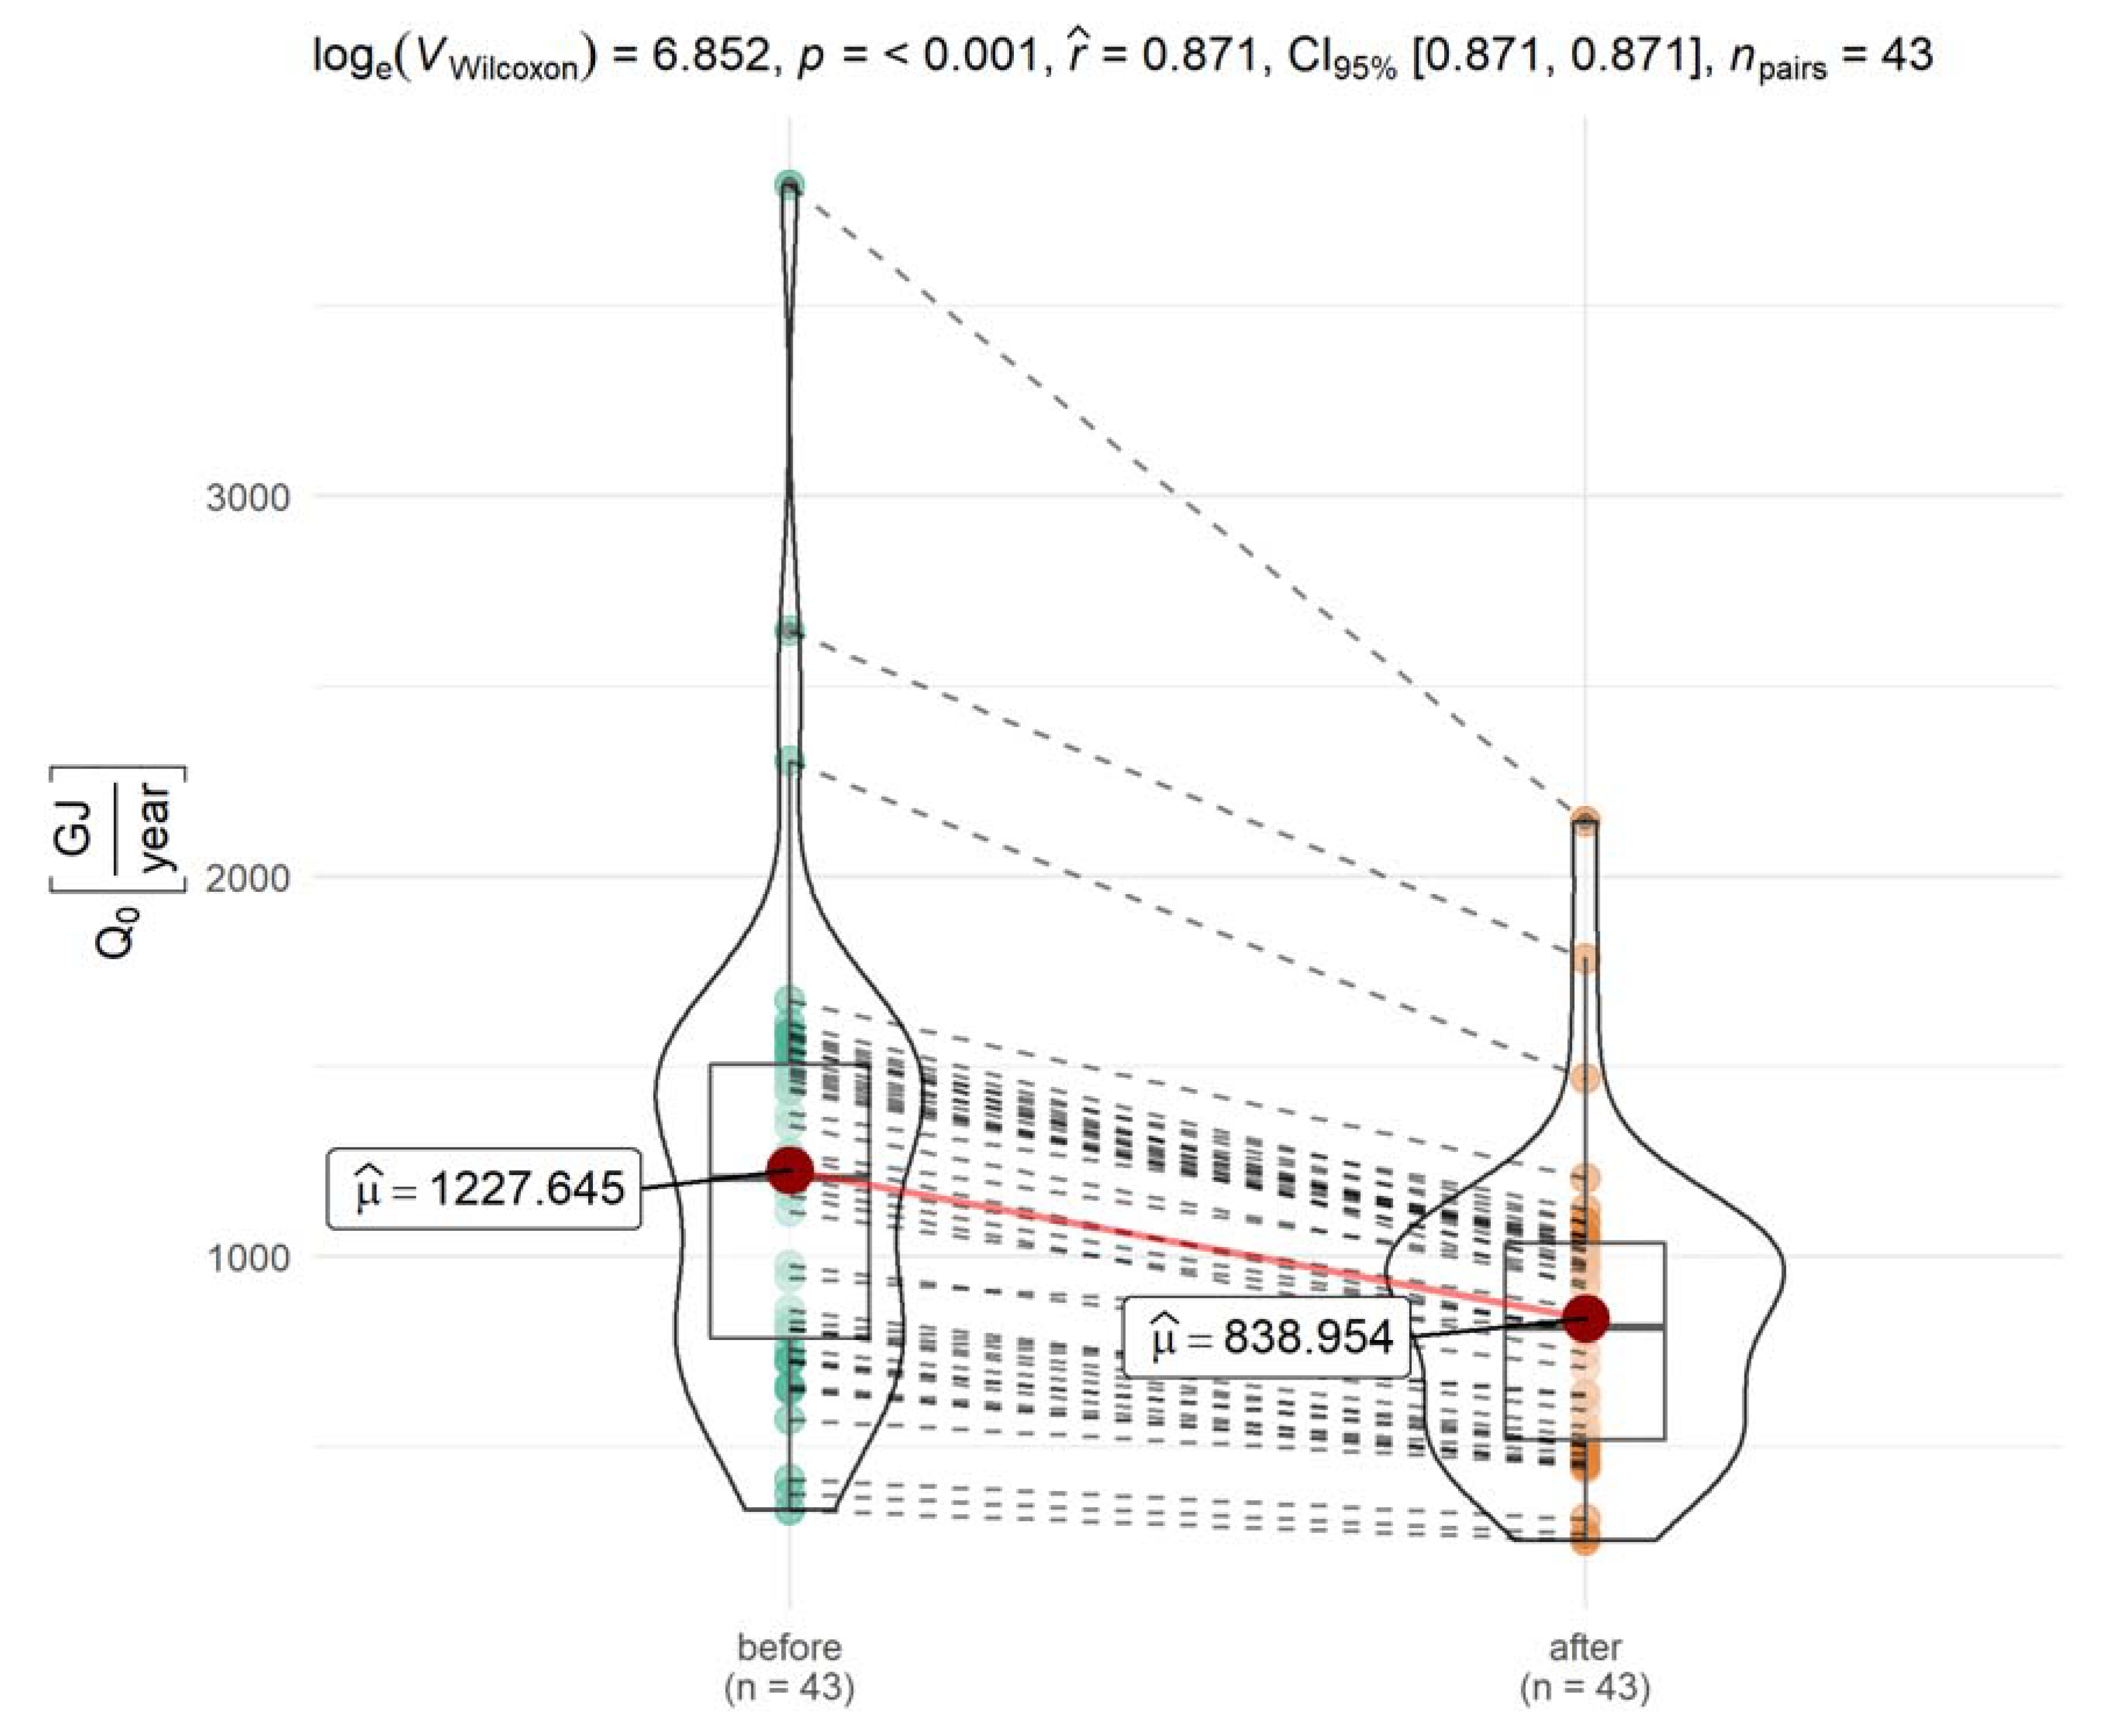
  • The thermal retrofitting conducted in multi-family residential buildings result in reduced heat consumption for heating ranging from 14 to 43%. The level of achieved final energy savings depends on the improvement degree of the technical parameters of wall barriers and efficiency of the heating system in a building. The more comprehensive the thermal retrofitting is and the greater the improvement of these parameters, the higher the reduction in heat consumption.
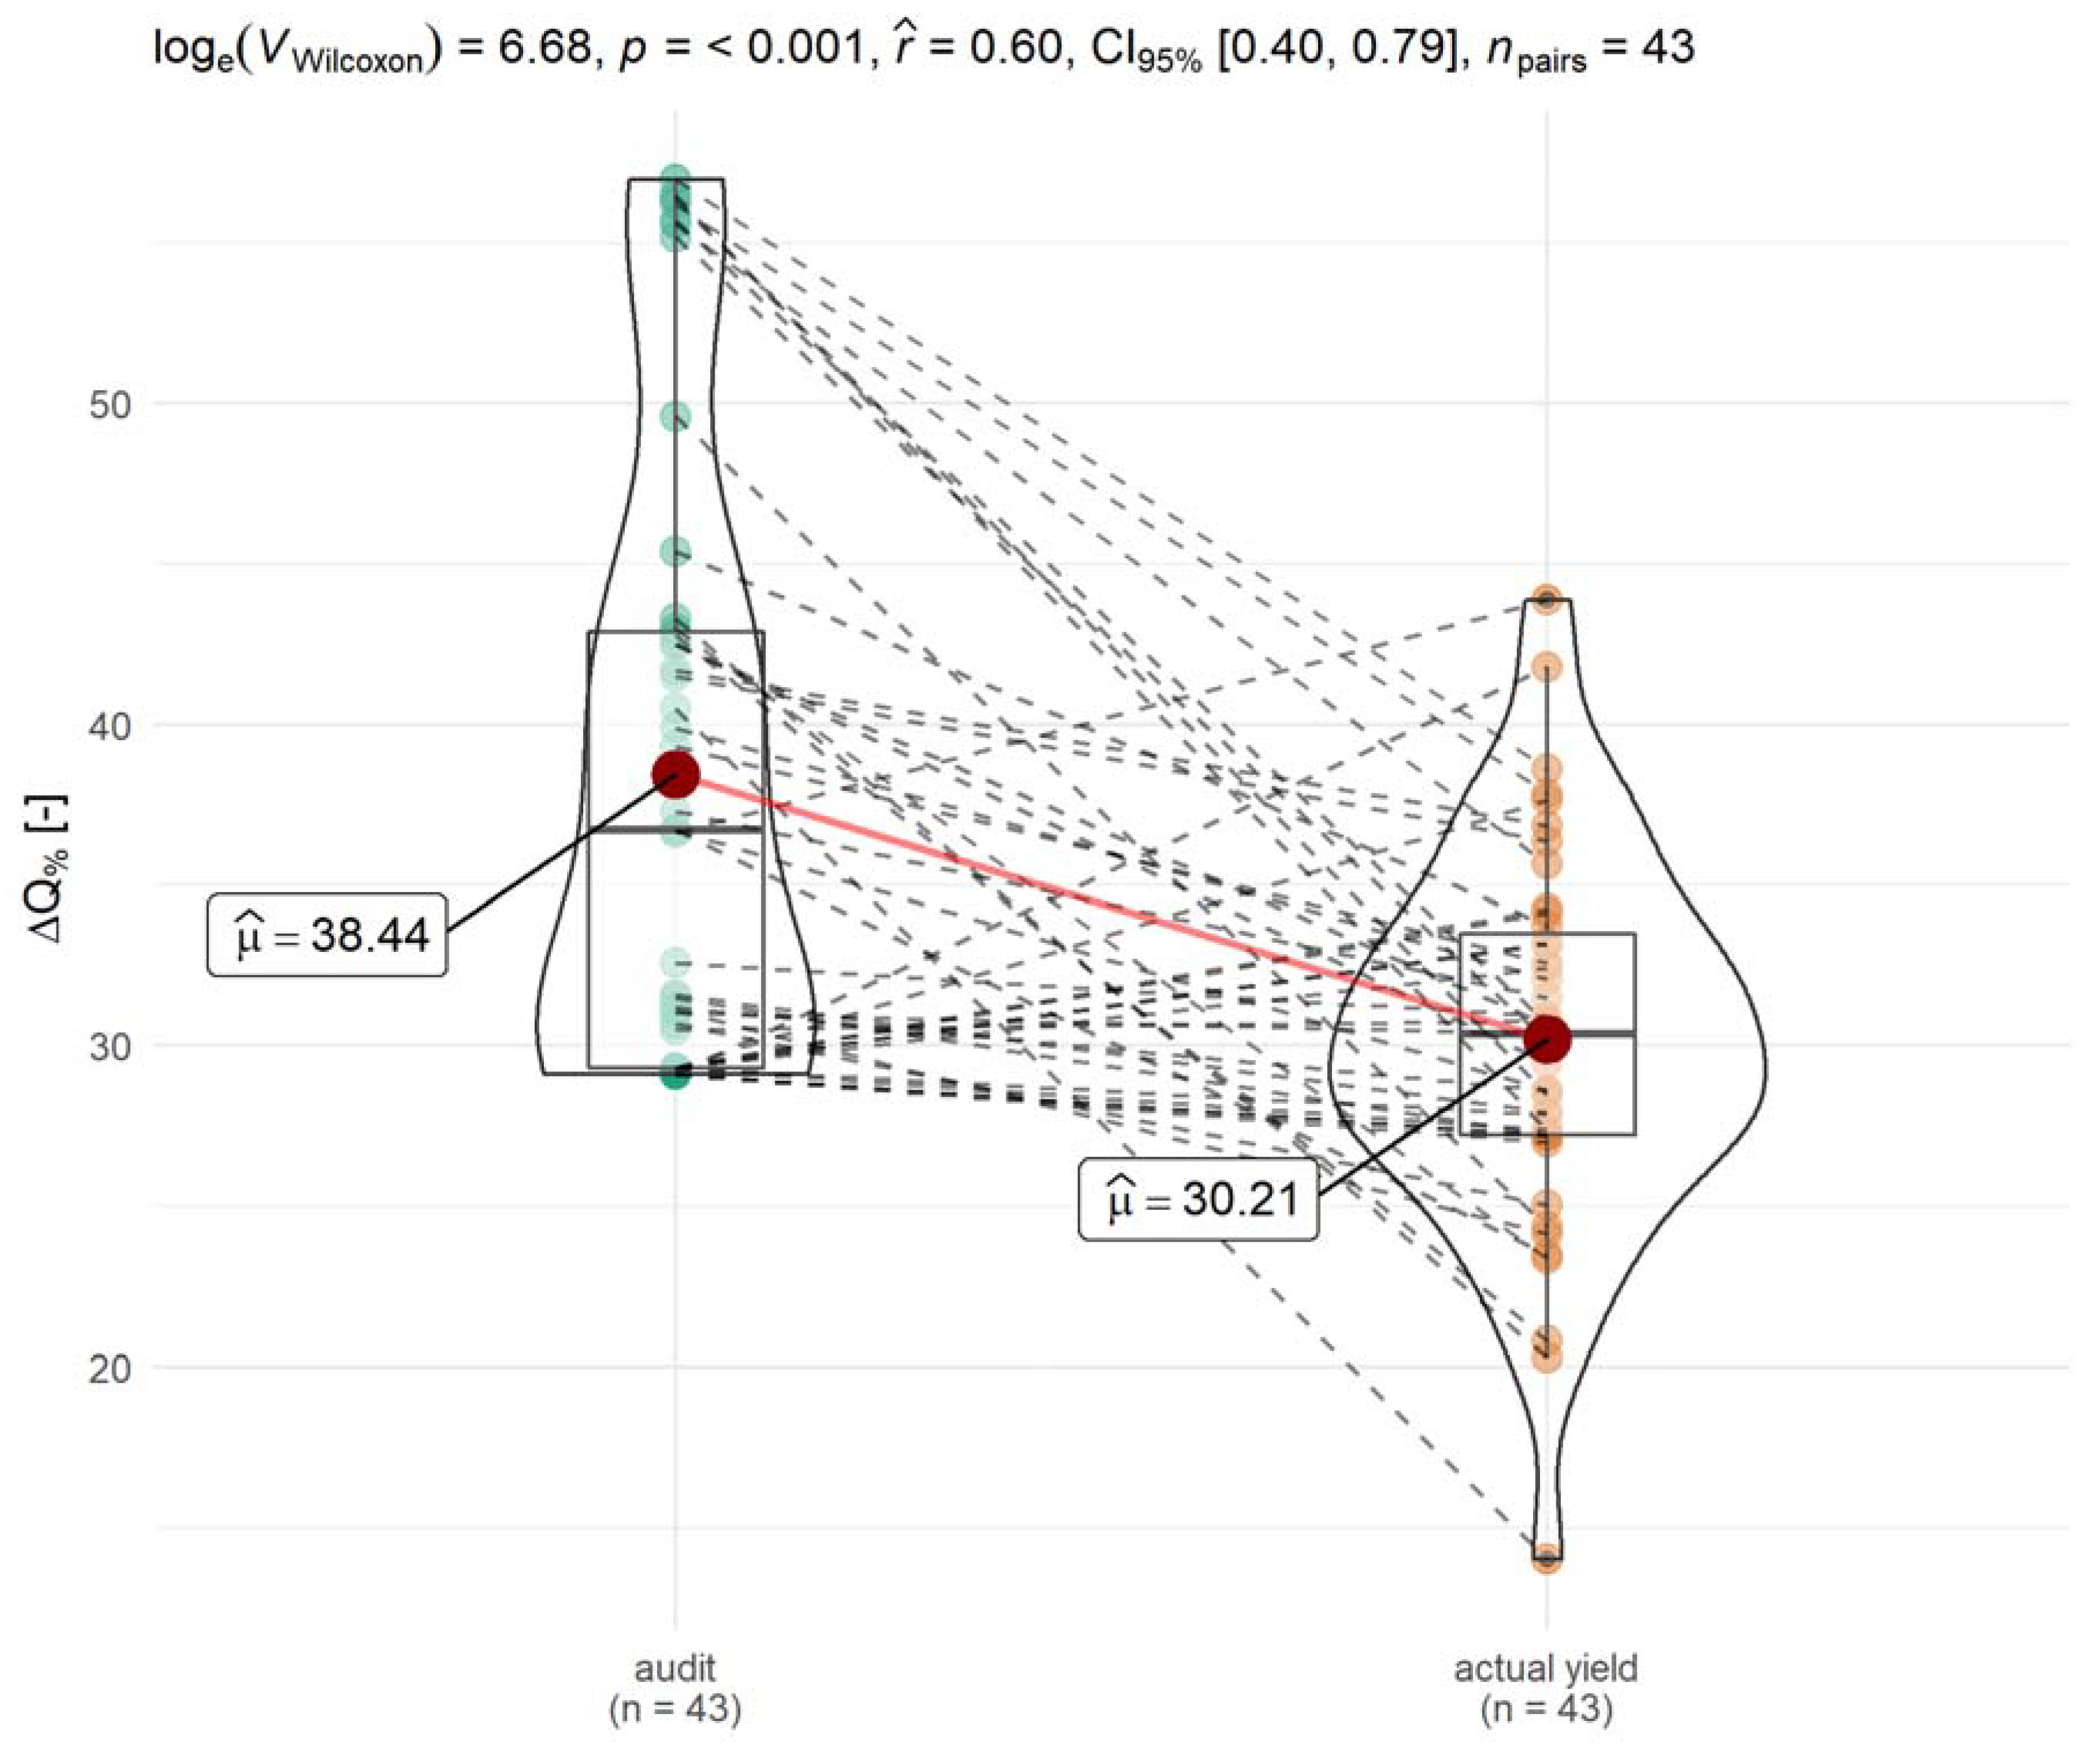
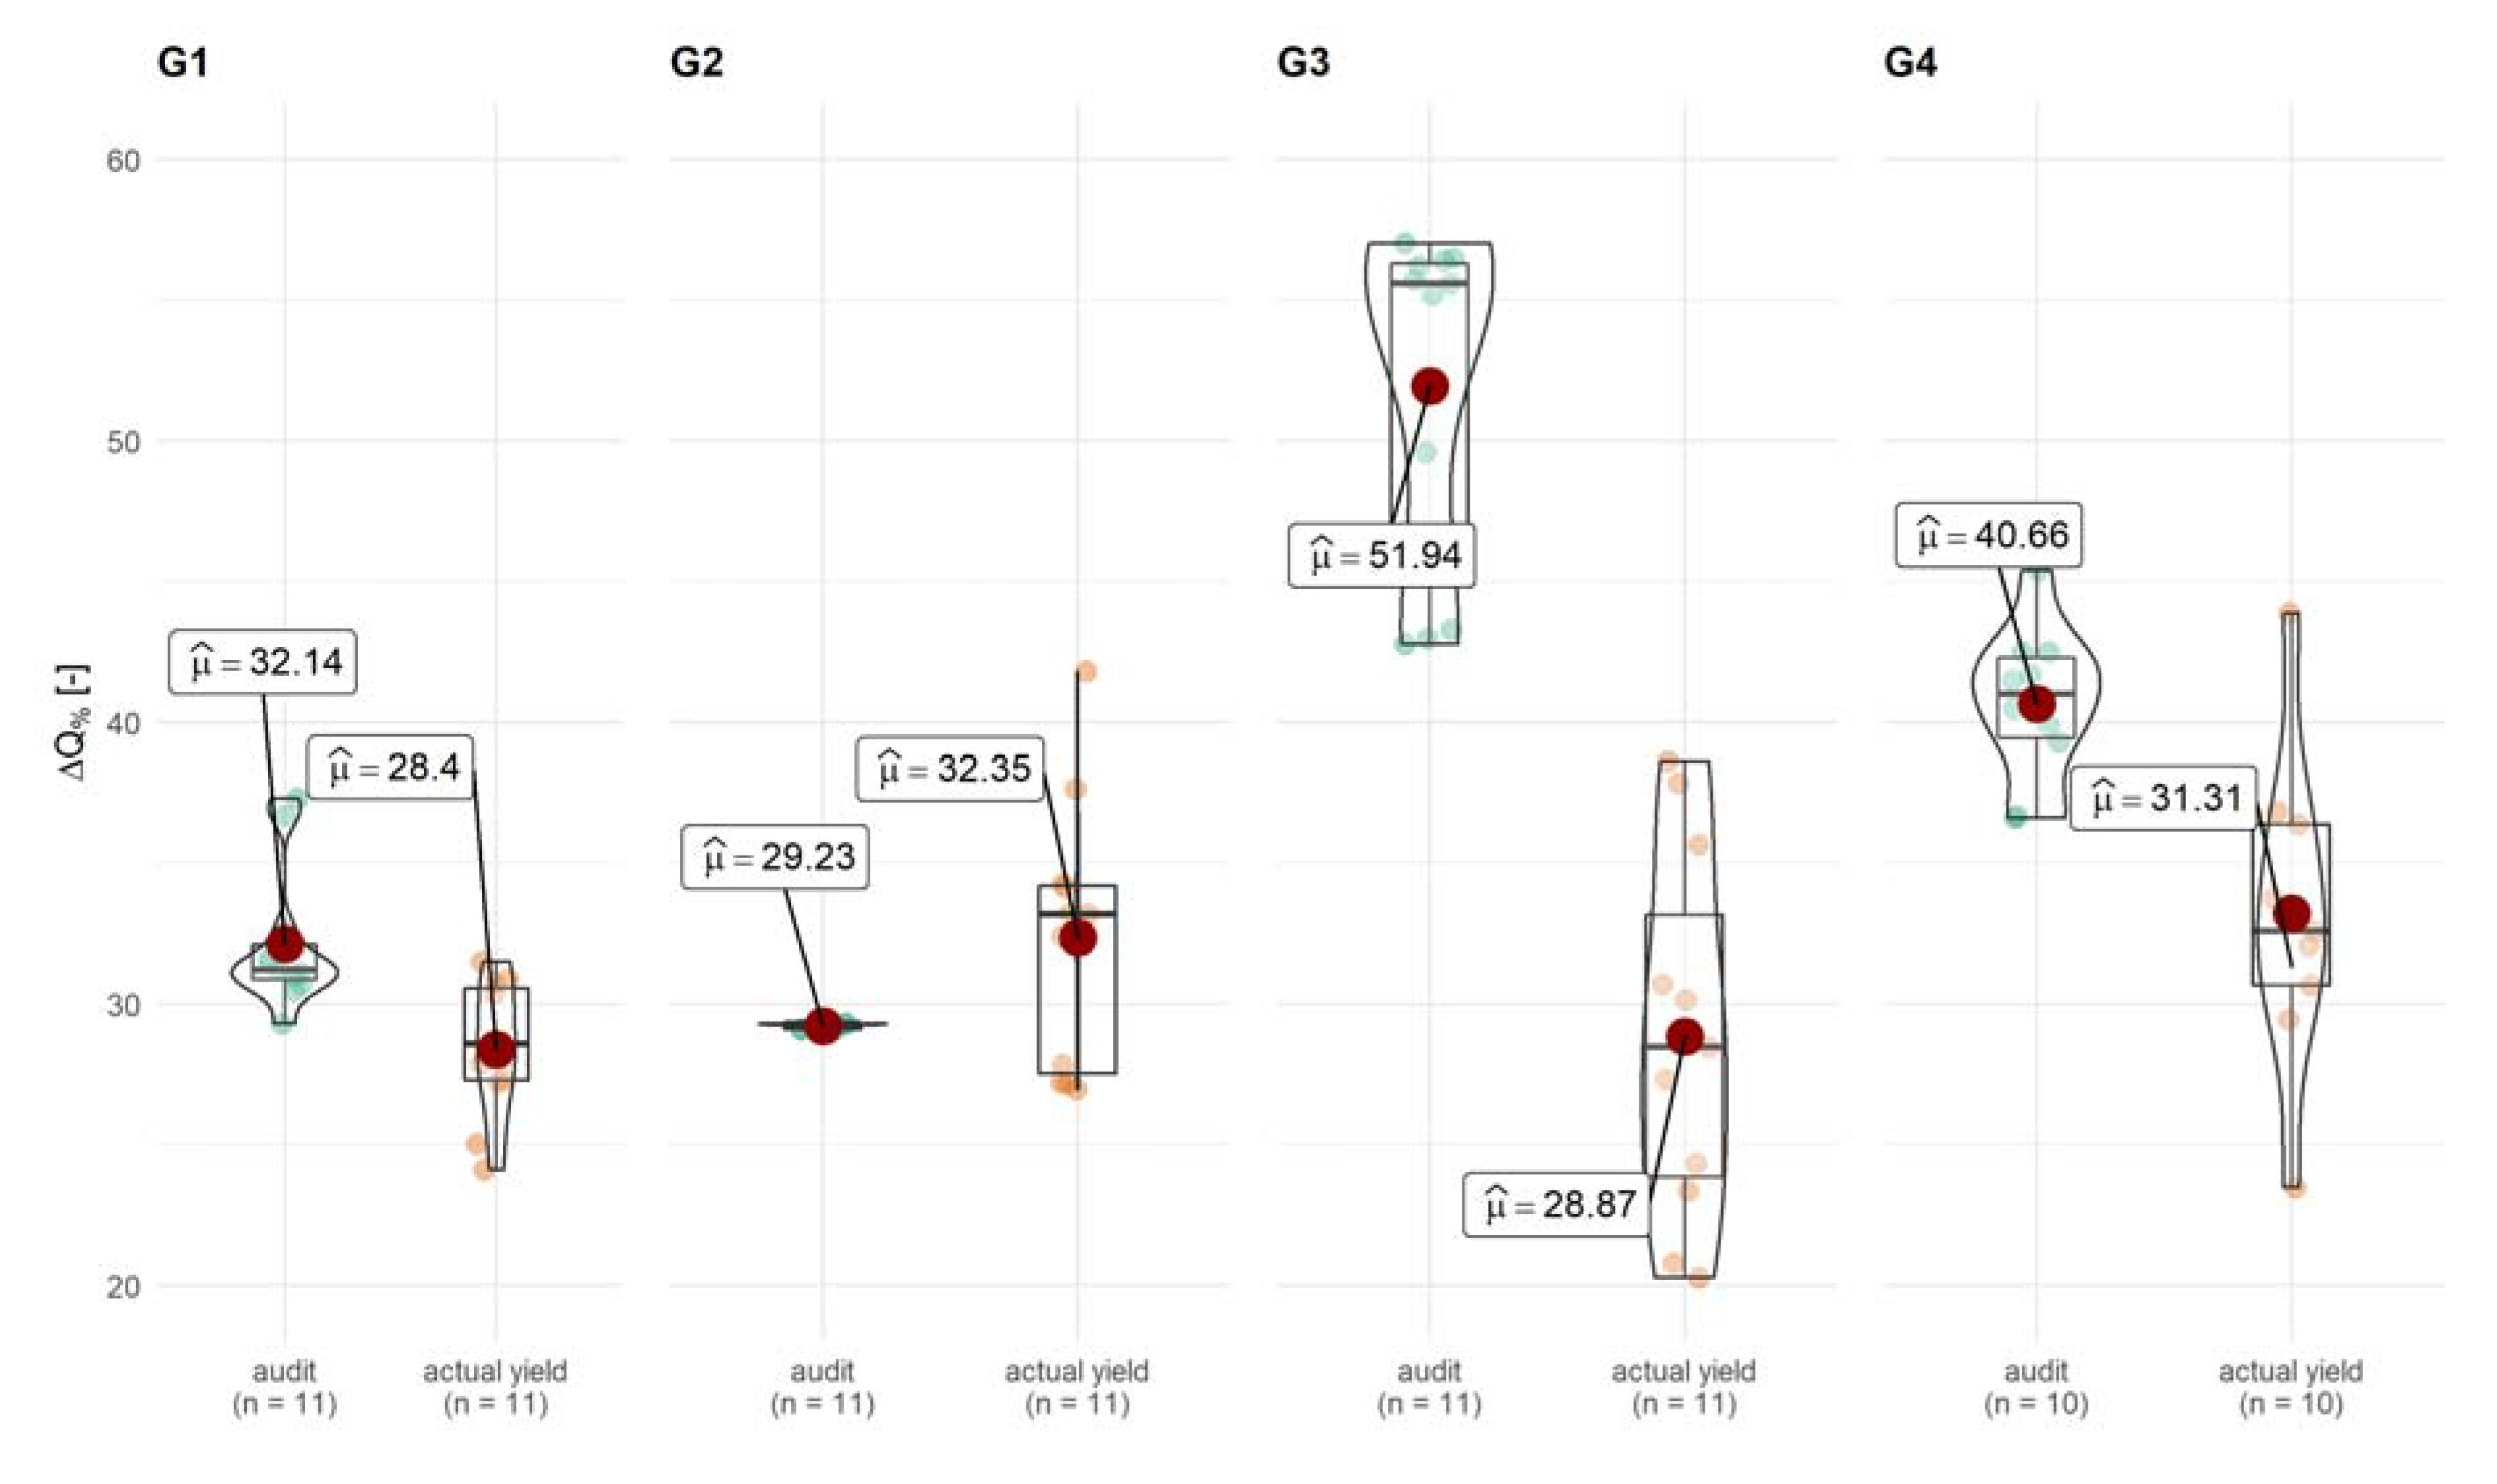
  • The analysis indicates that the predicted savings determined on the basis of the calculations performed in accordance to the applicable algorithms found in respective standards and national legal acts are usually higher than the actual values. On the basis of the conducted studies, the mean obtained from an audit amounts to 38.4%, whereas from measurements, the mean obtained amounts to 30.2%. It should be noted that the predicted effects can be achieved under the operational conditions, which happened most often in group G2. Varying energy effects are obtained in different years, even within the same building. It is likely that this is connected with the method of energy supply and usage in particular rooms of a building.
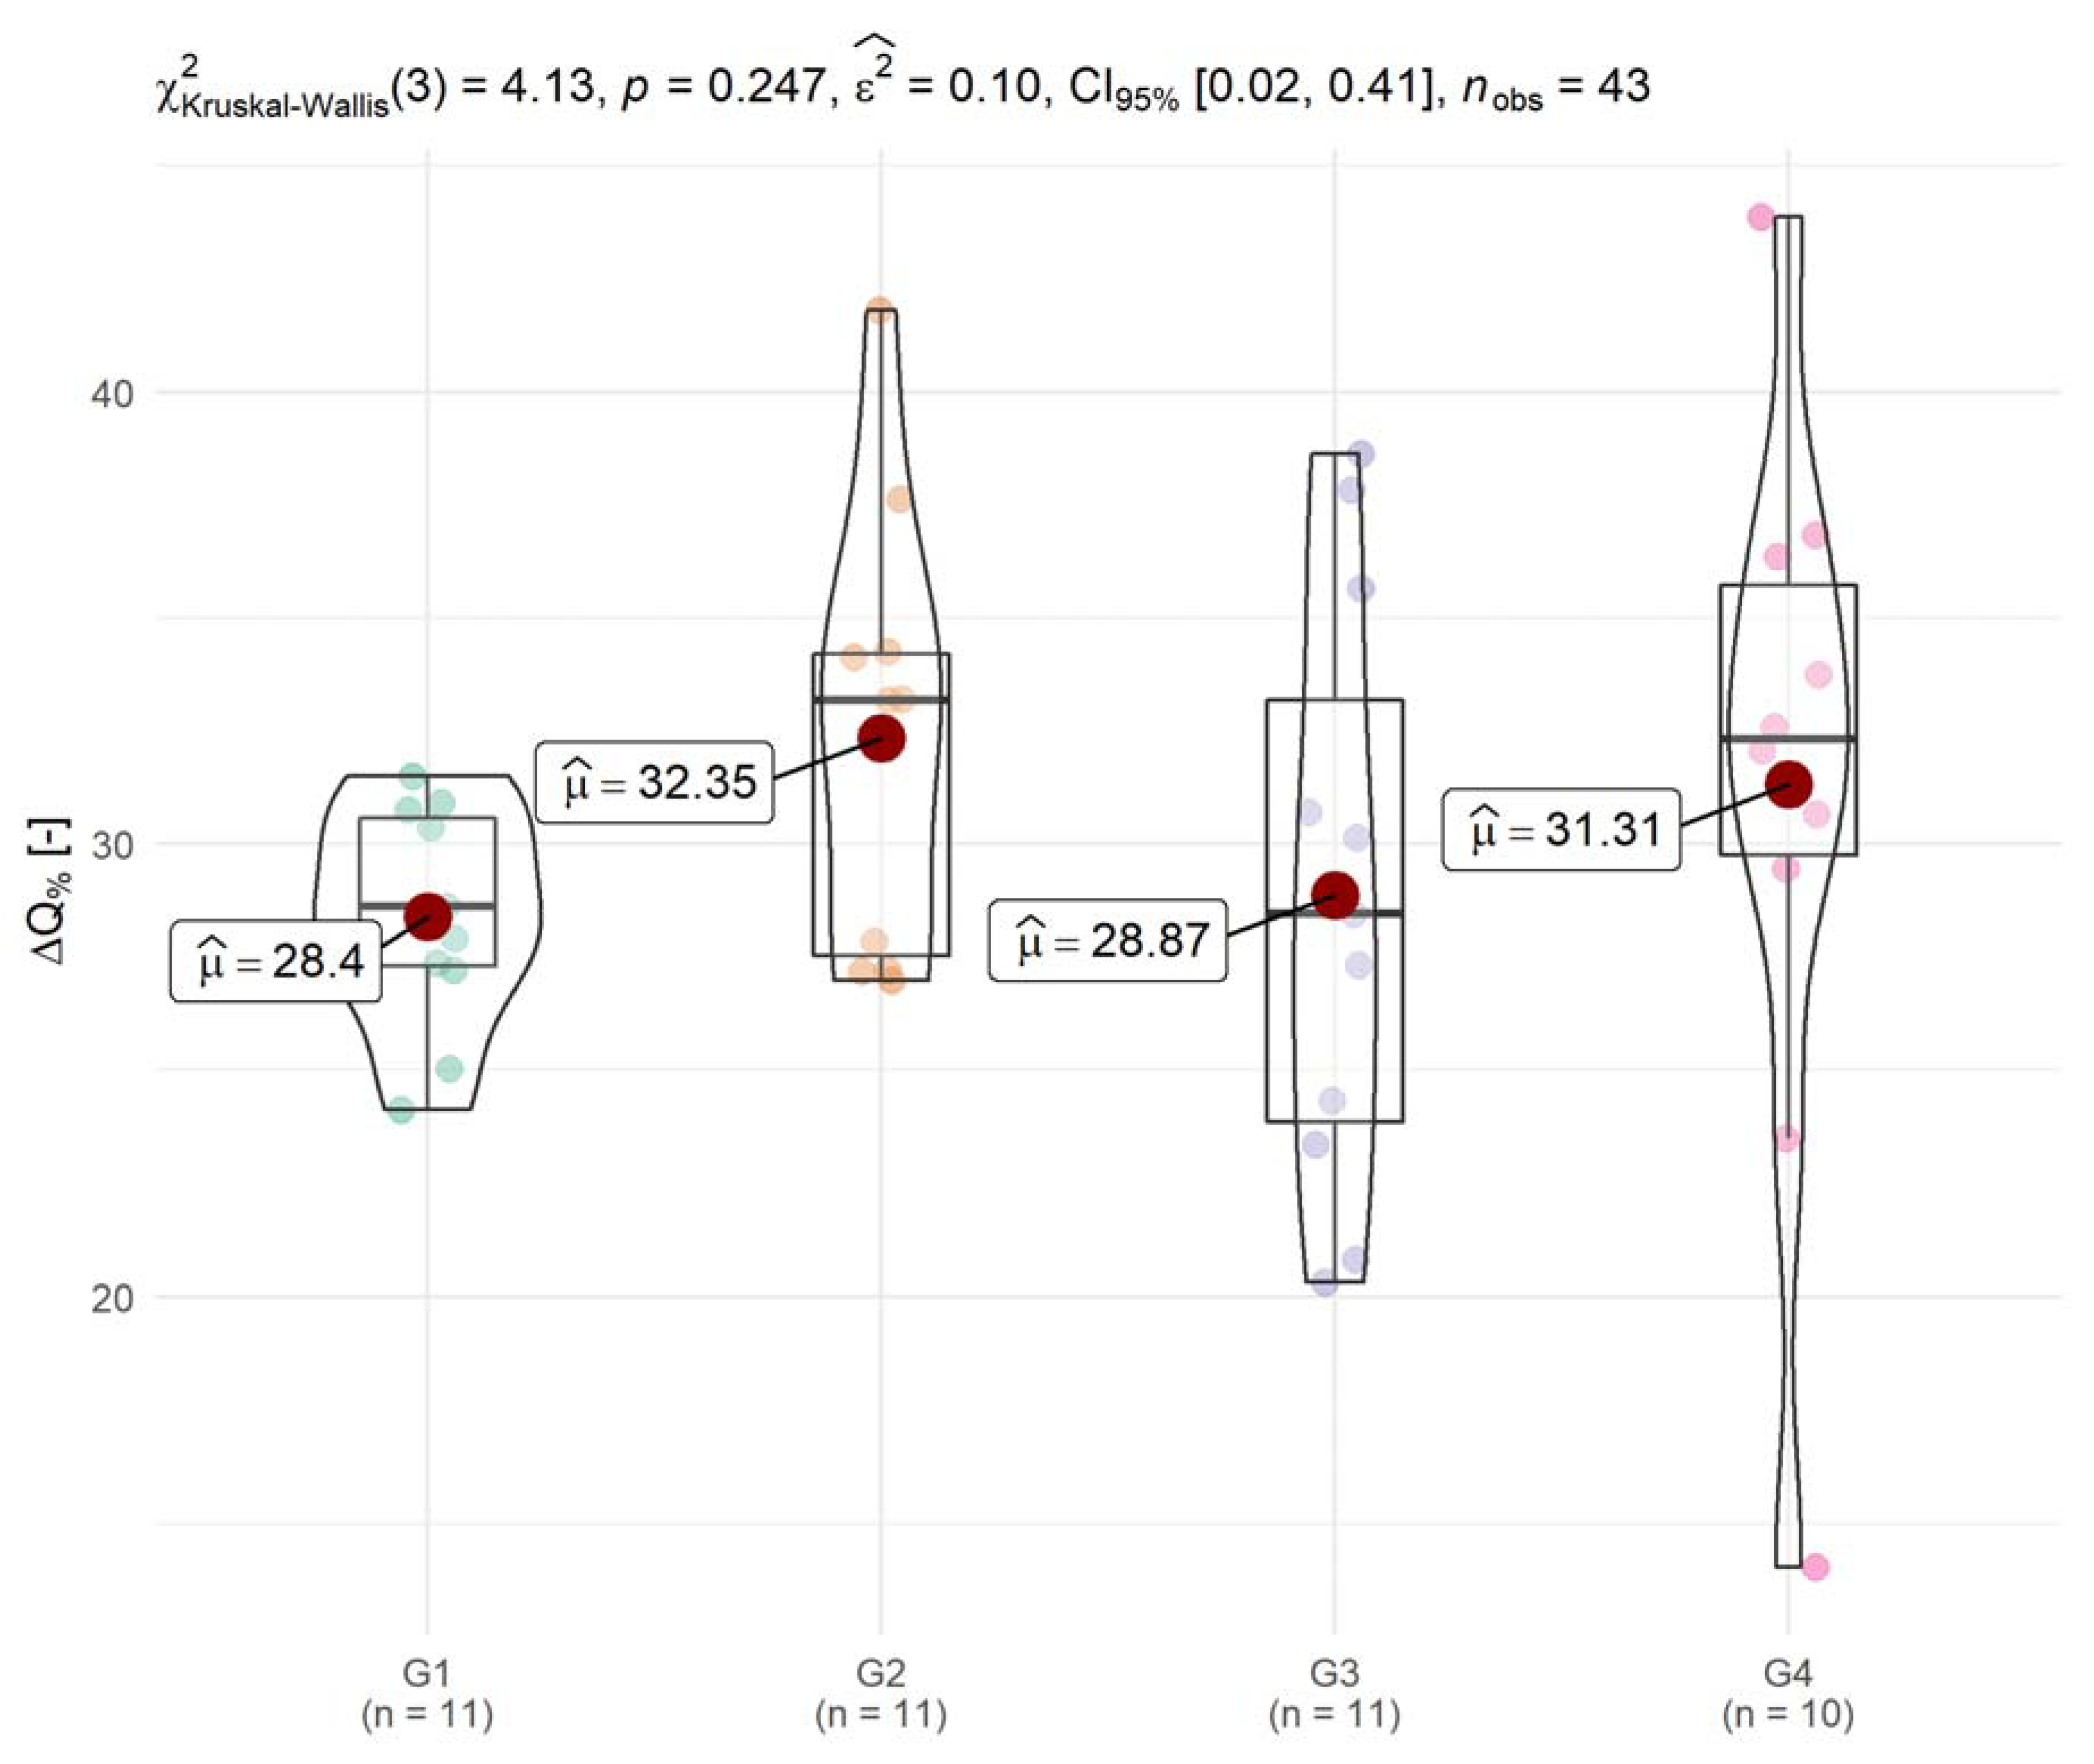
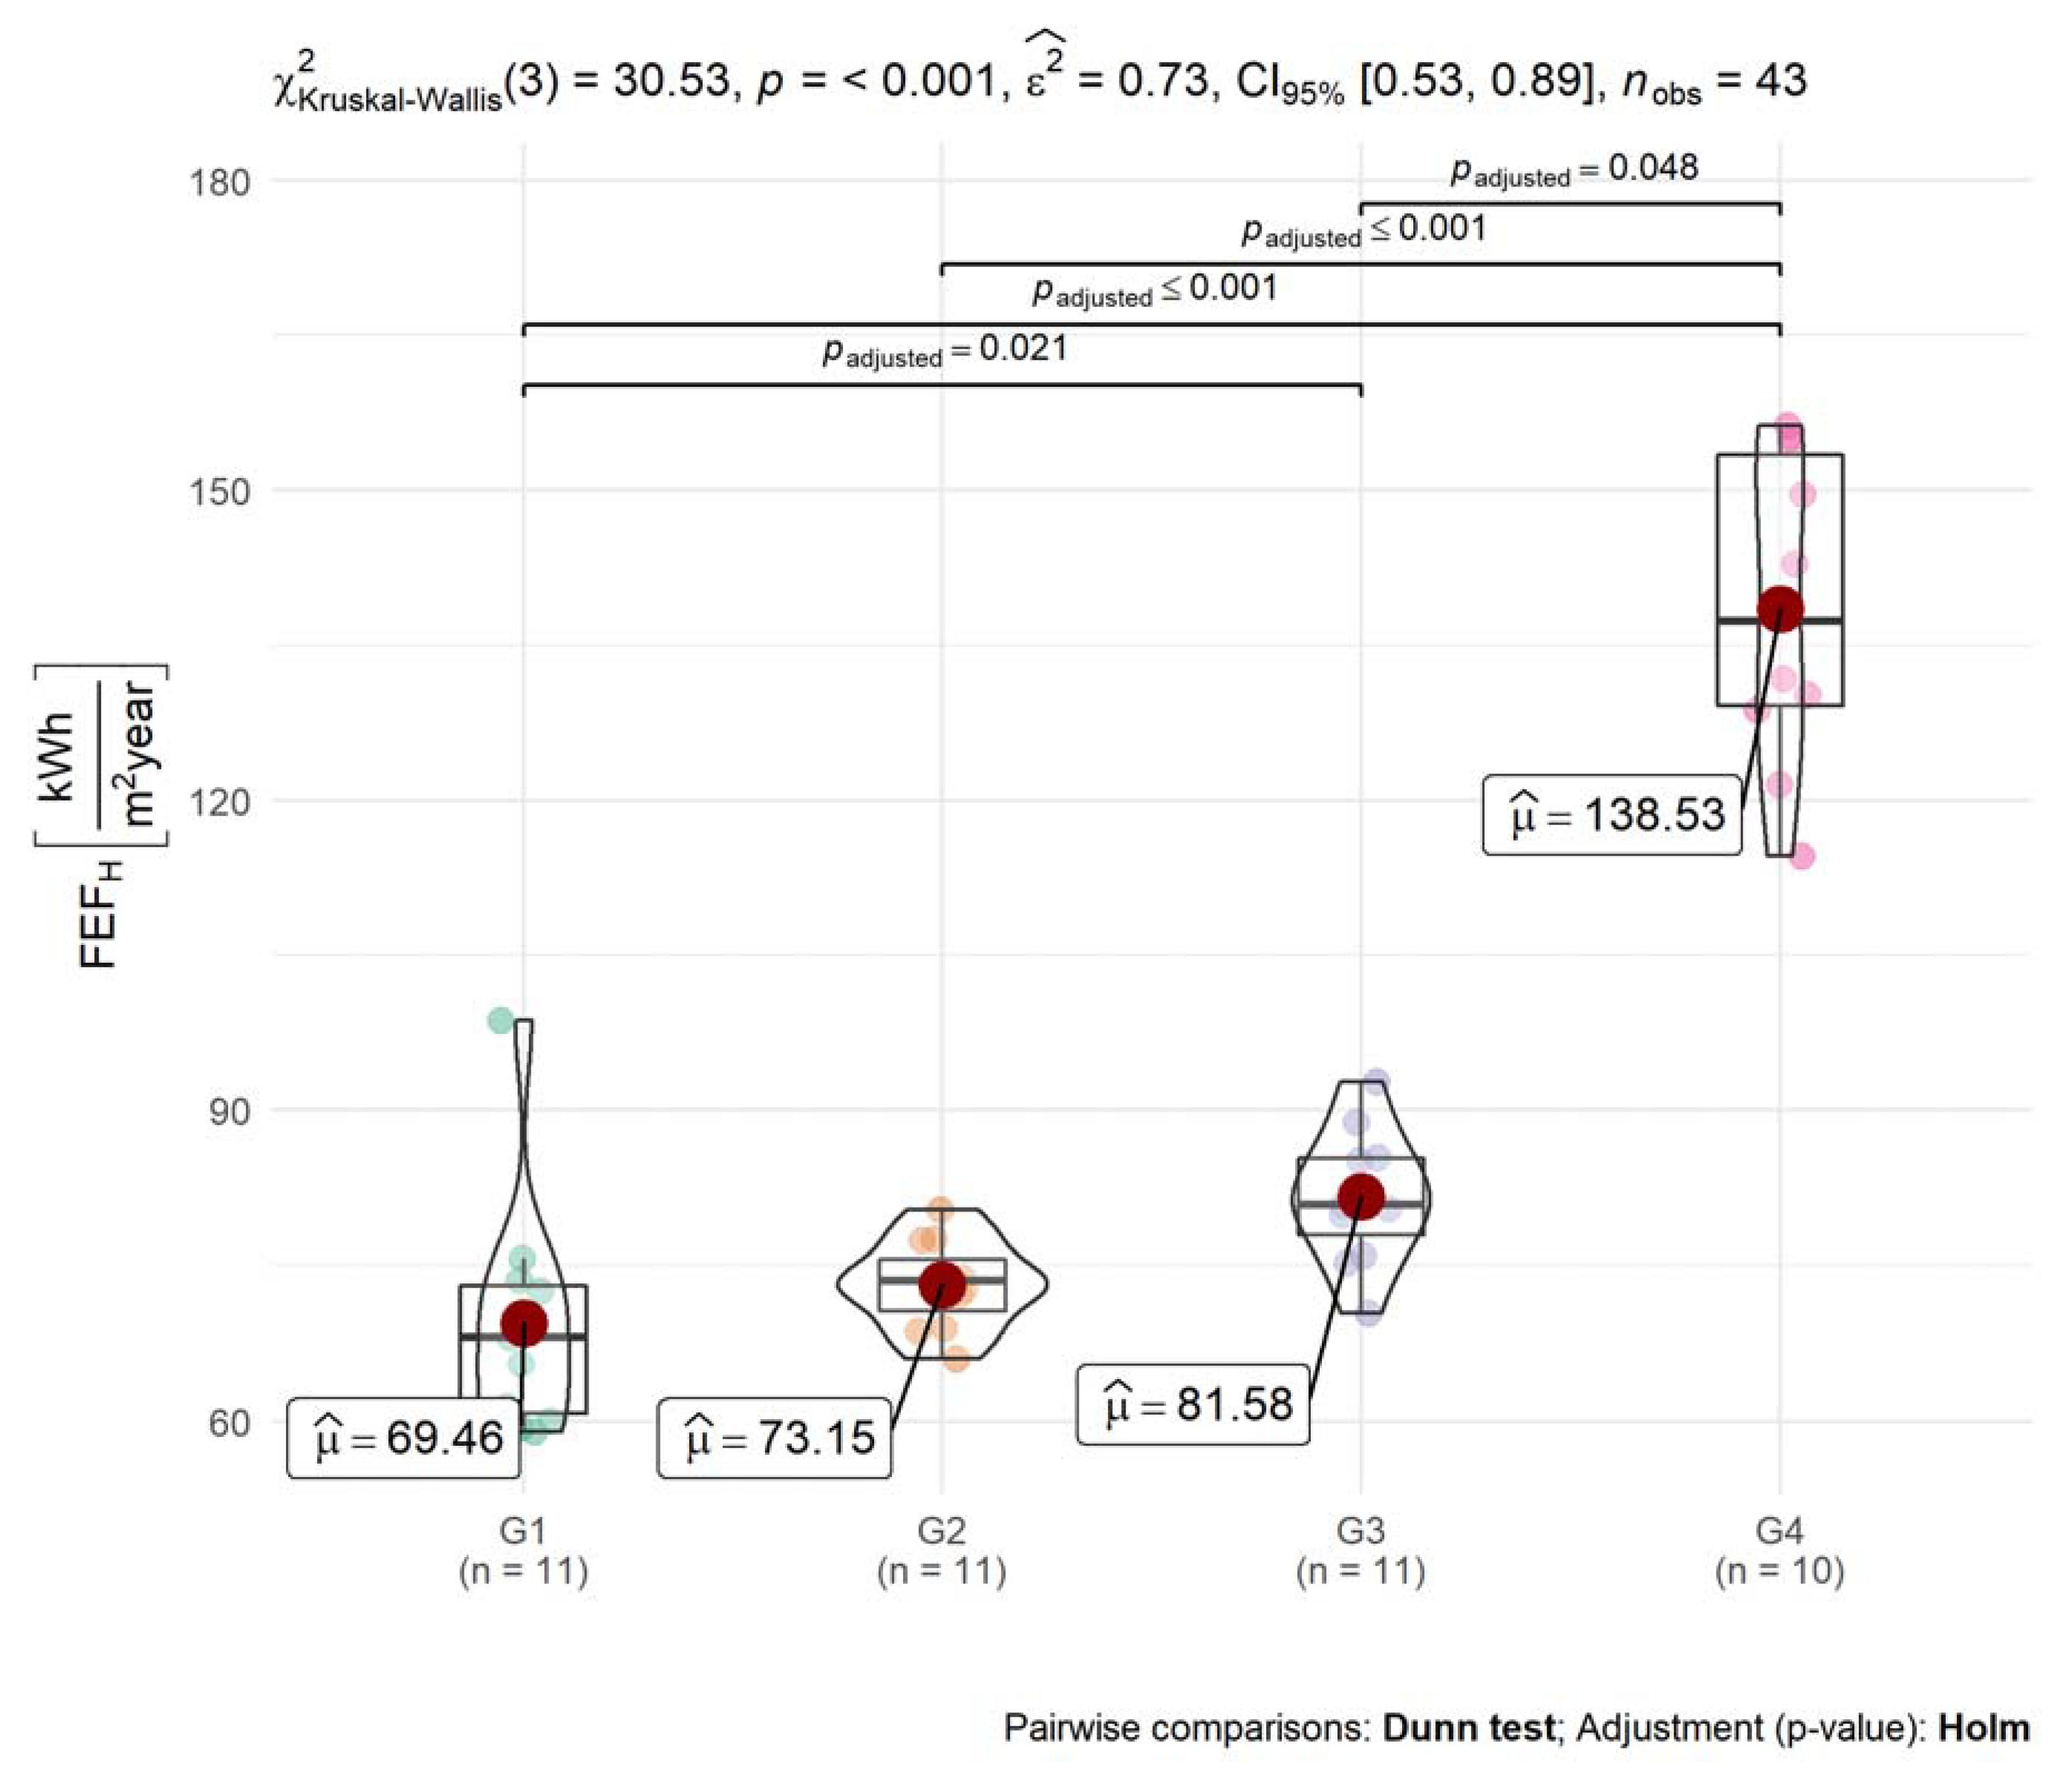
  • Despite similar parameters of wall barriers, the building shape coefficient (A/V = 0.31 to 0.5), and total efficiency of heating installations in the final state, some buildings were characterized with much higher values of the FEFH factor. These were mainly the objects belonging to group G4. This means that these buildings varied in terms of use, operation, and energy management. It should also be assumed that the method of energy management in a building largely affects its energy quality under the operational conditions. Therefore, thermal retrofitting of a building can be conducted to the same extent, yielding different energy effects under the actual conditions. This is indicated by diversified FEFH values both within a single group and between them.
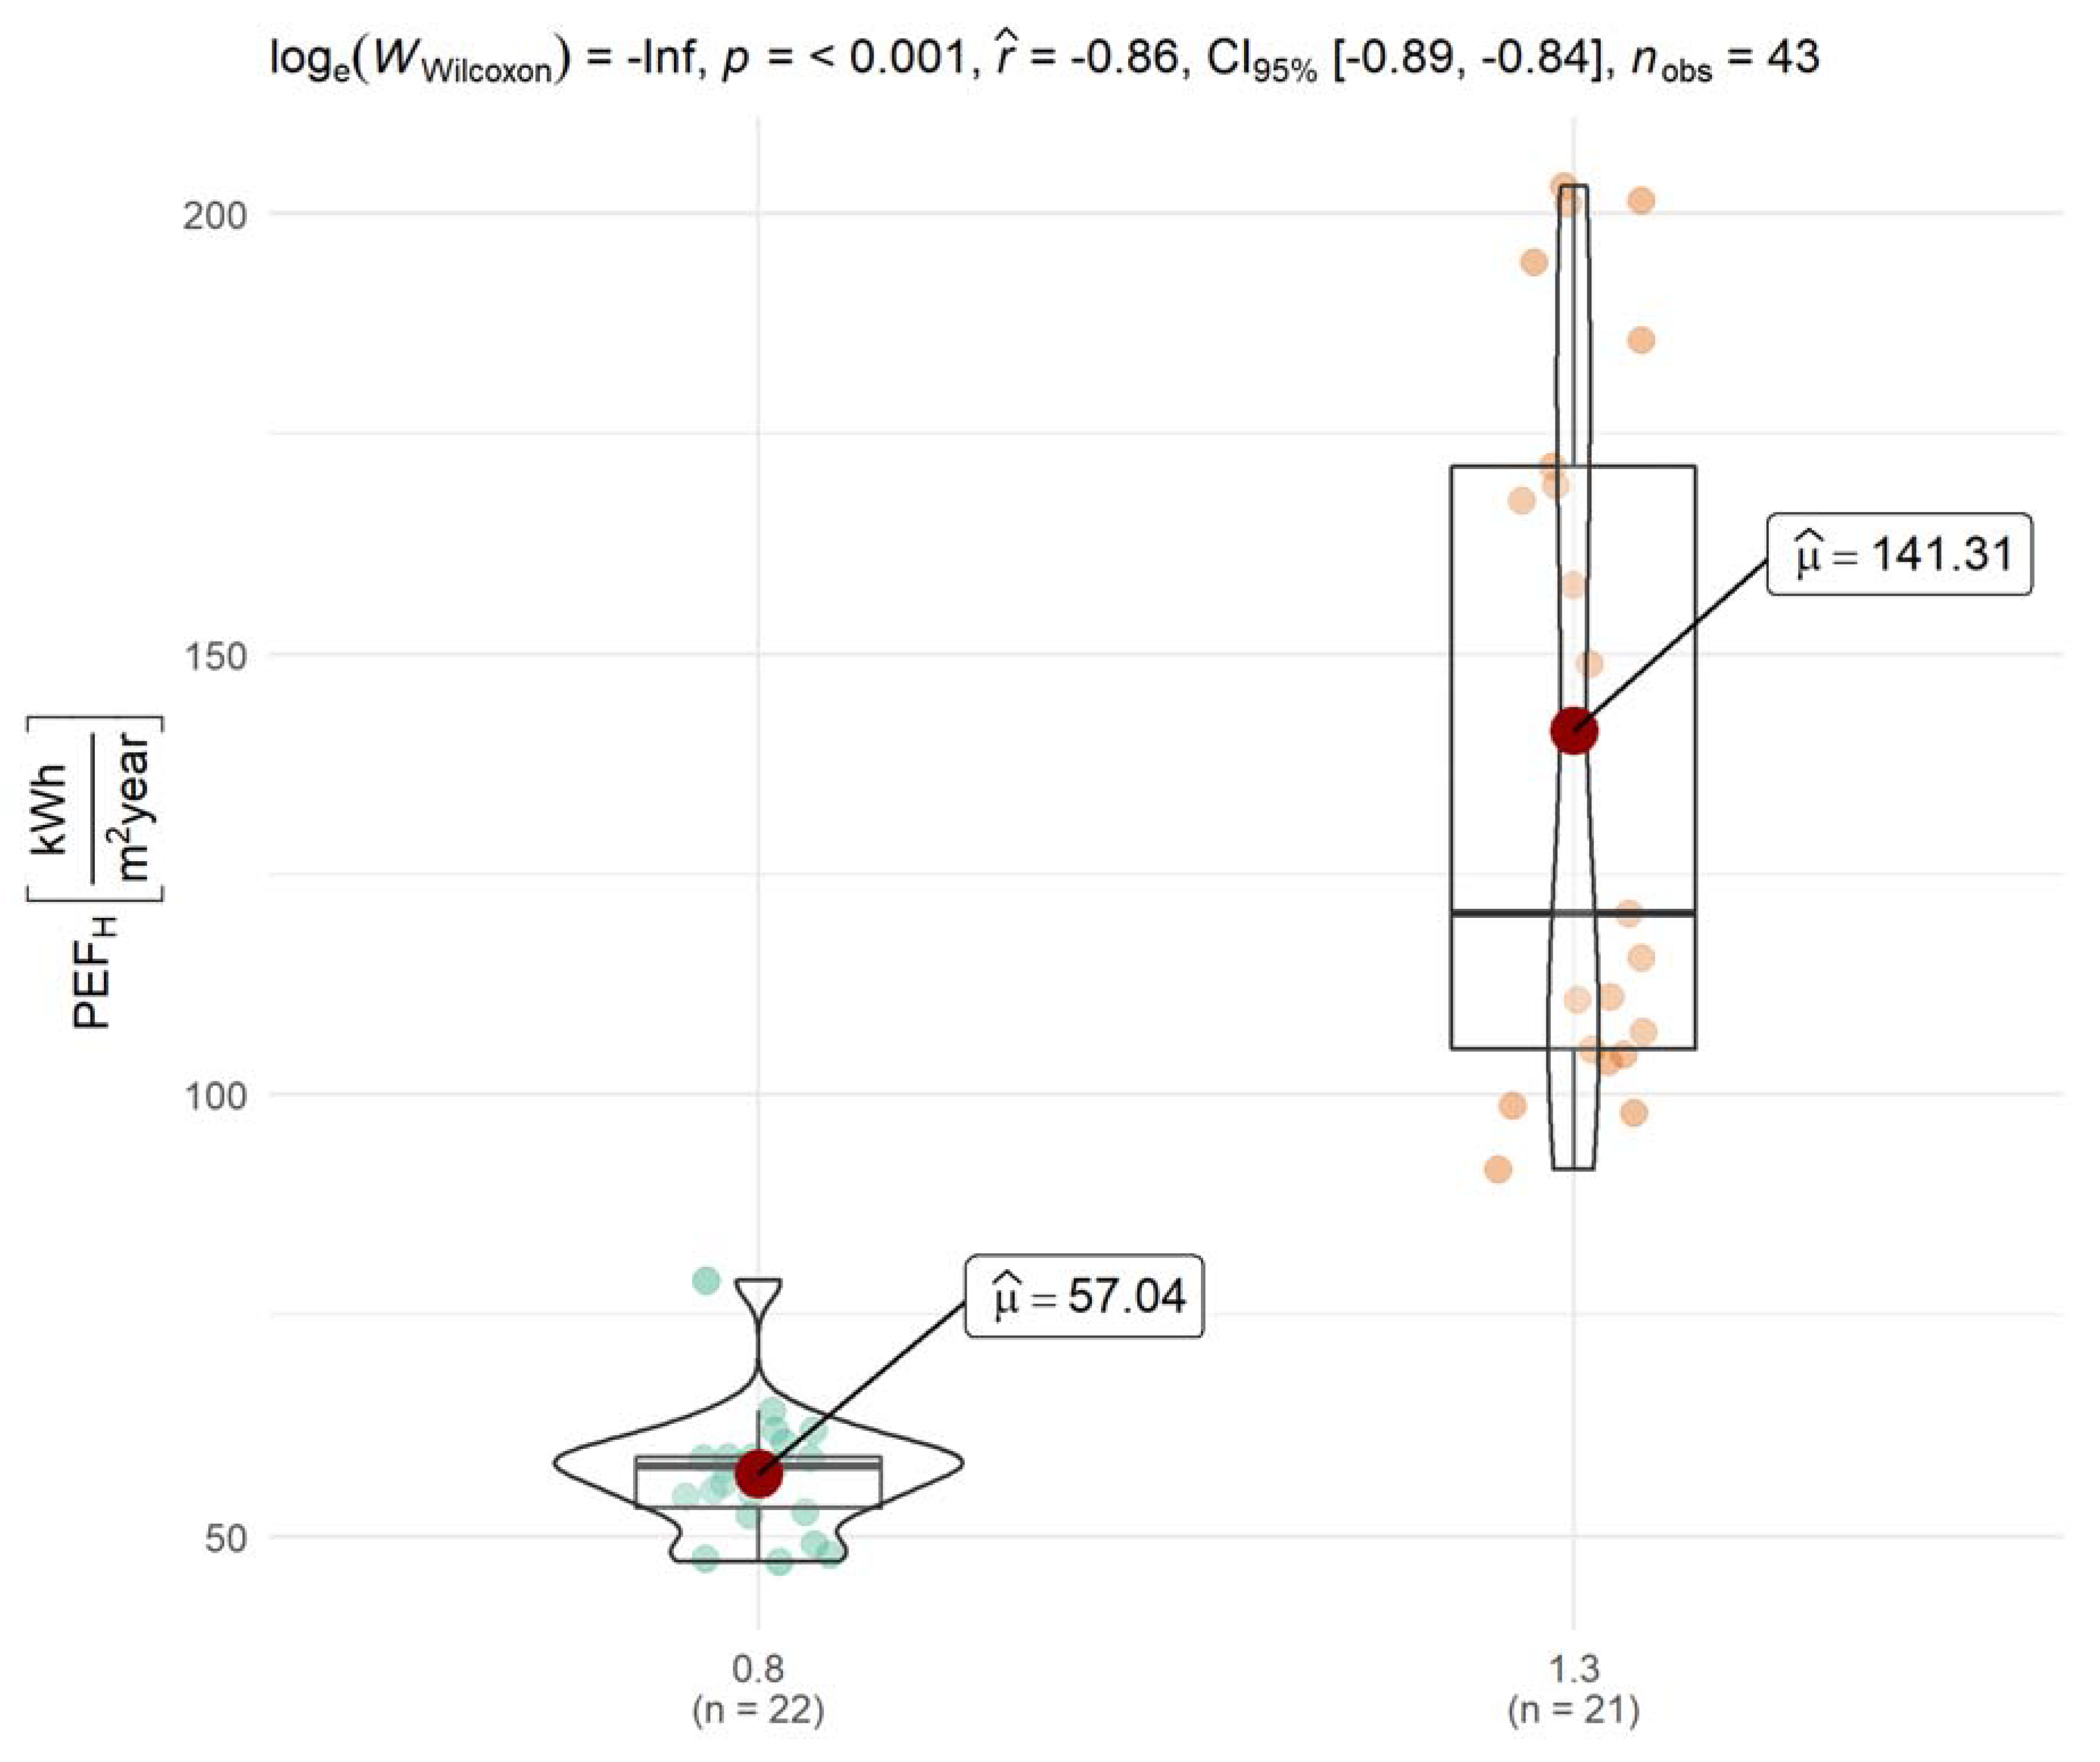
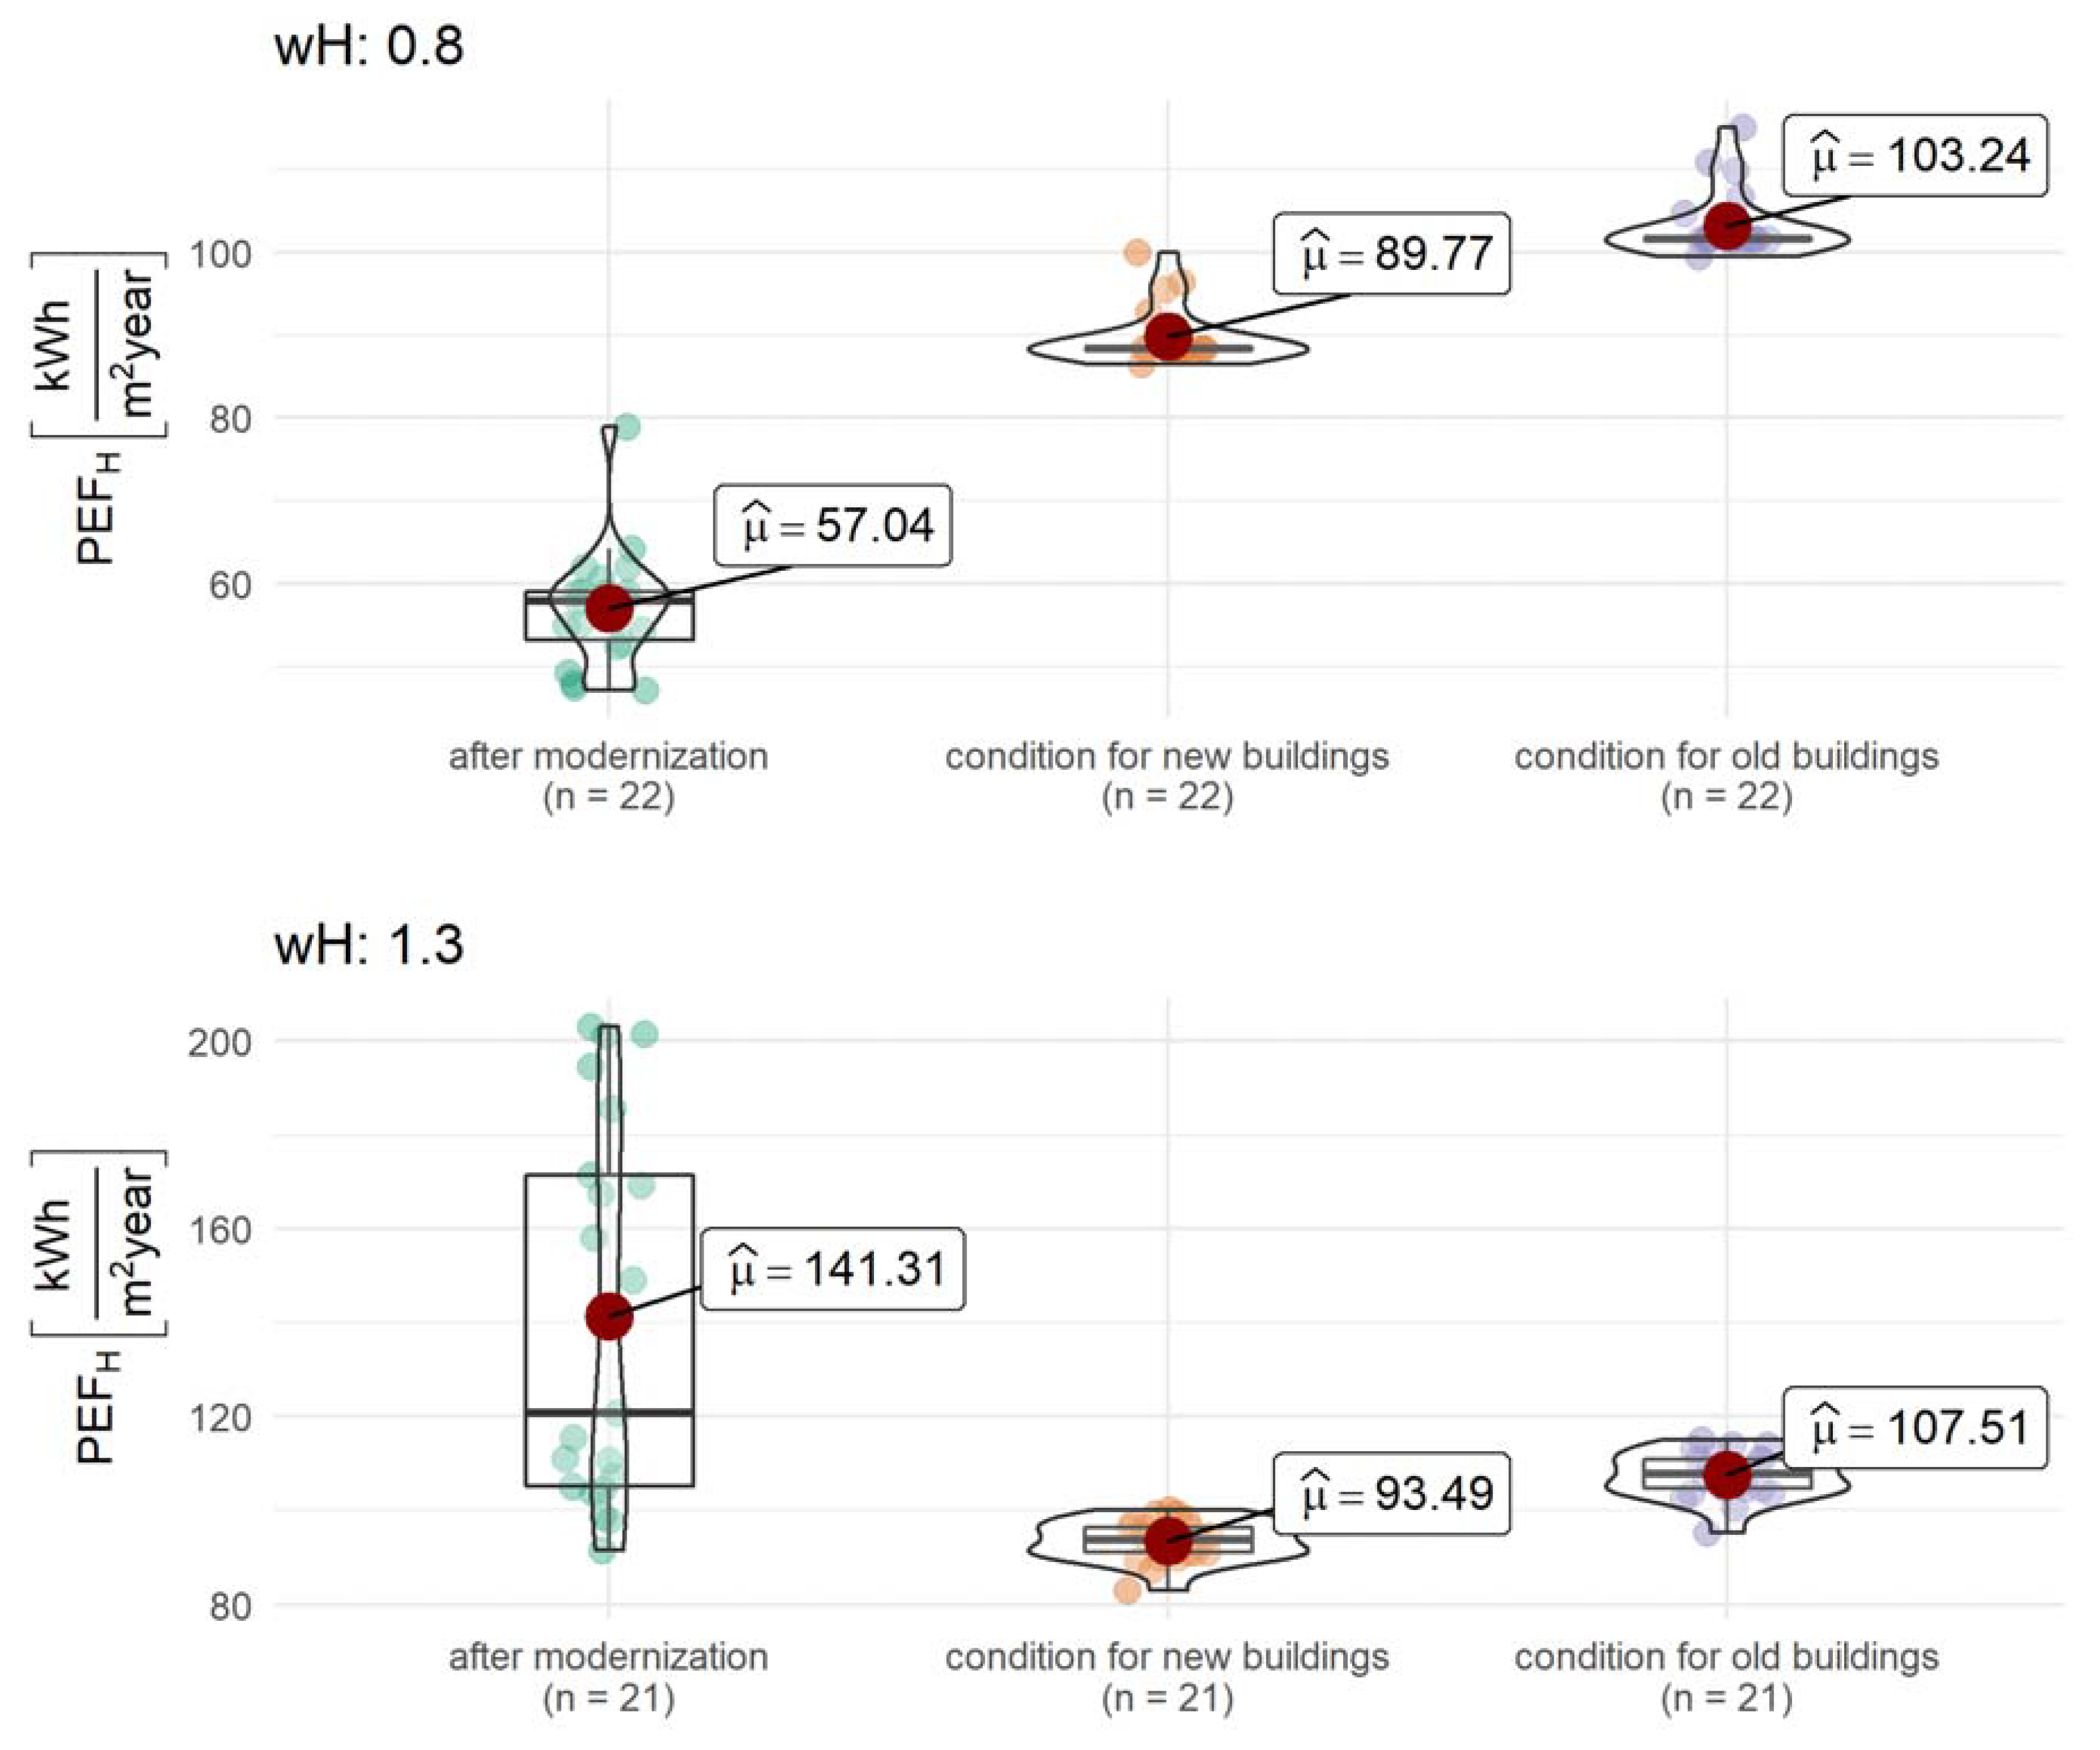
  • The buildings from groups G1 and G2 with input coefficient wH = 0.8 met the requirements for the annual primary energy factor, with mean values equal 104.9 and 101.5 kWh/(m2·year), respectively, with the measured average value of this factor equal to 57 kWh/(m2·year). On the other hand, the objects from groups G3 and G4 (with wH = 1.3) did not meet those requirements, reaching greater PEFH values compared to the boundary PEFH,0 values (110 and 104.8 kWh/(m2·year), respectively).
  • All buildings supplied from a district heating system with a co-generational heat source met the requirements of modernized buildings found in technical guidelines. However, not every building supplied from a district heating system equipped with coal heat plant met the requirements related to the PEFH,0 factor value, despite a FEFH factor that was comparable to other buildings. This is indicated through the comparison of the FEFH and PEFH factors in groups G1 and G2 to the values of these factors in G3.
  • The current requirements give a boundary value for the primary energy factor (PEFH+W, 0) for heating combined with hot water production, so it is not possible to say what the limit value for heating is. However, in the period in which the heat consumption of the modernized facilities was analyzed, it was possible to compare the consumption for heating purposes of the PEFH,0 limit value, but only for heating purposes.
The assessment of the energy quality of a building in terms of the heat demand for heating should be performed by means of the annual final energy demand factor (FEFH), whereas the environmental impact of a building should be calculated using the non-renewable primary energy demand factor (PEFH). The buildings with similar FEFH values can differ in terms of the PEFH factor, which does not necessarily indicate a lower energy quality of the building or its heating installation.

Author Contributions

Conceptualization, A.Ż. and Z.S.; data curation, A.Ż., Z.S., and D.M.; formal analysis, A.Ż., Z.S., and D.M.; funding acquisition, A.Ż., Z.S., and D.M.; investigation, A.Ż.; methodology, A.Ż.; project administration, A.Ż.; resources, A.Ż.; software, D.M.; supervision, Z.S.; validation, A.Ż., Z.S., and D.M.; visualization, D.M.; writing—original draft, A.Ż., Z.S., and D.M.; writing—review and editing, Z.S. All authors have read and agreed to the published version of the manuscript.

Funding

This research received no external funding.

Conflicts of Interest

The authors declare no conflict of interest.

References

  1. European Commission. Second Report on the State of the Energy Union; European Commission: Brussels, Belgium, 2017; Available online: https://ec.europa.eu/commission/sites/beta-political/files/2nd-report-state-energy-union_en.pdf (accessed on 2 September 2020).
  2. European Commission. Climate Action Paris Agreement. Available online: https://ec.europa.eu/clima/policies/international/negotiations/paris_en (accessed on 2 September 2020).
  3. Wang, B.; Xia, X.; Zhang, J. A multi-objective optimization model for the life-cycle cost analysis and retrofitting planning of buildings. Energ. Build. 2014, 77, 227–235. [Google Scholar] [CrossRef] [Green Version]
  4. Fan, Y.; Xia, X. A multi-objective optimization model for energy-efficiency building envelope retrofitting plan with rooftop PV system installation and maintenance. Appl. Energ. 2017, 189, 327–335. [Google Scholar] [CrossRef] [Green Version]
  5. Act of Polish Government of 18 December 1998 on Supporting Thermomodernization Projects; Warsaw, Poland, 1998. Available online: http://isap.sejm.gov.pl/isap.nsf/DocDetails.xsp?id=WDU19981621121 (accessed on 2 September 2020).
  6. Regulation of The Polish Minister of Interior and Administration of 30 April 1999 Concerning Scope and form of the Energy Audit as well as Algorithms for Assessing the Profitability of Thermo-Modernization Project and the Patterns of the Energy Audit Cards. Available online: http://prawo.sejm.gov.pl/isap.nsf/DocDetails.xsp?id=WDU19990460459 (accessed on 2 September 2020).
  7. Directive 2002/91/EC of the European Parliament and of the Council of 16 December 2002 on the Energy Performance of Buildings. Available online: https://eur-lex.europa.eu/legal-content/EN/TXT/?uri=CELEX%3A32002L0091 (accessed on 2 September 2020).
  8. Życzyńska, A.; Suchorab, Z.; Kočí, J.; Černý, R. Energy effects of retrofitting the educational facilities located in south-eastern poland. Energies 2020, 13, 2449. [Google Scholar] [CrossRef]
  9. Życzyńska, A. The influence of heating and hot water system on the energy performance of a building. Rynek Energii 2009, 6, 46–54. [Google Scholar]
  10. Regulation of the Minister of Infrastructure of 14 November 2017 amending the Regulation on the Technical Conditions to be Met by Buildings and Their Location. Available online: http://isap.sejm.gov.pl/isap.nsf/DocDetails.xsp?id=WDU20170002285 (accessed on 2 September 2020).
  11. Mejjaouli, S.; Alzahrani, M. Decision-making model for optimum energy retrofitting strategies in residential buildings. Sustain. Prod. Consump. 2020, 24, 211–218. [Google Scholar] [CrossRef]
  12. Piccardo, C.; Dodoo, A.; Gustavsson, L.; Tettey, U. Retrofitting with different building materials: Life-cycle primary energy implications. Energy 2020, 192, 116648. [Google Scholar] [CrossRef]
  13. Brzyski, P.; Barnat-Hunek, D.; Suchorab, Z.; Łagód, G. Composite materials based on hemp and flax for low-energy buildings. Materials 2017, 10, 510. [Google Scholar] [CrossRef]
  14. Barnat-Hunek, D.; Siddique, R.; Łagód, G. Properties of hydrophobised lightweight mortars with expanded cork. Constr. Build. Mater. 2017, 155, 15–25. [Google Scholar] [CrossRef]
  15. Barnat-Hunek, D.; Widomski, M.; Szafraniec, M.; Łagód, G. Impact of different binders on the roughness, adhesion strength, and other properties of mortars with expanded cork. Materials 2018, 11, 364. [Google Scholar] [CrossRef] [Green Version]
  16. Nemry, F.; Uihlein, A.; Colodel, C.M.; Wetzel, C.; Braune, A.; Wittstock, B.; Hasan, I.; Kreißig, J.; Gallon, N.; Niemeier, S.; et al. Options to reduce the environmental impacts of residential buildings in the European Union—Potential and costs. Energ. Build. 2010, 42, 976–984. [Google Scholar] [CrossRef]
  17. Dodoo, A.; Gustavsson, L.; Sathre, R. Life cycle primary energy implication of retrofitting a wood-framed apartment building to passive house standard. Resour. Conserv. Recy. 2010, 54, 1152–1160. [Google Scholar] [CrossRef]
  18. Pombo, O.; Allacker, K.; Rivela, B.; Neila, J. Sustainability assessment of energy saving measures: A multi-criteria approach for residential buildings retrofitting—A case study of the Spanish housing stock. Energ. Build. 2016, 116, 384–394. [Google Scholar] [CrossRef] [Green Version]
  19. Ramírez-Villegas, R.; Eriksson, O.; Olofsson, T. Life cycle assessment of building renovation measures–trade-off between building materials and energy. Energies 2019, 12, 344. [Google Scholar] [CrossRef] [Green Version]
  20. Wang, Q.; Holmberg, S. Combined retrofitting with low temperature heating and ventilation energy savings. Energy Procedia 2015, 78, 1081–1086. [Google Scholar] [CrossRef] [Green Version]
  21. Song, X.; Ye, C.; Li, H.; Wang, X.; Ma, W. Field study on energy economic assessment of office buildings envelope retrofitting in southern China. Susain. Cities Soc. 2017, 28, 154–161. [Google Scholar] [CrossRef]
  22. Mehlika, N.; Inanici, F.N.D. Thermal performance optimization of building aspect ratio and south window size in five cities having different climatic characteristics of Turkey. Build. Environ. 2000, 35, 41–52. [Google Scholar]
  23. El-Darwish, I.; Gomaa, M. Retrofitting strategy for building envelopes to achieve energy efficiency. Alex. Eng. J. 2017, 56, 579–589. [Google Scholar] [CrossRef] [Green Version]
  24. De Rosa, M.; Bianco, V.; Scarpa, F.; Tagliafico, L.A. Heating and cooling building energy demand evaluation; a simplified model and a modified degree days approach. Appl. Energ. 2014, 128, 217–229. [Google Scholar] [CrossRef]
  25. Mazzola, E.; Dalla Mora, T.; Peron, F.; Romagnoni, P. An integrated energy and environmental audit process for historic buildings. Energies 2019, 12, 3940. [Google Scholar] [CrossRef] [Green Version]
  26. Regulation of the Polish Minister of Infrastructure of 17 March 2009 Concerning Scope and form of the Energy Audit and the Repair Audit, Design Audits Cards, as well as Algorithms for Assessing the Profitability of Thermo-Modernization Project. Available online: http://isap.sejm.gov.pl/DetailsServlet?id=WDU20090430347 (accessed on 2 September 2020).
  27. Marrone, P.; Gori, P.; Asdrubali, F.; Evangelisti, L.; Calcagnini, L.; Grazieschi, G. Energy benchmarking in educational buildings through cluster analysis of energy retrofitting. Energies 2018, 11, 649. [Google Scholar] [CrossRef] [Green Version]
  28. Biserni, C.; Valdiserri, P.; D’Orazio, D.; Garai, M. Energy retrofitting strategies and economic assessments: The case study of a residential complex using utility bills. Energies 2018, 11, 2055. [Google Scholar] [CrossRef] [Green Version]
  29. Mancini, F.; Nastasi, B. Energy retrofitting effects on the energy flexibility of dwellings. Energies 2019, 12, 2788. [Google Scholar] [CrossRef] [Green Version]
  30. Cholewa, T.; Balaras, C.A.; Nižetić, S.; Siuta-Olcha, A. On calculated and actual energy savings from thermal building renovations: Long term field evaluation of multifamily buildings. Energ. Buildings 2020, 223, 110145. [Google Scholar] [CrossRef]
  31. Woroniak, G.; Piotrowska-Woroniak, J. Effects of pollution reduction and energy consumption reduction in small churches in Drohiczyn community. Energ. Build. 2014, 72, 51–61. [Google Scholar] [CrossRef]
  32. Życzyńska, A. The heat consumption and heating costs after the insulation of building partitions of building complex supplied by the local oil boiler room. Eksploat. Niezawodn. 2014, 16, 313–318. [Google Scholar]
  33. Regulation of the Polish Minister of Infrastructure of 27 February 2015 Concerning the Methodology for Calculating the Energy Performance of the Building or Part of a Building and the Preparation of Certificates of Energy Performance. Available online: http://prawo.sejm.gov.pl/isap.nsf/DocDetails.xsp?id=WDU20150000376 (accessed on 2 September 2020).
  34. Regulation of the Polish Minister of Infrastructure of 6 November 2008 Concerning the Methodology for Calculating the Energy Performance of the Building and a Residential Unit or Part of a Building which is the whole Technical-Independent Utility and the Preparation and Presentation of Certificates of Energy Performance. Available online: http://isap.sejm.gov.pl/DetailsServlet?id=WDU20082011240 (accessed on 2 September 2020).
  35. Fay, M.P.; Proschan, M.A. Wilcoxon-Mann-Whitney or t-test? On assumptions for hypothesis tests and multiple interpretations of decision rules. Statist. Surv. 2010, 4, 1–39. [Google Scholar] [CrossRef]
  36. Kim, T.K.; Park, J.H. More about the basic assumptions of t-test: Normality and sample size. Korean J. Anesthesiol. 2019, 72, 331–335. [Google Scholar] [CrossRef]
  37. Shapiro, S.S.; Wilk, M.B. An analysis of variance test for normality (complete samples). Biometrika 1965, 52, 591–611. [Google Scholar] [CrossRef]
  38. Bowerman, B.L.; Mason, R.L.; Gunst, R.F.; Hess, J.L. Statistical design and analysis of experiments with applications to engineering and science. Technometrics 1991, 33, 106. [Google Scholar] [CrossRef]
  39. Vargha, A.; Delaney, H.D. A Critique and improvement of the “CL” common language effect size statistics of mcgraw and wong. J. Educ. Behav. Stat. 2000, 25, 101–132. [Google Scholar]
  40. Corder, G.W.; Foreman, D.I. Nonparametric Statistics for Non-Statisticians: A Step-by-Step Approach; John Wiley & Sons, Inc.: Hoboken, NJ, USA, 2009; ISBN 978-1-118-16588-1. [Google Scholar]
  41. Albers, C.; Lakens, D. When power analyses based on pilot data are biased: Inaccurate effect size estimators and follow-up bias. J. Exp. Soc. Psychol. 2018, 74, 187–195. [Google Scholar] [CrossRef] [Green Version]
  42. Marcus, R.; Eric, P.; Gabriel, K.R. On closed testing procedures with special reference to ordered analysis of variance. Biometrika 1976, 63, 655–660. [Google Scholar] [CrossRef]
  43. R Core Team. R: A Language and Environment for Statistical Computing. 2020. Available online: https://www.r-project.org/ (accessed on 2 September 2020).
  44. Kassambara, A. Ggpubr: “Ggplot2” Based Publication Ready Plots. Available online: https://cran.r-project.org/web/packages/ggpubr/index.html (accessed on 2 September 2020).
  45. Kassambara, A. Rstatix: Pipe-Friendly Framework for Basic Statistical Tests. Available online: https://cran.r-project.org/web/packages/rstatix/index.html (accessed on 2 September 2020).
  46. Indrajeet, P.; Powell, C.; Beasley, W.; Heck, D.; Hvitfeldt, E.; Baniecki, H. Maintenance release and adjusting for pairwise Comparisons changes. Zenodo 2020. Available online: https://zenodo.org/record/2074621 (accessed on 2 September 2020).
Figure 1. Comparison of corrected annual energy consumption before and after retrofitting.
Energies 13 04625 g001
Figure 2. Comparison of the actual decrease in corrected annual energy consumption with the reduction predicted based on the audit.
Energies 13 04625 g002
Figure 3. Comparison of the audit results with the actual decrease in energy consumption.
Energies 13 04625 g003
Figure 4. Comparison of decreases in energy consumption between groups of buildings.
Energies 13 04625 g004
Figure 5. Comparison of annual final energy consumption factor (FEFH).
Energies 13 04625 g005
Figure 6. Comparison of the annual primary energy consumption for different non-renewable primary energy input coefficients.
Energies 13 04625 g006
Figure 7. Comparison of the actual annual primary energy consumption factor (PEFH) after modernization with the boundary conditions for the modernized (old) and new buildings, divided into groups depending on the non-renewable primary energy input coefficient.
Energies 13 04625 g007
Table 1. Building groups.
No.Number of Build.Heated Usable Area
[m2]
Heat SourcewHA/V
[1/m]
Meas. Period
[Years]
Year of Thermal Retrofitting
[Years]
Level of Energy Savings According to the Energy Audit
[%]
G 1111036.4 ÷ 3834.5Combined heat and power plant (cogeneration)0.80.35 ÷ 0.502005 ÷ 2010200629.3 ÷ 37.3
G 2113700.0 ÷ 4125.8Combined heat and power plant (cogeneration)0.80.34 ÷ 0.372003 ÷ 2010Depending on the building:
2004, 2005, 2006 or 2007
27.0 ÷ 39.1
G 3111539.0 ÷ 3142.0Heating plant1.30.42 ÷ 0.502003 ÷ 2009200442.8 ÷ 56.5
G 4101090.5 ÷ 4519.6Heating plant1.30.31 ÷ 0.491998 ÷ 2008Depending on the building:
2001, 2003, 2004, or 2005
36.6 ÷ 45.4
Table 2. Correction coefficient φ.
No.YearValue of the Correction Coefficient φ
G1G2G3G4
11998---1.044
21999---1.113
32000---1.155
42001---1.020
52002---1.092
62003-0.9290.9971.051
72004-0.9801.1471.098
820051.0311.0331.0461.020
920060.9970.9241.0961.057
1020071.0721.2711.1401.114
1120081.1261.0381.1591.081
1220091.0811.0701.128-
1320100.9680.984--
Table 3. Characteristics and heat consumption of an object from the group G1.
YearQp
[GJ/year]
Q0
[GJ/year]
Φ
[-]
FEFH
[kWh/(m2·year)]
PEFH
[kWh/(m2·year)]
Q01,śr
[GJ/year]
Q02,śr
[GJ/year]
Savings per
Audit
[%]
Savings per
Meas.
[%]
20057097311.031106.5085.20730.2504.632.630.9
20066766740.99798.2778.62
20075255631.07282.0265.62
20084134651.12667.7554.20
20094514871.08171.0156.81
Table 4. Characteristics and heat consumption of an object from the group G2.
YearQp
[GJ/Year]
Q0
[GJ/year]
Φ
[-]
FEFH
[kWh/(m2·year)]
PEFH
[kWh/(m2·year)]
Q01,śr
[GJ/year]
Q02,śr
[GJ/year]
Savings per
Audit
[%]
Savings per
Meas.
[%]
2003175816340.929118.4994.791429.01052.028.726.4
2004145614270.980103.5482.83
2005130413471.03397.7478.19
2006141713100.92494.9875.98
200790611521.27183.5266.81
200896910061.03872.9958.40
200999610661.07077.3561.88
2010110210850.98478.6562.92
Table 5. Characteristics and heat consumption of an object from the group G3.
YearQp
[GJ/year]
Q0
[GJ/year]
Φ
[-]
FEFH
[kWh/(m2·year)]
PEFH
[kWh/(m2·year)]
Q01,śr
[GJ/year]
Q02,śr
[GJ/year]
Savings per
Audit
[%]
Savings per
Meas.
[%]
20038138110.997142.96185.84810.6503.956.237.8
20046297221.147127.24165.41
20054474681.04682.46107.20
20064975451.09696.07124.89
20074304911.1486.46112.39
20084184851.15985.44111.08
20094725331.12893.90122.07
Table 6. Characteristics and heat consumption of an object from the group G4.
YearQp
[GJ/year]
Q0
[GJ/year]
Φ
[-]
FEFH
[kWh/(m2·year)]
PEFH
[kWh/(m2·year)]
Q01,śr
[GJ/year]
Q02,śr
[GJ/year]
Savings per
Audit
[%]
Savings per
Meas.
[%]
2002148116181.092186.64242.631589.21052.845.433.8
2003152216001.051184.59239.97
2004141315511.098178.98232.68
2005131013361.02154.18200.43
200697510311.057118.93154.61
200791510191.114117.59152.87
2008102611091.081127.96166.35
Table 7. Percent decrease in heat consumption in relation to the value from the audit.
Data SourceNumber of BuildingsHeat Consumption Decrease [%]
MinimalMaximalMedianMean
audit4329.157.036.738.4
readout4314.043.930.430.2
Table 8. Values of the FEFH factor after thermal retrofitting.
Building GroupFEFH Value [kWh/(m2·year)]
MinimalMaximal MedianMean
G1 58.998.668.169.5
G266.080.373.573.2
G370.480.992.881.6
G4114.6156.3137.3138.5
Table 9. Values of PEFH factor after thermal retrofitting.
wHBuilding GroupPEFH Value [kWh/(m2·year)]Mean PEFH,0 Value [kWh/(m2·year)]
MinimalMaximalMedianMean
0.8 G1 and G247.178.957.957.0104.9 and 101.5
1.3G3 and G491.5203.2120.6141.3110.0 and 104.8

