Article

An Experimental Study on the Fire Spread Rate and Separation Distance between Facing Stores in Passage-Type Traditional Markets

1
Department of Fire and Disaster Prevention, Daejeon University, 62 Daehak-ro, Dong-Gu, Daejeon 34520, Korea
2
Department of Research and Development Laboratory, Korea Fire Institute, 331 Jisam-ro, Giheung-Gu, Yongin 17088, Korea
*
Author to whom correspondence should be addressed.
Energies 2020, 13(17), 4458; https://doi.org/10.3390/en13174458
Submission received: 28 July 2020 / Revised: 27 August 2020 / Accepted: 27 August 2020 / Published: 28 August 2020
(This article belongs to the Special Issue Engineering Fluid Dynamics 2019-2020)

Abstract

:
Real-scale fire experiments were conducted to understand the fire spread characteristics of the major combustibles handled in traditional markets, a space with high fire risk. The major combustibles were selected through field surveys administered at a number of traditional markets. Through real-scale fire experiments, the horizontal fire spread rate according to the maximum heat release rate of major combustibles was examined. In addition, the separation distance to prevent fire spread to the facing store by radiant heat transfer was examined. As a result of the experiments, it was confirmed that the arrangement method of the combustibles causes a large change in the maximum heat release rate, fire growth rate, and fire spread rate. The horizontal fire spread rate showed a linear proportional relationship with respect to the maximum heat release rate regardless of the type of combustibles, and a correlation to define the relationship was proposed. A correlation equation for predicting the separation distance that can prevent fire spread by radiant heat transfer was proposed, and the curve by the correlation equation was in good agreement with the experimental results. Through this study, it is expected that the correlation proposed to examine the horizontal fire spread rate and the separation distance of major combustibles in a traditional market can be usefully used in the design of fire protection systems to reduce fire damage in the traditional market.

Graphical Abstract

1. Introduction

In the field of fire engineering, the use of simulation programs for fire risk assessment of buildings is increasing. The most commonly used Fire Dynamics Simulator (FDS) [1] predicts fire phenomena according to the input parameters given by the user, so the accuracy of the input parameters is very important. This has increased the importance of real-scale fire experiments in the field of fire engineering. Recently, studies for securing input parameters and understanding fire phenomena through real-scale fire tests according to the use of buildings have been actively conducted. For instance, Madrzykowski and Johnsson [2] and Bwalya et al. [3] conducted real-scale fire experiments in residential spaces and presented a measurement of the heat release rate according to the sprinklers’ operation. Bennetts et al. [4] conducted office fire experiments to measure temperature, heat flux, and carbon monoxide (CO) concentration related to human safety standards. In addition, Zalok et al. [5] and Hadjisophocleous et al. [6] proposed a fuel package representing fires in commercial premises based on fire loads and present design fire through fire experiments for the fuel package. In another study, Gross et al. [7] presented fire severity according to fire load in hospitals, schools, and warehouses, including residential spaces, to quantify the fire scale. These studies have significantly contributed to ensuring buildings’ fire safety in modern society. However, most studies only consider modern buildings and spaces with high fire risk due to outdated facilities not being considered.
Most traditional markets were formed naturally before modern sales and distribution facilities were established, and can be found all over the world. Traditional markets are not systematically designed; therefore, it is composed of temporary buildings and tends to have low fire resistance. Moreover, the indiscriminate use of gas and electric appliances is a factor that increases traditional markets’ fire risk. In fact, many fire accidents still occur in Southeast Asian countries where traditional markets have developed. For example, a fire in a traditional market in South Korea burned down about 700 stores and caused 40 million dollars’ worth of property damage [8]. Due to the characteristics of the traditional market used by a large number of unspecified people, it is essential to ensure fire safety because many casualties are caused by fire accident. Researchers in South Korea recently proposed the application of the afforestation system [9] and water-based fire protection system [10,11] to reduce fire damage in traditional markets. However, a clear understanding of fire phenomena in traditional markets is necessary in order to determine the required performance of potential safety measures. However, research focusing specifically on fire characteristics in these markets is difficult to find both in South Korea, which has a high interest in traditional market fires, and in the world. Therefore, in this study, a real-scale fire test was conducted as part of a project for the development of a water curtain system optimized for a traditional market and fire protection design throughout. For this, major combustibles with high fire loads were selected in the traditional market. In the experiment, the heat release rate, the incident heat flux according to the distance were measured, and the fire spreading phenomena was examined.
Most traditional markets are designed as “passage-type”, with stores facing each other across a passageway. Stores in the passage-type traditional market are separated by simple structures, such as thin walls or sandwich panels. As a result, fire can spread very easily between adjacent stores via direct flame contact. Since the fire spread is closely related to an increase in the fire growth rate—or the maximum heat release rate according to combustion area—understanding the fire spread characteristics is very important in establishing a fire safety plan. Most of these studies analyze the fire spread phenomena in a well-controlled thermal environment targeting widely used materials [12,13,14]. However, in actual fire environments, the fire spread can vary due to numerous factors, such as the amount, arrangement, and location of combustibles. As a result, defining the fire spread through bench-scale experiments is sometimes a limited approach. Recently, research has been conducted to predict the fire spread of combustibles through simulation [15,16]. However, prediction of thermal decomposition and fire spread phenomena of combustibles through simulation requires the input of numerous factors, such as activation energy, pre-exponential factor, and heat of combustion (including thermal properties). Since these values must be measured very precisely and are required individually for each material, there are limitations in predicting the actual fire spread at the current stage of research. Therefore, real-scale fire testing on target combustibles is the most effective way to understand fire spread characteristics. Additionally, examining the relationship between the physical quantities obtained from the experiment and the fire spread rate can be used as a simple means to replace various and complicated input parameters required in simulation.
In addition to the fire spread to adjacent stores by direct flame contact, the fire can spread to facing stores with passages in between. The fire on the facing store, i.e., on the new line, spreads to adjacent stores located on the same line by flame contact, which can greatly increase the size of the fire. Therefore, a number of studies have been conducted on the necessary separation distance to reduce damage caused by fire spreading across separate spaces [17,18,19,20,21,22]. These studies mainly considered the vertical and horizontal fire spread between buildings due to contact of the facade flame and flying brand. However, in the traditional market, facing stores are not separated by walls, and combustibles placed in the passages are very close, so they have a relatively high fire risk. Therefore, examining the separation distance suitable for the fire environment of the traditional market is requried. Radiant heat flux is usually what causes fire to spread between stores facing each other in passage-type traditional markets. Radiant heat flux can cause thermal decomposition and ignition of combustibles located far away without direct flame contact. Thus, identifying the precise separation distance where the radiant heat flux emitted from the fire source decreases below the critical value can provide useful information for reducing fire damage in traditional markets.
Based on this background, in this study, real-scale fire experiments were conducted on major combustibles in the traditional market. Major combustibles based on fire load were selected through field surveys of three traditional markets. Clothing, blankets, plastics, and bags were selected as the major combustibles. Experiments and analysis were conducted to quantify the fire spread of combustibles arranged to have a shape and fire load similar to those of the actual traditional market. The relationship between the maximum heat release rate and the fire spread rate was examined, and the distance between the stores to prevent fire spread was suggested through the measurement of the incident radiated heat flux. Finally, the curve based on the theory of incident heat flux for the remote target proposed by Modak [23] and the separation distance derived through experiments were compared. It is expected that the results of this study can be used as basic information useful in the application of water curtain system to prevent fire spread and reduce damage in traditional markets.

2. Fire Characteristics of Traditional Market

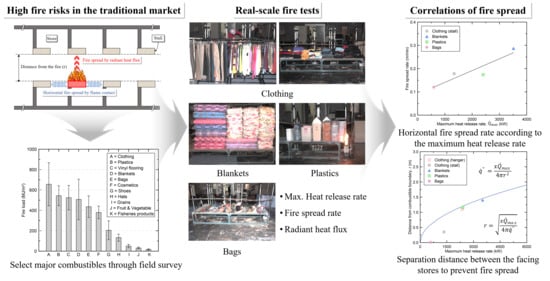
2.1. Spreading Paths of the Fire

Figure 1a presents a picture of a passage-type traditional market taken during the field survey process, and the field survey process is described later. Facing stores are arranged in parallel, and these structures are generally similar. The width of the passage varies slightly from market to market, but is generally about 3.0 m. However, as shown in Figure 1a, stalls placed in the passage reduce the width of the passage and the distance between combustibles. Due to the characteristics of these traditional markets, the fire spread, as shown in Figure 1b, may occur. As mentioned earlier, the fire probability of passage-type traditional markets can be classified into two types. Horizontal fire spread refers to the fire spread along the combustible materials of a store wall or stalls via direct contact with the flames. Since this type of fire spread is limited to stores along the same line, damage can be reduced through water curtain systems or fire shutters considering the fire spread rate. Implementing these systems may also be effective in preventing the fire spread in facing stores via radiant heat flux. However, from a conservative point of view, it may be effective to ensure a minimum distance (r) in which the radiant heat flux—which is emitted from a fire source and reaching the opposite store is reduced below a critical value. Therefore, in order to ensure safety by preventing the fire spread in traditional markets, it is necessary to assess the fire spread rate and separation distance of major combustibles through experiments.

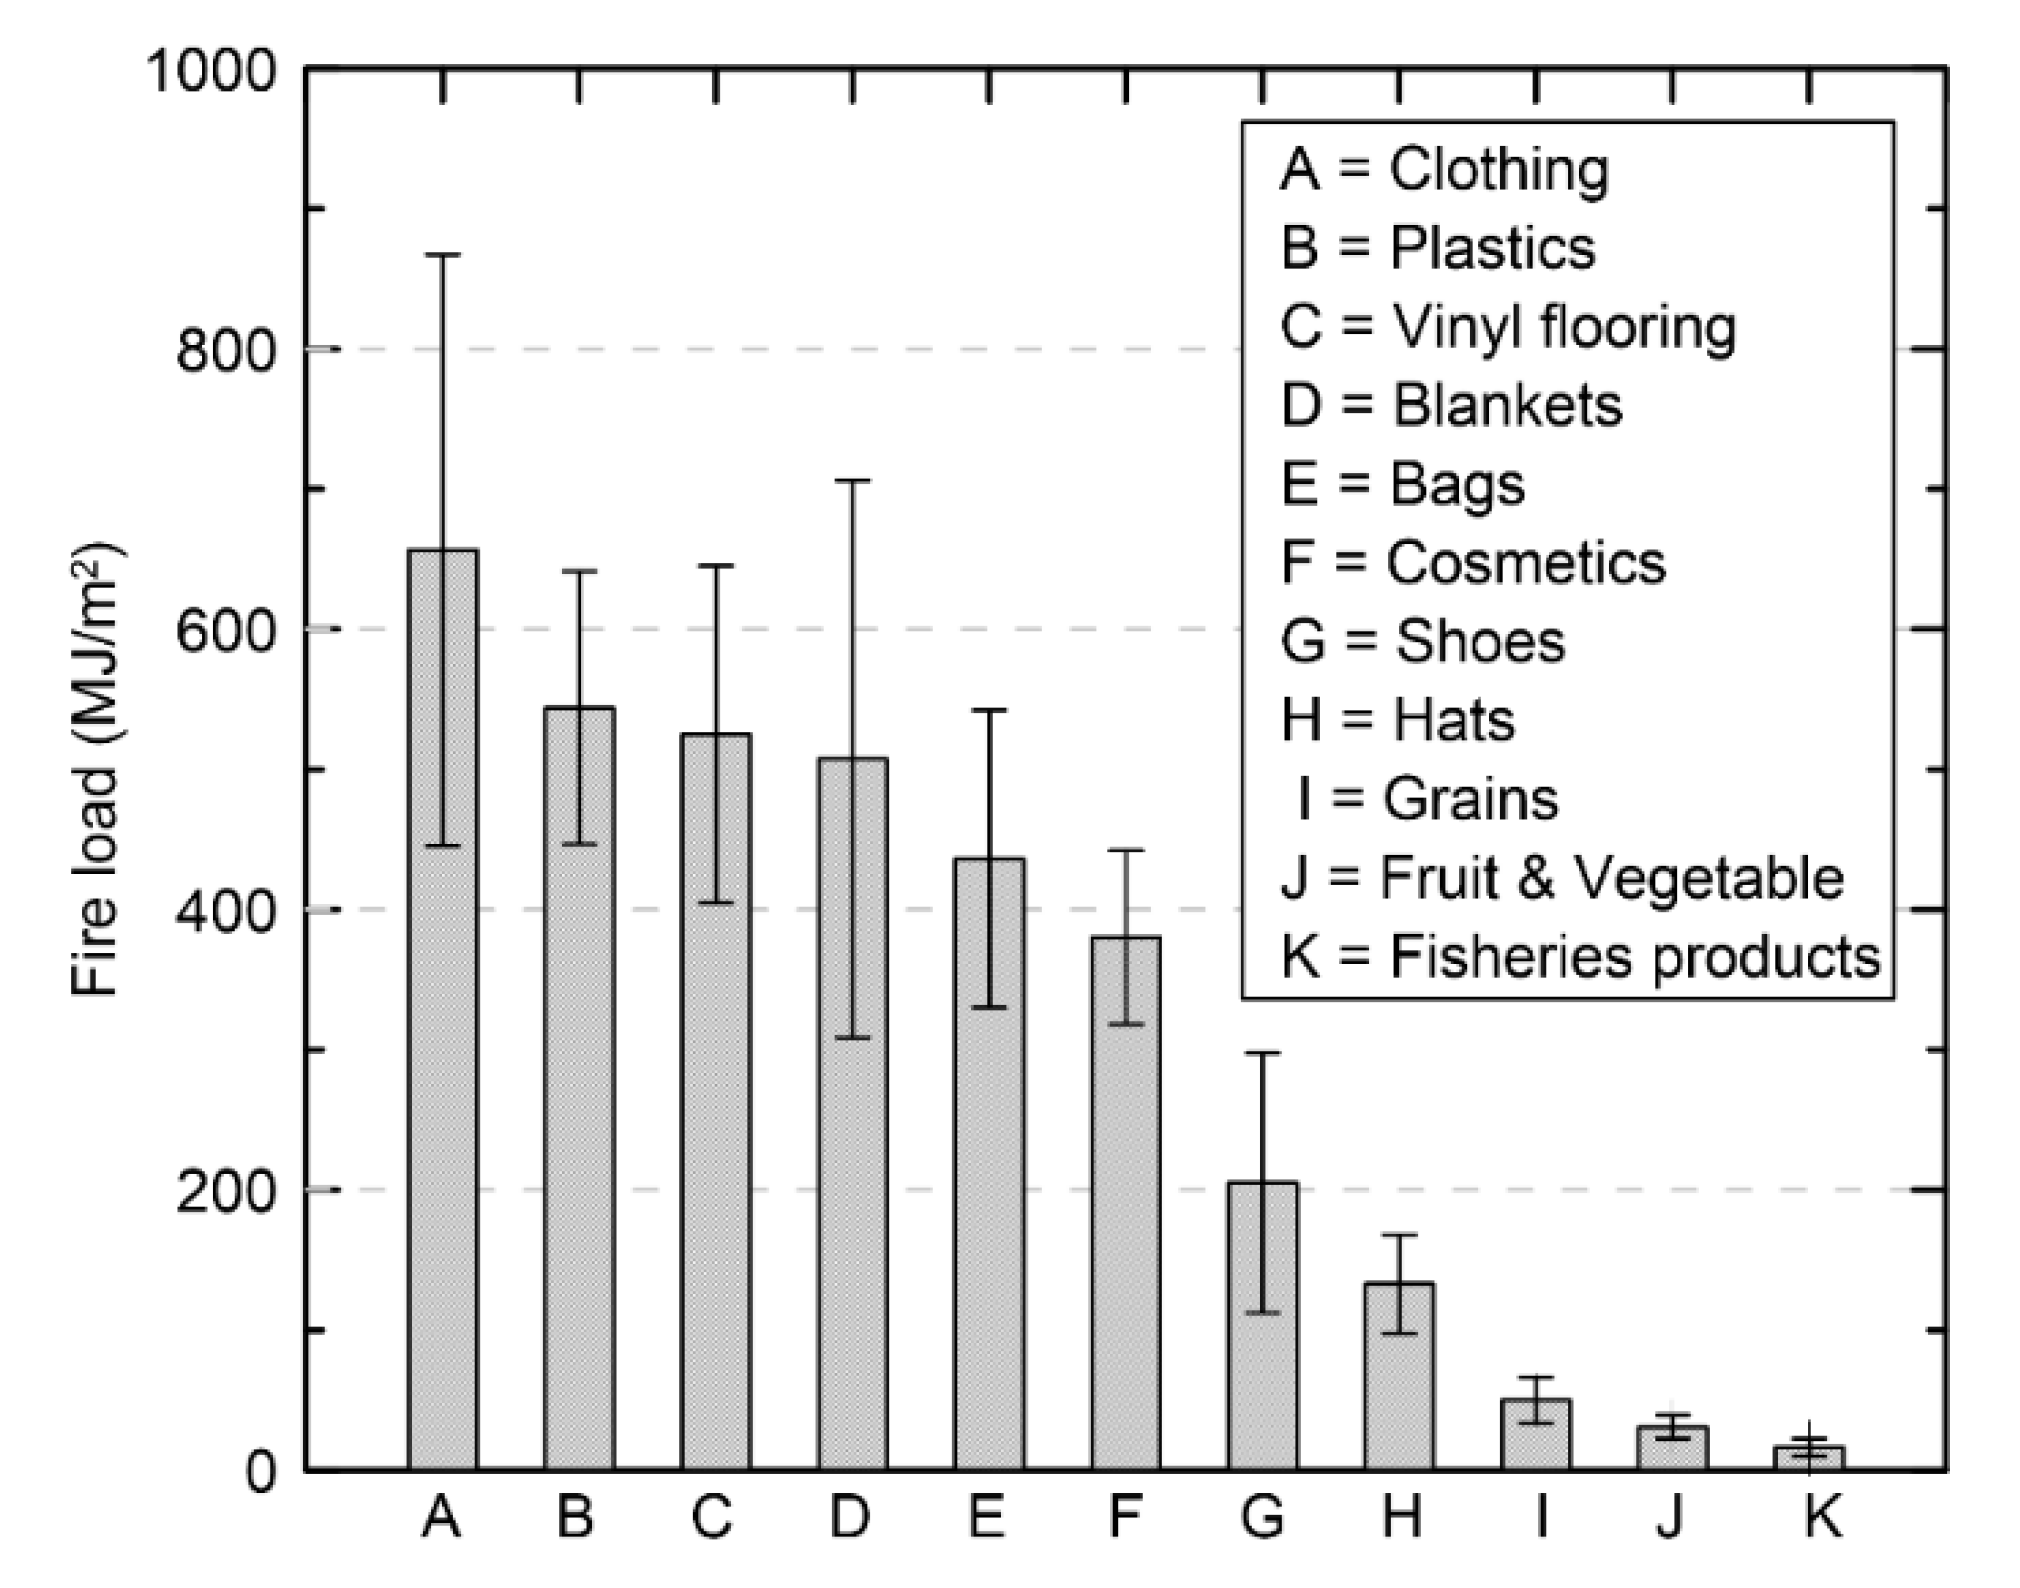
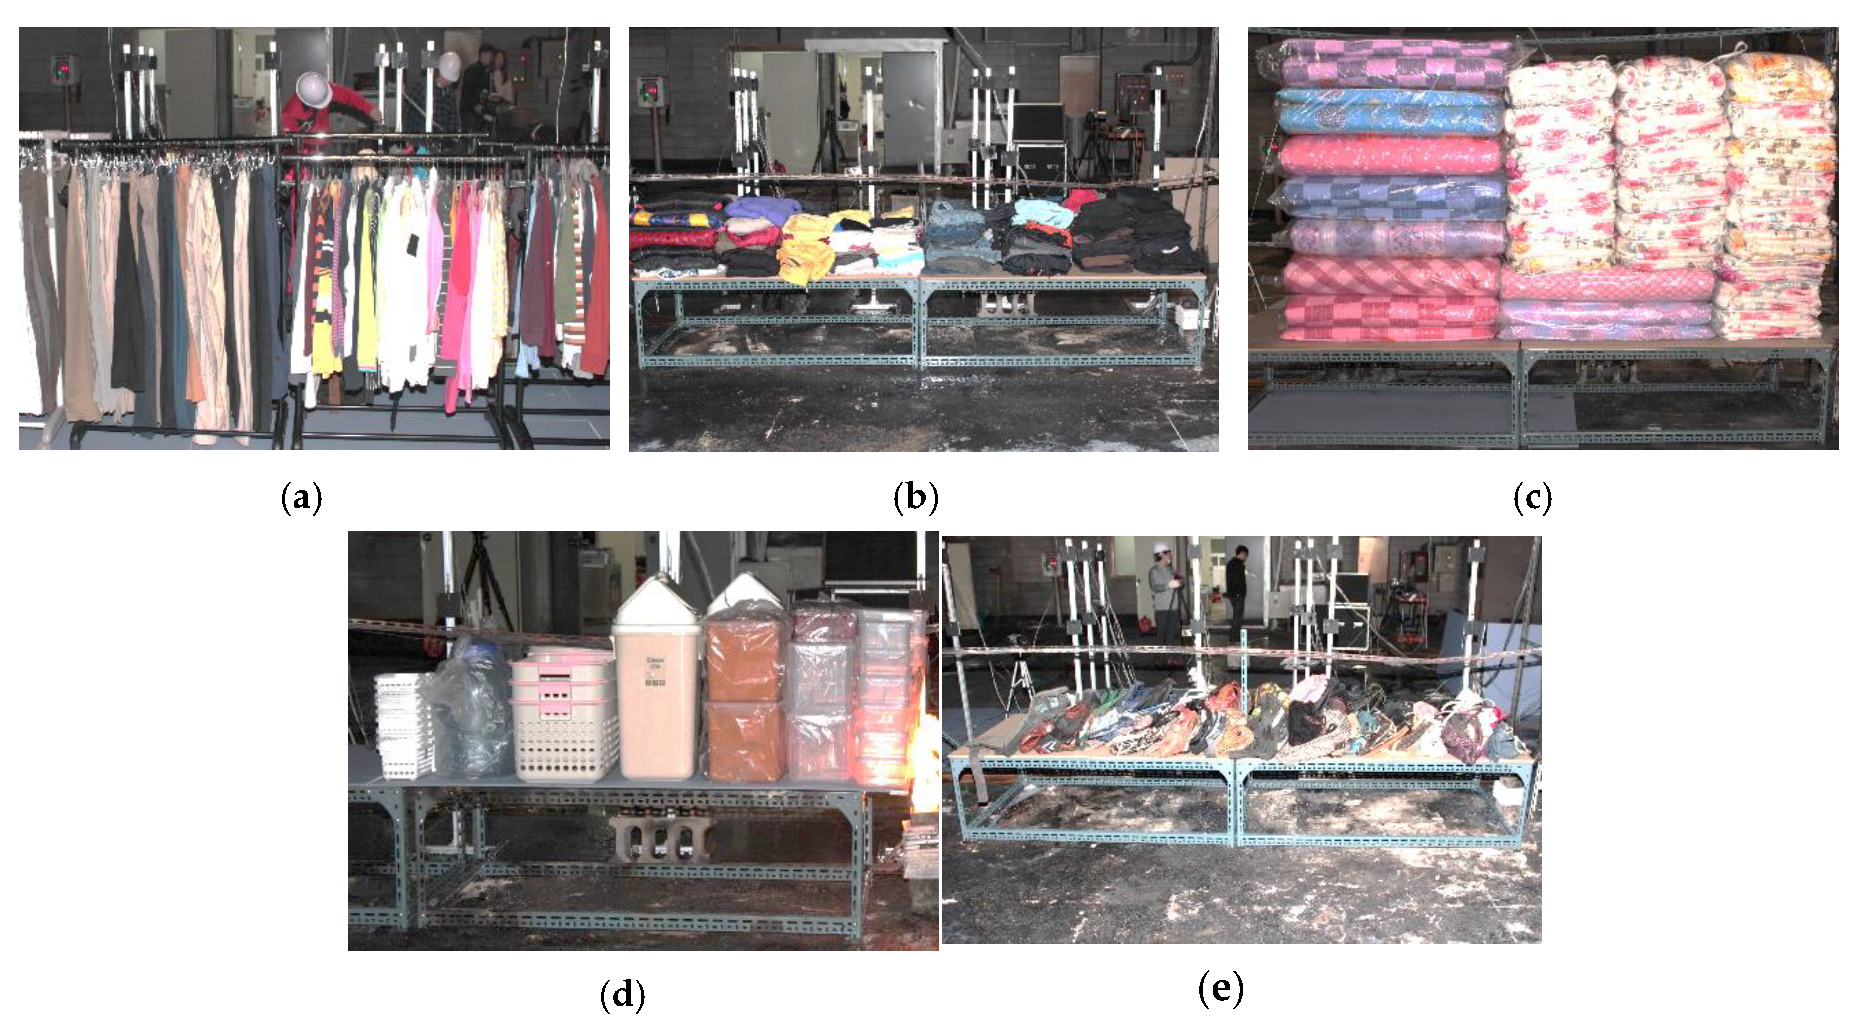
2.2. Field Survey to Select Major Combustibles

Figure 2 presents a comparison of fire loads based on store type for three traditional markets in South Korea. Different store types were classified based on their items and goods. Specifically, 11 types of items are most commonly handled in traditional markets, including clothing, plastics, vinyl flooring, blankets, bags, cosmetics, shoes, hats, and agricultural and fisheries products. In order to derive the fire load (MJ/m2) of each store, the mass of all combustibles (kg) in the store was measured, and the total amount of heat was calculated from the heat of combustion (kJ/kg) obtained through Thermal gravimetric analysis (TGA) [24] and literature review [25]. After that, the fire load was derived by considering the relationship between the store floor area (m2) and the total amount of heat. Finally, in the figure, the average value of fire load for each store type obtained in three traditional markets and the standard deviation for this are presented together. Based on the study’s comparison of fire loads by store type, clothing stores had the highest fire load at approximately 650 MJ/m2. The next highest fire load of approximately 530 MJ/m2 belonged to stores handling plastics and vinyl flooring. This was then followed by blankets, bags, cosmetics, shoes, hats, and agricultural and fisheries products. Taking fire load into account, four major combustibles were selected. Clothing and plastics with high fire loads were selected first, while vinyl flooring with fire loads similar to those of plastics were excluded. Blankets and bags with high fire loads were also selected as major combustibles.

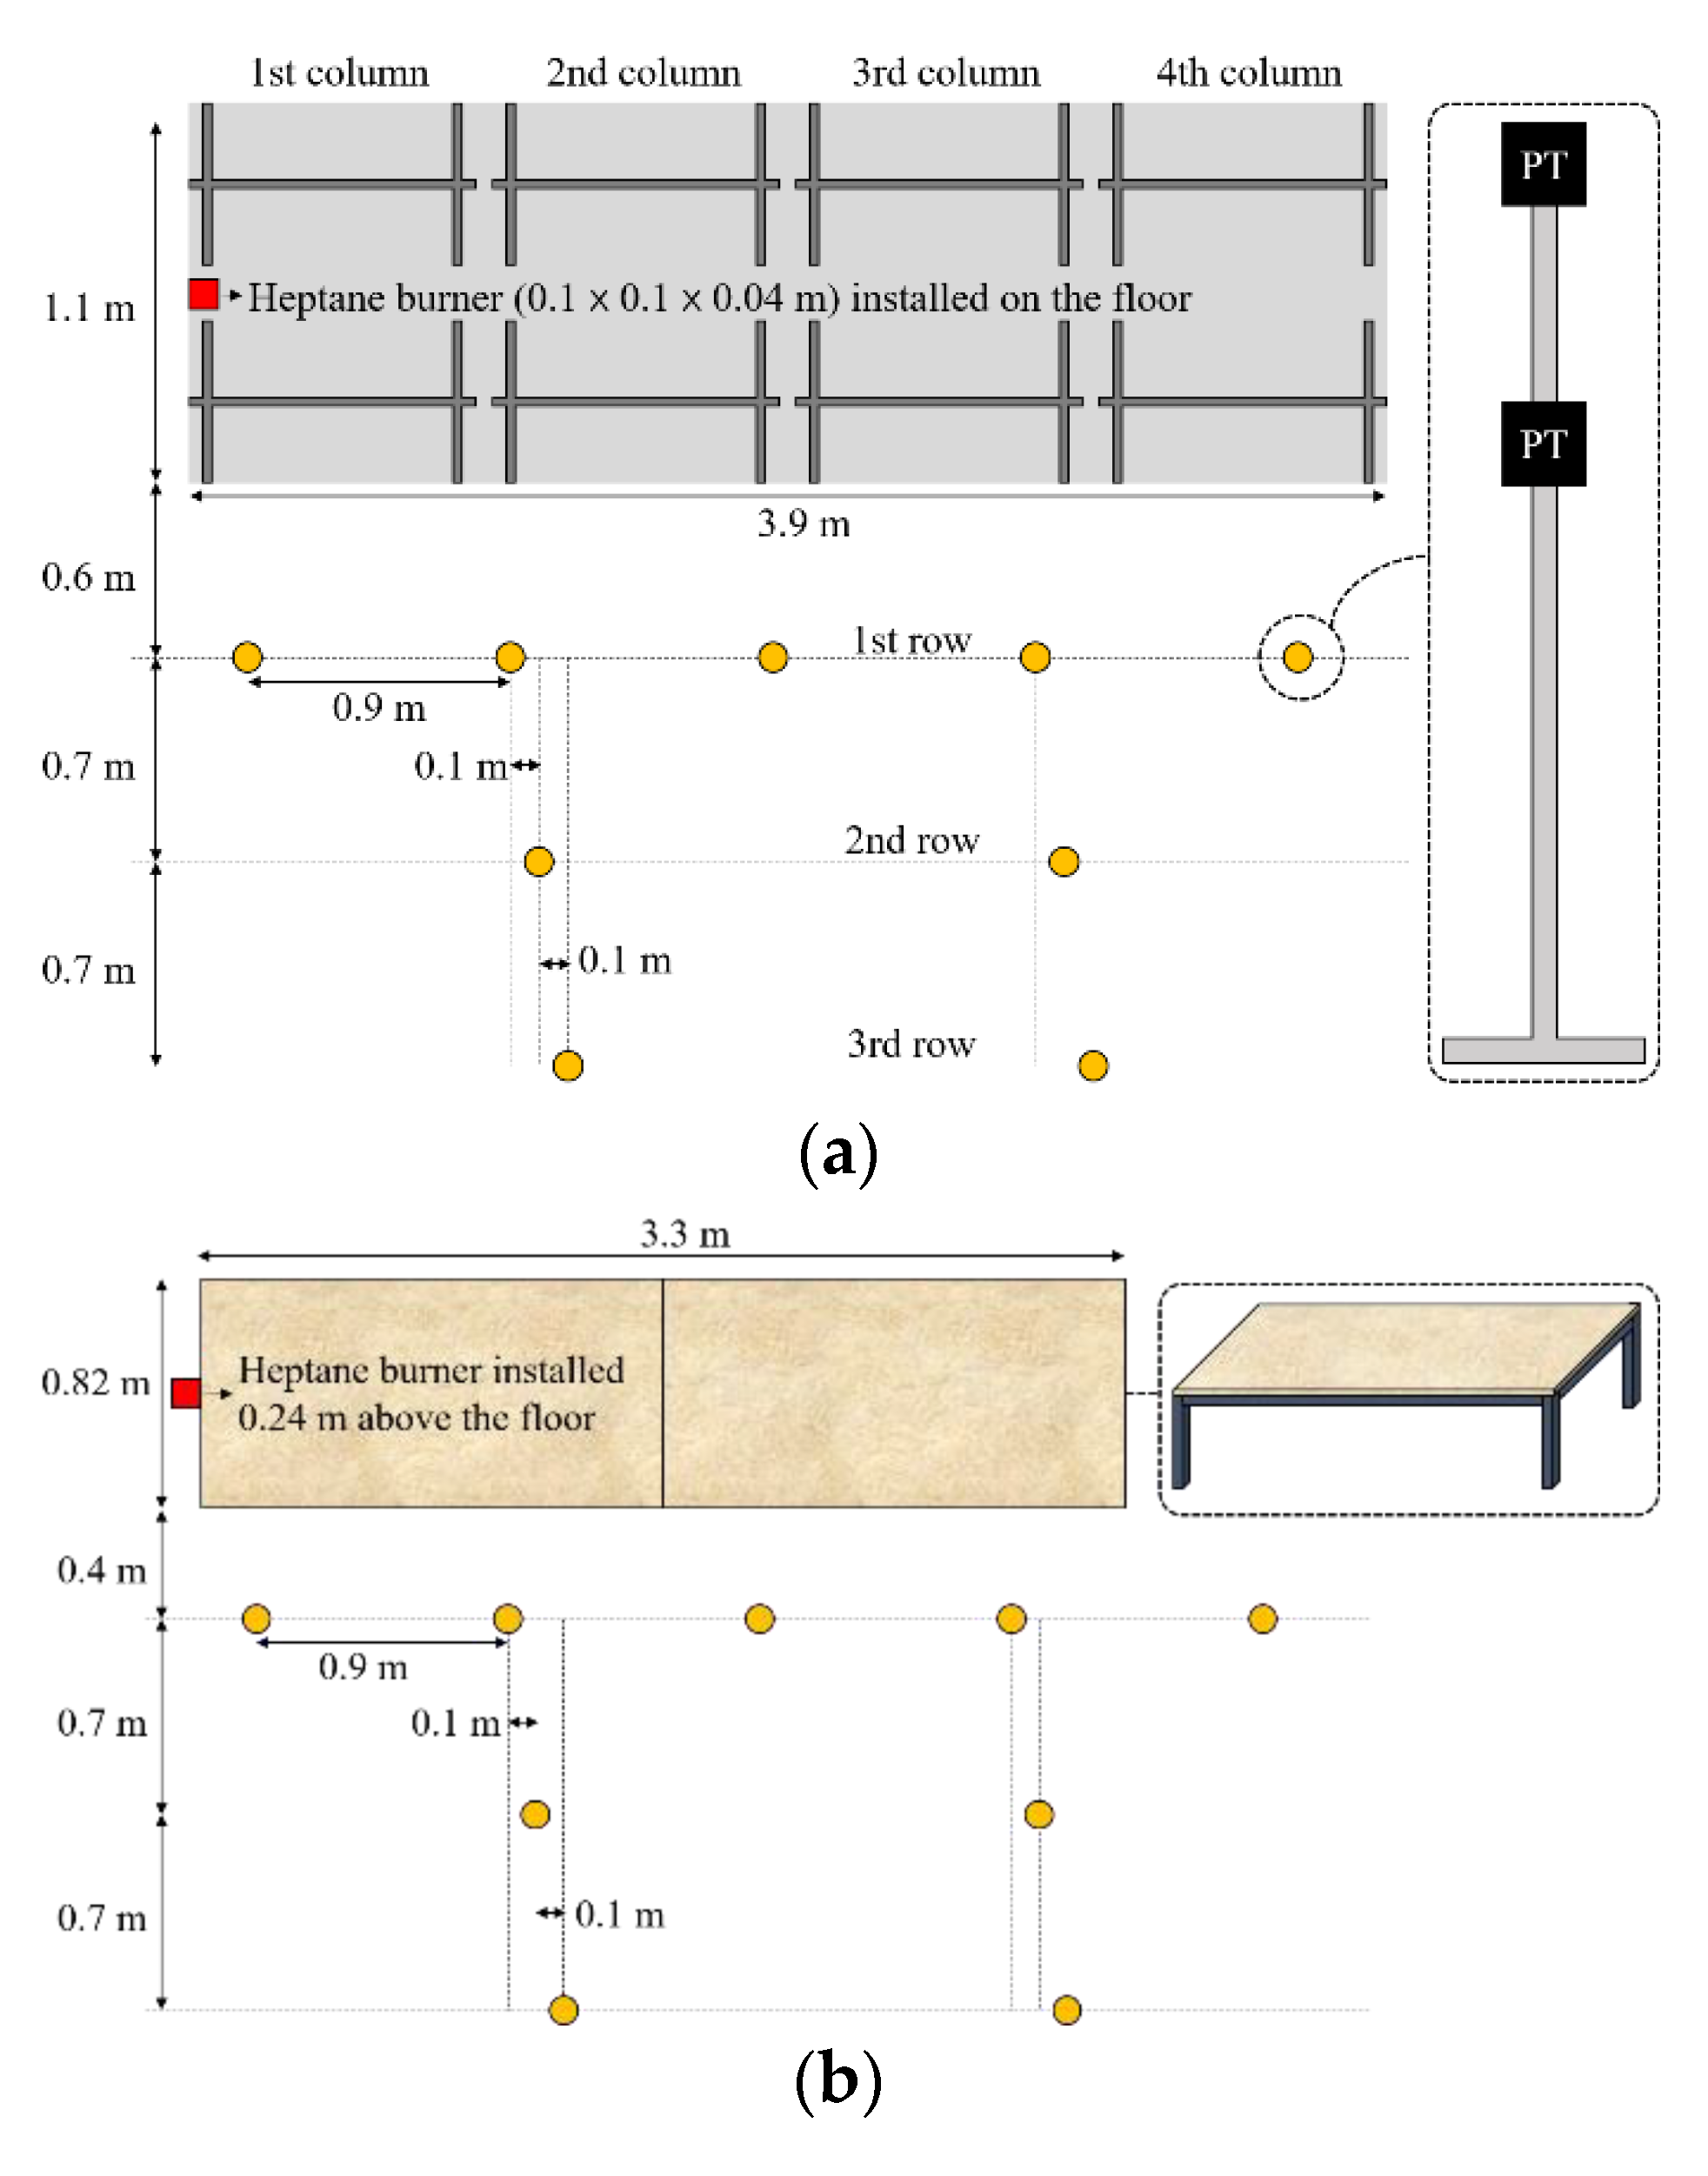
3. Experimental Details

Figure 3a to e indicate the arrangement of the major combustibles on hangers and stalls for real-scale fire testing. Figure 3a,b indicate the arrangement of clothing, with clothing types including bubble jackets, pants, and t-shirts. In actual stores, clothing is typically displayed on hangers or stacked on sales stalls; therefore, two layout methods were employed to reflect this. Figure 3a shows the clothing hanging on eight hangers with a total mass of 79.2 kg. Figure 3b shows clothing uniformly distributed on two stalls with a total mass of 63.6 kg. The hangers and stalls used in this study had the same shapes as those most commonly used in traditional markets. Each stall features a 1.65 m × 0.82 m area and 25 mm thick MDF panel on top of a steel support fixture. Figure 3c displays the layout chosen for blankets, with nine thick blankets and 21 thin blankets laid over two stalls. The total combustible mass for blankets was 68.0 kg. Figure 3d displays the layout of plastics, for which only one stall was used. In detail the types of combustibles include trash cans, covered side dishes cases and laundry baskets. The total mass of combustibles was 22.3 kg. Figure 3e shows a photo of bags, and products of various materials such as synthetic leather, acrylonitrile butadiene styrene (ABS), polyethylene, and polycarbonate were placed on two stalls. The total combustible mass of bags was 30.0 kg. In all experimental conditions, the fire load according to the floor area occupied by the hangers and stalls, the total mass of the combustibles was set to have a value within the deviation of the average value identified through field survey. In experiments with major combustibles, the heat release rate and incident radiant heat flux were measured. To measure the heat release rate, a large-scale calorimeter (LSC) was used, and all experiments were conducted under an exhaust hood with a diameter of 10.0 m. For the measurement of the incident radiant heat flux, a plate-thermometer (PT) was used. The PT was developed by Wickström [26] and registered as an international standard to review the fire resistance performance of building materials inside furnaces in the 1980s [27]. However, recently, the heat transfer equation is inverted as shown in Equation (1) for the temperature measured from the rear center, and PT is used to measure the incident heat flux [28,29,30]. PT can be used as a suitable alternative to heat flux meters that require various additional devices such as purging and water cooling systems to measure heat flux.
[ q ˙ i n c ] i + 1 = σ [ T P T 4 ] i + K c o n d ( [ T P T ] i T ) + h P T ( [ T P T ] i [ T g ] i ) + ρ s t C s t δ [ T P T ] i + 1 [ T P T ] i [ t ] i + 1 [ t ] i ε P T
where q ˙ i n c represents the incident heat flux measured by PT. σ ,   K c o n d ,   h P T stand for Stefan-Boltzmann constant, conduction correction factor (8.6 W/m2·K) [31], convective heat transfer coefficient (10 W/m2·K). T P T ,   T g , T refer to the PT’s surface temperature, surrounding temperature, and ambient temperature. In addition, ρ s t , C s t , δ are the properties of the metal plate related to thermal inertia, and are density (8000 kg/m3), specific heat (477 J/kg·K), and thickness (0.6 mm).
Table 1 presents a summary of the experimental conditions such as total mass and heat of combustion of the combustibles and fire loads. The heat of combustion for each combustibles was extracted from the results of a prior study [24] and from the Fire Protection Handbook [25] published by the National Fire Protection Association (NFPA). Furthermore, in the case of bags, an average value considering the bags’ various materials used as combustibles was applied.
Figure 4a,b show the layout of hangers, stalls and measuring devices for fire experiment of major combustibles. In Figure 4a, eight hangers arranged in four columns occupy a floor area of 3.9 m (x) × 1.1 m (y), and column and row information to describe the location of the hanger and measuring device are also indicated. A burner for ignition was placed between the two hangers on the first column. In order to provide the only minimum ignition energy, the size of the burner and amount of heptane were determined to be 0.1 m (x) × 0.1 m (y) × 0.04 m (z) and 45 mL through several tests. In this case, the heat release rate of the burner is about 8.2 kW and the fire duration time is 180 s. Nine PT stands were arranged in three rows to measure the maximum incident heat flux according to distance from combustibles. When, considering the concept of the view factor, the tilt angle between the fire source and the receive surface will affect the incident heat flux. In the process of fire spread along the combustibles, the tilt angle between the burning location and the PT can cause errors in the measurement of the incident heat flux. In order to minimize the possibility of such errors, five PT stands were placed at 0.9 m intervals in the first row closest to the combustibles. The second and third rows were placed further apart at intervals of 0.7 m each. In general, it can be predicted that the influence of the tilt angle (or view angle) will decrease as the distance from the heat source increases. Therefore, only two stands were placed in second and third rows. The PT stands in the second and third row were moved horizontally by 0.1 m to prevent shielding by the stand located in the front row. Each stand has a PT installed at a height of 1.0 m and 1.5 m from the floor. Figure 4b shows a layout for experiments on combustibles (clothing, blankets, plastics, and bags) placed on a stalls. The floor area occupied by the two stalls is 3.3 m (x) × 0.82 m (y). In the case of plastics, only one stall was used (The fire loads presented in Table 1 were calculated according to the number of stalls used). The shape of the burner and amount of heptane were set the same as described in Figure 4a. Relatively short flame length compared to the height of the stall (0.5 m) was insufficient to ignite combustibles. So the burner was installed at a height of 0.24 m from the floor. Combustibles placed on the stalls were expected to have a smaller fire scale than clothing hanging on hangers having a vertical arrangement. Therefore, PT stands were moved by 0.2 m towards the combustibles. Under these conditions, the heat release rate, fire growth rate, and incident heat flux of each combustibles were measured and compared. In all experiments, the amount of combustibles placed on each hanger or stall was set evenly in terms of mass. In addition, video recording was performed throughout the experiments, and the fire spread rate was analyzed through the video analysis.

4. Results and Discussion

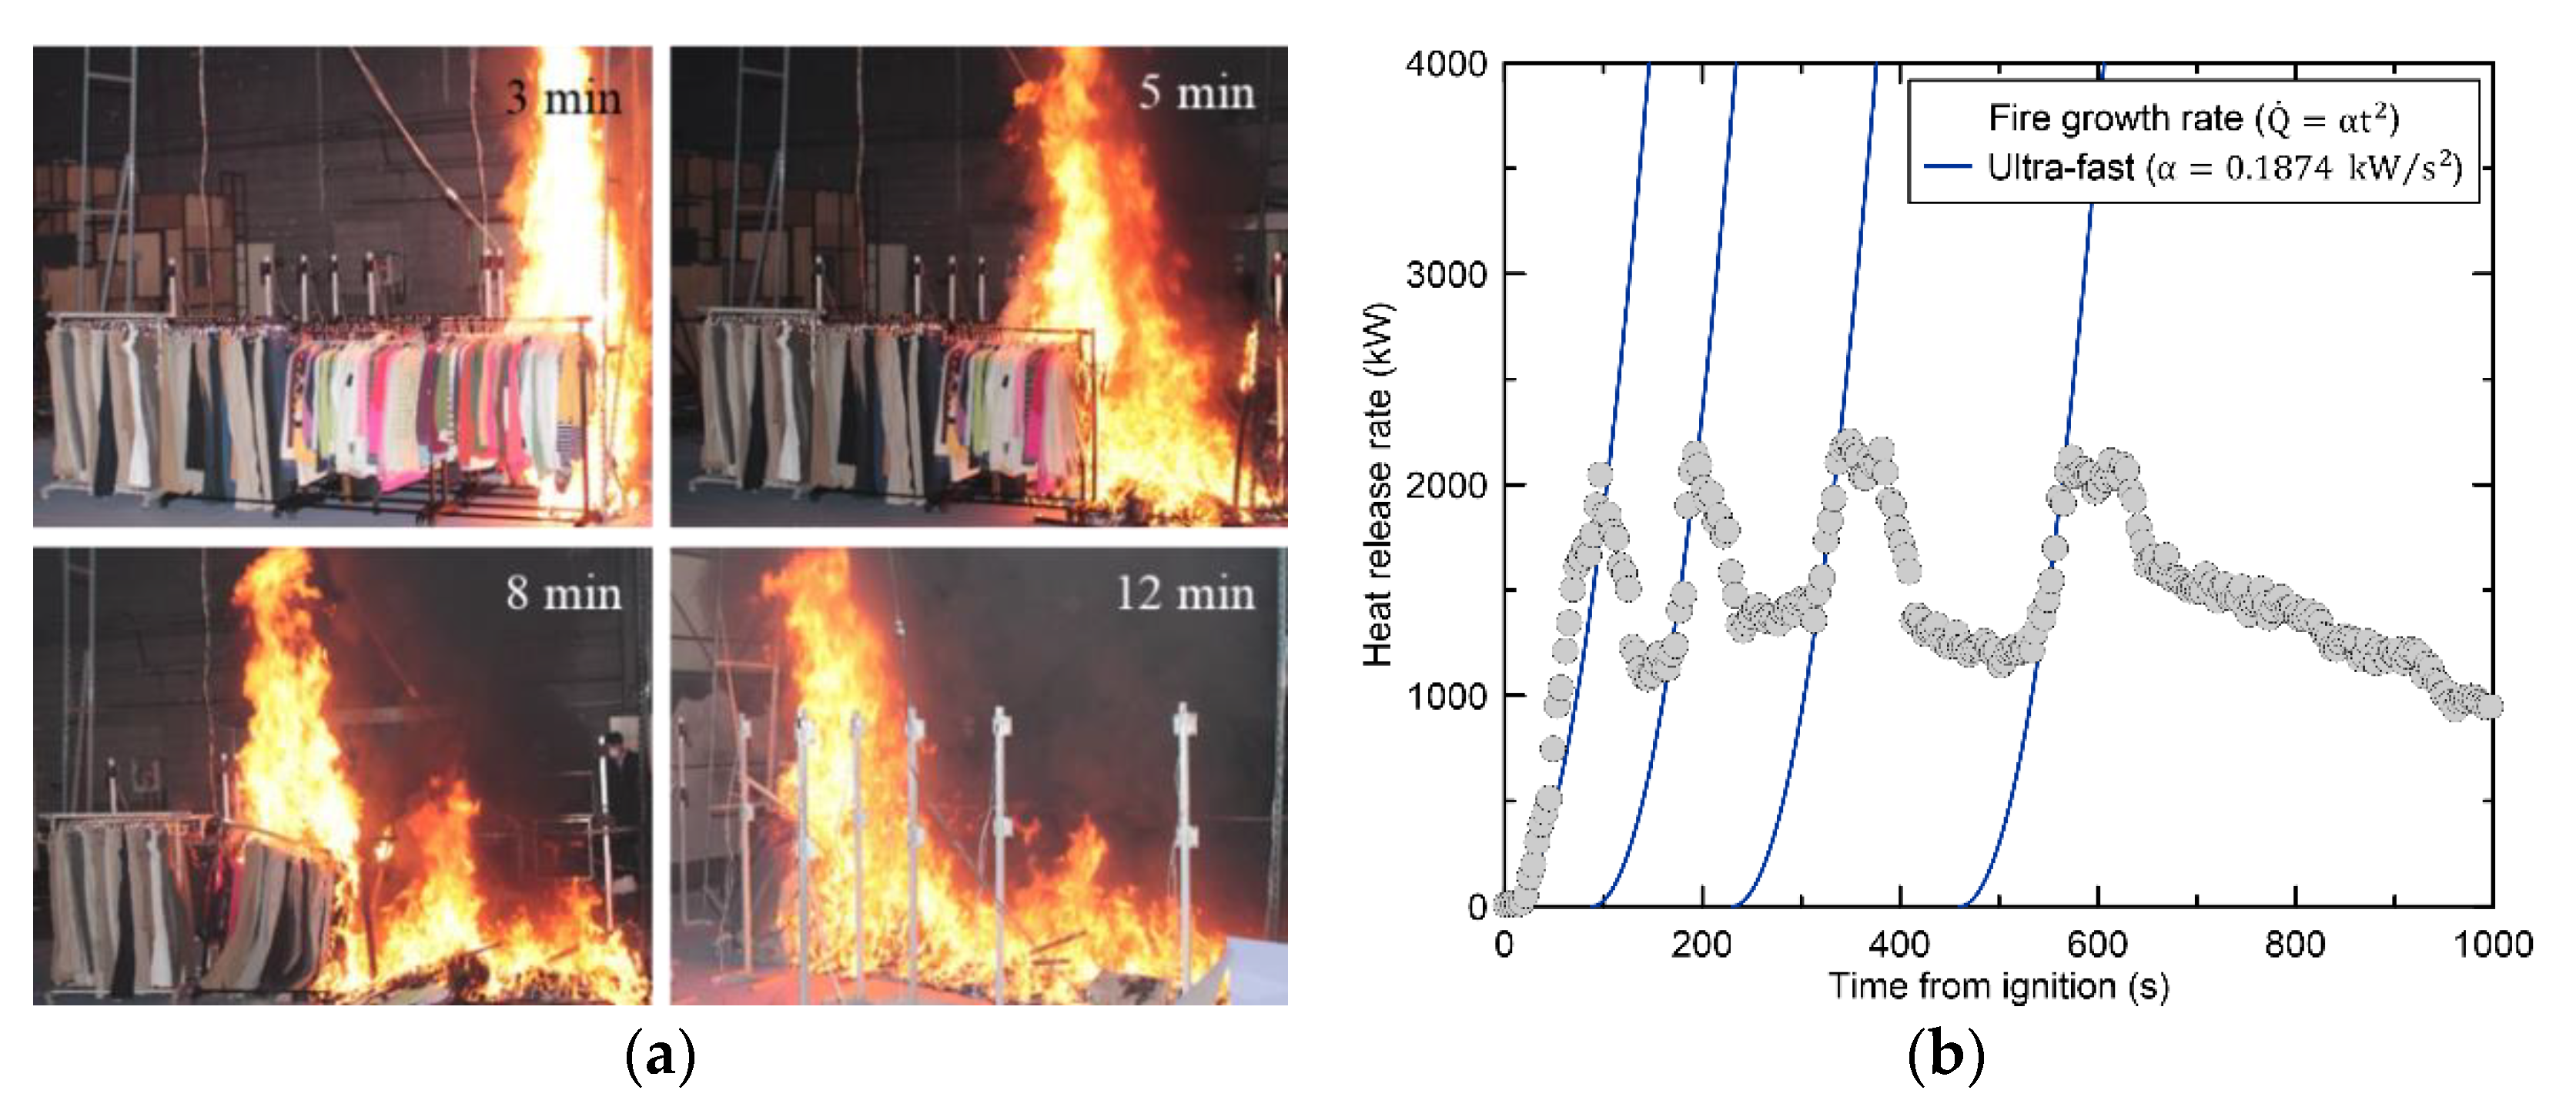
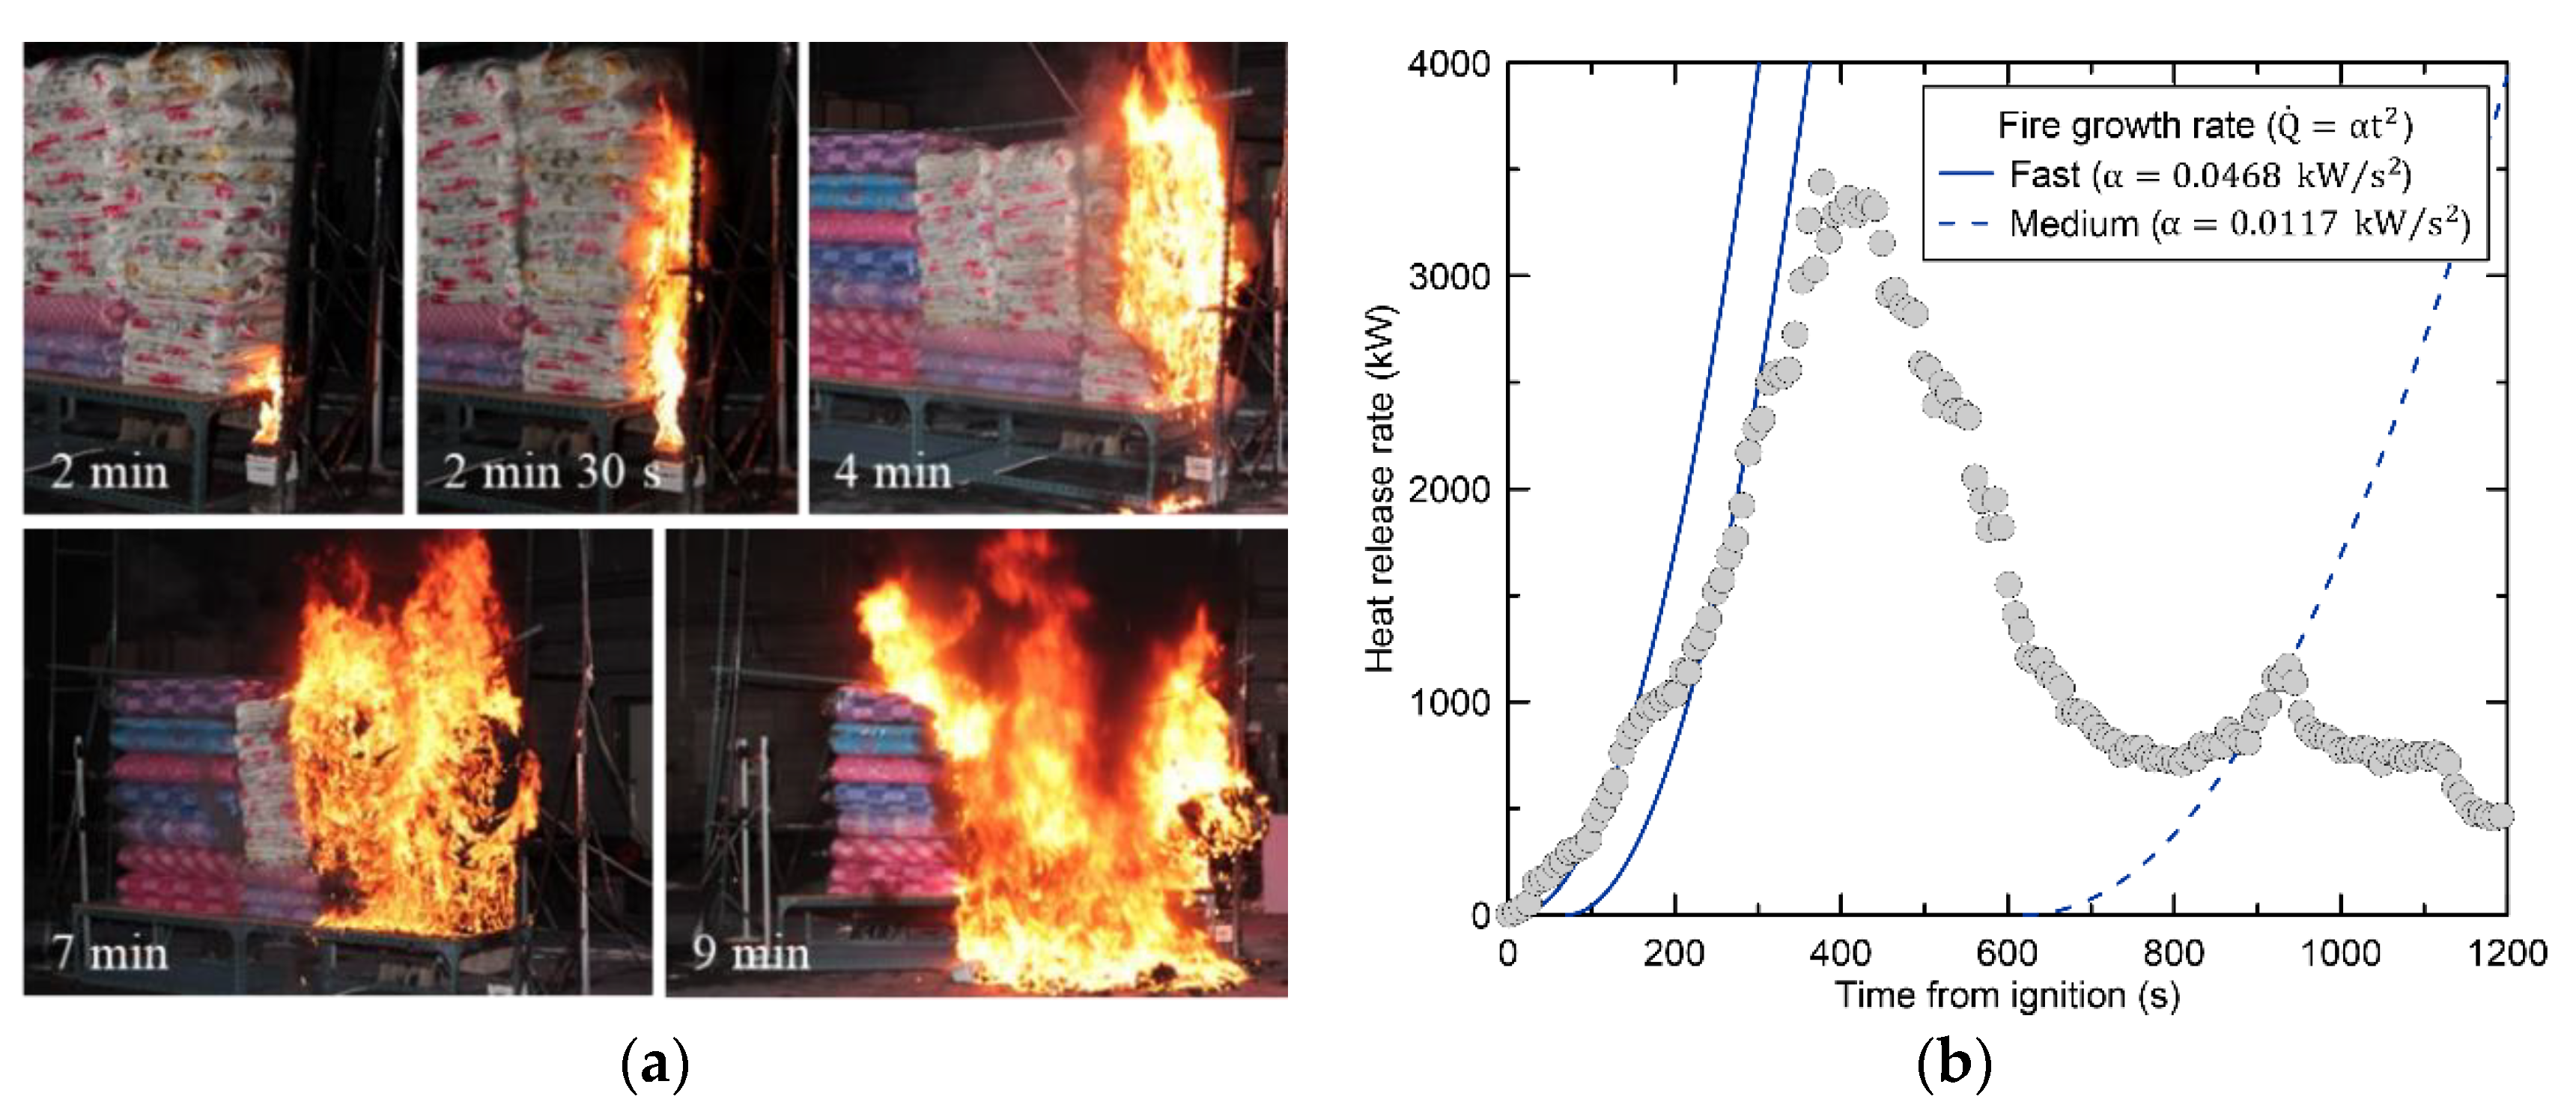
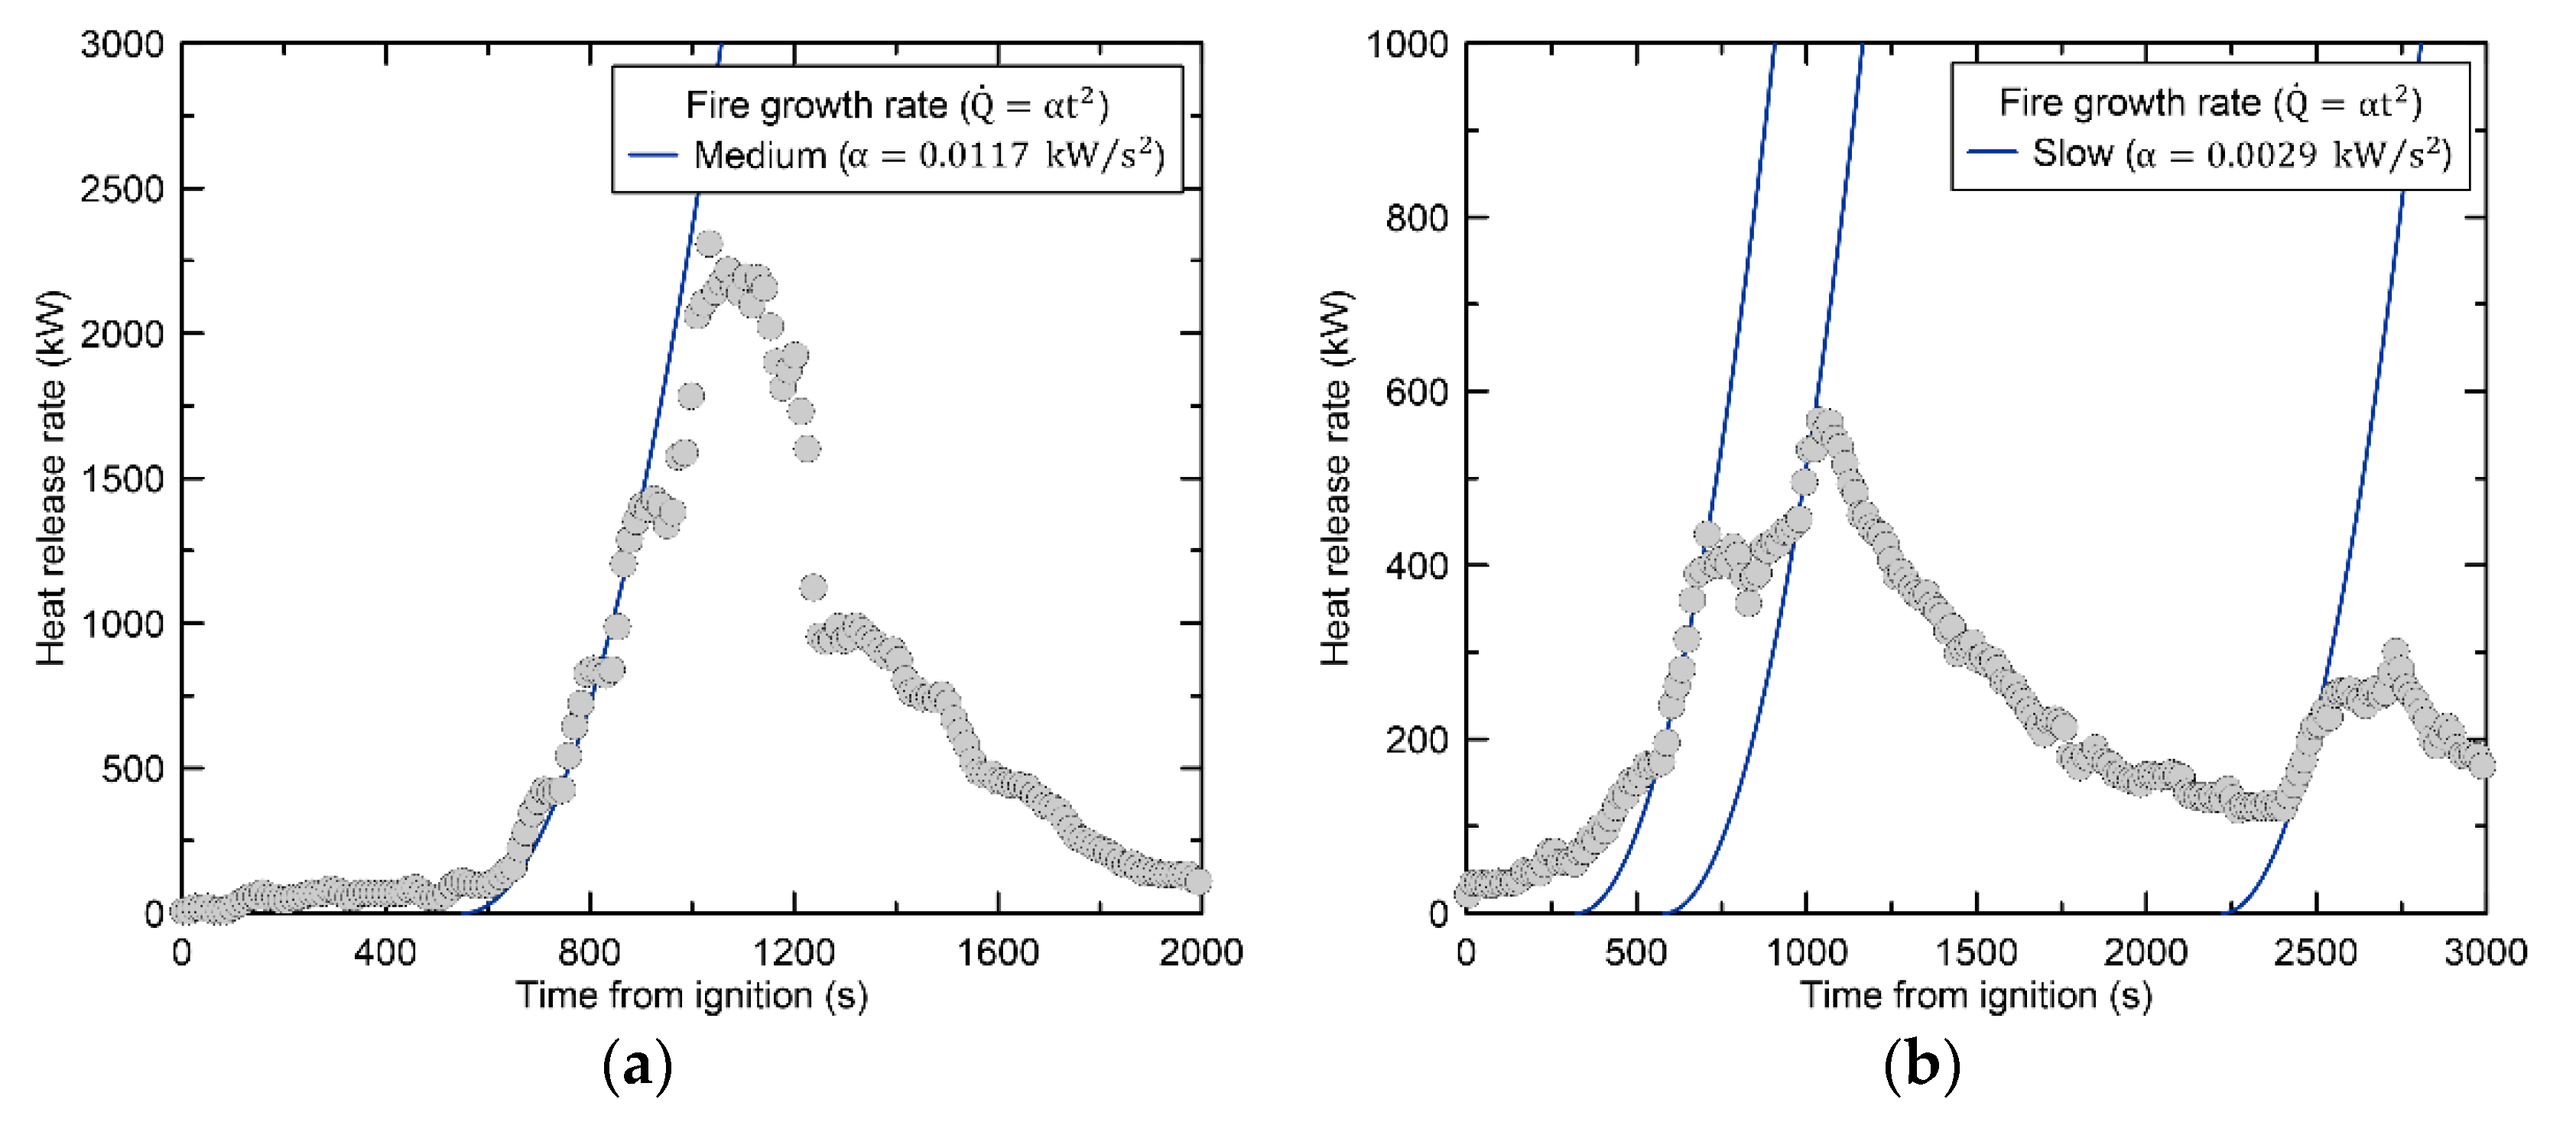
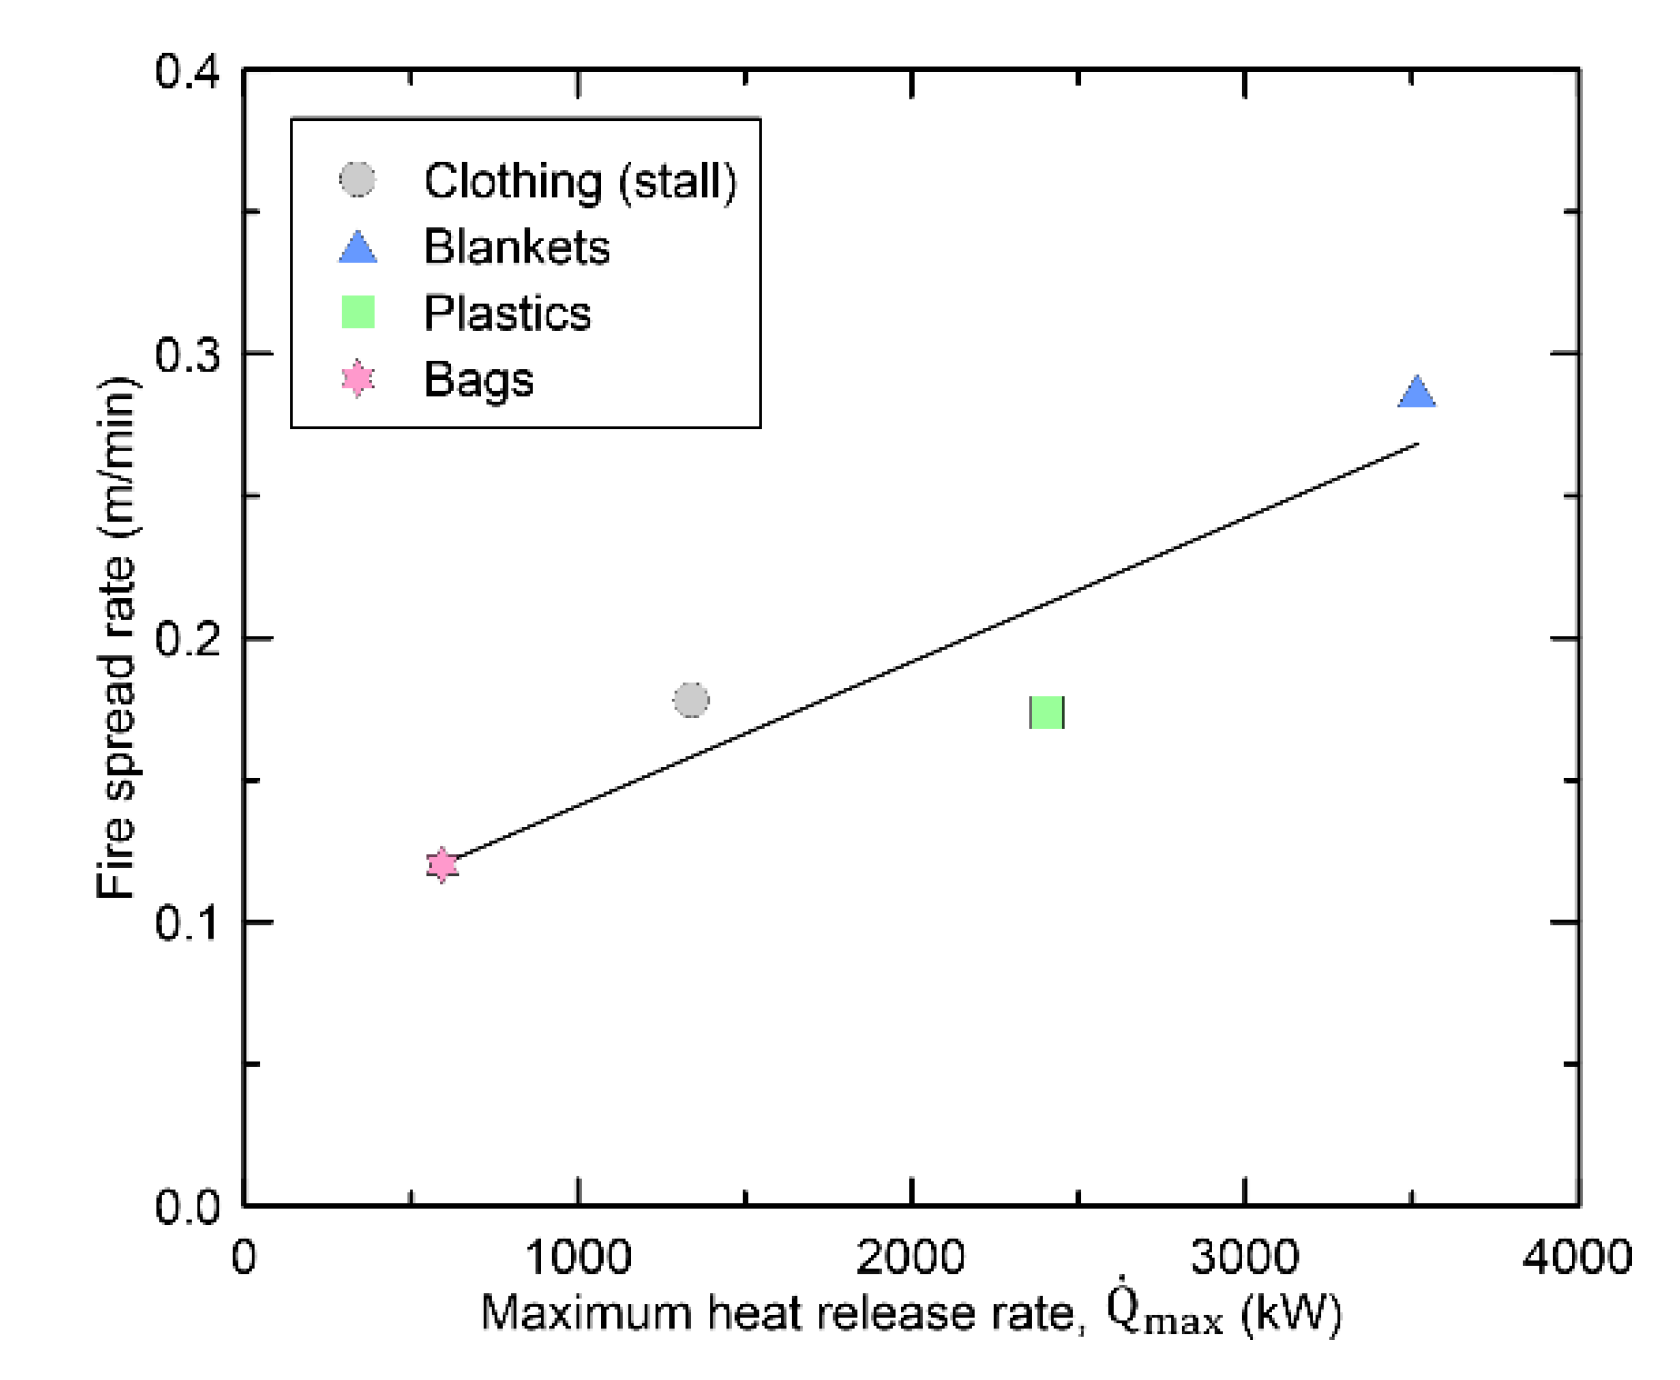
4.1. Relationship between the Maximum Heat Release Rate and Fire Spread Rate

The heat release rate was measured through LSC using the real-scale fire experiments with major combustibles in traditional markets. In all experiments, measurements were taken until all of the combustibles had burned down. However, measurements are only presented for sections where significant variations in heat release rates were identified in order to examine the phenomena of early fire growth and fire peak periods in detail. Figure 5a,b shows photos of the combustion process over time and results of the heat release rate measurements during the experiment with clothing hanging on hangers, respectively. Figure 5a illustrates the fire spread pattern over time from the ignition of burners. At around 3 min, the fire spread was limited to two hangers located in the first column. The fire spread followed a mostly vertical pattern due to the arrangement of the clothing. In the photo taken at 5 min after the hangers of the first column collapsed, it can be seen that the fire spread from the clothing burning on the floor to the combustibles placed on the second column. Similarly, the fire spread to combustibles located in third column was initiated after the hangers in second column collapsed, as shown in the photo about 8 min. The same trend occurred when the fire spread to the fourth column. In the case of clothing hanging on the hangers, the fire spread was mainly affected by the collapse of the hanger, and it was confirmed that the spread of vertical fires occurring in each column influenced the fire growth. Figure 5b shows that throughout the combustion process of clothing, the heat release rate exhibited four peaks with very similar patterns and a maximum heat release rate value of approximately 2300 kW. This can be interpreted as the combustion of each column’s combustibles. The heat release rate indicates the peak value and then a reduction due to the exhaustion of combustibles until the fire spread to the next column’s hanger. However, after the fire spread to the next column, vertical fire spread repeatedly contributed to the fire growth. The fire growth rate of all peak calculated by time-square law [32] is ‘Ultra-fast’ (α = 0.1874 kW/s2). An analysis of the video confirmed that the horizontal fire spread rate was approximately 0.325 m/min.
Figure 6 presents the results of another experiment where the same combustibles as shown in Figure 5 was placed on stalls. Figure 6a illustrates the fire spread over time, which started at three minutes on clothing closest to the burner. The flames then spread horizontally along the combustibles located at the top. At the 10-min mark, the flame spread throughout the first stall. At the 20-min mark, fire spread to all combustibles used in the experiment. At around 32 min, the combustibles fell to the floor due to the combustion of the MDF panel located on the first stall (confirmed by the photos at 35 min). Figure 6b presents the results of the heat release rate measurement over time. The initial fire growth rate was ‘Slow’ (α = 0.0029 kW/s2), which was significantly lower than the rate of clothing hanging on hangers despite the combustibles being the same. The maximum heat release rate occurred at 1100 s (≈20 min) and was approximately 1300 kW. After this peak period, the size of the fire was gradually reduced by the exhaustion of combustibles. A ‘medium’ fire growth rate (α = 0.0117 kW/s2) was measured at 1900 s (≈32 min), which is due to collapse of the MDF panel. The horizontal fire spread rate for clothing placed on a stalls was 0.178 m/min, slower than that of clothing hanging on hangers. The significant difference in fire spread rate for same combustibles is due to difference in fire spread process. In the experiment of clothing placed on stalls, fire spread occurring horizontally along the combustibles is observed. However, for clothing hanging on hangers, fire spread by collapse of hangers is observed. In other words, it is difficult to directly compare the fire spread rate according to the arrangement method of combustibles. However, differences in the maximum heat release rate and fire growth rate can be confirmed. The maximum heat release rate of clothing increases by about 1.8 times depending on the arrangement method, and the fire growth rate also shows a large difference from ‘slow’ to ‘ultra-fast’.
Figure 7 represents the results of an experiment where blankets were placed on stalls. Figure 7a is a sequential photographs of the fire spread pattern over time. As can be seen in the Figure 7a, combustion did not occur until 2 min after the burner was ignited. However, as the blankets’ plastic bags burned, the fire spread rapidly to the top of the combustibles in about 150 s (2 min 30 s). The fire initially exhibited a vertical spread, but it then spread horizontally along the combustible material (between 4 and 7 min). The fire spread to almost all combustibles at around 9 min, and it then spread out completely at around 11 min 30 s. Figure 7b presents the results of the heat release rate measurement. The first fire growth occurred before reaching 200 s from ignition of the burner, which is the result of vertical fire spread from the plastic bags. The fire growth rate via horizontal fire spread is also shown, indicating a ‘Fast’ fire growth rate (α = 0.0468 kW/s2). At the peak period, the maximum heat release rate exhibited a value of approximately 3500 kW. The maximum heat release rate appeared before the fire spread was completed. The fire was extinguished through decay following exhaustion of the combustibles. A temporary ‘medium’ fire growth rate (α = 0.0117 kW/s2) occurred at approximately 900 s, the cause of which was confirmed to be the collapse of the MDF panel. Horizontal fire spread rate of the blankets as identified by the video was 0.287 m/min.
Figure 8 presents the results of the heat release rate measurement obtained from the experiments with plastics and bags. With these combustibles, no particular phenomena were observed during the fire spread; thus, no photographs are presented. Based on the heat release rate of plastic products illustrated by Figure 8a, no fire growth was achieved until 600 s. This is due to the nature of thermoplastic resin, which burns after being melted by heat. The fire growth rate during combustion of molten combustibles showed a value of ‘medium’ (α = 0.0117 kW/s2). The fire, which grew continuously, was extinguished after exhibiting a maximum heat release rate of 2200 kW at its peak period. It took 570 s for the fire to spread to all combustibles from the initial moment of combustion, and the horizontal fire spread rate was 0.174 m/min. The fire growth rate of the bags confirmed through the experiment showed a very low value of ‘Slow’ (α = 0.0029 kW/s2) as shown in Figure 8b. In addition, the maximum heat release rate was about 600 kW, and the bags showed the lowest maximum heat release rate among the combustible materials considered. A period of temporary fire growth occurred at around 2500 s from ignition, caused by the collapse of the MDF panel placed on the stall. The horizontal fire spread rate of the bags placed on the stalls was identified by the video to be 0.120 m/min.
Table 2 presents a summary of the experimental results. The fire growth rate shows a wide distribution from ‘slow’ to ‘ultra-fast’. The fire growth rate of ‘Ultra-fast’ was found in the experiment of clothing hanging on hangers, where the tendency of vertical fire spread within each column was dominant. On the other hand, in the experiment of clothing placed on stalls where the influence of horizontal fire spread is dominant is ‘slow’, showing a significant difference in fire growth rate. In addition, the change in the arrangement method caused a difference of about 1.8 times in the maximum heat release rate. From this, it can be seen that the change in the arrangement method causes a significant change in the fire growth of the same combustibles. Unfortunately, the effect of the arrangement method on the horizontal fire spread rate was not examined in the present study. This is because, as mentioned above, collapse of the hanger affects the horizontal fire spread rate. Therefore, it is difficult to directly compare with experiments in which fire growth is performed by horizontal fire spread along combustibles. However, it is confirmed that the horizontal fire spread rate of other four experiments has a proportional relationship to the maximum heat release rate. Further, the combustibles for the experiments were designed to have similar fire load as in the actual traditional market. When considering this, examining the relationship between the maximum heat release rate and the horizontal fire spread rate can be useful in evaluating the fire spread rate in the traditional market.
Figure 9 illustrates the relationship between the maximum heat release rate and the horizontal fire spread rate obtained through experiments. At this time, it was confirmed that the horizontal fire spread rate was affected by the collapse of the hanger, not the burning rate of the combustibles, so the experimental results of the clothing hanging on hangers were excluded. As a result, it can be seen that the horizontal fire spread rate of each combustibles has a proportional relationship to the maximum heat release rate. This relationship between the maximum heat release rate and the fire spread rate can be expressed through Equation (2):
Horizontal   fire   spread   rate   [ m / min ] = Q ˙ max ( 5.06 × 10 5 ) + 0.09
The straight line by Equation (2) shows appropriate agreement with horizontal fire spread rate of the four experiments. Therefore, it can be seen that the maximum heat release rate can be utilized as a simple means to replace various and complex parameters for predicting the fire spread rate. However, the correlation predicts the fire spreading phenomenon only through the relationship with the heat release rate, and it is only examined under the conditions where horizontal fire spread is dominant, so caution is required in use of the correlation.

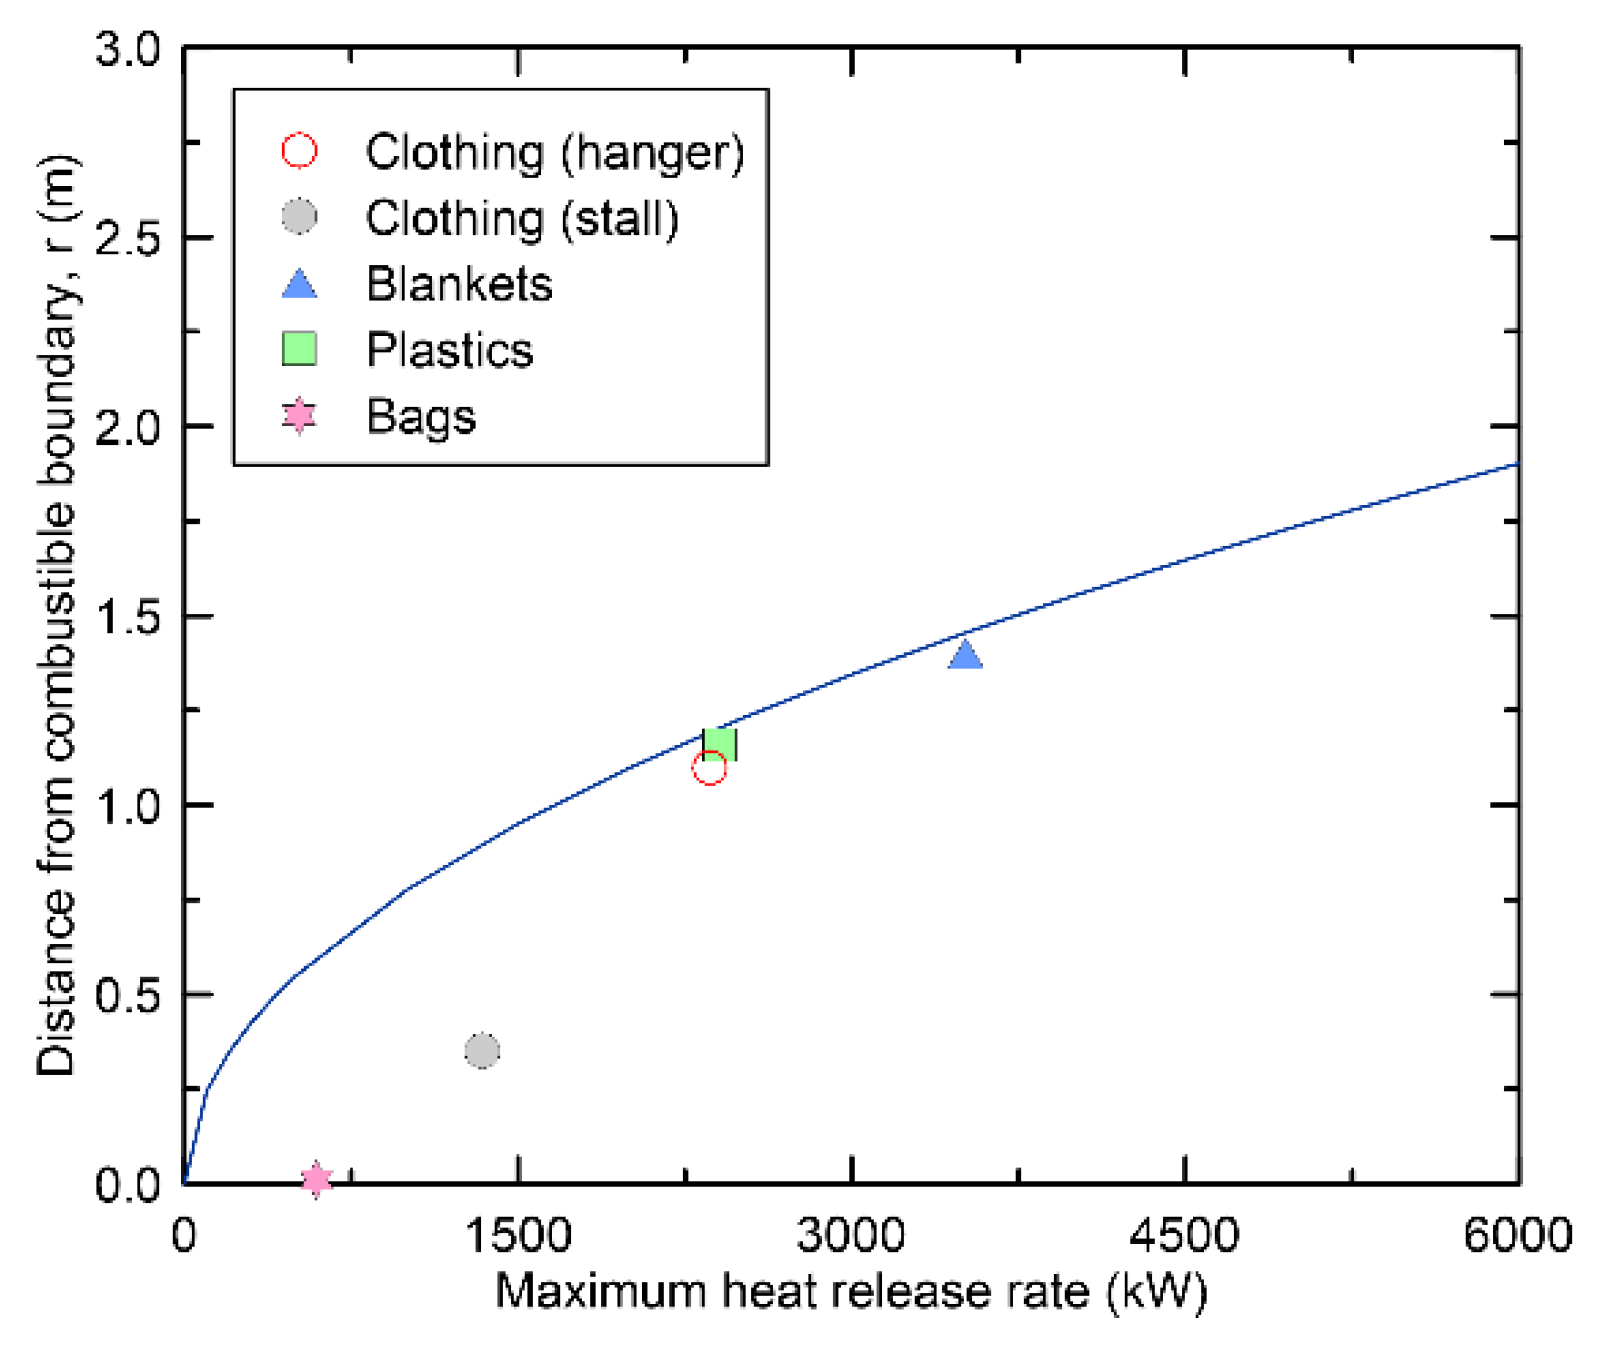
4.2. Separation Distance to Prevent Fire Spread by Radiant Heat Flux

As mentioned earlier, the fire spread via radiant heat flux in passage-type traditional markets lined with stores facing each other can be fatal. In this study, incident radiant heat flux according to the distance from combustibles was measured to derive the separation distance to prevent fire spread by radiant heat flux. Figure 10 present the maximum value of the incident radiant heat flux measured at various distances through PT in the experiments. Figure 10 shows the maximum value of the incident radiant heat flux measured with distance in each experiment. In addition, a curve for predicting the incident radiant heat flux according to the distance is also presented. The second-order function was used for the curve considering the characteristic of radiant heat flux which is inversely proportional to the square of the distance from the heat source. At this time, the cross point of the curve and the dotted line indicating the critical heat flux can be regarded as the minimum distance that must be guaranteed to prevent the fire spread by the radiant heat flux. The critical heat flux was set to 20 kW/m2 [33], which is the occurrence condition of flashover caused by radiant heat flux in a general fire environment. In legend of the figure, results of the separation distance according to each experiment are presented. When a distance greater than the required separation distance obtained in each experiment is secured, the incident heat flux will decrease below the critical value. The required separation distance generally tends to increase with the maximum heat release rate. While other experiments show separation distances greater than 1.0 m, clothing and bags placed on stalls show very small separation distances of 0.35 m and 0.01 m. This very small separation distance is due to the PT measurement error. In this study, PT stands were arranged so as not to generate errors according to the continuous flame area and the inclination angle of the measuring surface. That is, a location where the maximum view factor can be secured for the continuous flame area at a given distance was selected. However, in these two experiments, the continuous flame area was formed at a height lower than the installed height (1.0 m and 1.5 m) of the PT. Measurement error due to tilt angle causes inaccuracy of the second-order function, resulting in very small separation distances. That is, it is determined that the incident radiant heat flux actually emitted from the continuous flame area is not accurately measured. However, in other experiments, sufficient flame length (>2.5 m) was ensured, and as a result, PTs were placed in the continuous flame area.
The separation distances of major combustibles were examined through experiments, but the information obtained through a few experiments is insufficient to be used for safety design in traditional markets. Therefore, it is required to derive a correlation that can easily evaluate the safety separation distance. For this, Modak’s simple method can be used to predict the incident radiant heat flux for the remote target. As is well known, assuming the flame as a cylinder, and considering the view factor, the incident radiant heat flux for the remote target and separation distance can be predicted accurately. However, as confirmed in Figure 1a, there are many difficulties in calculating the separation distance in consideration of the view factor between all combustibles in the traditional market where the store shape is not standardized. Therefore, it may be useful to examine the applicability of the relatively simple Modak’s method. The correlation proposed by Modak is expressed as Equation (3) below:
q ˙ = x Q ˙ m a x 4 π r 2
where q ˙ , x , Q ˙ m a x , r refer to the incident heat flux, radiative fraction, maximum heat release rate and distance to the target surface, respectively. If Equation (3) is rearranged for r and 20 kW/m2 is substituted for q ˙ , the separation distances according to the maximum heat release rate can be derived. In Figure 11, the mean value of x (0.1516), derived by rearranging Equation (3) for x, has been applied. In Figure 11, the curve agrees very well with the experimental results, except for the clothing and bags placed on the stalls with errors in the measurement of heat flux. In conclusion, it can be seen that Modak’s simple method can be used to examine the separation distance for combustibles whose maximum heat release rate and radiative fraction are known. However, when using this method, a suitable measurement location that is not affected by the view factor must be carefully selected to avoid the same error as shown in Figure 10. This is also related to the premise that the target surface should face the heat source in Modak’s simple method.

5. Conclusions

In this study, real-scale fire experiments were conducted using major combustibles that are actually present in traditional markets. The major combustibles selected based on the fire load were designed in a shape similar to that existing in the actual traditional market. Through the experiment, the correlation between the horizontal fire spread rate and separation distance according to the maximum heat release rate was derived.
In experiments on the same combustibles (clothing), the maximum heat release rate and fire growth rate varied greatly depending on the arrangement method of the combustibles. Compared with the horizontal arrangement condition, the maximum heat release rate in the vertical arrangement condition increased about 1.8 times, and the fire growth rate increased significantly from ‘slow’ to ‘ultra-fast’. This change is caused by the difference in the fire spread direction according to the arrangement method of combustibles.
The horizontal fire spread rate via flame contact was confirmed to have a linear proportional relationship to the maximum heat release rate regardless of combustible type, and a correlation was derived to define it. The correlation derived in this study can be used as a simple means to replace various and complex parameters for predicting the spread of fire.
The applicability of the Modak’s simple method to evaluate of the safety separation distance was evaluated through comparison with the experimental results. The curve obtained from the correlation showed a tendency to agree considerably with the experimental results in which the incident heat flux was properly measured. The use of the correlation is expected to be useful in examining the separation distance to prevent the spread of fire to opposite stores by radiant heat flux in the traditional market.

Author Contributions

Conceptualization: H.-S.Y. and C.-H.H.; methodology: H.-S.Y. and C.-H.H.; software: H.-S.Y. and D.-G.N.; validation: H.-S.Y. and C.-H.H.; formal analysis: H.-S.Y. and C.-H.H.; resources: C.-H.H.; data curation: H.-S.Y. and D.-G.N.; writing—original draft preparation: H.-S.Y.; writing—review and editing: C.-H.H.; visualization: H.-S.Y.; supervision: C.-H.H.; project administration: C.-H.H.; funding acquisition: C.-H.H. All authors have read and agreed to the published version of the manuscript.

Funding

This research was funded by [National Fire Agency of Korea] grant number [2015-NFA001-004] And the [Ministry of Public Safety and Security] grant number [NEMA-Next Generation-2014-49].

Conflicts of Interest

The authors declare no conflict of interest.

References

  1. McGrattan, K.; Hostikka, S.; McDermott, R.; Floyd, J.; Vanella, M.; Weinschenk, C.; Overholt, K. FDS User’s Guide, 6th ed.; NIST Special Publication 1019; National Institute of Standard and Technology: Gaithersburg, MD, USA, 2017. [Google Scholar]
  2. Madrzykowski, D. Impact of a Residential Sprinkler on the Heat Release Rate of a Christmas Tree Fire. USA, 2008. NIST Interagency/Internal Report 7506. Available online: https://tsapps.nist.gov/publication/get_pdf.cfm?pub_id=861535 (accessed on 20 January 2017).
  3. Bwalya, A.; Gibbs, E.; Lougheed, G.; Kashef, A. Heat release rate of modern residential furnishings during combustion in a room calorimeter. Fire Mater. 2015, 39, 685–716. [Google Scholar] [CrossRef] [Green Version]
  4. Bennetts, I.D.; Moinuddin, K.A.; Thomas, I.R.; Proe, D.J. Sprinklered office fire tests. Fire Mater. 2008, 32, 159–198. [Google Scholar] [CrossRef]
  5. Zalok, E.; Hadjisophocleous, G.V.; Mehaffey, J.R. Fire loads in commercial premises. Fire Mater. 2009, 33, 63–78. [Google Scholar] [CrossRef]
  6. Hadjisophocleous, G.V.; Zalok, E. Development of Design Fires for Performance-Based Fire Safety Designs. Fire Saf. Sci. 2008, 9, 63–78. [Google Scholar] [CrossRef] [Green Version]
  7. Gross, D. Measurement of Fire Loads and Calculations of Fire Severity. Wood Fiber Sci. 1977, 9, 72–85. [Google Scholar]
  8. National Fire Data System. Available online: http://nfds.go.kr/stat/general.do (accessed on 7 May 2020).
  9. Oh, J.H.; Kim, D.Y. Fire-Resistant Green-Wall System for Traditional Markets. J. Archit. Inst. Korea Struct. Constr. 2017, 33, 27–33. [Google Scholar] [CrossRef]
  10. Park, J.W.; Jeon, G.Y.; Na, W.J.; Hong, W.H. A Study on Features of Fire and Change of Extinguishing Capacity of Sprinkler Equipment against Fire at a Traditional Market. Fire Sci. Eng. 2008, 22, 128–138. Available online: http://kifsejournal.or.kr/upload/pdf/HJSBCY_2008_v22n1_128.pdf (accessed on 11 April 2018).
  11. Lee, S.C.; Kim, B.J.; Lee, J.O.; Park, C.H.; Hwang, C.H. An Experimental Study on the Effects of the Shape of a Drencher Head on the Characteristics of a Water Curtain. Fire Sci. Eng. 2016, 30, 86–93. [Google Scholar] [CrossRef]
  12. Rothermel, R.C.; Anderson, H.E. Fire Spread Characteristics Determined in the Laboratory; United States Forest Serviece: Ogden, UT, USA, 1966.
  13. Zhang, Y.; Huang, X.; Wang, Q.; Ji, J.; Sun, J.; Yin, Y. Experimental study on the characteristics of horizontal flame spread over XPS surface on plateau. J. Hazard. Mater. 2011, 189, 34–39. [Google Scholar] [CrossRef]
  14. Zhao, K.; Zhou, X.; Peng, F.; Ju, X.; Yang, L. Experimental Study on Flame Spread over Inclined PMMA and PE Slabs. Key Eng. Mater. 2018, 775, 390–394. [Google Scholar] [CrossRef]
  15. Chaos, M.; Khan, M.M.; Krishnamoorthy, N.; De Ris, J.L.; DoroFeev, S.B. Evaluation of optimization schemes and determination of solid fuel properties for CFD fire models using bench-scale pyrolysis tests. Proc. Combust. Inst 2011, 33, 2599–2606. [Google Scholar] [CrossRef]
  16. Park, W.H. Optimization of fire-related properties in layered structures. J. Mech. Sci. Technol. 2019, 33, 3031–3840. [Google Scholar] [CrossRef]
  17. Tang, F.; Hu, L.H.; Qui, Z.W.; Zhang, X.C.; Lu, K.H. Window ejected flame height and heat flux along façade with air entrainment constraint by sloping facing wall. Fire Saf. J. 2015, 71, 248–256. [Google Scholar] [CrossRef]
  18. Hu, L.; Hu, K.; Ren, F.; Sun, X. Façade flame height ejected from an opening of fire compartment under external wind. Fire Saf. J. 2017, 92, 151–158. [Google Scholar] [CrossRef]
  19. Maranghides, A.; Johnsson, E.L. Residential Structure Separation Fire Experiment, USA, 2008. NIST Technical Note 1600. Available online: https://www.govinfo.gov/content/pkg/GOVPUB-C13-61ebeb4a9065a1584c3a9b0561bbb525/pdf/GOVPUB-C13-61ebeb4a9065a1584c3a9b0561bbb525.pdf (accessed on 10 May 2020).
  20. Delichatsios, M.A.; Ryan, J.; Tian, N.; Zhang, J. Vertical safe separation distance between openings in multi-storey buildings having a fire resistant spandrel. MATEC Web Conf. 2016, 46, 04003. [Google Scholar] [CrossRef] [Green Version]
  21. Barnett, C.R. Fire Separation between External Walls of Buildings. Fire Saf. Sci. 1989, 2, 841–850. [Google Scholar] [CrossRef]
  22. Cicione, A.; Walls, R.; Sander, Z.; Flores, N.; Narayanan, V.; Stevens, S.; Rush, D. The Effect of Separation Distance between Informal Dwellings on Fire Spread Rates Based on Experimental Data and Analytical Equations. Fire Technol. 2020. [Google Scholar] [CrossRef]
  23. Modak, A.T. Thermal Radiation from Pool Fires. Combust. Flame. 1977, 29, 177–192. [Google Scholar] [CrossRef]
  24. Hwang, C.H. Development of Water Curtain System Based on the Design of Optimized Fire Prevention Block in the Conventional Markets, Korea Fire Institute: Seoul, South Korea, 2016. Available online: https://www.ndsl.kr/ndsl/search/detail/report/reportSearchResultDetail.do?cn=TRKO201600011230 (accessed on 30 June 2016).
  25. Cote, A.E.; Hall, J.R.; Powell, P.; Grant, C.C.; Solomon, R.E. Fire Protection Handbook, 20th ed.; National Fire Protection Association (NFPA): Quincy, MA, USA, 2008; Section 6; pp. 6–274. ISBN 978-087-765-758-3. [Google Scholar]
  26. Wickström, U. The plate thermometer—A simple instrument for reaching harmonized fire resistance tests. Fire Technol. 1994, 30, 195–208. [Google Scholar] [CrossRef]
  27. ISO 834-1:1999. Fire Resistance Tests—Elements of Building Construction—Part 1: General Requirements. 1999. Available online: https://www.iso.org/obp/ui/#iso:std:iso:834:-1:ed-1:v1:en (accessed on 3 March 2016).
  28. Ingason, H.; Wickström, U. Measuring incident radiant heat flux using the plate thermometer. Fire Saf. J. 2007, 42, 161–166. [Google Scholar] [CrossRef]
  29. Häggkvist, A. The Plate Thermometer as a Mean of Calculating Incident Heat Radiation. Master’s Thesis, Luleå University of Technology, Luleå, Sweden, 2009. [Google Scholar]
  30. Ditch, B. Evaluating pool fire severity and the cooling effect of local water spray using a continuous plate thermometer. Fire Saf. Sci. 2011, 109, 133–143. [Google Scholar] [CrossRef]
  31. Han, H.S.; Yun, H.S.; Hwang, C.H. Calibration of the Plate Thermometer for measuring Heat Flux using a Conical Heater. J. Mech. Sci. Technol. 2019, 33, 3563–3569. [Google Scholar] [CrossRef]
  32. NFPA 92B. Standard for Smoke Management Systems in Malls, Atria, and Large Spaces. National Fire Protection Association (NFPA). 2009. Available online: https://www.nfpa.org/codes-and-standards/all-codes-and-standards/list-of-codes-and-standards/detail?code=92B (accessed on 11 August 2015).
  33. Poon, L.S. Predicting Time of Flashover. 1991. Available online: Iafss.org/publications/aofst/3/283/view/aofst_3-283.pdf (accessed on 2 July 2020).
Figure 1. General structure of the passage-type traditional markets and fire spread path: (a) Photo of passage-type traditional market; (b) fire spread path in the traditional markets.
Energies 13 04458 g001
Figure 2. Comparison of fire loads by store type through field survey to select major combustibles in traditional markets.
Energies 13 04458 g002
Figure 3. Photographs of the major combustibles arranged to conduct real-scale fire experiments: (a) Clothing hanging on the hangers; (b) clothing placed on the stalls; (c) blankets placed on the stalls; (d) plastics placed on the stall; (e) bags placed on the stalls.
Energies 13 04458 g003
Figure 4. Layout of plate-thermometer stands for measuring the incident radiant heat flux of major combustibles: (a) Experiment with clothing hanging on hangers; (b) experiment on combustibles placed on the stalls.
Energies 13 04458 g004
Figure 5. Fire spread pattern and heat release rate of clothing hanging on hangers: (a) Sequential photographs of fire spread over time; (b) measured heat release rate.
Energies 13 04458 g005
Figure 6. Fire spread pattern and heat release rate of clothing placed on stalls: (a) Sequential photographs of fire spread over time; (b) measured heat release rate.
Energies 13 04458 g006
Figure 7. Fire spread pattern and heat release rate of blankets placed on stalls: (a) Sequential photographs of fire spread over time; (b) measured heat release rate.
Energies 13 04458 g007
Figure 8. Measured heat release rate and fire growth curve: (a) Plastics; (b) bags.
Energies 13 04458 g008
Figure 9. Relationship between the maximum heat release rate and horizontal fire spread rate.
Energies 13 04458 g009
Figure 10. Minimum separation distance to prevent fire spread by radiant heat flux.
Energies 13 04458 g010
Figure 11. Correlation of separation distance according to maximum heat release rate.
Energies 13 04458 g011
Table 1. Summary of experimental conditions of major combustibles considered in the present study.
CombustiblesTotal Mass (kg)Average Mass Per Unit Area (kg/m2)Heat of Combustion (MJ/kg)Fire Load (MJ/m2)
ExperimentField Survey
Clothing (hanger)79.1918.4523.30430.09656.39 ± 211.0
Clothing (stall)63.5623.49547.28
Blankets68.0025.1317.41437.50507.48 ± 198.9
Plastics22.2916.4734.33565.57543.90 ± 97.5
Bags30.0111.0930.73340.80436.16 ± 106.0
Table 2. Summary of experimental results for the major combustibles in traditional markets.
Combustibles Fire   Growth   Rate   ( Q ˙ = α t 2 ) Maximum Heat Release Rate
(kW)
Horizontal Fire Spread Rate (m/min)
Clothing (hanger)Ultra-fast ( α = 0.1874   kW / s 2 ) 23600.325
Clothing (stall)Slow ( α = 0.0029   kW / s 2 ) 13400.178
BlanketsFast ( α = 0.0468   kW / s 2 ) 35140.287
PlasticsMedium ( α = 0.0117   kW / s 2 ) 24050.174
BagsSlow ( α = 0.0029   kW / s 2 ) 5920.120

