Abstract
The behavior of solid mixing dynamic is of profound significance to the heat transfer and reaction efficiencies in energy engineering. In the current study, the solid mixing characteristics of binary particles in the bubbling fluidized bed are further revealed at particle-scale. Specifically, the influences of gas superficial velocity, Sauter mean diameter (SMD) in the system and the range distribution of particle sizes on the performance of mixing index are quantitatively explored using a computational fluid dynamics-discrete element method (CFD-DEM) coupling model. The competition between solid segregation and the mixing of binary particles is deeply analyzed. There is a critical superficial velocity that maximizes the mixing index of the binary mixture in the bubbling fluidized bed. Solid mixing performs more aggressive when below the critical velocity, otherwise solid segregation overtakes mixing when above this critical velocity. Moreover, superficial velocity is a major factor affecting the mixing efficiency in the binary bubbling fluidized bed. Additionally, the mixing behavior is enhanced with the decrease of SMD while it is deteriorated in the binary system with a wide range of particle size distribution. Therefore, it is highly recommended to perform a binary particle system with smaller SMD and closer particle size distribution for the purpose of enhancing the mixing behavior. The significant understanding of mixing characteristics is expected to provide valuable references for the design, operation, and scale-up of binary bubbling fluidized bed.
1. Introduction
Due to the advantages of operational ease and excellent gas-solid contact efficiency, the bubbling fluidized bed (BFB) has been widely adopted in the chemical engineering processes [1,2,3,4]. In practice, the BFB is commonly operated with a wide particle distribution [5,6,7], which may enhance or deteriorate heat and mass transfer inside the fluidizing apparatus [8,9,10]. However, most of the previous studies were mainly focused on the mono-disperse systems [11,12,13,14]. To unveil the relationship between the particle size distribution and physical-thermal properties of gas-solid flows, it is in urgent need to investigate the transport mechanism of binary or poly-disperse systems in fluidizing apparatuses. Nonetheless, such intrinsically chaotic and strong non-linear systems within complex multiphase flows pose great challenges for experimental measurements and semi-empirical correlations.
As the computer capacity and numerical algorithm advance, computational fluid dynamics (CFD) has become increasingly popular in the exploration of gas-solid hydrodynamic mechanisms. According to the different treatments of particles, the existing numerical methods can be generally categorized into two kinds: two-fluid model (TFM) and computational fluid dynamics-discrete element method (CFD-DEM). The solid and fluid phases in the TFM are both treated as continua while the particles in the CFD-DEM are tracked individually. Comparing with the TFM, the CFD-DEM has an intrinsic ability to accurately capturing inter-particle collisions and providing detailed solid information at particle-scale [15,16,17].
Two processes commonly appear in a binary system which includes two groups of solid particles with distinct sizes, i.e., mixing and segregation [18,19,20]. Specifically, the segregation process is preferred in metallurgical industries [21] while the high-efficiency mixing process is required in engineering fields with the aim to achieve uniform heat and mass transfer [22]. As pointed out by experimental measurements, the segregation process is dominant under low gas velocities while the mixing process is dominant under high gas velocities [23]. Lu et al. [24] experimentally and numerically investigated the minimum fluidization velocity by analyzing the pressure drop distribution in a binary mixture fluidized bed and found the mass fraction of small particles in the binary mixture plays an important role in size segregation. Zhang et al. [25] experimentally studied the mixing behavior in a binary BFB with cylindrical-shape biomass and spherical sand and observed a maximum mixing state with the increase of inlet gas velocity. Zhong et al. [26] evaluated the effect of wall boundary conditions on the performance of mixing and segregation processes in a binary BFB by the TFM approach and pointed out that the restitution coefficient exerted an insignificant effect on simulating the mixing and segregation processes. Cooper et al. [27] investigated the bed expansion and bubble behaviors in a binary fluidized bed using the TFM approach and indicated that the binary mixture mixed well in axial direction under different operating conditions. Zhou et al. [28] extended the energy minimization multi-scale (EMMS) drag model to the investigation of binary fluidized bed and found that the drag model has a significant influence on the mixing behavior of binary particles.
The behaviors of binary mixture mixing have been extensively investigated by the TFM approach, where the detailed particle-scale information is unavailable. Nevertheless, a large deviation between the TFM and CFD-DEM was presented in the simulation by Fan et al. [29]. It was found that the TFM failed to reproduce the horizontal segregation across the bed. Annaland et al. [30] found that the TFM method underestimated the segregation rates in the simulation of a binary mixture system. Additionally, they pointed out that the underestimation of the segregation rate can be improved by the discrete particle simulation. Unlike the TFM approach, the particle collisions are calculated directly with different contact models and no additional closure models are required in the CFD-DEM. Therefore, the CFD-DEM approach is adopted in the current simulation. The mixing behavior of binary particles in the fluidizing apparatus has been seldom revealed at particle-scale in the literature. Using the CFD-DEM approach, Zhang et al. [31] evaluated the segregation behavior in a binary BFB with different drag models suitable for poly-disperse systems and found that the mixing process of binary particles at high superficial velocity can be well described by various drag models. Limtrakul et al. [32] found that the density and diameter of particles will significantly affect the mixing process in the binary fluidized bed. Besides, a better mixing performance was achieved in the binary system with fewer differences in particle density and diameter. Nevertheless, the influence factors of the mixing behavior, which have guiding significances for the practical industrial operations, have not been further elucidated. Moreover, the in-depth quantitative analysis of the mixing characteristic at particle-scale is still needed.
Accordingly, the current paper focuses on the mixing behavior of binary particles in a BFB at the particle-scale level. The poly-disperse drag model is used to accurately predict the dynamics (i.e., flow pattern, pressure drop, and velocity) of binary particles. The effect of gas superficial velocity on the mixing performance is comprehensively assessed. The competition mechanism between segregation and mixing under the influence of superficial velocity is revealed. Moreover, the influences of Sauter mean diameter (SMD) on the binary system and the range distribution of particle sizes are further explored.
2. Methodology
2.1. Governing Equations for the Fluid Phase
In the present simulation, the fluid motion is calculated under a computational cell scale by the Navier–Stokes equations. The mass and momentum equations considering the presence of particles are formulated as:
where ρf, uf,and pf denote the density, velocity, and pressure of the fluid phase, respectively. Ffp represents the inter-phase momentum exchange term, which can be estimated by the drag force exerted on the particles in the current computational cell:
where Vcell and np are the cell volume and particle number in the current computational cell, respectively. fd represents the drag force of particle p.
The stress tensor of fluid phase in the momentum equation can be written as:
The fluid volume fraction in the conservation equations is calculated as:
2.2. Governing Equations for the Particle Phase
In contrast to the fluid phase, each particle in the CFD-DEM is tracked individually in the Lagrangian framework. Considering the effect of gravity, drag force, collision force, and pressure gradient force, the particle motion descript by the Newton’s law is given as:
where fd, fp, and fc represent the drag force, pressure gradient force, and contact force, respectively. Ip, ωp, and Tp are the particle inertia momentum, angular velocity, and torque, respectively.
The soft-sphere contact force [33], which is proved to be appropriate in the simulation of dense fluid-particle flows in our previous researches [34,35,36,37], is employed in the current study. The contact force consists of normal and tangential components. It can be formulated as:
where k, δ, η, and μ stand for the spring constant, overlap, damping coefficient, and friction coefficient, respectively.
As the main driving force in the dense fluid-particle flows, the drag force is of great importance to be accurately calculated. The drag force in the translational motion equation of particle is written as:
where β represents the momentum exchange coefficient between fluid and solid phases. As pointed out by Beetstra et al. [38,39], the drag force in the binary system will be underestimated for the large particle but overestimated for the small particle. Thus, a modification considering the influence of poly-dispersity was proposed and suggested by Beetstra et al. [38,39]. In the current study, the correction factor is employed to investigate the hydrodynamic characteristics of a binary system [38,39,40].
where dp,i is the particle diameter. Re, dSMD, and fpoly stand for the particle Reynolds number, the Sauter mean diameter of binary particles, and the correction factor for the poly-disperse system, respectively.
3. Computational Details
3.1. Numerical Setups
The numerical scheme of CFD-DEM has been well documented in our previous literature [34,41]. The geometry configuration refers to the experimental work conducted by Goldschmidt et al. [23]. The investigated object is a binary BFB with 0.15 m, 0.015 m, and 0.70 m in width, depth, and height, respectively. The density of solid particles is 2.5 g/cm3. The diameter of small particles and large ones is 1.5 mm and 2.5 mm, respectively. The total mass of the binary particles in the current cases is 326 g. The computational domain is divided into 20, 2, and 94 elements in width, depth, and height, respectively. The computational cell adopted in the current simulation is about 3–5 times the particle diameter, meeting the requirement of the conventional CFD-DEM [36,42,43]. The detailed physical parameters of small and large particles are summarized in Table 1.

Table 1.
Physical parameters of small and large particles used in simulations.
3.2. Initial and Boundary Conditions
The initial and boundary conditions should be properly set for the enclosure of the algebraic equations. As illustrated in Figure 1, the small and large particles are randomly scattered in the inferior and superior part of the BFB in the bottom region, respectively. The superficial gas velocity is assigned in the distributor with a fixed value. The zero gradient boundary condition is applied to the outlet of the system. At the wall, a non-slip boundary condition is chosen for the solid phase while the gas phase is simulated with free-slip boundary conditions according to the study by Beetstra et al. [39]. Due to the bubbling fluidized regime, particles in the system will not be escaped from the top of the bed. The fluid time step is set as 1 × 10⁻⁵ s while the DEM time step is chosen as 1 × 10⁻⁷ according to the criterion [44]. Each case in the current study is simulated in a cluster using 16 processors with a total physical time of 20 s.
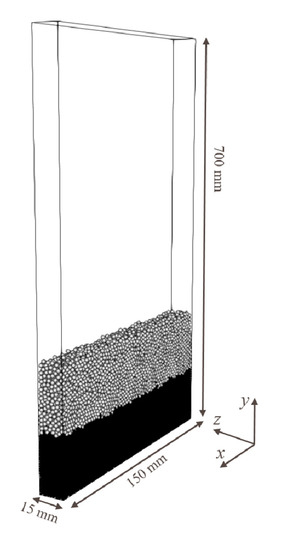
Figure 1.
Schematic of the binary BFB with small and large particles.
4. Results and Discussion
4.1. Model Validation
In order to validate the reasonability of the drag model adopted in the current study, the experimental measurement conducted by Jiang et al. [40] is used. The lab-scale BFB has the dimensions of 0.1 m, 0.34 m, and 0.014 m in width, height, and depth, respectively. Two different particles with the bed mass of 20.2 g and 13.5 g are initially packed in the fluidized bed with equal volume. The diameters and densities of investigated particles are 2.5 mm, 1450 kg/m3, and 1.8 mm, 985 kg/m3, respectively. The Sauter mean diameter in the validation simulation is approximately 2.15 mm. The computational domain is divided into 20, 100, and 3 elements in width, height, and depth, respectively. The detailed properties of gas and solid phases and numerical parameters are given in Table 2. A total physical time of 30 s is carried out for the statistical procedure in the validation.
Table 2.
Numerical parameters and physical properties of gas and solid phases, P1 for the white particle and P2 for the green particle.
Figure 2 displays the instantaneous distribution of solid particles in the BFB. Particles with binary sizes are respectively extracted and labeled with two colors, that is, the green and white particles respectively represent the large and small particles. The solid behaviors captured with the current simulation agree well with the experimental measurements by Jiang et al. [40]. A similar bed expansion is shown in the simulation and experiment. Good mixing between large and small particles can both be observed in the simulation and experiment. Different particles in the binary mixture system can be easily extracted owing to the flexibility of CFD-DEM simulation, while a certain system error will be introduced into the experimental extraction by the label matrix method [40]. Therefore, a slight difference in the void fraction can be seen between simulation and experiment. Nevertheless, the discrepancy is within the acceptable level.
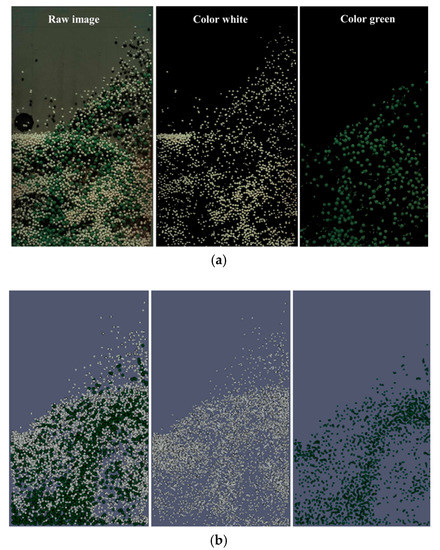
Figure 2.
Instantaneous mixing behaviors of particles with binary sizes: (a) experiment; (b) simulation.
Figure 3 shows the density distribution of particle vertical velocity and horizontal velocity with different sizes. The particle velocities are extracted at the heights ranging from 6 cm to 7 cm of the bed. The simulation results modeled with the current drag model are compared with that of the mono-disperse drag model and experimental data. It is obvious that more reasonable velocity distributions are captured when the poly-dispersity effect is considered in the drag model. The particle motions of both large and small particles perform more vigorous in the vertical direction compared with those in a horizontal direction. Moreover, similar distributions of horizontal velocity are obtained both in small and large particles while a slightly larger vertical velocity of small particles is presented in simulation and experiment. Additionally, the symmetric density distributions of particle velocity are presented both in horizontal and vertical directions.
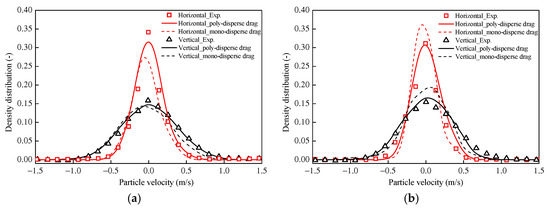
Figure 3.
Density distributions of particle vertical velocity and horizontal velocity with different particle sizes: (a) particle P1; (b) particle P2.
In order to further verify the accuracy of the poly-disperse drag model in the current work, the mixing index is compared between different numerical models and experiment results. For the purpose of quantitative description, the Lacey mixing index (MI) [45] is adopted to quantify the mixing degree of the whole bed, which is defined as:
where and represent the variance of solid mixing of the fully segregated and perfect mixed state, and they can by evaluated as:
where, the equivalent number of particles ne in the binary system [40,46] is employed. represents the averaged concentration of the smaller particles. The variance S is given as:
where ci is the concentration of smaller particles in the sample i. ki demonstrates a weighting factor. Obviously, the mixing index is in the range of 0 and 1, and the mixing degree at each instant can be descript by this value. Specifically, the MI of 1 and 0 stands for the perfectly mixed state and the completely segregated state at the initial time, respectively.
Figure 4 illustrates the evolutionary profiles of the mixing index between simulations and experiments. In harmony with the experimental measurement, the mixing index in the current simulation is calculated from the initial time. It can be found that the mixing index in the BFB gradually increases at the initial time period. At the time of 2 s, the mixing index achieves an equilibrium state and finally fluctuates around a fixed value. The profile obtained by the poly-disperse drag model is comparable to that of the experiment. Moreover, the relatively large deviations between the prediction with the mono-disperse drag model and experiment are presented in the current study. Observing from the instantaneous distributions of solid mixing behavior at 2 s, the poly-disperse drag model well predicts the mixing state between large and small particles while the traditional mono-disperse drag model obviously underestimates it, as the latter model underestimates the solid motion of large particles and overestimates that of the small particles. Based on the qualitative and quantitative analysis, the proposed drag model shows responsibility in the simulation of poly-disperse particle systems.
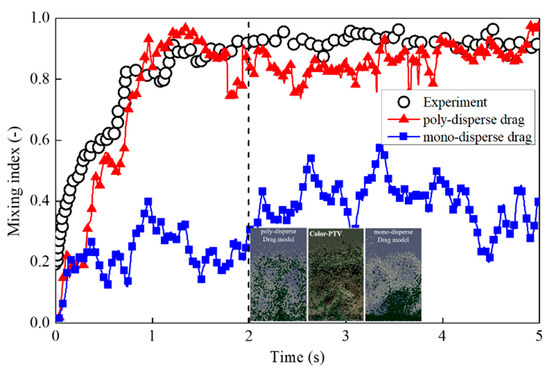
Figure 4.
Evolutionary profiles of the mixing index between simulations and experiment.
4.2. General Flow Pattern in the Binary Bubbling Fluidized Bed
Exploring the flow pattern of binary particles in the BFB is essential for not only the understanding of mixing behavior but also the design and optimization of the binary system. Figure 5 displays the evolution of solid motion in the binary BFB over time. After introducing the gas flow from the bottom distributor, the bed height is apparently increased with the rapid expansion of mixture particles. Meanwhile, owing to the formation of void structure between the interface of small particles and large particles, the small particles in the bottom region penetrates into the large particles in the upper layer. As the bubble rises and eventually breaks at the bed surface, the large particles are thrown to both sides of the left and right walls. After a period of bubble disturbance from formation to collapse and the influence of solid back-mixing along the wall region, the binary system is considered to reach a stable state at 5 s. Comparatively, a better mixing performance can be found in the upper region of the BFB because of the strong restriction of solid motion in the bottom region. Nevertheless, a good mixing state between small and large particles can be observed and the classical bubble phenomenon in the binary BFB is also captured.
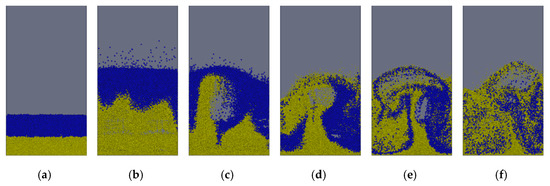
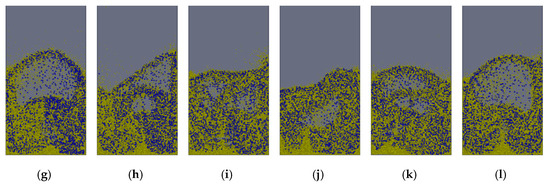
Figure 5.
Evolutions of the flow pattern and mixing process in the binary BFB: (a) 0 s; (b) 0.5 s; (c) 1.0 s; (d) 1.5 s; (e) 2.0 s; (f) 3.0 s; (g) 4.0 s; (h) 5.0 s; (i) 6.0 s; (j) 7.0 s; (k) 8.0 s; (l) 9.0 s.
4.3. Influence of Superficial Velocity on the Solid Mixing
As pointed by some researchers [47,48], elevating the superficial gas velocity can promote solid mixing in the mono-disperse fluidized system. In the current study, the effect of superficial gas velocity on the solid mixing characteristic of the binary BFB is comprehensively investigated. The superficial gas velocity changes from 1.15 m/s to 3.0 m/s while the physical properties of the small and large particle are the same as the description in Table 1.
The pressure characteristic is of great importance to the evaluation of gas-solid behaviors in the fluidization [49,50]. Figure 6 displays the influence of superficial gas velocity on the instantaneous pressure fluctuation and the associated power expressed as mean square amplitude (MSA). It is found that the pressure drop under different conditions randomly fluctuates around a fixed value. The amplitude of pressure drop is gradually strengthened with the increase of superficial gas velocity. The oscillation of pressure drop mainly depends on the disturbance caused by the formation and collapse of bubbles in the BFB. Observing from the power spectra analysis, a peak MSA value under a similar frequency is performed in each case. Generally, a higher MSA value appears at a larger superficial gas velocity.
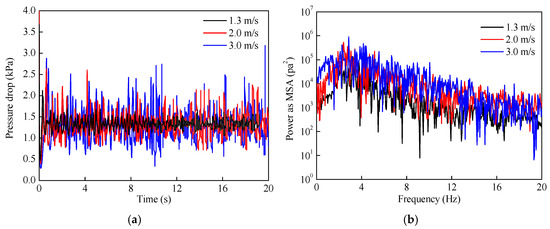
Figure 6.
Evolutions of pressure drop: (a) and the associated power as MSA (b) with different superficial gas velocity.
Figure 7 illustrates the time evolutionary profiles of the mixing index in the binary BFB with different superficial gas velocities. The mixing index gradually increases from zero and then oscillates around a fixed value, which respectively corresponds to the completely separated state at the initial moment and the equilibrium state of a binary system. The larger the superficial gas velocity is, the shorter the time is required for the system to reach an equilibrium state. Over the current range of superficial gas velocity from 1.15 m/s to 1.6 m/s, a better mixing behavior is obtained in the system with a larger superficial gas velocity. Owing to the more chaotic and unsteady fluidization in the system with a larger superficial gas velocity [48], the oscillation of MI is a bit more vigorous with the increase of superficial gas velocity.
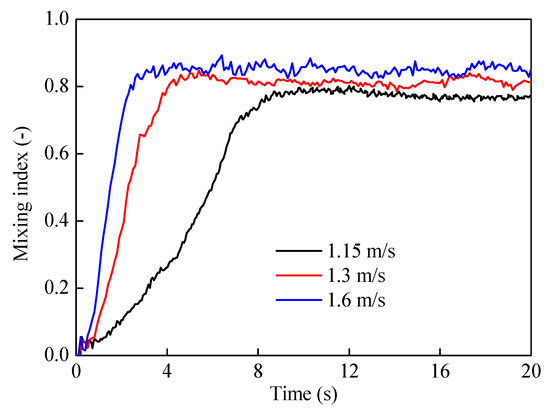
Figure 7.
Time evolutionary profiles of mixing index with different superficial gas velocities.
To further explore the influence of superficial gas velocity on the mixing performance in the binary system, a wider range of superficial gas velocities are comprehensively investigated. Furthermore, the independent study of statistical time is conducted in the current study. Figure 8 shows the time-averaged mixing index with different statistical time and various superficial gas velocities ranging from 1.15 m/s to 3 m/s. The results of the initial 5 s are discarded for avoiding the startup effect. In the case of 1.15 m/s, a big deviation can be found with a statistical time of the last 15 s and those of 5 s and 10 s, which indicates that it requires a long time to reach the equilibrium state as illustrated in Figure 7. Beyond that, the discrepancy among the results with different statistical time is fairly insignificant. Therefore, the statistical procedure conducted over the last 10 s of the simulation is reliable in the present study. Interestingly, the solid mixing in the binary BFB is firstly enhanced then deteriorated with the increase of superficial gas velocity. This phenomenon is different from previous observation as documented in the mono-disperse system [15,48].
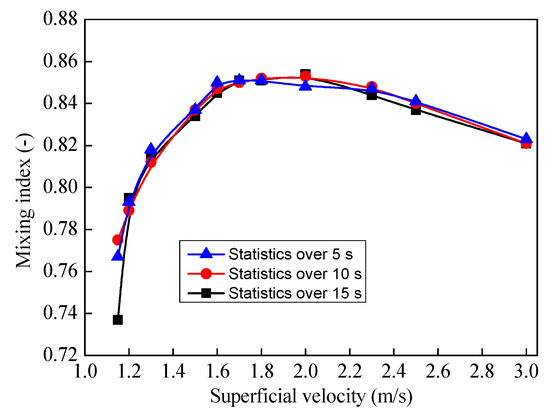
Figure 8.
Time-averaged mixing index under different superficial gas velocities.
Qualitative and quantitative analysis about the influence of superficial velocity on the mixing behavior is comprehensively discussed in the current study. Figure 9 displays the instantaneous structures of bubbles in the BFB under the superficial gas velocity of 1.5 m/s and 3.0 m/s, which represent two different representative operating conditions. Owing to the introduction of gas flow, small bubbles are randomly formed at the bottom region and coalesce into larger bubbles in the rising process, and finally break up at the bed surface. In the case with lower superficial gas velocity, the distribution of bubbles is more uniform. At a larger superficial gas velocity, an extremely large bubble can be observed in the bed. As pointed by previous researchers [51], decreasing the size of bubbles is beneficial for the gas-solid interactions especially in the solid mixing. Therefore, the large bubble observed in the system with a larger superficial gas velocity can provide a good descriptive metric for the deterioration of mixing characteristics.
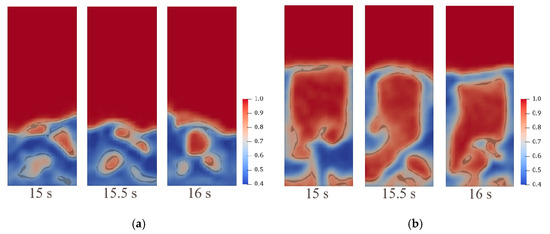
Figure 9.
Instantaneous distribution of bubbles in the BFB under different superficial gas velocities: (a) 1.5 m/s; (b) 3.0 m/s.
As shown in Figure 10, the vertical velocity of the small particle and large particle are quantitatively analyzed in the current study. Compared with the profiles in the middle and upper regions, the solid vertical velocity is more moderate in the lower layer. Owing to the solid back-mixing phenomenon in the upper region, the upward solid motion is more drastic in the central region. In the case with low superficial gas velocity, similar distributions of a vertical velocity of small and large particles can be observed in the central and upper regions while the solid vertical velocity of the small particle is a little smaller than that of the large particle in the lower layer. It is considered that the deviation of solid motion between small and large particles in the bottom region will enhance the disturbance of a binary mixture, thus promoting the mixing process in the binary system. As for the situation with a higher superficial gas velocity, the small particle preforms a larger velocity in the upper layer than that of the large particle. It is considered that this deviation in the upper region will cause a segregation phenomenon between small and large particles, which demonstrates the deterioration of solid mixing under high superficial gas velocities. Generally, the mixing characteristic in the binary BFB is determined by the competition between the solid segregation and mixing. Concluding from Figure 8, there is a critical superficial gas velocity that maximizes the mixing index of the binary mixture in the BFB. Mixing beats segregation and segregation overtakes mixing under the operating conditions below and above the specific critical velocity, respectively.
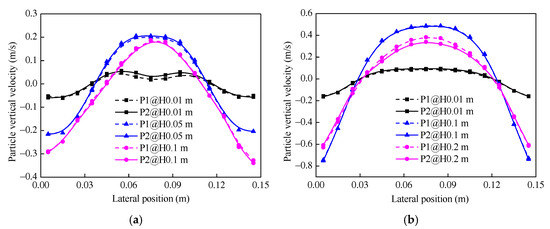
Figure 10.
Time-averaged profiles of solid vertical velocity under different superficial gas velocities: (a) 1.5 m/s; (b) 3.0 m/s.
4.4. Influence of SMD on the Solid Mixing
As commonly assumed in the previous researchers [52,53,54,55,56], the SMD is adopted in the simulation when dealing with the poly-disperse systems. Therefore, the influence of the mean diameter assumption in the simulation of the poly-disperse system is comprehensively explored in the current section. Leaving the physical properties (i.e., diameter and density of small and large particles) untouched, the number of small and large particles in different cases is various while the equivalent number of particles in each system is fixed. Table 3 gives detailed information of the simulation settings in the present section.
Table 3.
Details of the gas-solid properties in the current simulation, P1 for the small particle and P2 for the large particle.
Figure 11 illustrates the time evolutionary profiles of the solid mixing index in the BFB with different SMD. Comparting the equilibrium state under various conditions, the smaller the SMD of the binary mixture is, the better mixing behavior can be achieved in the system. This finding is consistent with the practical engineering applications (i.e., coal combustion, gasification, and chemical looping combustion) where small particles perform a better mixing and heat transfer performance [57,58,59]. Moreover, the mixing behavior is considerably deteriorated in the system with the SMD of 2.23 mm while the oscillation in this case is relatively more drastic compared with other conditions. In addition to the evaluation of the mixing index, the mixing efficiency is also compared under different conditions. Observing from the evolutions, the slopes of mixing index curves at the initial time are quite similar, which indicates that the SMD in the binary system has a little effect on the mixing efficiency.
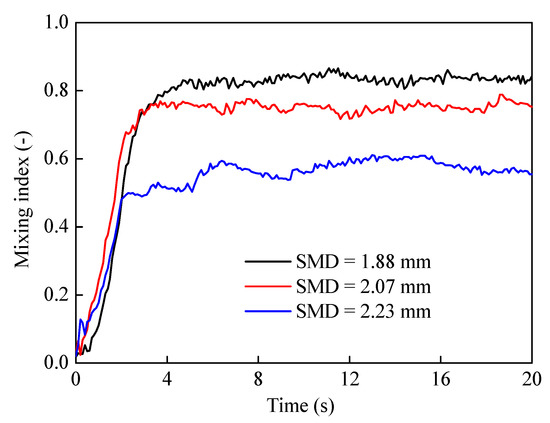
Figure 11.
Time evolutionary profiles of mixing index with different SMD.
Owing to the intense interphase momentum exchange and inter-particle interaction, the disturbance characteristics of small and large particles are quantitatively analyzed by the granular temperature in the current study. Figure 12 exhibits the time-averaged granular temperature of binary solid mixture with various SMD at the height of 0.05 m and 0.1 m. It is found that the horizontal distributions of granular temperature at different height are quite distinct. Specifically, parabolic shape distributions of granular temperature are observed in the lower region while the profiles in the upper layer are flatter. Moreover, the disturbance of small particles in each case is definitely more drastic than that of large particles. Comparing with the solid disturbance in the near-wall regions, a greater granular temperature magnitude appears in the central part.
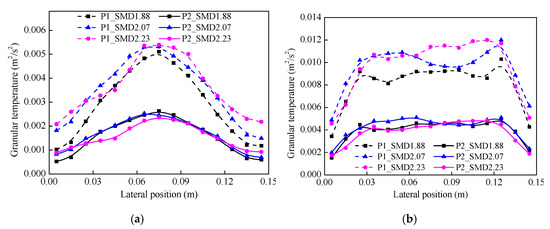
Figure 12.
Time-averaged granular temperature of small and large particles with various SMD at different heights: (a) 0.05 m; (b) 0.1 m.
For further understanding of the influence of SMD on the mixing behaviors in the binary BFB, the granular temperature difference between small and large particles under different conditions is comprehensively investigated in Figure 13. The granular temperature differences distribute parabolic profile and ‘M’ shape at the height of 0.05 m and 0.1 m, respectively. Moreover, the granular temperature difference is relatively greater in the upper layer. The granular temperature difference between small and large particles gradually increases with the increase of SMD in the binary system both in the lower and upper layers. A small deviation of the granular temperature indicates the fluctuation of small particles and large particles is closer, thus promoting a more uniform mixing of the binary mixture. Additionally, a large granular temperature difference will cause unsteady flow in the binary BFB.
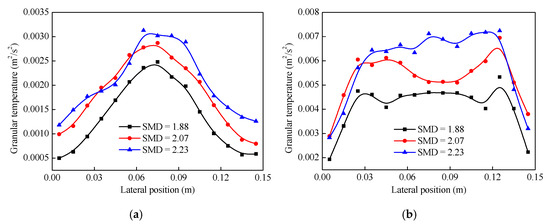
Figure 13.
Time-averaged granular temperature difference between small and large particles at different heights: (a) 0.05 m; (b) 0.1 m.
4.5. Influence of Particle Size Distribution on the Solid Mixing
In the current section, the influence of particle size distribution on the solid mixing characteristic is comprehensively revealed. Three ranges of the particle size distribution are investigated while the equivalent number of particles and SMD in the binary system are maintained in each case. Detailed properties of the binary mixture are summarized in Table 4.
Table 4.
Details of the gas-solid properties in the current simulation, P1 for the small particle and P2 for the large particle.
Figure 14 illustrates the time-averaged mixing index in the binary system with different ranges of particle size distribution. Comparing with the system with a wide range of particle size distribution, the mixing index is relatively higher in the system with a narrower particle size distribution. With the decrease of particle size distribution range, the mixing behavior in the binary system is gradually enhanced. A similar phenomenon can be concluded in the previous researches [32,40].
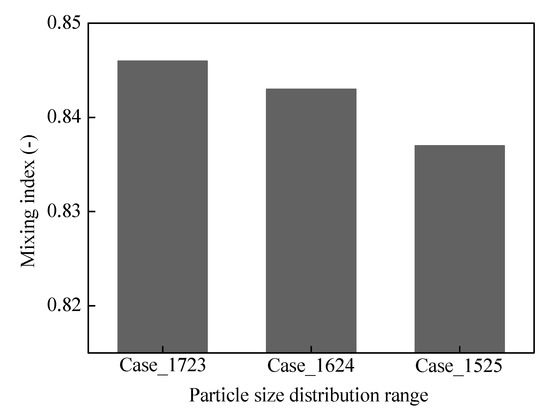
Figure 14.
Time-averaged mixing index in the system with different particle size distributions.
5. Conclusions
The mixing characteristics of binary BFB are numerically investigated in the current study. The poly-disperse drag model used in this paper can accurately predict the properties of a binary system. The influence of superficial gas velocity, SMD in the system, and particle size distribution on the behavior of mixing index in the binary BFB are comprehensively revealed. The results show that the mixing characteristic in the binary BFB is firstly enhanced then deteriorated with the increase of superficial gas velocity. Generally, the mixing characteristic in the binary BFB is determined by the competition between the solid segregation and mixing. A critical superficial gas velocity exists, which corresponds to the optimal mixing of binary particles. Solid mixing is dominant below the critical velocity while solid segregation is dominant above the critical velocity. The mixing process is enhanced with the decrease of SMD while it is deteriorated with a wide range of particle size distribution. Therefore, it is highly recommended to perform a binary particle system with smaller SMD and closer particle size distribution for the purpose of enhancing the mixing behavior. Superficial gas velocity is a major factor affecting the mixing efficiency, while the SMD and particle size distribution in the binary system have little influence on the mixing efficiency.
Author Contributions
Conceptualization, J.L. and K.L.; data curation, J.L.; methodology, J.L. and S.W.; writing-original draft preparation, J.L.; writing-review and editing, S.W. and L.S.; supervision, K.L.; funding acquisition, K.L. and J.F. All authors have read and agreed to the published version of the manuscript.
Funding
This research was funded by the National Key Research and Development Plan of China (2017YFE0112500), the National Natural Science Foundation of China (No. 51806192).
Conflicts of Interest
The authors declare no conflict of interest.
References
- Yang, S.; Zhou, T.; Wei, Y.; Hu, J.; Wang, H. Influence of size-induced segregation on the biomass gasification in bubbling fluidized bed with continuous lognormal particle size distribution. Energy Convers. Manag. 2019, 198, 111848. [Google Scholar] [CrossRef]
- Hofer, G.; Märzinger, T.; Eder, C.; Pröll, F.; Pröll, T. Particle mixing in bubbling fluidized bed reactors with continuous particle exchange. Chem. Eng. Sci. 2019, 195, 585–597. [Google Scholar] [CrossRef]
- Zhao, G.; Shi, X.; Wu, Y.; Wang, M.; Zhang, M.; Gao, J.; Lan, X. 3D CFD simulation of gas-solids hydrodynamics and bubbles behaviors in empty and packed bubbling fluidized beds. Powder Technol. 2019, 351, 1–15. [Google Scholar] [CrossRef]
- Timmer, K.J.; Brown, R.C. Transformation of char carbon during bubbling fluidized bed gasification of biomass. Fuel 2019, 242, 837–845. [Google Scholar] [CrossRef]
- Chew, J.W.; Hrenya, C.M. Link between bubbling and segregation patterns in gas-fluidized beds with continuous size distributions. AlChE J. 2011, 57, 3003–3011. [Google Scholar] [CrossRef]
- Yiannoulakis, H.; Yiagopoulos, A.; Kiparissides, C. Recent developments in the particle size distribution modeling of fluidized-bed olefin polymerization reactors. Chem. Eng. Sci. 2001, 56, 917–925. [Google Scholar] [CrossRef]
- Gu, J.; Zhong, W.; Yu, A. Three-dimensional simulation of oxy-fuel combustion in a circulating fluidized bed. Powder Technol. 2019, 351, 16–27. [Google Scholar] [CrossRef]
- Bidabadi, M.; Bozorg, M.V.; Bordbar, V.; Ahmadi, G. Flame propagation through heterogeneous combustion of hybrid aluminum-boron poly-disperse particle suspensions in air. Fuel 2018, 215, 714–725. [Google Scholar] [CrossRef]
- Deen, N.G.; Kuipers, J.A.M. Direct Numerical Simulation (DNS) of mass, momentum and heat transfer in dense fluid-particle systems. Curr. Opin. Chem. Eng. 2014, 5, 84–89. [Google Scholar] [CrossRef]
- Marandi, R.; Hashim, S.; Zahedi, G. Hydrodynamic and Heat Transfer Modeling of Polydisperse Fluidized Bed Olefin Polymerization Reactors. In Computer Aided Chemical Engineering; Elsevier: Amsterdam, The Netherlands, 2012; Volume 30, pp. 1053–1057. [Google Scholar]
- Wang, S.; Luo, K.; Fan, J. CFD-DEM coupled with thermochemical sub-models for biomass gasification: Validation and sensitivity analysis. Chem. Eng. Sci. 2020, 217, 115550. [Google Scholar] [CrossRef]
- Wang, S.; Luo, K.; Hu, C.; Fan, J. CFD-DEM study of the effect of cyclone arrangements on the gas-solid flow dynamics in the full-loop circulating fluidized bed. Chem. Eng. Sci. 2017, 172, 199–215. [Google Scholar] [CrossRef]
- Yang, S.; Cahyadi, A.; Sun, Y.; Wang, J.; Chew, J.W. CFD-DEM investigation into the scaling up of spout-fluid beds via two interconnected chambers. AlChE J. 2016, 62, 1898–1916. [Google Scholar] [CrossRef]
- Yang, X.; Wang, S.; Li, B.; Liu, H.; He, Y. Evaluation of sorption-enhanced reforming over catalyst-sorbent bi-functional particles in an internally circulating fluidized bed. Adv. Powder Technol. 2020, 31, 2566–2572. [Google Scholar] [CrossRef]
- Wang, S.; Luo, K.; Hu, C.; Sun, L.; Fan, J. Effect of superficial gas velocity on solid behaviors in a full-loop CFB. Powder Technol. 2018, 333, 91–105. [Google Scholar] [CrossRef]
- Yang, S.; Wang, H.; Wei, Y.; Hu, J.; Chew, J.W. Numerical Investigation of Bubble Dynamics during Biomass Gasification in a Bubbling Fluidized Bed. ACS Sustain. Chem. Eng. 2019, 7, 12288–12303. [Google Scholar] [CrossRef]
- Alobaid, F. A particle-grid method for Euler-Lagrange approach. Powder Technol. 2015, 286, 342–360. [Google Scholar] [CrossRef]
- Lim, L.J.J.; Lim, E.W.C. Mixing and segregation behaviors of a binary mixture in a pulsating fluidized bed. Powder Technol. 2019, 345, 311–328. [Google Scholar] [CrossRef]
- Molaei, E.A.; Yu, A.; Zhou, Z. CFD-DEM modelling of mixing and segregation of binary mixtures of ellipsoidal particles in liquid fluidizations. J. Hydrodyn. 2019, 31, 1190–1203. [Google Scholar] [CrossRef]
- Huilin, L.; Yurong, H.; Gidaspow, D. Hydrodynamic modelling of binary mixture in a gas bubbling fluidized bed using the kinetic theory of granular flow. Chem. Eng. Sci. 2003, 58, 1197–1205. [Google Scholar] [CrossRef]
- Dash, S.; Mohanty, S.; Mishra, B.K. CFD modelling and simulation of an industrial scale continuous fluidized bed roaster. Adv. Powder Technol. 2020, 31, 658–669. [Google Scholar] [CrossRef]
- Yang, S.; Liu, X.; Wang, S. CFD simulation of air-blown coal gasification in a fluidized bed reactor with continuous feedstock. Energy Convers. Manag. 2020, 213, 112774. [Google Scholar] [CrossRef]
- Goldschmidt, M.J.V.; Link, J.M.; Mellema, S.; Kuipers, J.A.M. Digital image analysis measurements of bed expansion and segregation dynamics in dense gas-fluidised beds. Powder Technol. 2003, 138, 135–159. [Google Scholar] [CrossRef]
- Huilin, L.; Yurong, H.; Gidaspow, D.; Lidan, Y.; Yukun, Q. Size segregation of binary mixture of solids in bubbling fluidized beds. Powder Technol. 2003, 134, 86–97. [Google Scholar] [CrossRef]
- Zhang, Y.; Jin, B.; Zhong, W. Experimental investigation on mixing and segregation behavior of biomass particle in fluidized bed. Chem. Eng. Process. Process. Intensif. 2009, 48, 745–754. [Google Scholar] [CrossRef]
- Zhong, H.; Gao, J.; Xu, C.; Lan, X. CFD modeling the hydrodynamics of binary particle mixtures in bubbling fluidized beds: Effect of wall boundary condition. Powder Technol. 2012, 230, 232–240. [Google Scholar] [CrossRef]
- Cooper, S.; Coronella, C.J. CFD simulations of particle mixing in a binary fluidized bed. Powder Technol. 2005, 151, 27–36. [Google Scholar] [CrossRef]
- Zhou, Q.; Wang, J. CFD study of mixing and segregation in CFB risers: Extension of EMMS drag model to binary gas–solid flow. Chem. Eng. Sci. 2015, 122, 637–651. [Google Scholar] [CrossRef]
- Fan, R.; Fox, R.O. Segregation in polydisperse fluidized beds: Validation of a multi-fluid model. Chem. Eng. Sci. 2008, 63, 272–285. [Google Scholar] [CrossRef]
- Van Sint Annaland, M.; Bokkers, G.A.; Goldschmidt, M.J.V.; Olaofe, O.O.; van der Hoef, M.A.; Kuipers, J.A.M. Development of a multi-fluid model for poly-disperse dense gas-solid fluidised beds, part II: Segregation in binary particle mixtures. Chem. Eng. Sci. 2009, 64, 4237–4246. [Google Scholar] [CrossRef]
- Zhang, Y.; Zhao, Y.; Lu, L.; Ge, W.; Wang, J.; Duan, C. Assessment of polydisperse drag models for the size segregation in a bubbling fluidized bed using discrete particle method. Chem. Eng. Sci. 2017, 160, 106–112. [Google Scholar] [CrossRef]
- Limtrakul, S.; Chalermwattanatai, A.; Unggurawirote, K.; Tsuji, Y.; Kawaguchi, T.; Tanthapanichakoon, W. Discrete particle simulation of solids motion in a gas-solid fluidized bed. Chem. Eng. Sci. 2003, 58, 915–921. [Google Scholar] [CrossRef]
- Cundall, P.A.; Strack, O.D. A discrete numerical model for granular assemblies. Geotechnique 1979, 29, 47–65. [Google Scholar] [CrossRef]
- Luo, K.; Wu, F.; Yang, S.; Fang, M.; Fan, J. High-fidelity simulation of the 3-D full-loop gas-solid flow characteristics in the circulating fluidized bed. Chem. Eng. Sci. 2015, 123, 22–38. [Google Scholar] [CrossRef]
- Yang, S.L.; Luo, K.; Fang, M.M.; Zhang, K.; Fan, J.R. Numerical investigation of the gas-solid flow characteristics in a three-dimensional spouted bed with a draft tube. Chem. Eng. Technol. 2013, 36, 2035–2043. [Google Scholar] [CrossRef]
- Wang, S.; Luo, K.; Hu, C.; Lin, J.; Fan, J. CFD-DEM simulation of heat transfer in fluidized beds: Model verification, validation, and application. Chem. Eng. Sci. 2019, 197, 280–295. [Google Scholar] [CrossRef]
- Luo, K.; Lin, J.; Wang, S.; Hu, C.; Fan, J. Effect of operating parameters on gas-solid hydrodynamics and heat transfer in a spouted bed. Chem. Eng. Technol. 2019, 42, 2310–2320. [Google Scholar] [CrossRef]
- Beetstra, R.; van der Hoef, M.A.; Kuipers, J.A.M. Drag force of intermediate Reynolds number flow past mono- and bidisperse arrays of spheres. AlChE J. 2007, 53, 489–501. [Google Scholar] [CrossRef]
- Beetstra, R.; van der Hoef, M.A.; Kuipers, J.A.M. Numerical study of segregation using a new drag force correlation for polydisperse systems derived from lattice—Boltzmann simulations. Chem. Eng. Sci. 2007, 62, 246–255. [Google Scholar] [CrossRef]
- Jiang, Z.; Hagemeier, T.; Bück, A.; Tsotsas, E. Color-PTV measurement and CFD-DEM simulation of the dynamics of poly-disperse particle systems in a pseudo-2D fluidized bed. Chem. Eng. Sci. 2018, 179, 115–132. [Google Scholar] [CrossRef]
- Wang, S.; Luo, K.; Yang, S.; Hu, C.; Fan, J. Parallel LES-DEM simulation of dense flows in fluidized beds. Appl. Therm. Eng. 2017, 111, 1523–1535. [Google Scholar] [CrossRef]
- Peng, Z.; Doroodchi, E.; Luo, C.; Moghtaderi, B. Influence of void fraction calculation on fidelity of CFD-DEM simulation of gas-solid bubbling fluidized beds. AlChE J. 2014, 60, 2000–2018. [Google Scholar] [CrossRef]
- Clarke, D.A.; Sederman, A.J.; Gladden, L.F.; Holland, D.J. Investigation of void fraction schemes for use with CFD-DEM simulations of fluidized beds. Ind. Eng. Chem. Res. 2018, 57, 3002–3013. [Google Scholar] [CrossRef]
- Tsuji, Y.; Kawaguchi, T.; Tanaka, T. Discrete particle simulation of two-dimensional fluidized bed. Powder Technol. 1993, 77, 79–87. [Google Scholar] [CrossRef]
- Lacey, P.M.C. Developments in the theory of particle mixing. J. Appl. Chem. 1954, 4, 257–268. [Google Scholar] [CrossRef]
- Feng, Y.Q.; Xu, B.H.; Zhang, S.J.; Yu, A.B.; Zulli, P. Discrete particle simulation of gas fluidization of particle mixtures. AlChE J. 2004, 50, 1713–1728. [Google Scholar] [CrossRef]
- Wang, S.; Luo, K.; Hu, C.; Sun, L.; Fan, J. Impact of operating parameters on biomass gasification in a fluidized bed reactor: An Eulerian-Lagrangian approach. Powder Technol. 2018, 333, 304–316. [Google Scholar] [CrossRef]
- Fang, M.; Luo, K.; Yang, S.; Zhang, K.; Fan, J. Computational fluid dynamics—Discrete element method investigation of solid mixing characteristics in an internally circulating fluidized bed. Ind. Eng. Chem. Res. 2013, 52, 7556–7568. [Google Scholar] [CrossRef]
- Yang, S.; Sun, Y.; Zhang, L.; Zhao, Y.; Chew, J.W. Numerical investigation on the effect of draft plates on spouting stability and gas-solid characteristics in a spout-fluid bed. Chem. Eng. Sci. 2016, 148, 108–125. [Google Scholar] [CrossRef]
- Wang, S.; Luo, K.; Hu, C.; Fan, J. CFD-DEM study of the effect of ring baffles on system performance of a full-loop circulating fluidized bed. Chem. Eng. Sci. 2019, 196, 130–144. [Google Scholar] [CrossRef]
- Hu, C.; Luo, K.; Yang, S.; Wang, S.; Fan, J. A comprehensive numerical investigation on the hydrodynamics and erosion characteristics in a pressurized fluidized bed with dense immersed tube bundles. Chem. Eng. Sci. 2016, 153, 129–145. [Google Scholar] [CrossRef]
- Wang, S.; Lu, H.; Zhao, F.; Liu, G. CFD studies of dual circulating fluidized bed reactors for chemical looping combustion processes. Chem. Eng. J. 2014, 236, 121–130. [Google Scholar] [CrossRef]
- Shuai, W.; Huang, L.; Zhenhua, H.; Huilin, L.; Guodong, L.; Dan, L.; Feixiang, Z. Numerical modeling of a bubbling fluidized bed coal gasifier by kinetic theory of rough spheres. Fuel 2014, 130, 197–202. [Google Scholar] [CrossRef]
- Sun, L.; Luo, K.; Fan, J. Numerical investigation on methanation kinetic and flow behavior in full-loop fluidized bed reactor. Fuel 2018, 231, 85–93. [Google Scholar] [CrossRef]
- Su, M.; Zhao, H.; Ma, J. Computational fluid dynamics simulation for chemical looping combustion of coal in a dual circulation fluidized bed. Energy Convers. Manag. 2015, 105, 1–12. [Google Scholar] [CrossRef]
- Lin, J.; Luo, K.; Sun, L.; Wang, S.; Hu, C.; Fan, J. Numerical investigation of nickel-copper oxygen carriers in chemical-looping combustion process with zero emission of CO and H2. Energy Fuels 2019, 33, 12096–12105. [Google Scholar] [CrossRef]
- Duan, Y.; Duan, L.; Wang, J.; Anthony, E.J. Observation of simultaneously low CO, NOx and SO2 emission during oxy-coal combustion in a pressurized fluidized bed. Fuel 2019, 242, 374–381. [Google Scholar] [CrossRef]
- Sutardi, T.; Paul, M.C.; Karimi, N. Investigation of coal particle gasification processes with application leading to underground coal gasification. Fuel 2019, 237, 1186–1202. [Google Scholar] [CrossRef]
- Chen, H.; Cheng, M.; Liu, L.; Li, Y.; Li, Z.; Cai, N. Coal-fired chemical looping combustion coupled with a high-efficiency annular carbon stripper. Int. J. Greenh. Gas. Control. 2020, 93, 102889. [Google Scholar] [CrossRef]


© 2020 by the authors. Licensee MDPI, Basel, Switzerland. This article is an open access article distributed under the terms and conditions of the Creative Commons Attribution (CC BY) license (http://creativecommons.org/licenses/by/4.0/).