Article

Analysis of the Effect of Ventilation Bars on the Packing Structure of Sinter Bed by DEM Simulation

Institute of Multidisciplinary Research for Advanced Materials, Tohoku University, 2-1-1 Katahira, Aobaku, Sendai 980-8577, Japan
*
Author to whom correspondence should be addressed.
Energies 2020, 13(15), 3836; https://doi.org/10.3390/en13153836
Submission received: 30 June 2020 / Revised: 17 July 2020 / Accepted: 21 July 2020 / Published: 27 July 2020
(This article belongs to the Special Issue DEM of Multiphase Flows and Powder Processing)

Abstract

:
The effect of ventilation bars on the porosity of a sinter bed charged on a sinter machine was investigated. The behavior of the sinter feed was calculated by discrete element method (DEM) simulation. By taking into account the adhesion force, the sinter feed in the wet state was represented and the simulation parameters were determined to reproduce the experimental values of the angle of repose. The porosity of the sinter bed was calculated, and the mechanism of the formation of the packing structure and the cause of the distribution of porosity in each region were clarified. As a result, it is shown that in the case of shear flow, the higher the powder pressure during flow, the higher the porosity.

1. Introduction

In general ironmaking, the sintering process plays an important role in supplying the blast furnace with high strength sinter, which is one of the raw materials for the blast furnace. In the sintering process, a granulation operation is first performed to obtain coarse granules from fine iron ores. During the granulation operation, several kinds of iron ores and limestones as a flux are mixed and granulated to achieve the desired composition and size. The obtained granules are charged from the hopper onto the moving sintering pallet to form a green bed. The green bed is sintered by ignition at the top and suction from the bottom. It is known that the permeability of the green bed affects the productivity and quality of sinter. Since the permeability of the green bed is strongly influenced by the particle packing structure of the sinter feed, it is important to control the particle size segregation and void structure of the bed [1]. The sinter feed certainly has a particle size distribution, and it is naturally segregated during the feeding process. In order to increase the permeability of the green bed and the thermal efficiency of the upper layer of the bed, which tends to lack heat, the coarser granules should be segregated in the lower layer and the finer granules in the upper layer. A lot of experimental and simulation studies have been performed to control and enhance the size segregation of sinter feeds [2,3,4,5,6,7,8]. Fukami et al. [9] used a scaled-down sinter machine to understand the segregation mechanism of the green bed, and investigated the effect of the rotational speed, the height of gate opening of the roll feeder, the angle of the chute and the feed position on the chute. Discrete element method (DEM) [10] calculations have been shown to be effective in describing the behavior of powders in various industrial fields [11,12,13]. Simulation analysis of raw material behavior in each process was performed, and its usefulness was shown [14,15,16,17,18,19,20,21,22]. Nakano et al. [23] calculated the granule behavior during the feeding process using DEM. The actual granules with particle size distribution were modeled with spherical particles with typical mean size, and the particle segregation in the sinter bed was successfully reproduced. In order to improve the permeability of the sinter bed, a device for sintering machines has also been developed. Higuchi et al. [2] developed stand-support sintering, and the effect on productivity was investigated. Honorato et al. [24] studied the effect of the intensified sifting feeder (ISF), which is a bar-type equipment located under the chute on the segregation of the sinter bed. Oyama et al. [25] studied the effects of magnetic force on the behavior of the charged granules on the sinter bed. Thus, efforts have been made to improve the permeability of the sinter bed by various methods. It has been shown that particle behavior analysis by simulation is also useful in the feed process, and it is important to use both approaches effectively.
One of the technologies that control the permeability of the sinter bed is the ventilation bar [26]. It is known that ventilation bars are inserted into the sinter bed from the opposite side of the pallet’s conveying direction, and as the pallet moves, the ventilation bars are pulled out from the sinter bed, creating a void and reducing the packing density of the bed. However, the effects and mechanisms of the ventilation bars on the packing structure and permeability are not fully understood, and the optimal specification conditions of the ventilation bars are unknown. Therefore, in this study, the effect of ventilation bars on the packing structure was evaluated by analyzing the feeding behavior of the sinter bed using DEM simulations. In order to reduce the computational load, the actual sinter feed was represented as three representative particle sizes and the friction coefficient was determined where the modeled particles showed the same angle of repose as the actual sinter feed. The effect of ventilation bars on the packing structure of the sinter bed was analyzed.

2. Simulation Methods and Determination of Simulation Parameters

2.1. Discrete Element Method (DEM)

DEM [10] is one of the most popular simulation methods for tracking solid particle motion. The motion of every particle in the calculation is tracked using Newton’s second law. The interaction forces at the moment of collision between two particles are calculated by the Voight model. The contact force is indicated as Equations (1) and (2).
F n = K n u n + η n d u n d t
F t = min { μ F n ,   K t Δ ( u t + r φ ) + η t d ( u t + r φ ) d t }
Here, K is the spring coefficient, η is the viscous coefficient, φ is the relative rotational displacement, μ is the frictional coefficient, u is the relative displacement, and the subscripts n and t represent the normal and tangential directions, respectively. The rotation of the particles is calculated from the moment of inertia and torque acting on the particles. Rolling friction is taken into account to represent the non-spherical shape of the particles [23]. In addition, since the sinter feed is a granule containing water, the adhesion force as a method of expressing the wet state is introduced. It is known that increasing the value of the adhesion force makes it harder for particles to rotate, resulting in a greater angle of repose [27]. The equation of motion of the particles considering the adhesion force Fadhesion is indicated by Equations (3) and (4); rotational resistance Rr is indicated by Equation (5).
m d v d t = ( F n + F t + F adhesion ) + m g
I d ω d t = ( r × F t ) + R r
R r = μ r b | f n | φ | φ |
Here, m is the mass, I is the moment of inertia, μ r is the rolling friction coefficient, and b is the radius of the contact surface. The adhesion force was assumed to act at a constant value in the central direction of the particles in contact with each other. Although the liquid bridge force model is commonly used to model the adhesion force, the adhesion force is simply determined by a single factor in this study. This is because the number of parameters to be set will increase and, in any model, the final parameters may be determined by fitting.

2.2. Determination of Simulation Parameters

In DEM, it is known that the friction coefficient has a dominant influence on the behavior of particles. The particle adhesion force also influences dynamic or static behavior. These parameters were identified by comparison of experimental and simulation results of angle of repose in order to reproduce the behavior of the sinter feeds. Sinter feeds used in this work were provided by NIPPON STEEL CORPORATION, Tokyo, Japan. The particle size distribution of the sinter feed measured by a sieve is shown in Figure 1. This sinter feed was wet with 7 wt% moisture. The test of angle of repose was performed as follows. The sinter feed was classified by a sieve into particle sizes of 0–2 mm, 2–4 mm, and 4–8 mm, respectively. A hopper with an outlet diameter of 100 mm was loaded with 4 kg of sinter feeds, and the sinter feeds were dropped from a height of 150 mm toward a 100 mm diameter pipe installed directly below the hopper. The angle of repose was measured by observing the sinter feed falling on the pipe from the horizontal direction. The measurements were taken from four locations with the direction of measurement changed by 90 degrees, and the average was calculated. Two tests were conducted for each particle size.

2.3. Experiment Results of Angle of Repose

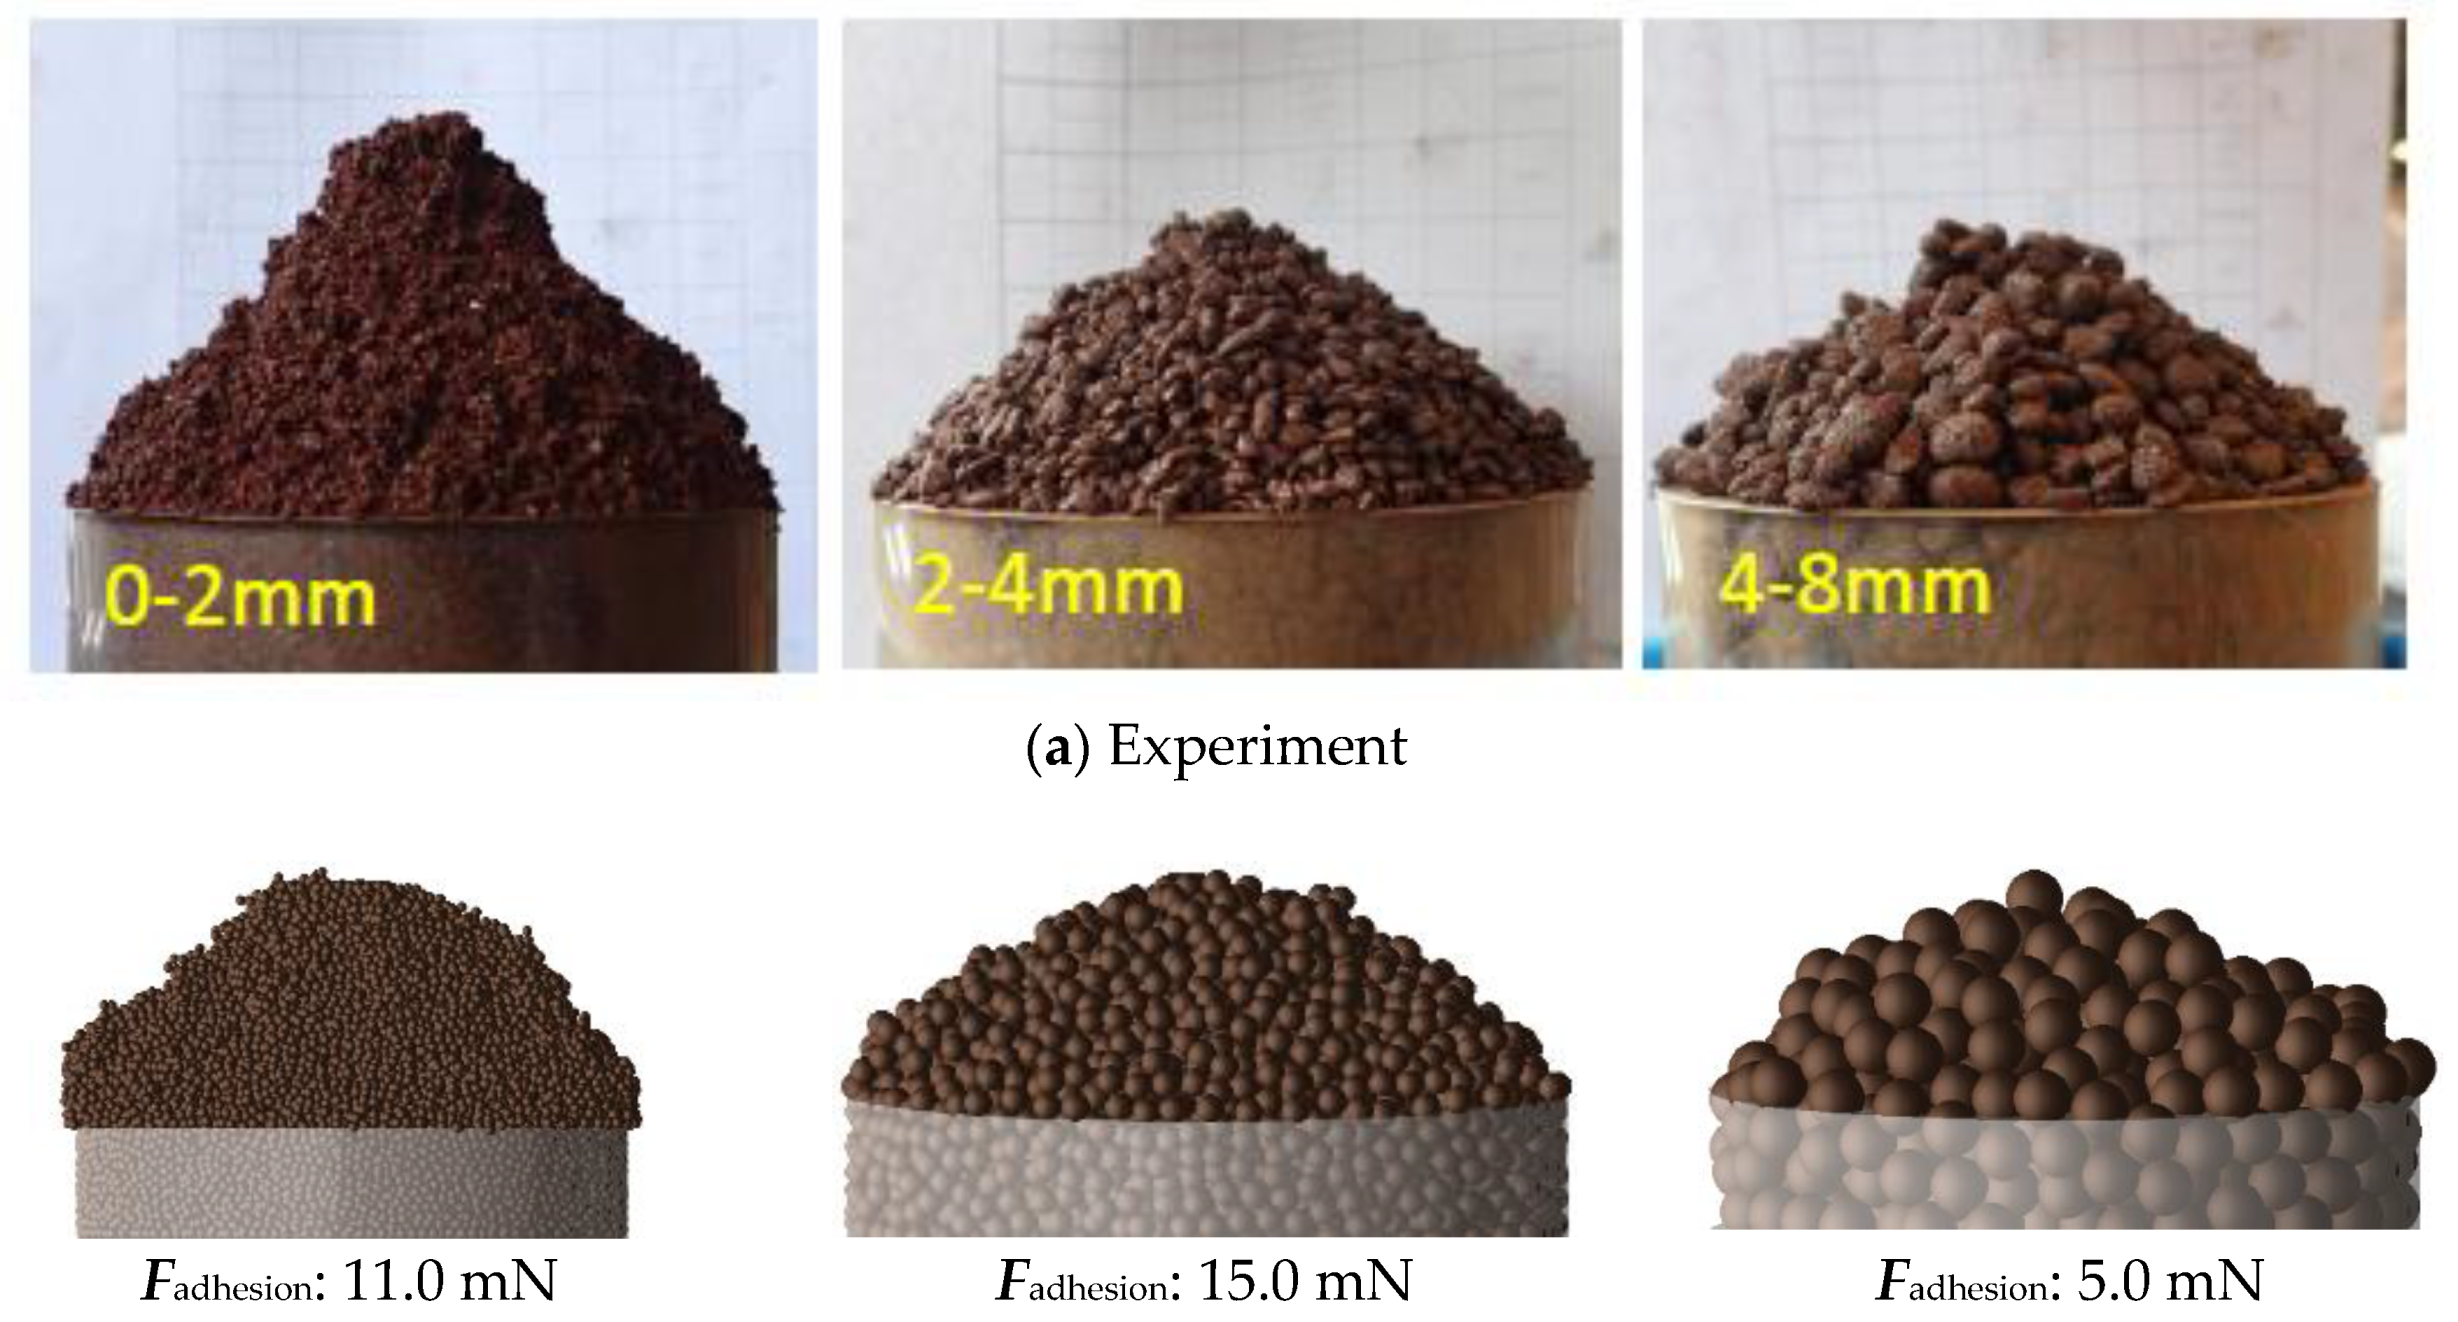
Figure 2a shows the snapshots of the angle of repose measured in the experiment.
Table 1 shows the measured values. The smaller the particle size, the greater the angle of repose.

2.4. Simulation of the Test of Angle of Repose

A search for simulation parameters that reproduced the angle of repose obtained in the experiment was performed. The friction coefficients and the rolling friction coefficients used in previous studies [23] were used to investigate the effect of varying the value of the adhesion force on the angle of repose. Although the actual sinter feed has a particle size distribution, three representative particles sizes were used in the simulation to reduce the calculation load. In other word, 0–2 mm in the experiment was represented by 2 mm particles, 2–4 mm by 4 mm particles, and 4–8 mm by 8 mm particles. The simulation conditions are shown in Table 2. Figure 2b shows the calculation results of both the snapshots and the relationship between adhesion force and angle of repose for each particle size. In the case of 2 and 4 mm particle size, the angle of repose increased with the increase in adhesion force. The angle of repose was almost constant for the particle size of 8 mm, regardless of the adhesion force. This is because the smaller the particle size, the smaller the mass of particle, and the greater the effect of the adhesion force. The experimental and calculated values of angle of repose were in agreement with each other in the adhesion force of 12 mN for all particle sizes. This result shows that the kinetic behavior of the sinter feed can be described by applying the same adhesion force regardless of particle size. The angle of repose of the sinter feed in the wet state was reproduced by setting the adhesion force appropriately.

3. Results

Analysis of the Effect of Ventilation Bars on the Packing Structure

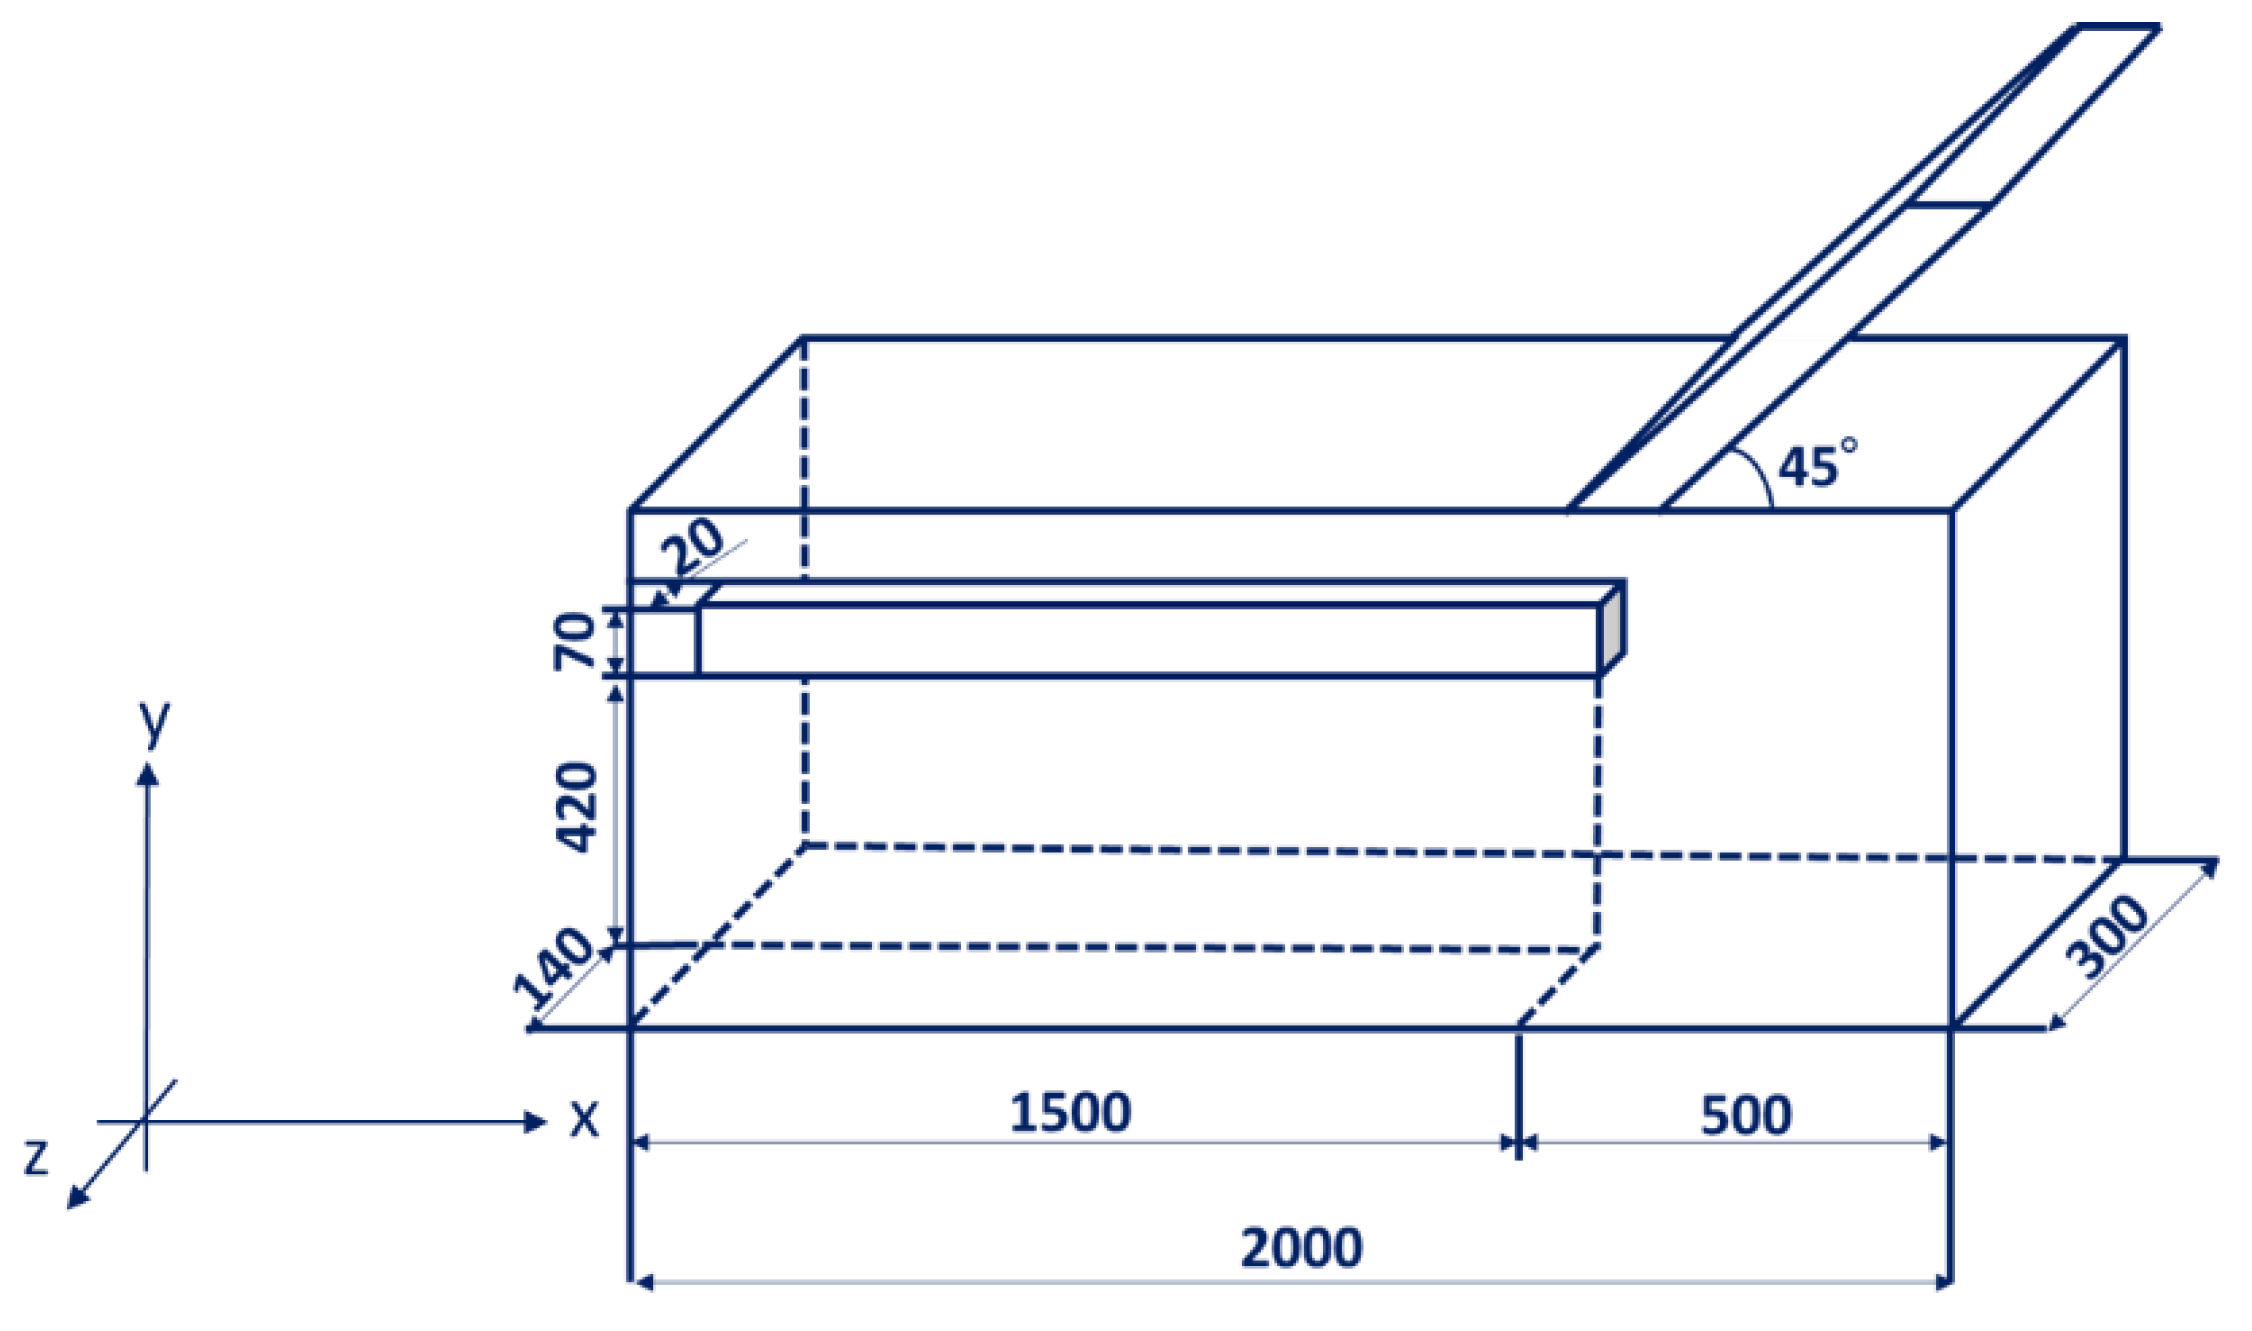
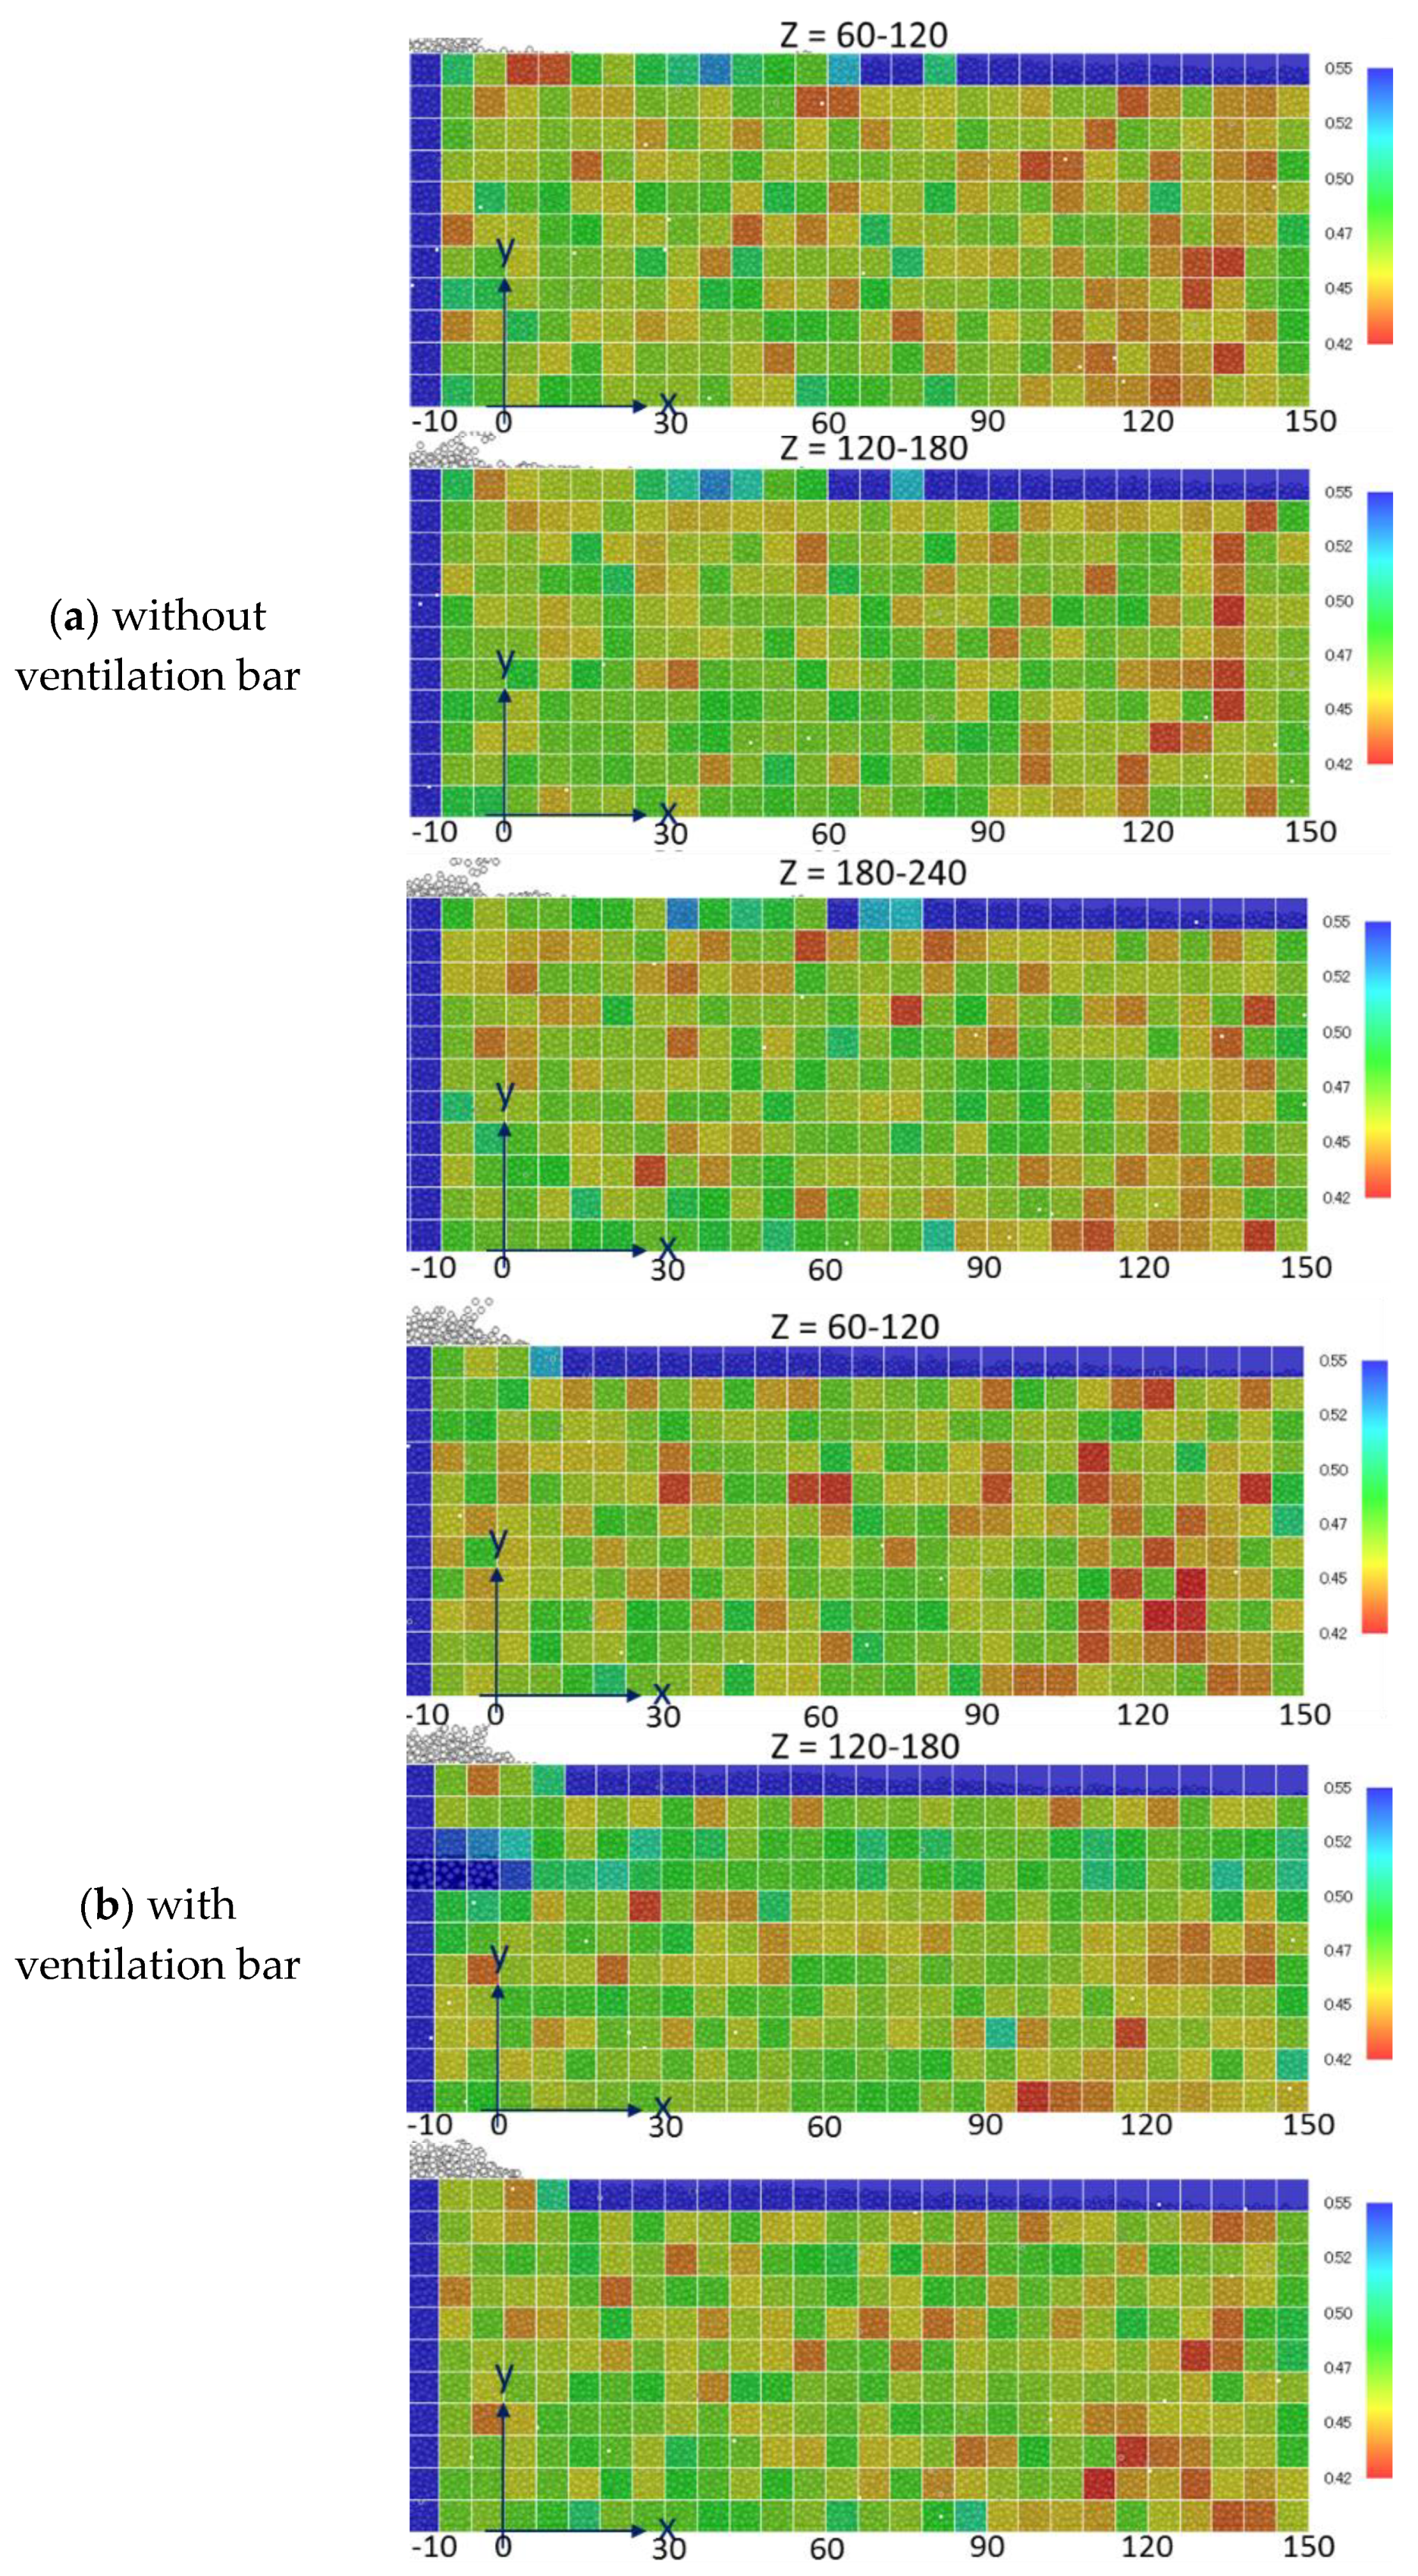
Since it was confirmed that the simulation could reproduce the sinter feed behavior, the effect of ventilation bars on the packing structure of the sinter bed was analyzed. Figure 3 shows a schematic diagram of the charging apparatus. The width of the calculation area was 300 mm, and a 70 × 20 mm rectangular ventilation bar was placed in the center of the area. It was installed at a height of 420 mm. The particles were generated continuously from the top of the chute and charged into the sintering machine through the chute inclined at 45°. The bottom was initially stopped, and after the particles were stacked to a height of 630 mm, the bottom moved at 31.8 mm/s in the positive direction of the X axis. The simulation parameters were set to the same values determined in the previous section; however, a particle diameter of 16 mm was used to reduce the calculation load. The wall in the Z direction was assumed to have a friction coefficient of zero, which does not interfere with the movement near the wall. Figure 4 shows the simulation results of the packing structure after the movement of the bottom wall for a certain time in each case with and without ventilation bars. The color of the particles changed from red to green to blue every second during generation, and the packing structure was visualized. In both cases, without and with the ventilation bar, a horizontally layered packing structure was formed at the right end of the packed bed. This is thought to be a packing structure formed when the bottom is not moving. On the other hand, an oblique layered packing structure was observed in the upper layer, while the lower layer had a highly random packing structure. The oblique packing structure is thought to be formed at the slope of the edge of the sinter bed. The periodic structure was disrupted by the ventilation bar; the packing structure was randomized in the region below the bar. The porosity was calculated by the sub-cell method in order to quantitatively evaluate the packing structure. In the sub-cell method, a unit cell with a certain inspection volume is divided into smaller sub-cells, and whether a particle is present or not in the sub-cell is determined by whether the center of the sub-cell is included in the particle. Here, the unit cell is a cube of 60 mm on a side, and the length of each sub-cell is 2 mm. The porosity is shown in Figure 5 without and with ventilation bars. (i), (ii) and (iii) represent the position in the z axis direction, respectively, and the center of the ventilation bar is located at z = 150.
In Figure 5, as the porosity increases, the color of the unit cell becomes blue, and as it decreases, its color becomes red. Figure 6 shows the porosity values at each position of the packed bed. In the cases without ventilation bars, porosity ranged from 0.44 to 0.48. On the other hand, in the cases that included ventilation bars, porosity increased in the region (ii) where the bar was present. It is necessary to experimentally confirm the validity of these calculation results. Previous experimental studies have reported that installing ventilation bars increases porosity by about 1.2 times compared to without bars [26]. The calculated porosities in this study are distributed from 0.48 to 0.56 in the region with bars, which is roughly consistent with the values reported in the experiment. Note, in the refereed papers, that porosity is calculated from the permeability of the sinter bed. It is difficult to measure porosity directly by experiment, and it is considered a challenge.

4. Discussion

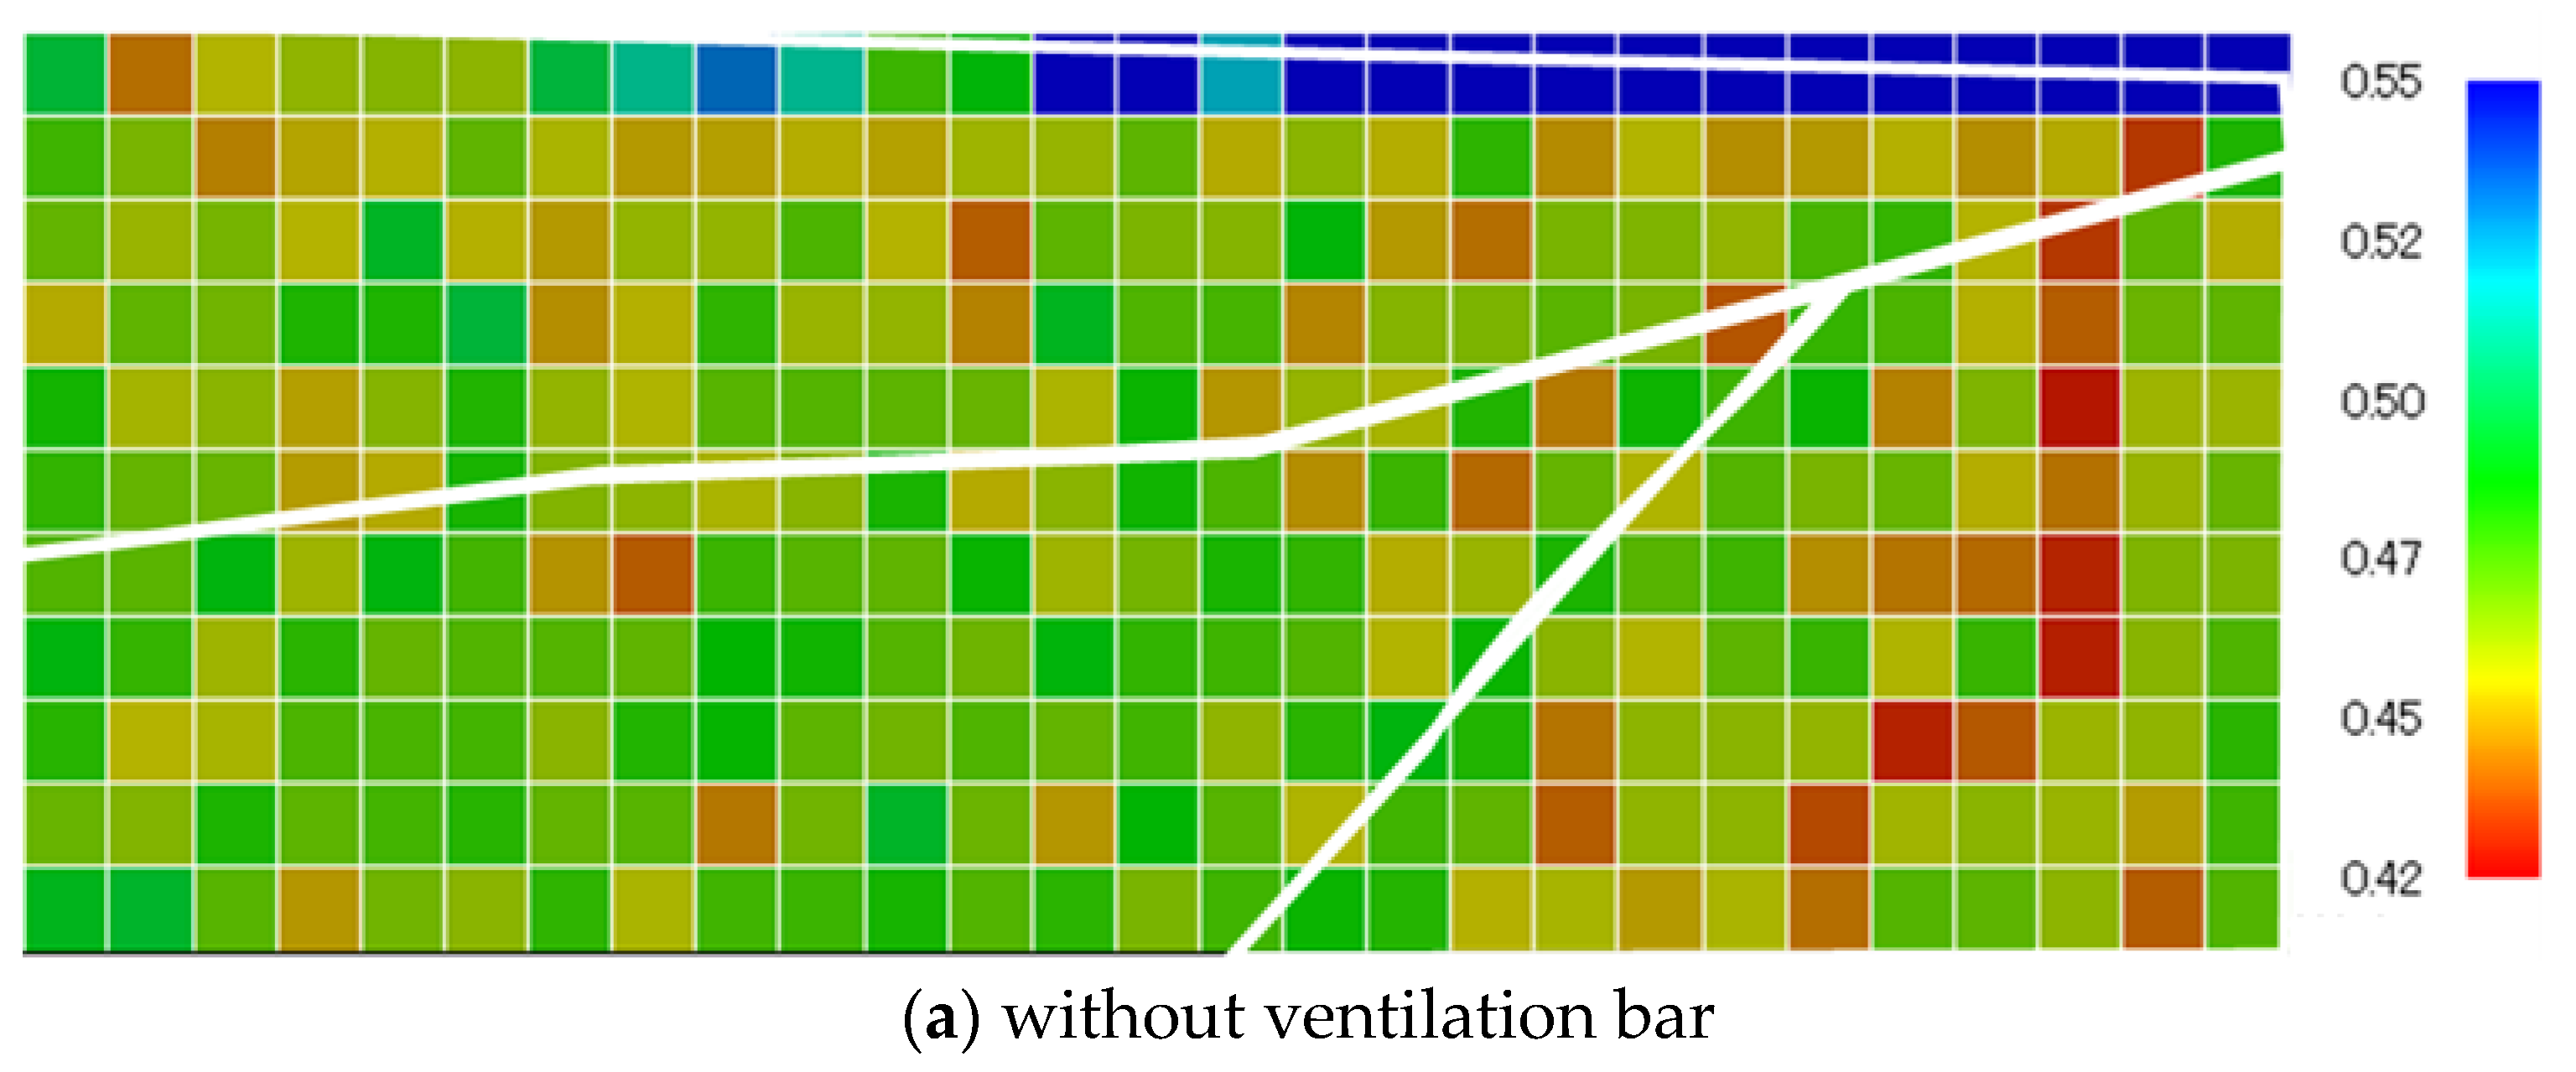
Figure 7 shows the regions where characteristic packing structure was observed in the cases without and with ventilation bars, separated by white lines, respectively. The boundaries of each region are shown as a guide to where the porosity trend changes. In the case without a ventilation bar, the porosity is relatively small in the lower right region. This is the region where the structure of the particles was charged while the bottom wall was stationary. In the lower left region, the porosity tends to be higher than in other regions. This is the region where the movement of the bottom wall caused a random structure. In the upper region, the porosity is about at the middle between the other two regions.
In general, it is known that a sliding line is generated in the powder layer when it flows. Shear stress due to powder pressure concentrates in the vicinity of the shear line, which causes the powder to expand during flow. In other words, when the powder pressure is high and the expansion occurs at the slip line, the porosity is considered to be increasing. In the lower right region of Figure 7a, the flow due to shear stress did not occur, because the initial packing structure was maintained and was moving parallel. Therefore, it is assumed that expansion at the slip line did not occur, and the porosity is considered to be reduced. A random structure was observed in the lower left region, suggesting that the charged particles were flowing and moving while disrupting the packing structure. The presence of flow due to shear stress is evidence of expansion at the slip line; as a result the porosity increased. In the upper region, the amount of expansion due to shear flow is lower than in the lower region, because the powder pressure due to deposition is lower. The porosity is lower than that of the lower region. In the case with a ventilation bar, the bar reduces the powder pressure of the lower region near the ventilation bars; thus the porosity is relatively low. To summarize, in the case of shear flow, the higher the powder pressure during flow, the higher the porosity. The expansion of the powder near the slip line and the increase in the porosity were also observed during particle ejection from the hopper [28]. One of the characteristic behaviors of the powders is confirmed here as well.

5. Conclusions

In this paper, the effect of ventilation bars on the packing structure of a sinter bed is analyzed by DEM simulation. From the comparison of the angle of repose, the simulation parameters representing the actual sinter feed behavior were determined. Sinter feed charging simulations were performed with and without a ventilation bar, and the mechanism of the formation of the packing structure and the cause of the porosity distribution were discussed. The results obtained show that when shear flow occurs, the higher the powder pressure, the higher the porosity. These results are consistent with the porosity distribution in each region of the sinter bed when the ventilation bar is installed.

Author Contributions

Writing—Original Draft Preparation, S.I.; Software, K.K. and S.I.; Investigation, K.K.; Supervision, J.K. All authors have read and agreed to the published version of the manuscript.

Funding

This research received no external funding.

Acknowledgments

The authors wish to thank NIPPON STEEL CORPORATION for providing samples and technological support.

Conflicts of Interest

The authors declare no conflict of interest.

References

  1. Kasama, S.; Inazumi, T.; Nakayasu, T. New Analysis Method of Sinter Cake Pore Structure for Permeability Evaluation. ISIJ Int. 1994, 34, 562–569. [Google Scholar] [CrossRef]
  2. Higuchi, K.; Kawaguchi, T.; Kobayashi, M.; Hosotani, Y.; Nakamura, K.; Iwamoto, K.; Fujimoto, M. Improvement of productivity by stand-support sintering in commercial sintering machines. ISIJ Int. 2000, 40, 1188–1194. [Google Scholar] [CrossRef]
  3. Iwami, Y.; Yamamoto, T.; Oyama, N.; Matsuno, H.; Saito, N.; Nakashima, K. Improvement of Sinter Productivity by Control of Magnetite Ore Segregation in Sintering Bed. ISIJ Int. 2018, 58, 2200–2209. [Google Scholar] [CrossRef]
  4. Ichikawa, K.; Ishii, J.; Watakabe, S.; Sato, M. Quantitative Estimation of Gas Permeability of Softening Sinter Layer with Liquid Phase. ISIJ Int. 2015, 55, 544–551. [Google Scholar] [CrossRef] [Green Version]
  5. Ngo, I.L.; Byon, C. Permeability of microporous wicks with geometric inverse to sintered particles. Int. J. Heat Mass Transf. 2016, 92, 298–302. [Google Scholar] [CrossRef]
  6. Nyembwe, A.M.; Cromarty, R.D.; Garbers-Craig, A.M. Relationship Between Iron Ore Granulation Mechanisms, Granule Shapes, and Sinter Bed Permeability. Miner. Process. Extr. Metall. Rev. 2017, 38, 388–402. [Google Scholar] [CrossRef]
  7. Li, C.Z.; Honeyands, T.; O’Dea, D.; Moreno-Atanasio, R. The angle of repose and size segregation of iron ore granules: DEM analysis and experimental investigation. Powder Technol. 2017, 320, 257–272. [Google Scholar] [CrossRef]
  8. Li, C.Z.; Honeyands, T.; O’Dea, D.; Moreno-Atanasio, R. DEM study on size segregation and voidage distribution in green bed formed on iron ore sinter strand. Powder Technol. 2019, 356, 778–789. [Google Scholar] [CrossRef]
  9. Fukami, K.; Itaya, H.; Aratani, F.; Nakanishi, K.; Nishimura, H. A Study on the Particle-Size Segregation in the Sintering Bed Formed at the Feeding Stage of A Sinter Machine. Tetsu Hagane 1985, 71, 1888–1894. [Google Scholar] [CrossRef] [Green Version]
  10. Cundall, P.A.; Strack, O.D.L. Discrete Numerical-Model for Granular Assemblies. Geotechnique 1979, 29, 47–65. [Google Scholar] [CrossRef]
  11. Chen, H.; Wei, Q.S.; Wen, S.F.; Li, Z.W.; Shi, Y.S. Flow behavior of powder particles in layering process of selective laser melting: Numerical modeling and experimental verification based on discrete element method. Int. J. Mach. Tools Manuf. 2017, 123, 146–159. [Google Scholar] [CrossRef]
  12. Chen, H.; Chen, Y.X.; Liu, Y.; Wei, Q.S.; Shi, Y.S.; Yan, W.T. Packing quality of powder layer during counter-rolling-type powder spreading process in additive manufacturing. Int. J. Mach. Tools Manuf. 2020, 153. [Google Scholar] [CrossRef]
  13. Chen, H.; Wei, Q.S.; Zhang, Y.J.; Chen, F.; Shi, Y.S.; Yan, W.T. Powder-spreading mechanisms in powder-bed-based additive manufacturing: Experiments and computational modeling. Acta Mater. 2019, 179, 158–171. [Google Scholar] [CrossRef]
  14. Ishihara, S.; Kano, J. ADEM Simulation for Analysis of Particle Breakage of Irregular Shaped Particles. ISIJ Int. 2019, 59, 820–827. [Google Scholar] [CrossRef] [Green Version]
  15. Natsui, S.; Ishihara, S.; Kon, T.; Ohno, K.; Nogami, H. Detailed modelling of packed-bed gas clogging due to thermal-softening of iron ore by Eulerian-Lagrangian approach. Chem. Eng. J. 2020, 392. [Google Scholar] [CrossRef]
  16. Ishihara, S.; Kano, J. Development of ADEM-SPH coupling model for analysis of solid to liquid phase transition behaviors. ISIJ Int. 2020, 60, 1469–1478. [Google Scholar] [CrossRef]
  17. Kon, T.; Natsui, S.; Ueda, S.; Nogami, H. Analysis of Effect of Packed Bed Structure on Liquid Flow in Packed Bed Using Moving Particle Semi-implicit Method. ISIJ Int. 2015, 55, 1284–1290. [Google Scholar] [CrossRef] [Green Version]
  18. Kurosawa, H.; Matsuhashi, S.; Natsui, S.; Kon, T.; Ueda, S.; Inoue, R.; Ariyama, T. DEM-CFD Model Considering Softening Behavior of Ore Particles in Cohesive Zone and Gas Flow Analysis at Low Coke Rate in Blast Furnace. ISIJ Int. 2012, 52, 1010–1017. [Google Scholar] [CrossRef] [Green Version]
  19. Natsui, S.; Ohno, K.; Sukenaga, S.; Kikuchi, T.; Suzuki, R.O. Detailed Modeling of Melt Dripping in Coke Bed by DEM—SPH. ISIJ Int. 2018, 58, 282–291. [Google Scholar] [CrossRef]
  20. Natsui, S.; Ueda, S.; Nogami, H.; Kano, J.; Inoue, R.; Ariyama, T. Penetration Effect of Injected Gas at Shaft Gas Injection in Blast Furnace Analyzed by Hybrid Model of DEM-CFD. ISIJ Int. 2011, 51, 1410–1417. [Google Scholar] [CrossRef] [Green Version]
  21. Natsui, S.; Ueda, S.; Fan, Z.Y.; Kano, J.; Inoue, R.; Ariyama, T. Sensitivity Analysis of Physical Parameters in Discrete Element Method Compared with Blast Furnace Cold Model Experiments. Tetsu Hagane 2010, 96, 1–10. [Google Scholar] [CrossRef]
  22. Natsui, S.; Nogami, H.; Ueda, S.; Kano, J.; Inoue, R.; Ariyama, T. Simultaneous Three-dimensional Analysis of Gas-Solid Flow in Blast Furnace by Combining Discrete Element Method and Computational Fluid Dynamics. ISIJ Int. 2011, 51, 41–50. [Google Scholar] [CrossRef]
  23. Nakano, M.; Abe, T.; Kano, J.; Kunitomo, K. DEM Analysis on Size Segregation in Feed Bed of Sintering Machine. ISIJ Int. 2012, 52, 1559–1564. [Google Scholar] [CrossRef] [Green Version]
  24. Honorato, E.P.; Seshadri, V. Granulometric optimisation of raw materials for ISF continuous segregation system in Usiminas’ sintering plants. Ironmak. Steelmak. 2008, 35, 405–415. [Google Scholar] [CrossRef]
  25. Oyama, N.; Igawa, K.; Nushiro, K.; Ida, M.; Fujii, N. Effects of the magnetic field exerted on the plate type feeder on the void fraction in the sintering bed and sinter productivity. Tetsu Hagane 2000, 86, 309–314. [Google Scholar] [CrossRef]
  26. Nushiro, K.; Konishi, Y.; Igawa, K.; Takihira, K.; Fujii, N. Formation of the vertical slits in the lower part of a sintering bed and their effect on sintering. Tetsu Hagane 1997, 83, 413–418. [Google Scholar] [CrossRef] [Green Version]
  27. Ishihara, S.; Soda, R.; Zhang, Q.W.; Kano, J. DEM Simulation of Collapse Phenomena of Packed Bed of Raw Materials for Iron Ore Sinter during Charging. ISIJ Int. 2013, 53, 1555–1560. [Google Scholar] [CrossRef] [Green Version]
  28. Zhu, H.P.; Zhou, Z.Y.; Yang, R.Y.; Yu, A.B. Discrete particle simulation of particulate systems: A review of major applications and findings. Chem. Eng. Sci. 2008, 63, 5728–5770. [Google Scholar] [CrossRef]
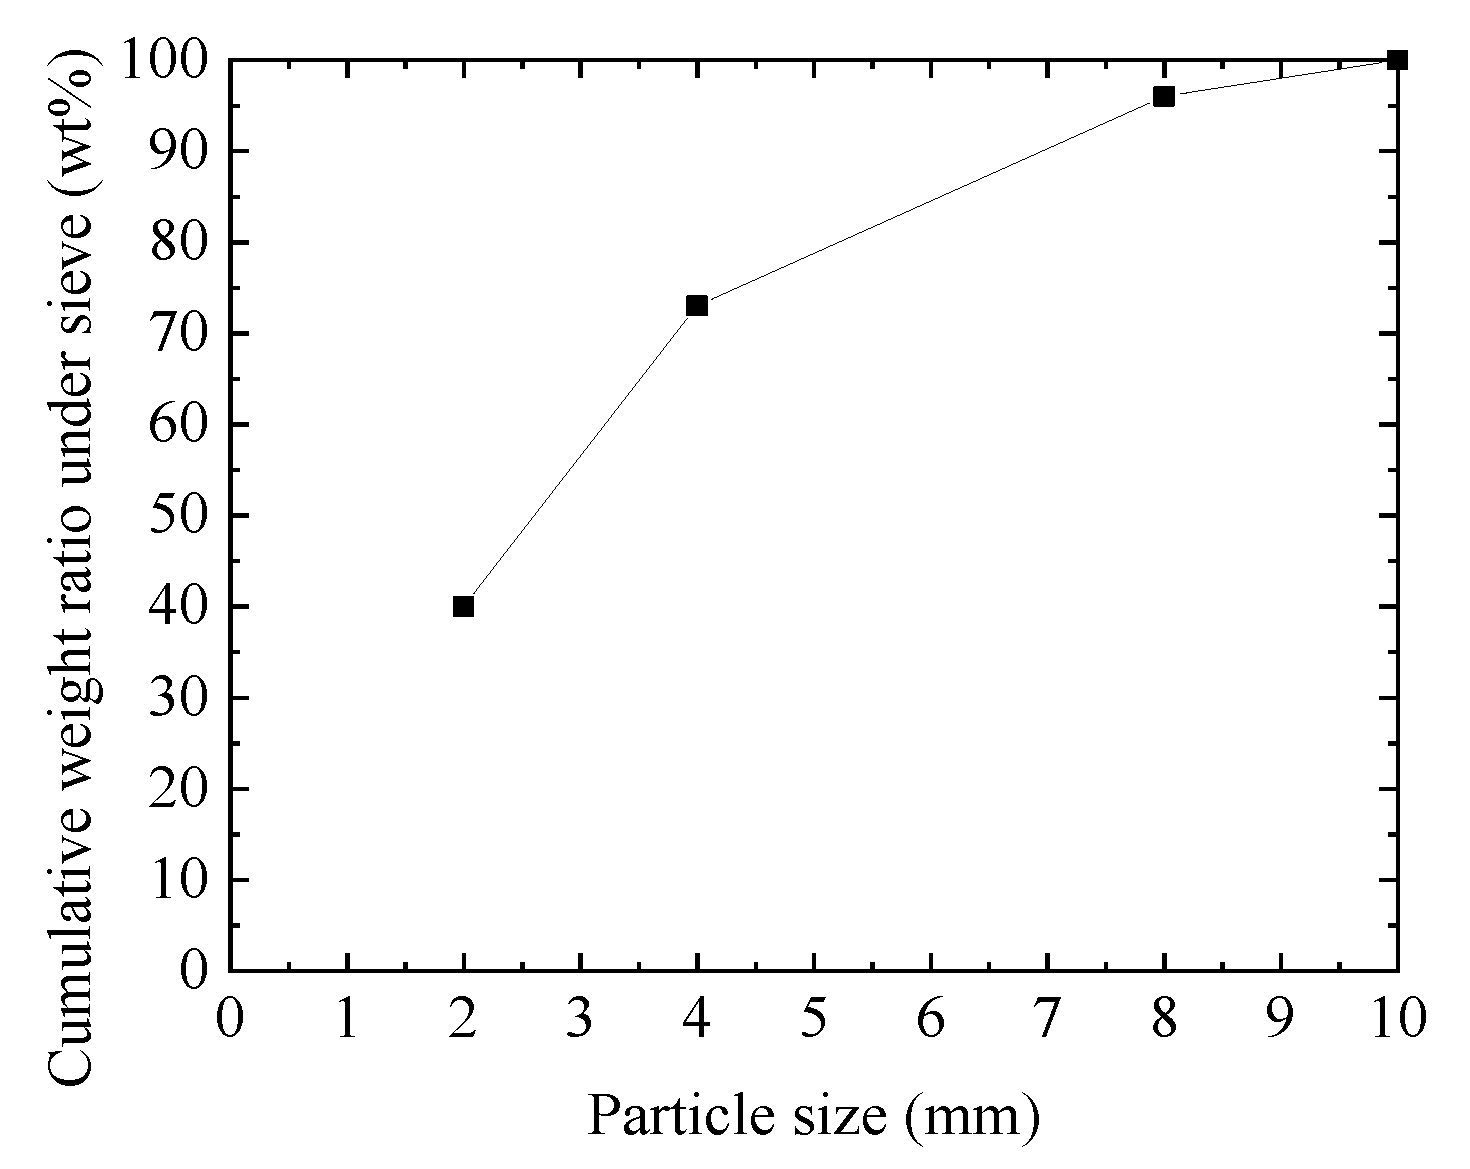
Figure 1. Particle size distribution of sinter feed.
Energies 13 03836 g001
Figure 2. Snapshots of the angle of repose test results: (a) experiment, (b) simulation.
Energies 13 03836 g002aEnergies 13 03836 g002b
Figure 3. Schematic diagram of charging apparatus for discrete element method (DEM).
Energies 13 03836 g003
Figure 4. Packing structures of sinter bed (a) without and (b) with ventilation bar. The particles were continuously generated on the chute and periodically colored red, green, and blue.
Energies 13 03836 g004aEnergies 13 03836 g004b
Figure 5. The influence of ventilation bar on the porosity of the packed bed.
Energies 13 03836 g005
Figure 6. The porosity at each position of the packed bed.
Energies 13 03836 g006aEnergies 13 03836 g006b
Figure 7. Classification of packing structures with different characteristics in the sinter bed: (a) without, (b) with ventilation bar.
Energies 13 03836 g007aEnergies 13 03836 g007b
Table 1. Experimental results of angle of repose.
Particle SizeAngle of Repose
n = 1n = 2Average
0–248.348.548.4
2–436.536.536.5
4–835.932.534.2
Table 2. Simulation conditions for the test of angle of repose.
ParametersUnitValue
Particle diametermm2, 4, 8
Friction coefficient-0.65
Rolling friction coefficient-4.0
Densitykg/m32500
Adhesion forcemN0–15