Article

A Mixed-Integer Nonlinear Programming Model for Optimal Reconfiguration of DC Distribution Feeders

by
O. D. Montoya
1,2,
W. Gil-González
3,
J. C. Hernández
4,*,
D. A. Giral-Ramírez
5 and
A. Medina-Quesada
4
1
Facultad de Ingeniería, Universidad Distrital Francisco José de Caldas, Bogotá D.C. 11021, Colombia
2
Laboratorio Inteligente de Energía, Universidad Tecnológica de Bolívar, Cartagena 131001, Colombia
3
Grupo GIIEN, Facultad de Ingeniería, Institución Universitaria Pascual Bravo, Campus Robledo, Medellín 050036, Colombia
4
Department of Electrical Engineering, University of Jaén, Campus Lagunillas s/n, Edificio A3, 23071 Jaén, Spain
5
Facultad Tecnológica, Universidad Distrital Francisco José de Caldas, Bogotá D.C. 11021, Colombia
*
Author to whom correspondence should be addressed.
Energies 2020, 13(17), 4440; https://doi.org/10.3390/en13174440
Submission received: 5 August 2020 / Revised: 21 August 2020 / Accepted: 25 August 2020 / Published: 27 August 2020
(This article belongs to the Special Issue Distribution Grids Modernization)

Abstract

:
This paper deals with the optimal reconfiguration problem of DC distribution networks by proposing a new mixed-integer nonlinear programming (MINLP) formulation. This MINLP model focuses on minimising the power losses in the distribution lines by reformulating the classical power balance equations through a branch-to-node incidence matrix. The general algebraic modelling system (GAMS) is chosen as a solution tool, showing in tutorial form the implementation of the proposed MINLP model in a 6-nodes test feeder with 10 candidate lines. The validation of the MINLP formulation is performed in two classical 10-nodes DC test feeders. These are typically used for power flow and optimal power flow analyses. Numerical results demonstrate that power losses are reduced by about 16 % when the optimal reconfiguration plan is found. The numerical validations are made in the GAMS software licensed by Universidad Tecnológica de Bolívar.

1. Introduction

Rapid advances in power electronics, i.e., conversion technologies, have transformed the classical distribution networks, where power comes from large scale generators interconnected through transmission grids to the substations, into modern electrical networks where interactions between generators and end-consumers have a place in the same voltage level (e.g., medium- or low-voltage distribution) [1,2,3]. These modern networks have been named as active distribution grids or smart grids, with these characteristics: (i) the large-scale integration of power electronic converters to interface renewable energy resources and battery energy storage systems [4], (ii) the possibility to be designed in AC, DC or hybrid configurations [5], (iii) the ability to work in microgrids that can be connected or disconnected from the main grid to manage its energy resources efficiently [6].
In the case of new distribution networks or extensions of the existing ones, the DC paradigm is an attractive alternative since these grids are easily controllable due to the simplification of the number of variables, i.e., the objective of control in these grids is the voltage profile provided in all the nodes of the networks [5,7,8]. This is because reactive power and frequency are concepts only applicable to AC distribution. In addition, DC networks present lower power losses and best voltage profiles (no inductive effect in steady-state conditions) since only active power is transported by the feeders, which is a remarkable advantage compared to classical AC networks [9].
The DC networks can be designed and operated using multiple renewable energy resources, such as photovoltaic panels [10], energy storage devices (batteries, supercapacitors or superconductors) [11], home appliances [12] and computer servers [13], among others. Observe that in the case of applications where AC energy is required (i.e., motors), this energy can be provided by interfacing the DC distribution network with voltage source inverters that generate sinusoidal voltages and the required reactive power at the load point [4]. The main advantage of using converters to interface AC loads is making them controllable, i.e., they can be added into the grid operation environment as active consumers that may or may not be dispatched inside of demand response plans [14]. Nevertheless, the implementation of DC networks for power distribution has some difficulties, such as high costs in the application of protection schemes [15,16], power electronic devices such as voltage source converters required to generate the voltage output [4] and high costs related to measuring devices [17], among others. Notice that these aspects must be taken into account when DC technologies are preferred over classical AC technology, for the electrical networks expansion in urban and rural areas in order to guarantee the return of investment in the planning period [17].
The DC paradigm distribution is definitely an option in modern power systems based on the advantages previously mentioned. In specialised literature during the last two decades, the DC networks have grabbed much attention, from large-scale to small-scale power applications (i.e., HVDC transmission networks and LVDC distribution applications) [5,18,19]. To analyse these grids, new power flow methods and optimal power flows strategies have been recently proposed based on exact and/or metaheuristic optimisation for the analysis under steady-state conditions [7,20]. The main characteristic of these analyses is that the topology of the DC networks has been considered as a fixed input of the problem [21]. Nevertheless, in real application cases, the DC grid configuration can be variable. Due to the high variation of the renewable energy resources, topology changes are needed to obtain the best performance of the network to efficiently meet the loads interconnected on it [22]. Based on this classical consideration, when DC grids are analysed, this research is motivated in presenting an alternative of analysis for DC distribution feeders taking into account changes in the DC grid structure to improve its operative efficiency. For this purpose, a new mathematical model for optimal reconfiguration of DC distribution networks is presented, based on a mixed-integer nonlinear formulation that selects the best subset of distribution lines that must be connected to provide energy to the end-consumers with the lowest power losses.
The problem of the optimal reconfiguration of electrical distribution networks has been largely explored in AC electrical networks with multiple optimisation approaches, most of them, based on metaheuristics, such as genetic algorithms [23], tabu search [24], particle swarm optimisation [25], ant colony [26] or modified culture search algorithm [27], and so on. Authors in [28] have proposed a multiobjective optimisation approach to solve the problem of the optimal reconfiguration in distribution networks simultaneously considering the optimal location and sizing of renewable energy sources based on wind and photovoltaic plants. As a solution technique, the strength Pareto evolutionary algorithm II has been proposed, which allows the obtaining of the optimal Pareto from between annual operation costs and the number of greenhouse emissions. Fuzzy set theory is used to select the best compromise solution among acquired Pareto set. Numerical results demonstrate the applicability and effectiveness of the proposed approach, mainly in the electrical networks feed by fossil sources. In [29], a metaheuristic approach named the salp swarm algorithm has been proposed to solve the problem of the optimal reconfiguration problem in distribution networks considering the optimal location and sizing of distribution generators simultaneously. Numerical results in two classical test feeders composed by 33 and 69 nodes demonstrate that the solution of this problem in the same stage is more efficient than the uncoupled approaches reported in the literature when the objective is to minimise the total grid losses and the voltage profile improvement. Authors of [30] have presented an optimal reconfiguration approach for distribution networks considering realistic time-varying load models and renewable energy resources in a simultaneous manner. As a solution technique, a multiobjective genetic algorithm is employed to minimise the total power losses and maximise the annual cost savings. Numerical results in the 33-node test feeder demonstrate efficiency and robustness compared to literature reports based on metaheuristics regarding Pareto front and processing times. In [31], an optimal reconfiguration approach has been proposed for active distribution networks. It is composed of multiple microgrids considering a daily economic dispatch environment as a function of the amount of renewable energy and energy storage availability. The main objective of the mathematical model presented is the minimisation of the total energy losses in the grid during its operation. The solution of this problem was to address a hybrid combination between conventional and selective particle swarm optimisation methods. Numerical results in the 33-node test feeder demonstrate the effectiveness and robustness of the proposed approach regarding processing times via parallel computing. In reference [32] has recently proposed an optimal reconfiguration approach in distribution networks in order to improve reliability indices and decrease the operational cost of power systems under a microgrid environment by considering electric vehicles and renewable energy. As a solution technique, an improved version has been proposed of the classical genetic algorithm, and all the numerical validations were made in the 33-node test feeder where the optimal reconfiguration plan optimises the grid operation (i.e., energy losses minimisation) when a shortage in renewables or electric vehicles are redispatched. Authors of [33] have presented a complete literature review about optimal reconfiguration approaches by offering the most typically objective functions and solution techniques with the main focus on the solution technique based on heuristic and metaheuristic optimisation approaches.
In the case of DC networks, the first approach reported in the literature was made in 2020 in [22] where the authors propose the optimal reconfiguration of low-voltage DC networks to maintain voltage profiles in an acceptable range. To represent the problem, these authors reformulate the MINLP model into an integer second-order cone programming formulation, which is solved through a branch and bound approach. It is worth mentioning that the work reported in [22] increases in a quadratic manner the number of variables required to represent the equivalent optimisation problem. This characteristic can increase the processing times with the additional need to use specialised software to achieve the optimal solution [34]. The combination of convex optimisation models, i.e., second-order cone programming to solve the conventional power flow, with branch and bound methods to deal with binary variables, can guarantee the optimal global solution of the relaxed optimisation model [35]. Nevertheless, in the final solution reported by the mixed-integer convex approximation, small estimation errors can be presented when these are evaluated in the exact MINLP model, mainly caused by the approximations employed in the optimal power flow problem [36,37]. Note that the main difference between our proposal and the work presented in [22] are (i) the use of power losses as an objective function by guaranteeing that all the voltage profiles are within allowable ranges and (ii) the use of our approach to reconfigure the DC network or can even be used to make technical studies regarding the optimal expansion of the DC network to provide electrical service to new potential users. The complete list of contributions of our approach is listed below.
The main contributions of this research regarding DC distribution can be summarised as follows:
The proposal of a new mathematical model that represents the problem of the optimal reconfiguration of DC distribution networks with an MINLP structure, taking into account the power balance equations as a function of the voltage profiles and the branch currents through an incidence branch-to-node incidence matrix.
The GAMS package presentation as a solution tool in a tutorial form that introduces bachelor engineering students and researchers in the modelling of mathematical optimisation problems. This is specially important because GAMS interface allows the implementation of MINLP models with the same compact structure of the symbolic model that represents the problem under study, which helps to learn about it (GAMS) in an intuitive way applying to all the areas related with mathematical optimisation.
The prospect to extend the proposed MINLP model to the optimal selection of routes in DC distribution networks in order to analyse future extensions of the existing DC networks or make projections for future distribution networks.
This research is framed within the active distribution network analysis, specifically in the DC distribution area, which presents a new MINLP model that represents the optimal reconfiguration problem in DC grids. In this sense, we concentrate our efforts on the representation of the technical operative aspects of the network, i.e., operational variables such as currents in lines, voltages at nodes and power losses. Thus, the proposed objective function is to minimise the total power losses caused by the distribution activity. Nevertheless, economic aspects, such as construction and maintenance of lines and cost of acquisition of power electronic interfaces are considered for future research. In addition, possible bipolar configurations of electrical DC distribution networks are not considered in this research. Nevertheless, as presented in [38], it will be possible to reformulate the proposed MINLP model to introduce these possible grid configurations that can originate fascinating and attractive future works to the scientific community.
The remainder of this document is structured as follows: Section 2 presents the mathematical formulation of the optimal reconfiguration problem in DC networks by highlighting the importance of the branch-to-node incidence matrix in this formulation. 
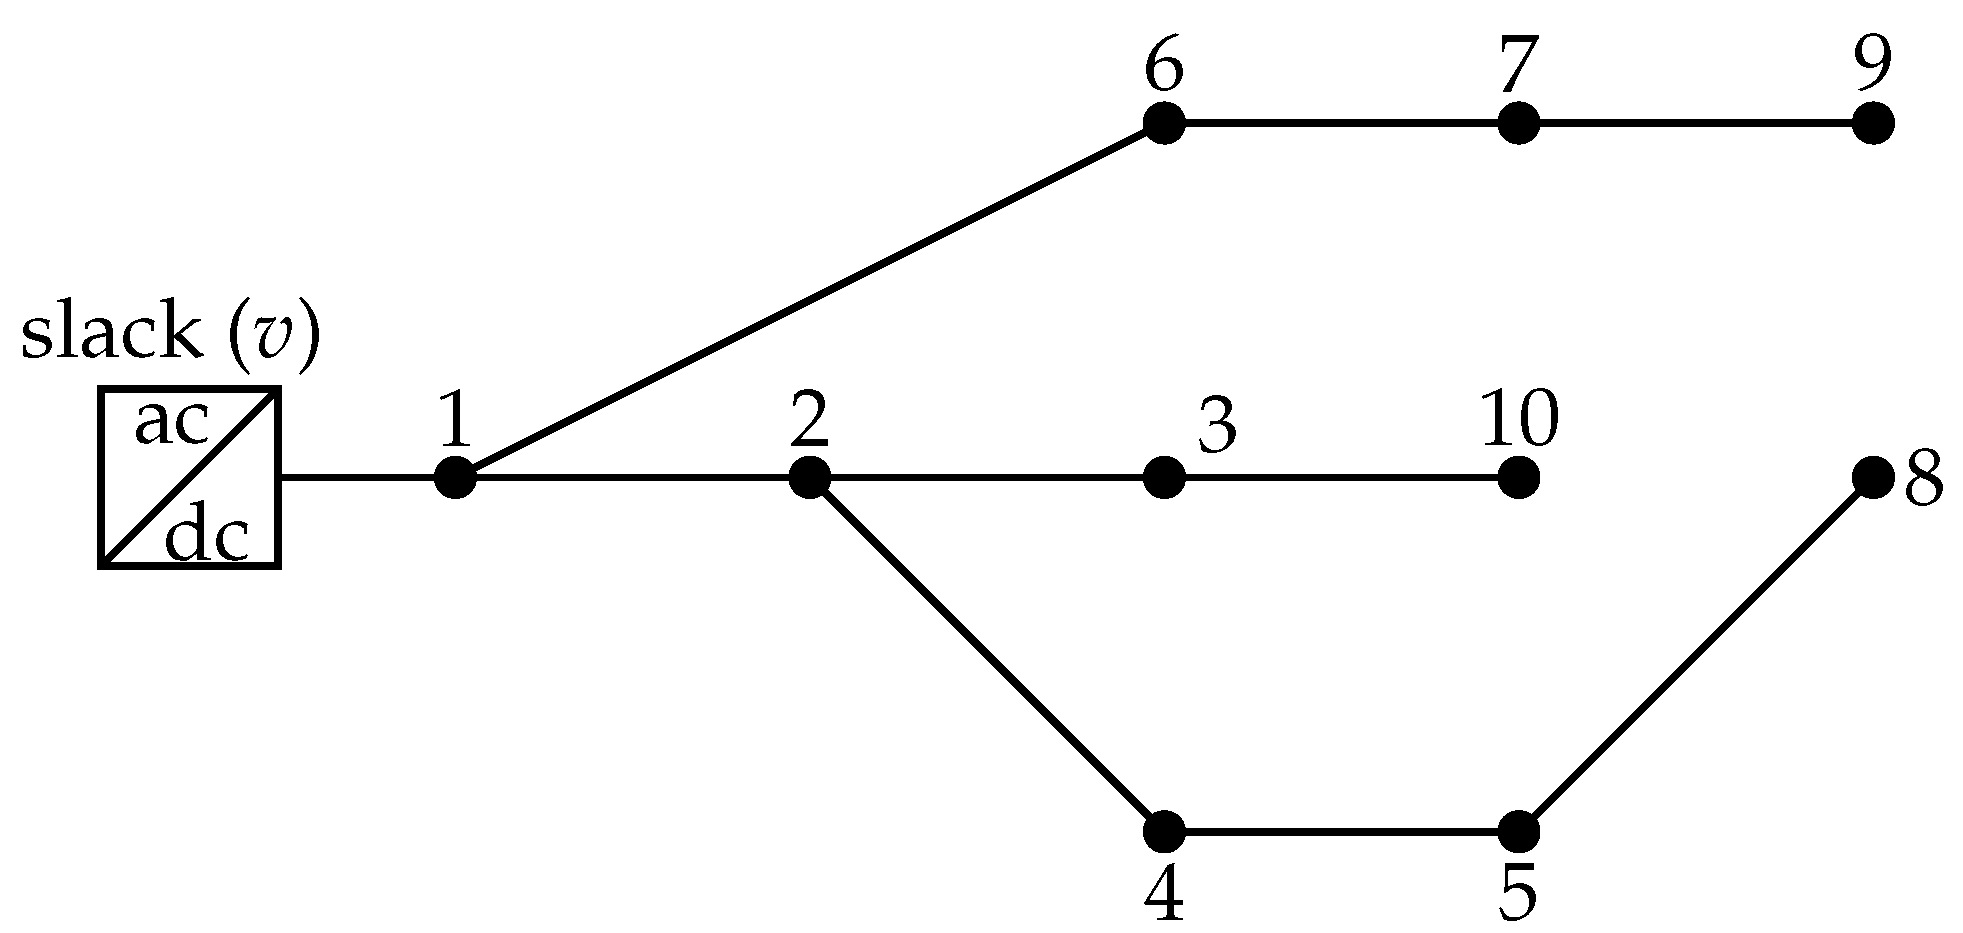
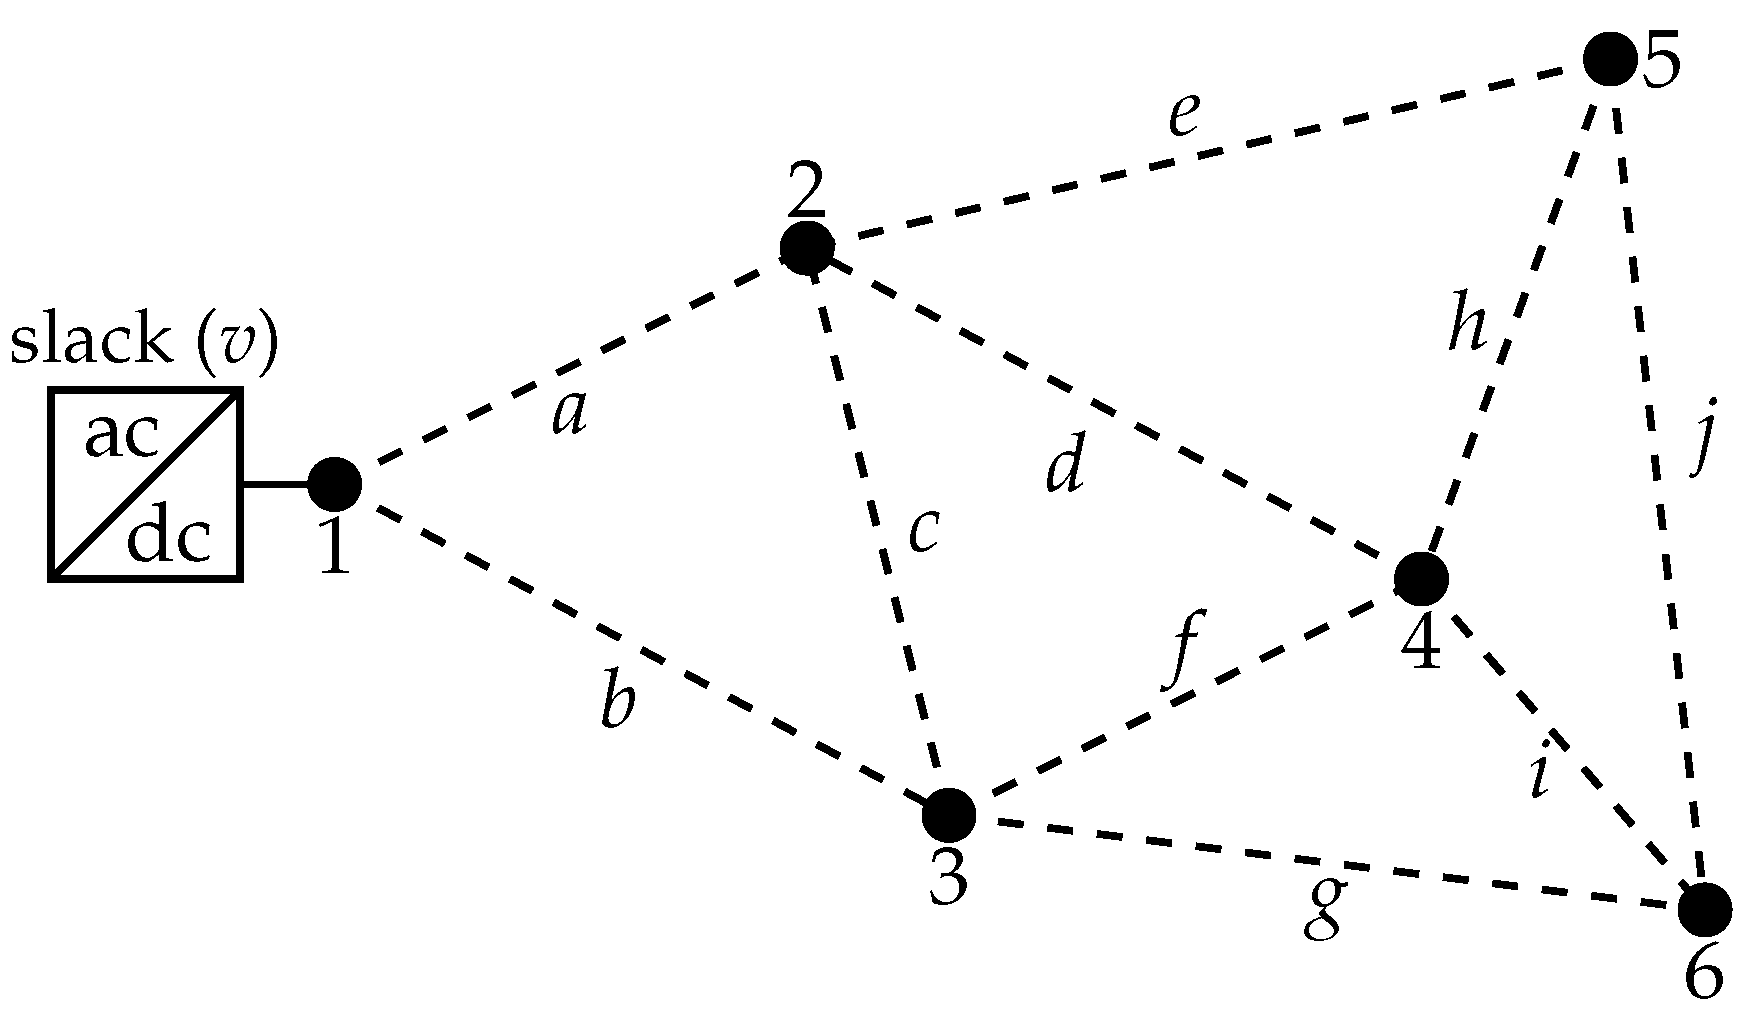
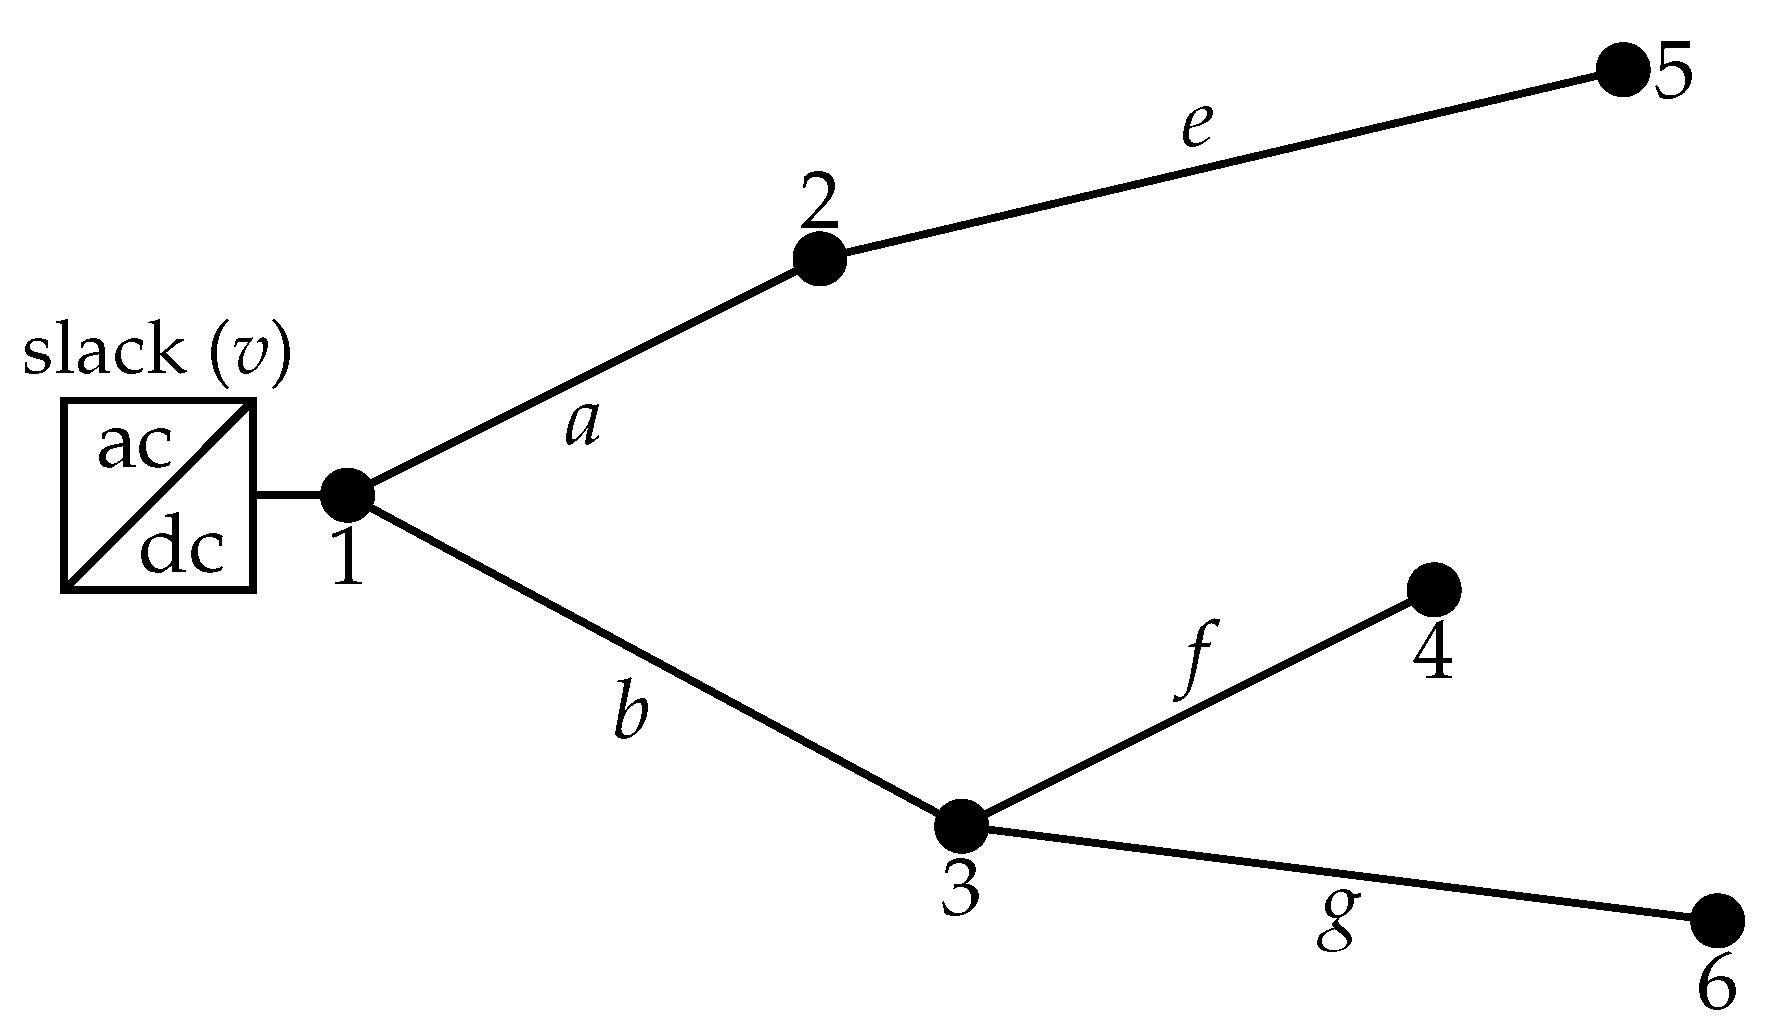
Section 3 presents the solution strategy based on the implementation of the MINLP model in the GAMS interface, using a tutorial sense with a small DC test feeder composed of 6 nodes and 10 candidate lines (this example offers the optimal selection of routes in DC distribution networks). 
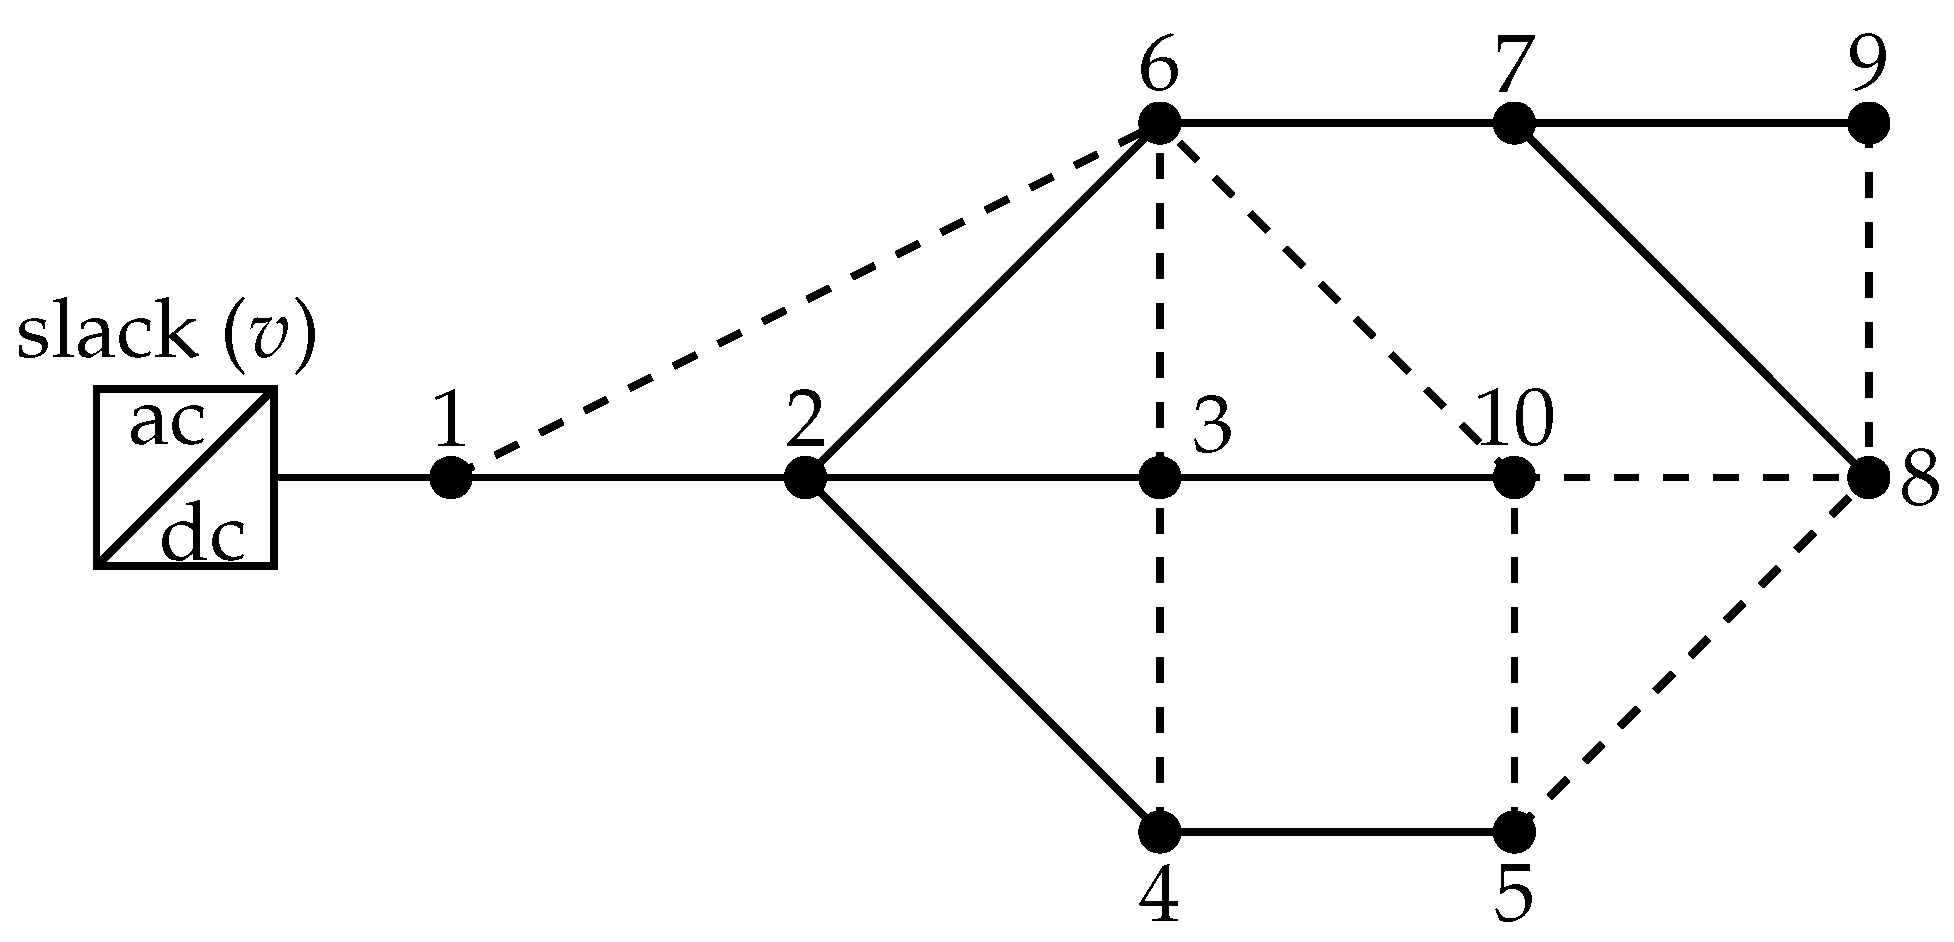
Section 4 describes the main features of the test systems used to validate the proposed MINLP model, which are composed of 10 and 21 nodes. These are classically used in power flow and optimal power flow analysis for DC networks. Section 5 presents the numerical results and their discussion by highlighting the main advantages of DC grids reconfiguration for power loss reduction and voltage profile improvements. Finally, Section 6 presents the main conclusions derived from this research and some possible future investigation lines.

2. Mathematical Formulation

The problem of the optimal reconfiguration in direct current networks can be represented as a mixed-integer nonlinear programming model based on the following facts: (i) the presence of binary variables regarding the selection of the branch l, i.e., x l , and (ii) the nonlinear relation between voltage and currents related to the power balance at each node of the network when constant power consumption is presented.
Remark 1.
The power balance equations in a dc network are typically formulated with nodal voltage variables when the interest is to solve optimal power flow problems or optimal location of shunt devices. Nevertheless, in the case of the optimal reconfiguration problem, the best representation of the problem is based on the currents flowing the branches. These currents allow to calculate the effect of the reconfiguration on the DC network, directly by modifying the resistive parameters in the distribution lines [39].
To develop the mathematical formulation of the reconfiguration problem in DC networks, let us define the branch-to-node incidence matrix as follows:
Definition 1 (Branch-to-node incidence matrix).
The branch-to-node incidence matrix A R b × n is a rectangular matrix composed of n columns associated with the nodes of the network and b rows related to the all branches of the network [40,41]. This matrix is filled by 1 , 0 , 1 based on the criteria presented in Equation (1)
A l k = 1 if e l = v k v m 1 if e l = v m v k 0 if v k e l ,
where e l is the unitary element that represents the line connection between vertices v k and v m on the graph that represents the electrical connection among nodes.
The branch-to-node incidence matrix presented in Definition 1 relates nodal injected currents to branch currents, allowing the transformation of the classical power balance equations formulated with voltages into a formulation that combines voltages and branch currents.
The complete mathematical model representing the problem of the optimal reconfiguration of DC distribution feeders is described as follows [39].
Objective function:
min p loss = l L r l i l 2 ,
where p loss corresponds to the objective function value associated to the total power losses in all branches of the DC system, r l is the resistive effect related to the branch l (The term resistive effect makes a reference to the physical opposition to the current flow that is intrinsically associated with real conductors due to their atomic composition, i.e., corresponds to the resistance value of the conductor at ambient temperature), and i l is the current that flows through this line.
Set of constraints:
p k g p k d = v k l L A l k i l , k N ,
i l = x l k N g l A l k v k , l L ,
l L x l = n n s ,
v min v k v max , k N ,
i l max i l i max , l l L ,
where p k g and p k d represent the power generation and power consumption at node k, v k is the voltage value in the node k, A l k is the component of the branch-to-node matrix that defines whether the node k and line l are connected, x l is the binary variable associated with the selection of the branch l in the reconfiguration plan, g l is the conductance value associated with the branch l, i.e., g l = 1 r l ; n represents the number of nodes and n s corresponds to the number of voltage controlled sources (i.e., slack nodes); v min and v max are the minimum and maximum voltage values permitted at the node k; i l max is the maximum current that is supported by the conductor associated to the branch l. Note that L and N are the sets that contain all the branches and nodes, respectively.
The interpretation of the mathematical model (2)–(7) is as follows: Equation (2) represents the objective function related to the minimisation of the power losses in all the conductors of the DC network. Expression (3) defines the power balance equation at each node, i.e., the application of the first Kirchhoff’s law and the first Tellegen’s theorem. Equation (4) determines the magnitude of the current that flows through the branch l, which is a function of the binary variable x l . Expression (5) determines the number of conductors that can be activated in the final configuration of the problem, added to (3) which is widely-known in specialised literature as the radial constraint [39]. Equation (6) is a type-box constraint that determines the voltage regulation bounds allowed in the DC network. Finally, Expression (7) determines the thermal capabilities of the conductor connected to the branch l.
Remark 2.
The solution of the optimisation model (2)–(7) is not an easy task, since it corresponds to a MINLP formulation, which is indeed an NP-hard optimisation problem [39]. For this reason, we select the general algebraic modelling (GAMS) as a solution methodology due to its excellent results reported in literature [42].
It is important to mention that in modern power systems, the most used devices to implement reconfiguration plans are the reclosers, since they can be operated in remote manner trough the SCADA system [43,44]. This implies that real-time reconfiguration plans can be programmed as a function of the grid and load conditions [22].

3. Solution Strategy

We employ the GAMS optimisation environment to solve the mathematical model associated with the optimal reconfiguration of DC distribution network. GAMS is focused on the mathematical model structure and not on the solution methodology. This feature makes GAMS an ideal alternative to introduce bachelor engineering students and researchers into the mathematical optimisation world.
We select the GAMS optimisation package as a solver since it has been employed mainly in mathematical optimisation, as reported in the scientific literature. Some of the problems solved with GAMS are optimal operation and allocation of batteries in AC and DC power systems [45,46], stability analysis in DC networks [47], the optimal location of distributed generators in AC and DC networks [8,42], optimal design of water distribution networks [48], optimal design of osmotic power plants [49], optimal design of thermoacoustic engines [50], optimal economic dispatch in thermal power systems [51], and optimal design of a standing wave thermoacoustic refrigerator [52], among others.
The main advantages of using GAMS software to solve optimisation problems are: (i) the usage of sets to define subindexes of variables to make a compact formulation of the mathematical problem under study. (ii) the organisation of the numerical information, i.e., constant parameters, vectors, and matrices, in tables as a function of the sets’ indexes. (iii) the definition of all the variables of the problem, i.e., continuous, binary and/or, discrete variables, and their maximum and minimum bounds. (iv) the definition of all the equations representing the mathematical structure of the problem in compact form, i.e., as a function of the sets previously defined. (v) the selection of the solution approach, i.e., maximisation or minimisation and the nature of the problem (e.g., linear programming, nonlinear programming, quadratic programming, mixed-integer nonlinear programming, and so on). 
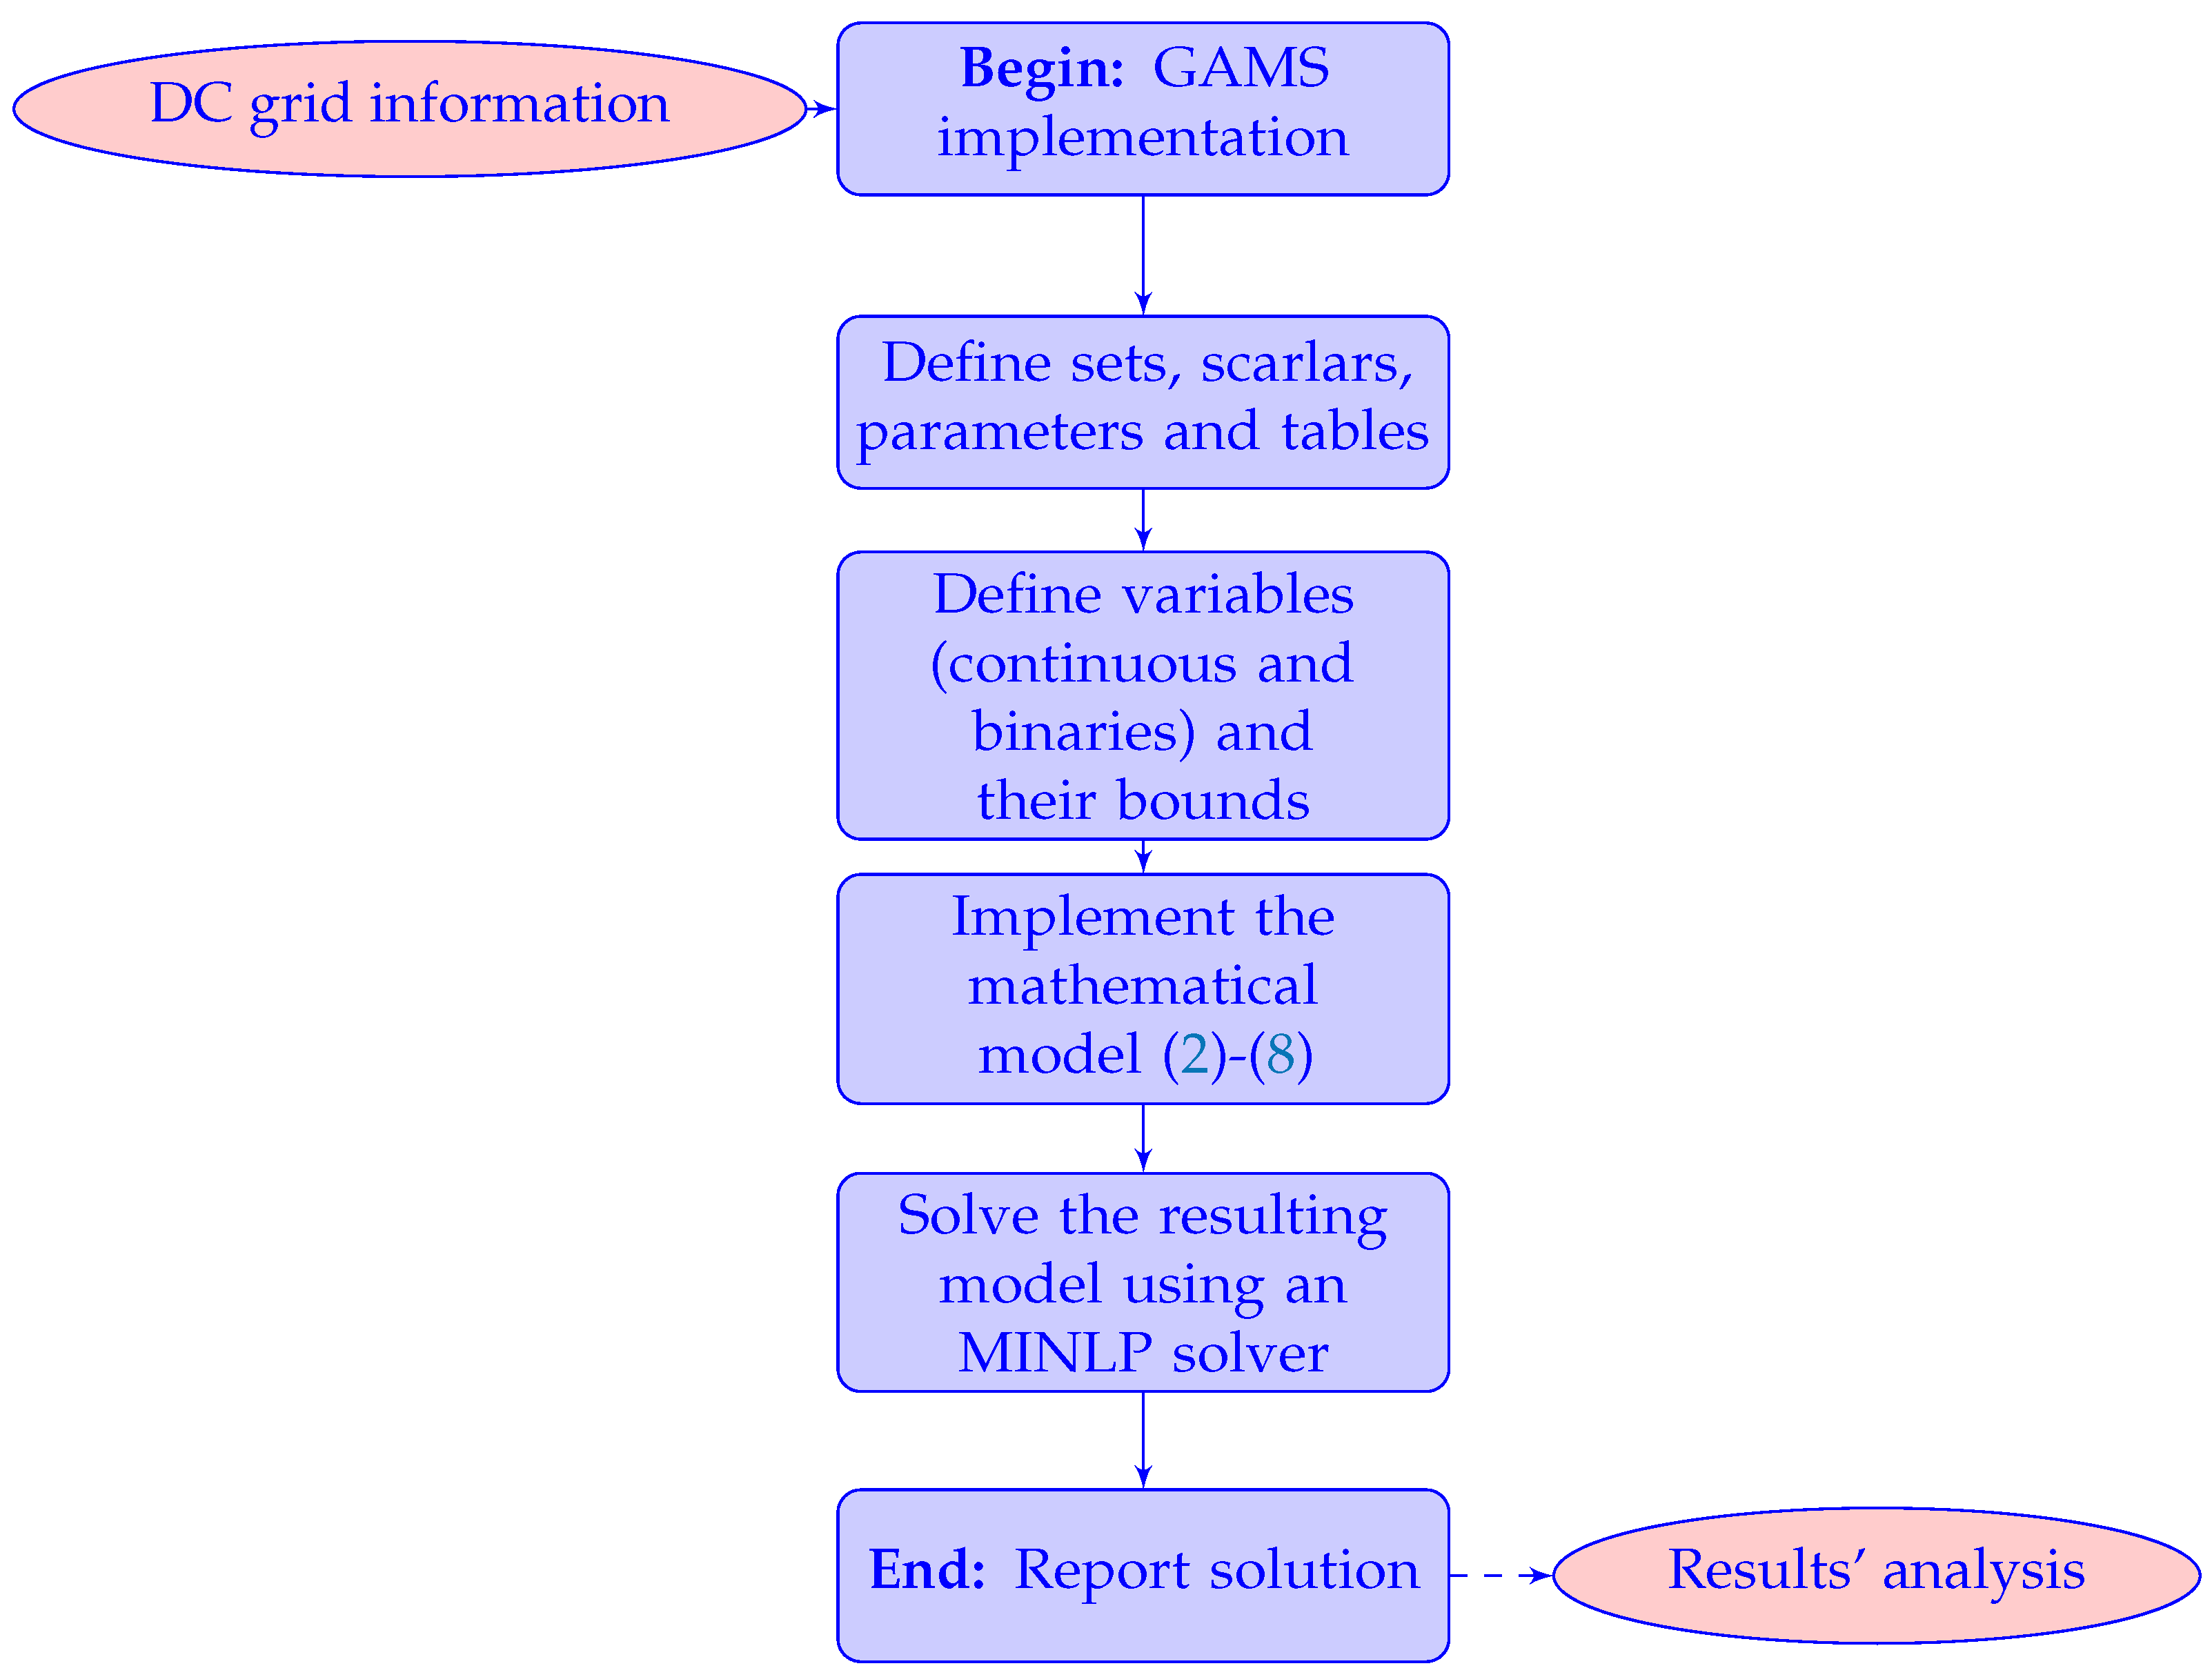
Appendix A illustrates an example of the implementation of mixed-integer nonlinear programming model that represents the problem of the optimal reconfiguration of DC grids [51]. In addition, in the flow chart presented in Figure 1, the main steps using the GAMS environment is presented. Note that this implementation is based on the general description of GAMS software reported in [46].

4. Test Systems

Two test feeders widely used in power flow and optimal power flow analysis are considered to validate the proposed MINLP formulation to reconfigure DC distribution networks. The first test feeder is composed of 10 nodes and the second one has 21 nodes. The complete information of both test feeders is described below.

4.1. 10-Nodes Test Feeder

The first test system corresponds to the 10-nodes LVDC microgrid proposed in [53]. The electrical configuration and the network parameters of this test system are shown in Figure 2 and Table 1, respectively. For this test system, the bases for power and voltage are 100 kW and 1 kV respectively, and the maximum current allowed in conductors is 5 pu.
The information of the links for possible reconfiguration of the 10-nodes test feeder is reported in Table 2.
In this test feeder, it is important to observe that constant resistive loads are connected at some nodes. Nevertheless, in the power balance constraint defined by (3), this was not initially considered, for this reason. Here, it is presented a soft modification to include the effect of the resistive loads as follows:
p k g p k d g k v k 2 = v k l L A l k i l , k N ,
where g k is the value of the load defined as a conductive parameter.

4.2. 23-Nodes Test Feeder

This test feeder corresponds to a medium voltage DC grid projected to be operated at the nominal voltage of the distribution network in Bogotá city (This is a fictitious network employed in this paper to validate the use of the MINLP proposed model for optimal reconfiguration (planning) of medium voltage DC networks), i.e., 11.40 kV which is composed by 12 nodes connected to the conversion station connected at node 1. This allows attending 6.54 MW of demand and 11 nodes projected to be connected to the existing test feeder by adding a new substation (node 21) with a total demand about 5.10 MW. The electrical configuration of the existent and new demands is depicted in Figure 3.
The information of the existing and projected lines is reported in Table 3, while information regarding existing and new loads is listed in Table 4.
Notice that in this test system for the existing configuration, there is 207.3193 kW with a minimum voltage value of 0.9438 pu at node 11.

5. Computational Validation

The implementation of the proposed mathematical model for optimal reconfiguration of DC distribution networks was performed in the GAMS optimisation package with the solver SBB in a desktop computer with an INTEL(R) Core(TM) i5–3550 3.5-GHz processor and 8 GB of RAM running a 64-bit version of Windows 7 Professional. All the numerical results in the 10- and 21-nodes test feeders are reported below.

5.1. 10-Nodes Test Feeder

The initial configuration of the 10-nodes test feeder is reported in Figure 2. Considering a voltage control at the substation of about 1 kV and the base power in 100 kW, initial power losses in all the conductors is of about 14.36 kW with the minimum voltage at the node 9 with a value of 968.96 V, i.e., 0.97 pu. Once the SBB solver is used in the GAMS interface to solve the reconfiguration problem in the 10-nodes test feeder, it is obtained the final configuration of this test feeder, as depicted in Figure 4.
Once this test feeder is reconfigured, the final power losses are 11.71 kW, which implies a grid reduction of about 18.45 % in comparison with the benchmark case. In addition, the lowest voltage value in the reconfigured system corresponds to the node 9 with a value of 973.10 V, i.e., 0.97 pu. The voltage profile comparison between the initial and the final configurations is presented in Figure 5. In this figure, we can observe an improvement of the voltage profiles at all the nodes when the reconfiguration plan is applied. This improvement is about 4 V at all the nodes (except in the substation which is always fixed).
Regarding currents in the conductors, we have for the initial configuration, a total current of 497.09 A flowing through the line that connects nodes 1 and 2, i.e., a loadability of 99.42 % . This implies that in the initial conditions, the loads in this test system cannot be increased since the conductor between nodes 1 and 2 is fully charged. When the reconfiguration plan is implemented, the same line is the most charged with a current flow of 375.04 A, which implies a loadability of 75.01 %. This is translated into a 24.41 % of release in the capacity of this feeder that can be used to transfer energy to new potential loads or possible increments in the existing ones.

5.2. Real-Time Reconfiguration Applications

To present the possibility of using the proposed MINLP model for optimal reconfiguration of DC distribution networks with real-time applications, we consider three possible load cases (LC) (Note that LC # means Load Case #) in the 10-nodes test feeder as presented in Figure 6 for each of the constant power consumption.
Note that the LC 1 is the peak load condition evaluated, defined in the Section 5.1 for the 10-nodes test feeder, while the LC 2 and LC 3 present two possible behaviours of the load nodes during a period of time under analysis. It is important to mention that in the literature, this load variation in distribution loads is typically separated by hours, which implies that if the reconfiguration plan is reached in seconds or few minutes, then, it will be suitable to be implemented through the SCADA system.
Table 5 presents the total energy losses for these three possible load cases considering optimal reconfiguration for each load condition and its comparison with the benchmark case, i.e., considering the original topology presented in Figure 2.
Notice that for each load scenario, the MINLP model is solved in GAMS with the SBB solver. A solution is reached that reduces the total power losses in the grid, by taking approximately 40 s to solve it. The time implies that each reconfiguration plan is suitable to be implemented in real load scenarios hours-based demand forecasting.
In Figure 7, it is shown where the optimal configuration topologies were reached by our proposed MINLP model in the load cases 2 and 3 respectively.
Observe that each electrical configuration for each load case is different when compared to all the load cases as can be seen in Figure 4 and Figure 7. This confirms that for each load condition there is an optimal combination of lines with a minimum power losses on the grid, that is suitable to be implemented by utilities if a complete communication system and set of reclosers are adequately disposed along the power grid, based on the concept of the real-time reconfiguration.

5.3. 23-Nodes Test Feeder

Note that in the case of the 23-nodes test feeder, we are only interested in illustrating our proposed MINLP model to evaluate possible expansion plannings in DC distribution networks; nevertheless, this example is purely illustrative since modifications regarding investments and operative costs must be added to the objective function to reach an adequate grid configuration plan as presented in [39] for the AC grids’ case.
In the case of the 23-nodes test feeder, we evaluate three expansion scenarios as follows: Scenario 1 (S1) the power expansion of the electrical network without the substation connected at node 23, Scenario 2 (S2) the possibility of injecting 2.50 MW without voltage control capabilities, i.e., the connection of a distributed generator, and Scenario 3 (S3) the possibility of controlling the voltage at node 23 (i.e., a new slack node).
Table 6 presents the results regarding power losses and the low voltage value for each simulation case.
From the results reported in Table 6, we can observe that:
The S1 corresponds to the worst simulation scenario regarding the final power losses since the unique power source is located at node 1. This implies that to provide energy to the new loads, there will be an increment on the current flows, producing higher power losses.
In the S2 the power losses are reduced respect to the S1 in about 77.06 kW, i.e., 16.17 % (Note that this percentage of reduction was calculated considering it as the benchmark case the S1, where the highest power losses are presented for this 23-nodes test feeder) due to the injection of active power in the node 23. Nevertheless, it is possible to observe that in this case, the lower voltage profile is presented at node 11 with a value of 0.93 pu. This result evidences the nonlinear relation between voltage profiles and power losses reduction, which implies that lower power losses do not necessarily mean best voltage profiles (compare the S1 and S2).
In S3 when the node 23 is assigned as a slack node, the final power losses of the grid are 210.99 kW. This means an improvement of 30.80 % respect to the S1. In addition, due to the presence of this second voltage controlled node, the minimum voltage profile is presented at node 5 with a value of 0.94 pu. This is slightly better than both previous cases.
In Figure 8, the complete voltage profiles for the 23-nodes test feeder in the three simulation cases has been reported. In this figure, it is possible to observe the effect of the power injection at node 23 regarding voltage performance in the entire network. This injection directly influences the area where the generator is located by improving these voltages compared to the S1. Nevertheless, note that in all the simulation cases, the voltage regulation bounds are fulfilled, i.e., all the voltages are between 0.90 pu and 1.10 pu. (These voltage regulation bounds are selected since in the Colombian power system for medium-voltage, levels are assigned by the regulatory entity a maximum variation of ± 10 % in the point of the load coupling [54]).
Regarding current flows in the 23-nodes test feeder, we initially assume that, all the lines can carry at most 500 A. In the case of the S1, the maximum current is presented in the corridor that connects nodes 1 and 3 with 463.14 A. This implies a loadability of 92.63 % . In the S2, the maximum flow is presented in the same corridor with a loadability of 78.77 % (i.e., 393.84 A). The maximum current in S3 is 440.96 A, which flows through the line connected between nodes 1 and 2. The loadability of this line is 88.19 %. These results suggest that the injection of the active power in node 23 allows the release of capability on the most charged lines, which can be taken as a surplus for future expansion plans or to attend possible increments in load consumptions.
The solution reached by GAMS when the mathematical model for optimal reconfiguration of DC test feeder is implemented in Figure 9, which is presented the configuration reached by the S3.
Observe that in the solution reported in Figure 9, both substations have radial grid configurations, which fulfils constraint (5) related to the number of conductors required to guarantee a tree configuration. In addition, for this feeder substation located at node 1, it is provided 9193.49 kW of power, and the new power source located at node 23 provides 2776.34 kW. Note that the efficiency of this configuration is 97.24 % , which confirms that DC technology is a powerful alternative to expand medium-voltage distribution networks.
Remark 3.
The average processing times to solve the optimal reconfiguration/expansion problem in the 23-nodes test feeder using the GAMS interface is about 30 s. This implies that this software guarantees the analysis of a wide range of scenarios before making economic decisions on behalf of the distribution company.

5.4. Scalability Test

To demonstrate that the proposed MINLP model is scalable, i.e., this can be applied to DC networks with high number of nodes, we include simulations in a 33- and 69-node test feeders proposed in [41,55]. These systems are classically employed for validating optimal reconfiguration plans in AC electrical networks [56].

5.4.1. 33-Node Test Feeder

The 33-node test feeder reported in [55] is modified by adding four new routes that can be used to reconfigure this system. The initial topology of this test system is depicted in Figure 10, and the branch and load information is reported in Table 7.
This system is operated at a medium-voltage level with 12.66 kV at the substation and 135.25 kW of power losses for the initial configuration. Once the MINLP model for the 33-nodes test feeder is solved, the final configuration introduces a line between nodes 22 and 26 and disconnects the line between nodes 6 and 26. This results in the power losses in this system being 107.48 kW. This new configuration allows a reduction of 20.54 % in the grid losses compared with the benchmark case. It is important to mention that the processing time required to solve the MINLP model for the 33-nodes test feeder is about 4 s, which confirms that the proposed approach can be adapted to real-time operation scenarios. Regarding voltage profiles, Figure 11 presents the voltage behaviour in this test feeder before and after the reconfiguration plan.
From Figure 11, we can observe that in both cases, the node with the lowest voltage profile is the node 18; nevertheless, in the benchmark case (i.e., without reconfiguration), the voltage in this node is 0.93 pu; while after reconfiguring the network reaches 0.95 pu. This implies a difference of 165.72 V between both solutions, which confirms that the proposed MINLP model also improves the voltage profile when power losses are minimised.

5.4.2. 69-Node Test Feeder

The 69-node test feeder configuration is composed of 68 branches and 69 nodes, which are operated with 12.66 kV at the substation node. This system has an initial power loss of 153.85 kW for the original configuration reported in [55] with a minimum voltage of 11.74 kV at node 69. After implementing the proposed MINLP model in this 69-node test feeder considering possible connection routes reported in [56] and presented in Table 8, the final power losses are 85.26 kW with a minimum voltage at node 69 with 12.11 kV.
Note that when applied to the reconfiguration plan, the total power losses are reduced to about 45.58 % , i.e., a reduction of 68.59 kW; and the minimum voltage profile at node 69 improves by about 370 V. These results confirm that reconfiguration DC power grids is a powerful alternative to enhance grid performance during a load condition. The simulation time to solve the MINLP model in the 69-node test feeder was about 10 s, which confirms that the proposed approach can be adapted to real-time operation scenarios.

6. Conclusions and Future Works

A mixed-integer nonlinear programming model for optimal reconfiguration of DC feeders has been proposed in this research. The mathematical formulation was founded in the power balance equations rewritten as a function of the branch currents using the branch-to-node incidence matrix. Numerical results in five test feeders confirm that is possible to reach optimal reconfiguration plans by implementing the proposed MINLP model in the GAMS software with processing times lower than 30 s in all the cases.
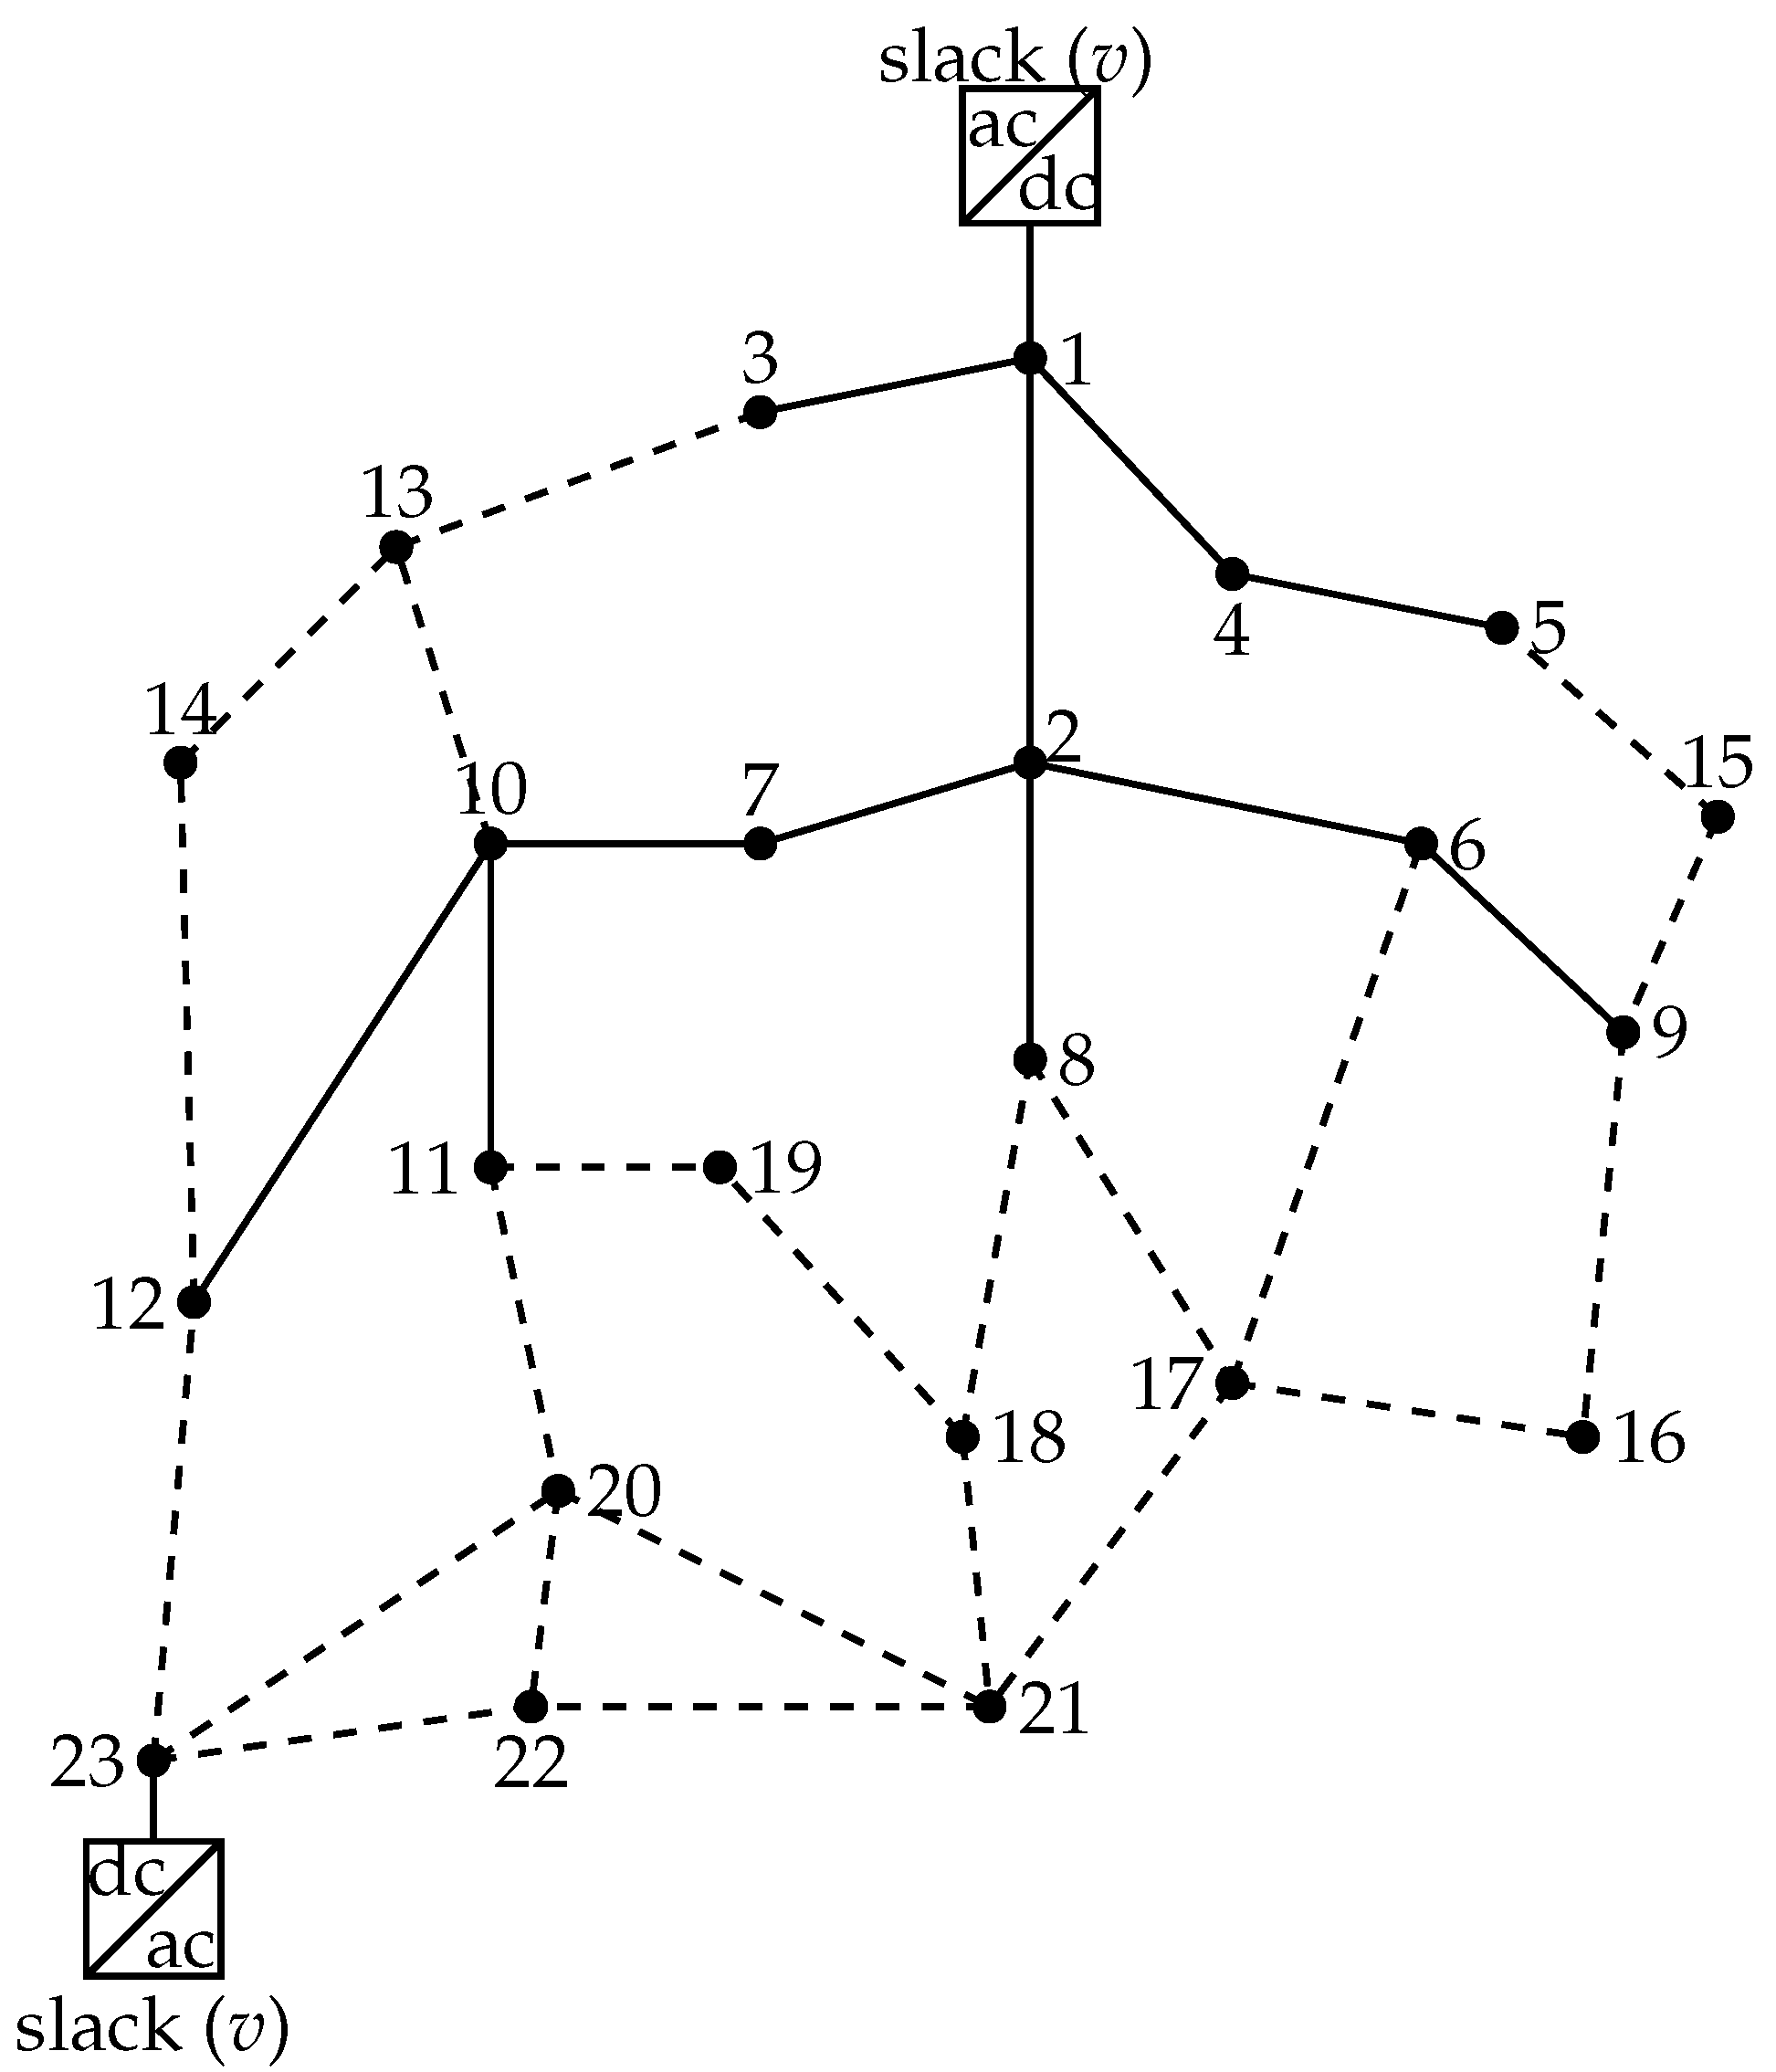
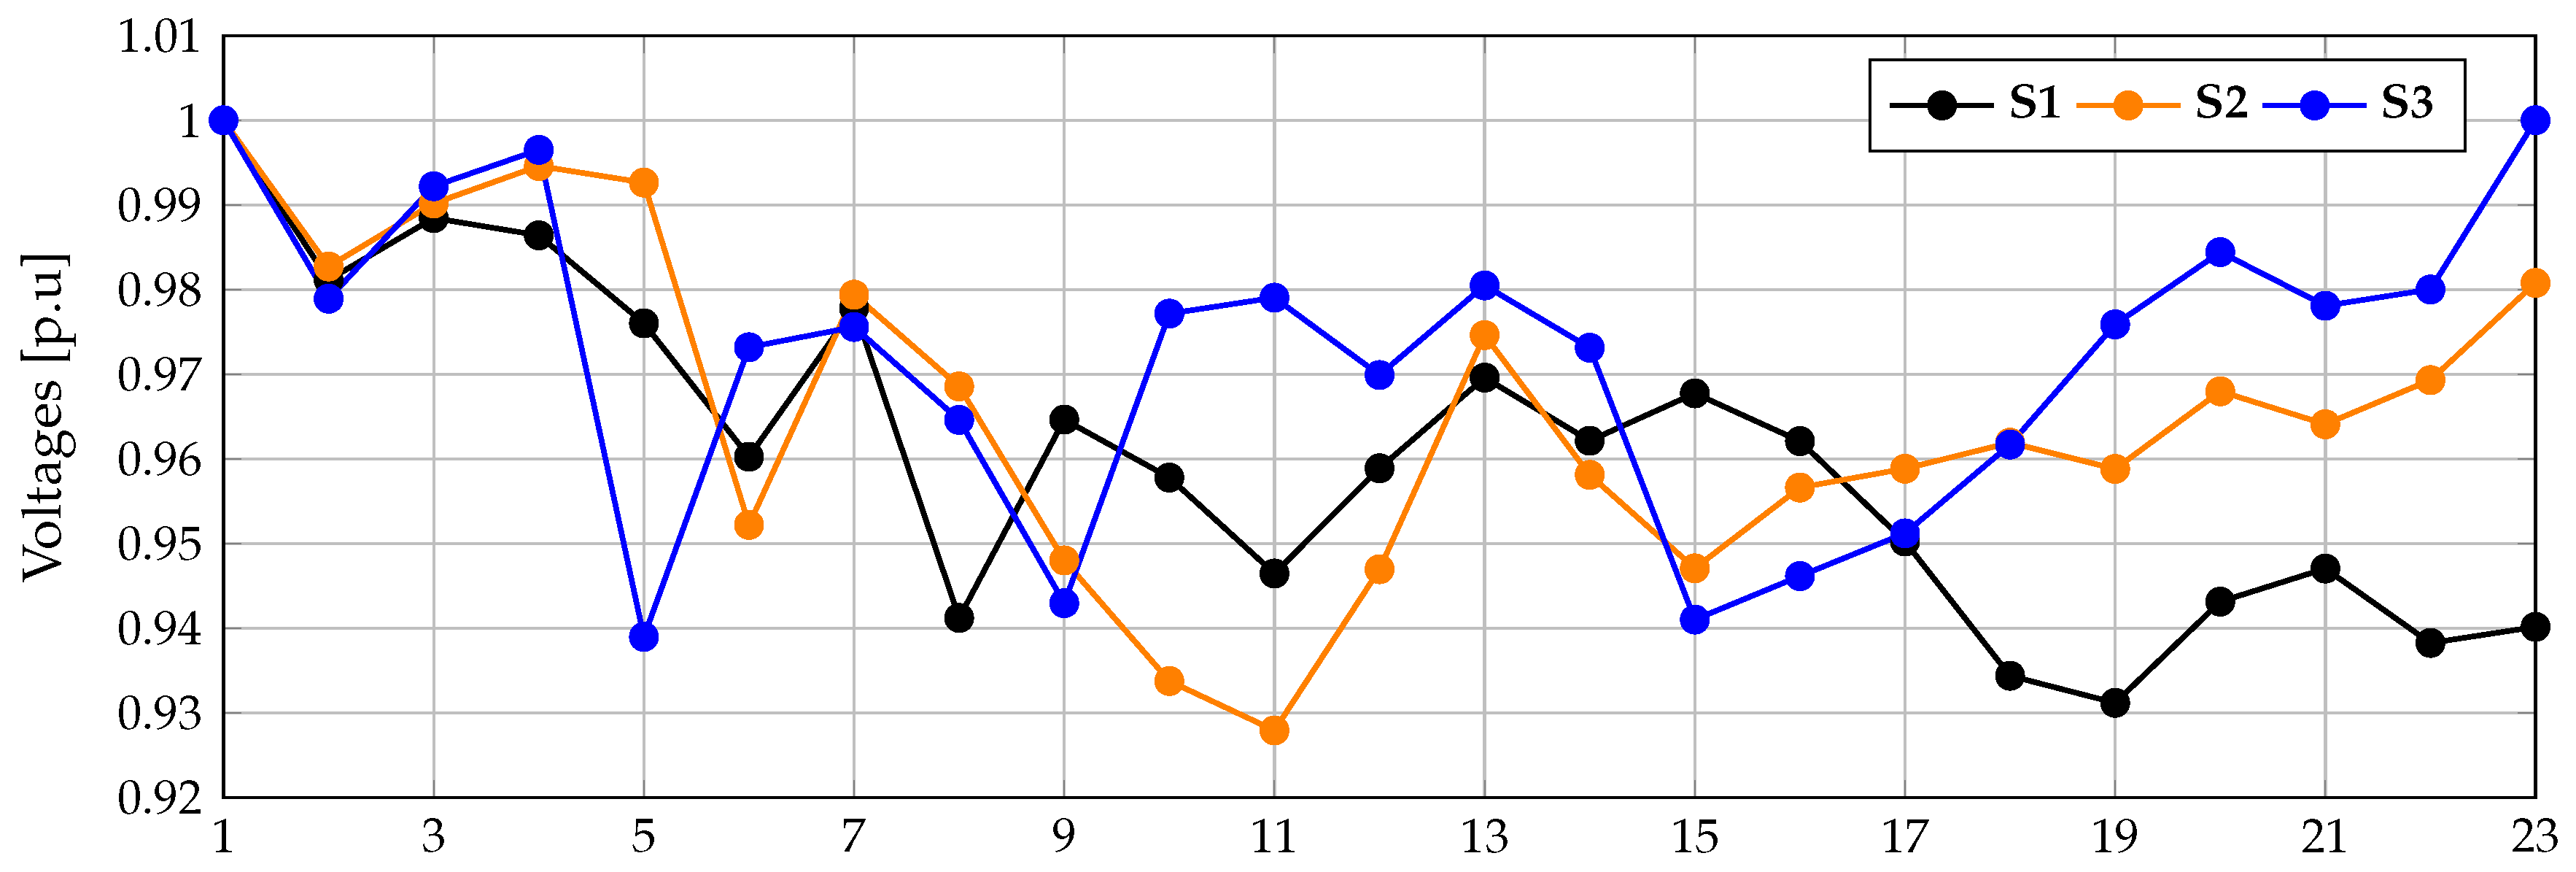
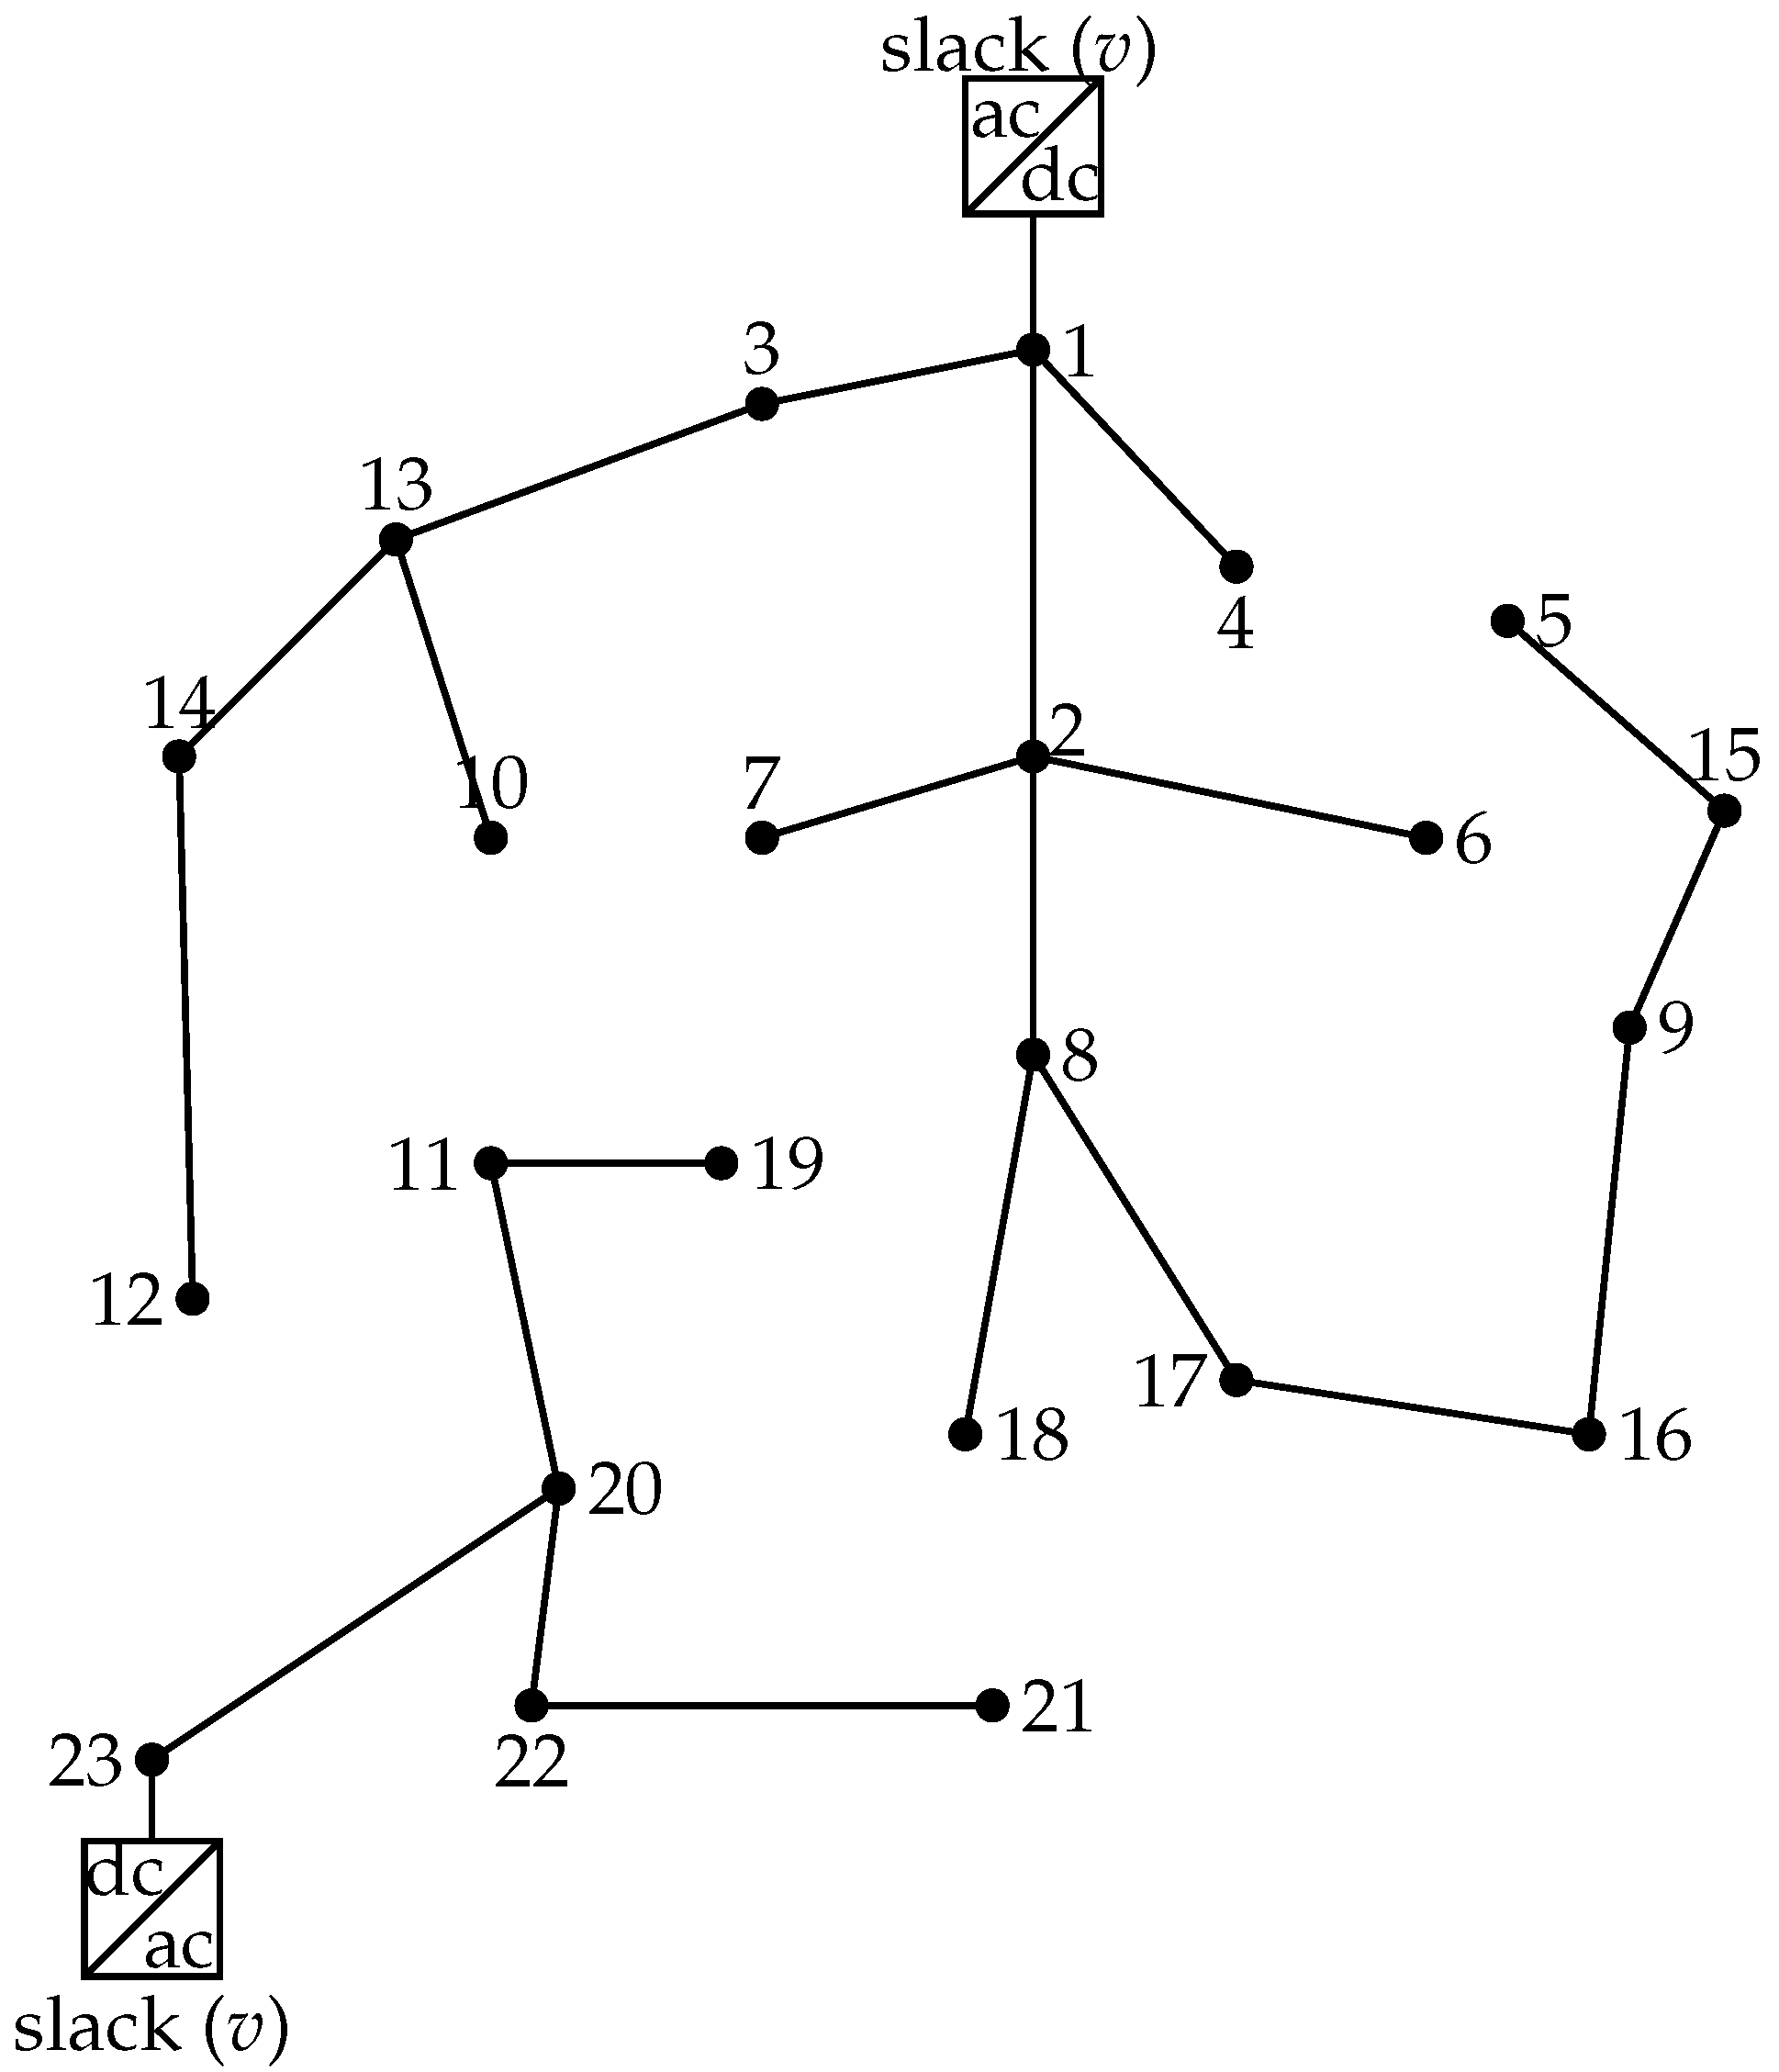
A numerical validation in a medium-voltage test feeder composed of 23 nodes demonstrates that the proposed MINLP model can be adapted to reconfiguration and expansion plans, since its mathematical models are identical, with the main advantage that multiple one or multiple slack nodes can use it.
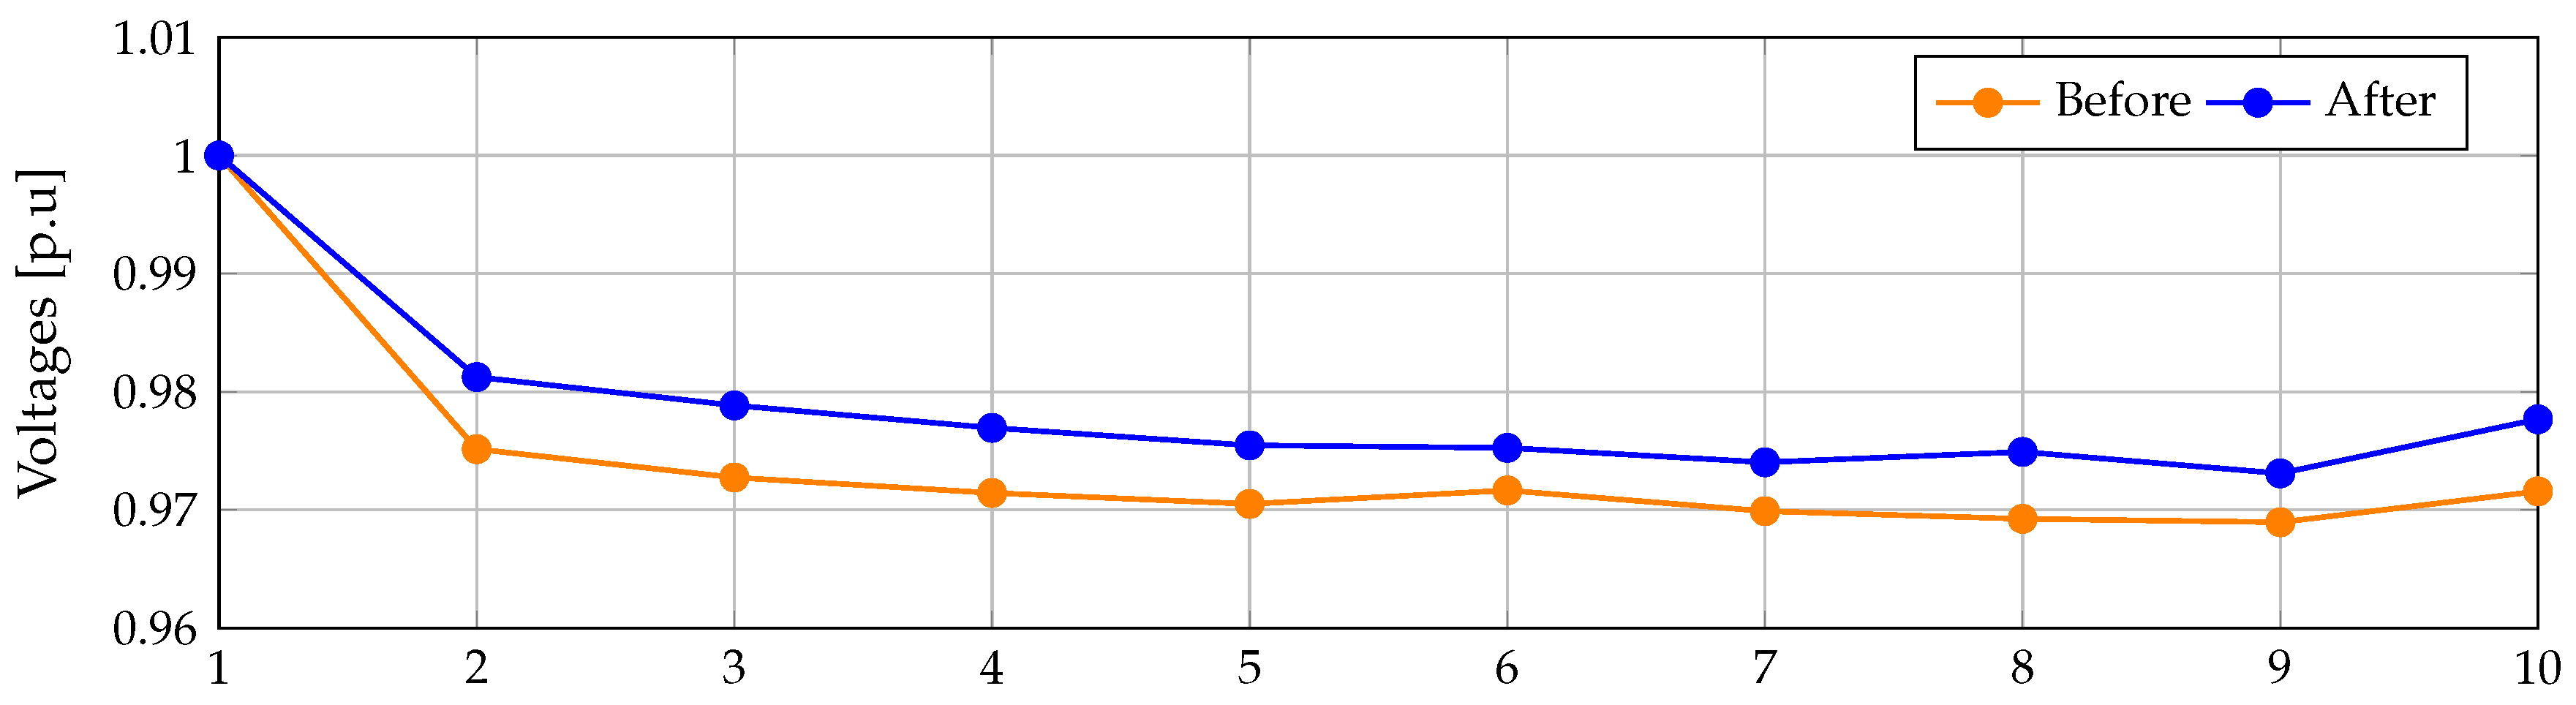
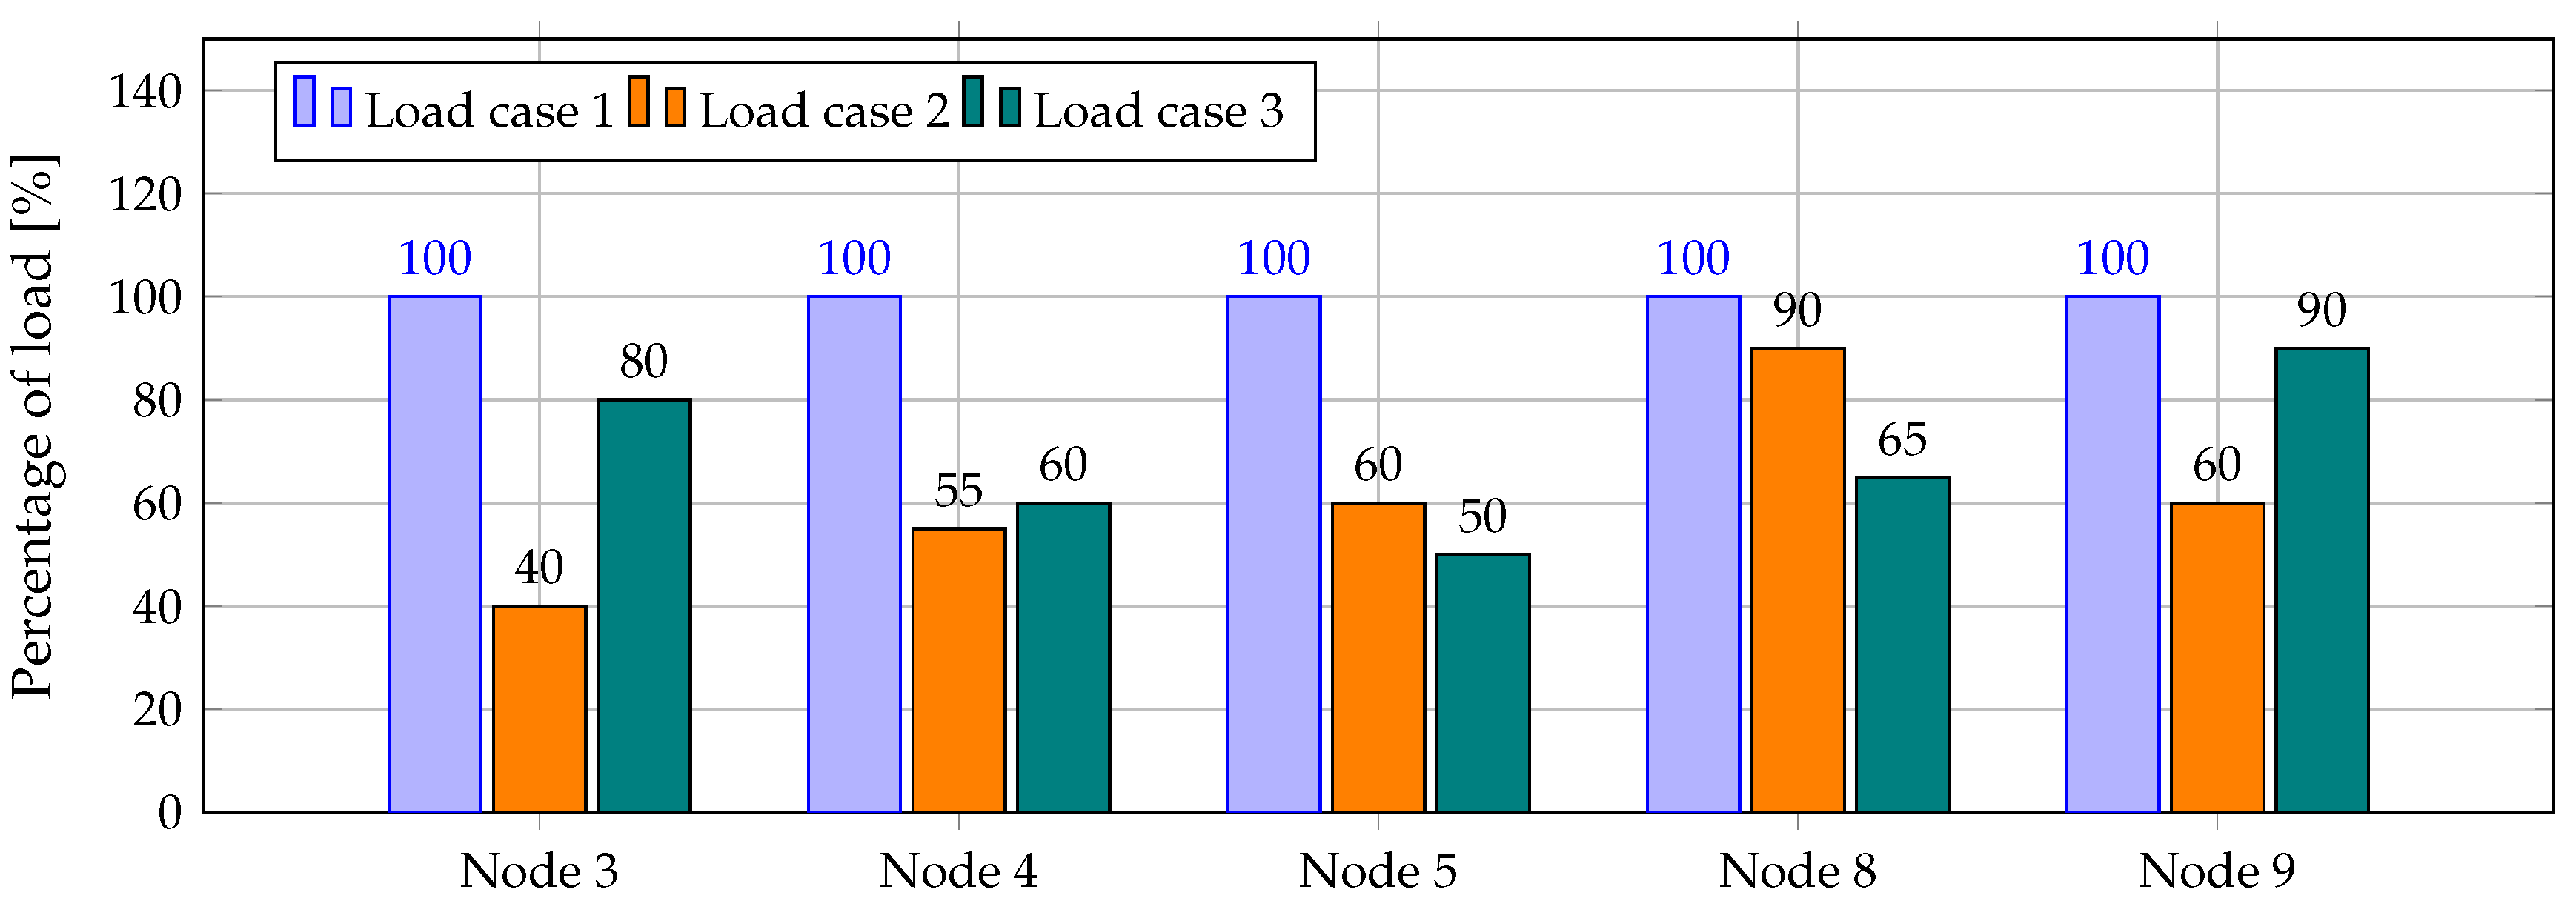
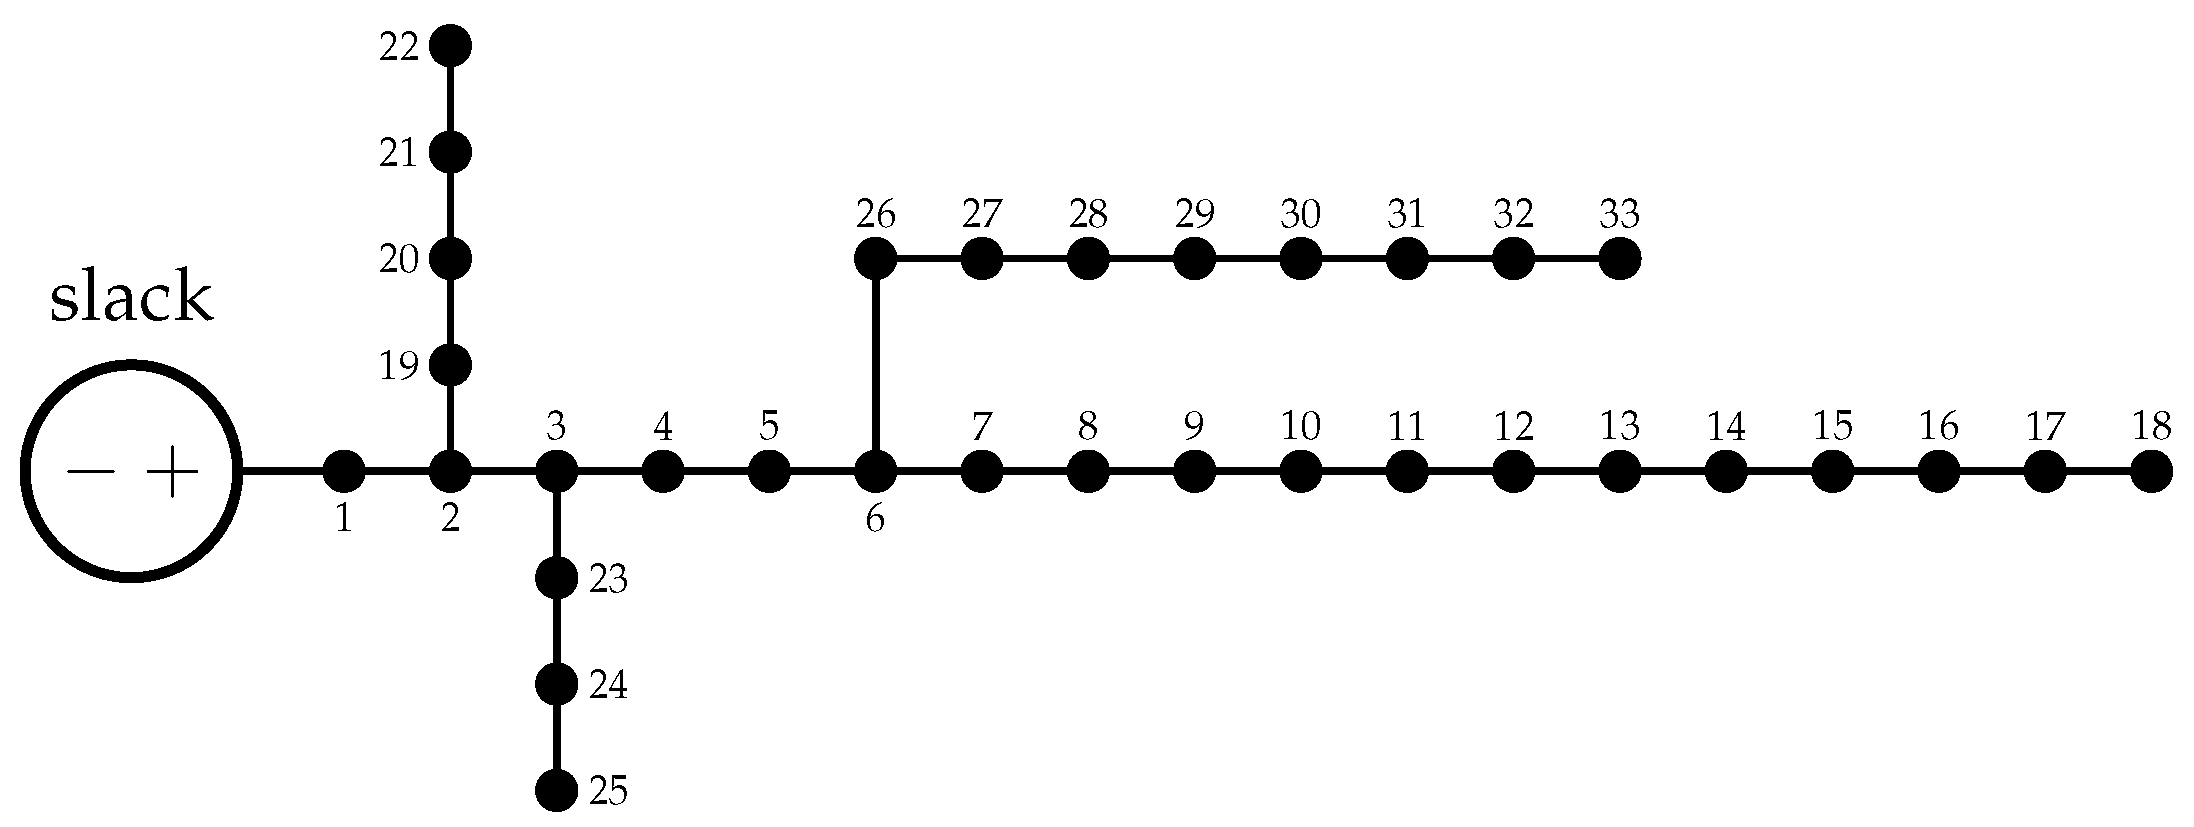
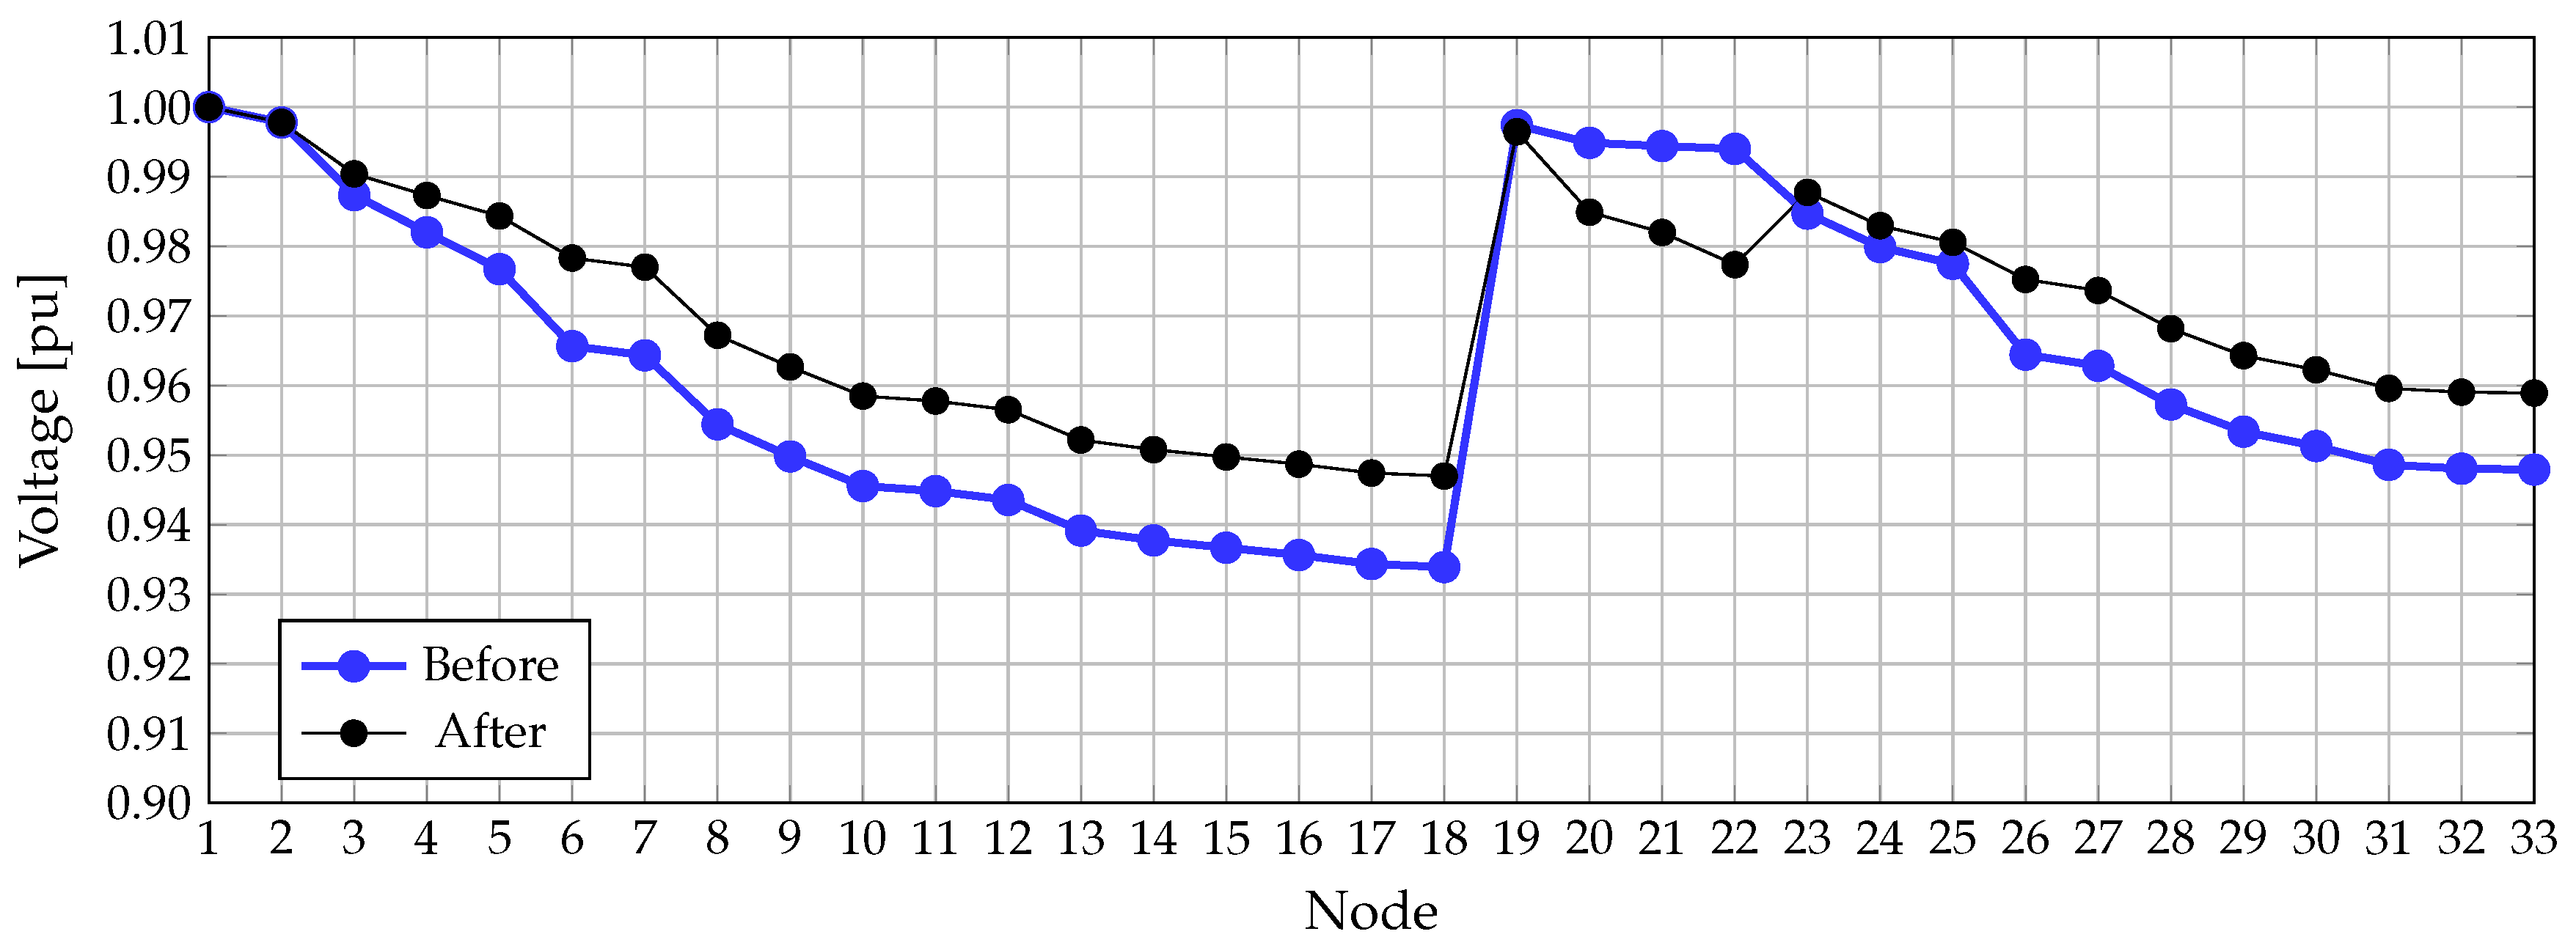
Simulations in the 33- and 69-node test feeders demonstrate that the proposed MINLP model is suitable for being applied to large scale medium-voltage DC grids with power losses minimisation about 20.54 % and 45.58 % , respectively. In addition, numerical validations in the 10-node test feeder show that the MINLP formulation combined to the GAMS software is suitable for implementing real-time reconfiguration plans with minimum computational efforts as a function of the power consumptions at the load points.
Some of the possible future works derived from this paper can be the following: (i) extend the proposed MINLP model to the optimal selection of wires gauge for DC grids considering technical and economic aspects, as well as to propose a mixed-integer convex relaxation to address the problem studied in this contribution with optimality guarantee; (ii) the inclusion of temporal variable in the MINLP formulation to address the issue of optimal reconfiguration of DC networks considering renewables and battery energy storage devices; (iii) the implementation of metaheuristic optimisation techniques to solve the mathematical model (2)–(7) in a sequential manner (master-slave optimisation) in order to develop free access software for students, researchers or even distribution companies; and (iv) study the possibility of extending the proposed MINLP model to electrical networks that combines AC and DC feeders to offer optimal reconfiguration plans in modern hybrid distribution systems.
As a recommendation, we suggest free access software with the following tools: PowerModels (transmission, ac), PowerModelsDistribution (distribution, ac) and PowerModelsACDC (transmission, ac+dc+converters). These have been developed in Julia environment and can be used to implement power system optimisation problems, as an alternative to GAMS to solve the proposed MINLP model.

Author Contributions

Conceptualisation, O.D.M., W.G.-G., J.C.H., and A.M.-Q.; Methodology, O.D.M., W.G.-G., J.C.H., and A.M.-Q.; Investigation, O.D.M., W.G.-G., J.C.H., D.A.G.-R., and A.M.-Q.; Writing—review and editing, O.D.M., W.G.-G., J.C.H., D.A.G.-R., and A.M.-Q. All authors have read and agreed to the published version of the manuscript.

Funding

This work was partially supported by the National Scholarship Program Doctorates of the Administrative Department of Science, Technology, and Innovation of Colombia (COLCIENCIAS), by calling contest 727-2015.

Conflicts of Interest

The authors declare no conflict of interest.

Appendix A. Numerical Example

To illustrate the implementation of an optimisation problem in GAMS, let us consider a small DC test feeder composed of 6 nodes and 10 possible distribution routes. The information about this small test example is reported in Figure A1 and Table A1 and Table A2. Note that this test feeder has a power consumption of 130 kW, and it has been designed to operate at 380 V. In addition, for all the lines, the maximum current is set in 250 A.
Figure A1. Electrical configuration for the 6-nodes test system used in the GAMS example.
Energies 13 04440 g0a1
Table A1. Branches information.
Line r l [ Ω ]Line r l [ Ω ]Line r l [ Ω ]Line r l [ Ω ]Line r l [ Ω ]
a0.0855f0.0727b0.0946g0.0689c0.0845
d0.0556i0.0450e0.0524j0.0445h0.0785
Table A2. Load information.
Node kLoad [kW]Node kLoad [kW]Node kLoad [kW]Node kLoad [kW]
10.0433232527
318620----
To implement the optimisation model that defines the optimal reconfiguration (if no one line is existent, then, the proposed model can be applied to the optimal route selection into a DC distribution network) plan in the DC distribution network. It is necessary to define the branch-to-node incidence matrix, which for this small test feeder takes the following form:
A = 1 1 0 0 0 0 1 0 1 0 0 0 0 1 1 0 0 0 0 1 0 1 0 0 0 1 0 0 1 0 0 0 1 1 0 0 0 0 1 0 0 1 0 0 0 1 1 0 0 0 0 1 0 1 0 0 0 0 1 1
where rows are rearranged starting from line a to line j, and columns from node 1 to node 6, respectively.
The complete GAMS implementation of the optimal reconfiguration problem is presented in Algorithm A1.
Note that in the Algorithm A1, the main aspects of the mathematical optimisation using the GAMS interface are clearly presented, as previously mentioned. Recall that from line 35 to line 47 it is presented the complete formulation of the reconfiguration problem, i.e., the compact implementation of the mathematical model described from (2) to (7).
Once Algorithm A1 is executed to solve the reconfiguration problem by choosing the SBB solver, the solution found is reported in Table A3. Note that this solution is indeed the global optimal solution reached by the SBB solver after applying the branch and bound search method to deal with the final solution of the MINLP model in the case of the 6-nodes test feeder.
Table A3. Solution reached by general algebraic modelling system (GAMS) for the reconfiguration problem in the 6-nodes test feeder.
v 1 = 380.00 V v 2 = 366.16 V v 3 = 361.18 V v 4 = 354.41 V
v 5 = 362.25 V v 6 = 357.33 V x a = 1 x b = 1
x e = 1 x f = 1 x g = 1  i a = 161.93 A
  i b = 198.92 A  i e = 74.53 A  i f = 93.11 A  i g = 55.97 A
p loss = 7.12 kW p g = 137.12 kW
From results in Table A3 note that the minimum voltage is presented at node 4 with a value of 354.41 V, equivalent to 0.93 pu, which is within the voltage regulation boundaries assigned to this system between 0.90 pu to 1.10 pu). Additionally, the power losses in this grid are 7.12 kW, which implies that the efficiency of this grid when the peak load occurs is about 94.81 % . The variable x in Table A3 contains the information about the lines selected to distribute the electricity in this network; this final configuration is depicted in Figure A2.
It is worth mentioning that the line with the maximum current is the line b with 198.92 A, which implies a maximum chargeability of 79.57 % , while the minimum current is presented in line g with a chargeability of about 22.39 % . This behaviour is expected, since the line b is directly connected to the substation, which provides energy to nodes 3, 4 and 6 (i.e., 71 kW), while line g only allows flow of power towards node 6, i.e., 20 kW.
Algorithm 1: GAMS implementation of the reconfiguration problem in the 6-nodes test feeder.
Energies 13 04440 i001
Figure A2. Selected configuration for the 6-nodes test system.
Energies 13 04440 g0a2

References

  1. Sarkar, M.N.I.; Meegahapola, L.G.; Datta, M. Reactive Power Management in Renewable Rich Power Grids: A Review of Grid-Codes, Renewable Generators, Support Devices, Control Strategies and Optimization Algorithms. IEEE Access 2018, 6, 41458–41489. [Google Scholar] [CrossRef]
  2. Jia, K.; Yang, Z.; Fang, Y.; Bi, T.; Sumner, M. Influence of Inverter-Interfaced Renewable Energy Generators on Directional Relay and an Improved Scheme. IEEE Trans. Power Electron. 2019, 34, 11843–11855. [Google Scholar] [CrossRef]
  3. Montoya, O.D.; Gil-González, W. Dynamic active and reactive power compensation in distribution networks with batteries: A day-ahead economic dispatch approach. Comput. Electr. Eng. 2020, 85, 106710. [Google Scholar] [CrossRef]
  4. Serra, F.M.; Fernández, L.M.; Montoya, O.D.; Gil-González, W.; Hernández, J.C. Nonlinear Voltage Control for Three-Phase DC-AC Converters in Hybrid Systems: An Application of the PI-PBC Method. Electronics 2020, 9, 847. [Google Scholar] [CrossRef]
  5. Simiyu, P.; Xin, A.; Wang, K.; Adwek, G.; Salman, S. Multiterminal Medium Voltage DC Distribution Network Hierarchical Control. Electronics 2020, 9, 506. [Google Scholar] [CrossRef] [Green Version]
  6. Sechilariu, M.; Wang, B.; Locment, F. Power management and optimization for isolated DC microgrid. In Proceedings of the 2014 International Symposium on Power Electronics, Electrical Drives, Automation and Motion, Ischia, Italy, 18–20 June 2014; pp. 1284–1289. [Google Scholar]
  7. Garcés, A. On the Convergence of Newton’s Method in Power Flow Studies for DC Microgrids. IEEE Trans. Power Syst. 2018, 33, 5770–5777. [Google Scholar] [CrossRef] [Green Version]
  8. Montoya, O.D.; Grisales-Noreña, L.F.; Gil-González, W.; Alcalá, G.; Hernandez-Escobedo, Q. Optimal Location and Sizing of PV Sources in DC Networks for Minimizing Greenhouse Emissions in Diesel Generators. Symmetry 2020, 12, 322. [Google Scholar] [CrossRef] [Green Version]
  9. Gil-González, W.; Montoya, O.D.; Grisales-Noreña, L.F.; Cruz-Peragón, F.; Alcalá, G. Economic Dispatch of Renewable Generators and BESS in DC Microgrids Using Second-Order Cone Optimization. Energies 2020, 13, 1703. [Google Scholar] [CrossRef] [Green Version]
  10. Sharip, M.R.M.; Haidar, A.M.A.; Jimel, A.C. Optimum Configuration of Solar PV Topologies for DC Microgrid Connected to the Longhouse Communities in Sarawak, Malaysia. Int. J. Photoenergy 2019, 2019, 1–13. [Google Scholar] [CrossRef] [Green Version]
  11. Grisales-Noreña, L.; Montoya, O.D.; Ramos-Paja, C.A. An energy management system for optimal operation of BSS in DC distributed generation environments based on a parallel PSO algorithm. J. Energy Storage 2020, 29, 101488. [Google Scholar] [CrossRef]
  12. Kamran, M.; Bilal, M.; Mudassar, M. DC Home Appliances for DC Distribution System. Mehran Univ. Res. J. Eng. Technol. 2017, 36, 881–890. [Google Scholar] [CrossRef]
  13. Wong, C.; Liu, C.; Hou, K. DC power supply system for intelligent server. In Proceedings of the 2012 International Symposium on Intelligent Signal Processing and Communications Systems, Taipei, Taiwan, 4–7 November 2012; pp. 245–249. [Google Scholar]
  14. Christakou, K. A unified control strategy for active distribution networks via demand response and distributed energy storage systems. Sustain. Energy Grids Netw. 2016, 6, 1–6. [Google Scholar] [CrossRef] [Green Version]
  15. Satpathi, K.; Ukil, A.; Nag, S.S.; Pou, J.; Zadrodnik, M.A. Comparison of Current-Only Directional Protection in AC and DC Power Systems. In Proceedings of the 2018 IEEE Innovative Smart Grid Technologies—Asia (ISGT Asia), Singapore, 22–25 May 2018; pp. 133–138. [Google Scholar]
  16. Xue, S.; Chen, C.; Jin, Y.; Li, Y.; Li, B.; Wang, Y. Protection for DC Distribution System with Distributed Generator. J. Appl. Math. 2014, 2014, 1–12. [Google Scholar] [CrossRef]
  17. Opiyo, N.N. A comparison of DC- versus AC-based minigrids for cost-effective electrification of rural developing communities. Energy Rep. 2019, 5, 398–408. [Google Scholar] [CrossRef]
  18. Alluhaidan, M.; Almutairy, I. Modeling and Protection for Low-Voltage DC Microgrids Riding Through Short Circuiting. Procedia Comput. Sci. 2017, 114, 457–464. [Google Scholar] [CrossRef]
  19. Gil-González, W.; Montoya, O.D.; Garces, A. Direct power control for VSC-HVDC systems: An application of the global tracking passivity-based PI approach. Int. J. Electr. Power Energy Syst. 2019, 110, 588–597. [Google Scholar] [CrossRef]
  20. Montoya, O.D.; Gil-González, W.; Grisales-Noreña, L.F. Vortex Search Algorithm for Optimal Power Flow Analysis in DC Resistive Networks with CPLs. IEEE Trans. Circuits Syst. II 2019, 1–5. [Google Scholar] [CrossRef]
  21. Garcés, A.; Montoya, O.D. A Potential Function for the Power Flow in DC Microgrids: An Analysis of the Uniqueness and Existence of the Solution and Convergence of the Algorithms. J. Control Autom. Electr. Syst. 2019, 30, 794–801. [Google Scholar] [CrossRef]
  22. Altun, T.; Madani, R.; Yadav, A.P.; Nasir, A.; Davoudi, A. Optimal Reconfiguration of DC Networks. IEEE Trans. Power Syst. 2020, 1. [Google Scholar] [CrossRef]
  23. Chidanandappa, R.; Ananthapadmanabha, D.; Ranjith, H.C. Genetic Algorithm Based Network Reconfiguration in Distribution Systems with Multiple DGs for Time Varying Loads. Procedia Technol. 2015, 21, 460–467. [Google Scholar] [CrossRef] [Green Version]
  24. Abdelaziz, A.; Mohamed, F.; Mekhamer, S.; Badr, M. Distribution system reconfiguration using a modified Tabu Search algorithm. Electr. Power Syst. Res. 2010, 80, 943–953. [Google Scholar] [CrossRef]
  25. Tandon, A.; Saxena, D. Optimal reconfiguration of electrical distribution network using selective particle swarm optimization algorithm. In Proceedings of the 2014 International Conference on Power, Control and Embedded Systems (ICPCES), Allahabad, India, 26–28 December 2014. [Google Scholar] [CrossRef]
  26. Daud, J.G.; Kondoj, M.; Patabo, M. Reconfiguration Distribution Network with Ant Colony. In Proceedings of the 2018 International Conference on Applied Science and Technology (iCAST), Manado, Indonesia, 26–27 October 2018; pp. 349–353. [Google Scholar]
  27. Verma, H.K.; Singh, P. Optimal Reconfiguration of Distribution Network Using Modified Culture Algorithm. J. Inst. Eng. (India) Ser. B 2018, 99, 613–622. [Google Scholar] [CrossRef]
  28. Hamida, I.B.; Salah, S.B.; Msahli, F.; Mimouni, M.F. Optimal network reconfiguration and renewable DG integration considering time sequence variation in load and DGs. Renew. Energy 2018, 121, 66–80. [Google Scholar] [CrossRef]
  29. Sambaiah, K.S.; Jayabarathi, T. Optimal reconfiguration and renewable distributed generation allocation in electric distribution systems. Int. J. Ambient Energy 2019, 1–14. [Google Scholar] [CrossRef]
  30. Murty, V.V.V.S.N.; Kumar, A. Optimal DG integration and network reconfiguration in microgrid system with realistic time varying load model using hybrid optimisation. IET Smart Grid 2019, 2, 192–202. [Google Scholar] [CrossRef]
  31. Yaprakdal, F.; Baysal, M.; Anvari-Moghaddam, A. Optimal Operational Scheduling of Reconfigurable Microgrids in Presence of Renewable Energy Sources. Energies 2019, 12, 1858. [Google Scholar] [CrossRef] [Green Version]
  32. Jangdoost, A.; Keypour, R.; Golmohamadi, H. Optimization of distribution network reconfiguration by a novel RCA integrated with genetic algorithm. Energy Syst. 2020. [Google Scholar] [CrossRef]
  33. Mishra, S.; Das, D.; Paul, S. A comprehensive review on power distribution network reconfiguration. Energy Syst. 2016, 8, 227–284. [Google Scholar] [CrossRef]
  34. Montoya, O.D. Numerical Approximation of the Maximum Power Consumption in DC-MGs With CPLs via an SDP Model. IEEE Trans. Circuits Syst. II 2019, 66, 642–646. [Google Scholar] [CrossRef]
  35. Jansson, C. A Rigorous Lower Bound for the Optimal Value of Convex Optimization Problems. J. Glob. Optim. 2004, 28, 121–137. [Google Scholar] [CrossRef]
  36. Yuan, Z.; Hesamzadeh, M.R. Second-order cone AC optimal power flow: Convex relaxations and feasible solutions. J. Mod Power Syst. Clean Energy 2018, 7, 268–280. [Google Scholar] [CrossRef] [Green Version]
  37. Kronqvist, J.; Bernal, D.E.; Lundell, A.; Grossmann, I.E. A review and comparison of solvers for convex MINLP. Optim. Eng. 2018, 20, 397–455. [Google Scholar] [CrossRef] [Green Version]
  38. Chew, B.S.H.; Xu, Y.; Wu, Q. Voltage Balancing for Bipolar DC Distribution Grids: A Power Flow Based Binary Integer Multi-Objective Optimization Approach. IEEE Trans. Power Syst. 2019, 34, 28–39. [Google Scholar] [CrossRef] [Green Version]
  39. Lavorato, M.; Franco, J.F.; Rider, M.J.; Romero, R. Imposing Radiality Constraints in Distribution System Optimization Problems. IEEE Trans. Power Syst. 2012, 27, 172–180. [Google Scholar] [CrossRef]
  40. Shen, T.; Li, Y.; Xiang, J. A Graph-Based Power Flow Method for Balanced Distribution Systems. Energies 2018, 11, 511. [Google Scholar] [CrossRef] [Green Version]
  41. The, T.T.; Ngoc, D.V.; Anh, N.T. Distribution Network Reconfiguration for Power Loss Reduction and Voltage Profile Improvement Using Chaotic Stochastic Fractal Search Algorithm. Complexity 2020, 2020, 1–15. [Google Scholar] [CrossRef]
  42. Montoya, O.D.; Gil-González, W.; Grisales-Noreña, L. An exact MINLP model for optimal location and sizing of DGs in distribution networks: A general algebraic modeling system approach. Ain Shams Eng. J. 2019. [Google Scholar] [CrossRef]
  43. Pfitscher, L.; Bernardon, D.; Canha, L.; Montagner, V.; Garcia, V.; Abaide, A. Intelligent system for automatic reconfiguration of distribution network in real time. Electr. Power Syst. Res. 2013, 97, 84–92. [Google Scholar] [CrossRef]
  44. Bernardon, D.; de Mello, A.P.C.; Pfitscher, L. Real-Time Reconfiguration of Distribution Network with Distributed Generation. In Real-Time Systems; InTech: London, UK, 2016. [Google Scholar] [CrossRef] [Green Version]
  45. Soroudi, A. Power System Optimization Modeling in GAMS; Springer International Publishing: Berlin/Heidelberg, Germany, 2017. [Google Scholar] [CrossRef]
  46. Montoya, O.D.; Gil-González, W.; Rivas-Trujillo, E. Optimal Location-Reallocation of Battery Energy Storage Systems in DC Microgrids. Energies 2020, 13, 2289. [Google Scholar] [CrossRef]
  47. Amin, W.T.; Montoya, O.D.; Grisales-Noreña, L.F. Determination of the Voltage Stability Index in DC Networks with CPLs: A GAMS Implementation. In Communications in Computer and Information Science; Springer International Publishing: Berlin/Heidelberg, Germany, 2019; pp. 552–564. [Google Scholar] [CrossRef]
  48. Skworcow, P.; Paluszczyszyn, D.; Ulanicki, B.; Rudek, R.; Belrain, T. Optimisation of Pump and Valve Schedules in Complex Large-scale Water Distribution Systems Using GAMS Modelling Language. Procedia Eng. 2014, 70, 1566–1574. [Google Scholar] [CrossRef] [Green Version]
  49. Naghiloo, A.; Abbaspour, M.; Mohammadi-Ivatloo, B.; Bakhtari, K. GAMS based approach for optimal design and sizing of a pressure retarded osmosis power plant in Bahmanshir river of Iran. Renew. Sustain. Energy Rev. 2015, 52, 1559–1565. [Google Scholar] [CrossRef]
  50. Tartibu, L.; Sun, B.; Kaunda, M. Multi-objective optimization of the stack of a thermoacoustic engine using GAMS. Appl. Soft Comput. 2015, 28, 30–43. [Google Scholar] [CrossRef]
  51. Montoya, O.D. Solving a Classical Optimization ProblemUsing GAMS Optimizer Package: Economic Dispatch ProblemImplementation. Ingeniería y Ciencia 2017, 13, 39–63. [Google Scholar] [CrossRef] [Green Version]
  52. Tartibu, L.; Sun, B.; Kaunda, M. Optimal Design of A Standing Wave Thermoacoustic Refrigerator Using GAMS. Procedia Comput. Sci. 2015, 62, 611–618. [Google Scholar] [CrossRef] [Green Version]
  53. Garces, A. Uniqueness of the power flow solutions in low voltage direct current grids. Electr. Power Syst. Res. 2017, 151, 149–153. [Google Scholar] [CrossRef]
  54. Enel-Codensa. Connection Voltage Levels of Customer Loads; Technical Report; Enel-Codensa (Diseño de red); ENEL: Bogotá, Colombia, 2018. (In Spanish) [Google Scholar]
  55. Montoya, O.D.; Gil-González, W.; Garces, A. Power flow approximation for DC networks with constant power loads via logarithmic transform of voltage magnitudes. Electr. Power Syst. Res. 2019, 175, 105887. [Google Scholar] [CrossRef]
  56. Huang, Y.C. Enhanced-genetic-algorithm-based fuzzy multi-objective approach to distribution network reconfiguration. IEE Proc. Gener. Transm. Distrib. 2002, 149, 615. [Google Scholar] [CrossRef]
Figure 1. Flow chart of the proposed optimisation approach for optimal reconfiguration of DC grids.
Energies 13 04440 g001
Figure 2. Electrical configuration for the 10-nodes test feeder.
Energies 13 04440 g002
Figure 3. Electrical configuration for the 23-nodes test feeder.
Energies 13 04440 g003
Figure 4. Electrical configuration for the 10-test test feeder after of the optimal reconfiguration plan.
Energies 13 04440 g004
Figure 5. Voltage comparison between initial and final configurations in the 10-nodes test feeder.
Energies 13 04440 g005
Figure 6. Three load demand scenarios in constant power loads.
Energies 13 04440 g006
Figure 7. Electrical configuration for the 10-nodes test feeder after optimal reconfiguration for load cases 2 and 3: (a) LC 2, and (b) LC 3.
Energies 13 04440 g007
Figure 8. Voltage comparison between initial and final configurations in the 10-nodes test feeder.
Energies 13 04440 g008
Figure 9. Electrical configuration for the 23-nodes test feeder reached for the S3.
Energies 13 04440 g009
Figure 10. Electrical configuration for the 33-nodes test system (taken from [55]).
Energies 13 04440 g010
Figure 11. Voltage profile in the 33-nodes test feeder before and after reconfiguration.
Energies 13 04440 g011
Table 1. Electrical parameters of the 10-nodes test feeder.
Node kNode m r km  [pu]Type of Node P m d [pu] − R m d [pu]
1 (slack)20.0050Step-node
230.0015Constant power0.80
240.0020Constant power1.30
450.0018Constant power0.50
260.0023Constant resistance2.00
670.0017Step-node
780.0021Constant power0.30
790.0013Constant power0.70
3100.0015Constant resistance1.25
Table 2. Connections proposed for the 10-nodes test feeder.
Node kNode m r km [pu]Node kNode m r km [pu]
160.0205890.0014
340.0010360.0011
580.00185100.0012
6100.00128100.0011
Table 3. Existing and proposed connections in the 23-nodes test feeder.
Node kNode m r km [ Ω ]Node kNode m r km [ Ω ]Node kNode m r km [ Ω ]
120.54523130.542019180.7584
130.284513100.652011200.5218
140.754813140.750221170.6252
260.852114120.654521220.3886
270.55695150.768620230.7565
280.65451590.372522230.6100
450.77899160.423611190.7852
690.85966170.565221180.6387
7100.974616170.369621200.3265
10110.87958170.854120220.5555
10121.10148180.911012230.6565
Table 4. Load information for the 23-nodes test feeder.
Node k P k d [kW]Node k P k d [kW]Node k P k d [kW]Node k P k d [kW]Node k P k d [kW]
10929017250685014620
25201065018400776015310
37501180019510837516750
460012620203002238023100
53251385021630
Table 5. Power losses at each load case.
Load CaseBase Case [kW]Reconf. Plan [%]Improvement [%]
LC 114.3611.7118.45
LC 26.545.7512.13
LC 38.547.5611.41
Table 6. Behaviour of the power losses in the 23-nodes test feeder for each simulation case.
ScenarioPower Losses [kW]Min. Vol. (Node) [pu]
S1476.61(19) 0.93
S2399.54(11) 0.93
S3329.83(5) 0.94
Table 7. Electrical parameters for the 33-nodes test system.
FromTo R ij [ Ω ] P j [kW]FromTo R ij [ Ω ] P j [kW]
120.092210017180.732090
230.4930902190.164090
340.366012019201.504290
450.38116020210.409590
560.81906021220.708990
670.18722003230.451290
781.711420023240.8980420
891.03006024250.8900420
9101.0400606260.203060
10110.19664526270.284260
11120.37446027281.059060
12131.46806028290.8042120
13140.541612029300.5075200
14150.59106030310.9744150
15160.74636031320.3105210
16171.28906032330.341060
Proposed lines for reconfiguration
12320.34108280.1556
22260.35602570.4585
Table 8. Initial and final configurations for the 69-node test feeder.
Initial Open LinesFinal Open Lines
Node i Node j Resistance[ Ω ]Node i Node j Resistance[ Ω ]
11430.500011430.5000
13210.500013210.5000
14461.000013141.0440
50592.000058590.3042
27651.000027651.0000

