Abstract
The measurement of polarization and depolarization currents (PDC) based on time–domain response is an effective method for state assessment of cellulose insulation material in oil-immersed electrical equipment. However, the versatility of the data obtained at different temperatures is limited because of the temperature dependence of the PDC. In this respect, the universal conversion of PDC data at different temperatures is an essential aspect to improve the accuracy of the determination of insulating properties of cellulose materials immersed in the oil. Thus, an innovative temperature conversion method based on polarization time-varying current (PTC, obtained by multiplying the polarization current and time) is proposed in this article. In the current work, the PTC data at different temperatures are obtained from the oil-immersed cellulose pressboards with different moisture. Afterwards, the functional model based on the power series theory is used to simulate the PTC data, through which the coefficients of the power series are found related to the test temperature of the PTC and the moisture content (mc%) of the oil-immersed cellulose pressboards. Furthermore, the functional relationship among moisture, test temperatures, and the feature parameter calculated by these coefficients is established. Thus, the PTC data at various temperatures can be calculated by the established function. The potential application ability of the proposed method is verified by comparing the calculated results with the measured results obtained from the various samples.
1. Introduction
The condition of oil-immersed electrical equipment is particularly important to the safe operation of the power grid [1,2]. The deterioration state of the insulation system is serviced as an important indicator to assess the stability of operation. The insulation system of oil-immersed electrical equipment is composed of solid insulation and liquid insulation, while oil-immersed cellulose insulating material is the main component of solid insulation [3], and liquid insulation refers to insulating oil. However, the solid insulation of the oil-immersed electrical equipment cannot be replaced after aging, while the insulating oil can be improved by filtering or changing oil [4]. Therefore, the condition assessment of the solid insulation of oil-immersed equipment is of great significance.
Exploring the deterioration regularity of oil-immersed cellulose insulating materials and assessing their insulation state accurately plays an important role in the safe operation of power systems. The existing methods for evaluating the oil-immersed cellulose insulating materials can be divided into the sampling method and the nondestructive method. The sampling method refers to sampling the oil-immersed cellulose insulating of the transformer and obtain the DP of the sample by using the viscosity test method [5]. Sampling method can obtain the insulation state of cellulose intuitively. However, since sampling will destroy the integrity of the oil-immersed cellulose insulating system, it is unrealistic to apply the sampling method to the on-site transformer condition assessment. The nondestructive method is to measure the parameters that can reflect the insulation state without destroying the integrity of the oil-immersed cellulose insulating system. The methods used for nondestructive evaluation of cellulose insulating systems include I. The detection of byproducts (dissolved gas [6], furfural [7], acids [8], etc.) dissolved in oil; II. Traditional electrical parameter (dielectric dissipation factor at power frequency, insulation resistance test, etc.) test method; III. Partial discharge technique [9,10]; IV. Dielectric response technique including recovery voltage measurement (RVM) [11], the frequency domain spectroscopy (FDS) [12,13] and polarization/depolarization current measurements (PDC) [14,15,16]. Among these, the PDC based on time–domain dielectric response has received extensive attention in recent decades due to its advantages of time saving and convenient testing [17].
Related studies show that temperature is an important factor that affects the PDC data [18,19]. The polarization rate and intensity are increased by the rising temperature, which leads to different polarization currents measured from the same object [20]. Moreover, the temperature-dependence parameters extracted by PDC data are not suitable for analyzing the insulation state under different temperatures without any correction. Therefore, to obtain the PDC data at the given temperatures from which measured at other temperatures, as well as eliminate the temperature influence on the PDC data, a method for temperature conversion is necessary and fundamental.
Currently, many researchers are interested in the temperature influence on dielectric response [21,22,23], the “master curve” which based on the Arrhenius equation is specifically applied in this field [24,25,26]. By shifting the polarization/depolarization curves measured at different temperatures to the given temperature, the master curve can be naturally constructed to extract the expected shift factor. However, the moisture effect on the temperature dependence of the polarization response is ignored in the existing studies, which results in an obvious error on the result of temperature correction. In fact, the dielectric response property of the oil-immersed cellulose insulation at the same temperature will be severely affected by the impact generated by various moisture [26,27,28,29]. Therefore, it is inaccurate to consider only the influence of temperature in the study of the temperature conversion of oil-immersed cellulose insulation.
Given the above issues, a novel model based on the combination of the power series theory and the time–domain dielectric response technique was developed to realize the temperature conversion of polarization time-varying current (PTC) of cellulose insulation materials. In the current work, the oil-immersed cellulose pressboards with different moisture content were first prepared to access the PDC data which was used to calculate the PTC data at different temperatures. Subsequently, the power series theory was used to exploring the extraction method of the feature coefficients with PTC data involved. Afterwards, the change regularity among moisture, temperature and the parameters calculated by the above coefficients is studied and discussed, and a functional relationship is built to actualize the calculation of the PTC data at various temperatures. In addition, the relative error of the temperature correction of PTC data was found less than 20%, which proves the potential application ability of the proposed method.
2. The Theoretical Analysis of Power Series
Polarization current ip(t) is defined as the currents that flow through the cellulose pressboard under the step voltage, expressed as Equation (1) [19,23].
where U0 is the step voltage applied to the cellulose pressboard, C0 is the geometric capacitance, σ refers to the DC conductivity, ε0 is the vacuum permittivity and ε0 ≈ 8. 854 × 10−12 F/m, f(t) is the response function of the relaxation behavior.
In fact, a variety of polarization-current transient responses will appear in the oil-immersed cellulose pressboards under the excitation of the external electric field. Moreover, the total polarization response of dielectric material can be described by the sum of multiple attenuation-exponential functions according to the Debye relaxation theory [30]. As shown in Equation (2).
where n is the total number of polarization current transient response, Ai is the amplitude of the exponential function and τi represents the relaxation time constant. Therefore, every single-polarization current transient response can be expressed by Equation (3).
Each single-polarization transient function can be represented by a Taylor-power series [31]. Thus, Equation (4) can be obtained. The total items m contained in the series is close to infinite.
where,
When t0 is close to 0, Equation (4) can be written as:
Substitute Equation (6) into Equations (2) and (7) is derived.
where,
The PTC’ is the product of polarization current and measure time, the expression is shown in Equation (9):
Equation (10) can be obtained by substituting Equation (7) into Equation (9) :
where,
However, relevant literature shows that the test temperature has a significant effect on the PDC results [24,29]. Therefore, θj is related to both the type of pressboard and the test temperature. Moreover, the temperature dependence of the polarization response of cellulose pressboard is related to moisture, which means that the temperature characteristics of cellulose pressboards with different moisture content are different under the same temperature [23,29]. Therefore, the amplitude of θj is also related to the moisture content of cellulose pressboard. Given the above issue, Equation (10) can be further expressed as Equation (12) considering the influence of temperature and moisture content:
where, PTC is the polarization time-varying current, θ0 represents the initial step response, T is the test temperature, mc% represents the moisture content of the tested cellulose pressboard.
3. The Preparation and Testing Process of Oil-Immersed Cellulose Pressboards
The oil-immersed cellulose pressboards with the same aging state and different moisture content are prepared for the measurement of the PDC data. The cellulose pressboards and mineral insulating oil shown in Table 1 were selected as the materials for preparing the samples.

Table 1.
Details of the cellulose pressboards and mineral insulating oil.
In order to obtain samples with low initial moisture content, the cellulose pressboards and insulating oil were dried at 110 °C/50 Pa for 48 h. Then, balanced for 48 h at 60 °C/50 Pa in a tank so that the cellulose pressboard is fully oil-immersed. Finally, the oil-immersed cellulose pressboards with similar initial moisture content are obtained. The oil-immersed cellulose pressboards with different moisture contents can be obtained by the moisture absorption experiment [32]. With the prepared samples, the PTC data were obtained by a time–domain dielectric response test. The experimental process of this work is shown in Figure 1.
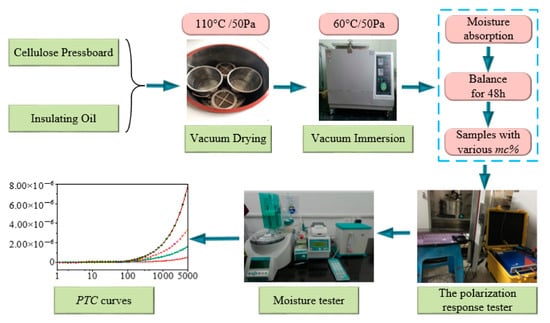
Figure 1.
Pretreatment and testing process of oil-immersed cellulose pressboards.
The PDC data were accessed by the time–domain dielectric response tester (using DIRANA, OMICRON Co., Ltd., Klaus, Austria) [33] with 200 V test voltage 5000 s measuring duration. Moreover, the three-electrode test device is used to connect the oil-immersed cellulose pressboards with DIRANA, as shown in Figure 2. In order to obtain PTC at different test temperatures, the three-electrode device is placed in a variable temperature test chamber. The sample was short-circuited and discharged for 8 h before each measurement was carried out. The moisture content of the oil-immersed cellulose pressboard is obtained by Karl Fischer titration according to the IEC 60814 [34].
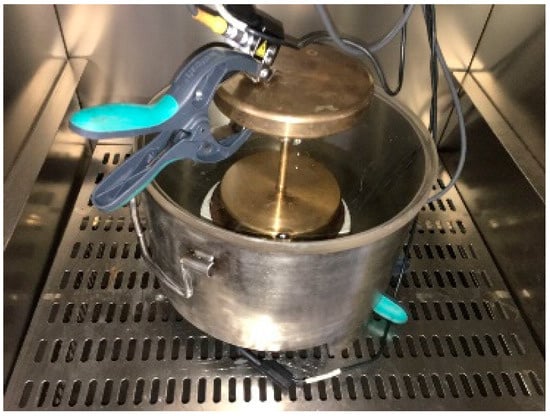
Figure 2.
Three-electrode test device.
4. The Novel Method for Calculating the PTC Data at Various Temperatures
4.1. The Feature Parameters Extraction on the PTC Data Based on the Power Series Theory
According to the experimental process described in the previous chapter, the oil-immersed cellulose pressboards with various moisture contents (1.13%, 1.94%, 2.82%, 3.36%) were prepared. The polarization currents of pressboards with the above moisture contents were measured at 45 °C, 60 °C, 75 °C and 90 °C to calculate the PTC data by multiplying the test duration t. The PTC curves were then simulated by the functional model expressed in Equation (12) according to the fitting analysis. The proper fitting accuracy and over-fitting prophylactic measure are considered during the fitting process. The corresponding Equation (12) when the amplitude of j is 4, 5, 6 and 7 were used to fitting the PTC curves, respectively. The average value of goodness-of-fit measure (R2) of fitting curves with mc% = 1.13% are shown in Table 2. Satisfactory average fitting goodness can be obtained when j = 6. Moreover, the fitting results of curves with various moisture content (1.94%, 2.82%, 3.36%) are consistent with this. Therefore, the power series in which the amplitude of j equal to 6 is used to describe the PTC curve.
Table 2.
Average R2 of fitting curves with mc% = 1.13% when j equal to various values.
The simulated results are drawn in Figure 3 by using the log-linear system.
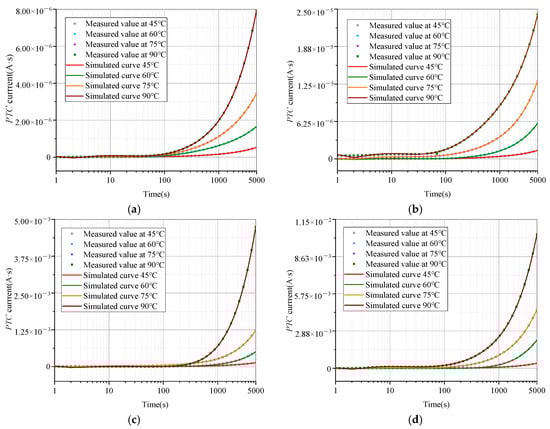
Figure 3.
Fitting results of polarization time-varying current (PTC) curves with different moisture contents and test temperatures. (a) mc% = 1.13%, (b) mc% = 1.94%, (c) mc% = 2.82%, (d) mc% = 3.36%.
The significant difference between the curves measured at different temperatures is observed after 100 s, since where the slope and amplitude of the curves increase exponentially as the temperature rise. This fact indicates that the conductivity and dielectric strength of the oil-immersed cellulose pressboard is enhanced as the temperature increases. It can be explained as the rising temperature will increase the mobility of carriers inside the cellulose pressboard, resulting in an increase in the conductivity and the response speed of the interface polarization response. At the same time, the rising temperature also exacerbates the unevenness of the dielectric properties at the oil–cellulose insulation interface, increasing the intensity of the interface polarization response [35].
It is worth noting that, the coefficient θj (j = 0, …, 6) in Equation (12) is related to the moisture content inside the cellulose insulating material and the test temperature. For discussion, the coefficient θj extracted by the fitting result of the PTC curve of the sample with a moisture content of 1.13% is shown in Table 3. It is observed that the value of coefficient θj is strongly connected to the measured temperature, which also shows that the temperature has a significant effect on the coefficient θj.
Table 3.
Coefficient θj of cellulose pressboard with moisture content of 1.13%
Due to the similar procedure to extract coefficients of PTC curves with various moisture and temperature. The variation trend of θ0 with different temperatures under various moisture is plotted in Figure 4. Of course, coefficients θ1–θ5 convey similar characteristics.
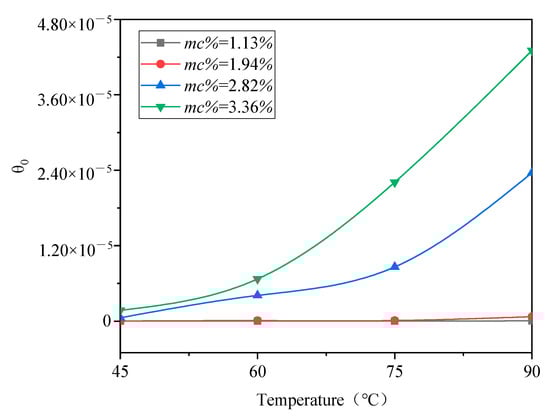
Figure 4.
Coefficient θ0 of cellulose pressboard with various moisture contents.
Out of Figure 4, the fitting curves of θ0 with the moisture content of 1.13% and 1.94% seems like a straight line. The reason is that their value is too small, resulting in the change of the curve is covered by other curves. Similarly, the coefficient θj can be also obtained.
To eliminate the unnecessary errors caused by the data dimension, the standard normalization is thus required to solve this issue. The normalized formula is shown in Equation (13), the coefficient θj-ref and θj-tes are extracted at 45 °C (i.e., reference temperature Tref) and other test temperature:
where, τj(mc%, T) is the normalized parameter, and it reflects the change amplitude of coefficient relative to the reference value. Moreover, j (j = 0, 1, 2, ..., 6) is used to represent different kinds of the coefficient. The mc% (1.13%, 1.94%, 2.82%, 3.36%) is used to represent the moisture content of oil-immersed cellulose pressboards. Moreover, T (45 °C, 60 °C, 75 °C, 90 °C) is the test temperature. The normalization results τj(mc%, T) are shown in Table 4 and Table 5.
Table 4.
Normalized parameters τj (mc%, T) with moisture content of 1.13% and 1.94%.
Table 5.
Normalized parameters τj(mc%, T) with moisture content of 2.28% and 3.36%.
4.2. Research on Temperature Conversion Method.
Form Table 4 and Table 5, for the same oil-immersed cellulose pressboard, the value of τj increases as the test temperature rise. Moreover, the higher the temperature, the greater the impact on τj. The trend of τ0 with different temperatures under various moisture contents is plotted in Figure 5.
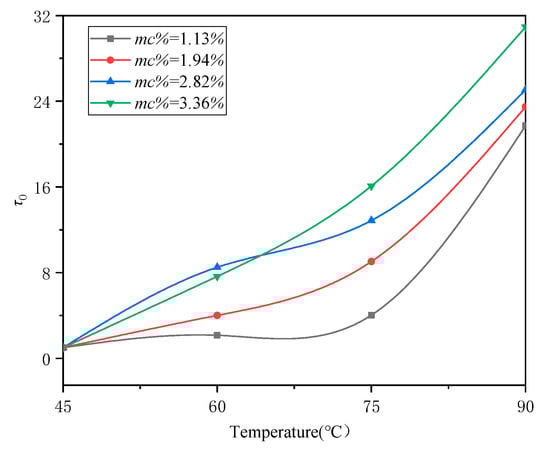
Figure 5.
Normalized parameters (τ0) of cellulose pressboards with various moisture content.
The effect of test temperature and moisture content on coefficient τ0 is clearly shown in Figure 5. The remaining normalized parameters τ1(mc%, T)–τ6(mc%, T) have similar characteristics. Thus, it is easy to determine the functional relationship among temperature, moisture content, and the normalized parameters by similar approaches.
If the θj-tes at any temperature can be calculated, then PTC data at the reference temperature can be converted to any temperature. However, the data in Table 4 and Table 5 show that τj(mc%, T) presents a stable change regularity with the change of temperature and moisture. Therefore, if the moisture of the cellulose pressboard is known, then, the τj at any temperatures can be calculated by using Equation (13). Combining the θj-ref at the reference temperature with the calculated τj(mc%, T), the coefficient θj-tes at any temperature in the selected regions can be calculated by Equation (14):
Based on the deep fitting technique and the data in Table 4 and Table 5, the functional model for calculating the normalized parameters τj(mc%, T) can be realized. The rational Taylor function was used to fit the relationship among τj(mc%, T), mc% and T, and the negligible error is set to 10−15. However, to get the appropriate fitting accuracy, τ5 is fitted by the function of rational 2D. The fitting results are shown in Table 6. Where, variable x and y are mc% and T, respectively.
Table 6.
Function model for calculating the normalized parameters τj(mc%, T).
The fitting goodness of each functional model is greater than 0.98, which indicates that there is a stable functional relationship between the independent variable (moisture and temperature) and the dependent variable τj(mc%, T). Based on the above function model, the normalized parameters τj(mc%, T) at any moisture and temperature can be calculated. Combined with the measured PTC data at the reference temperature, the PTC curve at any temperature can be thus calculated.
5. Verification Experiments in the Laboratory
To verify the potential application ability of the proposed for temperature conversion of PTC data, cellulose paperboard with a moisture content of 1.51% was used to obtain the PTC curves at 45 °C, 60 °C, 75 °C, 90 °C to carry out the verification experiments.
According to the previous chapter, the 45 °C is chosen as the reference temperature, the normalized parameters τj(mc%, T) of the verification samples at 60 °C, 75 °C and 90 °C can be calculated and the calculation results are shown in Table 7. Combining τj(mc%, T) shown in Table 7 and the coefficient θj-ref extracted from the test results at 45 °C, the coefficient θj-tes can be calculated. Then, the PTC curve at various temperatures can be calculated by substitute θj-tes into Equation (12). The measured PTC data and the calculated PTC curve of the verification sample at various temperatures are shown in Figure 6 (drawn in the log-linear system).
Table 7.
Calculation result of the normalized parameters of verification sample.
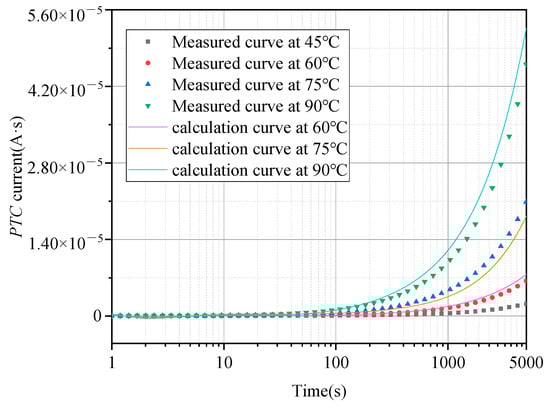
Figure 6.
Measured and calculated PTC curves of verification sample.
As shown in Figure 6, the PTC curve calculated by the reported method shown in Table 6 coincides with the measured curve of the verification samples, which verifies the potential application ability of the reported method could be utilized to the temperature conversion.
Although Figure 6 shows a good agreement between the calculation results and the measured data, it is necessary to perform error analysis on the calculation results. Relative error (RE) and root mean squared error (RMSE) can describe the deviation between calculated results and measured data and the expression is shown in Equations (15) and (16).
where, ti represents the sampling point, PTCm(ti) represents the measured value at point ti and PTCc(ti) is the calculation value at point ti. The parameter N represents the total number of sampling points. The sampling points of the test curve are 5000 and the step is 1 s in this study. The set of REi forms the curve of relative error, as shown in Figure 7. Table 8 shows the calculation results of RMSE.
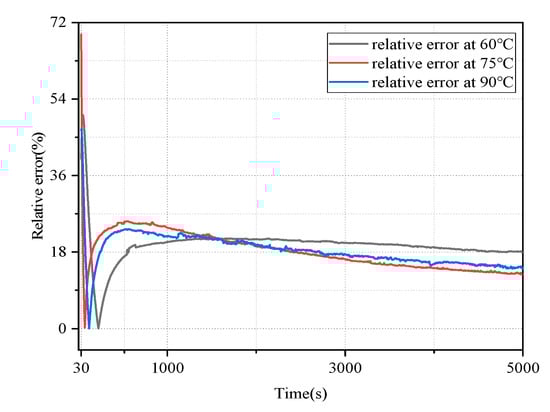
Figure 7.
Relative error (RE) of the calculation curves and the measured curves.
Table 8.
Root mean squared error (RMSE) of calculated data.
The negative value appears in the initial part of the calculated curves, which causes the relative error to become very large. However, this phenomenon only occurs at a few sampling points and the impact on the overall calculation result is not serious. Therefore, the relative error of 30−5000 s is shown in Figure 7, while the sampling points of 1−30 s are not calculated. It is shown in Figure 7 that the maximum relative error of the calculated curve is 69%, but the relative error of most calculation results is close to 18% and the RMSE at various temperatures is less than 0.37. Given the influence factors such as the slight fluctuation of the measured temperature on the test results, the results of the error analysis are considered acceptable
In order to illustrate the feasibility of the proposed method, the calculated curves of the verification sample at different temperatures are calculated based on the “master curve” technique [25]. The relative error between the calculated curves and the measured curves is shown in Figure 8.
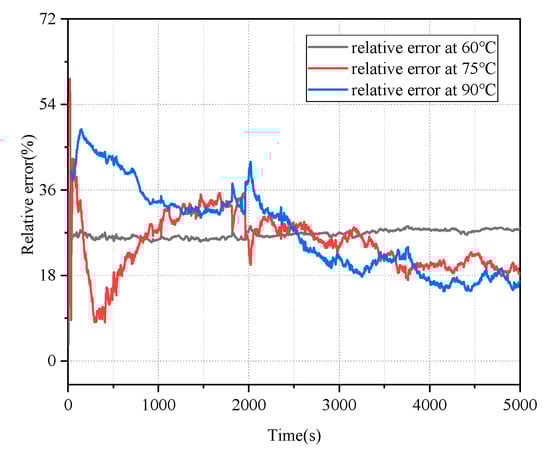
Figure 8.
RE of the calculation curves and the measured curves based on the “master curve” technique.
It is clear that the method reported in this article has a smaller relative error, which shows that the reported method has higher accuracy in the conversion of polarization current data under different temperatures. The reported method in this article can promote the research work of dielectric response technology in transformer insulation condition evaluation.
6. Conclusions
The PTC curves of oil-immersed cellulose pressboards with various moisture contents are characterized by a functional model based on the power series theory. In addition, the effect of moisture content and test temperature on the coefficients used in the power series is explored. Finally, the temperature conversion method is proposed which considering the influence of moisture content and temperature. This article has the following conclusions.
- A functional model based on the power series theory is applied to fitting the PTC curve of oil-immersed cellulose pressboards. A sixth-order power function model is used by including the proper fitting accuracy and overfitting prophylactic measure. The average value of goodness-of-fit measure exceeding 0.99, which indicates that the sixth-order power series model can be used to describe the PTC curve accurately;
- The coefficient θj (i = 0, 1, ..., 6) used in the sixth power series model is related to both the moisture inside the oil-immersed cellulose and the test temperature. The mathematical model among the normalized parameters (τj) of coefficient θj, the moisture inside the oil-immersed cellulose and the test temperature can be established by depth fitting technique;
- Relying on the computed parameters τj(mc%, T) and θj-tes by using the mentioned mathematical model and Equation (14), the PTC curve at any temperature can be calculated by the sixth-order power series model and the conversion of PTC curve between different temperatures is thus realized;
- Findings reveal that the obtained relative error of the temperature correction is less than 20%, which proves the feasibility of the proposed method. In particular, the proposed model outperforms the “master curve” technique which does not take into account the effects of moisture content;
- This work provides a novel method to correct the temperature effect on the PTC data, which is expected to promote the evaluation of aging or wetness of transformer cellulose insulating material.
Author Contributions
In this research activity, B.L. and S.Y. designed the experiments and performed the writing; Y.Z. is corresponding authors; H.Z. helped carry out the experiment; Y.Z., X.F. and J.L. edited the manuscript. All authors have analyzed the data and approved the submitted manuscript.
Funding
This work was supported in part by the National Natural Science Foundation of China (61473272; 51867003) and in part by the Natural Science Foundation of Guangxi (2018JJB160064; 2018JJA160176), the Guangxi Bagui Young Scholars Special Funding, the Boshike Award Scheme for Young Innovative Talents, the Guangxi Key Laboratory of Power System Optimization and Energy Technology Project (AE3020001829), the Basic Ability Improvement Project for Young and Middle-aged Teachers in Universities of Guangxi (20190067; 20190046).
Conflicts of Interest
The authors declare no conflict of interest.
References
- N’Cho, J.S.; Fofana, I.; Hadjadj, Y.; Beroual, A. Review of Physicochemical-Based Diagnostic Techniques for Assessing Insulation Condition in Aged Transformers. Energies 2016, 9, 367. [Google Scholar] [CrossRef]
- Alsuhaibani, S.; Khan, Y.; Beroual, A.; Malik, N.H. A Review of Frequency Response Analysis Methods for Power Transformer Diagnostics. Energies 2016, 9, 879. [Google Scholar] [CrossRef]
- Linhjell, D.; Lundgaard, L.; Gafvert, U. Dielectric response of mineral oil impregnated cellulose and the impact of aging. IEEE Trans. Dielectr. Electr. Insul. 2007, 14, 156–169. [Google Scholar] [CrossRef]
- Liu, J.; Fan, X.; Zhang, Y.; Zhang, C.; Wang, Z. Aging evaluation and moisture prediction of oil-immersed cellulose insulation in field transformer using frequency domain spectroscopy and aging kinetics model. Cellulose 2020, 27, 7175–7189. [Google Scholar] [CrossRef]
- Emsley, A.; Stevens, G. Review of chemical indicators of degradation of cellulosic electrical paper insulation in oil-filled transformers. IEE Proc. Sci. Meas. Technol. 1994, 141, 324–334. [Google Scholar] [CrossRef]
- Liu, J.F.; Fan, X.H.; Zhang, C.H.; Lai, C.S.; Zhang, Y.Y.; Zheng, H.B.; Lai, L.L.; Zhang, E.Z. Moisture diagnosis of transformer oil-immersed insulation with intelligent technique and frequency-domain spectroscopy. IEEE Trans. Ind. Inform. 2020. [Google Scholar] [CrossRef]
- Sun, W.; Yang, L.; Zare, F.; Lin, Y.; Cheng, Z. Improved method for aging assessment of winding hot-spot insulation of transformer based on the 2-FAL concentration in oil. Int. J. Electr. Power Energy Syst. 2019, 112, 191–198. [Google Scholar] [CrossRef]
- Lundgaard, L.E.; Hansen, W.; Ingebrigtsen, S. Ageing of Mineral Oil Impregnated Cellulose by Acid Catalysis. IEEE Trans. Dielectr. Electr. Insul. 2008, 15, 540–546. [Google Scholar] [CrossRef]
- Jiang, J.; Zhao, M.; Zhang, C.; Chen, M.; Liu, H.; Albarracín-Sánchez, R. Partial Discharge Analysis in High-Frequency Transformer Based on High-Frequency Current Transducer. Energies 2018, 11, 1997. [Google Scholar] [CrossRef]
- Siegel, M.; Coenen, S.; Beltle, M.; Tenbohlen, S.; Weber, M.; Fehlmann, P.; Hoek, S.M.; Kempf, U.; Schwarz, R.; Linn, T.; et al. Calibration Proposal for UHF Partial Discharge Measurements at Power Transformers. Energies 2019, 12, 3058. [Google Scholar] [CrossRef]
- Patsch, R. Return Voltage Measurements—A Promising Tool for the Diagnosis of the Insulation Condition of Power Transformers. In Proceedings of the 2018 IEEE International Conference on High Voltage Engineering and Application (ICHVE), Athens, Greece, 10–13 September 2018. [Google Scholar]
- Yang, F.; Du, L.; Yang, L.; Wei, C.; Wang, Y.; Ran, L.; He, P. A Parameterization Approach for the Dielectric Response Model of Oil Paper Insulation Using FDS Measurements. Energies 2018, 11, 622. [Google Scholar] [CrossRef]
- Zhang, D.; Yun, H.; Zhan, J.; Sun, X.; He, W.; Niu, C.; Mu, H.; Zhang, G.-J. Insulation condition diagnosis of oil-immersed paper insulation based on non-linear frequency-domain dielectric response. IEEE Trans. Dielectr. Electr. Insul. 2018, 25, 1980–1988. [Google Scholar] [CrossRef]
- Saha, T.K.; Purkait, P. Investigation of polarization and depolarization current measurements for the assessment of oil-paper insulation of aged transformers. IEEE Trans. Dielectr. Electr. Insul. 2004, 11, 144–154. [Google Scholar] [CrossRef]
- Wei, J.-L.; Zhang, G.-J.; Xu, H.; Peng, H.-D.; Wang, S.-Q.; Dong, M. Novel characteristic parameters for oil-paper insulation assessment from differential time-domain spectroscopy based on polarization and depolarization current measurement. IEEE Trans. Dielectr. Electr. Insul. 2011, 18, 1918–1928. [Google Scholar] [CrossRef]
- Saha, T.K. Review of time-domain polarization measurements for assessing insulation condition in aged transformers. IEEE Trans. Power Deliv. 2003, 18, 1293–1301. [Google Scholar] [CrossRef]
- Setayeshmehr, A.; Fofana, I.; Borsi, H.; Gockenbach, E.; Eichler, C.; Akbari, A. Dielectric spectroscopic measurements on transformer oil-paper insulation under controlled laboratory conditions. IEEE Trans. Dielectr. Electr. Insul. 2008, 15, 1100–1111. [Google Scholar] [CrossRef]
- Hao, J.; Liao, R.; Chen, G.; Ma, Z.; Yang, L. Quantitative analysis ageing status of natural ester-paper insulation and mineral oil-paper insulation by polarization/depolarization current. IEEE Trans. Dielectr. Electr. Insul. 2012, 19, 188–199. [Google Scholar] [CrossRef]
- Saha, T.K.; Purkait, P. Investigations of temperature effects on the dielectric response measurements of transformer oil-paper insulation system. IEEE Trans. Power Deliv. 2008, 23, 252–260. [Google Scholar] [CrossRef]
- Saha, T.K.; Purkait, P. Understanding the impacts of moisture and thermal ageing on transformer’s insulation by dielectric response and molecular weight measurements. IEEE Trans. Dielectr. Electr. Insul. 2008, 15, 568–582. [Google Scholar] [CrossRef]
- Liu, J.; Fan, X.; Zhang, Y.; Zheng, H.; Jiao, J. Temperature correction to dielectric modulus and activation energy prediction of oil-immersed cellulose insulation. IEEE Trans. Dielectr. Electr. Insul. 2020, 27, 956–963. [Google Scholar] [CrossRef]
- Liu, J.; Fan, X.; Zhang, Y.; Zheng, H.; Zhang, C. Condition prediction for oil-immersed cellulose insulation in field transformer using fitting fingerprint database. IEEE Trans. Dielectr. Electr. Insul. 2020, 27, 279–287. [Google Scholar] [CrossRef]
- Fofana, I.; Hemmatjou, H.; Farzaneh, M. Low temperature and moisture effects on polarization and depolarization currents of oil-paper insulation. Electr. Power Syst. Res. 2010, 80, 91–97. [Google Scholar] [CrossRef]
- Fofana, I.; Hemmatjou, H.; Meghnefi, F. Effect of thermal transient on the polarization and depolarization current measurements. IEEE Trans. Dielectr. Electr. Insul. 2011, 18, 513–520. [Google Scholar] [CrossRef]
- Ma, Z.; Liao, R.; Zhao, X.; Wang, Y.; Yang, L. Influence of temperature on polarization and depolarization current of oil-paper insulation. Trans. China Electrotech. Soc. 2012, 29, 426–430. [Google Scholar] [CrossRef]
- Zheng, H.B.; Lai, B.H.; Zhang, Y.Y.; Liu, J.F.; Yang, S.C. Correction for Polarization Current Curve of Polymer Insulation Materials in Transformers Considering the Temperature and Moisture Effects. Polymers 2020, 12, 143. [Google Scholar] [CrossRef]
- Mishra, D.; Baral, A.; Chakravorti, S. De-noising of time-domain spectroscopy data for reliable assessment of power transformer insulation. IET Gener. Transm. Distrib. 2020, 14, 1500–1507. [Google Scholar] [CrossRef]
- Liu, J.F.; Fan, X.H.; Zhang, Y.Y.; Li, S. Frequency Domain Spectroscopy Prediction of Transformer Oil-Immersed Cellulose Insulation under Diverse Temperature and Moisture. IEEE Trans. Dielectr Electr Insul. 2020. [Google Scholar] [CrossRef]
- Zupan, T.; Mikulecky, A.; Ziger, I. Ageing, Temperature and Water Content Influence on Oil-Paper Insulation: Model Preparation. In Proceedings of the IEEE International Conference on Dielectrics (ICD), Budapest, Hungary, 1–5 July 2018; Volume 1, pp. 1–4. [Google Scholar]
- Baral, A.; Chakravorti, S. A modified Maxwell model for characterization of relaxation processes within insulation system having non-uniform aging due to temperature gradient. IEEE Trans. Dielectr. Electr. Insul. 2013, 20, 524–534. [Google Scholar] [CrossRef]
- Odibat, Z.; Shawagfeh, N. Generalized Taylor’s formula. Appl. Math. Comput. 2007, 186, 286–293. [Google Scholar] [CrossRef]
- Liu, J.; Fan, X.; Zhang, Y.; Zheng, H.; Zhu, M. Quantitative evaluation for moisture content of cellulose insulation material in paper/oil system based on frequency dielectric modulus technique. Cellulose 2019, 27, 2343–2356. [Google Scholar] [CrossRef]
- Koch, M.; Kruger, M. A Fast and Reliable Dielectric Diagnostic Method to Determine Moisture in Power Transformers. In Proceedings of the International Conference on Condition Monitoring & Diagnosis, Beijing, China, 21–24 April 2008; pp. 467–470. [Google Scholar]
- International Electrotechnical Commission (IEC). IEC 60814:1997, Insulating Liquids—Oil-Impregnated Paper and Pressboard—Determination of Water by Automatic Coulometric Karl Fischer Titration; International Electrotechnical Commission (IEC): Geneva, Switzerland, 1997. [Google Scholar]
- Zhang, G.J. Experimental Research on Effects of Temperature and Aging State on Time Domain Dielectric Response Characteristics of Oil-impregnated Pressboard Insulation. Proc. CSEE 2012, 32, 69–75. [Google Scholar]


© 2020 by the authors. Licensee MDPI, Basel, Switzerland. This article is an open access article distributed under the terms and conditions of the Creative Commons Attribution (CC BY) license (http://creativecommons.org/licenses/by/4.0/).