Article

Electric Vehicles and Biofuels Synergies in the Brazilian Energy System

by
Géremi Gilson Dranka
1,2 and
Paula Ferreira
1,*
1
ALGORITMI Research Center, School of Engineering, University of Minho, 4800-058 Guimarães, Portugal
2
Department of Electrical Engineering, Federal University of Technology—Paraná (UTFPR), Pato Branco 85503-390, Brazil
*
Author to whom correspondence should be addressed.
Energies 2020, 13(17), 4423; https://doi.org/10.3390/en13174423
Submission received: 30 June 2020 / Revised: 27 July 2020 / Accepted: 29 July 2020 / Published: 27 August 2020
(This article belongs to the Special Issue Planning, Integration and Management in Sustainable Energy Systems)

Abstract

:
Shaping a secure and sustainable energy future may require a set of transformations in the global energy sector. Although several studies have recognized the importance of Electric Vehicles (EVs) for power systems, no large-scale studies have been performed to assess the impact of this technology in energy systems combining a diverse set of renewable energies for electricity production and biofuels in the transportation sector such as the case of Brazil. This research makes several noteworthy contributions to the current literature, including not only the evaluation of the main impacts of EVs’ penetration in a renewable electricity system but also a Life-Cycle Assessment (LCA) that estimates the overall level of CO2 emissions resulted from the EVs integration. Findings of this study indicated a clear positive effect of increasing the share of EVs on reducing the overall level of CO2 emissions. This is, however, highly dependent on the share of Renewable Energy Sources (RES) in the power system and the use of biofuels in the transport sector but also on the credits resulting from the battery recycling materials credit and battery reuse credit. Our conclusions underline the importance of such studies in providing support for the governmental discussions regarding potential synergies in the use of bioresources between transport and electricity sectors.

Graphical Abstract

1. Introduction

The long-term effects of global climate change have driven considerable critical attention of researchers and policy-makers mainly in recent decades. According to the Intergovernmental Panel on Climate Change, “taken as a whole, the range of published evidence indicates that the net damage costs of climate change are likely to be significant and to increase over time”. The United Nations Member States adopted in 2015 the 17 Sustainable Development Goals (SDGs) highlighting the need to develop affordable and clean energy solutions to address future worldwide challenges. A recent paper published in Nature Sustainability presented a structured review addressing whether or not climate change may affect these 17 SDGs. The authors presented evidence that although combatting climate change may reinforce all the SDGs targets, it may even be a threat to reach part of those targets (i.e., 12 out of 17) [1]. The impact on future energy demand due to climate change is predicted to increase but it would depend on a set of interacting sources of uncertainty and it would vary among regions in the world [1].
The concepts of Decarbonization, Digitalization and Decentralization are expected to drive the power system evolution worldwide [2]. The challenges and opportunities to achieve a globally sustainable energy future are investigated in [3], which also highlight the increasing competitiveness of renewable energy with other sources of energy. Renewable Energy Sources (RES) coupled with energy efficiency and demand-side flexibility measures appear as great potential contributors to address these climate-related challenges towards a more sustainable world [4,5,6]. However, the high share of Renewable Energy Sources (RES) in power systems may also lead to grid stability problems due to the mismatch between electricity demand and power production. The implementation of balancing measures is therefore required which includes the use of energy storage technologies, demand-side management strategies, curtailment and backup power generation, for example. The electric mobility mainly through the Electric Vehicles (also known as plug-in electric vehicles or electric cars) (EVs) would also provide an important role in providing flexibility to power systems since it may function as a storage system with the possibility to absorb the surplus production from renewables, for example [2,7,8,9]. The authors of [10,11] also highlight the significant role of EVs in the decarbonization of the transportation sector. Global targets project over 100 million EVs by 2050 [11]. IRENA [12] highlights that “electric vehicles (EVs) hold the key to unleash synergies between clean transport and low-carbon electricity”.
The benefits brought about by the use of EVs cover a wider scope. In addition to the possibility of decarbonizing the electricity system, EVs will provide valuable flexibility requirements for the power system, optimizing the renewable resources usage, reducing the reliance on imported oil [13], lowering the transmission system utilization, reducing local air pollution and carbon emissions [13], among others. Literature reveals that cars are idle in parking between 90% and 95% of their lifetime [12] and therefore combined with its storage capacity, EVs fleet can provide a high level of flexibility to support power system operations. The insertion of flexible loads in power systems may also provide reduced costs for larger integration of renewables. However, new market rules would be required to achieve lower-cost solutions. Therefore, the flexibility provided by the demand-side is projected to be a valuable resource in the future by also contributing towards a sustainable future.
The transition towards a smart power system configuration, however, requires an integrated energy planning approach which should also take into account the synergies between electricity and transportation sectors. Notwithstanding, there is a relatively small body of literature that is concerned with the impact analysis of EVs penetration in the future power generation mix of renewable-based electricity systems. The impact of EVs on a system with high penetration of wind power was addressed in [14]. The authors of [15] investigated the integration of RES into the transport and electricity sectors through V2G technology. Thus far, previous studies have attempted to evaluate the impact of electric vehicles in the power generation mix for selected countries such as Portugal [16], Belgium [16], France [16], Spain [16], Ireland [16], Norway [16], Austria [16], Italy [7], Germany [7], Great Britain [17] and Greece [17], just to name a few examples. It has been conclusively shown that the impacts in the future electricity mix differ significantly for each power system which is deeply dependent on the share of renewable energy in each system. Therefore, the generalizability of much-published research on this issue is problematic since the results would vary significantly among countries.
However, although several studies have recognized the importance of EVs for power systems in general, there is a current paucity of scientific literature focusing specifically on the contribution of EVs in energy systems which combines a diverse set of renewable energies for electricity production and biofuels in the transportation sector. The Brazilian energy system will then be used as the case study in this research since it is already mostly supplied by RES and relies deeply on biofuels but also because of its high RES potential and future vulnerability to climate change [18]. The author of [2] stresses the future role that EVs might play in the country and also emphasizes the importance of evaluating the impact of this technology on the power sector. The high reliance on biofuels in the country for both the transportation and electricity sectors also make this study fundamental to verify, for instance, the synergies between clean transport and low-carbon electricity through electric vehicles and biofuels use. Therefore, this study set out to investigate the implications of EVs penetration in a high RES system with a particular focus on evaluating the impact in the overall future power generating mix but we also aim to assess the extent to which EVs might have on reducing the overall level of carbon dioxide emissions. This means that our findings should provide important insights into the role of EVs in a system with high reliance on renewable energies for electricity production and biofuels in the transportation sector.
The paper has been divided into six sections. This first section introduced the topic under study by providing a brief theoretical background. Section 2 gives a brief overview of the energy and transportation sector in Brazil, but it also highlights fundamental aspects regarding EVs technology. The materials and methods are then presented in Section 3 followed by the practical application (Section 4). Section 5 addresses the main conclusions and policy implications followed by the main limitations and the suggestions to future research in Section 6.

2. Theoretical Background

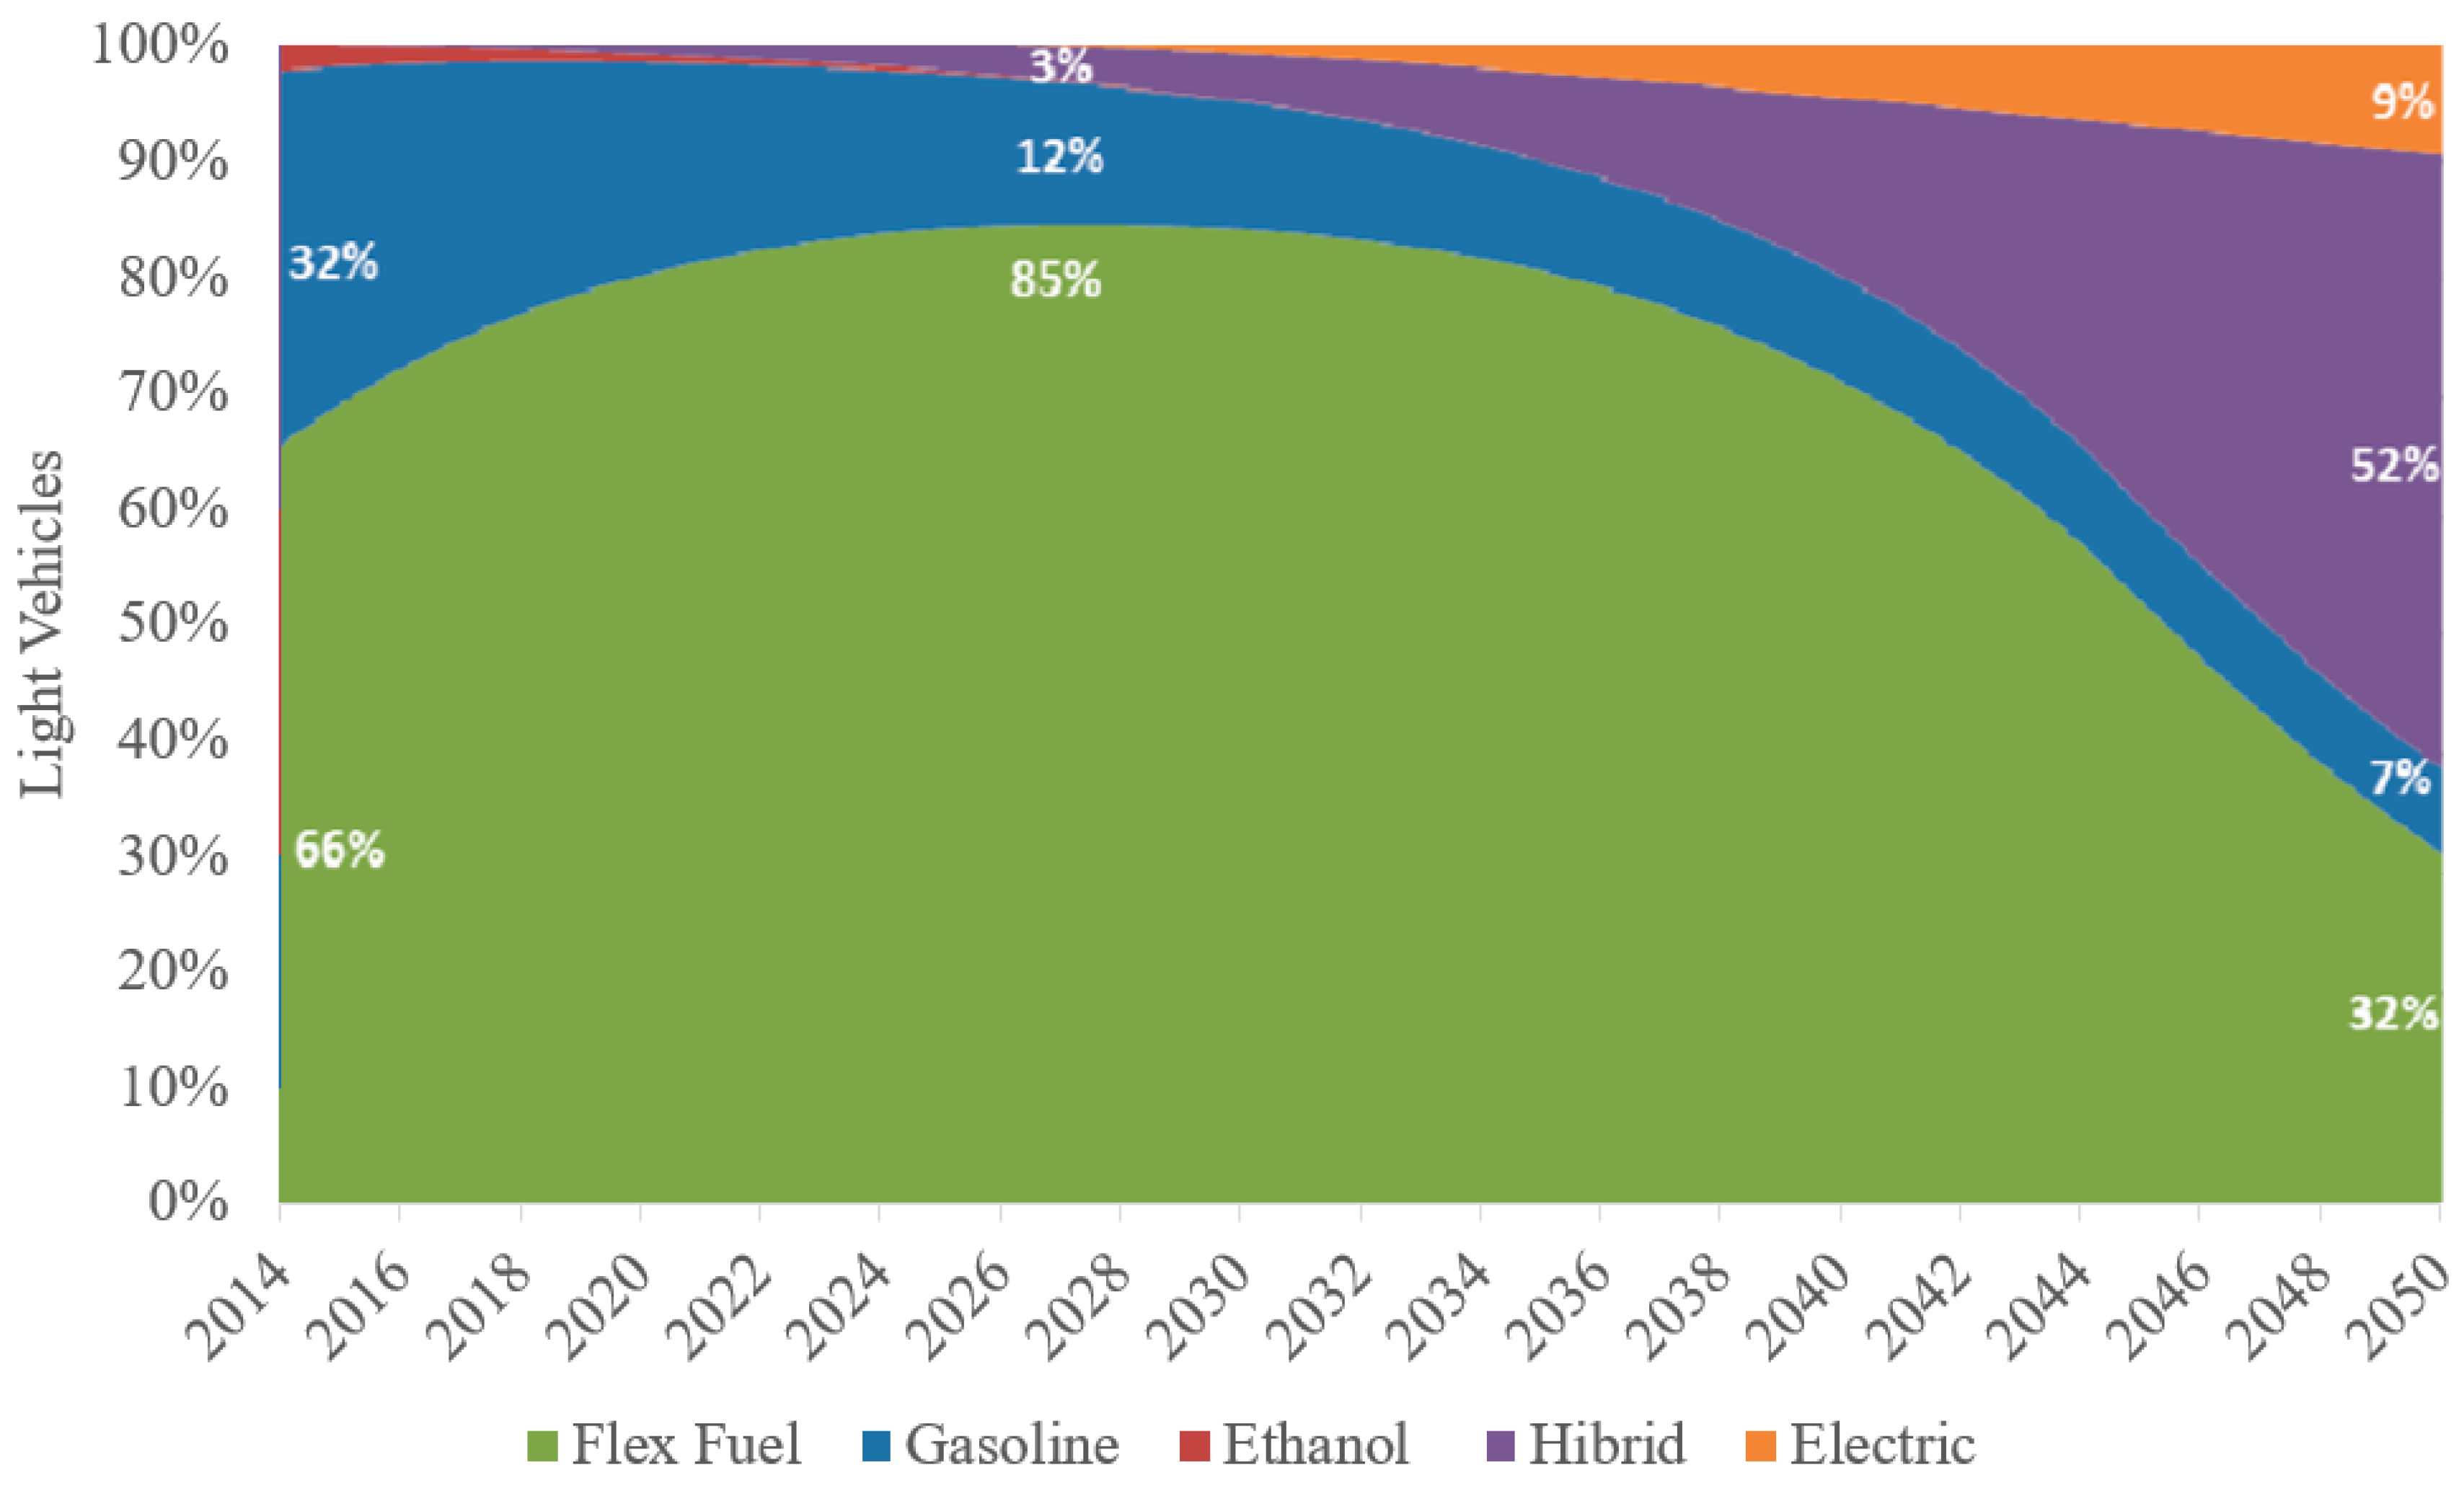
2.1. Energy and Transport Sector in Brazil

Several challenges for the energy and transportation sectors are arising from the wide range of alternative developments worldwide. Brazil has the largest electricity market in South America and it is seen as one of the leading countries in renewable installed capacity worldwide mostly because of its high hydropower capacity which currently accounts for near 109.3 GW (62.51%) out of 174.5 GW [4,19]. Renewable energy in the country now accounts for over 82.77% of the overall installed capacity. Electricity generation from RES by 2018 was composed of 66.6% from hydropower; 8.5% biomass; 7.6% wind and 0.5% from solar power [20]. Fossil fuel power sources also develop a key role in the country (29.3 GW–16.80%) followed by wind power which reached 15.9 GW (9.1%) in 2020. The current overall installed capacity of biomass for electricity generation represents near 15.2 GW (8.75%) and the remaining installed capacity comes from solar power (2.9 GW–1.68%) and nuclear power plants (1.99 GW–1.14%).
The importance of bioenergy for the global renewable energy supply is discussed in [21]. It is well known that policies related to transport in Brazil focus largely on biofuels. Brazil is the second-largest producer of biofuels in the world and together with EUA accounted for 69% of biofuel production in 2018 [21]. Biofuels in Brazil has set a new production record in 2018, with the delivery of over 32 billion liters from biodiesel and over 5 billion liters from ethanol [22]. The spatial techno-economic potential of bioelectricity production from sugarcane is assessed in [23], based on a Brazilian case-study in which the authors concluded that the prices for bioelectricity production may vary from 68 to 266 US$/MWh. The Brazilian National Energetic Policy Council (in Portuguese, CNPE) recently published Resolution N° 14 (June 2017) defining the role of biofuels in the country’s energy mix, recognizing the ability of biofuels in the decarbonization of the transport sector but also highlighted the need to attract new investments for the sector. The authors of [24] also highlighted the potential of biofuels in Brazil for reducing carbon dioxide emissions. Apart from the biofuel’s reliance in Brazil, the country also relies mostly on fossil fuels. The current light vehicles fleet is composed primarily by flex fuels and gasoline vehicles. However, a steadily increase for both hybrid and EVs are projected for the future such as presented in Figure 1 which illustrates the projected light vehicles fleet profile by fuel in Brazil between 2014 and 2050 [25].
The markets of EVs are still in the early stages of development in the country and there is a long way before EVs may become dominant [26] not only in the global market but even more for the case of developing countries such as the case of Brazil. The deployment of EVs may also represent a great opportunity for the power sector since EV fleets would offer a great level of flexibility through its vast storage capacity [12]. The Brazilian Electricity Regulatory Agency (in Portuguese, ANEEL) established recently the first regulation for EVs in the country such as better discussed in [2]. The authors [2] also pointed out the slow pace of growth of EVs for the case of Brazil and highlighted that regulation for electrical vehicles is still emerging in the country.
Reducing GHG emissions and in particular carbon dioxide emissions is considered one of the greatest challenges of all nations in order to hold the increase of the global mean temperature and to meet the targets proposed by the Paris Agreement. Electricity and transportation sectors both have been historically the greatest contributors to carbon emissions and the case of Brazil is no exception to this universal trend. The analysis of GHG emissions in Brazil is addressed in [27] for the period 1970 to 2015 at the national and subnational level and considering the energy, agriculture, product use, industrial processes, waste and land-use change sectors. The overall amount of CO2 emissions in the Brazilian energy sector amounted to 416.1 million tons in 2018. CO2 emissions from passenger transport accounted for over 46% of all country emissions in 2018 (192.7 Mt CO2) [20]. The electricity sector, in particular, accounted for 88 kg CO2/MWh (2018) which is much lower than base values for Europe, China and EUA, for example [20]. It is now generally accepted that the introduction of EVs might contribute to reducing GHG emissions. However, the extent to which it can support this reduction would strongly vary among countries depending mostly on the share of renewables in each power system but it may also differ depending on the set of categories included in the CO2 evaluation.

2.2. Electric Vehicles (EVs)

Electric Vehicles (EVs) would represent a disruptive model and have emerged as a valuable resource for the transportation sector but also as a potential source of flexibility to power systems. According to the Bloomberg New Energy Finance (BNEF), EVs are expected to be cheaper than internal combustion engines by 2025. Regarding the greenhouse gas emissions (GHG) emissions, the authors of [12] highlight the lower level of GHG emissions for EVs compared with Internal Combustion Engines (ICE) vehicles even in the case of charging the EVs with electricity from fossil fuels. However, the overall level of CO2 emissions from EVs depends on the electricity supply mix of each power system. The authors of [13] highlight that, although it is a general consensus that EVs can reduce carbon emissions, its real effectiveness depends largely on the electricity mix of each country. The authors of [13] evaluated the electric cars’ emissions for twenty countries based on their current electricity mix and concluded that even for some coal dominated power generating systems such as China, EVs emissions can be compared to average petrol vehicle levels. However, for low carbon systems such as Paraguay and Sweden, the emissions can be less than half the best petrol hybrids.
The integration between electric vehicles and renewable energy for sustainable mobility is addressed in [10]. The integration between renewable energy with the Vehicle-to-Grid (V2G) technology for islanded energy systems is studied in [23] by using both the Long-range Energy Alternatives Planning System (LEAP) and EnergyPLAN software in their modeling approach. A literature review related to the future of transportation in sustainable energy systems is presented in [28] which also traces the importance of electric modes of transportation to promote the largest benefits in the transport transition. A multiobjective optimization model was developed by [29] with a particular focus on finding the most efficient bus fleet combination for a city located in the South region of Brazil. The authors pointed out the electrical bus as the best choice for reducing greenhouse gas emissions among the other analyzed alternatives.
Presently, EVs have been mostly powered by lithium-ion batteries [26]. IRENA projects an amount of about 14 TWh of EV batteries by 2050 compared to 9 TWh for stationary batteries [12]. The authors of [26] addressed a set of storage technologies with the greatest potential to develop in the future for commercial applications including batteries and hydrogen fuel cells. The challenges and barriers which should be overcome the technological status of these storage technologies were also addressed in [26].
There are two primary arrangements for charging the EVs in a controllable strategy, the so-called one way “smart charging” and the two-way “vehicle-to-grid—V2G” strategy. Smart charging can be defined as “adapting the charging cycle of EVs to both the conditions of the power system and the needs of vehicle users [12]”. Therefore, smart charging can be considered a way of optimizing the battery charging process and it is considered essential to avoid increases in peak load in the case of EVs would be charged in an uncontrolled way [12]. Smartly charged EVs enables a set of benefits for power systems in general by providing ancillary services to the grid, reducing curtailment, cutting peak load, managing network congestion, reducing grid infrastructure investments, improving local electricity consumption from Variable Renewable Energy (VRE) and it might also allow higher shares of low-cost PV electricity. In general, a decrease in the overall level of CO2 emissions is achieved through a smart charging strategy since higher shares of renewables are allowed using the smart charging approach [12]. Previous research has also demonstrated that “using vehicle-to-grid-based storage increases the efficiency of renewable energy utilization” [30]. V2G technology also provides additional benefits for the power system such as frequency regulation services [31,32,33].
The synergies between low-carbon electricity and a cleaner transport sector may be higher through the use of a smart charging strategy [12]. The authors of [34] addressed a particular control strategy aiming to achieve the optimal daily charging profile for EVs in a microgrid environment. The authors of [35], for example, addressed the use of dynamic pricing for charging EVs concluding that hourly pricing should be the best alternative. Grid reinforcements are also reduced by using a smart charging approach (near 10% of the cost of grid reinforcement) [12]. Solar PV profiles would partially match the EVs charging (considering an uncontrolled charging strategy) in the case of considering office charging, for example [12]. However, for a smart charging strategy, the benefits for solar PV systems are considerably increased since with the use of batteries it would allow the power to be dispatched later. In general, overnight charging strategies would benefit wind-based energy systems especially in regions where average wind speed profiles are higher in the evening and at night [12]. The authors of [12] highlight that the optimal charging patterns for EVs will strongly depend on the energy mix of each country and would differ for systems with higher shares of wind power compared with systems where solar power prevails. Due to its higher predictability, the smart charging approach would benefit more in systems with higher shares of solar PV compared to wind-based energy systems. Harnessing the synergies between EVs and intermittent renewables such as wind and solar power is therefore essential.

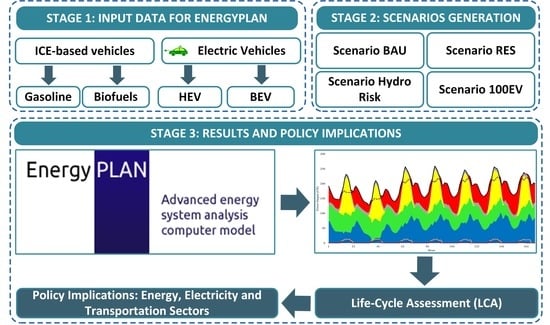
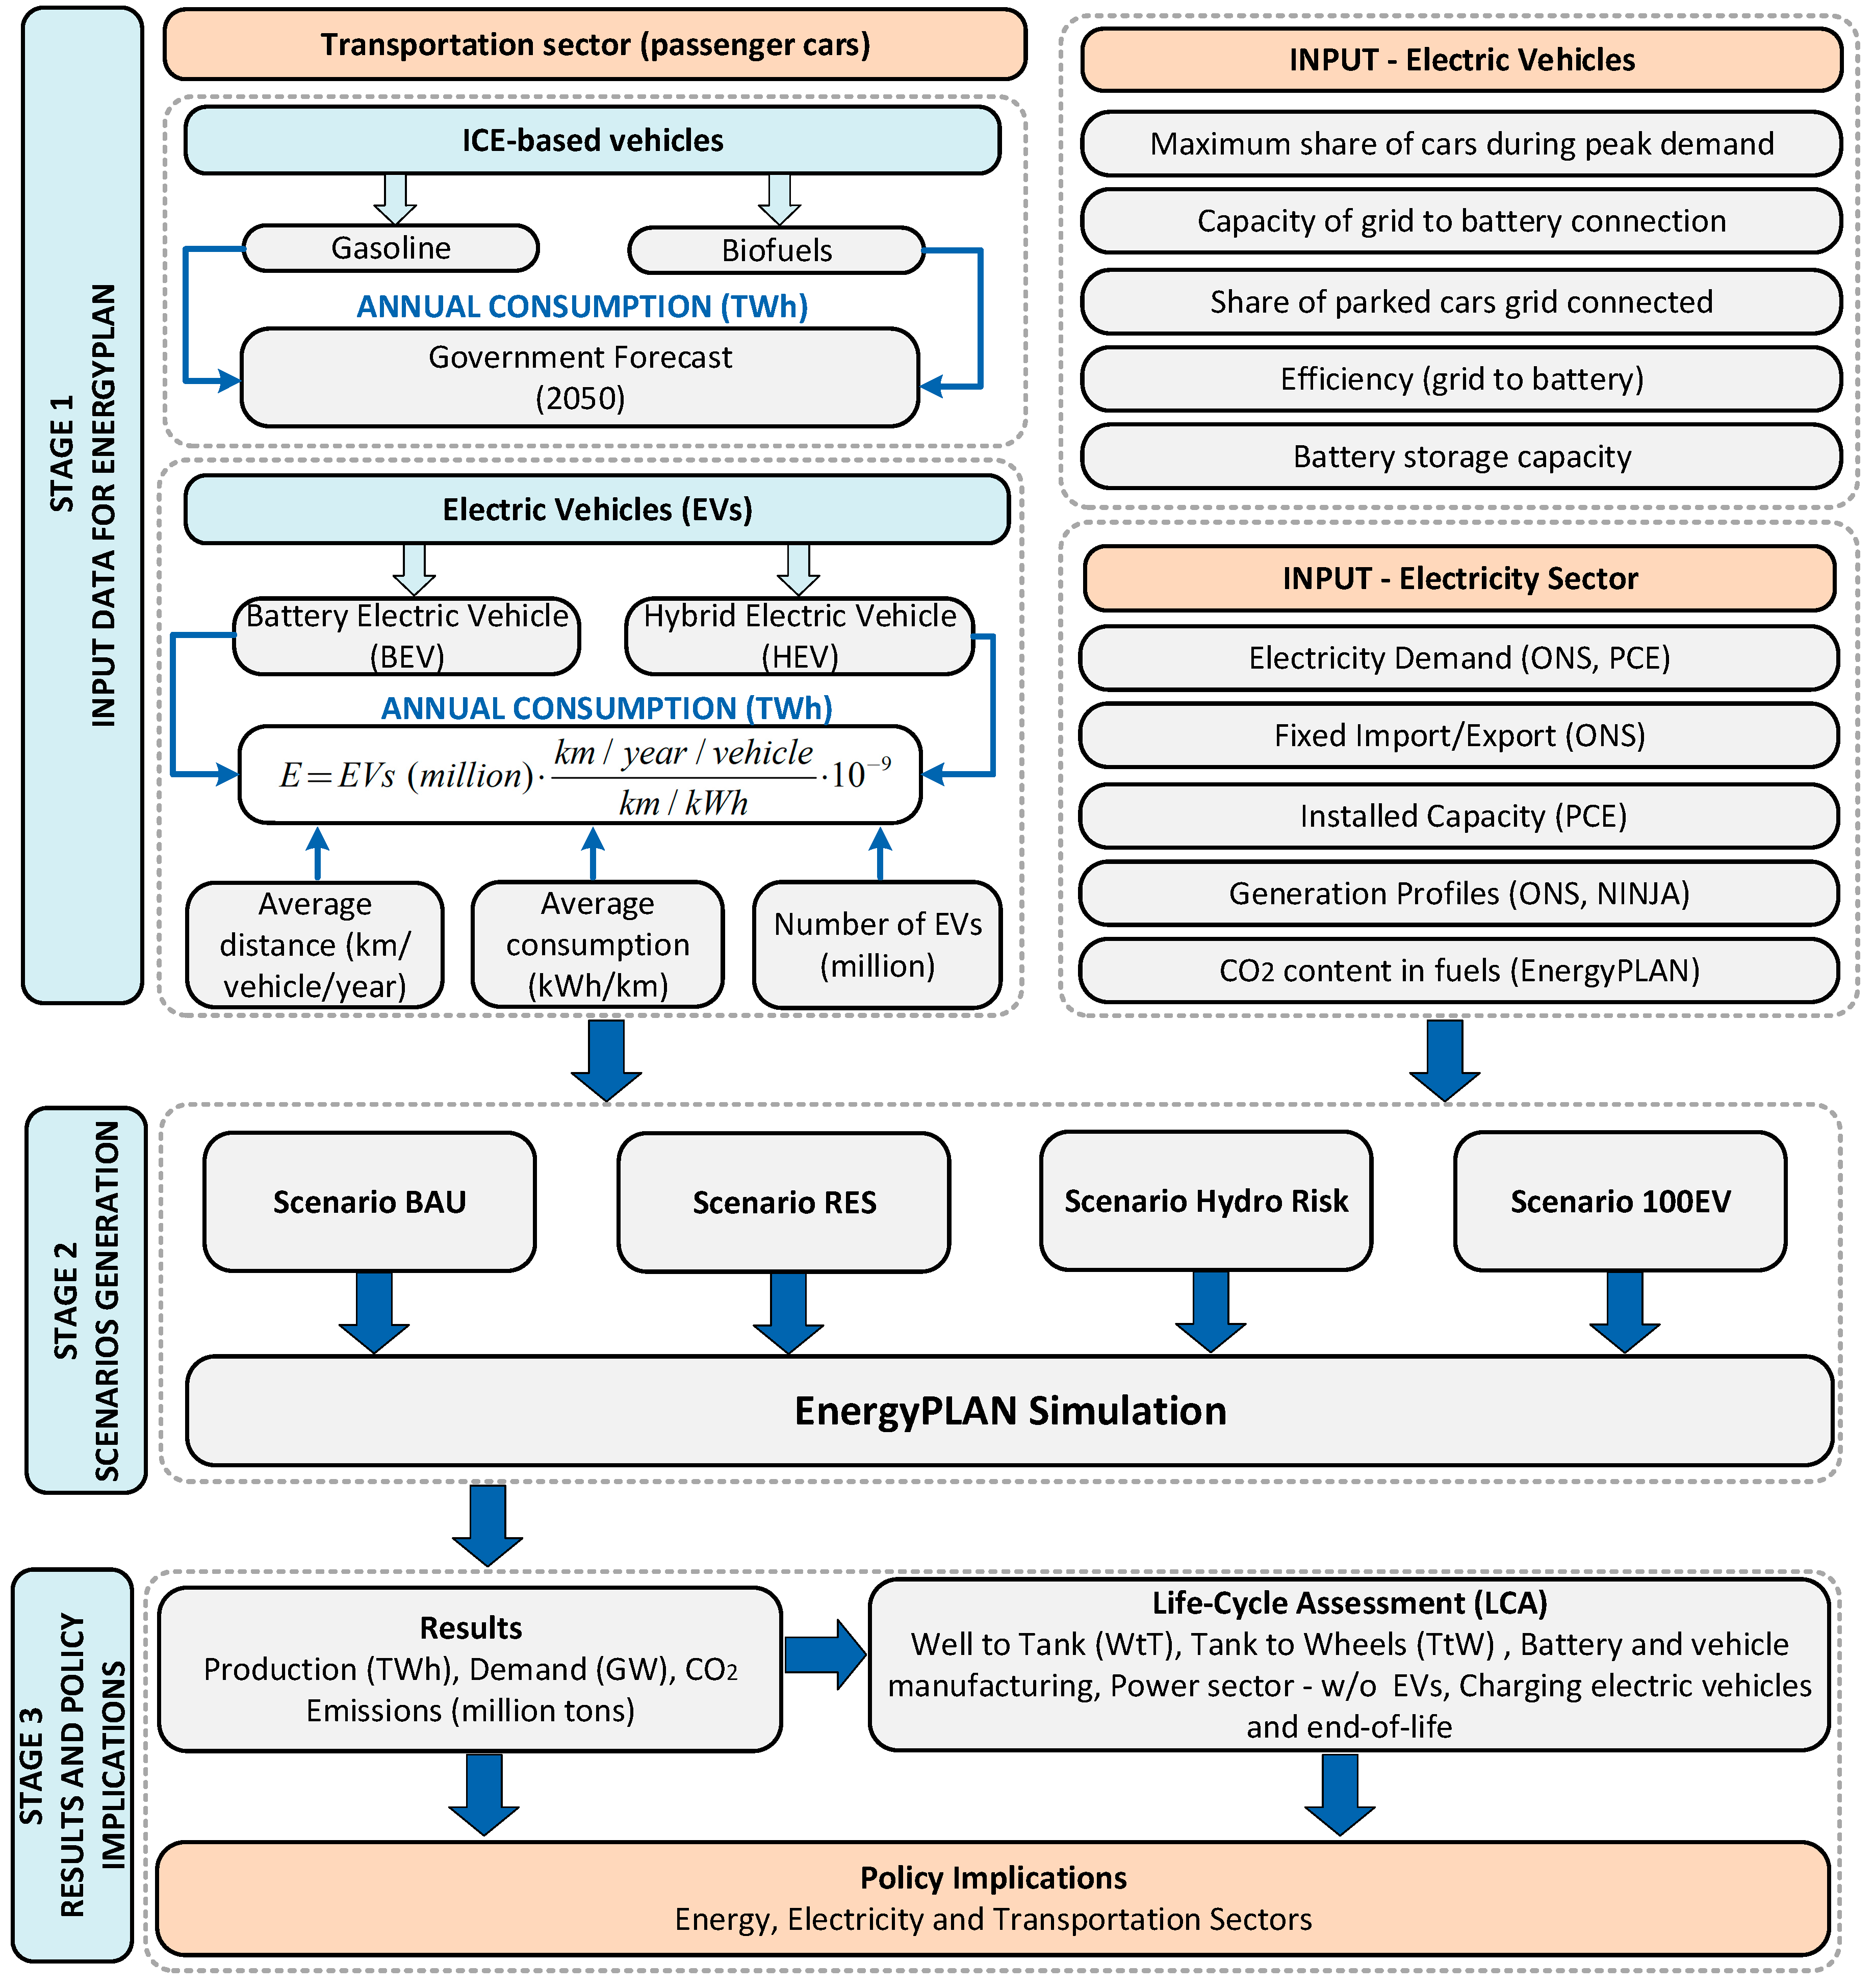
3. Materials and Methods

One of the most well-known tools for assessing the future operation of national energy systems on an hourly basis is the EnergyPLAN tool which takes the electricity, heating, cooling, transport and industry sectors into account [36,37]. One of the main advantages of EnergyPLAN is the possibility to make an hourly analysis which is particularly useful for evaluating the impact of intermittent renewable generation coupled with the use of electric vehicles. The impact of different charging strategies for electric vehicles together with the hourly assessment enabled by EnergyPLAN makes the software a powerful resource to evaluate the interactions among the transportation and electricity sectors, for example.
A case-study approach has been adopted in this research taking into account the particular case of the Brazilian energy sector since research has yet to systematically and quantitatively assess the impact of EVs on the country’s future electricity mix. This would also allow a deeper insight into the effects of different shares of both EVs and RES in the energy sector. This case study is particularly important due to three main features: (1) the country’s electricity generation currently relies mostly on renewable energy from hydropower resources; (2) Brazil is the second-largest producer of biofuels in the world and (3) so far no large-scale studies have been conducted to address the possible synergies between transport and energy sectors in the country. Prior to data collection, an in-depth literature review was conducted by the authors to establish the boundaries of the research. Data were collected based on different secondary data sources mostly based on the official database of the government (ONS [38] and EPE [25]) but also from [39], which established the possible future pathways for the Brazilian power sector). In the follow-up phase of the study, simulations were performed using the EnergyPLAN model. A Life-Cycle Assessment (LCA) is also performed to evaluate the overall level of carbon dioxide emissions in the country based on the methodology proposed in [40]. The final stage of the study comprised the analysis of the results and the proposition of a set of policy implications for the country.
The detailed methodological approach of the research is illustrated in Figure 2. Hourly generation profiles for solar and wind power were obtained by using the data extracted from [41] which is based on [42,43] and takes into account weather information from NASA. Other model assumptions related to the power system were extracted from the Energy National Balance (in Portuguese, BEN) [44], the National Grid Operator [38] and also from [18] which is considered the first research work that attempted to use EnergyPLAN for modeling the Brazilian power sector.
Four scenarios are proposed which differs by basically taking into account different shares for both EVs and RES. Scenario Business As Usual (BAU) comprises the base case scenario with data extracted from government projections for the transportation sector (i.e., Energy Research Office [25]) and [39] for the projected installed capacity for 2050). Scenario RES and scenario hydro risk also consider the government projections [25] for the transportation sector but different assumptions regarding the RES capacity are taken into account for each one such as follows. Scenario RES addresses the case of an increase in the RES system capacity from wind and solar power such as presented in Table A1 (Appendix A). Scenario hydro risk also assumes a RES capacity increase identical to scenario RES. However, scenario hydro risk also takes into account climate changes impacts on future hydropower generation resulting in a hydro-risk scenario. Finally, scenario 100EV addresses a hypothetical case in which in addition to the high RES capacity increase from both wind and solar power considered in scenario RES, the entire replacement of the vehicle fleet by EVs is assumed (i.e., 100% of EVs). The calculation of the future electricity consumption of EVs is frequently based on the assumed average consumption (kWh/km) and the annual average travelled distance (km/vehicle/year). Therefore, this approach is also followed to estimate the electricity consumption of EVs for Scenario 100EV.
The demand distribution for the transportation sector is chosen to be a daily charging strategy (constant between 9 a.m. and 5 p.m.) although the implications of other charging scenarios such as a night-charging approach (in this case from 8 p.m. to 07 a.m., for example) is further discussed. A smart charging strategy is considered for all scenarios. The maximum capacity of battery to grid connection (MW) is estimated by multiplying each car charging power (kW) by the number of vehicles plugged in at any given time. The battery storage capacity for the entire vehicle fleet (GWh) is calculated by multiplying the maximum number of vehicles plugged in at any time by the single storage capacity of each battery (kWh). A remaining 80% of battery capacity is taken into consideration such as considered by the authors of [45]. For all scenarios, the maximum capacity of battery to grid connection was restricted to thirty-five percent. All scenarios are modeled in EnergyPLAN software by assuming 2050 as the reference year. The main assumptions for each scenario are described in detail in Table A1 and Table A2 (Appendix A).
The Well to Tank (WtT) and Tank to Wheels (TtW) emissions are calculated based on the CO2 exhaust emission intensity (g/MJ) for petrol and ethanol fuels. The resulted emissions from non-battery components (i.e., from vehicle manufacturing) are assumed to be constant and near 3.2 tons per vehicle which includes the emissions from the glider and power train. Therefore, the yearly manufacturing emissions per car are calculated based on the average vehicle life-time (km) and the average distance travelled per car (km/year). The battery manufacturing emissions are calculated for both electric and hybrid EVs based on its batteries capacities (kWh), the rate of battery replacement and on the average battery manufacturing intensities (g/kWh). The CO2 emissions from the electricity sector (including both the electricity needed to the power sector and to charge de electric vehicles) are retrieved from the EnergyPLAN simulation results. The end-of-life phase considers (1) the non-battery recycling emissions, (2) battery recycling materials credit and (3) the battery reuse credit. The non-battery recycling emissions comprise the emissions resulting from the process of recycling non-battery components and it was estimated based on the mass of vehicles (kg) and the energy required (MJ/kg) to its recycling. For the sake of simplicity, the average emission factor (tons of CO2/MWh) of the electricity sector resulted from the EnergyPLAN simulations is considered to estimate the CO2 emissions for non-battery components. The battery recycling materials credit is estimated based on the expected average emissions factor reduction (%) by using the recycled battery materials multiplied by the total battery manufacturing emissions (tons) and assuming a battery recycling rate of 100% in 2050. Finally, the battery reuse credit is calculated by considering the remaining percentage level (41.9%—[30]) that batteries can be used after their vehicular use and the assumed extra life (72%) that batteries can be employed after its use in the vehicles.

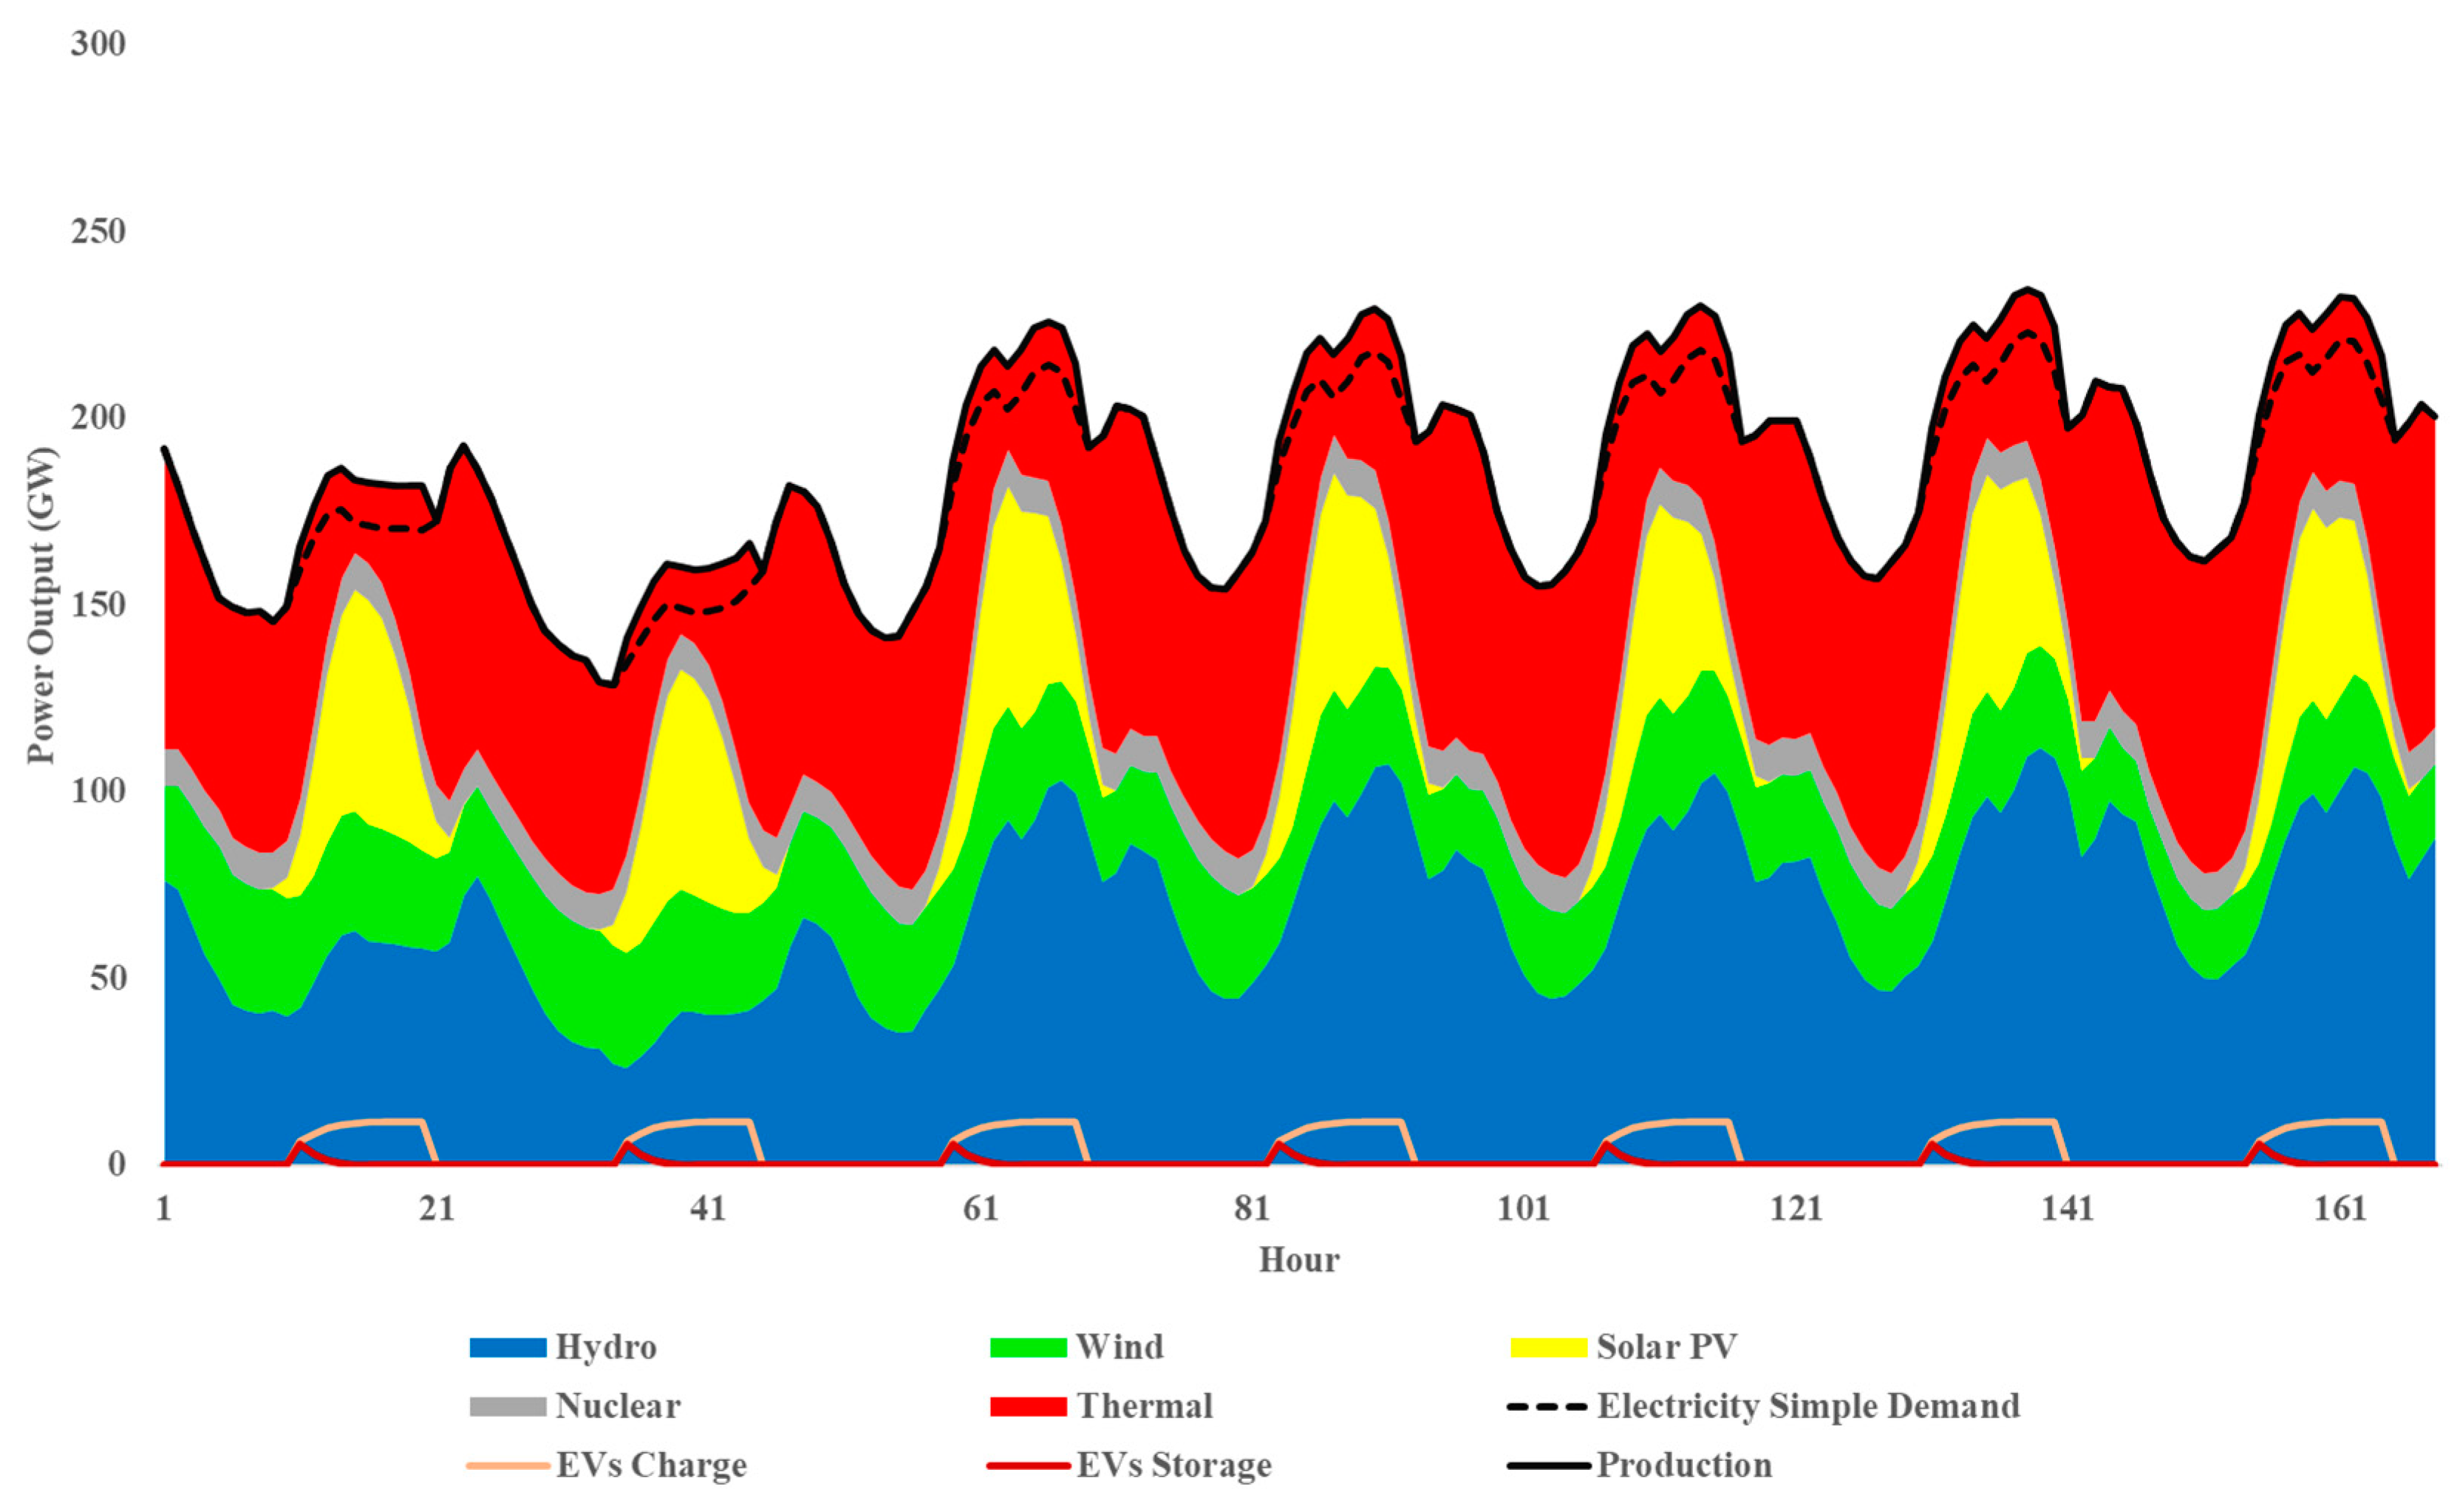
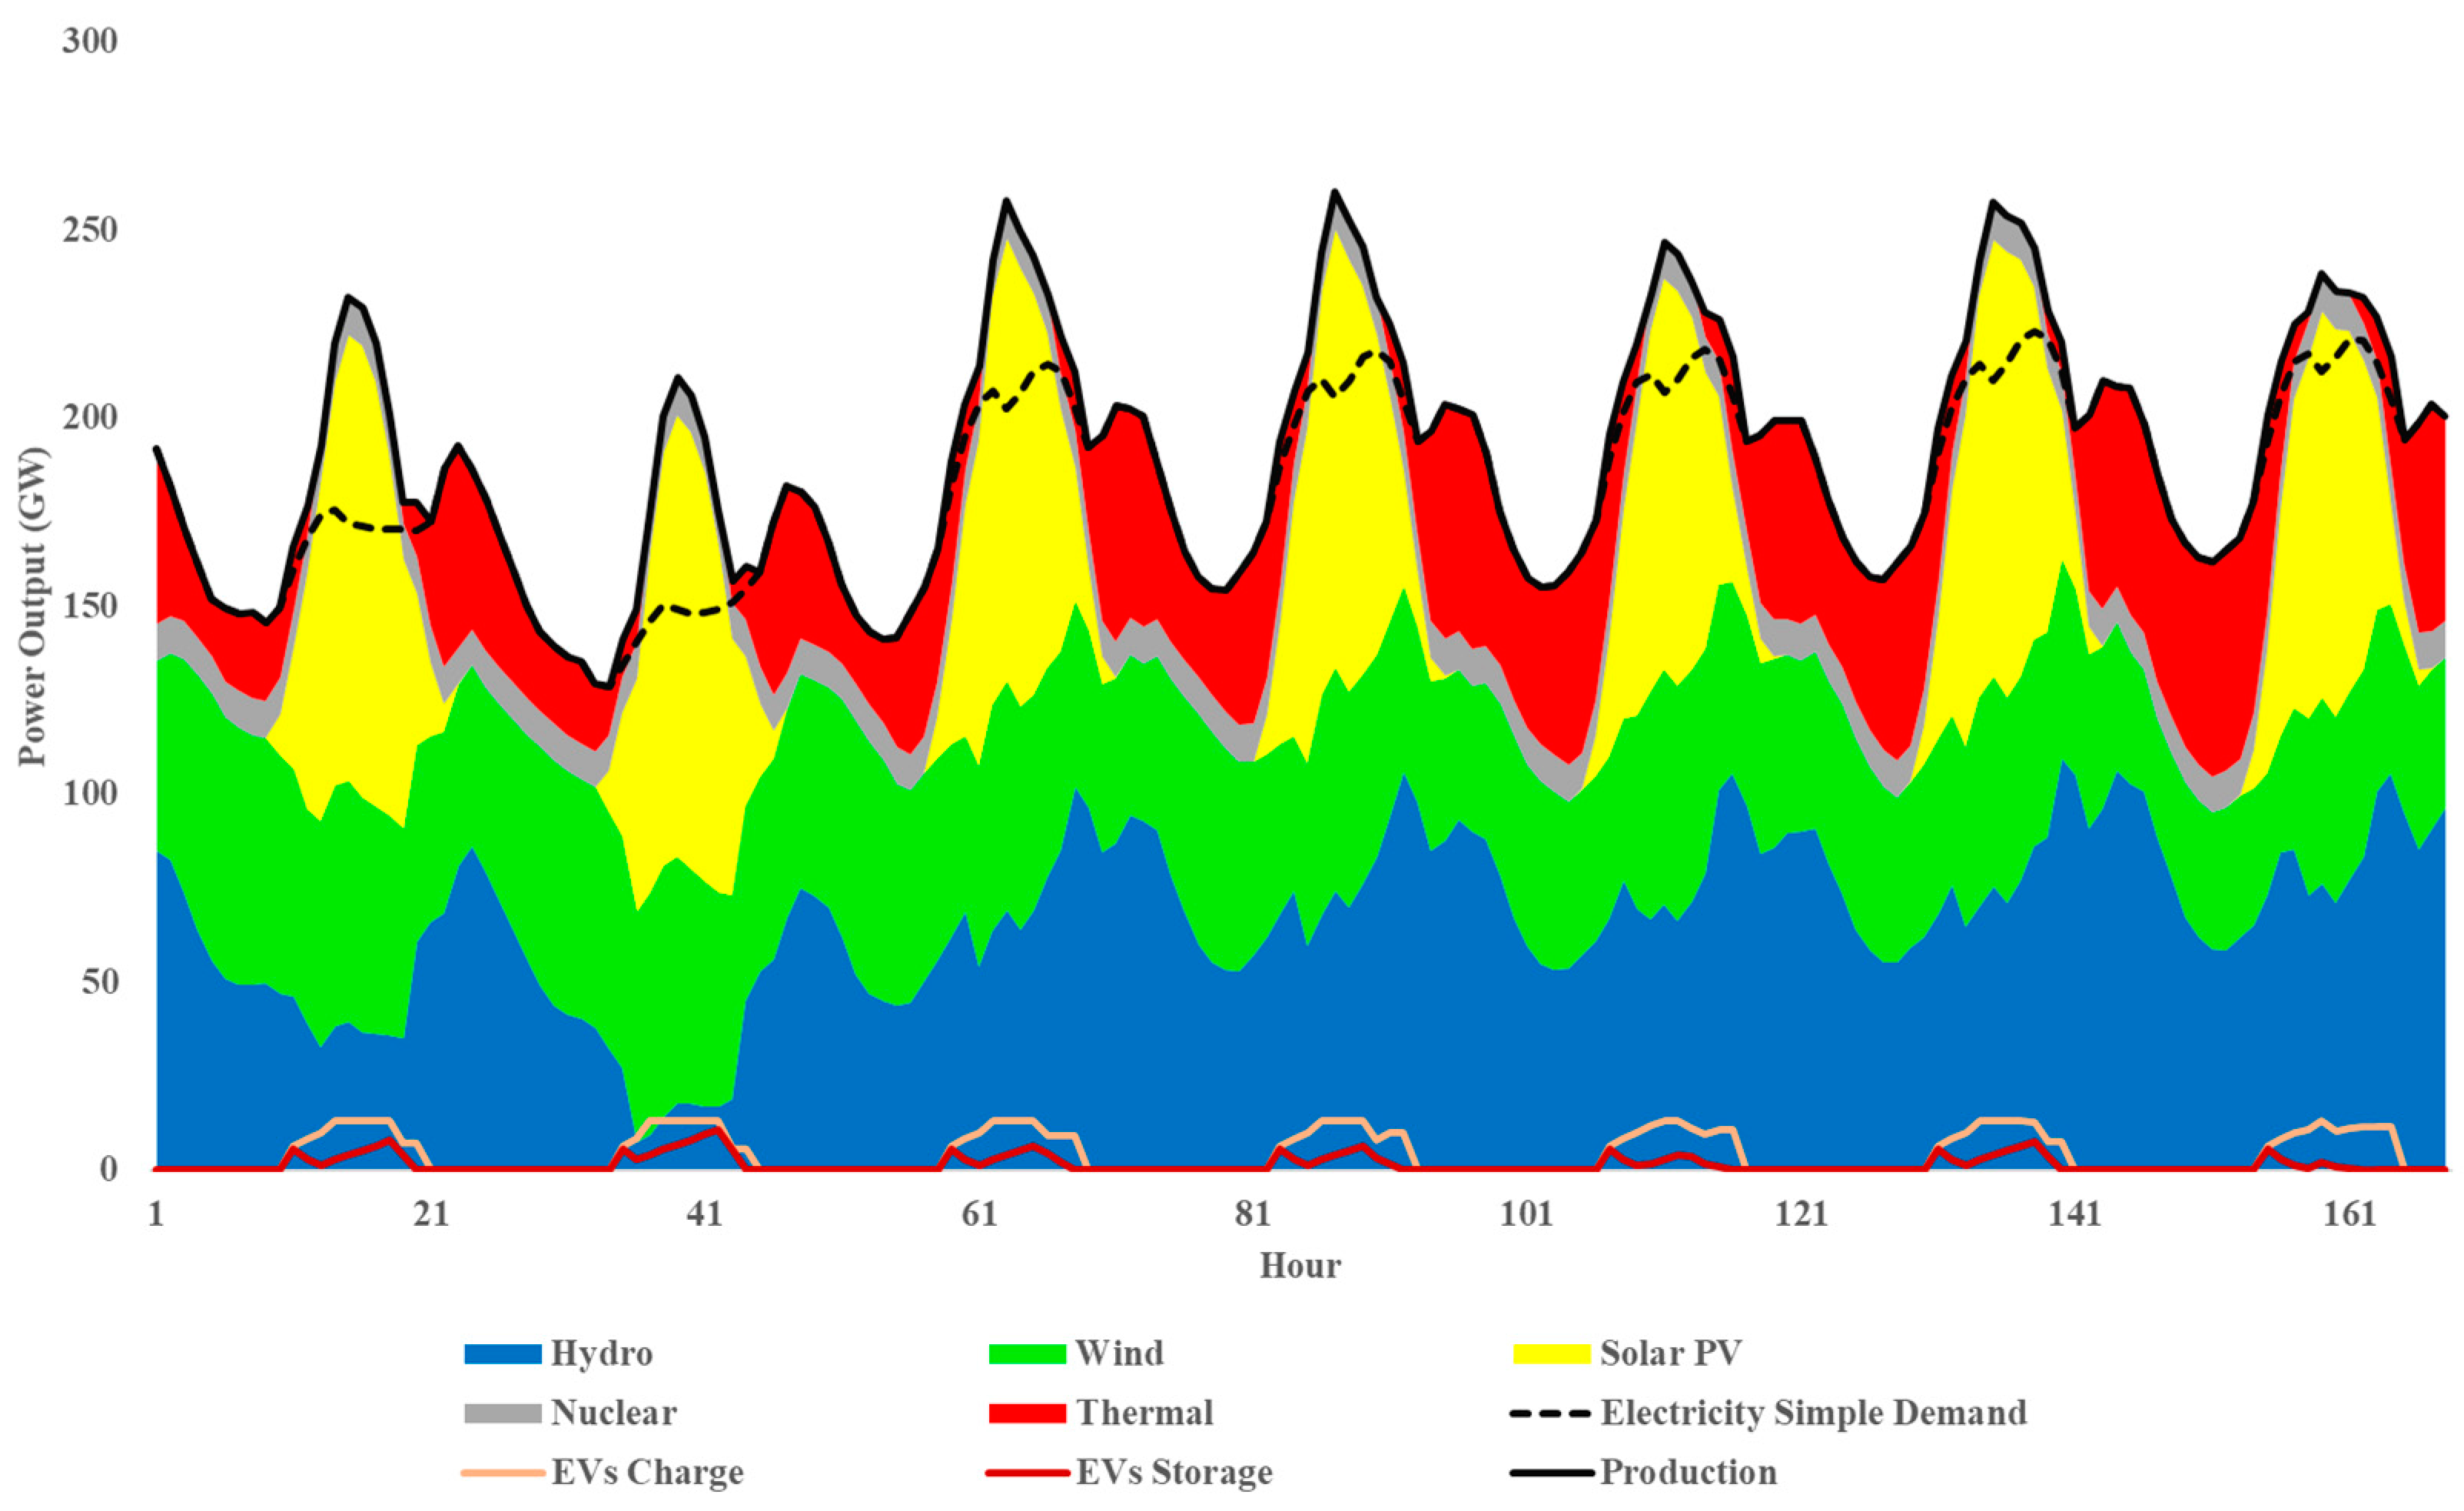
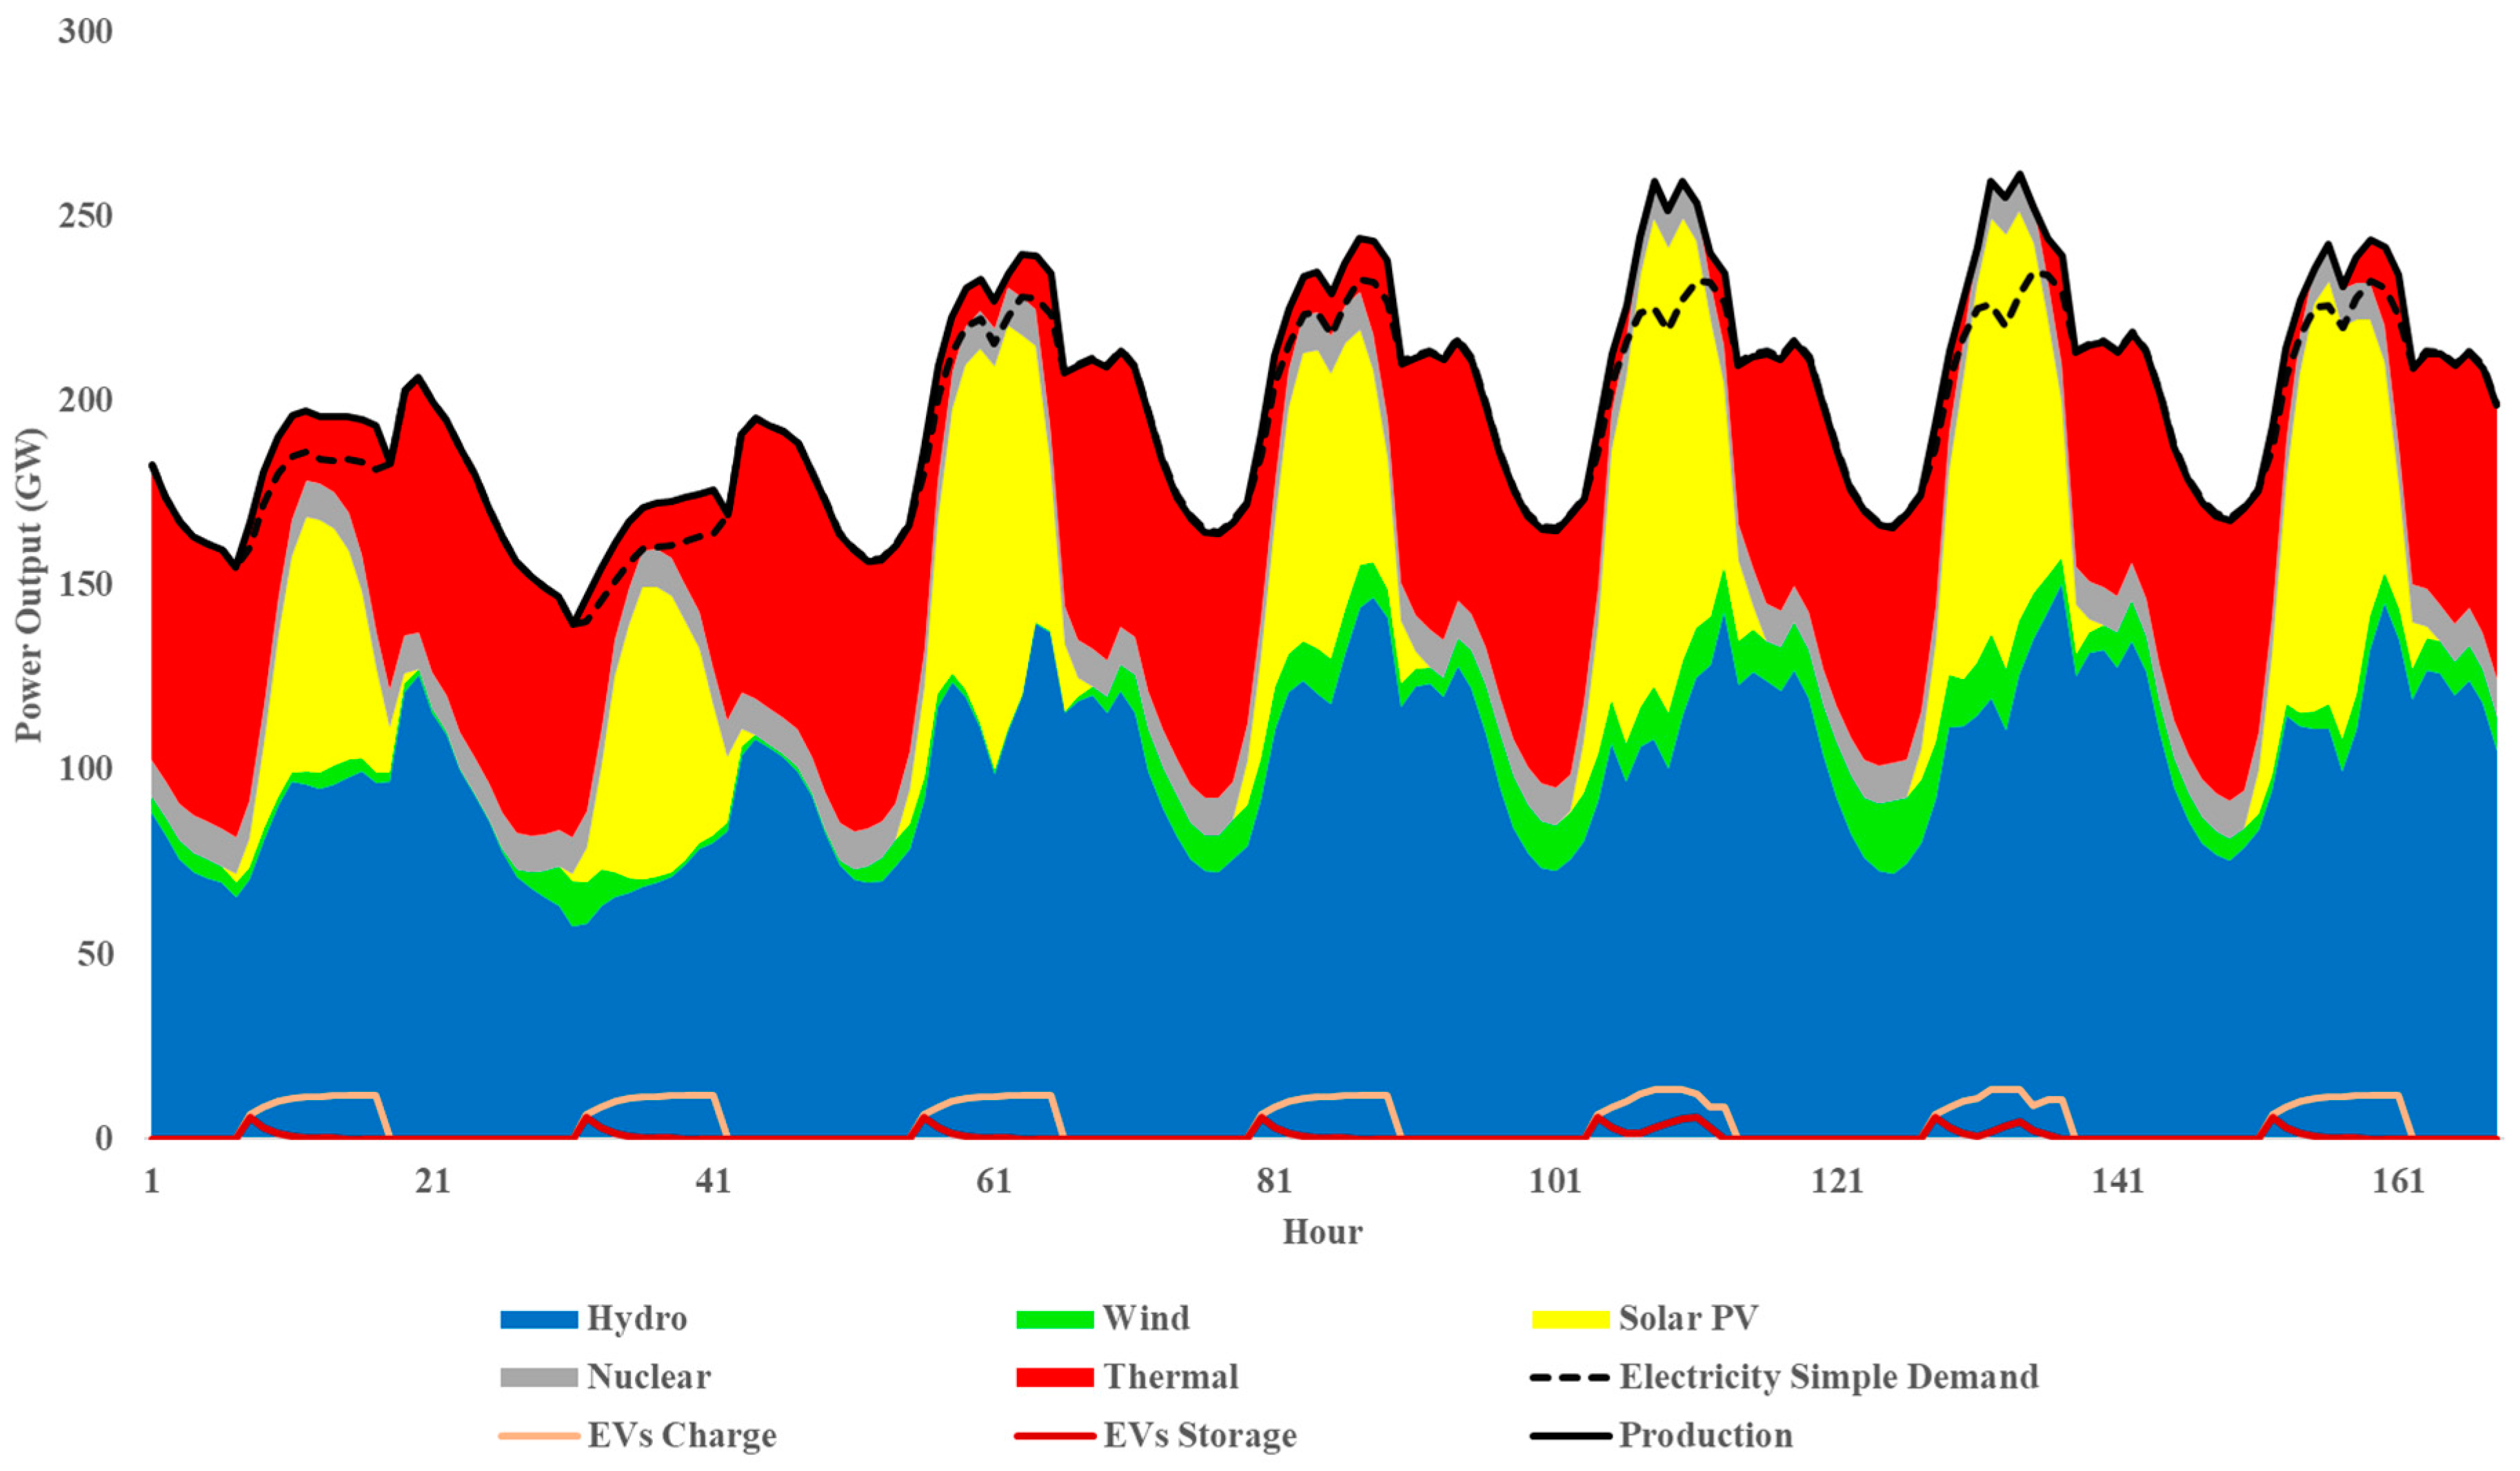
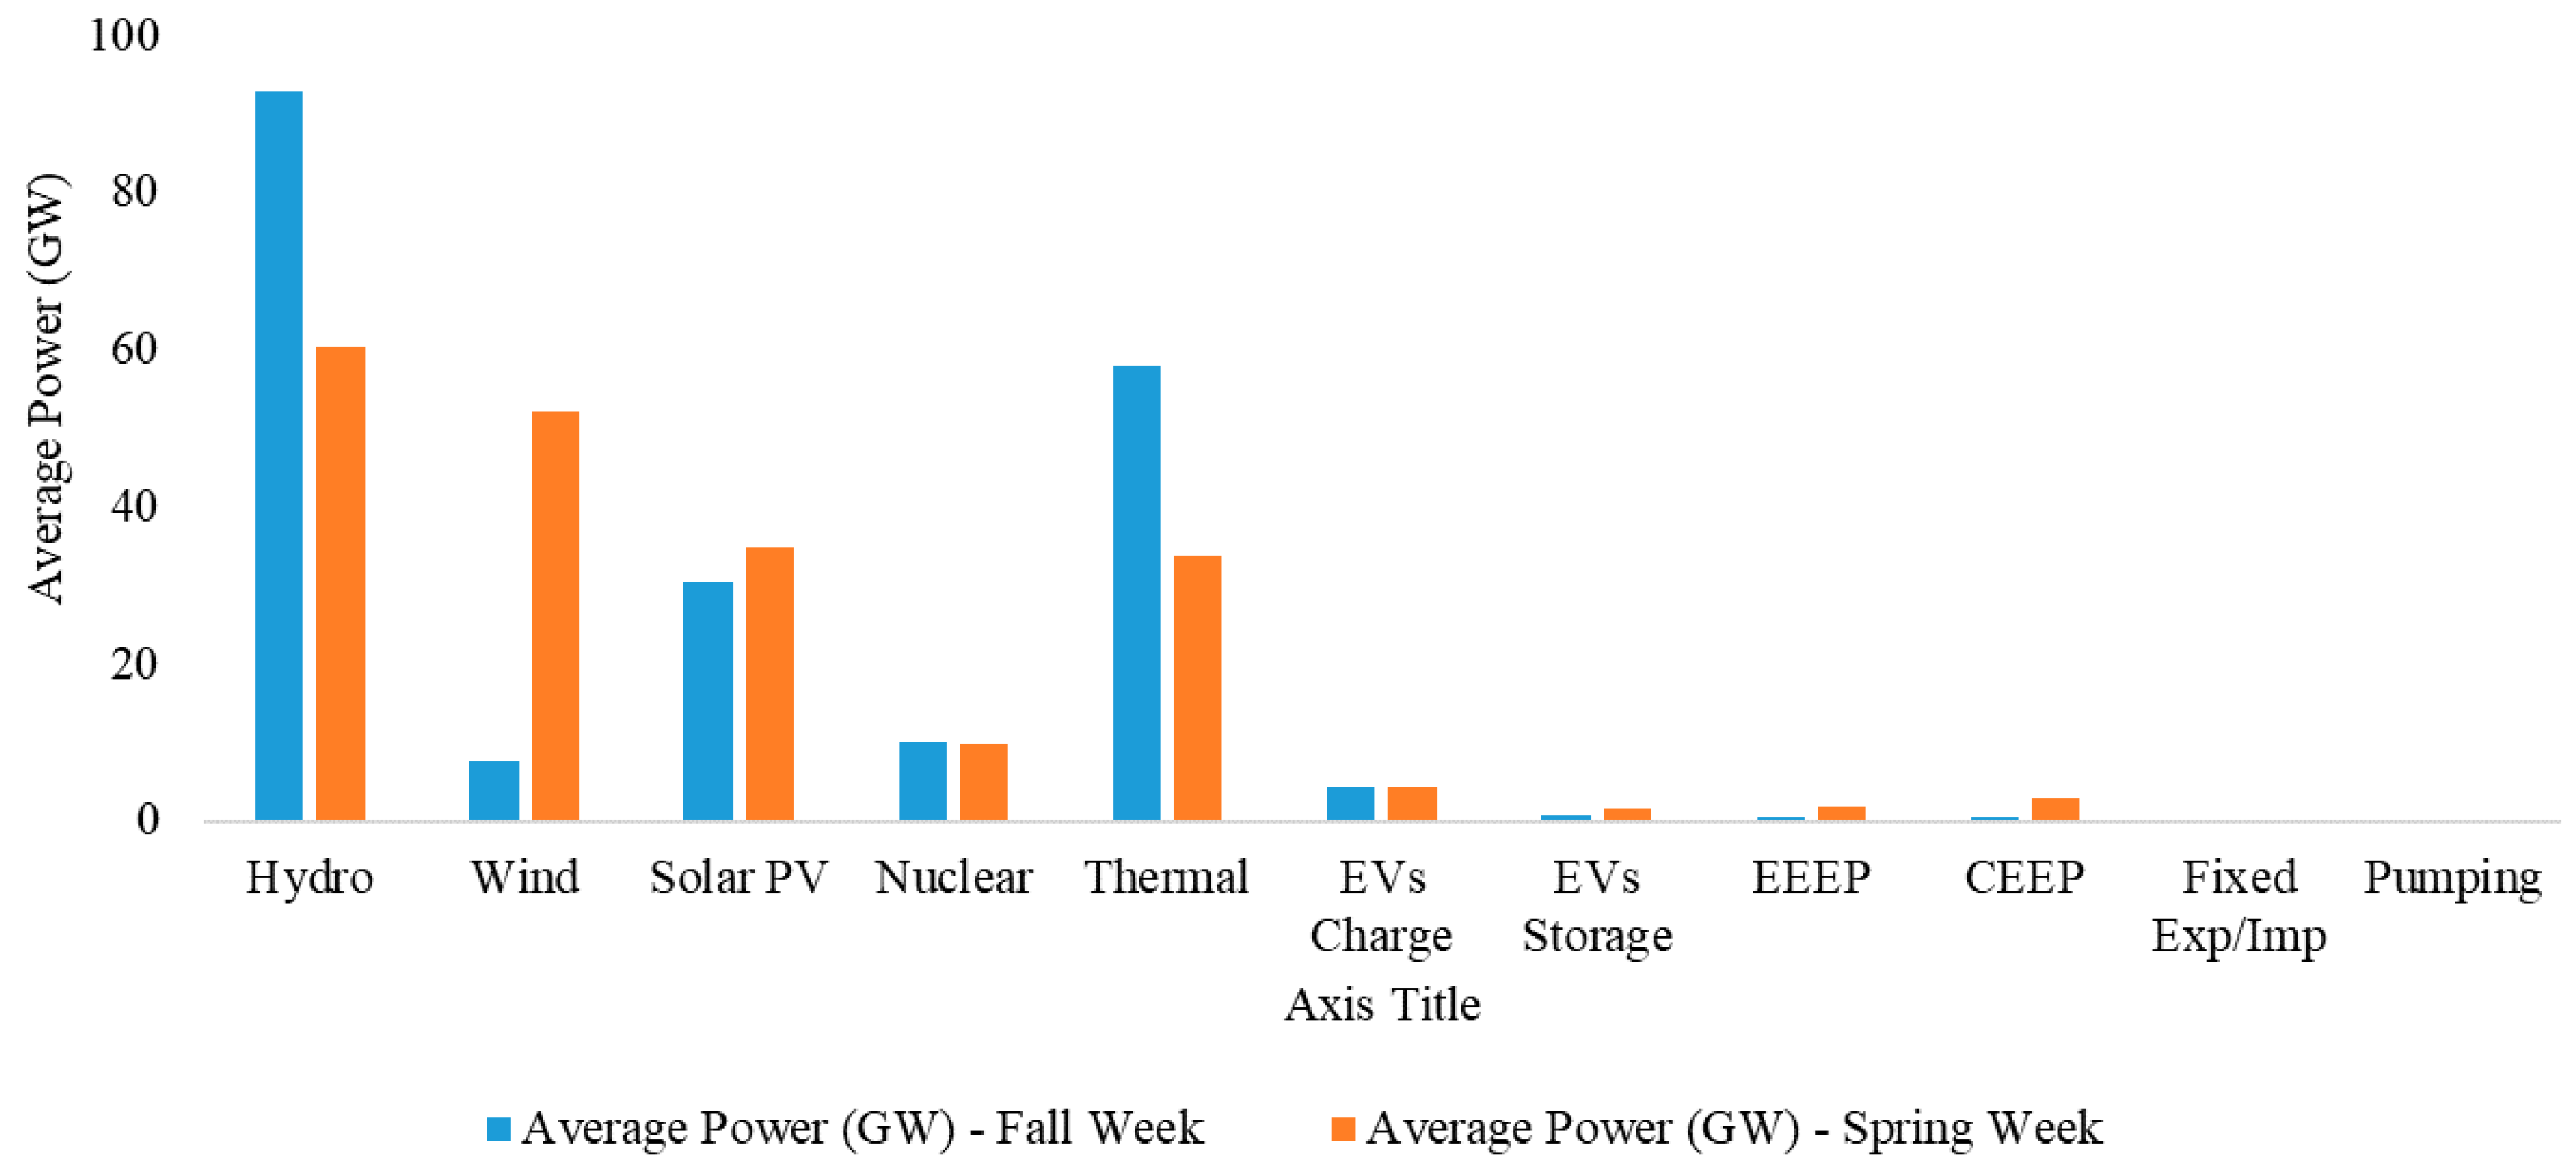
4. Results and Discussion

The analysis carried out along with this section aims to describe the most relevant results obtained in this research in a systematic and detailed way. Section 4.1 addresses a technical analysis which is best suited to assess the main impacts of EVs on the future electricity mix. A Life-Cycle Assessment (LCA) is addressed in Section 4.2 estimating the level of carbon dioxide emissions in the electricity and transport sector in Brazil for 2050. The input data used along with this research is displayed in Appendix A (Table A1 and Table A2).

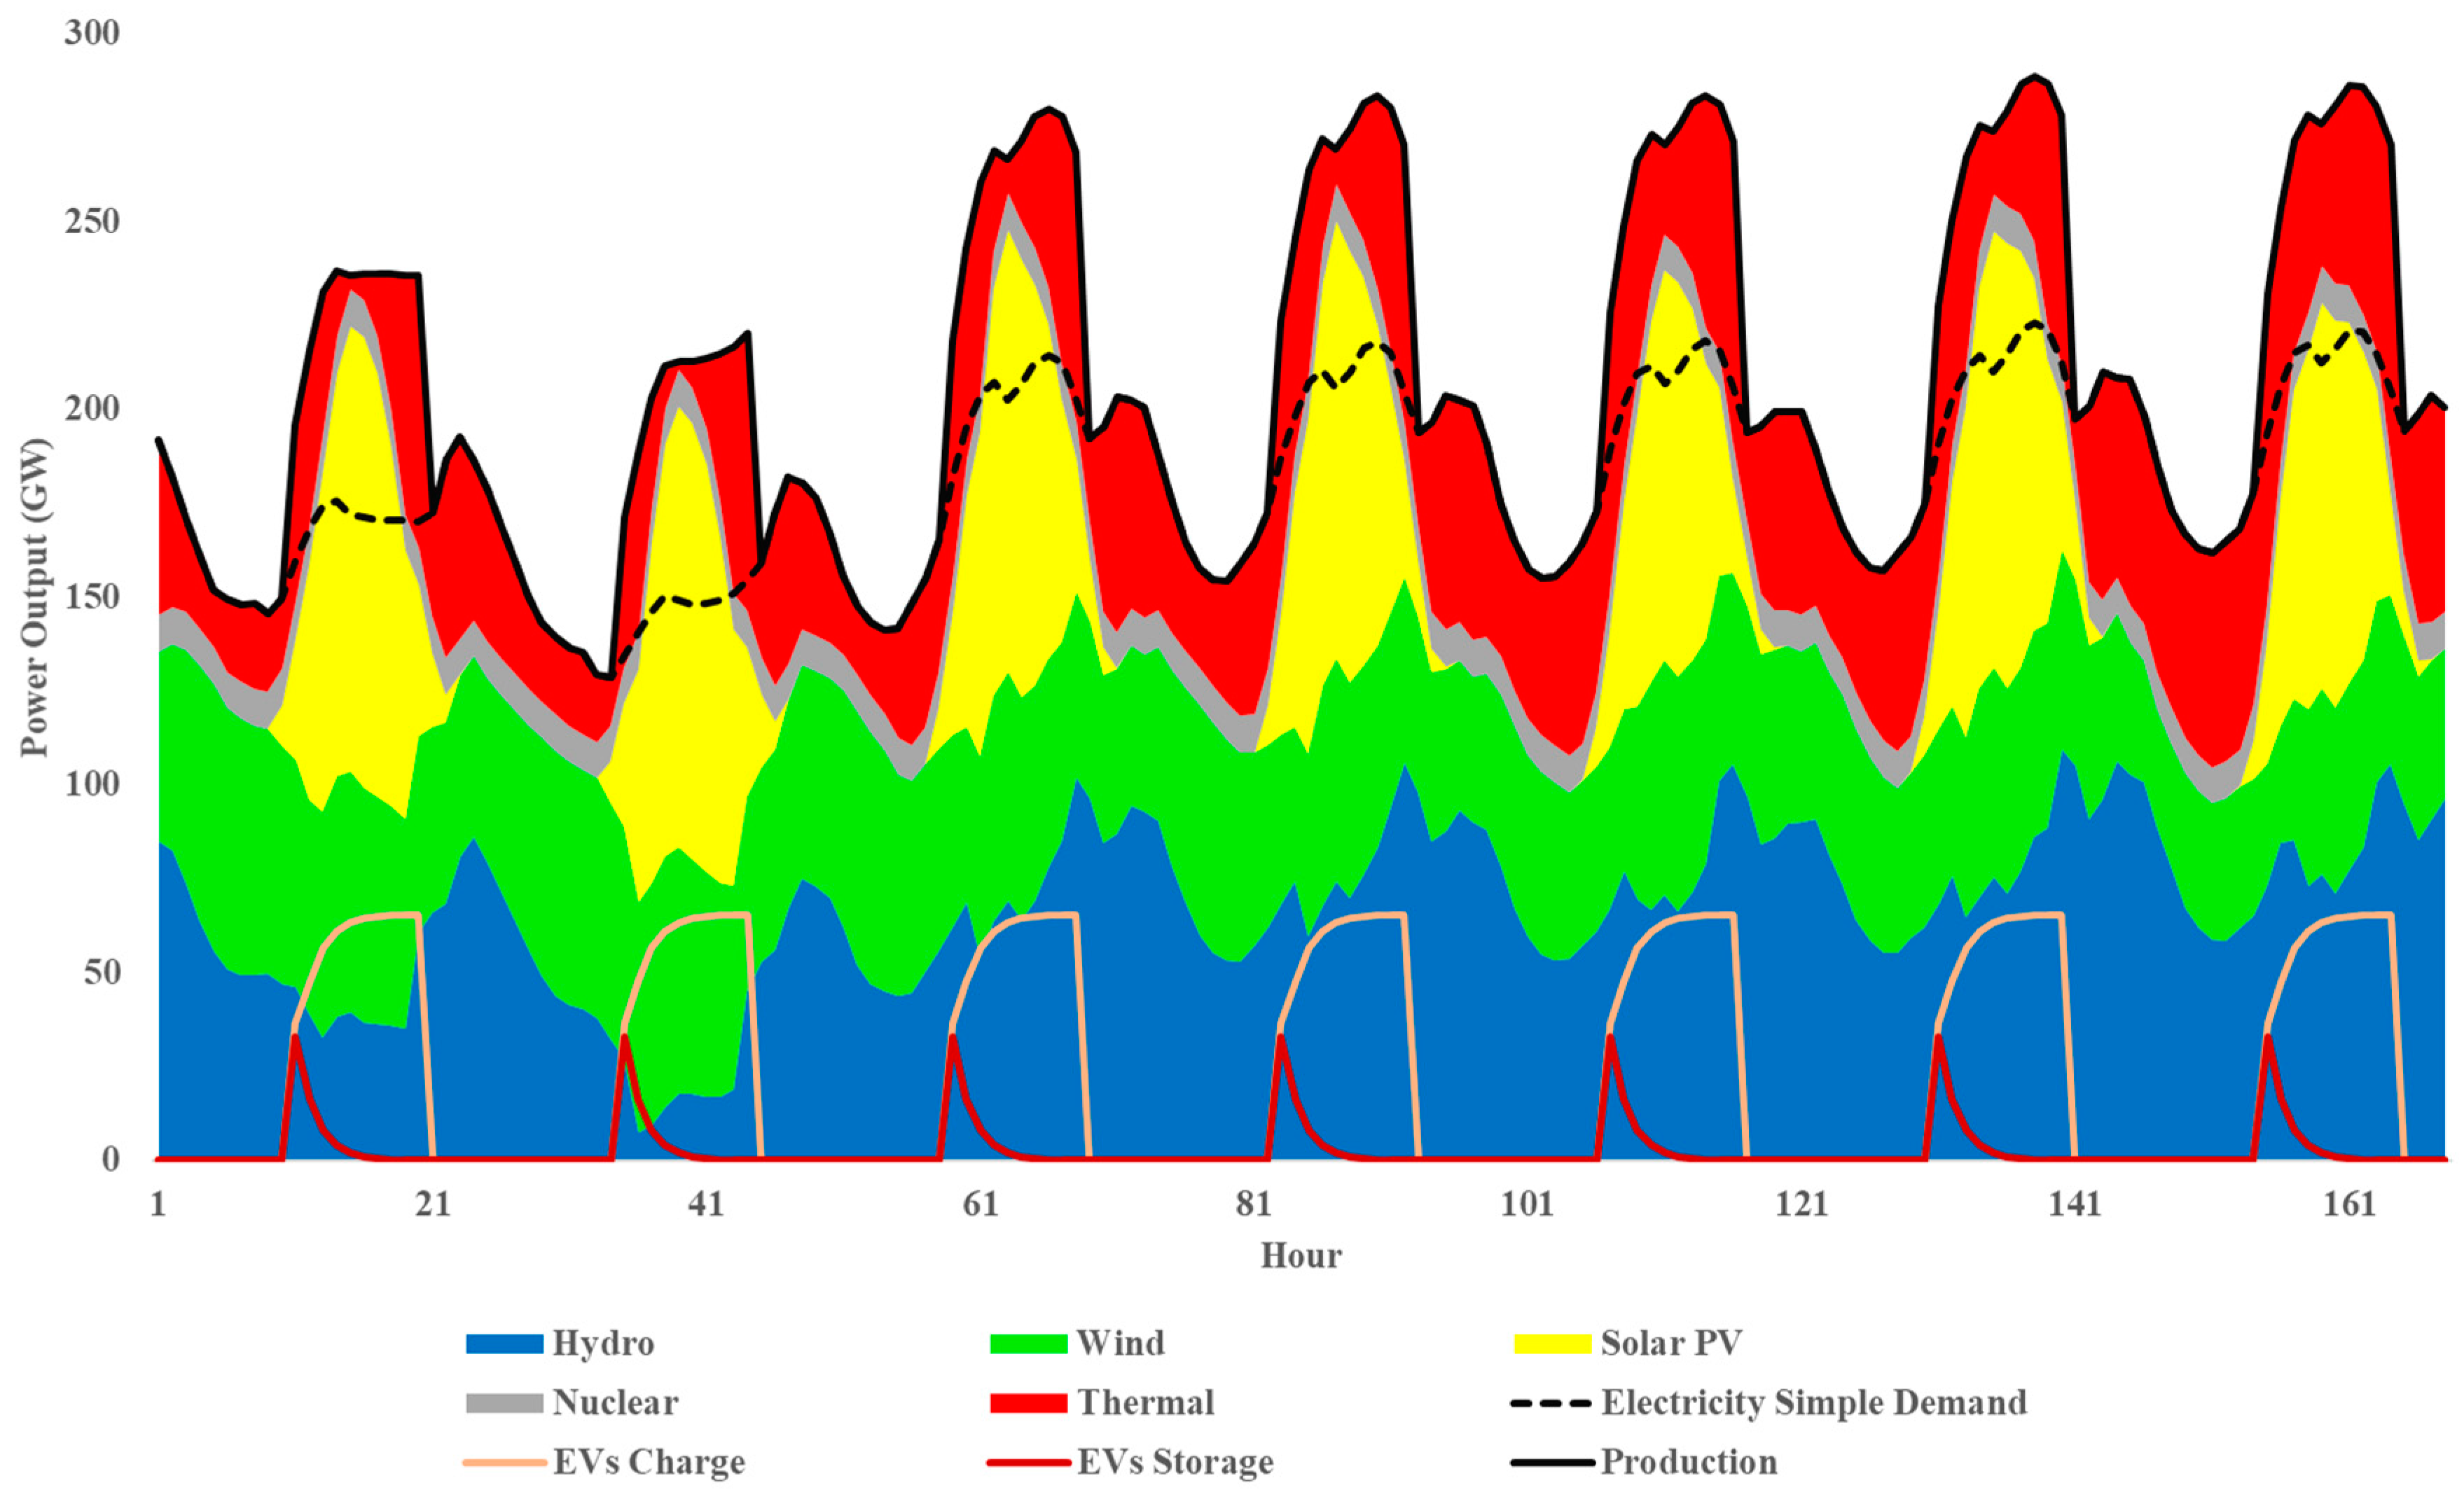
4.1. Technical Analysis

The base case scenario (Scenario BAU) is defined considering the real prospects for the country in 2050 considering both the share of each mean of transportation (i.e., gasoline, biofuel and EVs) and its projected electricity consumption (see Table A1 for details—Appendix A). These prospects are described in detail in the official report developed by the Brazilian government for 2050 (see [25]). The predicted electric mobility fleet share for scenario BAU includes 9% of EVs (11.8 million) and 52% for hybrid vehicles (65 million). The remaining vehicle fleet is predicted to be composed of 32% from flex-fuel (39.4 million) and 7% from gasoline (8.9 million) [25]. The overall electricity demand for the EV-fleet share in 2050 is estimated to be near 38.8 TWh (Scenario BAU) which is based on official government forecasts [24]. Data for the future installed capacity in 2050 for scenario BAU is extracted from [39] and [18].
Currently, the Brazilian power system relies mostly on hydropower resources. However, climate-driven changes may affect the future hydropower generation in the Brazilian power sector, such as better discussed in [46] which assessed Brazil’s vulnerability to climate change in future years The role of renewable energy for reaching the goals of the Paris agreement in Brazil has been recently highlighted in [25] which also pointed out the Brazilian vulnerability to climate change mainly due to its high dependence on hydropower. The authors recommended the diversification of the electricity matrix of the country to meet the Paris agreement targets [25]. The challenge of climate mitigation for the specific case of Brazil is studied in [47] pointing out that recent environmental licensing requirements were softened compared to previous legislation in the country. This issue together with the abandonment of deforestation control policies would put into question Brazil’s capability of meeting the Paris agreement targets [47]. However, it is important to highlight that the Brazilian government set its first regulation (n° 419-2019) establishing the carbon credit system in the country. This regulation may foster the energy transition in the country by also helping to meet the Paris agreement targets. Therefore, the result analysis will be concentrated on preselected weeks of spring and fall seasons since these weeks correspond to the minimum and maximum storage level of hydro reservoirs in the country, respectively (see [18,38,48] for details). Figure 3 illustrates the hourly results from a typical week of November (spring week) for scenario BAU. Figure 3 is split up into the simple electricity demand (i.e., without the EVs contribution), the electricity production from each power source, the fixed importation/exportation needs and the EVs charging and storage curves.
The most striking result to emerge from the data illustrated in Figure 3 is that for this selected spring week the surplus electricity for charging EVs comes essentially from thermal resources (for a daily charging strategy). This charging strategy considers that EVs are charging during working hours. These results are likely to be related to the high average simple electricity demand (without EVs) which is high enough to absorb the entirely renewable electricity production for scenario BAU. The annual average thermal production increased by 6.8% compared to the case where the EV-fleet share is set to zero. However, it is also important to highlight that the thermal production also includes the use of biomass resources and therefore part of the EVs charging might come from these renewable resources. For scenario BAU, the share of RES for electricity production is found to be near 59.7%. However, it is important to highlight that the projected installed capacity for scenario BAU has been defined based on [39], which does not take into account the electricity needs for charging the EVs. Therefore, this might be the reason why the additional electricity production for charging the EVs comes essentially from thermal power resources which also led to the inexistence of both Exported Excess Electricity Production (EEEP) and Critical Excess Electricity Production (CEEP) in this scenario.
It would be useful at this stage to move on verifying the potential impact of the forecasted government EV-fleet share within the future country’s electricity mix in the case of integrating higher shares of intermittent renewable energy. We now turn to model scenario RES which takes into account an increase of 100% in the RES capacity from intermittent power sources (i.e., wind and solar power) compared to scenario BAU. The results for scenario RES revealed a substantial decrease in the need for thermal electricity production to charge the EVs compared to scenario BAU due to its higher RES capacity (Figure 4). The electricity production from RES becomes even higher than the required simple electricity demand during certain times (see Figure 4). For scenario RES, the high renewable capacity from Variable Renewable Energy (VRE) resulted in an increase on the share of RES for electricity production from 59.7% (Scenario BAU) to 77.9% (Scenario RES) with a reduction in the overall level of CO2 emissions for the power sector slightly higher than 45%. The simulation results also reveal that the increase in the share of RES would add an EEEP and CEEP of about 12.2 TWh and 24.3 TWh respectively for scenario RES (see Table 1).
Figure 5 illustrates the power output on a fall week for scenario RES (with a daily charging strategy) revealing the limited wind power potential on fall compared to typical spring weeks. This comes with a substantial increase in the need for thermal power compared to the case of a spring week even with the clear higher hydropower production in fall as compared to spring. The higher hydropotential potential in fall as compared to spring is also supported by previous studies (see [34]).
The EVs storage capacity seems to be much more useful during daylight hours as it allows storing the excess of electricity production from solar power production in the case of an overnight charging strategy for scenario RES on a spring week (see Figure 6).
The water seasonal variability for the Brazilian system is projected to be at high risk in the future such as illustrated by the water risk atlas [49]. The “seasonal variability (SV) is an indicator of the variability between months of the year. Increasing SV may indicate wetter wet months and drier dry months, and higher likelihood of droughts or wet periods” [49]. Therefore, before proceeding to examine the impact of an entire EV-fleet share in the future country’s electricity mix, it would be useful to analyze a hydro risky scenario which is considered essential since the country mostly relies on hydropower. Scenario Hydro Risk attempts thus to verify the impact of the government forecasted EV-fleet share in the country’s electricity mix by also taking into account the conditions of a hydro risk scenario. To simulate scenario hydro risk, a reduction in the overall capacity of hydropower is included in the EnergyPLAN model together with an hourly distribution curve of a typical past hydro risky year (2001) based on data extracted from the National Grid Operator [38]. Figure 7 illustrates the power output for a typical spring week considering a daily charging strategy. The results show that the average annual hydropower output decreased by 9.4% (from 76 GW to 68.9 GW) whereas the average thermal power production increased by 20.1% (from 35.5 GW to 42.7 GW) for scenario hydro risk compared to scenario RES. The share of RES for electricity production decreased from 77.9% (Scenario RES) to 74% for the hydro risky scenario.
The average water storage levels for the Brazilian system are risky mainly during spring seasons (see [18,38] for details). This can be clearly seen in Figure 8 which illustrates the average power output on a spring and fall week for scenario hydro risk. The results illustrated in Figure 8 clearly indicates that the average hydroelectricity production in a spring week is considerably lower than on a typical fall week. However, the most striking result to emerge from the data analysis is the higher contribution for wind power in spring compared to typical values in the fall. This is a rather interesting outcome since it gives evidence to the complementarity of wind and hydropower in the Brazilian power system. This finding broadly supports the work of other studies (e.g., [18]) in this area linking the complementarity between hydro and wind resources in the Brazilian power sector. Particularly for the hydro risk scenario, no significant reduction in solar PV and nuclear power are found between spring and fall weeks. Electricity exchange may also occur with a higher share in spring for scenario hydro risk. The existence of a higher exportation potential for spring may be explained because of the more favorable wind-profile in this season.
This combination of findings provides some support for the conceptual premise that the excess of electricity might be higher on spring times and the thermal power sources (on average) are likely to be less needed during this season as illustrated in Figure 8. Figure 8 also reveals the complementarity between wind and hydropower on fall and spring seasons. Taken together, these results suggest that the electricity mix for charging the EVs would be greatly affected depending on the season of the year. Also, the potential to absorb the excess of wind power would be higher during spring periods. However, more research on this topic needs to be undertaken as these results reflect the outcome of the technical analysis and economic or regulatory aspects, such as future market-based electricity-pricing schemes, must be also taken into account.
It would be useful at this stage to consider a scenario which takes into account an increase of 100% for the RES capacity from wind and solar PV such as considered in scenario RES and scenario hydro risk but also by considering the entire replacement of the vehicle fleet by an entire EV-fleet (Scenario 100EV). Although a 100% EV-fleet share is an assumption far from reality for Brazil even for 2050, the main objective of this scenario is to illustrate the extent to which a high RES share together with a full EV-fleet might have on the future country’s electricity mix. The required electricity demand for EVs for scenario 100EV is calculated based on the proposed methodology framework presented in Section 3.
Figure 9 illustrates the matching between EVs charging during times of highest solar power production since a daily charging strategy is taken into account. The required thermal power production becomes clearly more necessary when solar power is not available (i.e., at night times). The share of RES in the overall electricity production becomes 70.1% and the effective exportation potential (EEEP) reduces to 0.9 TWh with no CEEP. The small value for the exportation potential comes basically from the high demand from the EVs fleet in this scenario. At this point, it is important to highlight that the thermal production also includes the use of biomass resources which in the case of a 100% EV-fleet share could be at least partly shifted from the transportation sector to electricity production, reducing the need for using other fossil fuel resources.

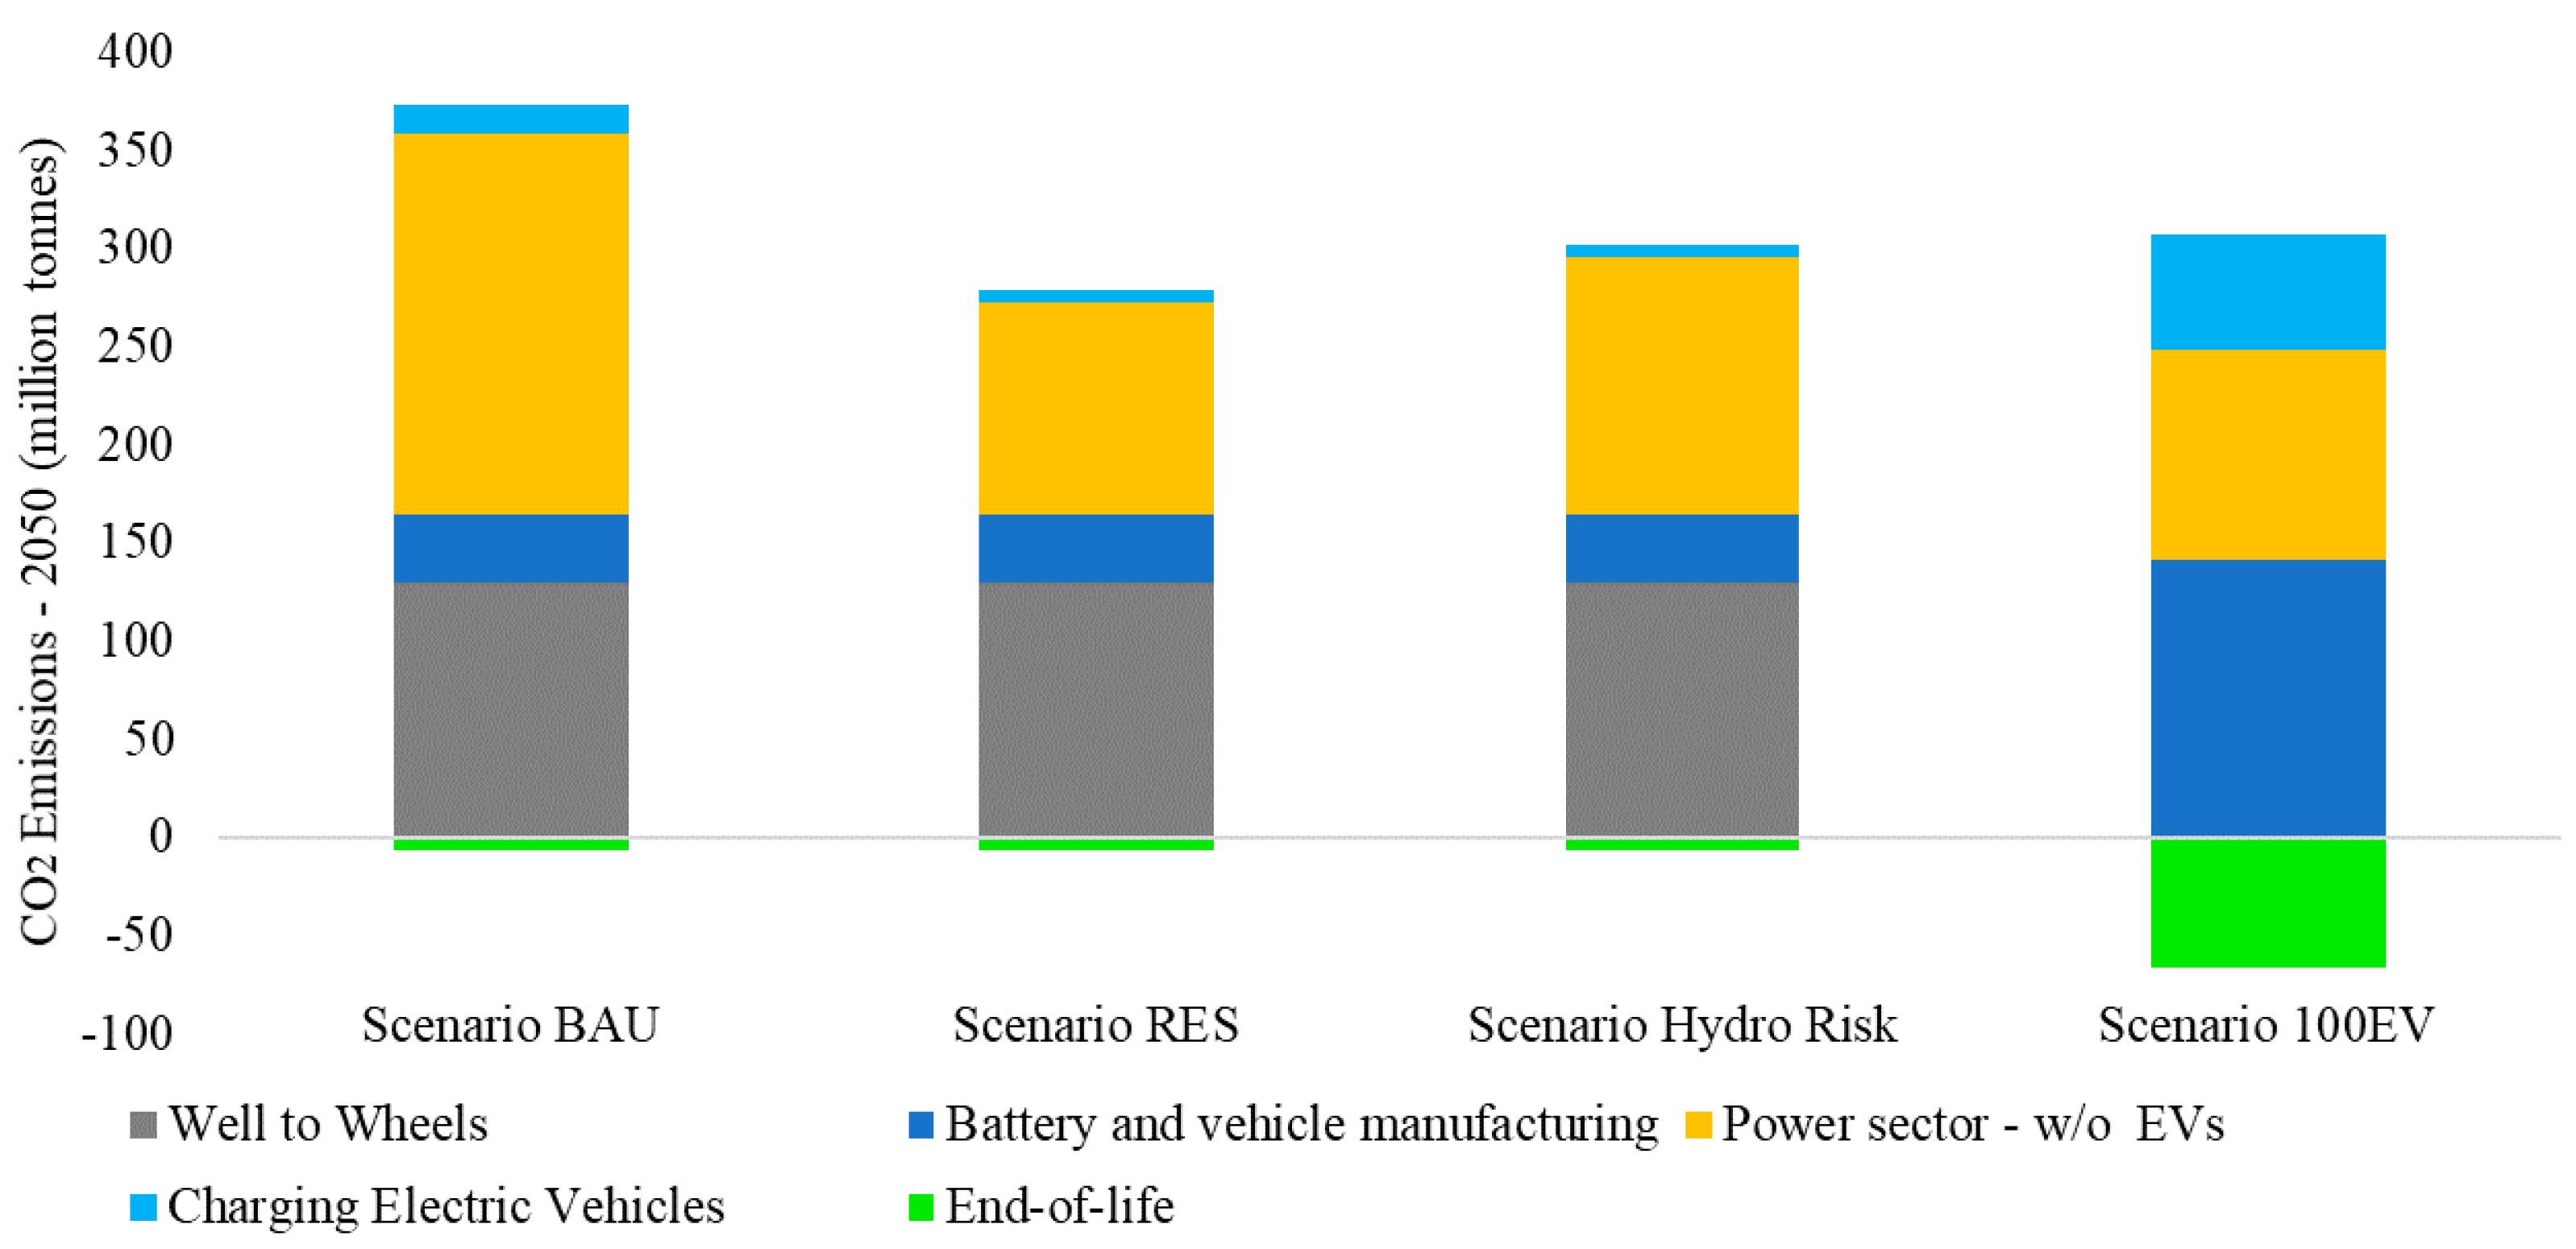
4.2. Life-Cycle Assessment (LCA)

This study set out to verify how effective might EVs be in decarbonizing the Brazilian energy sector through an LCA methodology taking into account the emissions from the Well to Tank (WtT), Tank to Wheels (TtW), battery and vehicle manufacturing, power sector and the electricity needed for charging the EVs. The credits resulted from the end-of-life of both vehicles and batteries are also included within the LCA.
Returning to the question posed at the beginning of this study regarding whether EVs can help reducing carbon dioxide emissions, it is now possible to state the extent to which each sector has on the overall country’s level of CO2 emissions in 2050 following the methodology presented in Section 3. In general, the study results show a clear-cut positive effect of increasing the share of EVs on reducing the overall level of CO2 emissions, but this would be highly dependent on both the share of RES in the power system and biofuels use in the transport sector. The potential to decrease CO2 emissions varies among scenarios and also increases as the renewable generation grows. Figure 10 shows the level of CO2 emissions (million tonnes) for each scenario in 2050.
The overall level of CO2 emissions from the transportation and electricity sectors are estimated to achieve 366 million tonnes in 2050 for scenario BAU from which 14 million tonnes (3.9%) comes from the EVs charging. Because of the higher need for thermal electricity in the hydro risk scenario, the CO2 emissions from the power sector increased from 114 million tonnes (Scenario RES) to 137 million tonnes (Scenario Hydro Risk). However, CO2 emissions from the power sector reduced by 45% between scenario BAU and scenario RES, as a result of the high share of renewable energy in scenario RES. Interestingly, differences in CO2 emissions for EVs charging between scenario BAU and scenario RES were found to be very significant reducing from 14 million tons (Scenario BAU) to 7 million tons (Scenario RES) and this reduction can also be explained by the higher renewable capacity for scenario RES compared to scenario BAU.
The single most striking observation to emerge from the data comparison is the reduction in the overall level of CO2 emissions in the case of replacing the entire transportation fleet to electric vehicles (i.e., Scenario 100EV). However, this reduction is highly dependent on the end-of-life CO2 emissions which comes from the non-battery recycling emissions (positive), battery recycling materials credit (negative) and battery reuse credit (negative) which accounted for near −67 million tonnes in scenario 100EV compared to −7 million tons for other scenarios. Although the thermal electricity production numerically increases (in average) compared to scenarios without a significant share of EVs (e.g., scenario RES), the Well to Tank and Tank to Wheels emissions from conventional cars are reduced to zero for Scenario 100EV. Taken together, from the CO2 emissions’ point of view, these results suggest that there is a positive impact of substituting the entire vehicle fleet for EVs since the CO2 emissions slow down sharply.
To estimate the average CO2 emissions per km for EVs (gCO2/km), the average distance travelled by the vehicles is also taken into account. A significant reduction has been found between scenario BAU (107.8 g CO2/km) compared with all other scenarios. No significant differences were found between scenario RES (52.3 g CO2/km) and scenario hydro risk (52.3 g CO2/km). Scenario 100EV represented the least value accounting for near 40.2 g CO2/km. These findings reveal that because of the higher RES capacity for scenarios RES, Hydro Risk and 100EV there is a significant decrease in the average level of CO2 emissions per km for these scenarios compared to scenario BAU. To give a well-known example for the sake of clarity and comparison, current average emissions for petrol cars are about 123 g CO2/km.
The specific contribution of carbon dioxide emissions (kgCO2/vehicle/year) from the transport sector reduced sharply from scenario BAU (1380 kgCO2/vehicle/year) to scenario 100EV (1066 kgCO2/vehicle/year). In this case, the emissions represent the average value for the entire vehicle fleet. This means that for scenario BAU, scenario RES and scenario hydro risk it takes into account both conventional and electric cars whereas for scenario 100EV only EVs are considered since no conventional cars are included in this last case. A small reduction was found between scenario BAU (1380 kgCO2/vehicle/year) and scenarios RES (1321 kgCO2/vehicle/year) and hydro risk (1321 kgCO2/vehicle/year). These results together further support the potential of higher shares of EVs to reduce carbon dioxide emissions for the Brazilian energy sector. The potential of increasing RES capacity also appears to highly positively influence the level of CO2 emissions decreasing for both the power sector and for charging the EVs and the extent to which it would impact the overall level of CO2 emissions would largely depend on the share of RES in the power system.

5. Conclusions

The findings from this research study make several contributions to the current literature. First, this study set out to assess the future impacts of electric vehicles in the electricity mix of the Brazilian power sector. The share of electric mobility is still small in Brazil, but it is expected to steadily increase in the years to come. Prior to this study, it was difficult to make predictions about how electric vehicles would impact both the country’s electricity mix and the level of carbon dioxide emissions. We highlight that our focus has been not on answering the competitiveness of EVs within the country but provide an overall assessment of its impact on the energy sector.
For the base case scenario (scenario BAU), our results revealed that the surplus electricity for charging EVs would come essentially from thermal resources. However, this electricity production is not only restricted to fossil fuel resources, but it also includes the use of biomass resources. The evidence from the simulation results and the LCA suggests that a positive impact would occur by substituting the entire light vehicles fleet for EVs since CO2 emissions slowed down compared to scenarios with lower shares of electric vehicles. Therefore, in general, the study results show that by increasing the share of EVs would also increase the potential to reduce the overall level of carbon emissions of transportation and electricity sectors combined but this is highly dependent on the credits resulting from the battery recycling materials credit and battery reuse credit. The potential to decrease CO2 emissions varies among scenarios and also increases as renewable generation grows. The present study has shed a contemporary light on the contentious issue that the potential to reduce carbon dioxide emissions is highly dependent on the power mix of each country but also on the share of biofuels use in the transportation sector. Our results proved also to be useful in expanding our understanding of how carbon dioxide emissions would be affected by different shares of both renewable energy and electric vehicles.
Strong evidence of reducing the overall level of CO2 emissions was found from the base case scenario (366 million tonnes–Scenario BAU) compared to the entire replacement of the vehicles by an EV-fleet (241 million tonnes–Scenario 100EV) which represents a reduction of 34%. The combined use of EVs and biofuels could, therefore, enhance Brazil’s capability of meeting the Paris agreement targets. With a 100% light electric vehicle fleet, road transportation might significantly reduce fossil fuel consumption. It is also well known that policies related to transport in Brazil focus largely on land-based biofuel production. In the particular case of Brazil, the avoided biofuels consumption in the road transportation sector could be partially shifted to the electricity sector providing synergies between road transportation and electricity generation sectors. Such synergies, however, require a holistic and integrated approach from the government side since structural and conjunctural changes may occur in the future for both the biofuels industry and in the electric vehicles sector.
The findings of the current study have important implications for the government to develop medium and long-term political frameworks that may integrate and take advantage of the synergies in the use of bioresources between transport and electricity sectors once the synergies from sector coupling will become increasingly important in the future. In the case of a high share of electric vehicles, this would also allow increasing the exportation potential of bioresources. It is also well known that harvesting periods for biomass from sugar cane can typically occur between April and October in the country. As explained earlier, a more favourable wind-profile is typical in this period, but due to unfavourable hydrological conditions, reduced reservoir water levels are also predictable for this specific period. Therefore, the coordinated use of bioresources could be beneficial for the entire energy sector to fully exploit the synergies between the use of bioresources together with the availability of wind and hydro-based resources according to seasonal variations.
We also found that synergies might exist between EVs needs and solar power generation mainly if a daily charging strategy is considered. For the overnight charging strategy, there is also a higher need for battery storage mainly during the day with higher solar power production. The authors of [50] addressed the impact on carbon emissions for both day and night charging strategies and concluded that the emissions were reduced by 13.8% for the day charging strategy considering the power system evaluated (i.e., region of Texas). The development of a tariff structure (e.g., Time of Use rates) would probably offer low-cost electricity during peak sun hours and it could make people shift their load to these specific hours. The charging of EVs would also possibly benefit from this market price system.
The insights gained from this study may be of assistance to the government and policy-makers. The transition towards an electric fleet may also be beneficial for the country, reducing the importation of gasoline and increasing the exportation of biofuels, for example. A critical determinant of the success of this transition is the support of local government for promoting incentives for the adoption of EVs but the support for the development of the required charging infrastructure is also essential. Therefore, the current challenges include increasing the charging infrastructure which would allow the diffusion of EVs in the country. Regulatory improvements are imperative as well as new incentives for a sustainable transport system in Brazil. The country would also be beneficiated by using an integrated approach into urban planning, helping the transition to sustainable mobility. The co-benefits of EVs should be also better addressed identifying its role for citizens, renewable energy providers and electricity grid operators, for example.
This work contributed to existing knowledge addressing the future impact of electric vehicles in the electricity mix of the Brazilian power sector. It is possible that our results may not be generalizable to a broader range of power systems. However, the findings reported here shed new light on the role of electric vehicles in renewable-based energy systems.

6. Limitations and Further Research

Although the findings of this research provide important insights into the role of EVs in renewable-based energy systems, some limitations need to be noted regarding the present research and future studies on the current topic are therefore highly recommended. Future research can address topics related to the interaction between different economic sectors, bioenergy emissions, modeling improvements and technological developments, as detailed below.
The use of an optimization approach, for instance, would be of much interest as it could focus on answering the optimal market share among electric, biofuels and flexible-fuel vehicles in the country’s energy transportation mix. The joint use of biofuels and EVs in the transportation sector may provide a set of benefits for both the energy and transportation sectors. Regardless of the high costs associated with the EVs, this technology might increase the future power system flexibility supporting the power system operation. Furthermore, EVs has the potential to optimizing renewable resources usage, reducing the reliance on imported oil and lowering the transmission system utilization in the country.
A financial analysis could be also conducted for the different optimal alternatives based on the selected country’s political objectives. The scope of this study was limited in terms of evaluating only the potential of light passenger vehicles and other transport categories should be further addressed. The interaction and coordinating challenges brought about by the joint use of EVs and other Distributed Energy Resources (DER) are not assessed in this research and future work could focus in this direction ([51,52] may provide some support is this issue). A full assessment analysis, which takes into account other sectors (e.g., agriculture, product use, industrial processes and waste sectors) and its interactions also open up new avenues for future research.
Further investigations are also needed to assess the extent to which bioenergy might compete not only with food production and land use but also for water resources. The sustainability of non-carbon alternatives (e.g., biofuels) depends largely on the source of the feedstock [53]. However, the land area required to grow biofuel feedstocks is beyond the scope of this study. Therefore, the direct and indirect land-use change (LUC) emissions should be further evaluated (see [40] for details). To give a well-known example for the sake of clarity, the authors of [54] highlight the importance of taking into account the resulted biofuel emissions in the case that “the crop were produced on a parcel of land that previously grew soybeans, and as a result a forest was cleared somewhere else to grow soybeans to meet the same soybean demand”. Therefore, further studies, which take the indirect CO2 emissions from biofuels into account, will need to be undertaken in order to provide a deeper insight into the full assessment of carbon dioxide emissions from both the transport and electricity sectors. Although our findings indicated a potential reduction in the overall level of CO2 emissions, the authors of [7] found that EVs could potentially lead to a rebound effect and in reality, it can increase CO2 emissions in the transport sector. This limitation means that study findings need to be interpreted cautiously.
With regard to the research methods, some limitations need to be acknowledged. The model used did not allow to represent the interconnections between national subsystems. Therefore, there is a fair degree of uncertainty by modeling the country as a single region which makes it difficult for the inclusion of within-country inequalities. Therefore, this current research investigation has not been able to establish the regional impacts of renewables production on EVs charging, for instance, which adds further caution regarding the generalisability of the findings. For example, in the Northeast region, a critical excess of the wind electricity production might occur in specific seasons of the year which can be potentially used to charge the EVs during these periods of high wind profiles. Further simulation analysis is required to determine exactly how the penetration of EVs affects the resources of each region but also to establish the potential of transmission lines to provide flexibility to the power system. Further research should also be carried out to establish the regional-specific impacts of different shares of both EVs and biofuels in the transportation section and RES for electricity production.
Another major source of uncertainty is related to the method used to calculate the electricity consumption of EVs for 2050 since technological developments may change these values. The importance of both the capacity of the grid to battery connection and the overall battery storage capacity would also affect the results. We have restricted the grid capacity by a percentage share of the total EVs capacity since the grid infrastructure investments would be very high if the grid capacity would be dimensioned for supporting a 100% EVs fleet. Other charging strategies could be also addressed by future research. This research did not evaluate the use of Vehicle-to-Grid (V2G) technology which could have the potential to accommodate the critical excess of electricity production. Also, considering, for example, that two full-power hours are necessary to charge the electric car, it becomes clear the great level of flexibility that might be provided for the power grid during the remaining hours of the day considering the EV is plugged in at work times. Further research work is required to shed light on the potential contribution of the so-called Shared Autonomous Electric Vehicles (SAEV) which is likely to also have a place in the future (see [55] for more details). The contributions of SAEV for climate mitigation, for instance, was recently addressed in [56] concluding that the transition towards SAEV may also accelerate vehicle electrification.
Therefore, the generalizability of our results is subject to certain limitations. These limitations mean that study findings need to be interpreted cautiously and it is also possible that our results might not be generalizable to a broader range of countries. However, we highlight the potential of replicability of the proposed methodology which may help to obtain consistent results across similar power systems and help on the decarbonization of the world’s energy matrix.

Author Contributions

Conceptualisation, G.G.D. and P.F.; methodology, G.G.D.; validation, G.G.D. and P.F.; draft preparation, visualisation G.G.D. and P.F.; writing—review and editing, supervision, P.F. All authors have read and agreed to the published version of the manuscript.

Funding

The researchers further like to acknowledge the financial support by the National Council for Scientific and Technological Development (CNPq), Brazil. This work has been also supported by FCT e Fundaçao para a Ciência e Tecnologia within the R&D Units Project Scope: UIDB/00319/2020.

Conflicts of Interest

The authors declare no conflict of interest.

Appendix A

Table A1. Technical assumptions for each scenario.
Energy PLAN Input DataScenario BAUScenario RESScenario Hydro RiskScenario 100EVRef.
Electricity Demand (TWh)1571157115711571[39,57]
Fixed Import/Export (TWh)0.1790.1790.1790.179[38]
Transmission Capacity (MW)9070907090709070[19]
Installed Capacity—Intermittent (2050) (GW)149.7299.3299.3299.3[39]
Installed Capacity—Other (2050) (GW)661.3661.3661.3661.3[39]
Transport Consumption—Gasoline (TWh/year)347.2347.2347.20[24]
Transport Consumption—Biofuels (TWh/year)388.6388.6388.60[24]
Electric Vehicles Demand—(TWh/year)38.838.838.8216.4[24,58,59]
Capacity of grid to battery connection (MW)23,62523,62523,625262,500[24,45]
Battery storage capacity (GWh)713.7713.7713.77064[24,45]
Charge Rate of EVs (kW)6666[45]
Table A2. Other input data.
DescriptionValueRef.
WtT Emission Intensity Factor (g/MJ) for Petrol 13.8[40]
WtT Emission Intensity Factor (g/MJ) for Ethanol18.1[40]
TtW Emission Intensity Factor (g/MJ) for Petrol 69.8[40]
TtW Emission Intensity Factor (g/MJ) for Ethanol0[40]
CO2 Emissions from non-battery components per car (tonnes)3.2[40]
Vehicle Life (km)200,000[40]
Batteries in life-time for electric and hybrid vehicles (years)1.5[40]
Battery size—Electric (kWh) 70.64 [45]
Battery size—Hybrid (kWh)1.5[40]
Max share of cars during peak demand0.2[60]
Share of parked cars grid connected0.7[60]
Efficiency (grid to battery)0.9[60]
Charging strategyDaily[16]
Average distance travelled (km/year)11,700[58]
Average EVs consumption—2050 (kWh/km)0.148[59]
Charge Rate of EVs (kW)6[45]
CO2 by fuel (kg/GJ) Coal (Electricity Sector—EnergyPLAN input data)95[60]
CO2 by fuel (kg/GJ) Petrol (Electricity Sector—EnergyPLAN input data)74[60]
CO2 by fuel (kg/GJ) Natural Gas (Electricity Sector—EnergyPLAN input data)56.7[60]
Average battery manufacturing intensity (g/kWh)152,063[40]
Energy for recycling vehicles (MJ/kg)0.43[40]
Energy for recycling batteries (MJ/kg)469[40]
Mass of each car (kg)1200[40]
Average emissions factor reduction by using recycled battery materials (%)26.5[40]
Battery recycling rate in 2050 (%)100[40]
Vehicle-use portion of battery life (%)58.1[40]
Batteries in vehicle life1.5[40]
Extra life batteries can be used for after their vehicular use (%)72[40]

References

  1. van Ruijven, B.J.; De Cian, E.; Sue Wing, I. Amplification of future energy demand growth due to climate change. Nat. Commun. 2019, 10. [Google Scholar] [CrossRef] [PubMed] [Green Version]
  2. Dranka, G.G.; Ferreira, P. Towards a smart grid power system in Brazil: Challenges and opportunities. Energy Policy 2020, 136. [Google Scholar] [CrossRef]
  3. Chu, S.; Majumdar, A. Opportunities and challenges for a sustainable energy future. Nature 2012, 488, 294–303. [Google Scholar] [CrossRef]
  4. Dranka, G.G.; Ferreira, P.; Vaz, A.I.F. Cost-effectiveness of energy efficiency investments for high renewable electricity systems. Energy 2020, 198, 117198. [Google Scholar] [CrossRef]
  5. Dranka, G.G.; Jorge, C.; de Lima, J.D.; Ferreira, P. Economic evaluation methodologies for renewable energy projects. AIMS Energy 2020, 8, 339–364. [Google Scholar] [CrossRef]
  6. IRENA. Synergies between Renewable Energy and Energy Efficiency; International Renewable Energy Agency: Masdar City, Abu Dhabi, 2017; pp. 1–121. [Google Scholar]
  7. Bellocchi, S.; Klöckner, K.; Manno, M.; Noussan, M.; Vellini, M. On the Role of Electric Vehicles towards Low-Carbon Energy Systems: Italy and Germany in Comparison. Energy Fuel Technol. 2019, 2019050331. [Google Scholar] [CrossRef]
  8. Dranka, G.G.; Ferreira, P. Review and assessment of the different categories of demand response potentials. Energy 2019, 179, 280–294. [Google Scholar] [CrossRef]
  9. Dranka, G.G.; Ferreira, P. Load flexibility potential across residential, commercial and industrial sectors in Brazil. Energy 2020, 201. [Google Scholar] [CrossRef]
  10. Longo, M.; Foiadelli, F.; Yaïci, W. Electric Vehicles Integrated with Renewable Energy Sources for Sustainable Mobility. In New Trends in Electrical Vehicle Powertrains; IntechOpen: London, UK, 2019. [Google Scholar]
  11. Ballinger, B.; Stringer, M.; Schmeda-Lopez, D.R.; Kefford, B.; Parkinson, B.; Greig, C.; Smart, S. The vulnerability of electric vehicle deployment to critical mineral supply. Appl. Energy 2019, 255, 113844. [Google Scholar] [CrossRef]
  12. IRENA. Innovation Outlook—Smart Charging for Electric Vehicles. Available online: https://www.irena.org//media/Files/IRENA/Agency/Publication/2019/May/IRENA_Innovation_Outlook_EV_smart_charging_2019.pdf (accessed on 12 November 2019).
  13. Wilson, L. Shades of Green: Electric Cars’ Carbon Emissions Around the Globe; Shrink That Footpr: Washington, DC, USA, 2013. [Google Scholar]
  14. Liu, W.; Hu, W.; Lund, H.; Chen, Z. Electric vehicles and large-scale integration of wind power—The case of Inner Mongolia in China. Appl. Energy 2013, 104, 445–456. [Google Scholar] [CrossRef]
  15. Lund, H.; Kempton, W. Integration of renewable energy into the transport and electricity sectors through V2G. Energy Policy 2008, 36, 3578–3587. [Google Scholar] [CrossRef]
  16. dos Santos Martins, M.M.M.M. Evaluation of Energy and Environmental Impacts of Electric Vehicles in Different Countries. Master’s Thesis, Técnico Lisboa, Lisboa, Portugal, 2015. [Google Scholar]
  17. Hassan, A.S.; Xydas, E.S.; Marmaras, C.E.; Cipcigan, L.M.; Jenkins, N. Integrating renewable energy with flexible storage systems: A case study of GB and Greece. In Proceedings of the 2013 48th International Universities’ Power Engineering Conference, Dublin, Iceland, 2–5 September 2013; Institute of Electrical and Electronics Engineers: New York, NY, USA, 2014. [Google Scholar]
  18. Dranka, G.G.; Ferreira, P. Planning for a renewable future in the Brazilian power system. Energy 2018, 164, 496–511. [Google Scholar] [CrossRef]
  19. ANEEL. Sistema de Informações de Geração da ANEEL; SIGA: Brasília, Brazil, 2020. [Google Scholar]
  20. EPE. Brazilian Energy Balance 2019: Base Year 2018. Available online: https://ben.epe.gov.br/ (accessed on 25 July 2019).
  21. REN21. Renewables 2019 Global Status Report; National Technical University of Athens (NTUA): Athens, Greece, 2019; ISBN 978-3-9818911-7-1. [Google Scholar]
  22. EPE. Análise de Conjuntura dos Biocombustíveis 2018; Ministério de Minas e Energia: Brasília, Brazil, 2018. [Google Scholar]
  23. Dorotić, H.; Doračić, B.; Dobravec, V.; Pukšec, T.; Krajačić, G.; Duić, N. Integration of transport and energy sectors in island communities with 100% intermittent renewable energy sources. Renew. Sustain. Energy Rev. 2019, 99, 109–124. [Google Scholar] [CrossRef]
  24. Lima, M.A.; Mendes, L.F.R.; Mothé, G.A.; Linhares, F.G.; de Castro, M.P.P.; da Silva, M.G.; Sthel, M.S. Renewable energy in reducing greenhouse gas emissions: Reaching the goals of the Paris agreement in Brazil. Environ. Dev. 2020, 100504. [Google Scholar] [CrossRef]
  25. EPE. Nota Técnica DEA 13/15—Demanda de Energia 2050. Available online: http://www.epe.gov.br/sites-pt/publicacoes-dados-abertos/publicacoes/PublicacoesArquivos/publicacao-227/topico-458/DEA13-15DemandadeEnergia2050.pdf (accessed on 19 February 2016).
  26. Cano, Z.P.; Banham, D.; Ye, S.; Hintennach, A.; Lu, J.; Fowler, M.; Chen, Z. Batteries and fuel cells for emerging electric vehicle markets. Nat. Energy 2018, 3, 279–289. [Google Scholar] [CrossRef]
  27. de Azevedo, T.R.; Costa Junior, C.; Brandão Junior, A.; Cremer, M.; dos Santos Cremer, M.; Piatto, M.; Tsai, D.S.; Barreto, P.; Martins, H.; Sales, M.; et al. SEEG initiative estimates of Brazilian greenhouse gas emissions from 1970 to 2015. Sci. Data 2018, 5, 180045. [Google Scholar] [CrossRef] [Green Version]
  28. Dominković, D.F.; Bačeković, I.; Pedersen, A.S.; Krajačić, G. The future of transportation in sustainable energy systems: Opportunities and barriers in a clean energy transition. Renew. Sustain. Energy Rev. 2018, 82, 1823–1838. [Google Scholar] [CrossRef]
  29. Emiliano, M.W.; Costa, L.; Carvalho, S.M.; Telhada, J.; A. Lanzer, E. Multiobjective optimization of transit bus fleets with alternative fuel options: The case of Joinville, Brazil. Int. J. Sustain. Transp. 2020, 14, 14–24. [Google Scholar] [CrossRef]
  30. Tarroja, B.; Zhang, L.; Wifvat, V.; Shaffer, B.; Samuelsen, S. Assessing the stationary energy storage equivalency of vehicle-to-grid charging battery electric vehicles. Energy 2016, 106, 673–690. [Google Scholar] [CrossRef]
  31. Li, P.; Hu, W.; Xu, X.; Huang, Q.; Liu, Z.; Chen, Z. A frequency control strategy of electric vehicles in microgrid using virtual synchronous generator control. Energy 2019, 189, 116389. [Google Scholar] [CrossRef]
  32. Islam, M.M.; Zhong, X.; Sun, Z.; Xiong, H.; Hu, W. Real-time frequency regulation using aggregated electric vehicles in smart grid. Comput. Ind. Eng. 2019, 134, 11–26. [Google Scholar] [CrossRef]
  33. Bañol Arias, N.; Hashemi, S.; Andersen, P.B.; Træholt, C.; Romero, R. Assessment of economic benefits for EV owners participating in the primary frequency regulation markets. Int. J. Electr. Power Energy Syst. 2020, 120, 105985. [Google Scholar] [CrossRef]
  34. Musio, M.; Porru, M.; Serpi, A.; Marongiu, I.; Damiano, A. Optimal Electric Vehicle charging strategy for energy management in microgrids. In Proceedings of the 2014 IEEE International Electric Vehicle Conference, IEVC 2014, Florence, Italy, 17–19 December 2014; Institute of Electrical and Electronics Engineers Inc: Piscataway, NJ, USA, 2014. [Google Scholar]
  35. Zethmayr, J.; Kolata, D. Charge for Less: An Analysis of Hourly Electricity Pricing for Electric Vehicles. World Electr. Veh. J. 2019, 10, 6. [Google Scholar] [CrossRef] [Green Version]
  36. Østergaard, P.A. Reviewing EnergyPLAN simulations and performance indicator applications in EnergyPLAN simulations. Appl. Energy 2015, 154, 921–933. [Google Scholar] [CrossRef]
  37. EnergyPLAN—Advanced Energy System Analysis Computer Model. Available online: http://www.energyplan.eu/ (accessed on 9 October 2017).
  38. ONS Brazilian National Grid Operator. Available online: http://www.ons.org.br/Paginas/resultados-da-operacao/historico-da-operacao (accessed on 7 May 2018).
  39. PCE. Cenários Para a Matriz Elétrica 2050: Aporte ao Debate Energético Nacional e ao Planejamento Participativo de Longo Prazo; PCE Brasil 2050. Available online: http://www.nextrans.com.br/wp-content/uploads/2015/03/Energia-Cenarios-2050.pdf (accessed on 5 October 2017).
  40. Glensor, K.; María Rosa Muñoz, B. Life-cycle assessment of Brazilian transport biofuel and electrification pathways. Sustainability 2019, 11, 6332. [Google Scholar] [CrossRef] [Green Version]
  41. Pfenninger, S.; Staffell, L. Renewables Ninja. Available online: www.renewables.ninja (accessed on 14 November 2017).
  42. Pfenninger, S.; Staffell, L. Long-term patterns of European PV output using 30 years of validated hourly reanalysis and satellite data. Energy 2016, 114, 1251–1265. [Google Scholar] [CrossRef] [Green Version]
  43. Staffell, L.; Pfenninger, S. Using Bias-Corrected Reanalysis to Simulate Current and Future Wind Power Output. Energy 2016, 114, 1224–1239. [Google Scholar] [CrossRef] [Green Version]
  44. EPE. Brazilian Energy Balance 2017: Base Year 2016. Available online: https://ben.epe.gov.br/ (accessed on 5 March 2018).
  45. de Almeida, A.S.F. The Role of Electric Vehicles Second-Life Batteries on Renewable Based Power Systems. Master’s Thesis, Universidade de Lisboa, Lisbon, Portugal, 2018. [Google Scholar]
  46. de Lucena, A.F.P.; Szklo, A.S.; Schaeffer, R.; de Souza, R.R.; Borba, B.S.M.C.; da Costa, I.V.L.; Júnior, A.O.P.; da Cunha, S.H.F. The vulnerability of renewable energy to climate change in Brazil. Energy Policy 2009, 37, 879–889. [Google Scholar] [CrossRef]
  47. Rochedo, P.R.R.; Soares-Filho, B.; Schaeffer, R.; Viola, E.; Szklo, A.; Lucena, A.F.P.; Koberle, A.; Davis, J.L.; Rajão, R.; Rathmann, R. The threat of political bargaining to climate mitigation in Brazil. Nat. Clim. Chang. 2018, 8, 695–698. [Google Scholar] [CrossRef]
  48. Zambon, R.C. A operação dos reservatórios e o planejamento da operação hidrotérmica do Sistema Interligado Nacional. Rev. USP 2015, 133–144. [Google Scholar] [CrossRef]
  49. Institute, W.R. Water Risk Atlas. Available online: https://www.wri.org/applications/aqueduct/water-risk-atlas (accessed on 3 December 2019).
  50. Chen, X.; Tan, C.-W.; Kiliccote, S.; Rajagopal, R. Electric vehicle charging during the day or at night: A perspective on carbon emissions. arXiv 2019, arXiv:1811.07984. [Google Scholar]
  51. Liu, L.; Kong, F.; Liu, X.; Peng, Y.; Wang, Q. A review on electric vehicles interacting with renewable energy in smart grid. Renew. Sustain. Energy Rev. 2015, 51, 648–661. [Google Scholar] [CrossRef]
  52. Mwasilu, F.; Justo, J.J.; Kim, E.-K.; Do, T.D.; Jung, J.-W. Electric vehicles and smart grid interaction: A review on vehicle to grid and renewable energy sources integration. Renew. Sustain. Energy Rev. 2014, 34, 501–516. [Google Scholar] [CrossRef]
  53. Graves, C.; Ebbesen, S.D.; Mogensen, M.; Lackner, K.S. Sustainable hydrocarbon fuels by recycling CO2 and H2O with renewable or nuclear energy. Renew. Sustain. Energy Rev. 2011, 15, 1–23. [Google Scholar] [CrossRef]
  54. APS Physics. Direct Air Capture of CO2 with Chemicals—A Technology Assessment for the APS Panel on Public Affairs. Available online: https://www.aps.org/policy/reports/assessments/upload/dac2011.pdf (accessed on 5 December 2019).
  55. Iacobucci, R.; McLellan, B.; Tezuka, T. The Synergies of Shared Autonomous Electric Vehicles with Renewable Energy in a Virtual Power Plant and Microgrid. Energies 2018, 11, 2016. [Google Scholar] [CrossRef] [Green Version]
  56. Jones, E.C.; Leibowicz, B.D. Contributions of shared autonomous vehicles to climate change mitigation. Transp. Res. Part D Transp. Environ. 2019, 72, 279–298. [Google Scholar] [CrossRef]
  57. PCE. Metodologia Para Elaboração e Validação dos Cenários Elétricos—Plataforma Cenários Energéticos. Available online: http://viex-americas.com/cortex/wwf/pce/metodologia/ (accessed on 17 November 2017).
  58. KBB. Average Distance Travelled (km/year) by Vehicles in Brazil. Available online: https://www.kbb.com.br/detalhes-noticia/quanto-brasileiro-roda-carro-ano/?ID=1830 (accessed on 4 December 2019).
  59. Zushman, J.M. Modelling Greenhouse Gas Emissions from Light Duty Vehicles. Bachelor’s Thesis, University of Iceland, Reykjavik, Iceland, 2016. [Google Scholar]
  60. Lund, H. EnergyPLAN—Documentation. Available online: http://www.energyplan.eu/ (accessed on 4 December 2019).
Figure 1. Projected light vehicles fleet profile by fuel in Brazil between 2014 and 2050.
Energies 13 04423 g001
Figure 2. The detailed methodological approach of the research.
Energies 13 04423 g002
Figure 3. Power output on a spring week for scenario BAU—Daily charging strategy.
Energies 13 04423 g003
Figure 4. Power output on a spring week for scenario RES—Daily charging strategy.
Energies 13 04423 g004
Figure 5. Power output on a fall week for scenario RES – Daily charging strategy.
Energies 13 04423 g005
Figure 6. Power output on a spring week for scenario RES—Overnight charging strategy.
Energies 13 04423 g006
Figure 7. Power output on a spring week for scenario hydro risk—Daily charging strategy.
Energies 13 04423 g007
Figure 8. Average power output on a spring and fall week for scenario hydro risk.
Energies 13 04423 g008
Figure 9. Power output on a spring week for scenario 100EV—Daily charging strategy.
Energies 13 04423 g009
Figure 10. CO2 for each scenario in 2050 (millions of tonnes).
Energies 13 04423 g010
Table 1. Exported Excess Electricity Production (EEEP) and Critical Excess Electricity Production (CEEP) for all scenarios (TWh).
EEEP (TWh)CEEP (TWh)
Scenario BAU0.00.0
Scenario RES12.224.3
Scenario Hydro Risk12.224.3
Scenario 100EV0.90.0

