Article

Stochastic Modeling Method of Plug-in Electric Vehicle Charging Demand for Korean Transmission System Planning

Department of Electrical Engineering, Jeonbuk National University, 567 Baekje-daero, Deokjin-gu, Jeonju-si, Jeollabuk-do 54896, Korea
*
Author to whom correspondence should be addressed.
Energies 2020, 13(17), 4404; https://doi.org/10.3390/en13174404
Submission received: 24 June 2020 / Revised: 14 August 2020 / Accepted: 19 August 2020 / Published: 26 August 2020
(This article belongs to the Special Issue Impact of Electric Vehicles on the Power System)

Abstract

:
The number of plug-in electric vehicles (PEVs) has rapidly increased owing to the government’s active promotion policy worldwide. Consequently, in the near future, their charging demand is expected to grow enough for consideration in the planning process of the transmission system. This study proposes a stochastic method for modeling the PEV charging demand, of which the time and amount are uncertain. In the proposed method, the distribution of PEVs is estimated by the substations based on the number of electricity customers, PEV expansion target, and statistics of existing vehicles. An individual PEV charging profile is modeled using the statistics of internal combustion engine (ICE) vehicles driving and by aggregating the PEV charging profiles per 154 kV substation, the charging demand of PEVs is determined for consideration as part of the total electricity demand in the planning process of transmission systems. The effectiveness of the proposed method is verified through case studies in the Korean power system. It was found that the PEV charging demand has considerable potential as the additional peak demand in the transmission system planning because the charging time could be concentrated in the evening peak time.

1. Introduction

As part of the efforts to reduce greenhouse gas emission in the transportation field, the number of electric vehicles (EV) has rapidly increased with the active promotion policy of governments all over the world [1,2]. Among the various types of EVs, the most promising type is the plug-in electric vehicle (PEV), which is directly connected to the power system via a charger to charge the battery. Because PEV chargers have a one-step higher rating than those of existing electric appliances such as air conditioners and refrigerators, the aggregated charging demand of PEVs is expected to grow enough for consideration in the planning process of power systems as its penetration level increases in the near future. With the integration of a large number of PEVs into the grid, there will be important challenges in terms of peak load, power loss, and voltage profiles which have been reported in several studies [3,4,5]. Due to the increase in peak demand at the transmission system, the maximum power generation cannot meet the demand, so it is necessary to install additional power plants such as fossil fuel power plants. In addition, the demand profile may change due to the PEV charging demand, which may lead to even greater changes when a renewable energy system (RES) is added in the future and may affect the mix of fuels. The impact of the transmission system due to the concentration of additional loads in the particular area where the number of PEVs is concentrated can appear as an increase in the resistive loss of the high-voltage network and an increase in the load ratio of the transmission line. Therefore, it is necessary to consider their charging demands not only in the distribution system but also in the transmission system [6,7].
The first step in the typical transmission system planning process is load forecasting based on the historical data of electricity use. In Korea, the estimated electricity loads are published over the next 15 years by the government and the charging demand of PEVs became one of the particular data in 2017. In addition, the charging demands of PEVs need to be modelled as a part of the electricity loads at the substation so that it can be considered in the process of transmission system planning where the process is more heavily regulated and conducted in a longer timeframe comparing with the distribution system. However, because of inexperience and the uncertainty of the charging demand of PEVs, electric utilities would suffer from considering them in the planning process. Therefore, the applicability of the modeling methods for the PEV charging demand, while representing the characteristics of PEV, is necessary for the existing planning process.
Various methods of modeling the EV charging demand and a behavior of EVs driving schedule in the power system have been proposed. One method used queuing analysis and the Monte Carlo method to model the EV charging demand. In Hafez et al. [8], the PEV queuing model was proposed using a detailed PEV battery charging behavior (BCB) model, modeled arrival rate, and the service time. In [9], the charging load was modeled based on Monte Carlo Simulation by analyzing different power demand characteristics of charging mode. However, because of specific conditions such as the plug-in time and charging time assumed in the queuing analysis, as well as the complex process and extensive data required in the Monte Carlo method, electric utilities would face numerous constraints when applying the methods in the transmission system planning process. Another study [10] proposed an optimal charging profile model of individual PEV for vehicle to grid (V2G) to flatten the power load profile. The proposed scheme deals with the high uncertainty due to the mobility as transportation tool through stochastic connection to smart grid. As input data used for this stochastic connection to the smart grid, the actual driving pattern of passenger cars was investigated. However, samples of actual data used as input data are too small. In order to reflect the reality, it seems that more data are needed to be able to generalize. In Qian et al. [11], an individual EV was modeled stochastically and the charging pattern for multiple EVs was modeled as the average value for a specific time and a uniform distribution-based modeling method of EVs was proposed for analyzing the effectiveness of the charging demand of EVs in the distribution network. However, the uniform distribution model could not consider variations in the penetration level and distribution of EVs, which are necessary for the consideration of the EV charging demand in the planning process of transmission systems. Tabatabaee et al. [12] used bidirectional energy trading capabilities of an EV among distributed energy resources (DER) components for the purpose of optimal operation of an energy management system for a grid-connected smart building. The mobility behavior of the EVs fleet used for work-related trips is modelled taking into account stochastic characteristics. Thus, arrival times, detention times, and initial state-of-energy levels for EVs have been considered using corresponding appropriate statistical distributions. Further studies [13,14], suggest a new stochastic framework based on unscented transformation (UT) in which a suitable tool is used to model the uncertainties associated with the departure time and arrival times of the PEVs fleets, state of charge (SOC) of batteries, number of PEVs in a fleet. However, modeled in a PEV fleet, a PEV set with similar driving characteristics, short trips, and individual PEVs distributed in the network were ignored [12,13,14]. In De Nigris et al. [15], through the average EV charging amount and one type of charger, the daily charging pattern was derived by calculating according to the ratio of EV charging over time. However, although the charging profile was derived for individual EVs, the total charging demand of the EVs was modeled by equally assuming the derived charging profile of all the EVs. Therefore, the variations of the charging demand such as the charger rating, plug-in time, and charging amount for various EVs could not be considered in these methods. Considering the above, the proposals of this paper are as follow:
  • A stochastic method which models the PEV charging demand as electric loads over the substations in the transmission system planning process. The method considers the uncertainty and variations in the distribution and charging profiles of the PEVs.
  • The distribution of PEVs is estimated by the substation based on the number of electricity customers, the PEV expansion target, and existing statistics. An individual PEV charging profile is modeled using the statistics of existing internal combustion engine (ICE) vehicles driving.
  • By aggregating the PEV charging profiles per 154 kV substation, the charging demand of PEVs can be determined for consideration as a part of the total electricity demand in the planning process of transmission systems.
The effectiveness of the proposed method is verified through case studies in the Korean power system and it was found that the PEV charging demand has considerable potential as a peak demand in the transmission system planning because the charging time is concentrated in the evening peak time.

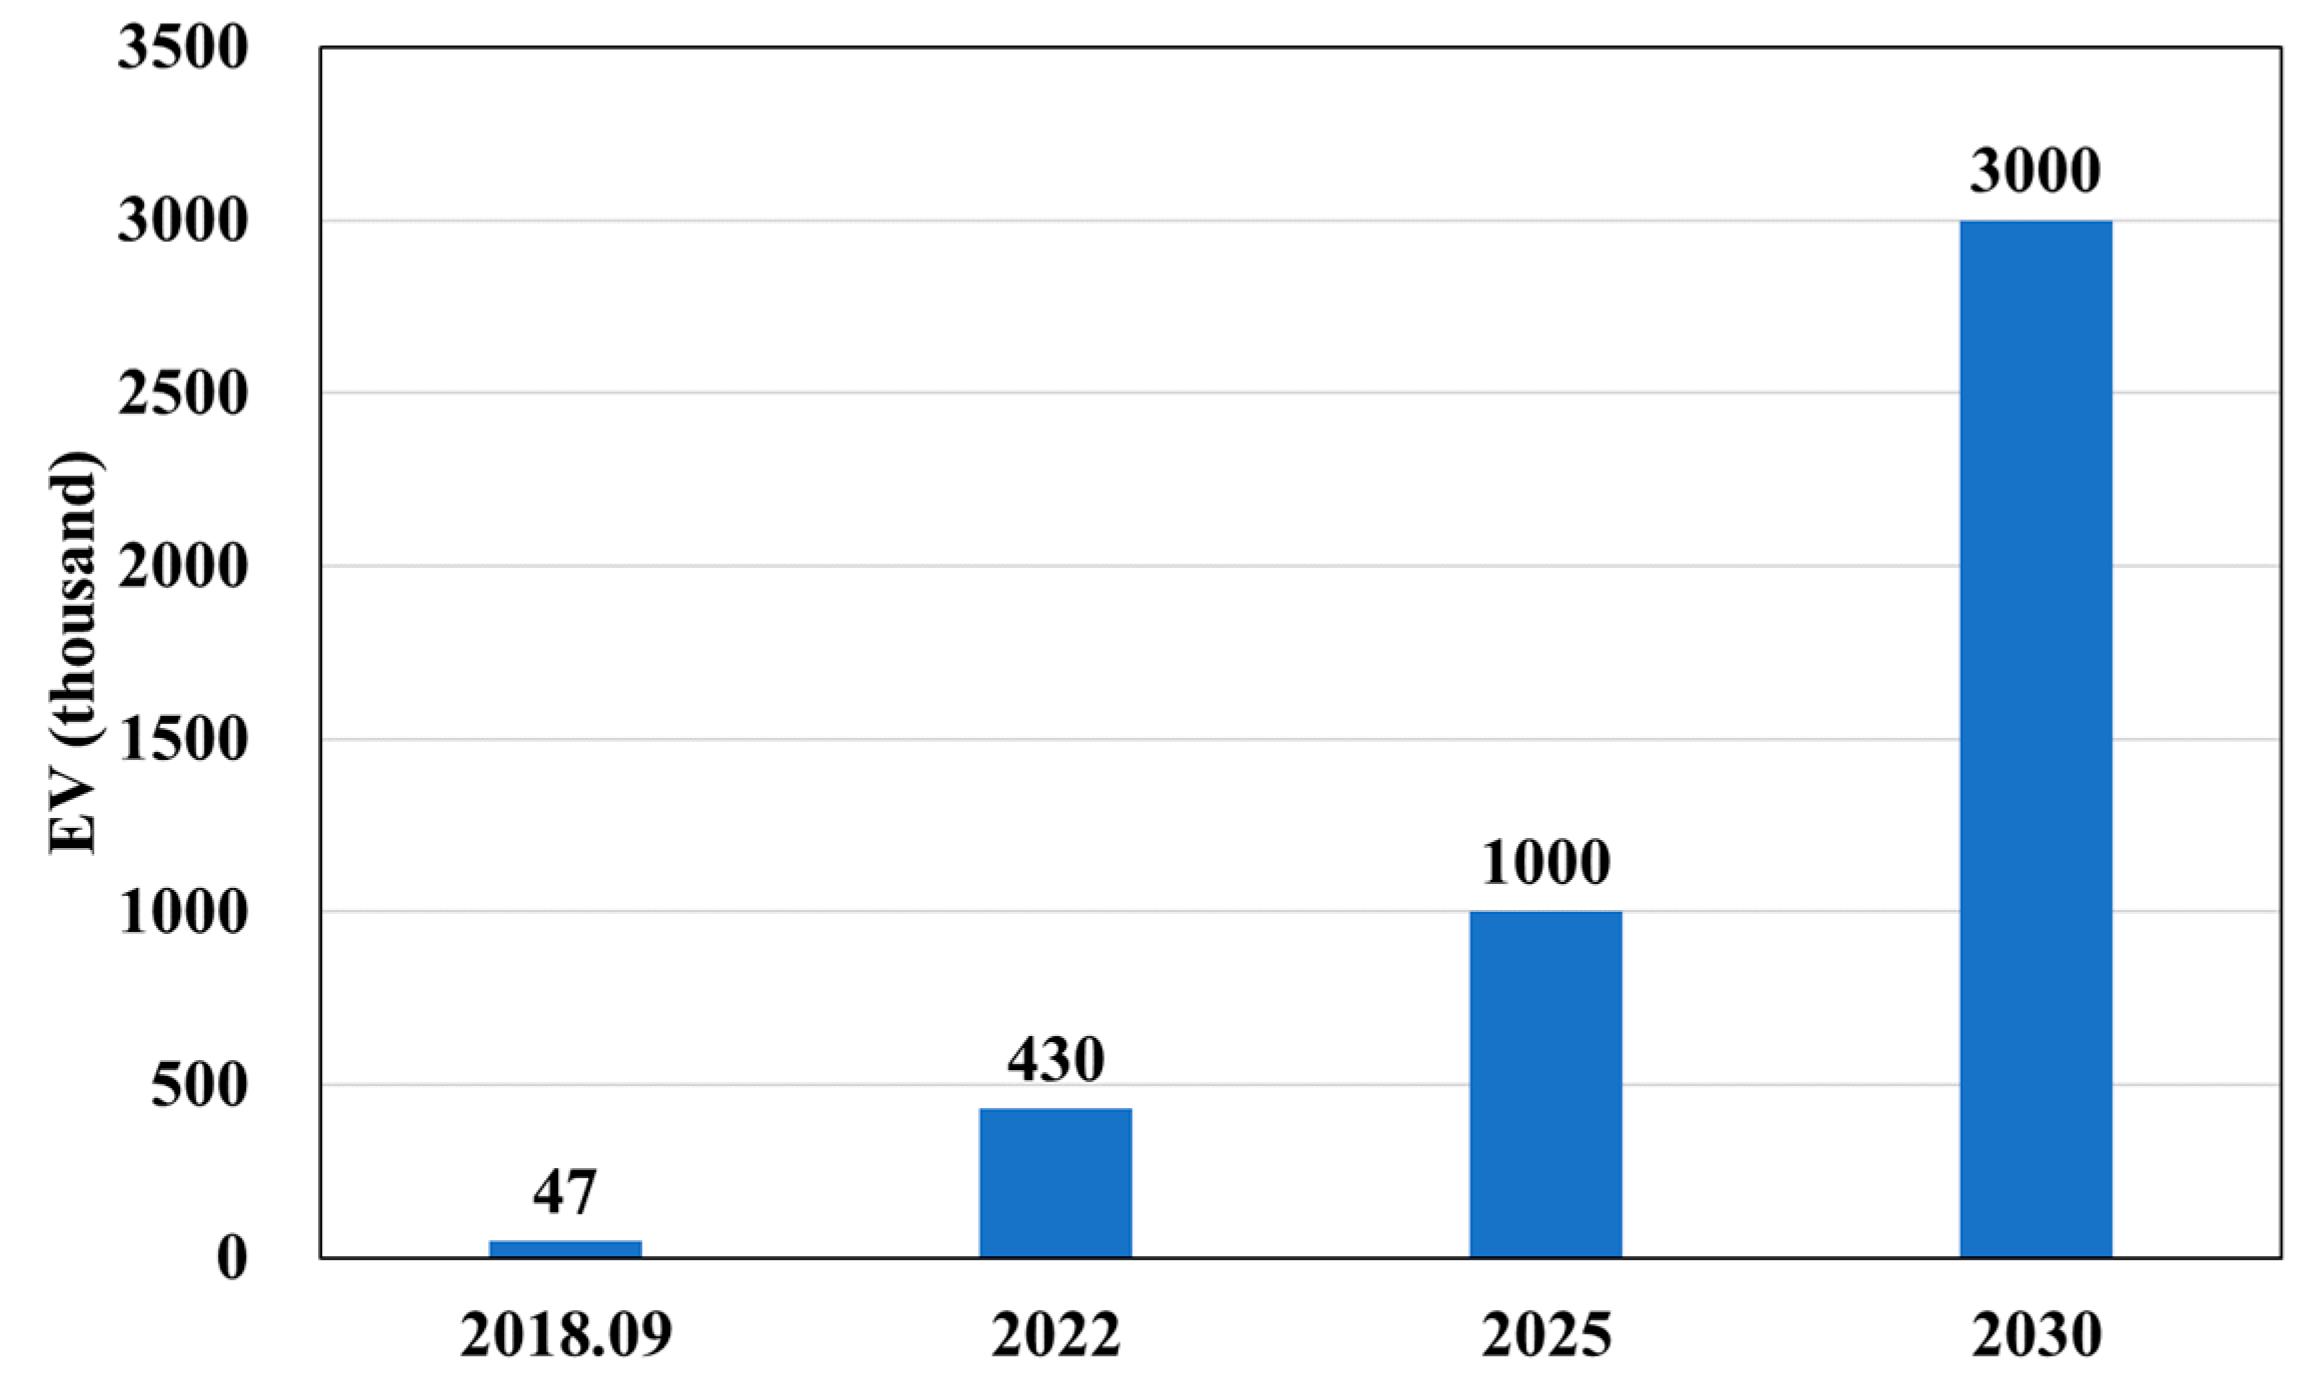
2. Penetration Trend and Charging Demand of EVs in Korea

As one of the top seven countries manufacturing cars worldwide, the Korean government has introduced a policy for promoting electric vehicles by subsidizing their purchase and expanding their chargers. In this section, the necessity of modelling the charging demand of PEVs is discussed using the situations in Korea where detailed data is available. In 2018, more than 20,000 EVs were sold in Korea, which is equal to the total number of EVs registered in the past four years. Moreover, in 2019, the Korean government increased the supply target of the EVs to three million units by 2030 as shown in Figure 1 [16].
To reach this target, 20,000 fast chargers and 180,000 slow chargers would be installed, and the energy density of the EV battery would be improved by 30% [17]. The total number of new registrations during the first seven months of 2019 increased by 86% year-over-year to 23,379.
Additionally, the Korean government started considering the estimated charging demand of EVs in the long term plan for electricity supply and demand. From the 8th Basic Plan for Long-term Electricity Supply and Demand (BPLE) published in 2017, the charging demand of EVs was estimated by the supply target of the government. Its impact on electricity supply and demand was analyzed for future power systems as summarized in Table 1 [18].
However, because the charging demand of EVs in the 8th BPLE was estimated using the existing charging patterns accumulated in Jeju Island in Korea or California in USA where EVs are deployed, those results could not represent the characteristics of EV charging demands in the future Korean power system. Therefore, for consideration in the transmission system planning process of electric utilities, it is necessary to develop a systematic method for estimating the charging demand of EVs for the long term electricity supply and demand plan.

3. Stochastic Modeling for PEV Charging Demand

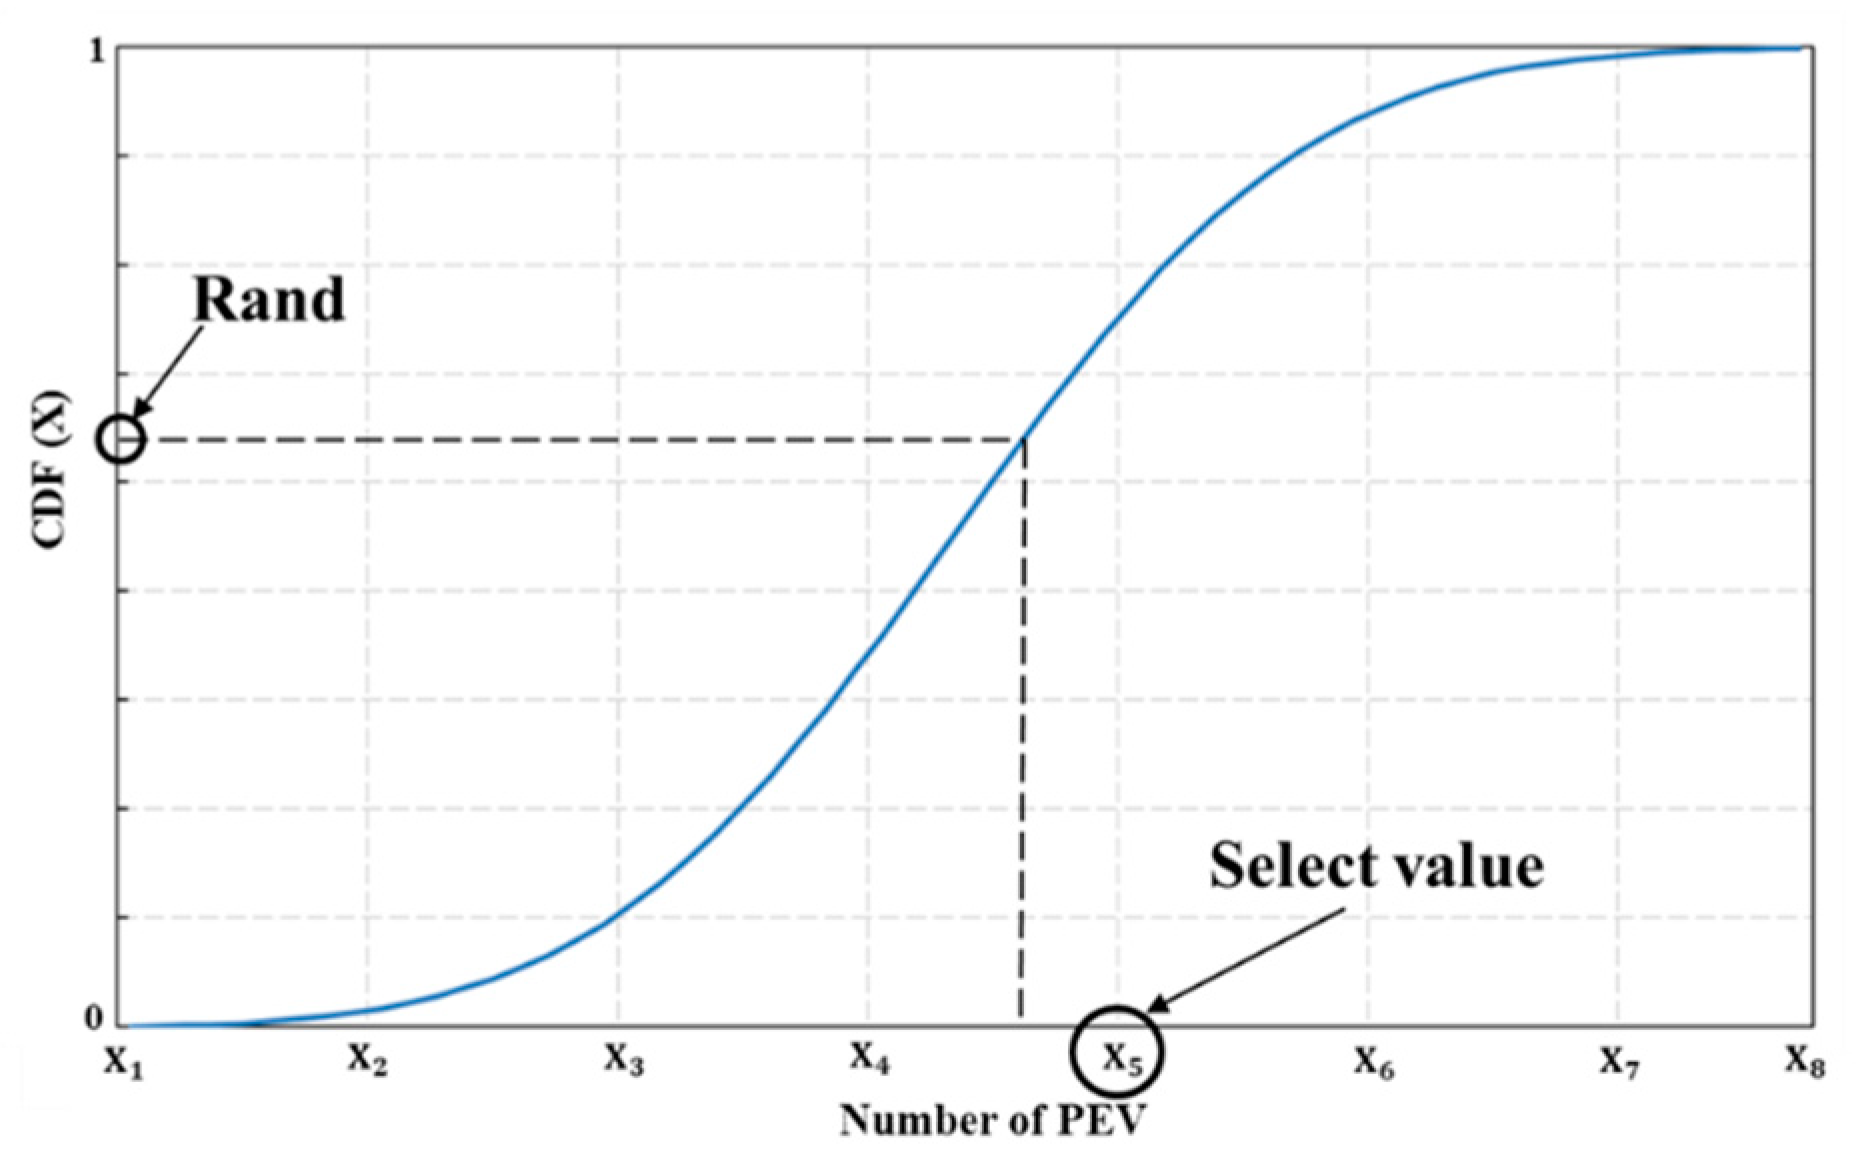
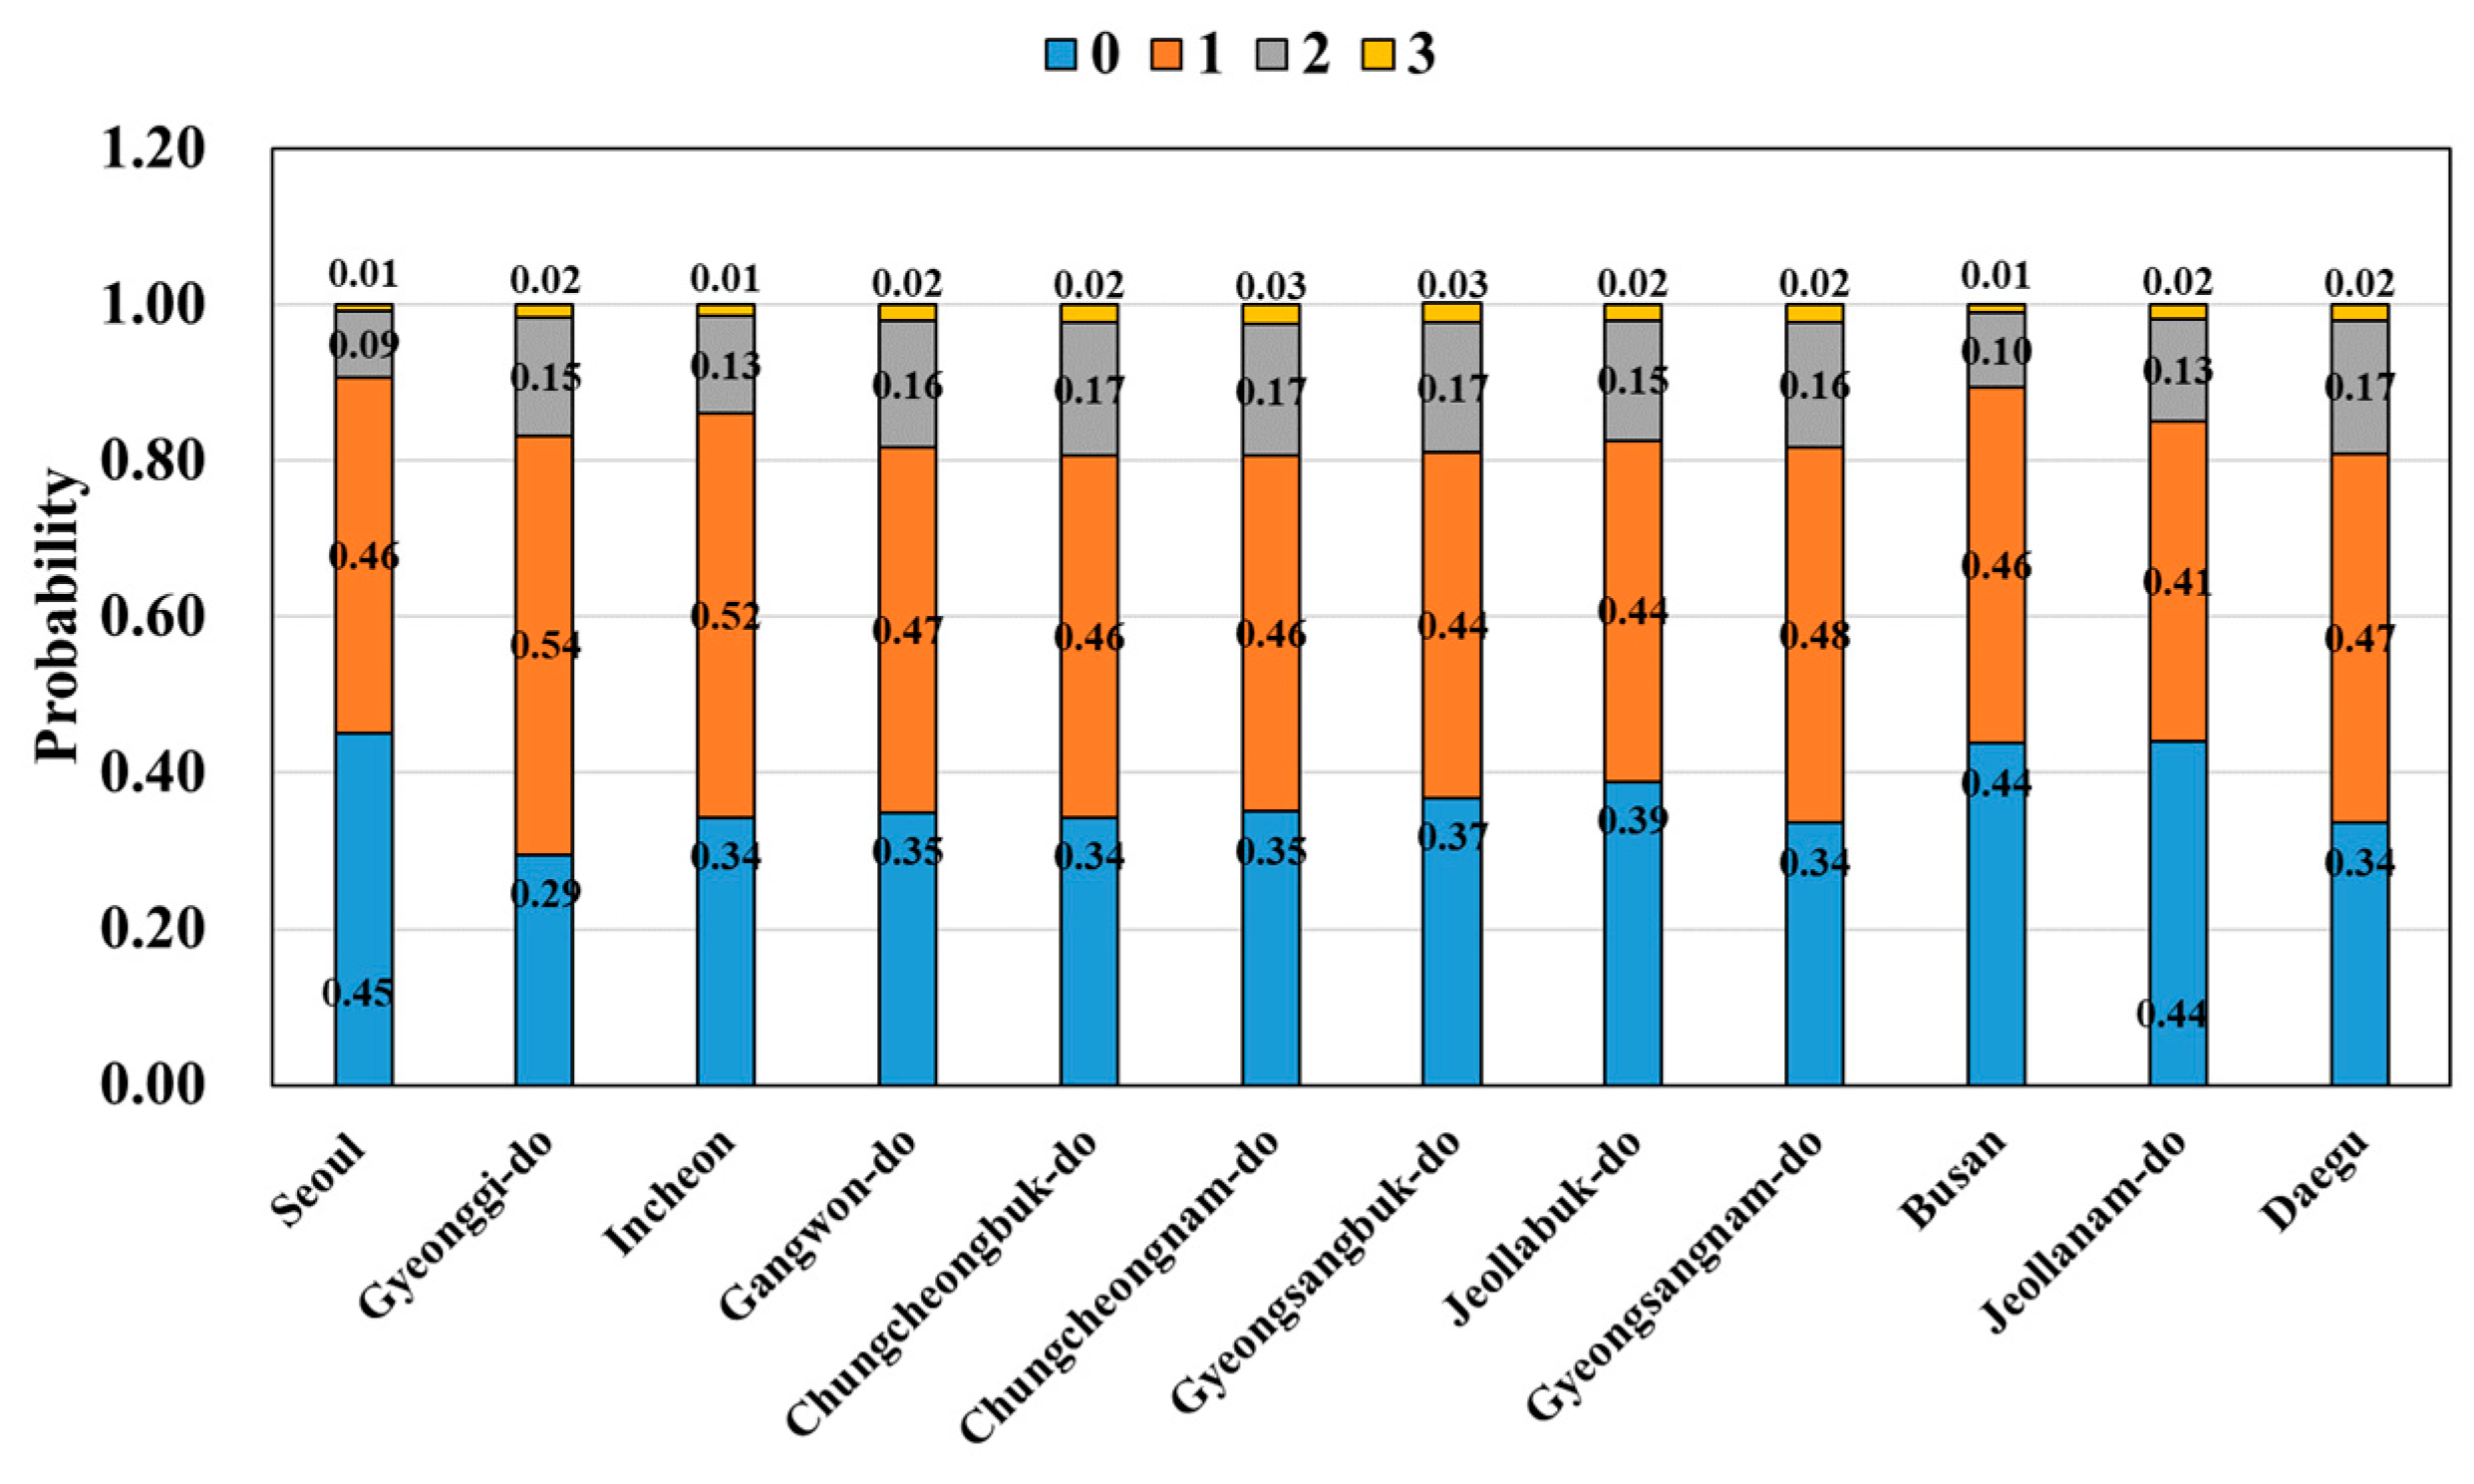
3.1. Distribution of PEVs

The first step in modeling the charging demand of PEVs is modeling their number and location. In the transmission system planning process, all electric loads are modeled at every 154 kV substation; therefore, the number of PEVs at each 154 kV substation where the PEVs are charged is enough to represent those electrical locations. The number of PEVs at each 154 kV substation can be stochastically estimated based on the number of customers whose electricity is supplied from those substations, which is usually managed by power utilities. Therefore, in the proposed stochastic method, the number of PEVs is respectively derived for all the customers receiving electricity from the same substation using the statistics of ICE vehicles. The summation is the total number of PEVs at the substation. By repeating the above process for all substations of the given power system, the PEV distribution can be modeled for a given penetration level of PEVs [19]. The penetration level of PEVs is technically defined per Equation (1):
p =   Number   of   PEVs Total   number   of   registered   vehicles
Because the number of PEVs may depend on the number of vehicles belonging to a household, the probability of the number of PEVs (n) among registered vehicles (N) in any household can be calculated using binominal distribution for a given penetration level of PEVs as represented by Equation (2):
P B ( n / N ) = ( N n ) P n ( 1 P ) N n ,   n = 0 ,   1 ,   ,   N ,
where the number of registered vehicles per household is considered only up to three since the cases when a household has more than four cars are very rare in Korea. Also, P B ( n / N ) is zero when n is larger than N since the PEV is also one of the registered vehicles at the household. Therefore, the probability that a household has n PEVs can be calculated by adding the expected number of PEVs for a given number of registered vehicles from 0 to N as represented by Equation (3):
P P E V ( n ) = i = 0 N { P v e h ( i ) × P B ( n / i ) } ,
where P v e h ( i ) is the probability of the number of registered vehicles in a household provided by the existing statistics [20]. The cumulative density function (CDF) of P P E V ( n ) is then used to determine the number of PEVs in each household by finding the corresponding number of PEVs to the randomly generated value (Rand) between 0 and 1 in the probability of the CDF as shown in Figure 2.
The process above is applied for all households to derive the number of PEVs in each. Figure 3 shows the overall procedure for stochastically modeling the PEV distribution over the 154 kV substations.

3.2. Charging Demand of PEVs

Because the drivers would like to fully charge the PEV battery before their next trip, the charging demand of a PEV is determined by the driven mileage before it is plugged in. Therefore, in the proposed method, the daily driving distance of an individual PEV is stochastically modeled using related statistics of ICE vehicles referred to in existing statistics. The CDF and PDF of the driving distance are derived from the statistics of ICE vehicles, and the daily driving distance of an individual PEV is modeled by finding the corresponding driven mileage to the randomly generated value (Rand) between 0 and 1 in the probability of the CDF as shown in Figure 4.
After the daily driving distance d of the PEV is determined, the initial SoC of the PEV when it is plugged-in can be calculated using Equation (4):
S o C i n i = 1 d d m a x ,
where d m a x is the maximum driven distance considering the energy capacity of the PEV battery. The electricity demand for fully charging the PEV can be calculated from the initial SoC as Equation (5):
E d e m a n d = E c a p × ( 1 S o C i n i ) ,
where E c a p is the energy capacity of the PEV battery. Finally, considering the charging efficiency of the PEV charger, the total charging demand of the PEV to the power system is calculated by Equation (6):
E g r i d = E d e m a n d η c h a r g e r ,
where E g r i d is the charging demand and η c h a r g e r is the charging efficiency of the charger.

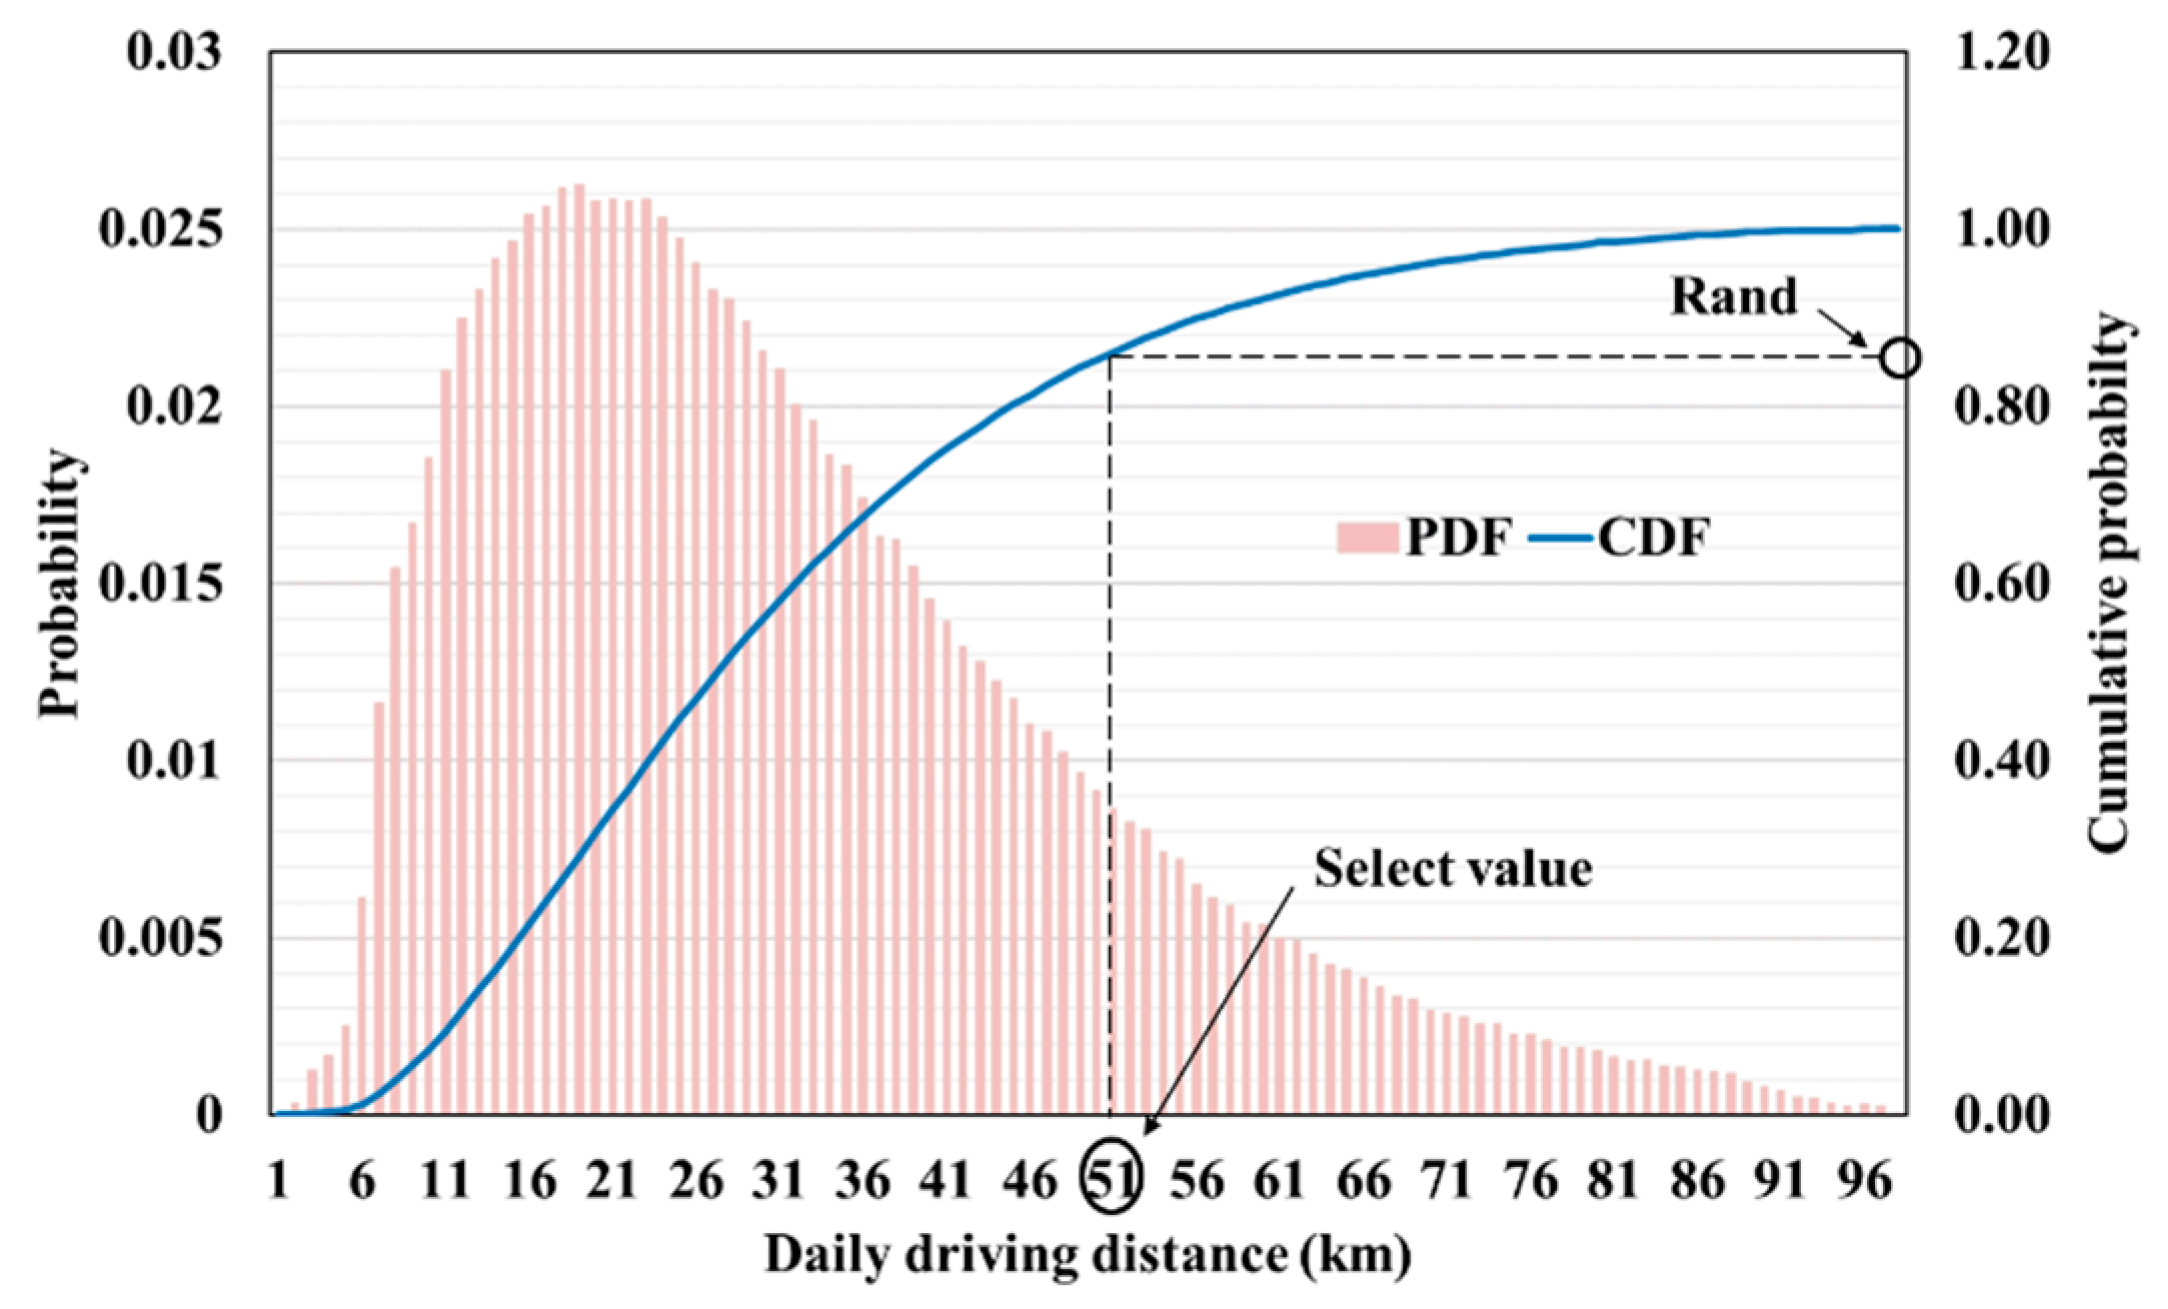
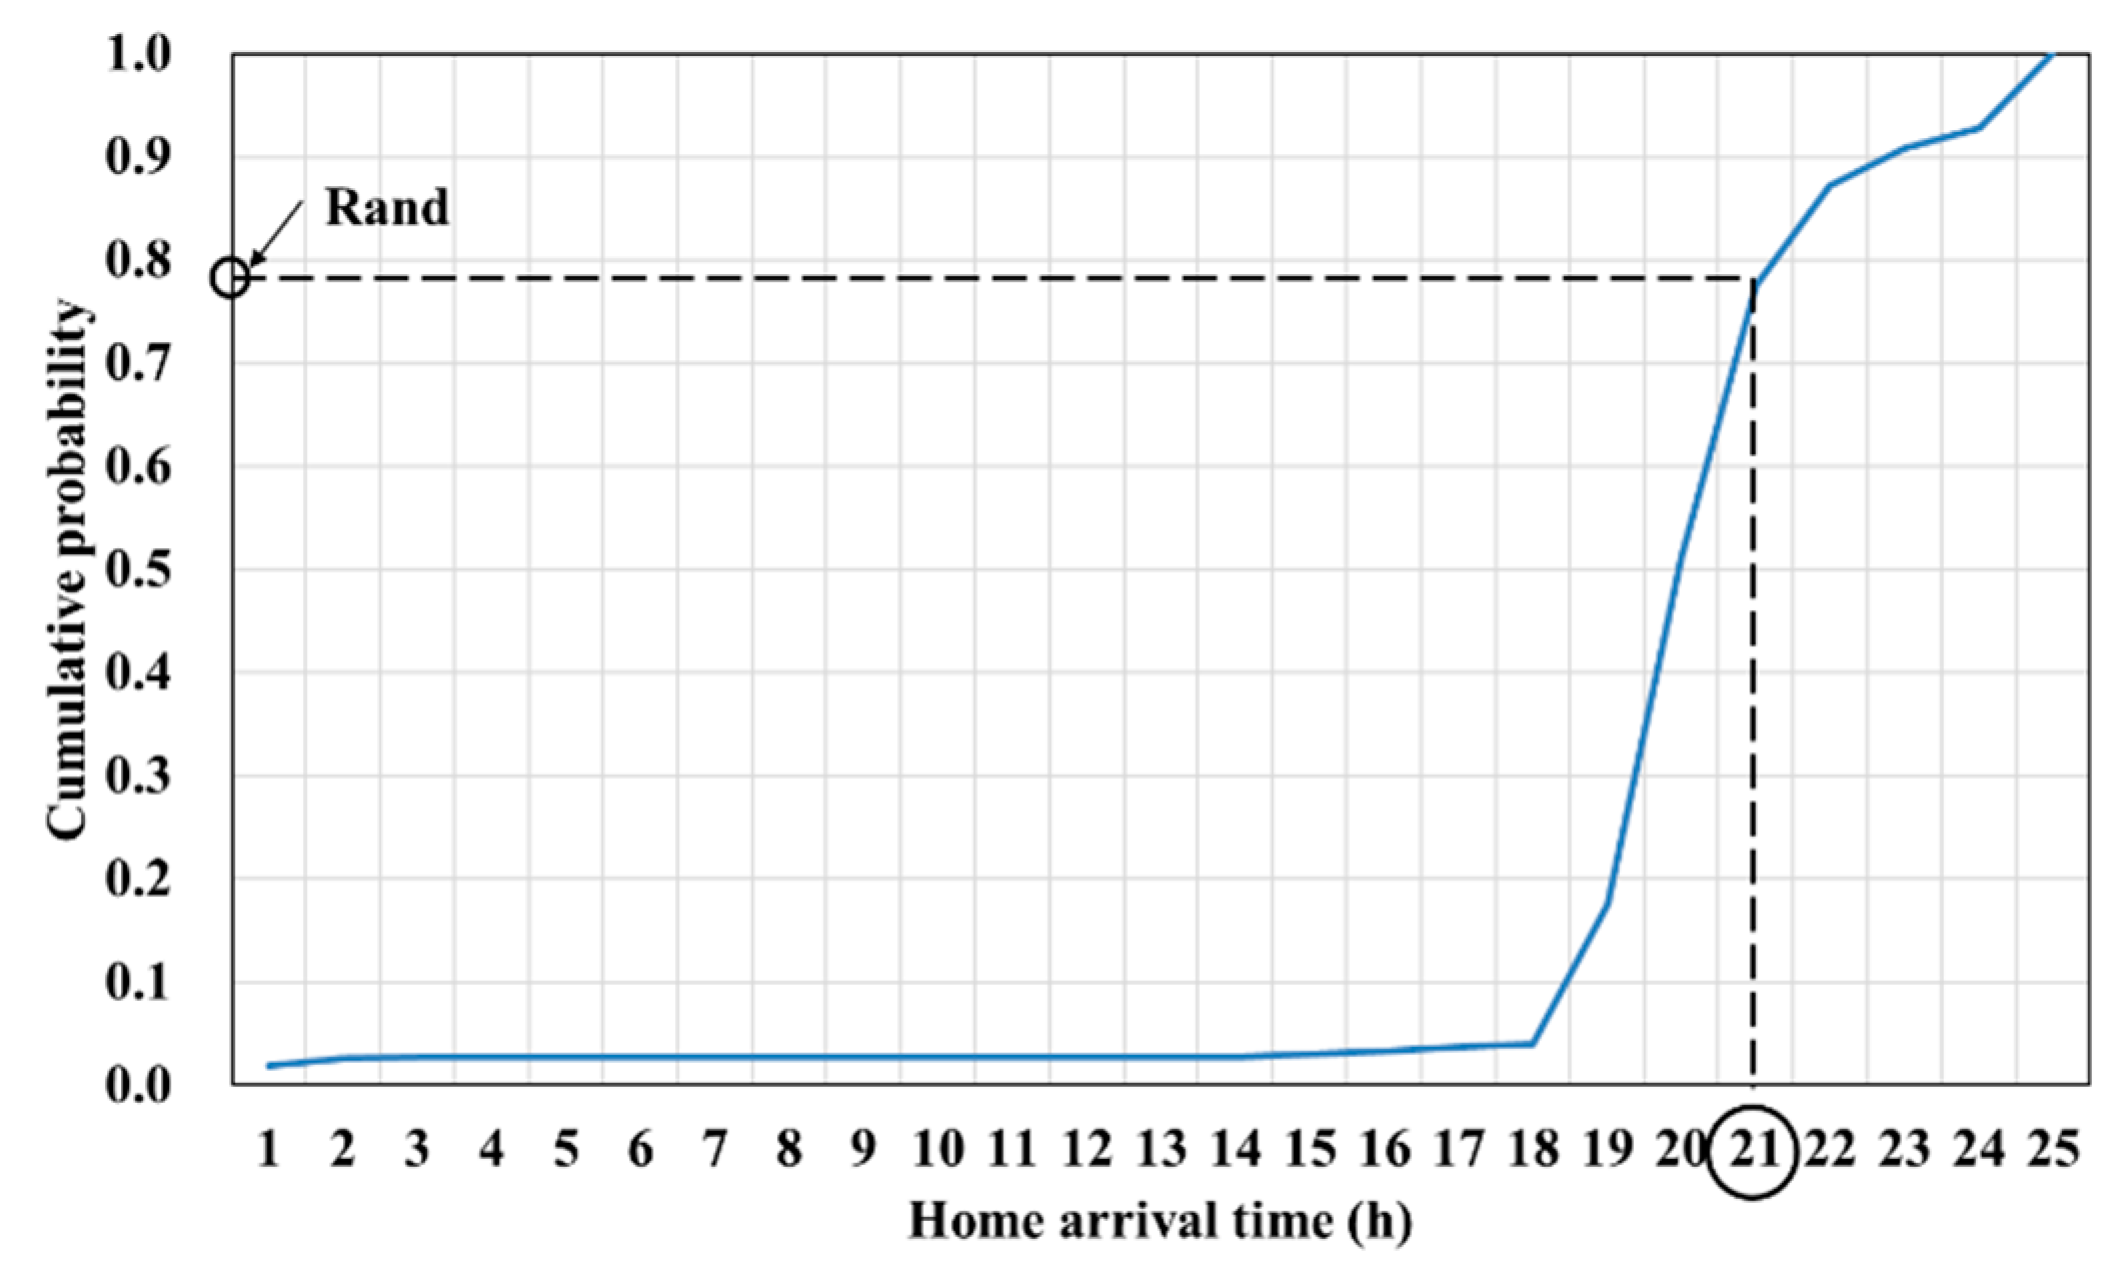
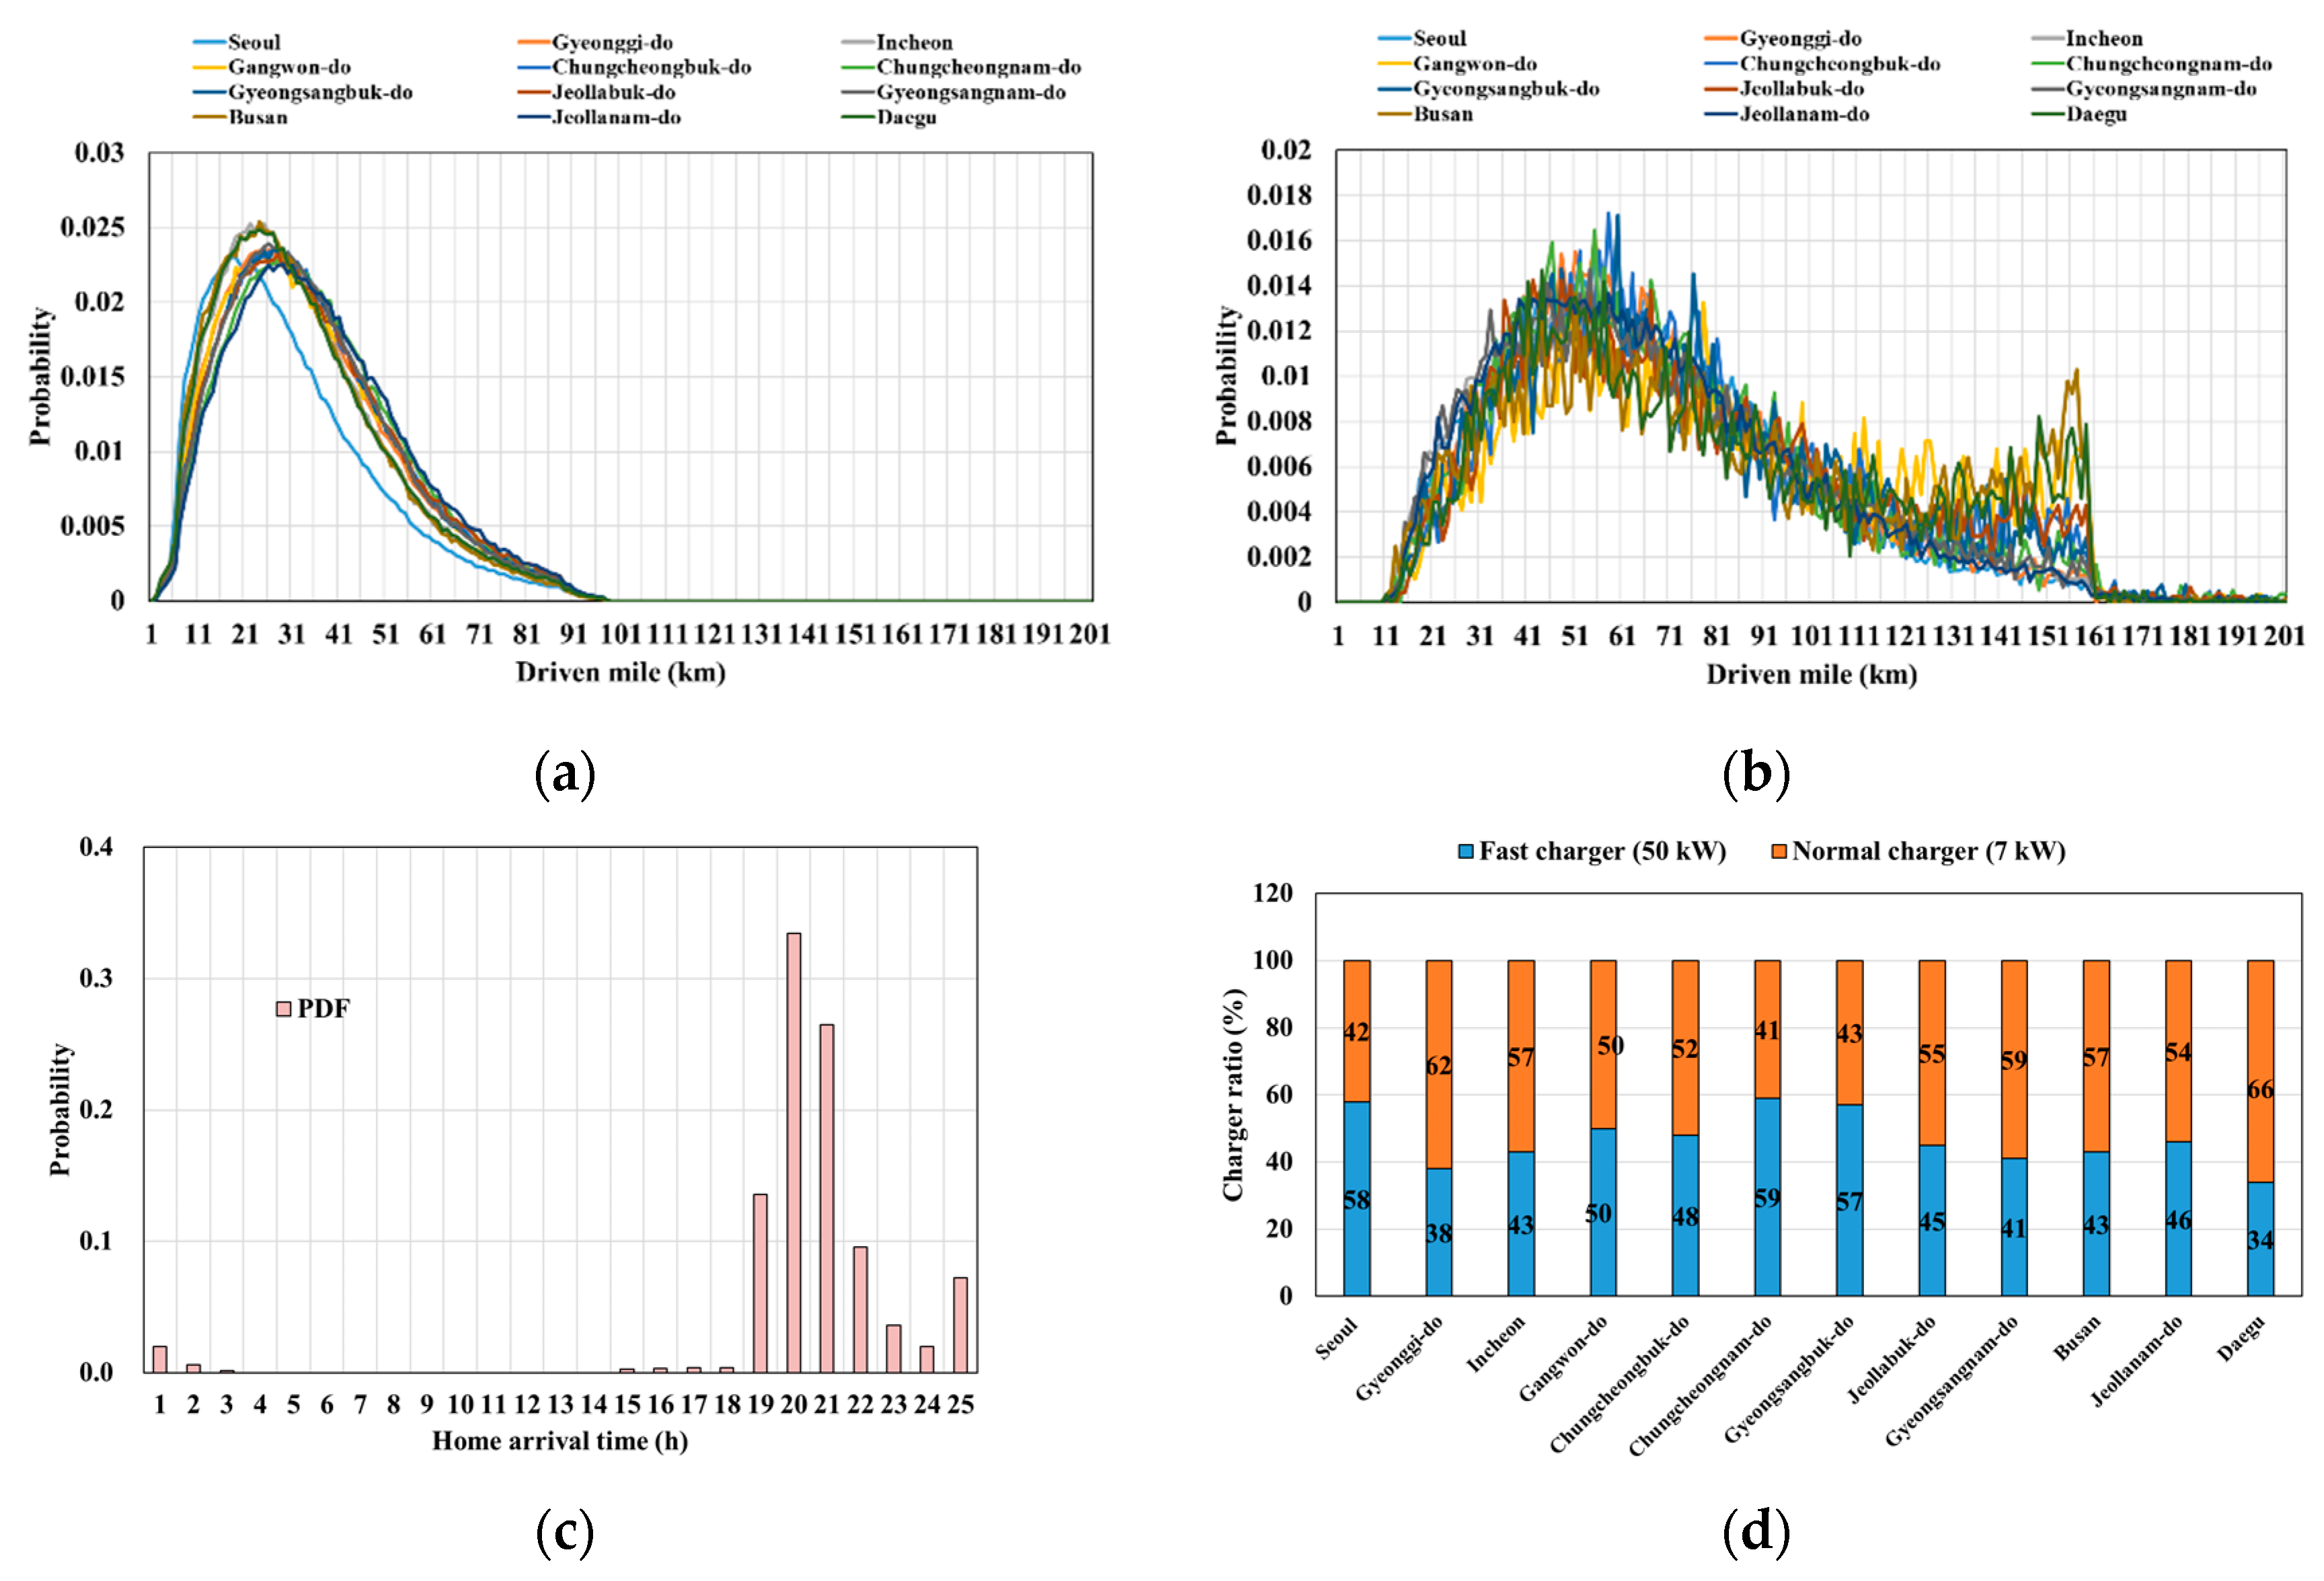
3.3. Charging Profile of PEV

The charging profile of PEVs includes the charging power supplied by the power system and its duration time. In this section, it is assumed that the PEV is plugged-in immediately after getting home to start charging its battery until it is fully charged with the rated power of its charger. Therefore, the charging duration of the PEV starts at the home arrival time and can be stochastically determined based on the related existing statistics of ICE vehicles as shown in Figure 5.
As shown in Figure 5, the CDF of the home arrival time derived from the statistics of ICE vehicles is used to stochastically model the plug-in time of PEVs. The charging duration time ( t d ) can then be calculated by dividing the charging demand with the rating of the charger and its efficiency as represented in Equation (7):
t d = E d e m a n d P c h a r g e r × η c h a r g e r ,
where P c h a r g e r denotes the power rating of the charger. Further, in this study, the charging profile is modeled in 1-h intervals, and the charging power is assumed to be the hourly averaged power during any interval when it is not necessary to supply the rating power for fully charging the PEV. Concerning the rating of the charger, a specific type of charger is stochastically assumed for each PEV using a variety of chargers and their penetration in Korea. In this study, it is assumed that the chargers used to charge the existing EVs are still used for PEVs and those specifications are referred from commercially available EV chargers. The following Table 2 shows the specifications of the installed chargers considered in this study [21,22,23].
By repeating the modeling procedure for deriving the daily charging profile of PEVs for 365 days, the yearly charging profile of each PEV can be derived in hours.

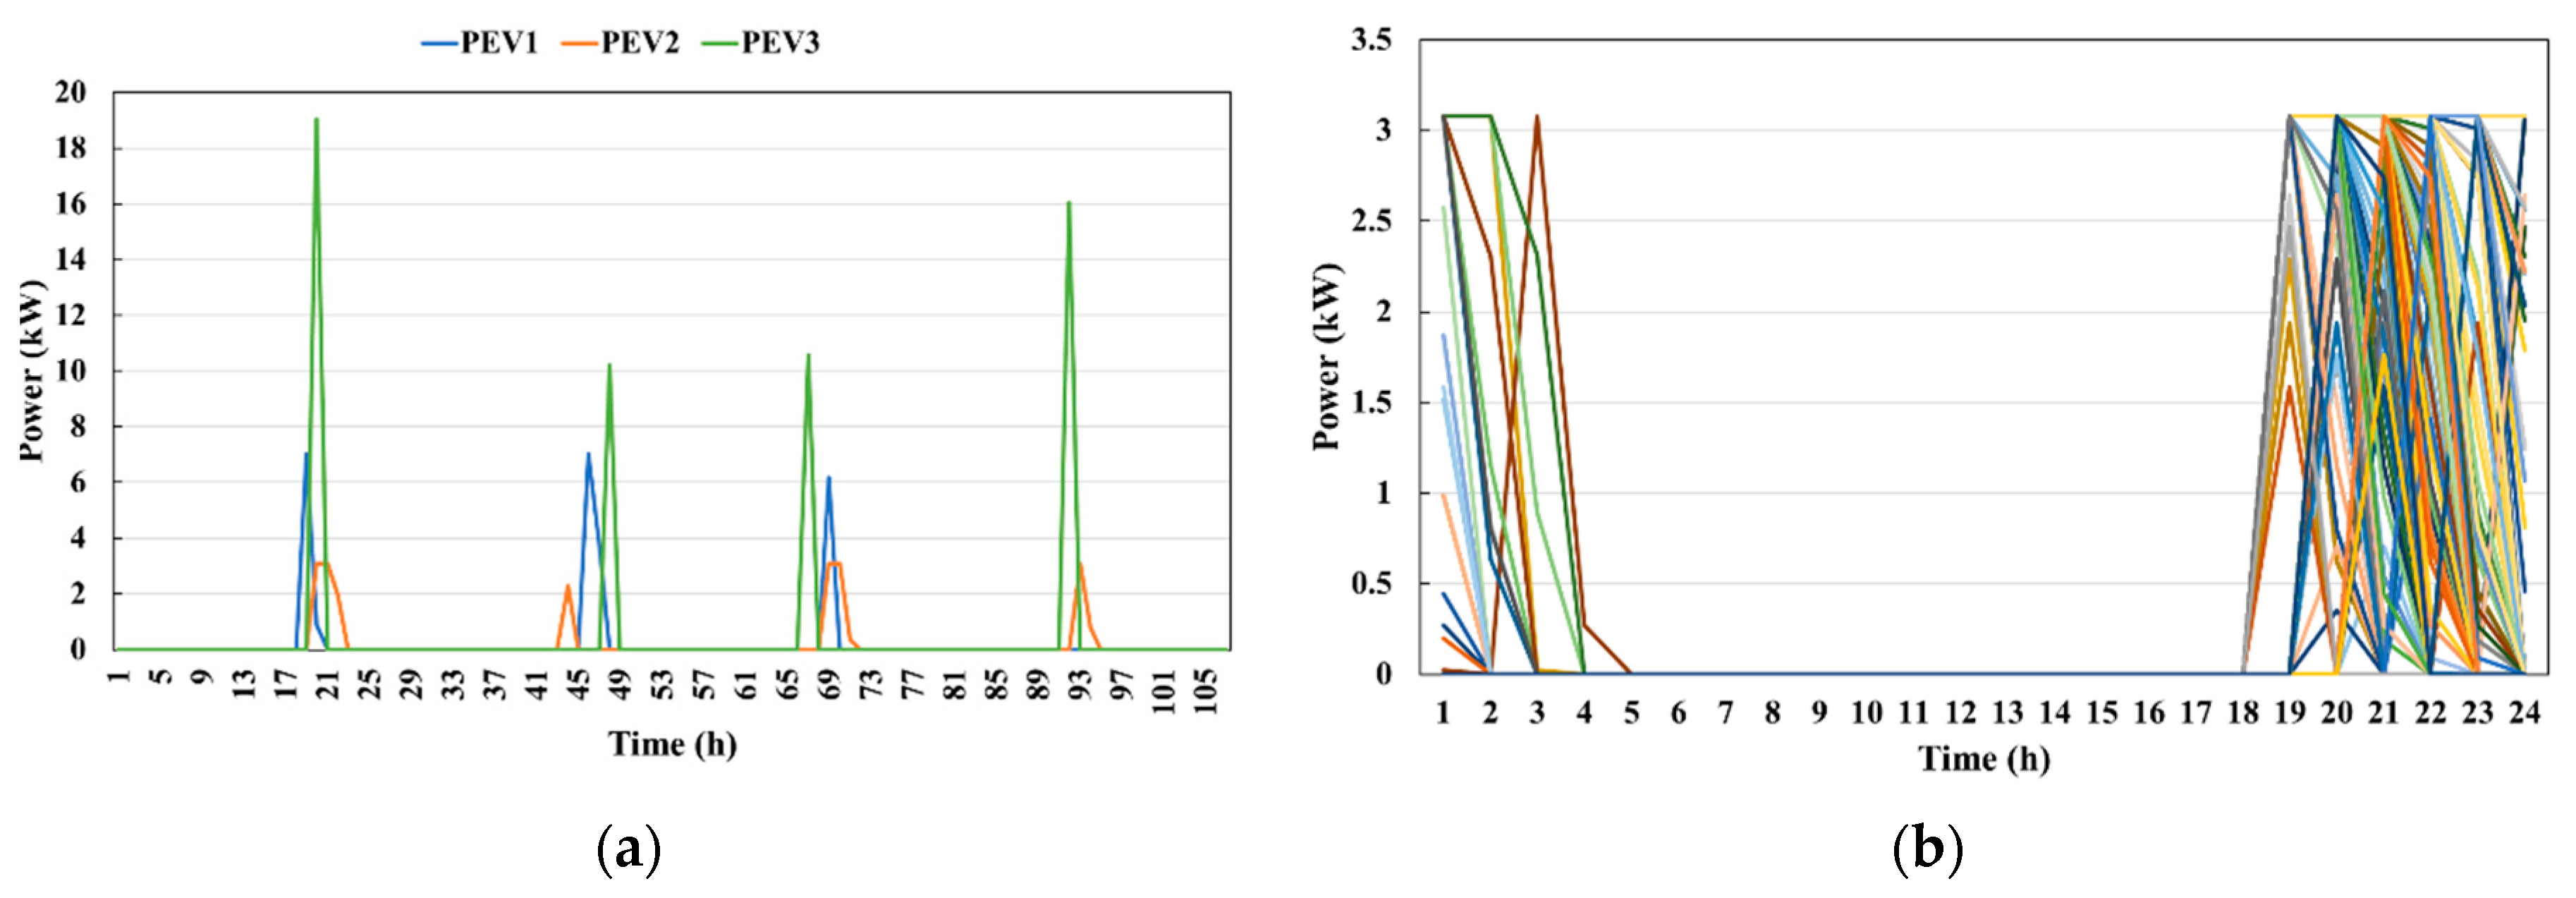
3.4. Charging Demand of PEVs per Substation

Because the feasibility of the transmission system planning process is evaluated by considering the estimated loads at the substations where the transmission lines are connected, the charging demand of PEVs needs to be modeled as loads at the substations where the charging powers are supplied. In the proposed method, the charging profiles of the PEVs supplied from the same substations are aggregated as one profile, and this process is repeated for all the substations. The yearly charging profile of m PEVs at the substation can be calculated as Equation (8):
P s ( t ) = j = 1 m P p e v , j ( t ) t = 1 , 2 , ,   8760 ,
where P p e v denotes the charging demand of an individual PEV at hour t, and P s is the aggregated charging profile at the substation.
Based on the total charging profile of the PEVs over the substations, their total charging demand can be determined as the value at the time when the feasibility of the transmission system is analyzed with assumed conditions for the load and renewable energy resources in the planning process as represented by the Equation (9):
P s = P s ( t * )
where t* denotes the time assumed for the planning process of the transmission system.
Figure 6 shows an overview of the process of modeling the PEV charging demand from the charging profiles of the PEVs at the substations reflected in the transmission system planning.

4. Case Study

In this study, the effectiveness of the proposed method is verified through case studies in the Korean power system. The statistical data required to derive the PEV charging demand are based on the Statistics Korea published by KOSTAT; the existing PEV statistics are assumed to continue for a while in Korea. Additionally, the penetration level of the PEVs is assumed based on the national EV target and another scenario is assumed with the increase of the number of PEVs based on the aggressive policy of the Korean government.

4.1. Distribution of PEVs in Korean Power System

In Korea, the 154 kV substations are the basis for modeling the loads and transmission lines in the planning process. Therefore, the distribution of PEVs is modeled as the number of PEVs for each 154 kV substation. For the penetration level, 3 million PEVs (PEV 3m), which is approximately 11% of the total number of vehicles are assumed for the first scenario and 20% of the penetration, which represents 5 million PEVs (PEV 5m) are assumed for the second scenario considering the aggressive policy of the Korean government in this study. Additionally, the probability of the number of registered vehicles per household is obtained from the statistics published by KOSTAT as shown in Figure 7.
Based on these assumptions and the Korean data, the number of PEVs for each 154 kV substation is derived by Equation (3). The distribution modeling results are summarized as the penetration of the modeled PEVs at each 154 kV substation as shown in Figure 8.
As shown in Figure 8, although the penetration level varies by substation within a certain range, the median value is close to the assumed penetration level of the PEVs assumed in each scenario i.e., similar to 11%, and 20%, respectively. The derived total numbers of the PEVs are 2,966,572 and 5,572,378 for the first and second scenario, respectively, which are approximately 11% and 20% of the total number of vehicles in Korea.

4.2. Modeling Results of PEV Charging Demand

The statistics of the driven mileage and home arrival time of the vehicles in Korea are used to derive the energy demand and charging time of each PEV after plugging in. The charging profiles of the PEVs are modeled individually by assuming the charger ratings of each PEV. The input data related to the driving vehicles, home arrival time, and charger ratings are referred from the statistics published by Statistics Korea (KOSTA) as shown in Figure 9 [24].
Additionally, based on the specifications of the selected EVs in Korea, it is assumed that the battery capacity is 28 kWh, the maximum driving range is 200 km, and energy efficiency is 6.8 kWh/km [25].
The charging profile of each PEV is derived based on these assumptions and the Korean data, as shown in Figure 10.
From Figure 10, it can be observed that the charging profile is modeled differently for each day and PEV, because the plug-in time, charger rating, and daily driving distance were stochastically determined.
The charging profiles of the individual PEVs supplied from the same 154 kV substation are aggregated to derive the charging profile of all the PEVs at that substation. Because the peak demand of the loads is assumed to occur at 20 h in Korea, the charging demand of the PEVs at 20 h is selected from the profile for consideration in the transmission system planning process. This PEV charging demand can be added to the existing loads at the 154 kV substations for evaluating the feasibility of the planned transmission system. Figure 11 shows the total demand in descending order for each substation in the Korean power system.
It is observed that there is a correlation between the charging demand and existing loads over the substations with some degree of variation. It is also notable that the charging demand of the PEVs is high enough for consideration in the planning process of the transmission system, compared to the amount of loads due to the concentration of their charging demand.

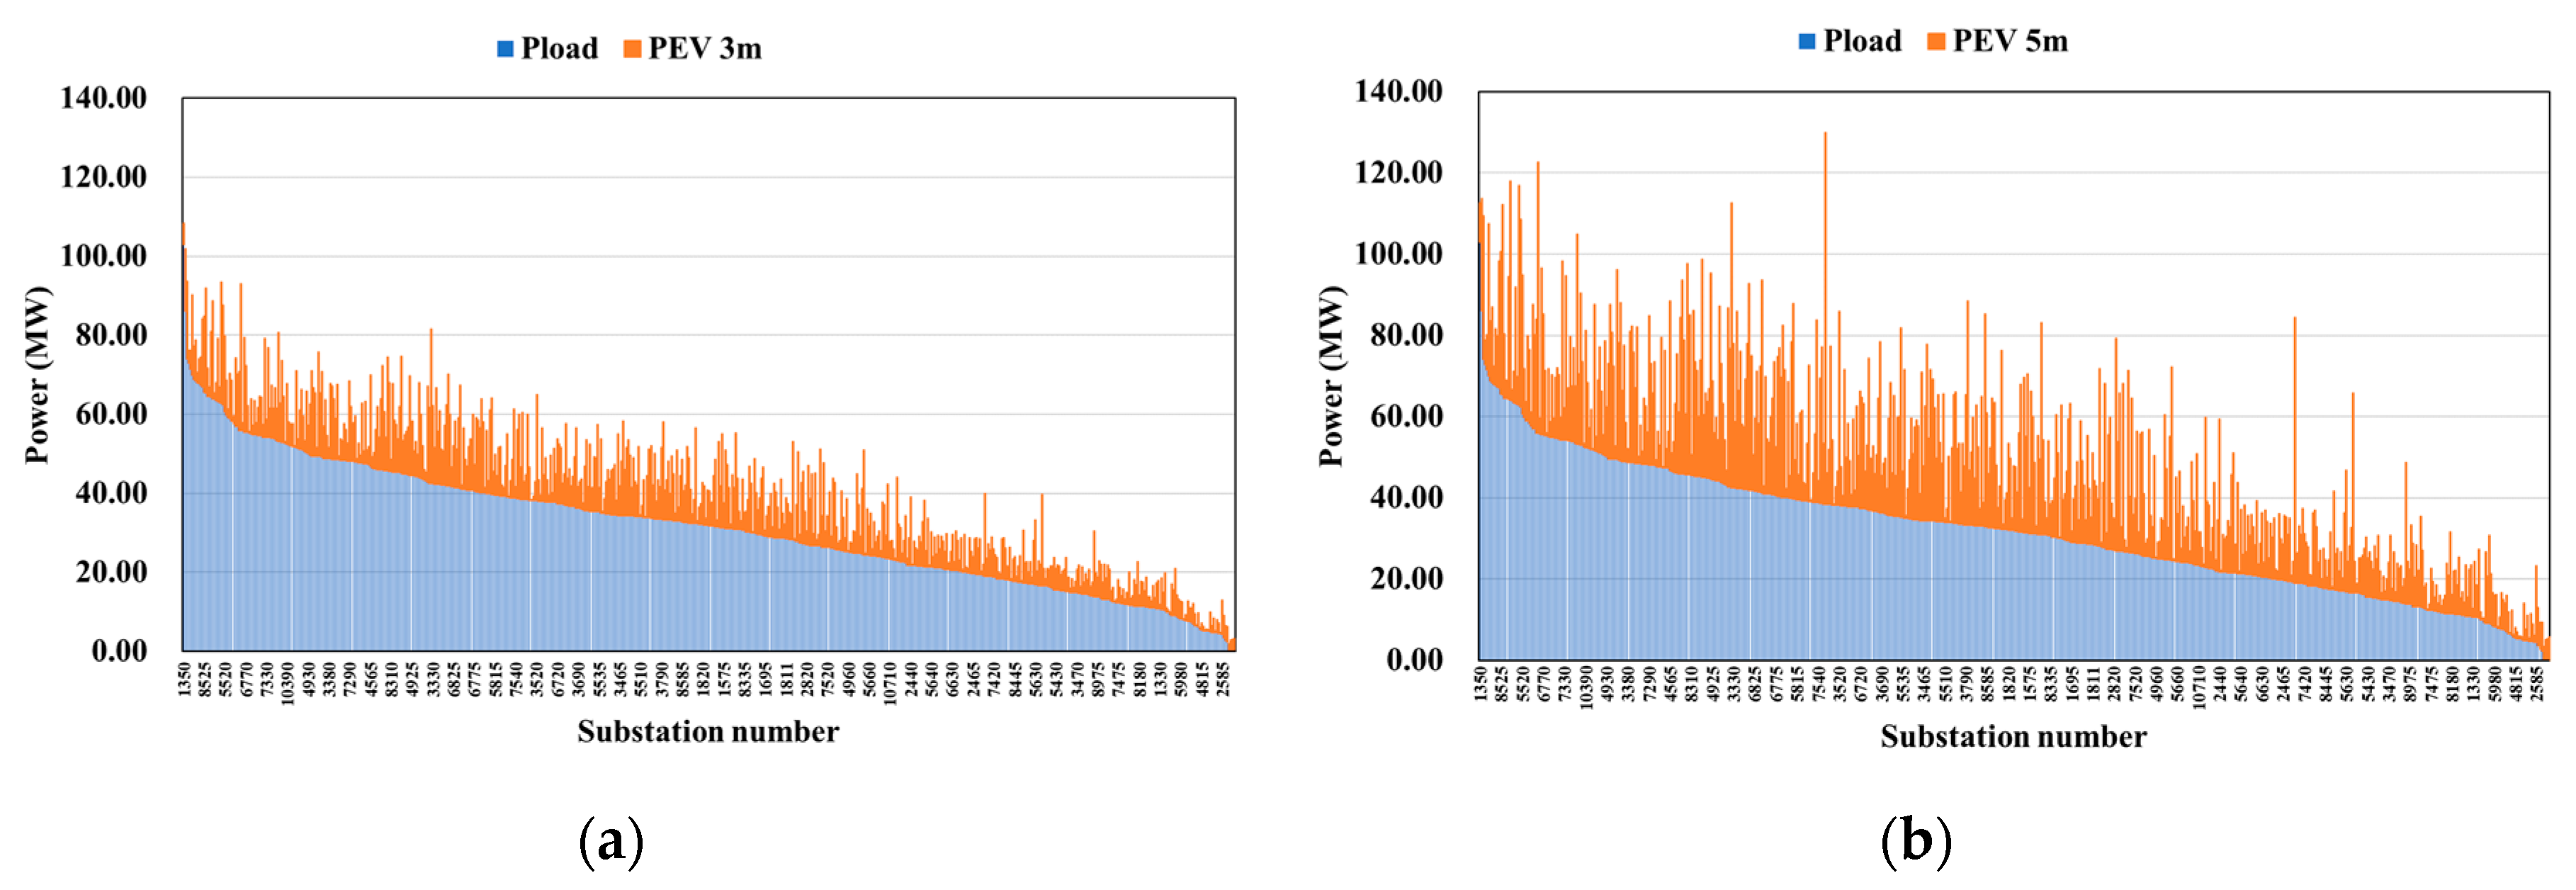
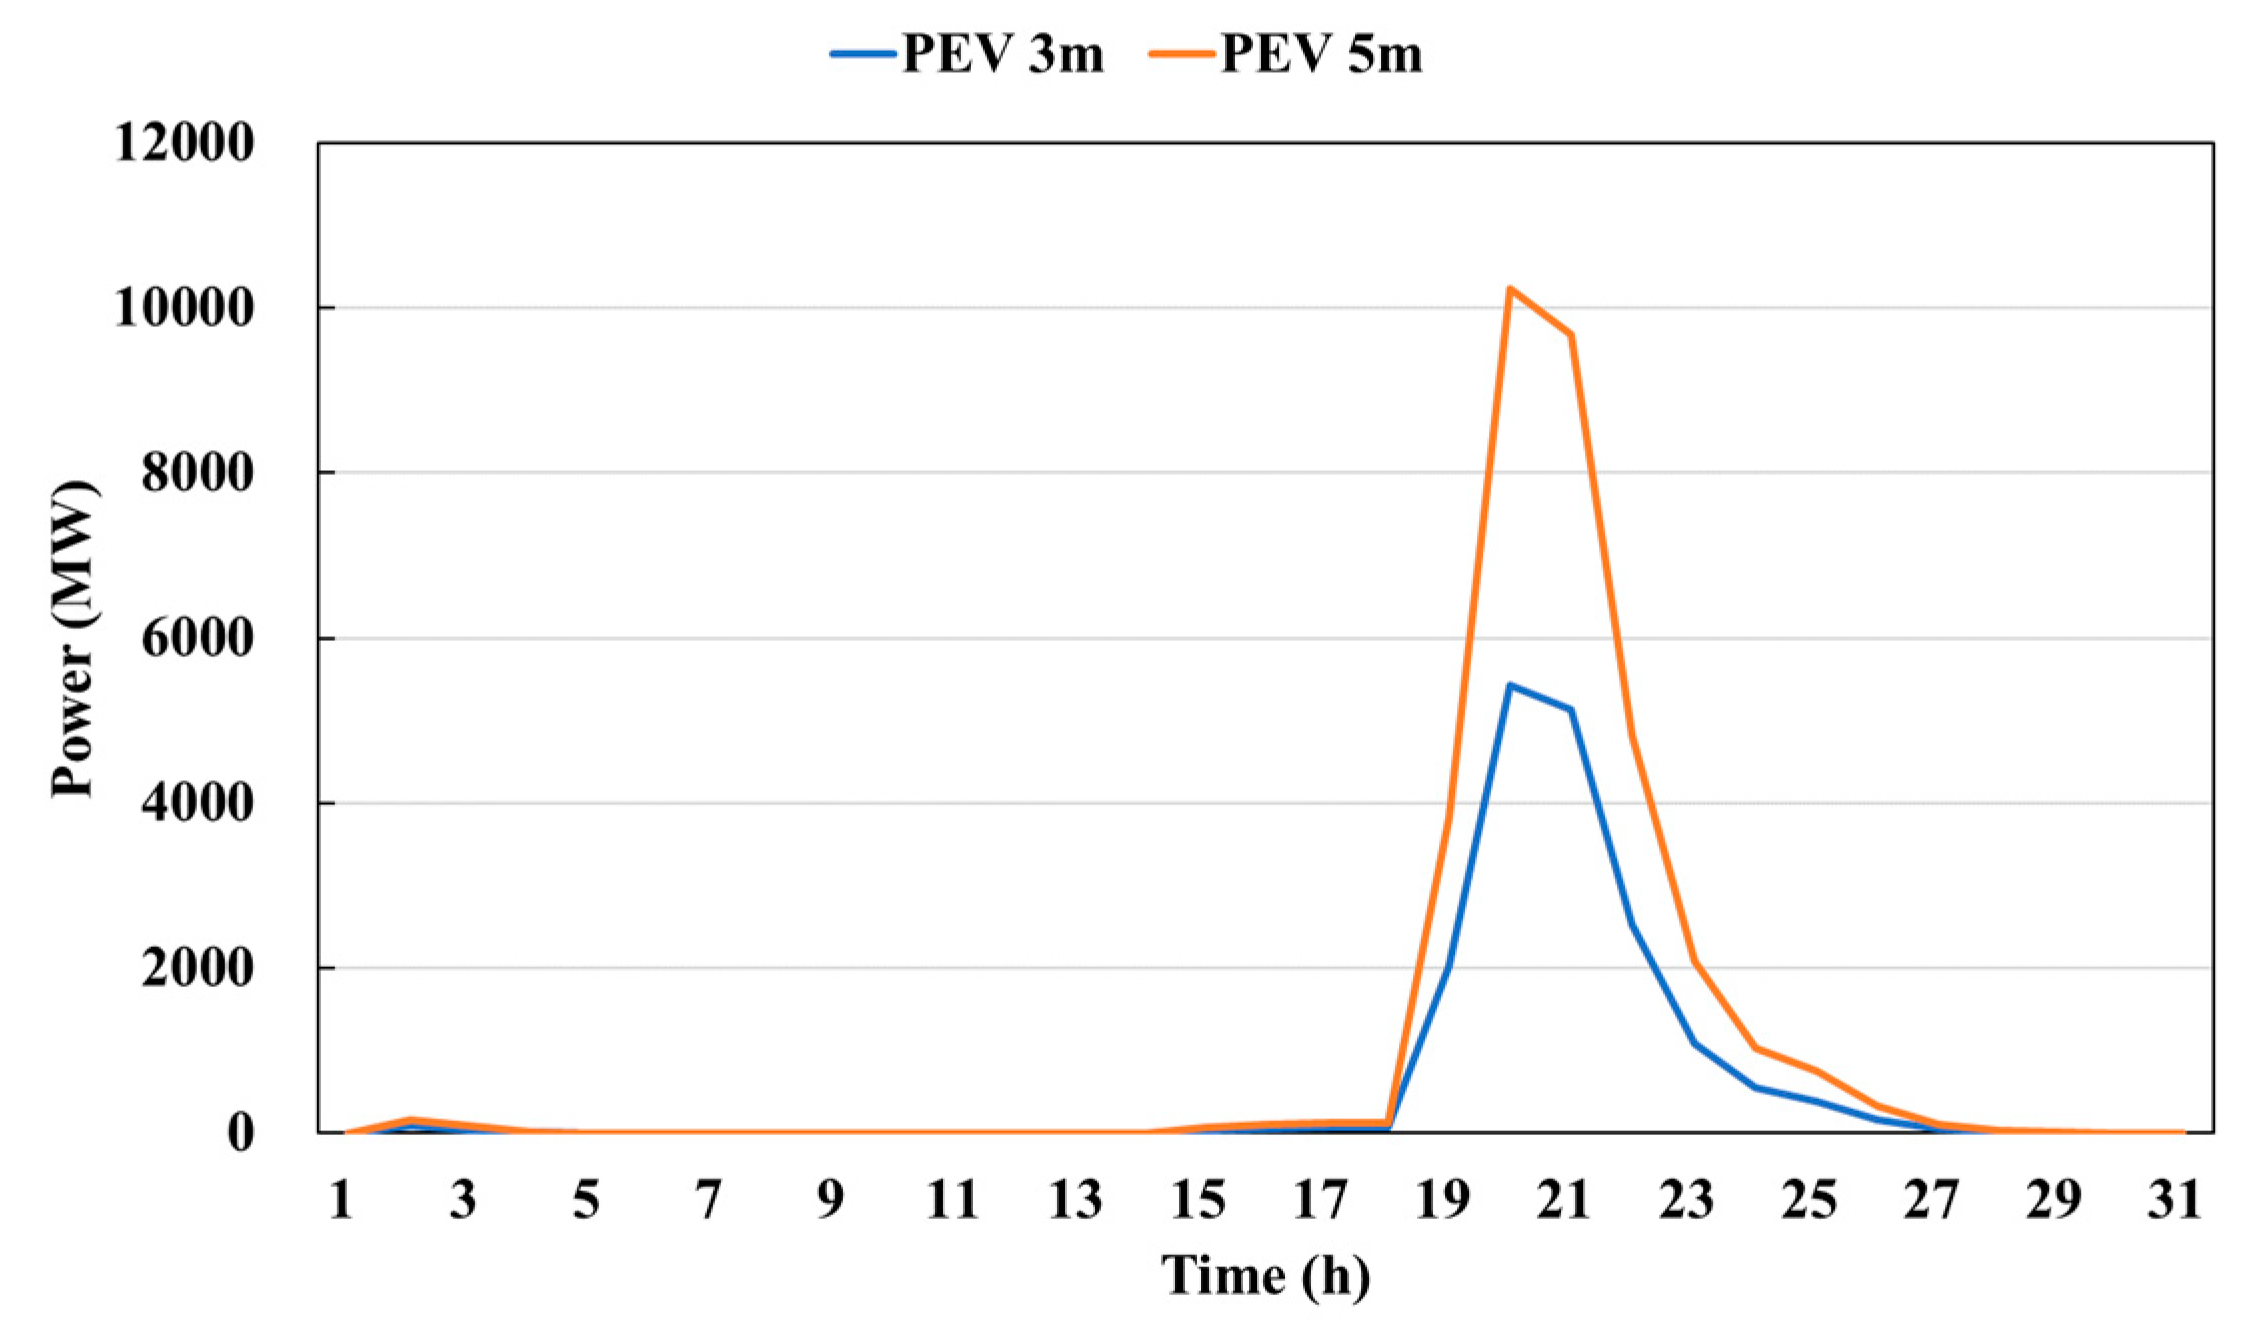
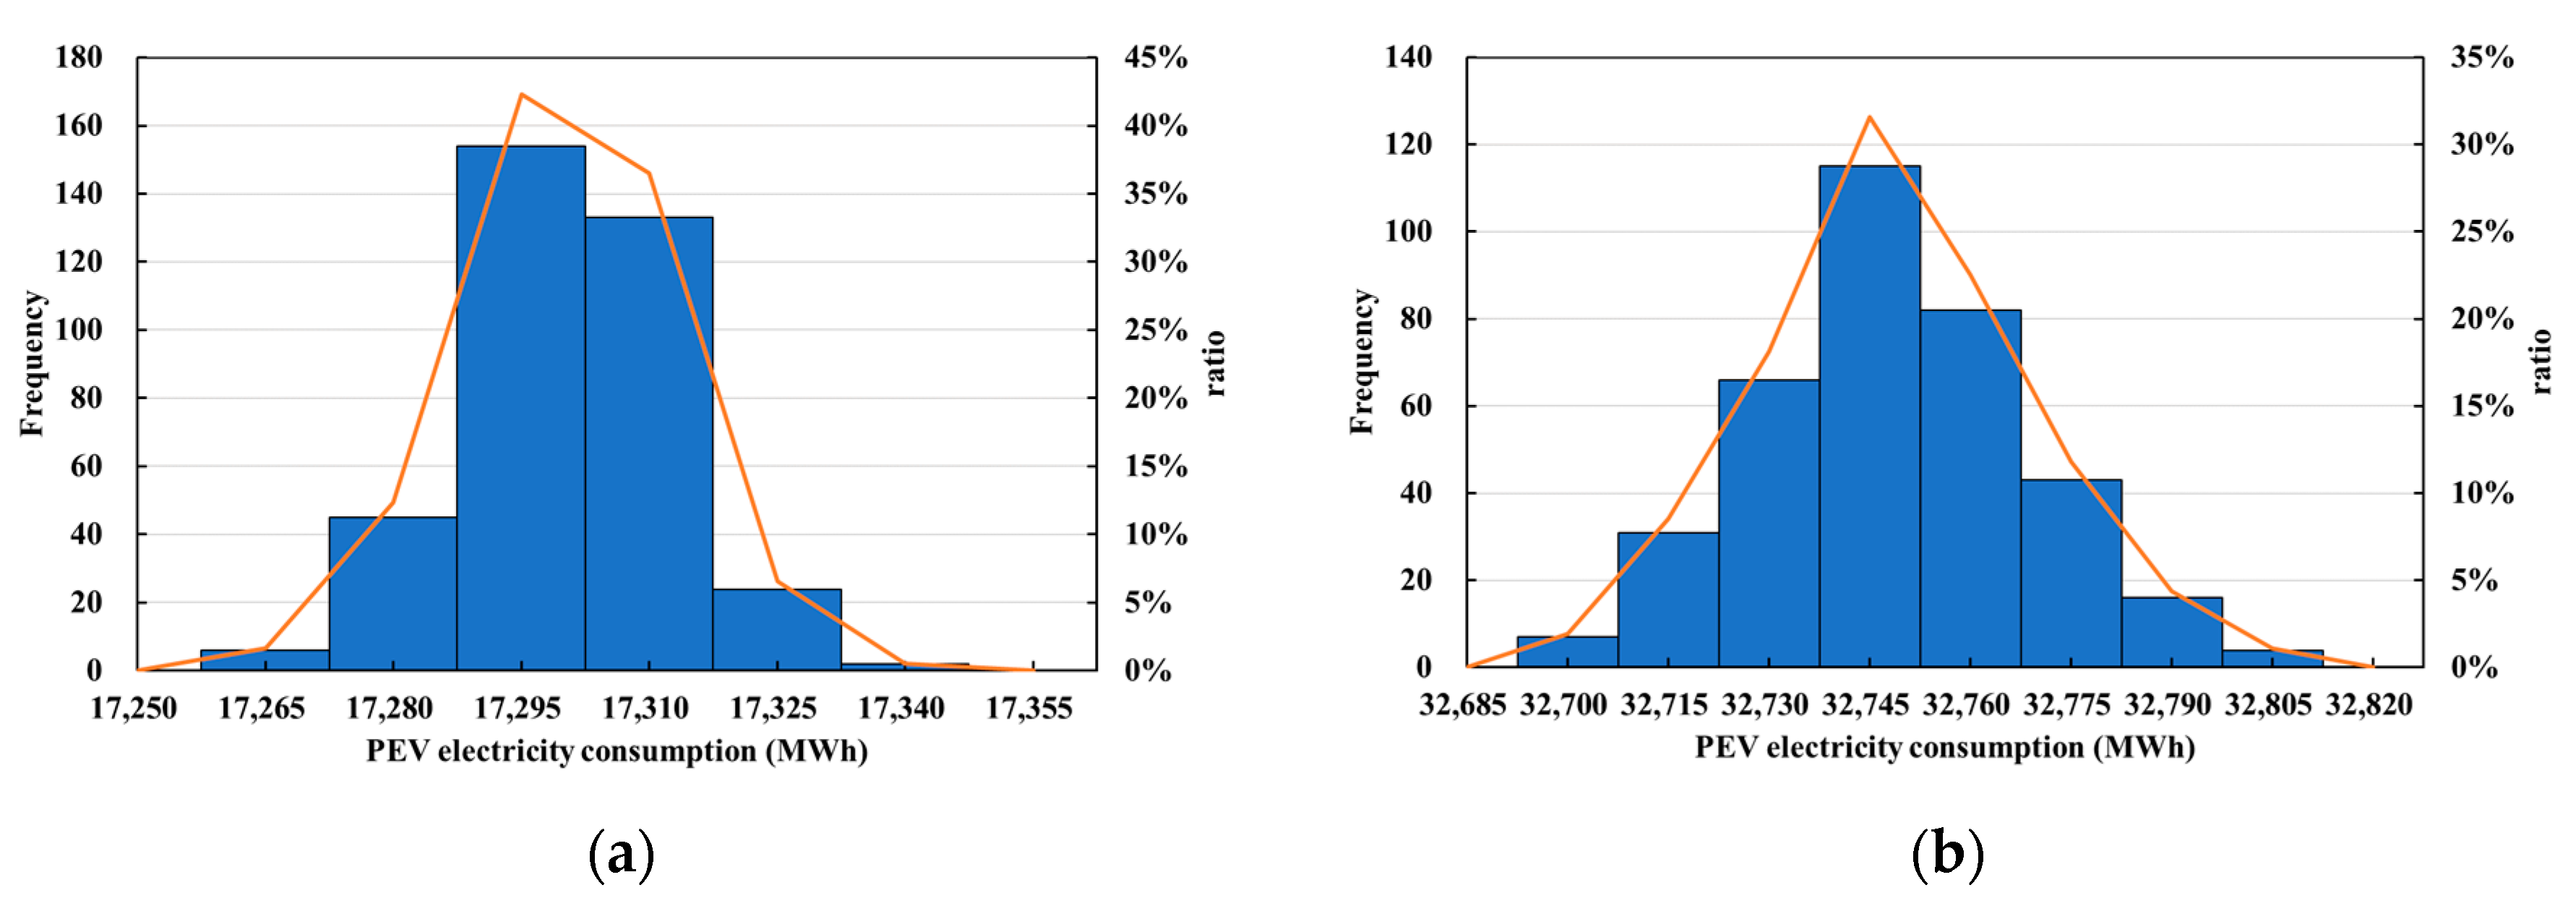
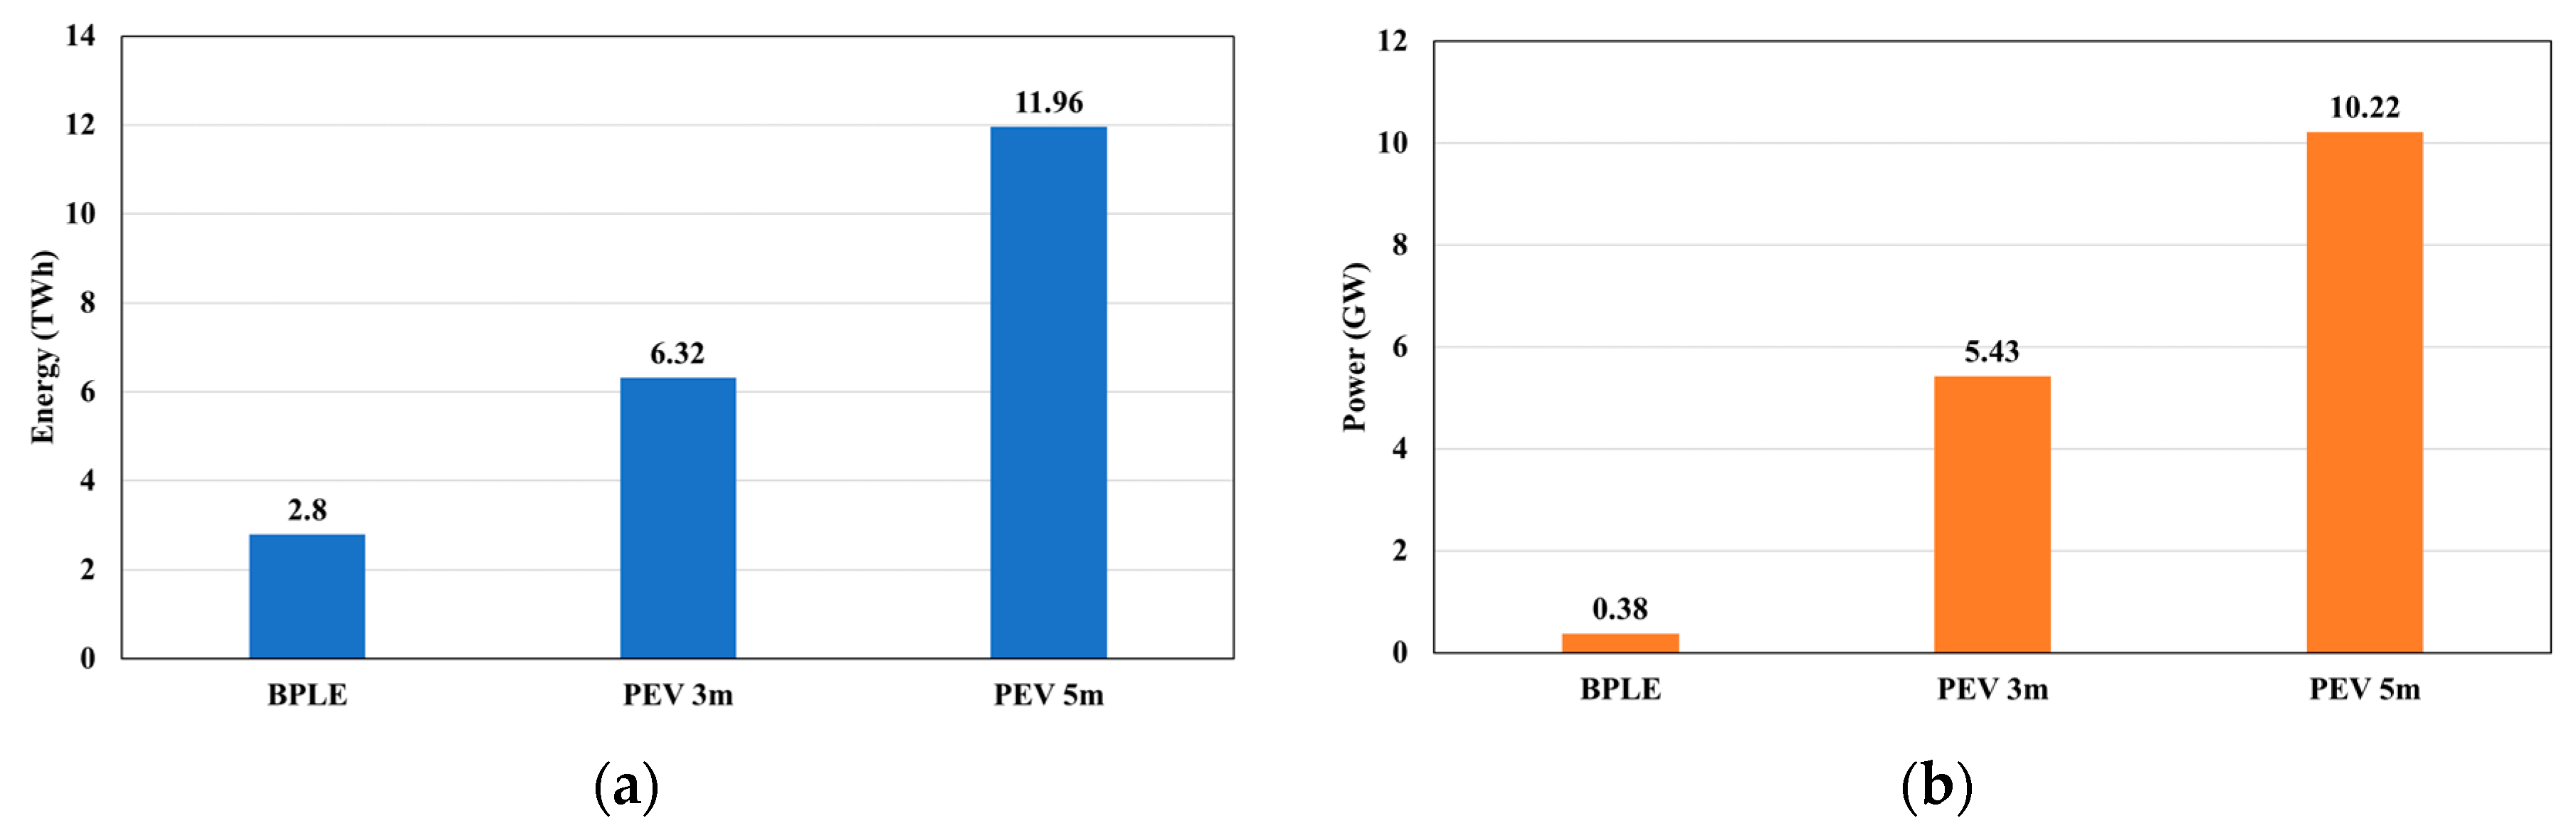
4.3. Characteristics Analysis of PEV Charging Demand

Because the proposed method derives the charging demand of PEVs from the charging profiles of individual PEVs, the profile of all the PEVs can also be derived for the analysis. Figure 12 shows the charging profile of the total PEVs in Korea during a selected day.
As shown in Figure 12, although the charging demand of individual PEVs is small compared to the electricity demand of the power system, the national peak of the PEV charging is high enough for consideration in the planning process of the transmission lines due to its concentration in the evening. Moreover, because the peak time of the PEV charging is found to occur at around the time of the peak demand of the electricity netted by the renewable energy system (RES), the impact of the PEV charging demand could be considerable in the power system.
Figure 13 shows the distribution of the daily electricity consumption of all the PEVs in the Korean power system.
The range and variation of the daily electricity consumption of the total PEVs in Korea can be obtained from the analysis of Figure 13, for application in the power system planning and operations. The PEV charging demand derived by the proposed method is compared to that of one million PEVs estimated in the 8th BPLE as shown in Figure 14.
As shown in Figure 14, although the charging demand is stochastically modeled in this study, the annual charging energy of the PEVs proportionally increases as the number of PEVs increases. However, the maximum charging demand increases significantly as the number of PEVs increases because the concentration of PEV charging is modeled in the proposed stochastic method.

4.4. Discussion

The accuracy of modeling the charging demand of PEV could be limited due to high uncertainties. These uncertain factors are due to the PEV user behavior, which corresponds to daily driving distance, charging location, and charging start time. All of these factors are different for each individual PEV user and there are large variations. Therefore, it is necessary to analyze the behavior of PEV users that determine the charging demand for PEVs, and to understand how this can affect the transmission system [26,27]. First, concerning the PEV user’s daily driving distance, which determines the amount of charging power, there is no significant difference from the mileage of the existing ICE vehicle. Therefore, it is possible to understand the amount of charging power of the PEV through the daily driving distance data of the existing ICE vehicle. Second, in the case of charging start time, it was analyzed that most drivers will charge at home after work. If a large number of PEVs in the power system are concentrated and charged as a specific time after work, the peak value of the power system may increase. Therefore, the management of the charging start time is considered to be the most important factor to mitigate power system influence. Third, as the charging location in the transmission system in concentrated in large cities, the load on the transmission line can be concentrated. In order to examine the effects of these transmission systems, PEV modeling appropriate to the level is required. In particular, it is essential to model the PEV charging demand for each substation because not only the location but also the size of the load is required to examine the effect of the loading of the transmission line.

5. Conclusions

This study proposed a stochastic method to model the PEV charging demand as the electric loads over substations in the transmission system planning process, considering the uncertainty and variations in the distribution and profiles of PEV charging. In the proposed method, the distribution of the PEVs is modeled as the number of PEVs supplied from the same substation, based on the number of electricity customers per substation. The penetration level of the PEVs and the number of EVs per customers are used to derive the probability of the number of PEVs per customer. The charging demand is also derived using the existing ICE vehicle statistics for the driven mileage and efficiency of the PEVs. The existing ICE vehicle statistics are used to determine the home arrival time and charger ratings of the PEVs. These are then used to derive the charging profile for supplying the derived charging demand. By aggregating the charging profiles of the PEVs connected to the same substation, their charging demand could be determined for consideration as part of the total electricity demand in the transmission system planning process. The effectiveness of the proposed method was verified through case studies in the Korean power system and statistics. From the modeling results and analysis, it was found that the PEV charging demand has considerable potential as additional peak demand in the transmission system planning because the charging time would be concentrated in the evening peak time shifted by the RES expansion. Particularly, by comparing the PEV charging demand modeled by the proposed method with that considered in the 8th BPLE of the Korean government, it was found that the proposed method was more practical in considering the distribution and driving patterns of vehicles when modeling the charging demand of PEVs. In the future, the impact of the PEV on the transmission system could be also studied in detailed as its charging demands would be derived by the proposed method.

Author Contributions

Methodology, J.H.M. and K.S.K.; software, J.H.M.; validation, J.H.M. and K.S.K.; investigation, J.H.M., H.N.G. and G.R.J.; writing—original draft preparation, J.H.M. and K.S.K.; writing—review and editing, J.H.M., H.N.G., G.R.J., W.Y.C. and K.S.K.; supervision, K.S.K. All authors have read and agreed to the published version of the manuscript.

Funding

This research was partially funded by Korea Electric Power Corporation, grant number R18XA04.

Acknowledgments

This research was partially supported by the Korea Electric Power Corporation (grant number: R18XA04).

Conflicts of Interest

The authors declare no conflict of interest.

References

  1. UNFCC. Paris agreement. In Report of the Conference of the Parties to the United Nations Framework Convention on Climate Change; UNFCC: New York, NY, USA, 11–30 November 2015. [Google Scholar]
  2. International Organization of Motor Vehicles Manufacturers, Climate Change and CO2. May 2008. Available online: http://oica.net/wp-content/uploads/climate-change-and-co2-brochure.pdf (accessed on 9 April 2020).
  3. Johansson, S.; Persson, J.; Lazarou, S.; Theocharis, A. Investigation of the Impact of Large-Scale Integration of Electric Vehicles for a Swedish Distribution Network. Energies 2019, 12, 4717. [Google Scholar] [CrossRef] [Green Version]
  4. Crozier, C.; Morstyn, T.; McCulloch, M. The opportunity for smart charging to mitigate the impact of electric vehicles on transmission and distribution systems. Appl. Energy 2020, 6, 114973. [Google Scholar] [CrossRef]
  5. Pieltain Fernández, L.; Gomez San Roman, T.; Cossent, R.; Mateo Domingo, C.; Frías, P. Assessment of the Impact of Plug-in Electric Vehicles on Distribution Networks. IEEE Trans. Power Syst. 2011, 2, 206–213. [Google Scholar] [CrossRef]
  6. Korea Energy Economics Institute (KEEI). Analysis of Impact of Energy Supply and Demand of Dissemination of Electric Vehicles; KEEI: Ulsan, Korea, November 2012. [Google Scholar]
  7. Korea Power Exchange (KPX). The Affect and Implication of the Electric Power Supply and Demand according to Dissemination Electric Vehicle; KPX: Naju, Korea, 2009. [Google Scholar]
  8. Hafez, O.; Bhattacharya, K. Queuing Analysis Based PEV load Modeling Considering Battery Charging Behavior and Their Impact on Distribution System Operation. IEEE Trans. Smart Grid 2018, 9, 261–273. [Google Scholar] [CrossRef]
  9. Zhang, B.; Sun, Y.; Li, B.; Li, J. A Modeling Method for the Power Demand of Electric Vehicles Based on Monte Carlo Simulation. In Proceedings of the 2012 Asia-Pacific Power and Energy Engineering Conference, Shanghai, China, 27–29 March 2012. [Google Scholar]
  10. Jian, L.; Zheng, Y.; Xiao, X.; Chan, C. Optimal scheduling for vehicle-to-grid operation with stochastic connection of plug-in electric vehicles to smart grid. Appl. Energy 2015, 146, 150–161. [Google Scholar] [CrossRef]
  11. Qian, K.; Zhou, C.; Allan, M.; Yuan, Y. Modeling of Load Demand Due to EV Battery Charging in Distribution Systems. IEEE Trans. Power Syst. 2011, 5, 802–810. [Google Scholar] [CrossRef]
  12. Thomas, D.; Deblecker, O.; Ioakimidis, C.S. Optimal operation of an energy management system for a grid-connected smart building considering photovoltaics’ uncertainty and stochastic electric vehicles’ driving schedule. Appl. Energy 2017, 210, 1188–1206. [Google Scholar] [CrossRef]
  13. Tabatabaee, S.; Mortazaci, S.S.; Niknam, T. Stochastic scheduling of local distribution systems considering high penetration of plug-in electric vehicles and renewable energy sources. Energy 2017, 121, 480–490. [Google Scholar] [CrossRef]
  14. Kavousi-Fard, A.; Niknam, T.; Fotuhi-Firuzabad, M. Stochastic Reconfiguration and Optimal Coordination of V2G Plug-in Electric Vehicles Considering Correlated Wind Power Generation. IEEE Trans. Sustain. Energy 2015, 6, 822–830. [Google Scholar] [CrossRef]
  15. De Nigris, M.; Gianinoni, I.; Grillo, S.; Massucco, S.; Silvestro, F. Impact evaluation of plug-in electric vehicle (PEV) on electric distribution networks. In Proceedings of the 14th International Conference on Harmonics and Quality of Power—ICHPQ 2010, Bergamo, Italy, 26–29 September 2010. [Google Scholar]
  16. Ministry of Environment, Republic of Korea. The 2nd Basic Plan for Climate Charge Response; MOE: Sejong, Korea, 2019.
  17. Ministry of the Interior and Safety, Republic of Korea. 2030 National Greenhouse Gas Reduction Basic Roadmap Amendment; MOIS: Sejong, Korea, 2018.
  18. Korean Ministry of Trade, Industry and Energy. The 8th Basic Plan for Long-Term Electricity Supply and Demand (2017–2031); Korean Ministry of Trade, Industry and Energy: Sejong, Korea, 2017; pp. 70–83.
  19. Son, H.J.; Kook, K.S. Stochastic Modeling of Plug-in Electric Vehicle Distribution in Power Systems. J. Electr. Eng. Technol. 2013, 8, 1276–1282. [Google Scholar] [CrossRef]
  20. Statistics Korea. The Number of Household by the Status of the Vehicle Ownership and the Status of Transportation Uses; KOSTAT: Daejeon, Korea, 2012.
  21. Normal EV Charger (3 kW). Available online: https://www.ev-line.co.kr/subsidy_request/sr_one_01.asp (accessed on 20 July 2020).
  22. Normal EV Charger (7 kW). Available online: http://www.ecarplug.com/sub/m2_product1_cpw.php (accessed on 20 July 2020).
  23. Fast EV Charger (50 kW). Available online: http://www.ecarplug.com/sub/m2_product2_1.php (accessed on 20 July 2020).
  24. Statistics of ICE Vehicles. Available online: https://mdis.kostat.go.kr/index.do (accessed on 5 May 2020).
  25. Specification of HYUNDAI IONIQ EV. Available online: https://www.hundai.com/kr/ko/e/vehicles/ioniq-electric/spec (accessed on 5 May 2020).
  26. Clairand, J.; Rodríguez-García, J.; Álvarez-Bel, C. Assessment of Technical and Economic Impacts of EV User Behavior on EV Aggregator Smart Charging. J. Mod. Power Syst. Clean Energy 2020, 8, 356–366. [Google Scholar] [CrossRef]
  27. Thomas, F.; Josef, K. Understanding charging behavior of electric vehicle users. Transp. Res. Part F Traffic Psychol. Behav. 2013, 21, 75–89. [Google Scholar]
Figure 1. EV expansion plan in Korea.
Energies 13 04404 g001
Figure 2. Stochastic method to model the number of PEVs for a household.
Energies 13 04404 g002
Figure 3. Stochastic modeling procedure for distribution of PEVs over 154 kV substations.
Energies 13 04404 g003
Figure 4. Stochastic method to model the daily driving distance of a PEV.
Energies 13 04404 g004
Figure 5. Stochastic method to model the plug-in time.
Energies 13 04404 g005
Figure 6. Overview of PEV charging demand modeling for transmission system planning.
Energies 13 04404 g006
Figure 7. Probability of the number of registered vehicles per household by region.
Energies 13 04404 g007
Figure 8. Box plot analysis for PEV portion per 154 kV substation in each scenario.
Energies 13 04404 g008
Figure 9. Statistics for PEV charging demand modeling: (a) Private vehicle daily driving distance; (b) Commercial vehicle daily driving distance; (c) Home arrival time; (d) Charger for commercial vehicle.
Energies 13 04404 g009
Figure 10. Example of an individual PEV charging demand model: (a) Charging profiles for three arbitrarily chosen PEVs; (b) Over-rapped daily charging profiles of an arbitrary chosen PEV.
Energies 13 04404 g010
Figure 11. Charging demand and loads at the substation: (a) PEV 3 m; (b) PEV 5 m.
Energies 13 04404 g011
Figure 12. Daily charging profile of total PEVs in Korean power system.
Energies 13 04404 g012
Figure 13. Distribution of daily electricity consumption of all PEVs in Korean power system; (a) PEV 3 m; (b) PEV 5 m.
Energies 13 04404 g013
Figure 14. Comparing results with 8th BPLE; (a) Charging energy; (b) Maximum charging power.
Energies 13 04404 g014
Table 1. Charging demand of EV estimated in 8th BPLE.
20172022202620302031
Cumulative number of EVs (Thousand)4633462910001108
Annual electricity consumption (TWh)0.11.01.82.83.2
Annual peak demand (summer, GW)0.020.140.230.380.42
Annual peak demand (winter, GW)0.020.110.180.290.32
Table 2. Charger specifications used for modeling PEV charging demand.
Type of ChargeInput Voltage (V)Output Voltage/Current (V/I)Charging Power (kW)
Normal 220   ac ,   1 220 ac/143
Normal 220   ac ,   1 220 ac/327
Fast 380   ac ,   3 450 dc/11050

