1. Introduction
In order to achieve the climate targets set within the Paris agreement [
1], a significant transformation of the overall energy system is required. Sweden is at the forefront of this transformation with a bold energy policy adopted in 2016 [
2]. In the transport sector, the country aims to reduce CO
emissions in 2030 by 70% compared to those in 2010. Moreover, in the electricity sector the goal is to have a 100% renewable production by 2040. The ultimate target for 2045 is to reach carbon emission neutrality. For the past 10 years, the transport sector has swiftly reduced its carbon dependency by switching from fossil fuels to other alternatives at a faster rate than any other sector. However, as of today, it is still the sector with the highest proportion of fossil fuels, with a 76% consumption [
3]. The electricity sector, on the other hand, is at the other end of the spectrum with only 1% of fossil fuel consumption. Even at the latest rate of fossil fuel reduction, there is a risk that the emission target is not reached in time. Consequently, in the coming 10 years it is crucial to accelerate the diversification of the transport sector towards other energy sources.
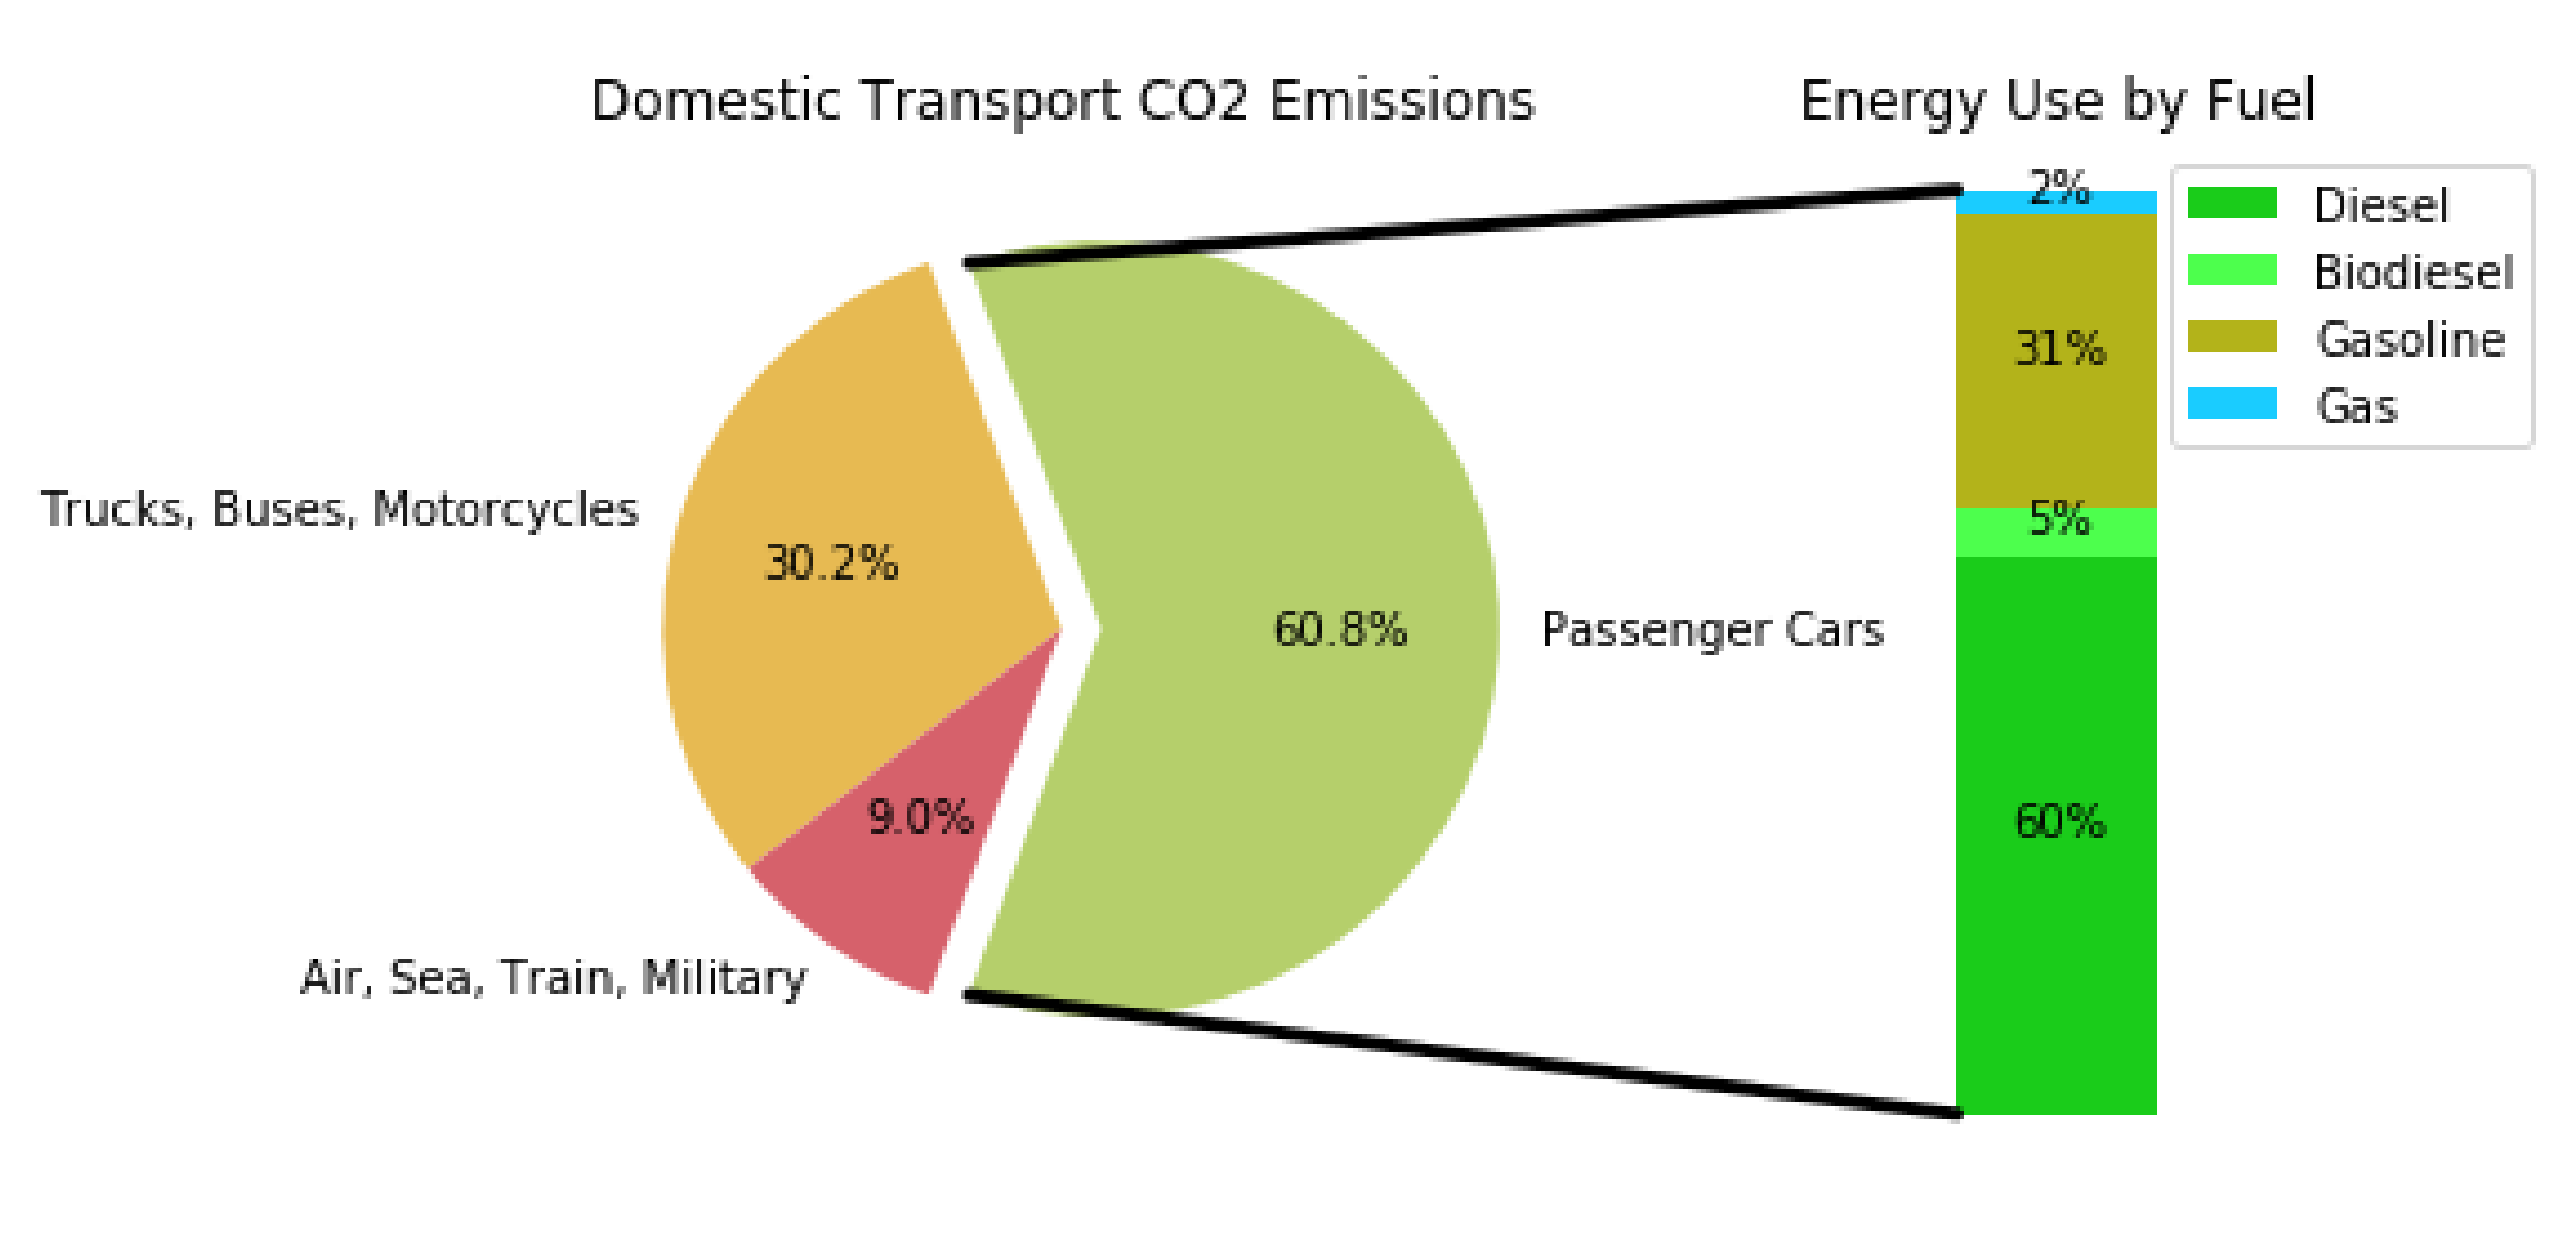
Increasing the share of electricity use within transport is a most promising solution for achieving this needed transformation. Specifically, the rapid integration of plug-in electric vehicles (PEVs) within road transport. As shown in
Figure 1, in 2018 passenger cars were responsible for 60.8% of the total domestic transport emissions [
4] and the electricity use in the sub-sector accounted for a minimal 0.12% share of its total energy use by fuel [
5]. Both of these facts entail that there is an enticing potential to increase the share of PEVs and these would, in turn, cause a direct benefit in reducing the carbon footprint of the highest emitting transport sub-sector. Therefore, sector coupling between transport and electricity can be an enabling force that steers the swedish energy system into fossil freedom.
Achieving a high share of PEVs in the system does not come without challenges. The massive introduction of PEVs increases the strain on the electricity infrastructure and confronts its robustness. The behavioral nature of the PEV charging loads changes the way the network is designed, planned and operated today. Nowadays, the share of PEVs from the total cars in traffic is only 4% but the rate of increase has been doubling in the past 3 years [
3]. In addition, there is an identified shortage of power capacity in the Swedish transmission grid. This translates to limitations in the distribution of electricity at regional level and it has been affecting major cities. This is the case for the city of Stockholm, where the electricity demand is increasing as part of the region’s own infrastructural development [
6] while the power supply is limited to 1525 MW. In accordance to the transmission system operator, this limit in power capacity will be remedied by 2030, at the earliest.
In face of this challenging situation, Ellevio AB and Stockholm Exergi (as the local DSO and heat utility, respectively) reached an agreement at the end of 2019 [
7,
8] consisting of securing an additional 320 MW produced locally by a local combined heat and power plant for the coming 12 years. For the time being, this solution will help avert the electricity power supply crisis in Stockholm while long-term investments and measures are set in place. However, such a situation requires monitoring and especial attention to the reciprocity between having the share of PEVs continue increasing while guaranteeing security of the power supply and the integrity of the grid components. Neither one should be an obstacle to the other.
1.1. Related Work
In order to handle a high share of PEVs at district level, it is crucial to investigate the impact that the collective PEV charging loads would have on the distribution system. Previous studies in this field have been carried out for distribution networks over different locations in the world and in Sweden. Within the extensive review carried out in Reference [
9], demand side management and scenario-based analyses were been identified as categories with a major presence in the literature. In the study carried out in Reference [
10], charging behavior factors were shown to have a strong influence on the results. It was found that uncontrolled PEV charging can increase load peaks by up 3.6 times and that improved charging strategies are needed to ease the effects of simultaneous charging.
A Portuguese study analyzed the impacts of home charging PEVs at night-time, and concluded that the degree of penetration increases, more strain will be put on the distribution grid, increasing the minimum system load, and increase stress on baseload units [
11]. In British Columbia, Monte Carlo simulations were performed to estimate residential and commercial demands where it was learned that PEV charging does increase the peak demand, which in turn causes voltage drop (mainly in rural areas) and transformer overloading [
12]. In the UK, a Monte Carlo simulation was developed with a Spatial-Temporal model to obtain EV charging loads in busbars at different times, identifying the critical network components for up to 50% PEV penetration levels, showing low voltages at times for larger penetrations. Spatial-Temporal modelling has potential to quantify EV penetration impact and detailing vulnerable parts of the network [
13]. The study carried out in Reference [
14] analysed the deployment of PEVs, under numerous smart charging schemes, to facilitate a microgrid’s self-consumption of solar power in the Netherlands.The main findings indicate that PEVs and smart charging schemes can make significant contributions to a well-balanced supply and demand.The system is however not deemed favourable when employed on a larger scale.
In Sweden, the work carried out in Reference [
15] analyzed the impact of load management strategies in different districts of Gothemburg. The study found that steering the electric loads towards minimizing losses can reduce de need for grid investments while the strategy of minimizing costs would result in an increased peak power demand. The study conducted in Reference [
16] for the Uppsala municipality investigated the need for distribution grid operators to incorporate PEV loads as a factor in their network planning and dimensioning. It was made clear in this study that PEV charging is expected to have a significant impact in the 2030 timeframe and that the parameters used for dimensioning of the network should incorporate electric vehicle loading aspects as the risk for overloading of components is high. Similarly, a study conducted for five areas in Stockholm [
17] calculated the maximum number of cars that could fit in those areas while identifying network bottlenecks. It was found that the cables were the most vulnerable components in the suburban areas grid while the network in the inner city was found to be more robust.
In general, the impact of increased loads in the network is highly dependent on the area being studied, on the capacity of the existing grid and on behavioral considerations of the PEV loads. Likewise, all studies agree that load management strategies can post-pone network reinforcements but that the level of postponement is entirely case-specific. Moreover, the literature agrees that if PEVs were properly designed and controlled, they would be beneficial to the operation of the grid, by providing ancillary services. If not, supply-demand matching may be affected, as well as power quality, voltage imbalance and component overloads. This work builds upon the knowledge generated from the previous cited studies but evaluates the effects of PEV charging in a new area. Moreover, the concept of a peak power budget is introduced for the district area being studied, which is something that none of the studies before have considered. The idea with the power budget is to set an equivalent limit at district level to the one Stockholm region has imposed by the transmission system operator. In that way, it is possible to gain knowledge on how close the district is operating around the said limit and thus its influence on the power shortage situation in the region.
1.2. Scope and Objectives
This paper develops a scenario-based simulation study to evaluate the impact of PEV charging loads on the distribution grid of a neighborhood in Stockholm, Sweden. The effects of PEVs are evaluated specifically on the local infrastructure as well as in the existing power capacity limitations in the region. The paper also investigates the extent to which load management strategies can mitigate the peaks generated by uncontrolled charging.
For this, different scenarios for electricity usage are developed based on regional trends and demographic data. Then, based on the extension of a previously developed model [
18], power flow analyses are conducted in the intermediate voltage grid of the area in question. Studies are run considering different time resolutions and PEV charging behaviors. More specifically, load management strategies for controlling the PEV charging loads are implemented and compared in terms of their impact in the network. In this process, bottlenecks in the distribution network of the neighborhood of Hammarby Sjöstad are identified both at the level of the network components and in the overall peak power capacity to the area.
The remainder of the paper is organized as follows—an overview of the case study, input data and the developed scenarios are presented in
Section 2.
Section 3 explains the modeling scheme and the simulation framework implemented in the paper, as well as the research questions addressed.
Section 4 shows and discusses the results obtained for each of the simulations. Finally,
Section 5 concludes the paper and provides an outlook for the future.
2. Case Study and Scenarios
The selected area of study of this work is Hammarby Sjöstad (HS), a district located in the southeast of Stockholm. Since its development, HS has been globally recognized as a very successful urban renewal project for its approach of integrating sustainability into city planning [
19]. Today, about 70% of the area is developed and by its estimated completion it will have 12,000 residential units, 21,000 inhabitants and employ 10,000 people [
20]. As both a result and a cause of its success story, HS is used today as a demonstration platform with a number of test-beds in smart energy, sustainable transport and sharing economy.
Within HS, citizen driven initiatives [
21] have been working for some years to engage the tenant-owner associations and residents towards concrete energy and climate measures. One project to highlight from that initiative is called “Charge at Home” which makes use of policy incentives to install charging infrastructure in households. This sets a natural predisposition for HS to be an early adopter of PEVs, thus making it a very relevant test-case for this study.
The first step in the analyses carried out in this work was to develop a set of scenarios for the years of 2016, 2020, 2025 and 2031 in HS. The scenarios were developed using year 2016 as a reference and scaled for the other years based on different input data and assumptions. For the years in study, each scenario establishes:
an aggregated electricity demand,
a level of PEV penetration,
a power capacity limit,
The aggregated electricity demand listed above refers only to the base loads in the area. The PEV loads will be subsequently constructed from the PEV penetration levels. The data extracted from different sources and the respective assumptions to construct the scenarios are explained in
Section 2.1 and
Section 2.2.
2.1. Electricity Demand
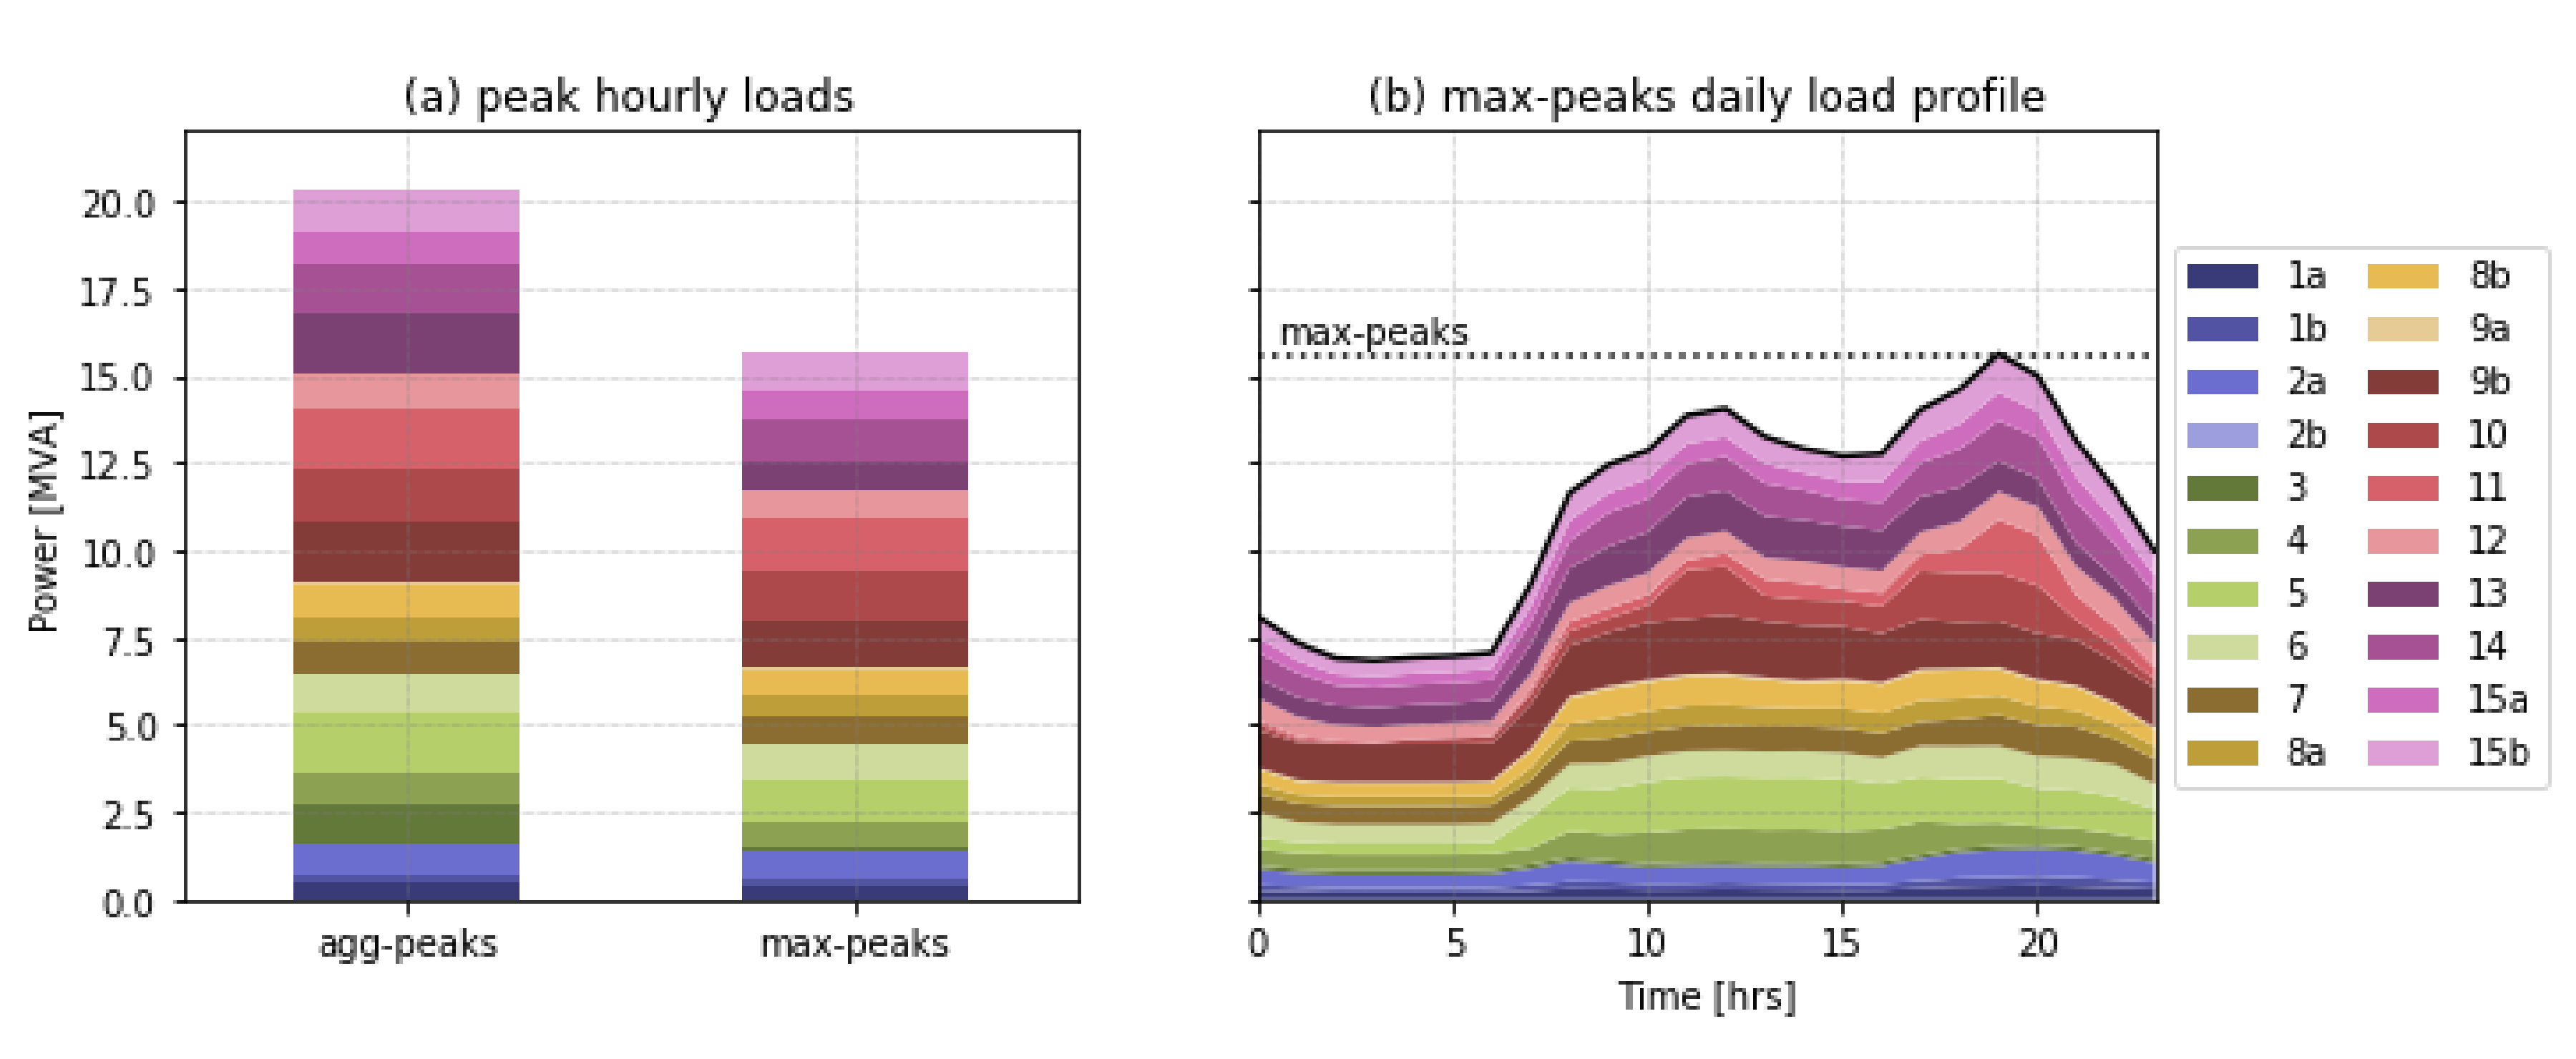
The electricity consumption in HS for the year 2016 was calculated based on measured data provided by Ellevio AB, the distribution system operator of the area. In 2016, the total electricity demand in HS amounted to 76.5 GWh with an maximum peak of 15.61 MVA and an aggregated peak of 20.29 MVA.
Figure 2a shows the two peak values in terms of the distribution among the 20 substations in the area. The difference between these two values is that max-peaks is the actual maximum of the yearly load time-series while agg-peaks is the sum of the partial maximum loads at each substation. Since partial peak values can happen at different occasions, their aggregation results in a higher value.
Figure 2b shows the daily distribution of the loads on the max-peaks case which corresponds to wednesday 20 January 2016. The peak to average load ratio on this day is equal to 1.39. The scenarios were built considering the agg-peaks case while the max-peaks is considered for the studies performed in later sections.
In order to scale the 2016 base load demand onto the other years of study, the changes in the base loads electricity consumption were considered proportional to those of the population. For this, population data and its growth projections were obtained [
22,
23] and interpolated for the years of interest to this study.
Table 1 shows the corresponding numbers for the city of Stockholm (Sthlm) and for HS. While the population in the whole city is expected to increase in the selected years, the population in the HS district is constant after 2025 which is when the on-going contructions for housing are expected to be completed.
2.2. Electric Vehicle Penetration
Before building scenarios for electric vehicle penetration, the total amount of cars in the district was quantified. Car ownership in the city of Stockholm has been relatively steady for the past two decades [
24]. Since HS is a part of Stockholm city, this value was assumed constant for the years of study as 370 cars per 1000 inhabitants. The total amount of vehicles in HS was then estimated using this ratio and the population from
Table 1.
Table 1 shows the values that were defined as the share of electric vehicles that can be expected in the district of HS for the studied years. These values were gathered from electric vehicle statistics [
25] and their future trends in the City of Stockholm [
26]. Historic data from Reference [
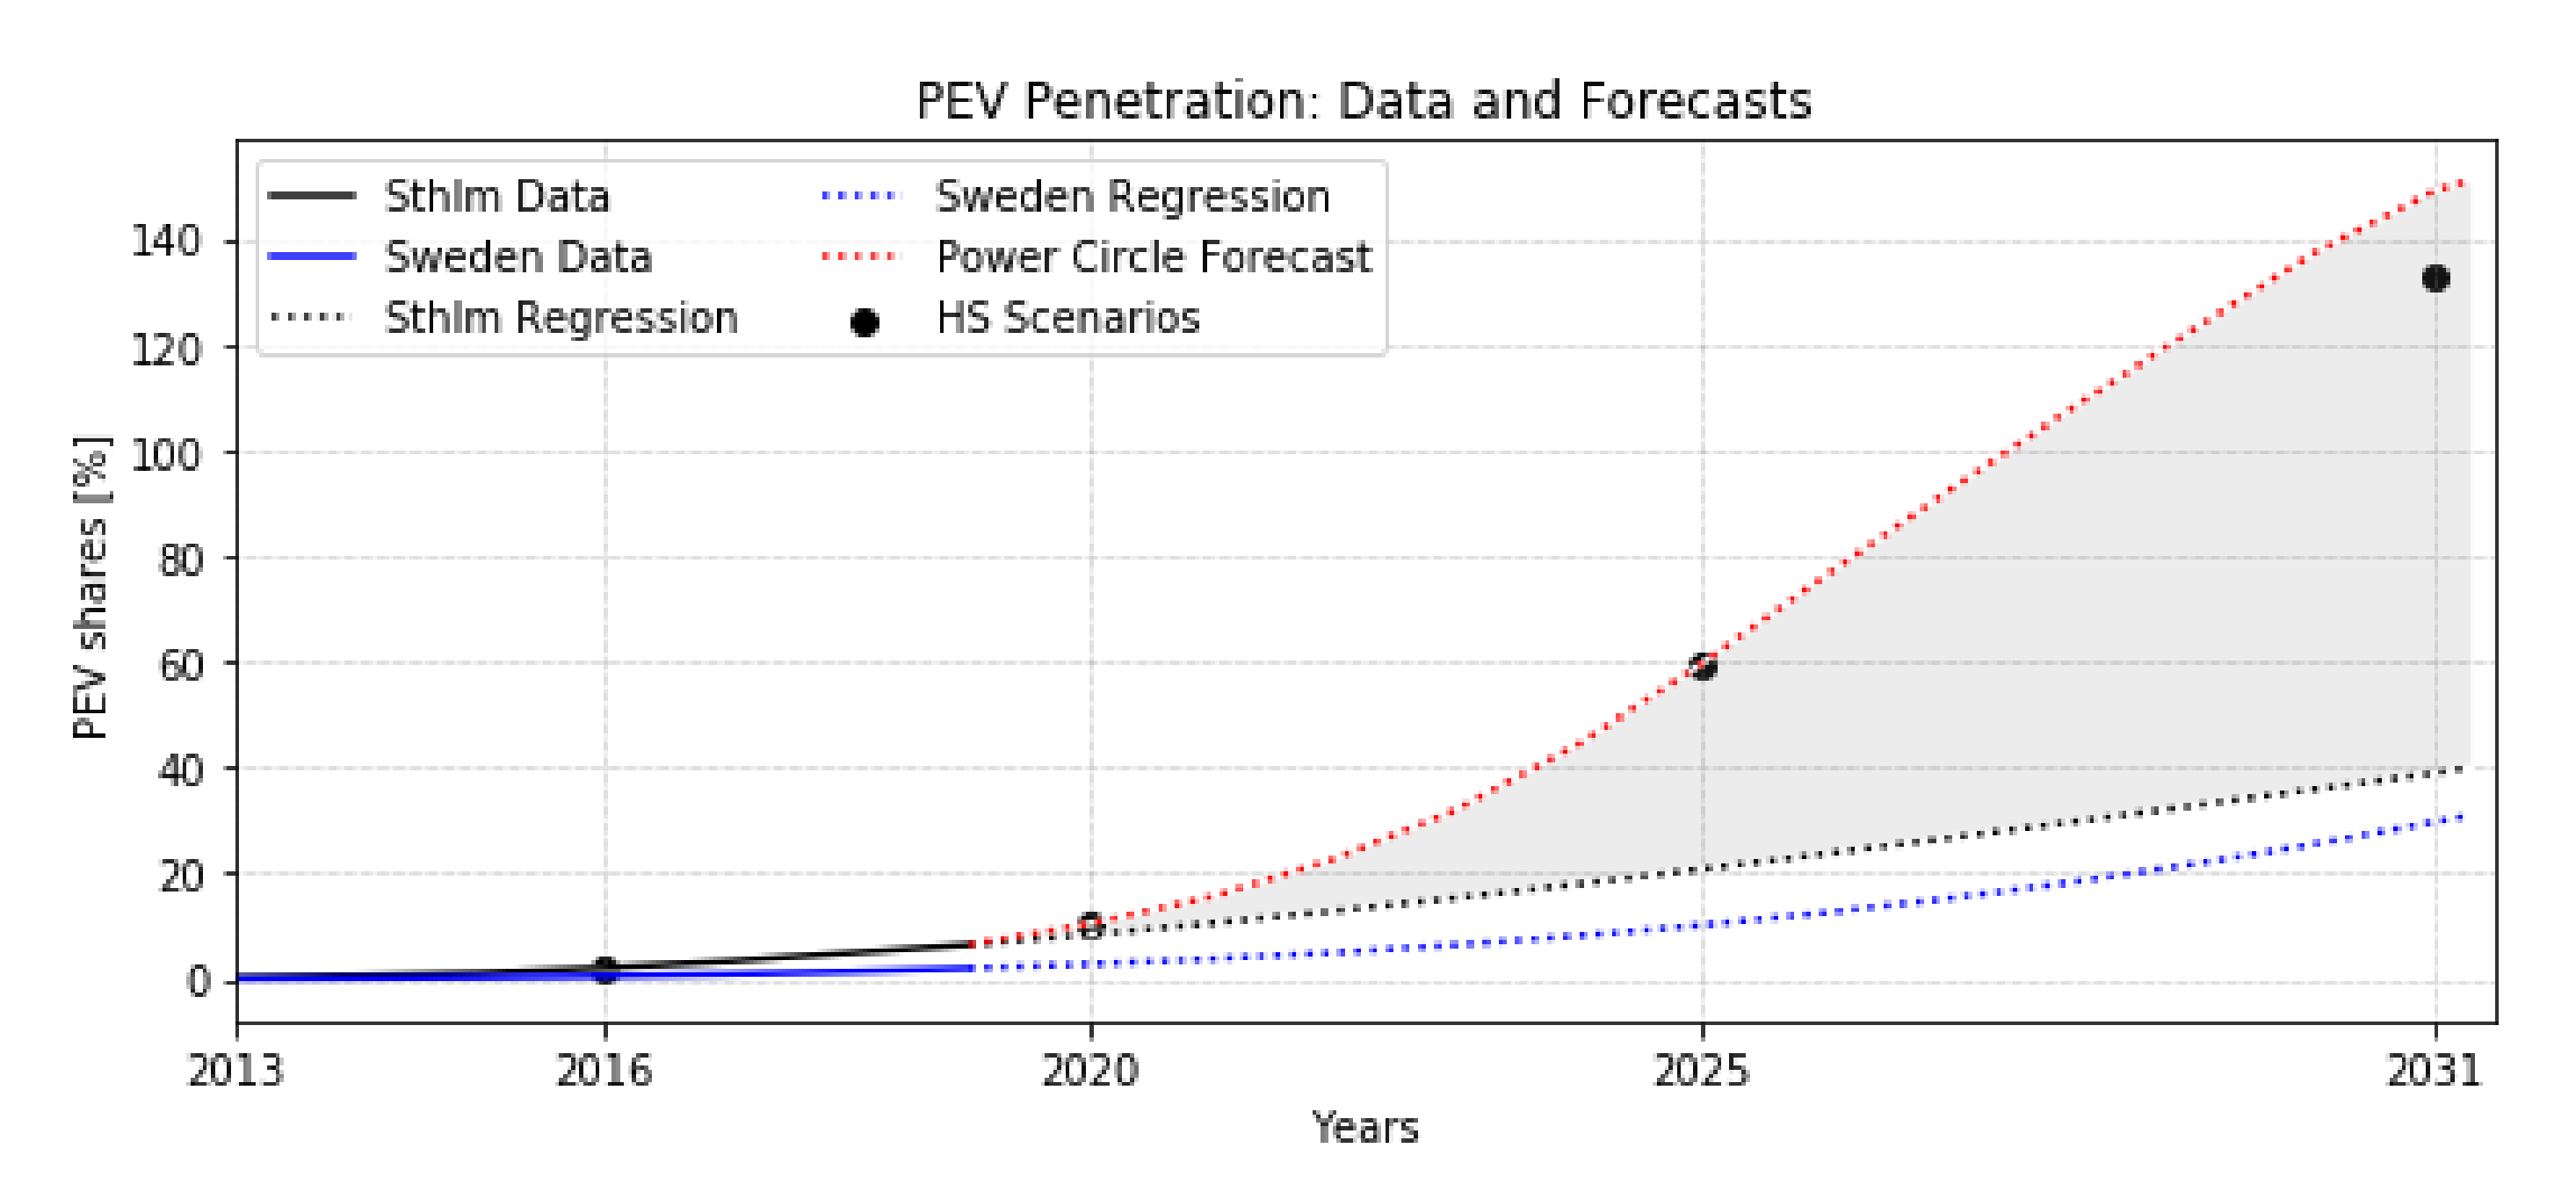
25] was gathered up to year 2019 for Stockholm and for Sweden. Based on this information, the projected rate of growth of PEVs was regressed towards future years. In parallel to this, the Power Circle organization has assessed the long term market development of PEVs in Sweden as one following the S-curve model of new technology adoption [
26]. This forecast was adapted to the population of personal vehicles in Stockholm and is considered in this work.
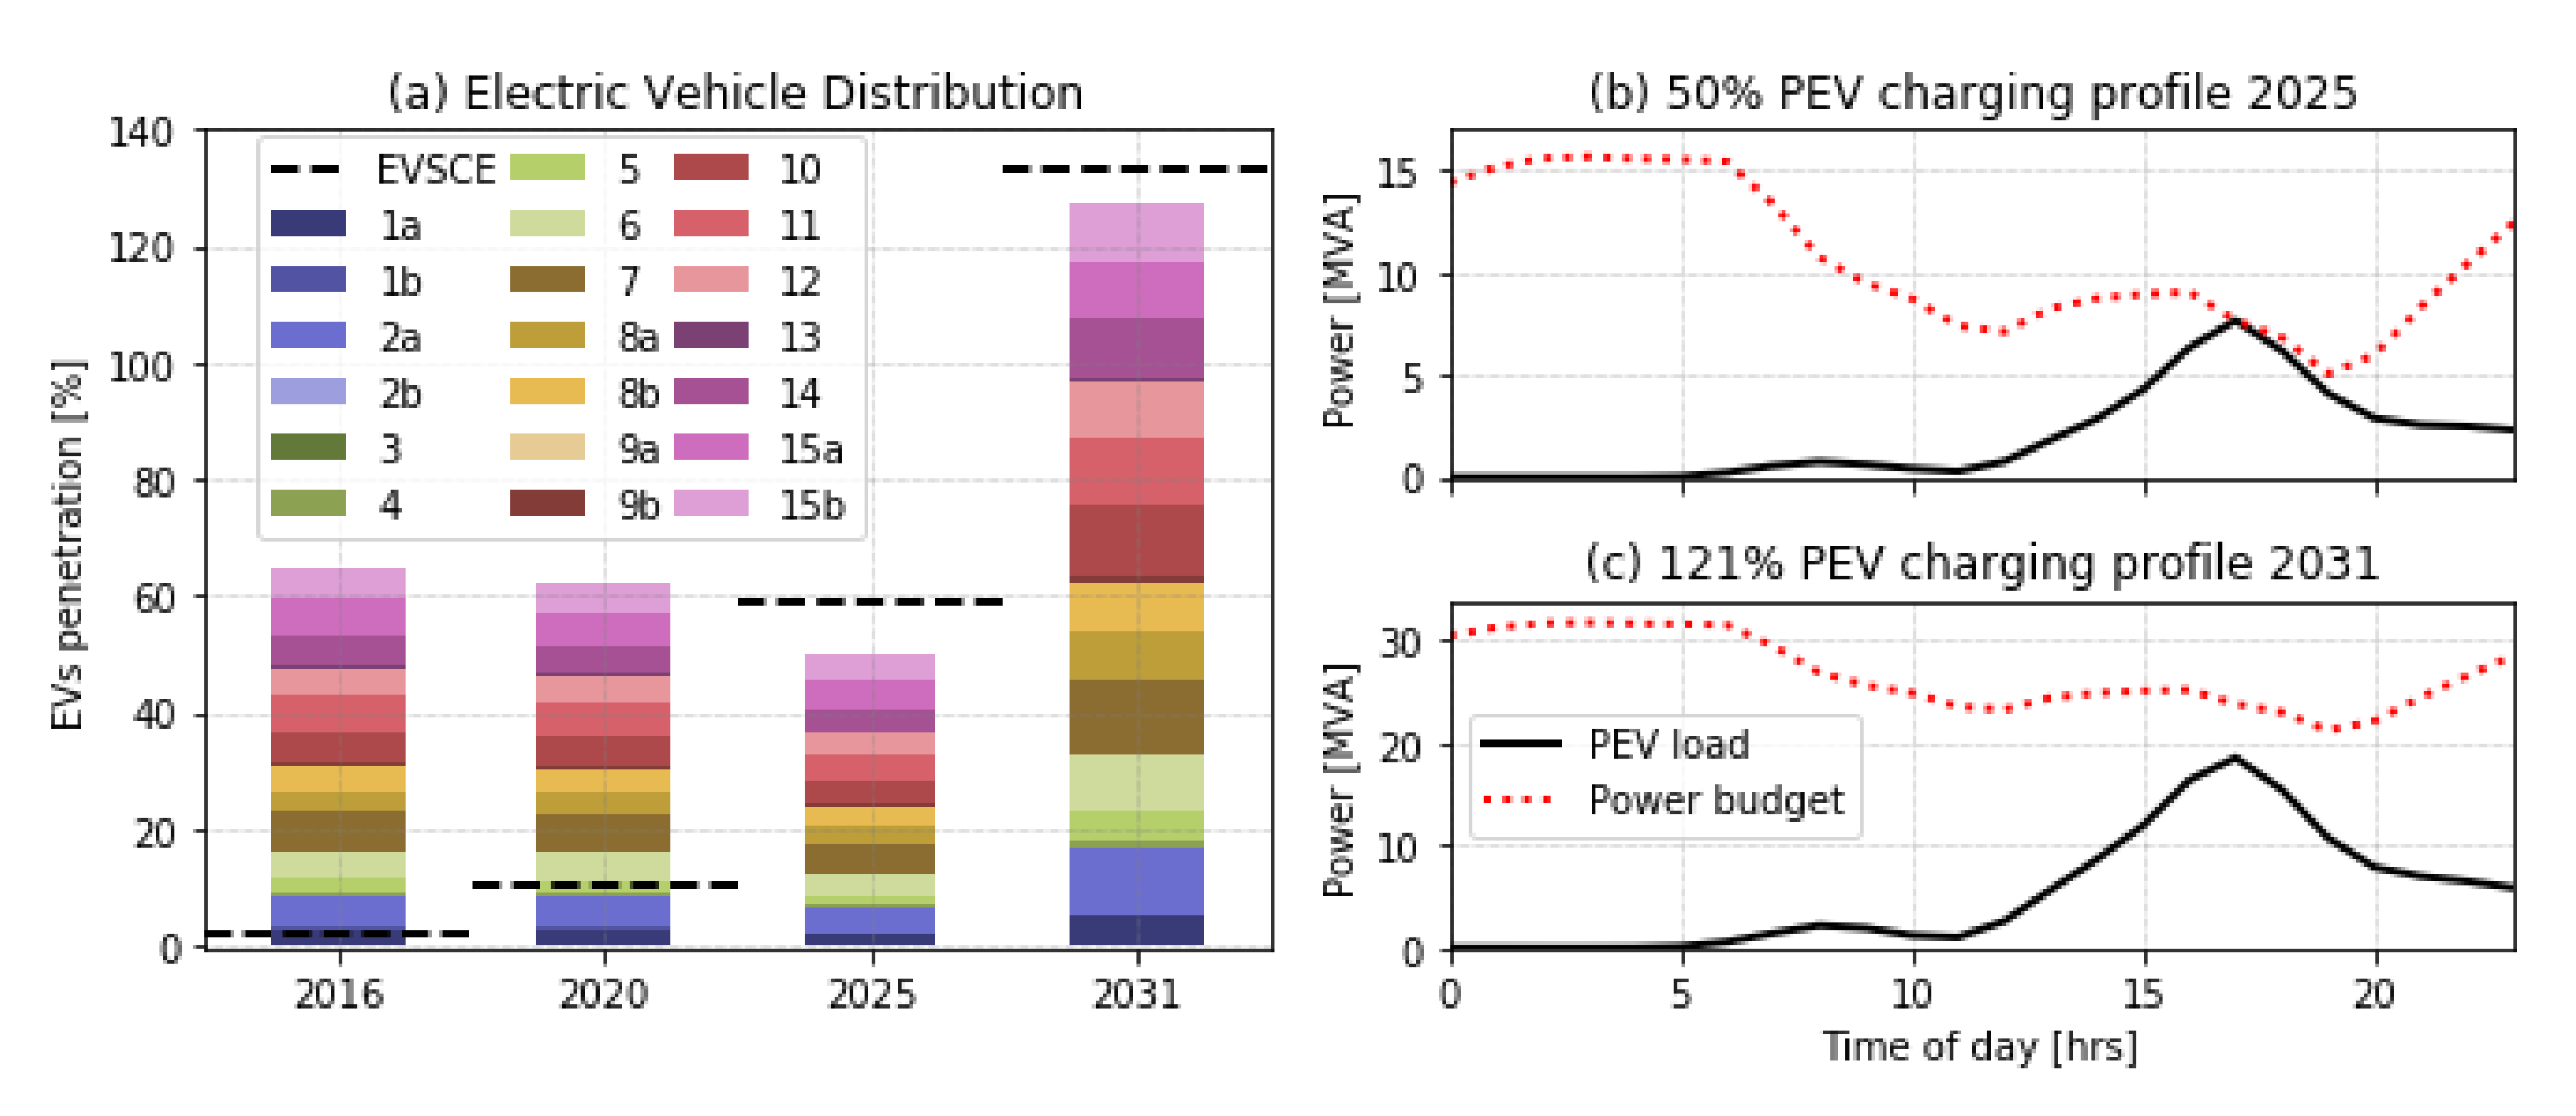
Figure 3 shows the historic electric vehicle data, its future regressions as well as the Power Circles forecast.
The PEV penetration scenarios that were considered for HS within this work are also shown in
Figure 3. It can be seen in the figure that the values selected for the district are in the high end of the forecasted range. The reason for this being the amount of smart energy initiatives that are currently on-going at HS (as mentioned in
Section 2). The year 2031 was chosen to be more conservatively within the range due to the fact that the population in HS (
Table 1) will have already reached saturation by then.
It is important to highlight that the Power Circles forecast only takes into account PEV development from a market growth perspective and it does not take into account how many vehicles or inhabitants are in total in the municipality in the future, this is the reason why the PEV penetration share for 2031 is 133%. Although this number appears to be counterintuitive, it is simply interpreted as a high-electrification scenario in which the entire car fleet is made of PEVs and there is an increased amount of vehicles in the total passenger car fleet in comparison to today’s share. The value is therefore kept for the subsequent calculations performed in this paper. In that way, all the scenario years PEV shares are calculated using the same car ownership and future projection assumptions.
2.3. Power Capacity Limits
As established in
Section 1, the amount of power available from the transmission level to the Stockholm distribution grid is limited to 1525 MW and the local heat utility has agreed to supply an additional 320 MW in the coming years. In this study, those limitations corresponding to the whole region were scaled down to an equivalent capacity limit for the district of HS. This was done in order to establish the concept of a peak power
budget against which to compare and control the eventual peaks of the PEV charging loads of the district.
The Stockholm situation has been previously documented [
6,
27] and well described in a figure that presents a timeline of the available power capacity contrasted with the expected growing electricity demand. However, the additional power capacity agreed upon with the heat utility is not included in the aforementioned studies. Therefore, the first step was to extract those values for the years selected in this study and include the additional 320 MW agreed for the Stockholm region. Then, a scale down to HS equivalent capacities was done based on the ratio between regional and local peak demands for the reference year 2016.
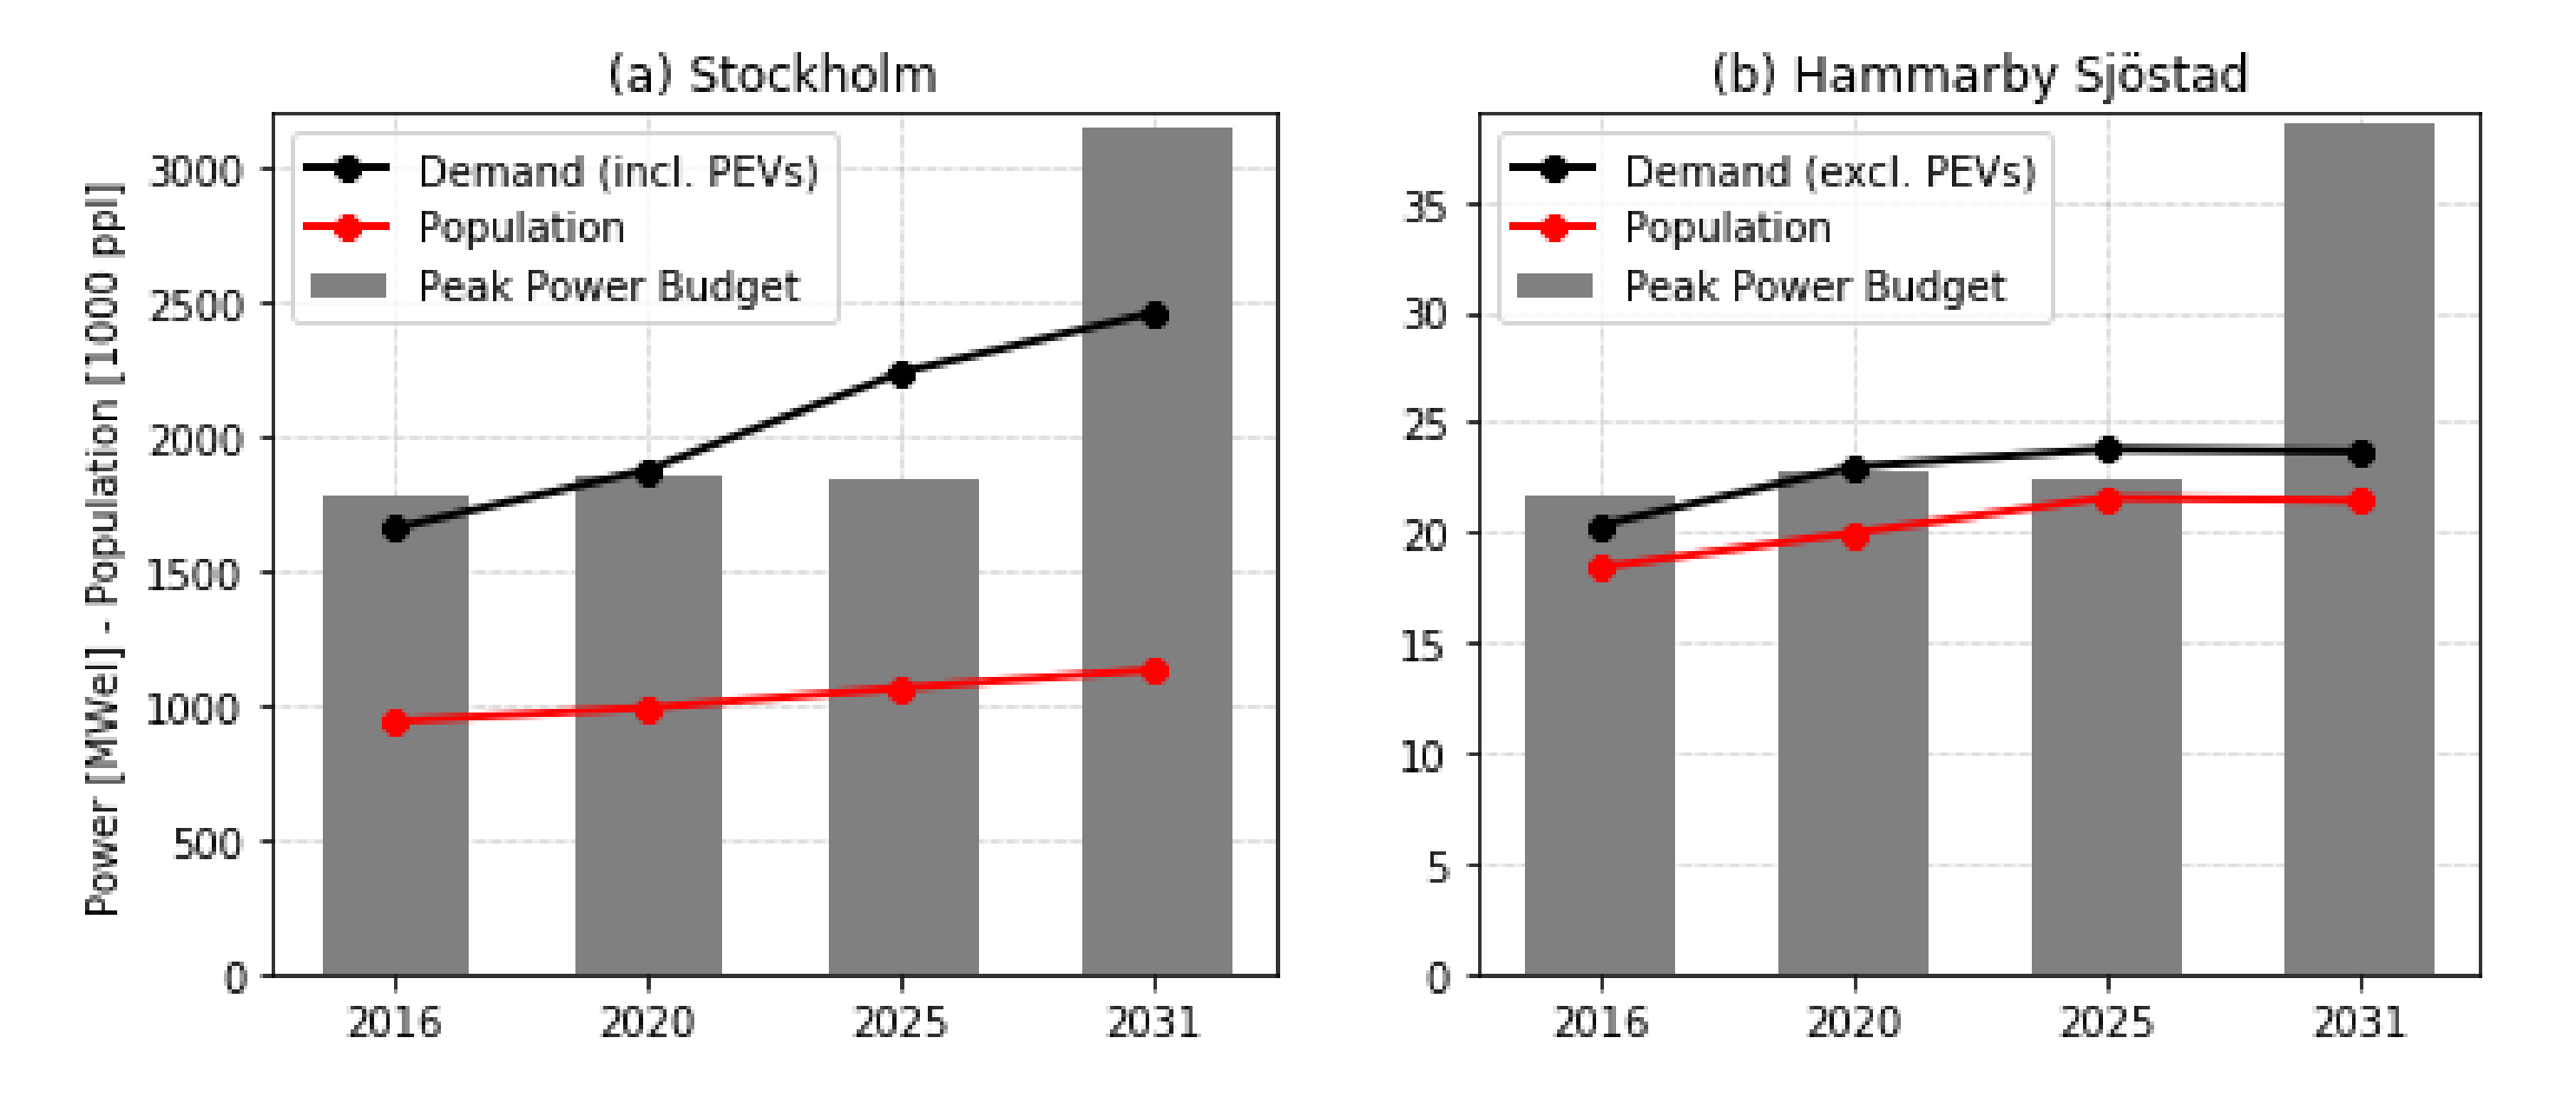
Figure 4a hereby shows the corresponding power capacity and demand for Stockholm and
Figure 4b shows the scaled down equivalent of those values for HS’ electricity demand.
The population development for the city and the district are also shown in
Figure 4. It can be seen that while the rate of electricity demand increase for HS is proportional to the population growth, the one for Stockholm city is not. This relates to the assumption made in
Section 2.1 and to the fact that the demand for the Stockholm case includes all electrification loads (including PEVs) while the one for HS only reflects the base loads (excluding PEVs). Even with this difference, the scenarios created for HS still reflect the reality of the region with regards to the increasing gap between demand and power capacity in the coming years until 2031 when the transmission limitations are solved.
3. Method and Models
Once having defined the scenarios, they were used as part of the modeling scheme shown in
Figure 5. Essentially, a choice of scenario year also defines the percentage of electric vehicle share, base loads and capacity limits in the area as per the clarifications in
Section 2.1–
Section 2.3. These attributes then serve as an input to three models, namely: A PEV load model, a load management model and a power flow model. The models are explained in more detail in the coming
Section 3.1–
Section 3.3. The methodology proposed in this work, uses the presented scheme towards addressing the following research questions:
3.1. Power Flow Model
The intermediate voltage grid of HS was modeled using pandapower [
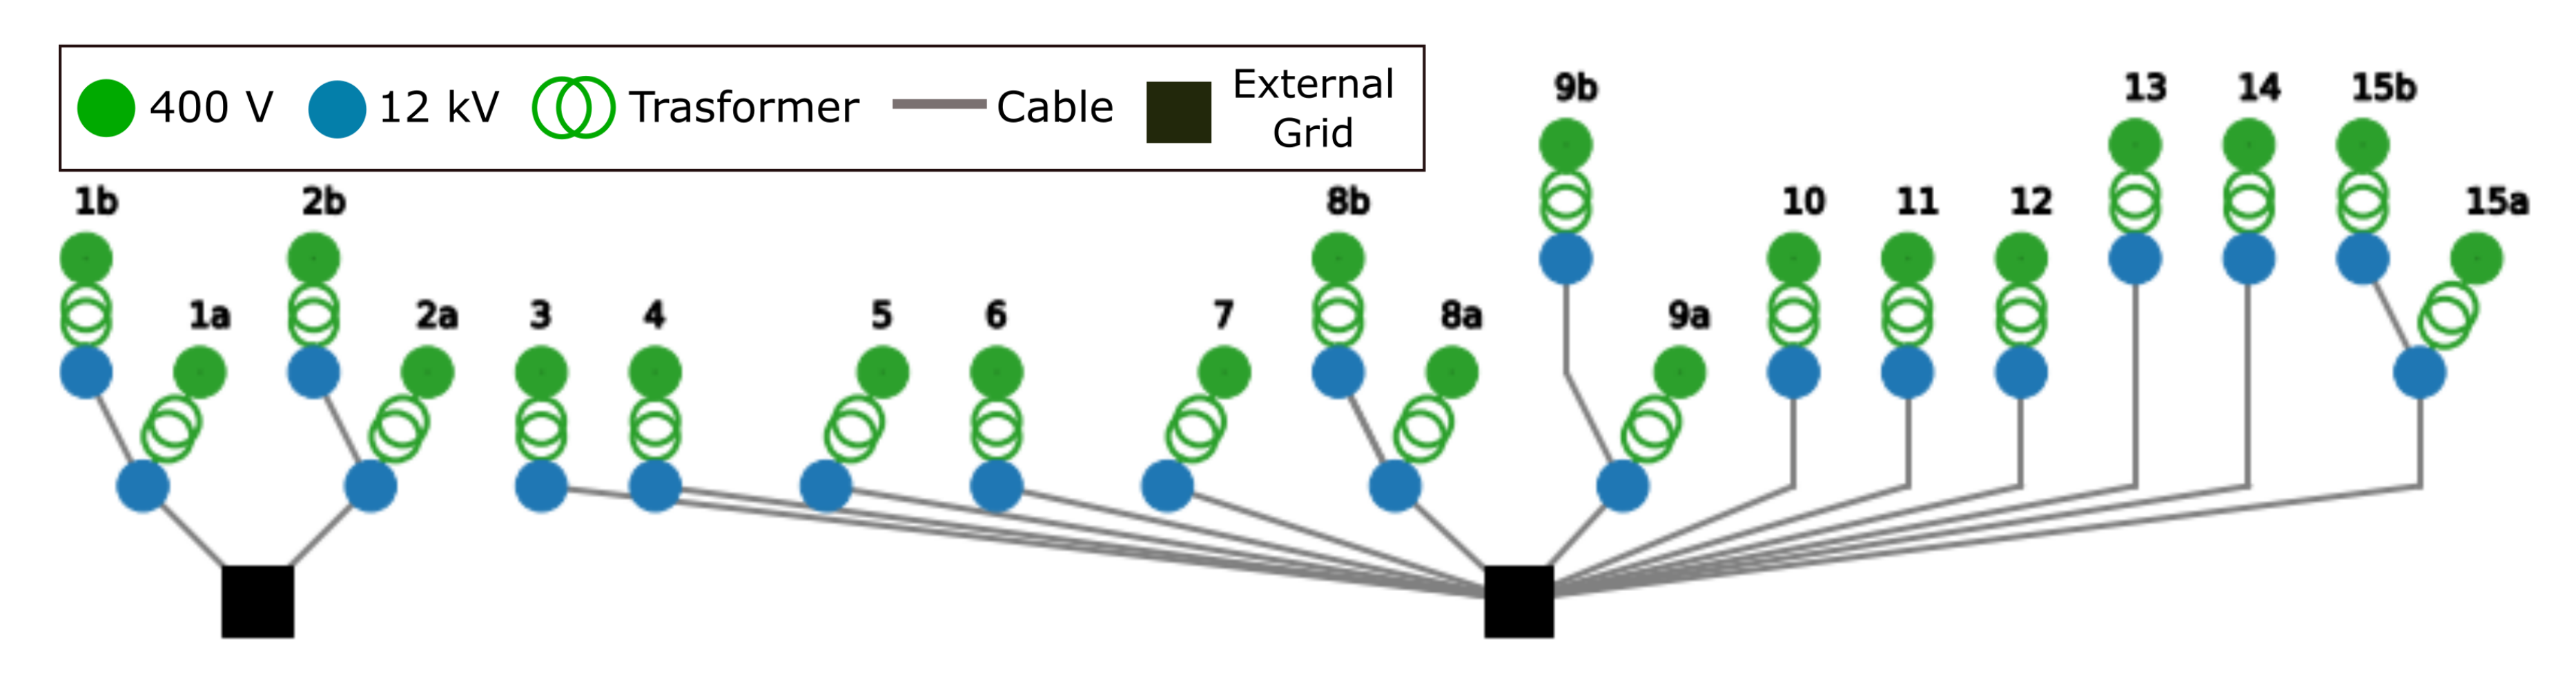
28], a python-based tool used for load flow analysis of networks. In order to make a relevant representation of the reality, the network model was developed using input data provided by the DSO concerning transformers ratings, cable properties, connected customer characteristics, system topology and hourly load measurements. In
Figure 6, the one line diagram of the power system is observed. The network is composed of 20 substations of 12 kV/400 V and 2 external feeders. Based on this system, the power flow model solves the respective nodal power balance equations and calculates the voltage levels, current flows, system losses, peak power and the overall status of the network components for different load inputs.
3.2. Electric Vechicle Load Model
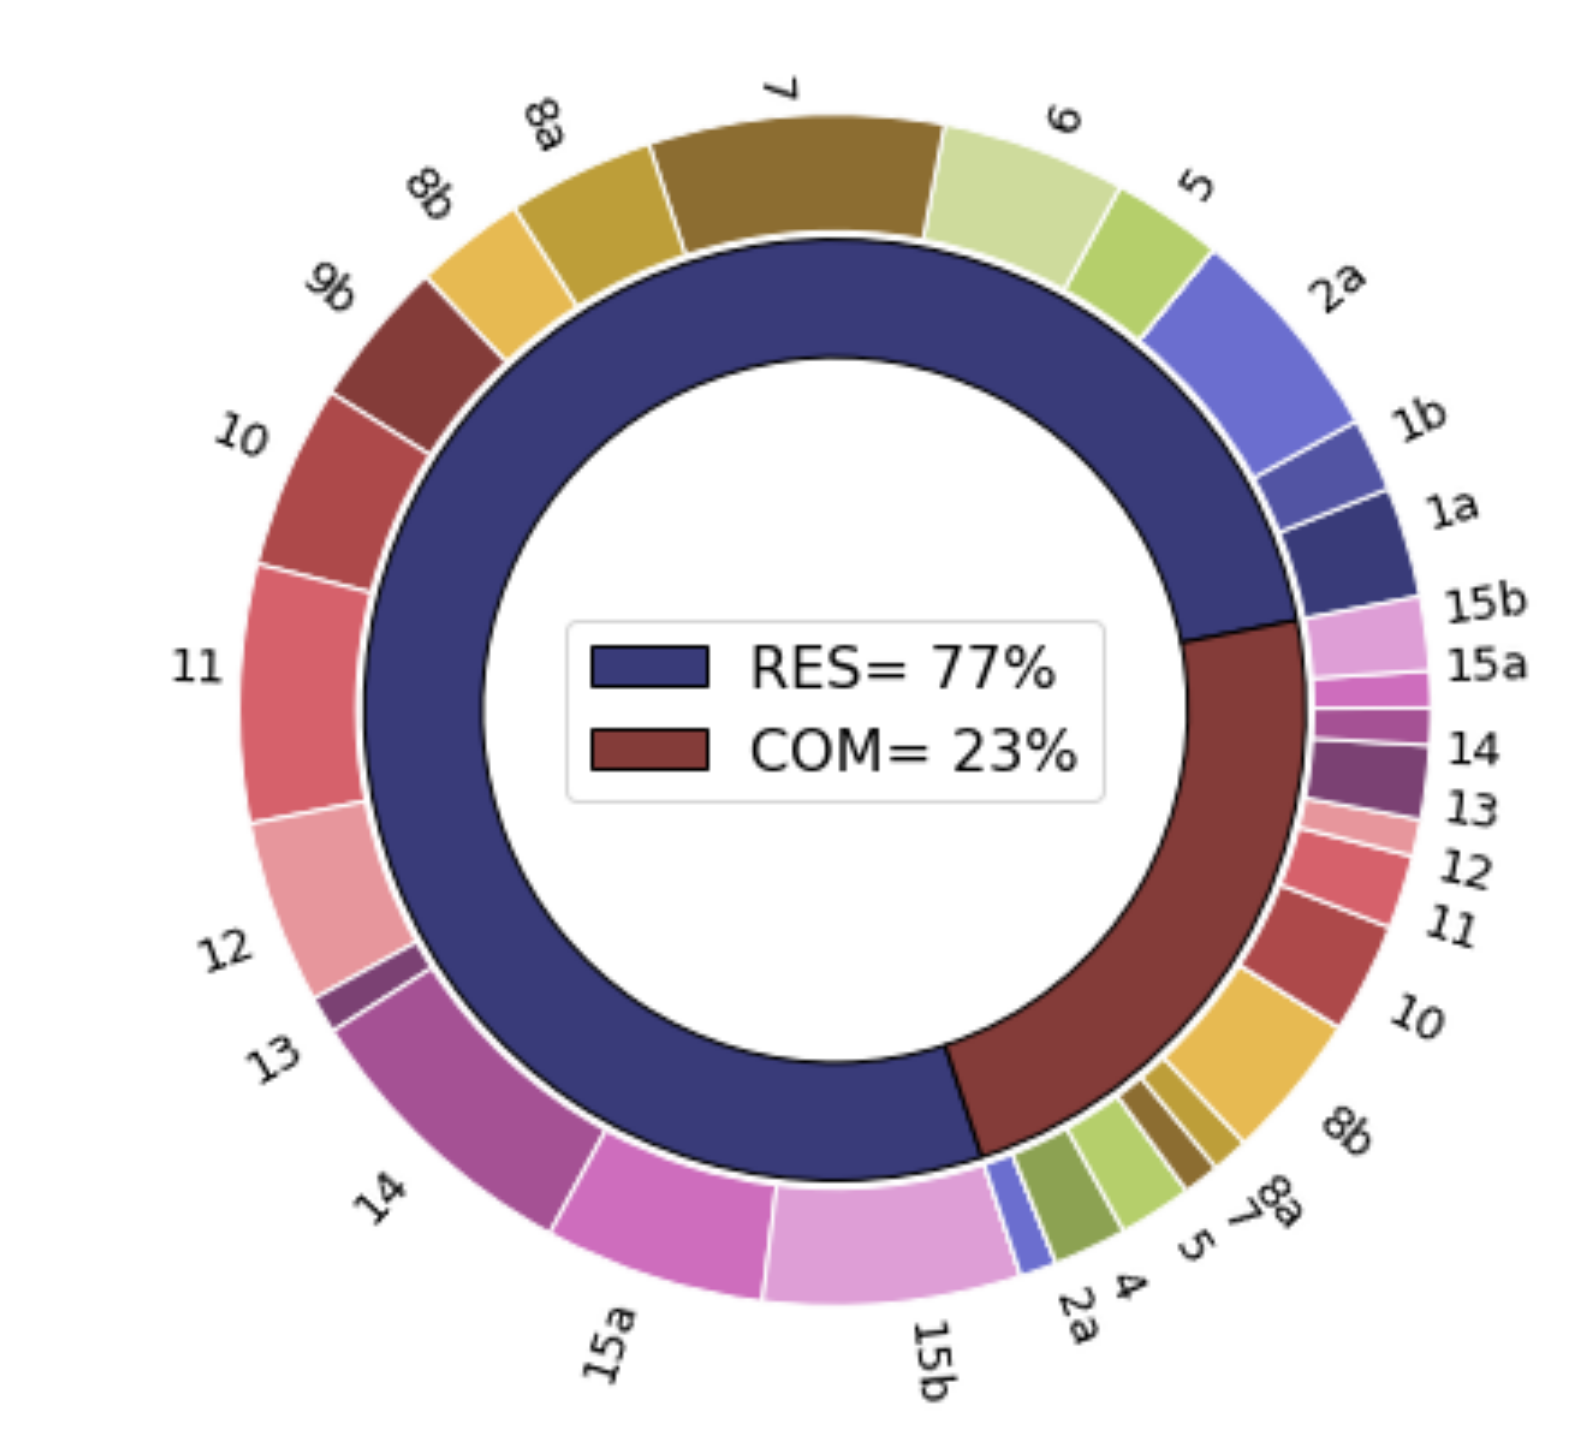
The PEV load model calculates the load profile of the electric vechicles in each substation based on their charging requirements and driving schedules. The first step is to distribute the total number of PEVs per network area, per type of activity and per type of car. In spatial terms, the PEVs are distributed among the substations based on the demand distribution of connected customers. The distribution for commercial and residential activities is also based on the shares of customer types.
Figure 7 shows the relative size of the demand per sub-area and it also categorizes their activities in terms of commercial (COM) or residential (RES). For distributing the PEVs in terms of car type (e.g., pure electric or hybrid electric) a mix representative of the market popularity of PEV models in Sweden [
26] was considered. Besides determining the car type, this last distribution serves to obtain valuable attributes such as battery size and driving range.
Once the PEVs are distributed, the next step is to take into account their driving behavior. The start of trips for a weekday was withdrawn from the national travel survey [
29] as well as the driving distances and duration of trips [
30]. In order to obtain variations in the charging profiles the driving behavior parameters were randomized for each PEV within a 10% range of the average values. It was assumed that each car performs two trips per weekday. As a consequence of the driving behavior randomization, the distance and duration of each trip is not necessarily the same. Based on this information it is thus possible to calculate the end times of each car’s trip.
Having established the driving schedule of each PEV, the next step is to translate this into charging requirements. An initial state of charge for the batteries was assumed at the start of the day for each car within a random range between 80–90%. The charging occasion of each car was determined by their activity type. Commercial PEVs charge in the window between the end of the first trip and the start of the second trip. Residential PEVs charge directly at the end of the second trip, towards the end of the day, until the beginning of trip one on the next day. Combining the driving behavior parameters with the state of charge and a charging power of 3.68 kVA (standard single phase 230 V and 16 A outlet) it is then possible to calculate the magnitude of the PEV loads and produce a charging profile for each substation.
3.3. Load Management Model
The purpose of the load management model is to control the PEV loads (
) towards fulfilling a certain objective. In order to do this, a linear programming formulation was adopted using the Gurobi optimization solver [
31] coupled with the power flow model of the network. Two load management strategies were developed: loss-optimal and cost-optimal. The loss-optimal strategy seeks to conduct the charging of the vehicles at the lowest amount of system losses, which most favourable from the DSO’s perspective. The cost-optimal strategy takes into account the electricity costs perceived by the end-users and aims to conduct the charging at the lowest possible costs for them. The objective functions and constraints considered for the strategies are presented in
Table 2.
The total system losses are calculated as the difference between the power fed into the system through the external feeders, , and the total power consumed within the system by the base loads and by the PEV loads, and , respectively. This is done considering all of the substations, , as well as the external feeders, . Moreover, as the loads are also time dependent these are added up for the entire optimized time period, T.
The total electricity costs are calculated as the sum of the electricity market price,
, and the network tariffs,
. The electricity prices were obtained from the spot price at Nordpool [
32] while the tariffs were taken from the DSO’s available subscriptions [
33]. Since there are different network tariffs to choose from, it was assumed that the entire area was subscribed to time based tariffs, in which a higher tariff applies on weekdays between 6 h to 22 h. Only the variable part of the network tariffs was accounted for, as it is the part that is subject to variations in the consumption. Also, the share of the electricity costs that is related to taxes and government fees was not included in this calculation. The two load management strategies were subject to the same set of constraints:
A peak power budget constraint in order to keep the base loads and the PEV loads within the established power limit, , defined for each scenario year,
A network infrastructure constraint to avoid exceeding the installed transformer capacity, , from each substation,
A charging energy constraint in order to guarantee that the charging requirements of the vehicles are met by the optimized PEV loads to the same level as in the business as usual (BAU) case, ,
A scheduling constraint to ensure that charging is conducted within arrival and departure hours of each vehicle. was defined as the minimum power required by the vehicles if they were to distribute their charging equally throughout their window of connection to the grid.
5. Conclusions
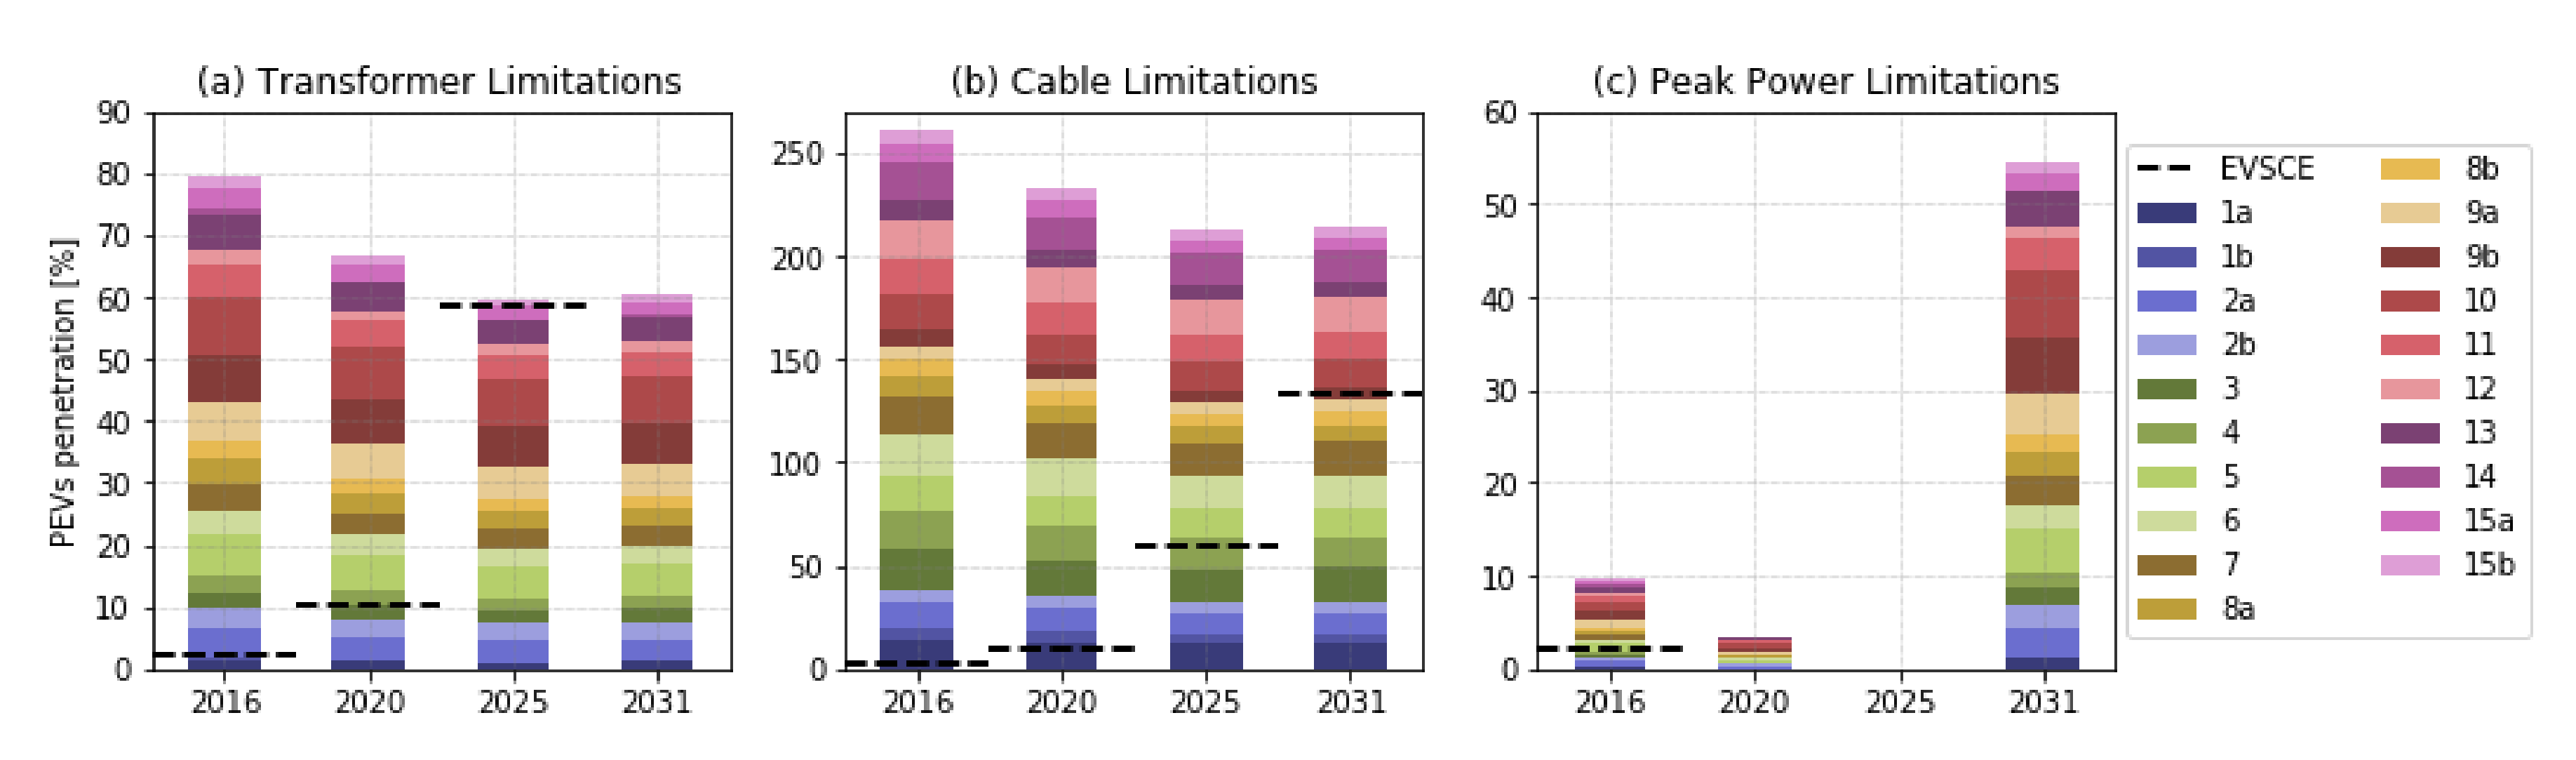
This work evaluated the impact of PEV charging loads on the distribution grid of Hammarby Sjöstad, a neighborhood located in Stockholm, Sweden. The intermediate voltage network of the neighborhood was built and power flow calculations were carried out in order to answer the question of which level of electric vehicle penetration becomes problematic for the network. This was done for different scenarios of electric vehicle penetration and base electricity demand for the coming years. The scenarios also considered the peak power limitations that currently exists in the Stockholm region by scaling down this number to an equivalent peak power budget for the district of Hammarby. Once the model and the scenarios were built, three studies were carried out seeking to answer whether the congestions in the network were due to limitations in the local infrastructure or in the external peak power capacity.
In all scenario years, it was observed that the 12 kV network cables were well sized for all the future loads. In general, it was found that peak power capacity is an earlier limiting factor than the network infrastructure. The year 2025 was identified as critical due to the peak power budget if the PEV charging loads are left uncontrolled. In the year 2031, the peak power limitations were no longer a constraint but intead the installed transformer capacity becomes problematic if the charging loads are left uncontrolled.
Based on these findings, an analysis was also made on the potential of controlling the charging loads to mitigate the negative effects on the network. The loss optimal management strategy was found to be the most beneficial for the system, due to the fact that it was able to reduce peak power, total losses and average transformer loading with regards to the uncontrolled charging. The charging costs for the users were also reduced in this strategy, however, the cost optimal strategy achieved the most significant reductions in this regard. It was observed that cost optimization focused on the user tariffs can actually inccur in increased peaks. This highlights the importance of having the right price signals that steer the loads towards the overall benefit of the system. In this regard dynamic tariffs are a focal point of future studies as well as the network status in the lower voltage network.


