Article

Energy Consumption Optimization and User Comfort Maximization in Smart Buildings Using a Hybrid of the Firefly and Genetic Algorithms

1
Department of Information Technology, University of Haripur 22620, Khyber Pakhtoonkhwa 22620, Pakistan
2
Department of Computer Science, University of Central Asia, 310 Lenin Street, Naryn 722918, Kyrgyzstan
3
Faculty of Computer Science and Information Technology, Universiti Tun Hussein Onn Malaysia, Johor 86400, Malaysia
4
Department of Computer Engineering, Jeju National University, Jeju 63243, Korea
*
Author to whom correspondence should be addressed.
Energies 2020, 13(17), 4363; https://doi.org/10.3390/en13174363
Submission received: 9 May 2020 / Revised: 5 August 2020 / Accepted: 7 August 2020 / Published: 24 August 2020

Abstract

:
This research work proposed a hybrid model to maximize energy consumption and maximize user comfort in residential buildings. The proposed model consists of two widely used optimization algorithms named the firefly algorithm (FA) and genetic algorithm (GA). The hybridization of two optimization approaches results in a better optimization process, leading to better performance of the process in terms of minimum power consumption and maximum occupant’s comfort. The inputs of the optimization model are illumination, temperature, and air quality from the user, in addition with the external environment. The outputs of the proposed model are the optimized values of illumination, temperature, and air quality, which are, in turn, used in computing the values of user comfort. After the computation of the comfort index, these values enter the fuzzy controllers, which are used to adjust the cooling/heating system, illumination system, and ventilation system according to the occupant’s requirement. A user-friendly environment for power consumption minimization and user comfort maximization using data from different sensors, user, processes, power control systems, and various actuators is proposed in this work. The results obtained from the hybrid model have been compared with many state-of-the-art optimization algorithms. The final results revealed that the proposed approach performed better as compared to the standard optimization techniques.

1. Introduction

One of the most prominent applications of technological integration with AI techniques is the conception of smart or energy-efficient buildings. The major motivational factor behind this integration is an efficient energy management system and user satisfaction inside building in terms of a minimum energy consumption and maximum user comfort index. Therefore, a trade-off is required between the indoor environmental quality (IEQ) and energy consumption in residential buildings [1,2,3]. For this purpose, an energy consumption management system is required inside the residential building that can maximize the comfort level of the occupant and minimize the power consumption. For maintaining the quality of occupants’ lives inside the building, three basic parameters: namely, indoor thermal quality (ITQ), indoor air quality (IAQ), and door visual quality (IVQ) are needed by the occupants residing in the buildings [4]. For maintaining the IVQ, the residential building uses the illumination (the lighting system) to facilitate its occupants [5]. The ITQ is represented by the temperature level of the building. In order to preserve the temperature inside the building in the occupants’ comfort zone, the residential buildings maintain a cooling/heating system. For maintaining the IAQ of the building in the occupants’ comfort zone, the system measures the CO2 concentration. The ventilation system keeps the CO2 concentration as low as possible to keep the occupants in their comfort zone inside the building [6]. These three parameters (temperature, illumination, and air quality) are considered to maintain the comfort level inside the building according to the users’ demands. Three parameters in our work to maintain the IEQ of the building depending on the users’ demands have been considered. The methodology adopted in this work followed the standard proposed by the authors in [1,2,3,7,8,9]. The authors in all of the above research works have used the air temperature as the input of the temperature parameter, because air temperature measurements are adequately easy in implementation. For reading the air temperature, the temperature sensor only reads the values, and no further computation is required.
In order to achieve an occupant’s preferred IEQ, many international standards have been followed for the last few decades. All these standards keep different parameters under consideration with their preferences. In this connection, the authors in [10] considered different variables for maintaining a user-preferred ITQ. Similarly, some other parameters have also been considered when deciding the internal environment of the energy-efficient building. For example, four parameters—namely, air quality, lighting, thermal comfort, and acoustics—were used by the authors in [11] to define the internal environment of a residential building. In addition to previously considered parameters, the ventilation system was also taken into consideration in the newly developed standard. In order to define the ITQ of a building, the authors in [12] outlined four values affecting the temperature—namely, air temperature, mean radiant temperature, air velocity, and humidity values, which will create the ITQ. The authors are also of the opinion that there are many other parameters that can be useful for defining the ITQ, but covering all of them for maintaining a standardized thermal requirement is one of the sophisticated tasks during building energy management. The internationally accepted standard for developing an IEQ is the ANSI/ASHRAE guidelines 10P, which recommend a few parameters when working with design, development, and operations of energy-efficient buildings [13]. In this standard, the ITQ, IAQ, aural, and IVQ are separately addressed. Similarly, there are some other factors affecting the ITQ that have been recommended by ANSI/ASHRAE Standard 55 [14]. The ITQ is affected by the weather variation, shading strategy, and an appropriate ventilation system. In the ISO standard 7730, different factors are identified and recommended for maintaining thermal comfort [15]. For PMV calculation, a methodology was proposed by the authors in [16] that is adequately supportive to consider different parameters when an energy management system is developed.
The firefly algorithm (FA) is a widely used metaheuristic, nature-inspired swarm intelligence technique formulated by Xin-She Yang in 2008 [17]. The significant wellspring of motivation prompting the advancement of the FA is the wonder of light emanation by fireflies. The light emitted by fireflies is used for the attraction of fireflies for their potential mate. The FA is considered to be one of the most robust, easily implementable, and simple optimization approaches, making it widely applicable for solving various types of complicated optimization problems. When the FA is used for solving optimization problems, it works in three main operational stages—namely, initial population generation stage, the position changing stage of fireflies, and the termination stage. In the starting phase, the initial population is randomly generated and evaluated for getting the most optimal solution for the given problem. At the firefly position changing stage, this population is updated using a factor known as the randomization factor. The termination stage is used for ending the operational procedure of the FA.
Two phenomena—namely, exploration and exploitation—are used for defining a well-established solution search space suitable for obtaining the optimal solution of the problem. The process of exploration is considered for determining new solutions, thus expending the solution search space to cover more solutions, whereas exploitation is used for focusing on the nearby locations close to the solution found so far. In order to enable the solution search space of the standard FA as an efficient one, there must be a balanced relationship between the exploration and exploitation of the solution search space, i.e., the solution search space should be neither too explorative nor too exploitative. If the exploration and exploitation have an imbalanced relationship, the algorithm will finally fail to get the best optimal solution of the problem. In this scenario, some further processing is required to achieve the desired goal. In the proposed approach, the properties of the genetic algorithm (GA) have been considered to carry out the further optimization process to get the required result. The GA possesses rich operators called selection, mutation, and crossover operators for balancing the exploration and exploitation of the solution search space [18].
In this paper, a hybrid firefly algorithm based on the GA algorithm has been proposed for the performance of a conventional firefly algorithm. In the proposed model, the FA is run for a fixed number of iterations to obtain the optimal solution of the energy optimization problem. It is observed that the solution quality is not improved after running the standard FA for a limited number of iterations, and the solution obtained is not the most optimal solution. In order to further improve the optimization process, the GA is embedded after the termination stage of the standard FA. A significant amount of improvement has been observed in the solution quality by introducing the GA after running the FA for a few iterations.
The organization of the structure of the remaining paper is carried out as below. Section 2 gives a detailed view of the literature study and related work, and Section 3 presents the proposed work, while Section 4 consists of the implementation and experimental results, with a detailed discussion. In Section 5, the paper is concluded. The abbreviations with their corresponding descriptions are itemized in Table 1.

2. Literature Review

Previously, several research studies have been conducted. Various types of energy consumption resources, their consumption, and different parameters worth consideration for the occupants have been explored by researchers. For example, the authors in [19] introduced an equation-based system for energy efficiency management, intelligent buildings modeling, simulation, and power consumption optimization in smart buildings. These equation-based systems are used for declaring the relationship among various variables that play roles in any form in energy-efficient buildings. These systems make use of computational algebra for enabling simpler architecture of the buildings for generating efficient and effective codes in order to perform simulations and the process of optimization. The authors applied the idea to different microgrids, a few buildings, some controllers used for controlling the temperature of the buildings, interactive inverters for maintaining the power quality, and HVAC systems. The systems were found to be efficient in obtaining the desired goals. Similarly, a multiagent control system based on information fusion has been proposed by the authors in [20]. In order to control and manage the energy inside the buildings, they used to order weighted aggregated averaging aggregation. The proposed approach maximizes user comfort and minimizes power consumption. There are many internal and external factors influencing user comfort inside the buildings. All these factors have some strong relationship to affect the occupants of the building. A model was proposed by the authors in [21] for understanding this relationship to keep them under consideration when developing some energy and user comfort-related approach for residential buildings. Both the indoor and outdoor environmental factors have been considered by the authors in [22] for managing the user comfort and power usage management system. For efficient energy management systems, different types of classification, prediction, and optimization models and techniques have been presented in the literature. The authors in [23] developed an energy management system for providing the user comfort in the buildings connected to microgrids. The model was developed for balancing the consumption and production of the energy by different power-generating resources. The developed system takes into account the amount of energy generated by various power-generating sources, providing it to the buildings and, at the same time, maintaining user’ comfort, according to the requirements. Similarly, an efficient algorithm was proposed by the authors in [24] for management of the demand response and thermal comfort optimization in an environment facilitated with renewable power sources and storage devices. The authors targeted two major issues present in the literature, focusing on energy consumption and occupant satisfaction. The first issue resolved by the authors was the integration of power generation and consumption with the user behavior and guaranteeing the user thermal comfort. The second issue targeted was to develop a robust and scalable demand response system. A multi-objective simulation-based multi-objective optimization problem was solved by the authors in [25] by proposing a model based on the particles swarm optimization algorithm. For enhancing the performance of a building energy management system, the authors applied a single-objective and multi-objective particle swarm optimization (PSO) and coupled it with EnergyPlus simulation software. In order to evaluate the performance, effectiveness, and capability of the proposed model, it was applied to single-room architecture in which various types of building management parameters were considered that can affect the energy consumption, and four major climate areas in Iran were selected for testing. In the optimization process of the approach, multi-criterion and single criterion optimization analyses of yearly based cooling/heating systems and lighting system power consumptions are tested for understanding the relationship between the annual energy consumption minimization and the objective function. In the same manner, a simulation-based system, in combination with the genetic algorithm, was used by [26] for a multi-objective optimization process in which the benefit of power consumption was maximized and the thermal discomfort was minimized. In a similar attempt, the genetic algorithm was applied by the authors in [27] for a multi-objective optimization problem in which the energy consumption was minimized and the user thermal comfort was maximized. In order to improve the prediction power of the neural network, the authors also applied the GA, and then, the thermal comfort and the energy consumption were predicted. Lastly, the authors established a multi-objective building using the GA and neural network for the optimization process. Similarly, single-objective and multi-objective optimization models were developed by the authors in [28] using the nondominated sorting genetic algorithm. The inputs of the system were different environmental parameters, including weather data, lighting system, renewable energy management parameters, cooling/heating load, and the occupancy schedules. The output of the optimization process is the optimal energy system design and the user-preferred environment. In a similar fashion, the nondominated sorting genetic algorithm was used by the authors in [29] for minimizing the visual and thermal discomforts. Different types of building parameters were considered in the proposed work, e.g., the locations of the buildings, geometry of the buildings, volume of buildings, number of rooms, and types of rooms. An approach was developed by authors in [30], focusing on energy efficiency and the management of smart or energy-efficient buildings. All of the energy management systems were divided into four categories—namely, building space, lighting system, HVAC systems, and occupancy and comfort management systems. Similarly, the authors in [31] used deep reinforcement learning for the energy optimization in buildings. Different types of energy resources and consumption appliances were considered in the work.
Shimin Li et al. [32] proposed another stochastic optimization approach known as the slime mold algorithm (SMA) in light of the oscillation method of slime mold in natures. In that particular research work, they introduced few novel features, utilizing a remarkable numerical model dependent on adaptive weights so as to mimic the way toward creating positive and negative inputs of sludge form waves during spreading. The incitement has been controlled with the assistance of a bio-oscillator for producing the ideal way for associating food with a great exploratory capacity and exploitation affinity. They led broad, similar trials of proposed SMA with a few metaheuristic approaches utilizing a lot of benchmark functions to confirm its productivity. Furthermore, they utilized four smart building problems to approve the adequacy of the algorithm in severe optimizing problems. The conclusive outcomes introduced in various tables and figures demonstrated that the proposed SMA is a new enhancement procedure on various search landscapes. In [33], the authors presented another improved algorithm, named the equilibrium optimizer (EO). The EO is propelled by the control volume mass equalization models, which were utilized to evaluate both the dynamic and balanced states in material science. In their proposed EO approach, every particle is considered as a single solution, and its position is referred to the concentration of these particles while acting as a search agent. The positions are randomly updated for the current-best solutions by the search operators and named equilibrium candidates. At the point when the last best particle from the equilibrium candidates reaches the balanced state, it is then considered as the ideal output. An unmistakable “generation rate” term is demonstrated to help the exploration and exploitation capacity of the EO for the evasion of nearby minima. The authors in [34] introduced Henry Gas Solubility Optimization, a novel material science-based approach that imitates the conduct of Henry’s law. This work is being roused by the Henry’s law of dissolvability, which demonstrates that “on a steady temperature, the particular measure of a gas which dissolvable in a particular volume and sort of fluid is directly proportional to the partial pressure of that gas in equilibrium with that fluid”. The exploratory outcomes led from 47 optimization problems and the CEC’17 test suite with three engineering design problems uncovered that Henry Gas Solubility Optimization (HGSO) focuses on a harmony between exploration and exploitation capacities of the search space, which avoids the problem of local optima.
The firefly algorithm (FA) is one of the most recently introduced metaheuristic, nature-inspired swarm intelligence techniques formulated by Xin-She Yang in 2008 [17]. The light emitted by fireflies is used for the attraction of fireflies for their potential mate. The FA is one of the most robust, easily implementable, and simple optimization approaches, making it widely applicable to solve different types of complicated optimization problems.
There are a few major drawbacks associated with all the previously proposed optimization algorithms applied for the energy optimization and management in residential buildings. Firstly, most of them are used in their standard operational working mechanisms. This independent working characteristic of most of the optimization models makes them weak in handling the parameters from the environment, as well as from the user, leading to an inefficient energy management and optimization process. Secondly, the optimization algorithms are suffering from an imbalanced relationship between the exploration and exploitation capabilities of the solution search space that leads to their failure in getting the most optimal solution of an optimization problem. Due to this property, most of the proposed approaches for the energy optimization process have not been successful in achieving minimum power consumption and maximum user comfort. Lastly, some optimization algorithms have been used in their enhanced, modified, or in hybridization with other optimization algorithms; their complexities increase adequately due to their sophisticated operations in the introduction of modifications or embedding other algorithms’ characteristics. In order to overcome all of these drawbacks, a new, simple, and efficient model is proposed in this work. The newly developed model is a hybrid of two optimization algorithms—namely, the FA and GA. The hybridization process makes the model more powerful in minimization of the power consumption and maximization of the user comfort as compared to the independent and conventional optimization techniques. A balanced relationship between the exploration and exploitation capabilities of the solution search space of the standard FA has been achieved by embedding rich operators of the GA used for exploration and exploitation, making it powerful in order to get the minimum power consumption and maximum user comfort. Lastly, the proposed model is easy to implement, because both the FA and GA are easy in terms of integration, running, development, and parameter tuning. The detailed description, working procedure, components, and complete structure of the proposed approach are given in various sections of this paper.

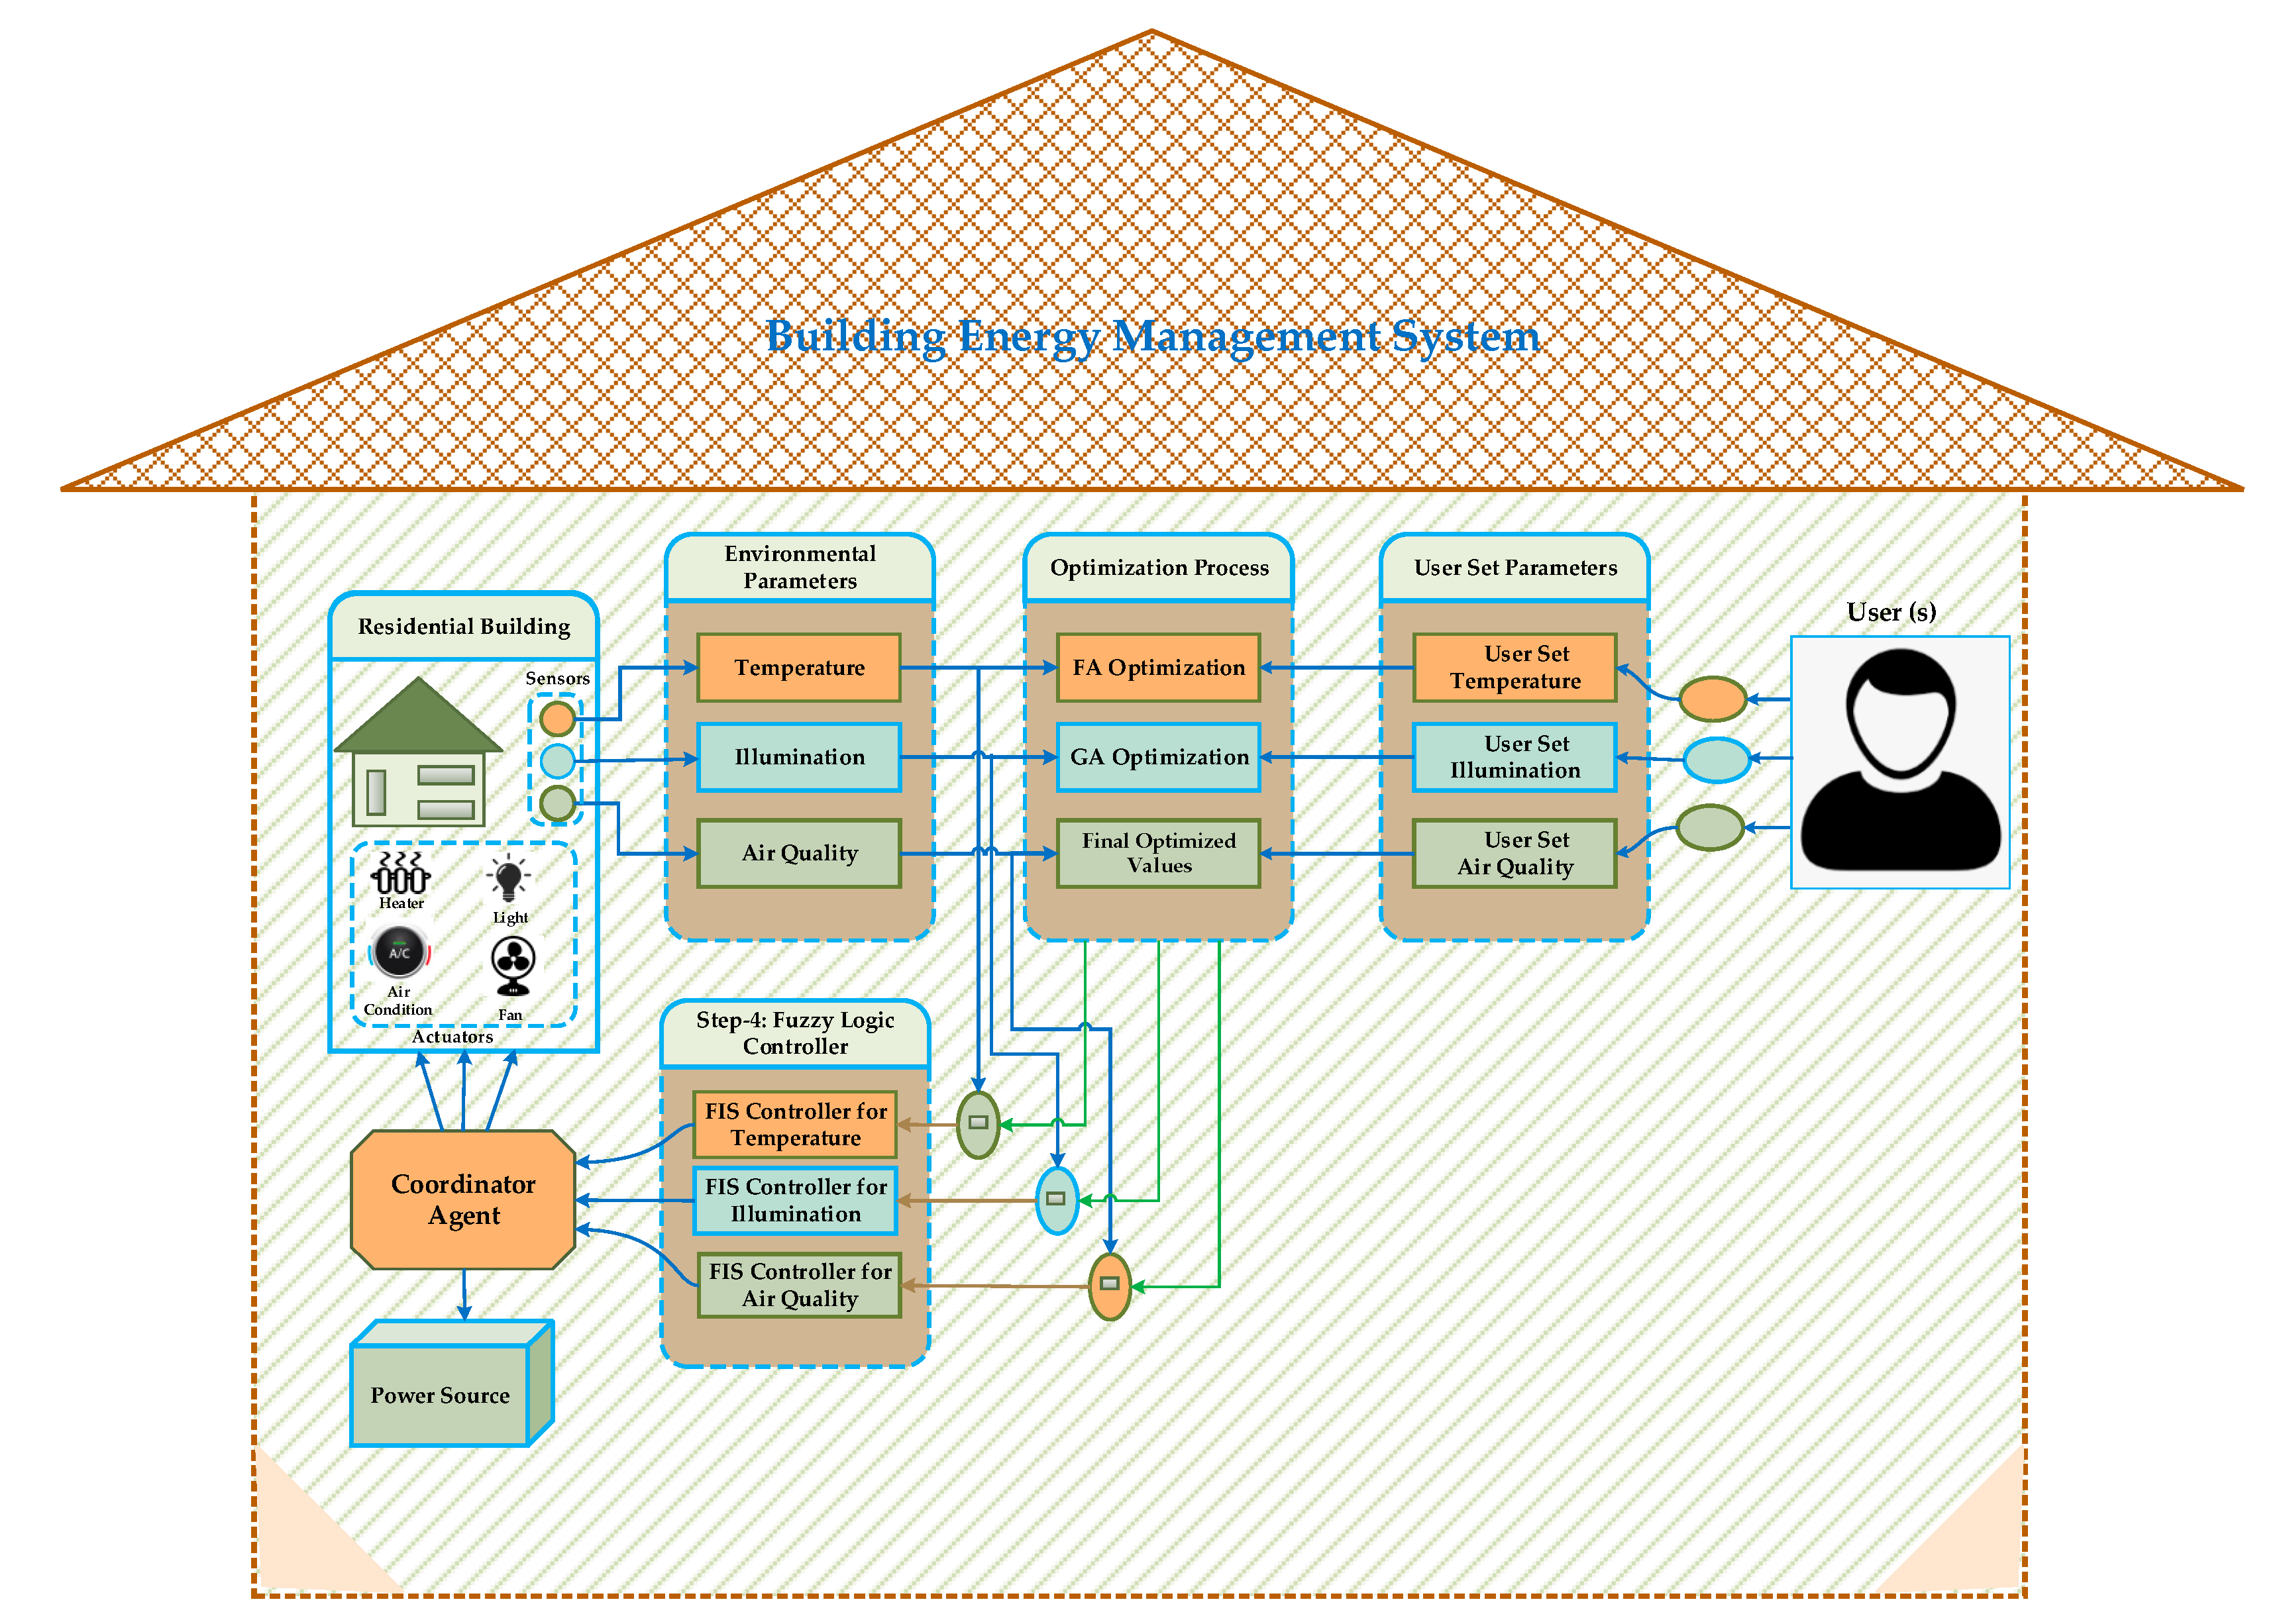
3. Proposed Approach

In this work, a hybrid approach of one evolutionary intelligence (EI) technique and swarm intelligence (SI) technique is used for energy consumption reduction and increasing the user comfort level in smart buildings. The proposed hybrid model named FA-GA, as it is a blend of an SI technique known as the firefly algorithm (FA) and EI approach called the genetic algorithm (GA), is illustrated in Figure 1. This is a multi-objective optimization approach used to minimize the power consumption and maximize the comfort of the user. The major aim of this model is to blend the fitness functions of the FA and GA to the energy consumption optimization function. The optimization function considered in this research work is used to minimize the power utilization and maximize the level of comfort of the user.
In the proposed hybrid model, the two techniques are applied in a serial fashion. In this manner, the parameters that are used in the optimization module enter the first optimization algorithm—namely, the FA, in this case. After the optimization is performed by the FA, the parameters enter the second algorithm—namely, the GA, in this case, for further improving the optimization process. In this work, three parameters called temperature, illumination, and air quality are taken into account that come from the corresponding sensors and are given as inputs to the first optimizer, named the FA, and then the second optimizer, named the GA. All the parameters used in this work follow the standard adopted by the authors in [1,2,3,7,8,9]. The authors in all of the above research works have used the air temperature as the input of the temperature parameter. After the optimization is performed by the FA-GA hybrid optimization model, the error difference between the newly optimized parameters and the environmental parameters is computed. This error difference is in turn used to calculate the user-preferred indoor environment. In order to provide the required environment to the occupants, the fuzzy controllers are used. The fuzzy controllers take the error difference as the input and generate the required power necessary for changing the status of the actuators as the output. There is a power controller that directs the internal or external power source to provide power to the actuators to change their status according to the power generated by fuzzy controllers.

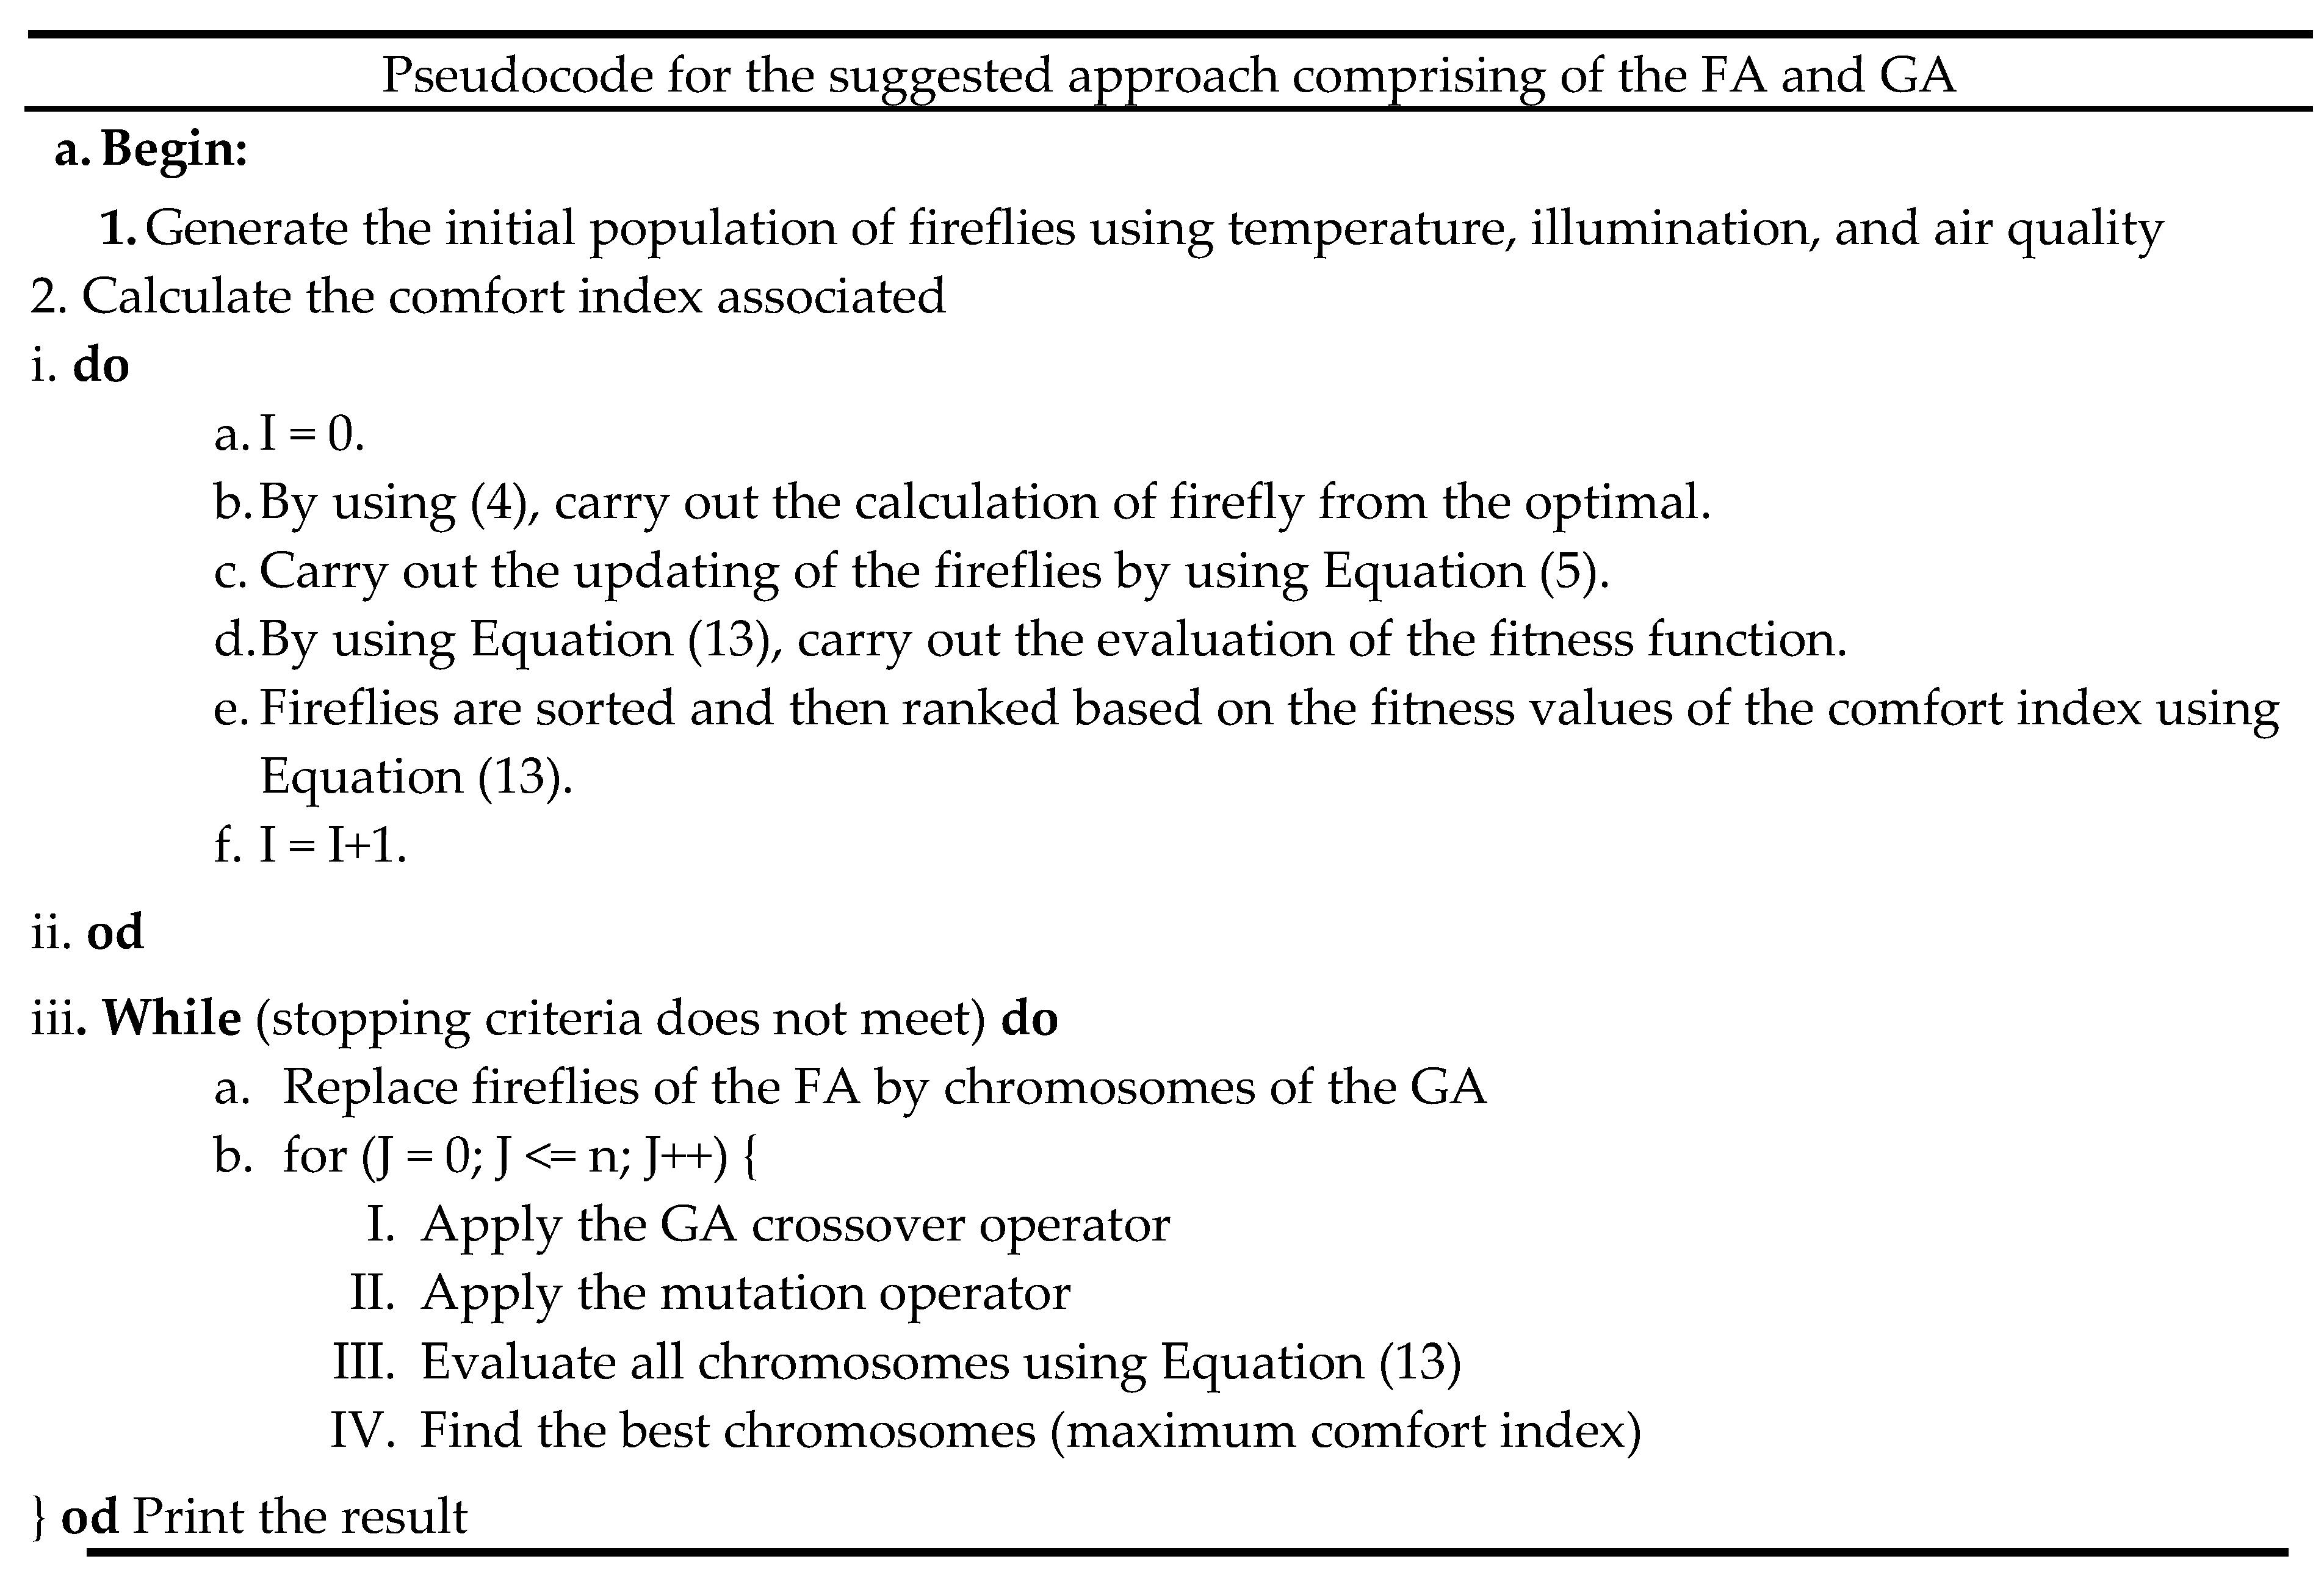
3.1. Proposed AI Algorithm

The major and the most complicated part of the proposed energy management efficiency system is the reduction process of the energy utilization and increasing the occupant’s comfort level, which is considered as a multi-objective optimization problem. Two powerful AI optimization algorithms—namely, the FA and GA—have been considered for improving the energy optimization process; therefore, this proposed algorithm has been given a name as the FA-GA model. The motivation behind using the combination of these two algorithms is the fact that only one technique is not able to perform the complete optimization process and finds difficulty in finding the most optimal value of the problem. The objective function or the fitness function used in this process is given in Equation (13) and is associated with the light intensity in Equation (1). The parameters differences are used for making fireflies, whereas the comfort index value is associated with each firefly-emitted light intensity. The initial solution search space is randomly generated using these input parameters, and the solution for each member of the initial population is calculated, which represents the comfort index for each combination. At the second stage of the standard FA, the solutions generated in the initialization stage are updated using the firefly position changing stage, for which the FA uses Equations (3)–(5). The whole mathematical representation of the FA is outlined in Equations (1)–(5). Based on the rules of light in physics, the light intensity released by any single firefly, I (r), from a distance r with the firefly can be calculated using Equation (1).
I   ( r ) = I 0 r 2
where I0 indicates the light intensity emitted at the light source point. In such a case, γ is the absorption coefficient of the medium, I is the light intensity from distance r, which is then calculated by the Equation (2).
I = I 0 e x p ( γ r 2 )
In such a case, r is the distance between the light source point and the observation point of light. The light intensity here can be correlated with the attractiveness within the fireflies of the FA, which is calculated by Equation (3).
I = β 0 e x p ( γ r m ) ( m 1 )
In here, β0 is the attractiveness at the distance r = 0. While the separation between two fireflies’ xi and yj is the Euclidean distance that can be calculated by Equation (4).
ij = | X i Y j | k = 1 d ( x i , k y j , k ) 2
For every generation, the firefly position can be changed based on Equation (5).
X i = X i + β 0 e x p ( γ r ij 2 ) ( X i Y j ) + α ε
while α is the randomization parameter, ε represents a Gaussian distribution-based generated random number. The randomization factor is used for controlling the solution search space.
After the FA is run to predefined iterations, the GA is applied for a further optimization process. The switching of the optimization process from the FA to GA consists of a few technical steps. The firefly of the FA becomes the chromosomes of the GA, whereas the error differences of all the parameters make the genes of the GA. The GA takes a start from the solution search space generated by the FA in its maximum number of iterations and further continues its processing in the standard normal GA operational steps. The further optimization by the GA takes place in the following stages:
  • An initial population is created for the GA using the standard FA population.
  • The fitness function for user comfort is computed using Equation (13).
  • The best individuals are selected using Roulette wheel, Rank, or tournament selection. In our work, rank-based selection was used.
  • One-point crossover of the selected individuals is performed.
  • Offsprings are generated after the crossover.
  • The mutation operation is performed.
  • The above steps are repeated for the specified number of iterations.
  • When the termination criterion is met, the best-fitted chromosomes are selected.
  • The best chromosomes obtained represent the value of the maximum comfort index.
The proposed approach comprising of the FA and GA is shown in Figure 2.

3.2. Comfort Index

The indoor comfort environment of the building is computed using different parameters under consideration. The occupant’s comfort is calculated similar to [1,2,3]. This is the overall comfort inside building in the defined range of [0, 1] where 0 represents lowest comfort level and 1 being the highest comfort. The indoor comfort is subjective in nature depending on user preferences. The overall comfort is the blend of three sub-comforts known as temperature, illumination and air quality comforts. In order to compute comfort of each parameter, first their discomfort is calculated as explained by [30] and given by following equations. The temperature discomfort is given by Equation (6).
Discomfort T = ( T T s T s ) 2
where T is the environmental temperature, and T s is the user-set temperature.
Similarly, the illumination discomfort is given by Equation (7).
Discomfort I = ( I I s I s ) 2
where I represents the environmental illumination, and I s represents the user-set illumination.
In a similar fashion, the air quality discomfort can be computed by Equation (8).
Discomfort A = ( A A s A s ) 2
where A shows the environmental air quality, and As represents the user-set air quality parameter value.
In accordance with the discomforts, the comforts associated with temperature, illumination, and air quality are given by Equations (9)–(11).
Comfort T = 1 Discomfort T
Comfort I = 1 Discomfort I
Comfort A = 1 Discomfort A
Using Equations (9)–(11), the overall indoor environment comfort is given as in Equation (12):
CI = i = 1 n p r r i   ( Discomfort i )
where i = 1 to n = 3 for the three parameters.
Based on the above computations, the overall comfort index is computed using Equation (13) [30].
CI = p r r 1 [ 1 ( e r r 1 T u ) 2 ] + p r r 2   [ 1 ( e r r 2 I u ) 2 ] + p r r 3   [ 1 ( e r r 3 A u ) 2 ]
where CI represents the user comfort level index. e r r 1 , e r r 2 , and e r r 3 are the user-set parameters for the three parameters, respectively, and p r r 1 + p r r 1 + p r r 1 = 1. e r r 1 , e r r 2 , and e r r 3 are the differences between the user-defined parameters and environmental parameters. The maximum value of CI is 1. Tu is the user-set temperature, Iu is the user-set illumination, and Au is the user-set air quality value. After the computation of comfort, the required power for maintaining the comfort is supplied by the controller agent. The total power required is the combination of the electric power required for the three parameters, as shown in Equation (14) [30].
E T O T A L = E T + E I + E A
where
  • E T O T A L = total required power,
  • E T = power required for temperature comfort,
  • E I = power required for illumination comfort, and
  • E A = power required for air quality comfort.
It must be kept under consideration that ETOTAL E m a x , where E m a x is the maximum power that is provided by the power source. In order to achieve the required temperature, illumination, and air quality comfort, the fuzzy controllers are used. The coordinator agent uses the outputs of the fuzzy controllers to change the statuses of the actuators concerned. According to the authors of [7], the power required for maintaining the temperature ( E T ), illumination ( E I ), and air quality ( E A ) comfort is given by Equations (15)–(17), respectively.
ET = 5.655 ∗ T + 2.961
where T represents the errors of the user-set and the environmental temperature values.
Similarly, the power required for the illumination comfort is given by Equation (16):
EI = 4.428 ∗ sin (0.9603 ∗ I − 0.4234)
where I represents the error between the user-set and the environmental illumination values.
Similarly, the power required for air quality comfort is given by Equation (17):
E A = 0.944 e ( A 1163 389 ) 2
where A represents the difference between the user-set and the environmental air quality values.
After the process of optimization, the comfort index is computed. The parameters obtained after calculating the comfort index are entered as inputs to the fuzzy controllers, which, in turn, change the statuses of the actuators accordingly to provide a user-preferred environment inside the building. The details of fuzzy controllers are given in the following sections.

3.3. Fuzzy Controllers

The initial concept of fuzzy has been proposed by Zadeh, L.A. at California University [1]. Fuzzy controllers use the concept of fuzzy logic, which gives a new representation to the set theory in which an element can belong to a set of values with some membership functions instead of a few fixed numbers of classes. It uses the concept of inferential rules and the elastic category to deal with uncertainty in the representation of values. In order to reduce the distance between human representation for a problem and the numerical computer representation by a computer system, fuzzy logic control is used, which is implemented in fuzzy controllers. The fuzzy logic control allows dynamic modeling and the description of the controller in terms of simple language statements. There are many reasons that make fuzzy controllers advantageous over the traditional techniques. The first reason of using fuzzy logic instead of traditional controllers is that, in the case of the latter one, there is no proper way of quantitatively refining the parameters by tuning. The controller’s parameters can be properly tuned if the system is built on the concept of simple language representation. The second reason of using a fuzzy control system is that it can be used to achieve the quantitative control of a nonlinear system very easily. In our proposed system, the fuzzy controllers have been used because all three parameters—namely, temperature, illumination, and air quality—cannot be handled using the traditional representation of values. The cooling/heating system, lighting system, and ventilation system have been managed using the fuzzy controllers due to the advantages associated with the fuzzy controllers discussed in this section.
In the proposed system, fuzzy controllers have been used for calculating the energy requirements of each environmental parameter for maintaining high-quality user comfort by controlling the corresponding actuators. Resultantly, several generalized functions were formulated to fulfill the requirements of each subsystem. The function has been used for comparing the power determined by the coordinator agent to adjust the amount of energy used. The coordinator will compare the energy demand of each actuator with the available energy present in the energy resource. If the required energy is available, it is supplied to the actuators to maintain a high level of comfort. If a sufficient amount of power is not available, then it is brought from the external resource of energy. The major purpose of the fuzzy controllers is to provide the energy demand required for changing the statuses of the actuators based on parameter differences between the user-set values and the environmental values. This difference is converted to energy by applying fuzzy rules. For each of the fuzzy controllers, the inputs and outputs are described in detail in the following sections.

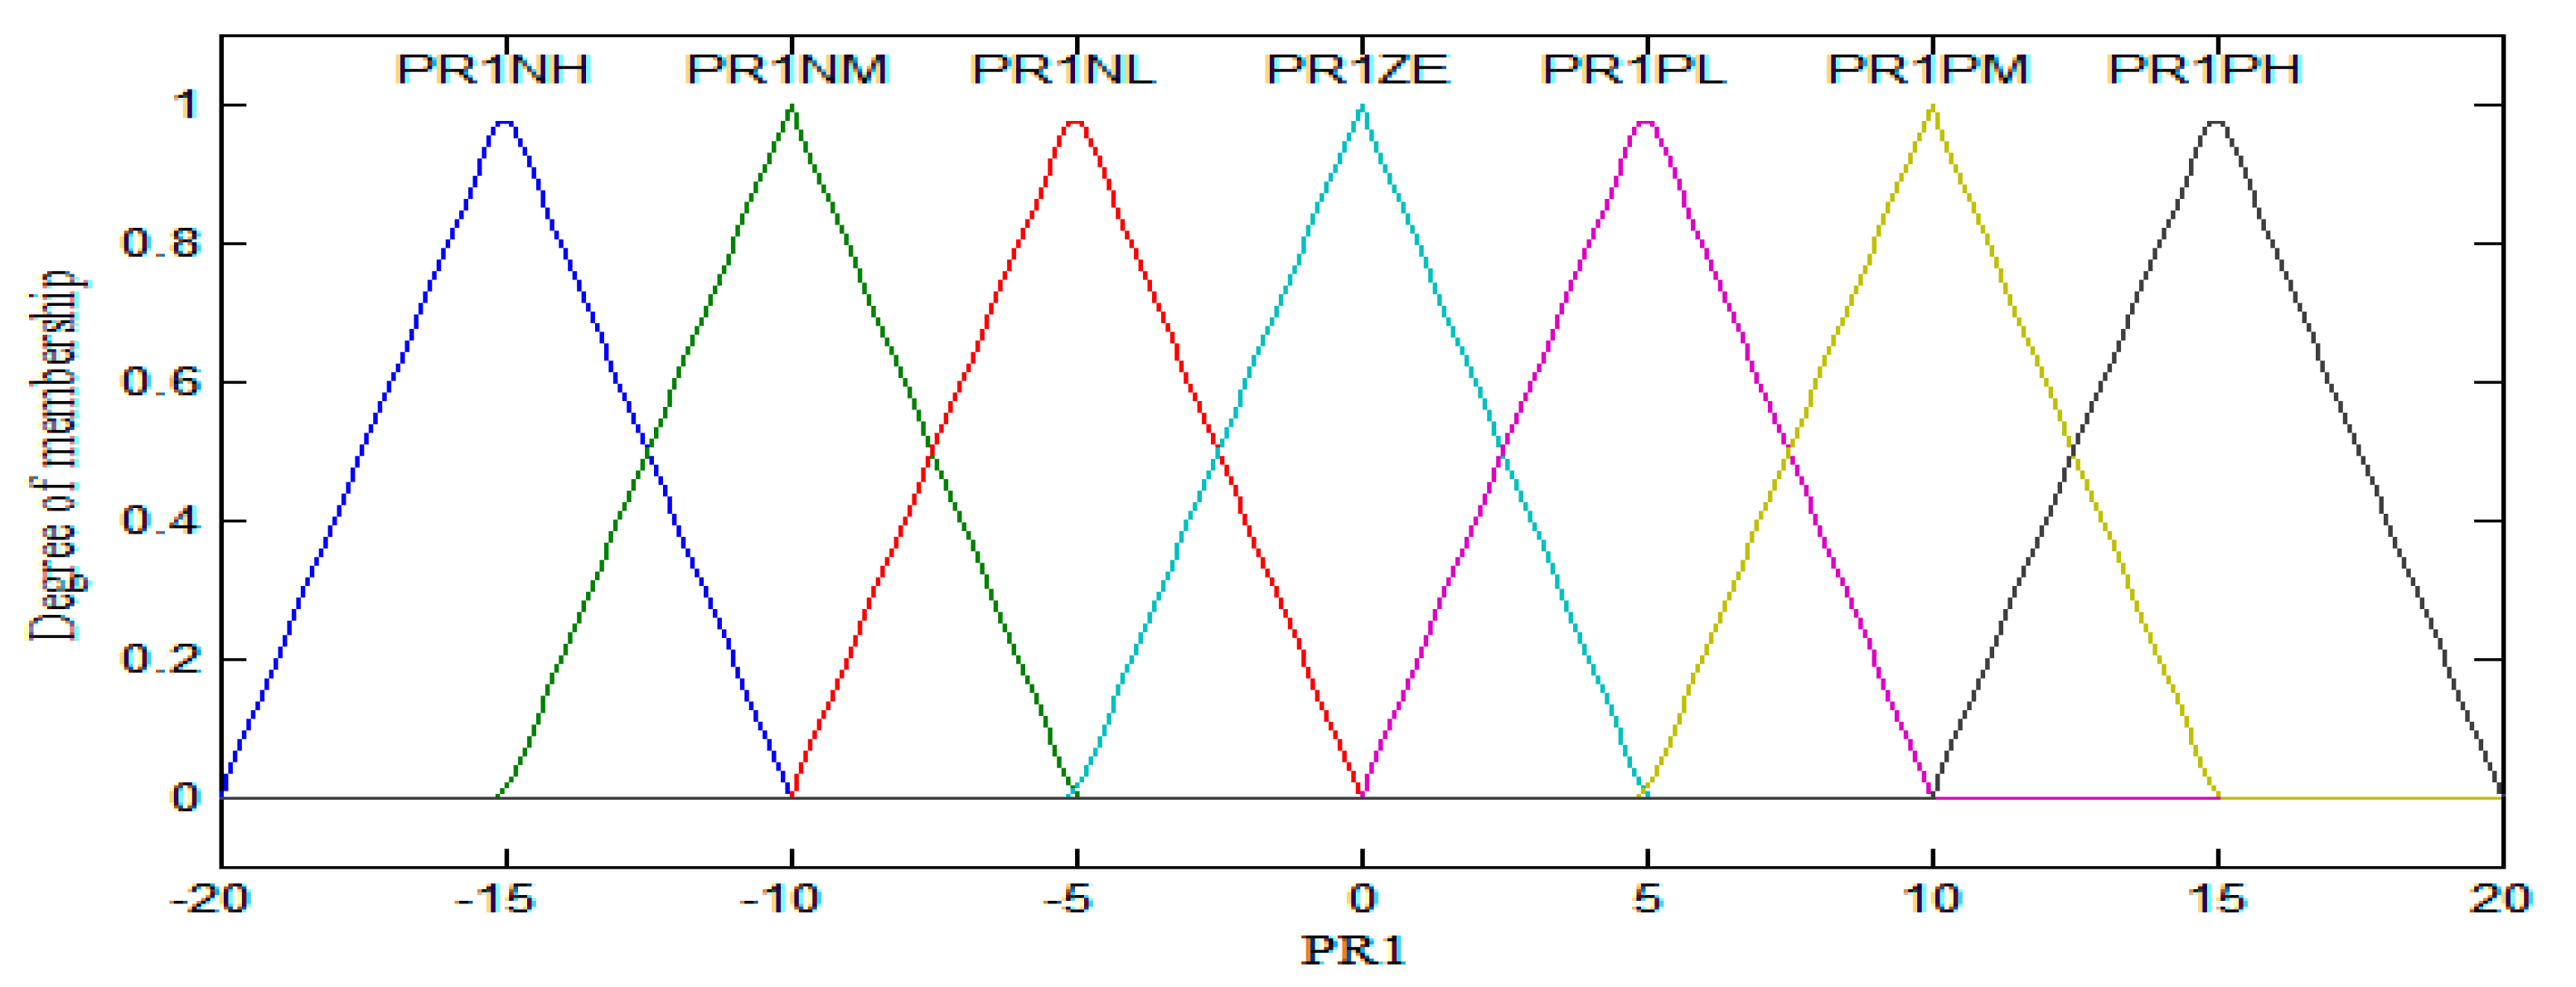
3.3.1. Temperature Fuzzy Controller

The temperature fuzzy controller takes the error difference between the environmental temperature and the optimized temperature as inputs and generates the power as the output, which is then used to change the statuses of the actuators according to the user-preferred values. The temperature fuzzy controller inputs and outputs are given in the following rules:
  • If ( e r r 1 = = NH), then P R 1 = PR1NH
  • If ( e r r 1 = = NM), then P R 1 = PR1NM
  • If ( e r r 1 = = NL), then P R 1 = PR1NL
  • If ( e r r 1 = = ZE), then P R 1 = PR1ZE
  • If ( e r r 1 = = PL), then P R 1 = PR1PL
  • If ( e r r 1 = = PM), then P R 1 = PR1PM
  • If ( e r r 1 = = PH), then P R 1 = PR1PH
In the above rules, err1 is the error between the external environmental temperature and the FA-GA-optimized temperature calculated by Euclidean distance, and PR1 represents the output power generated for controlling the actuator status. The output difference is the error, and it will be an input to the temperature fuzzy controller. Based on that output error, the energy PR1 (required power 1) will be generated by the temperature fuzzy controller for providing it to the heating and cooling actuators. NH is the least output error for the external environmental temperature and FA-GA-improved temperature, tailed by NM, NL, ZE, PL, PM, and PH. Therefore, it can be moved from NH towards PH while the difference increases and vice versa. Similarly, the desired power ( P R 1 ) for a heating and cooling controlling system is the least ( P R 1 = P R 1 N H ) for the error difference NH and the highest error difference P H , i.e., P R 1 = P R 1 P H . So, PH is the least error difference between the external environmental temperature and the FA-GA-optimized temperature. While P R 1 N H is the least power required for the heating and cooling system, and PR1PH is the highest power required for the heating and cooling system control.

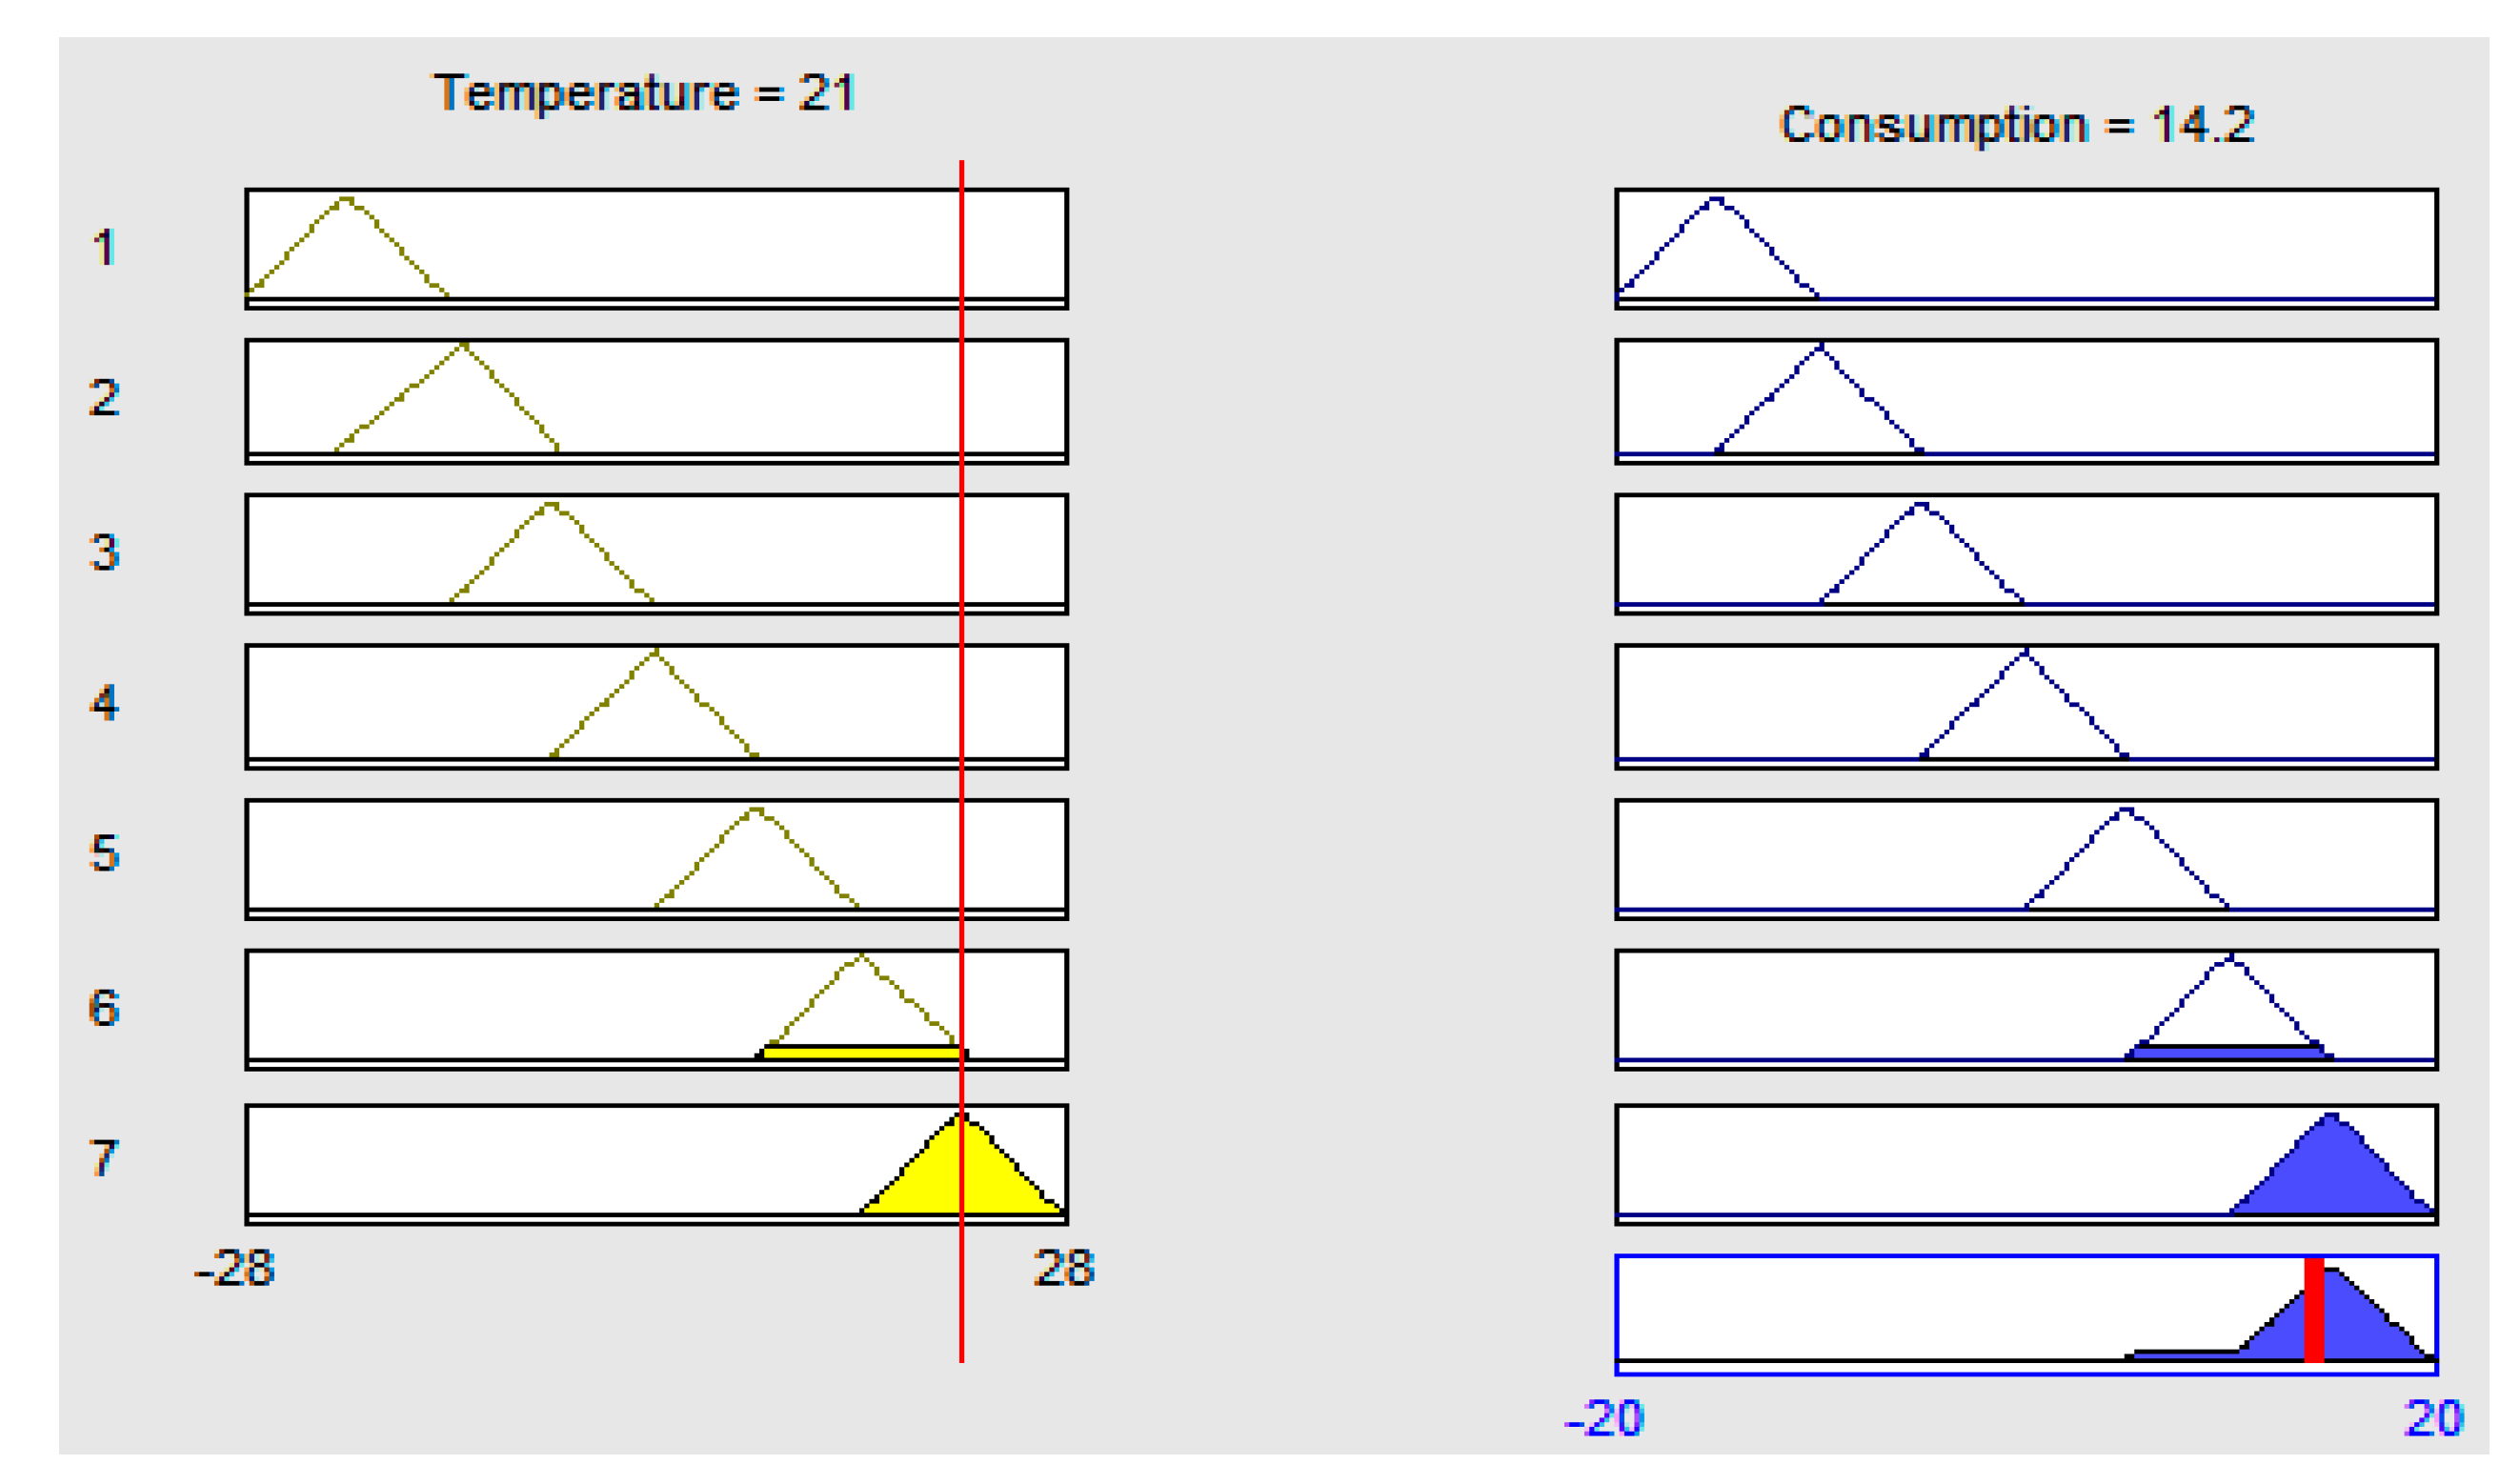
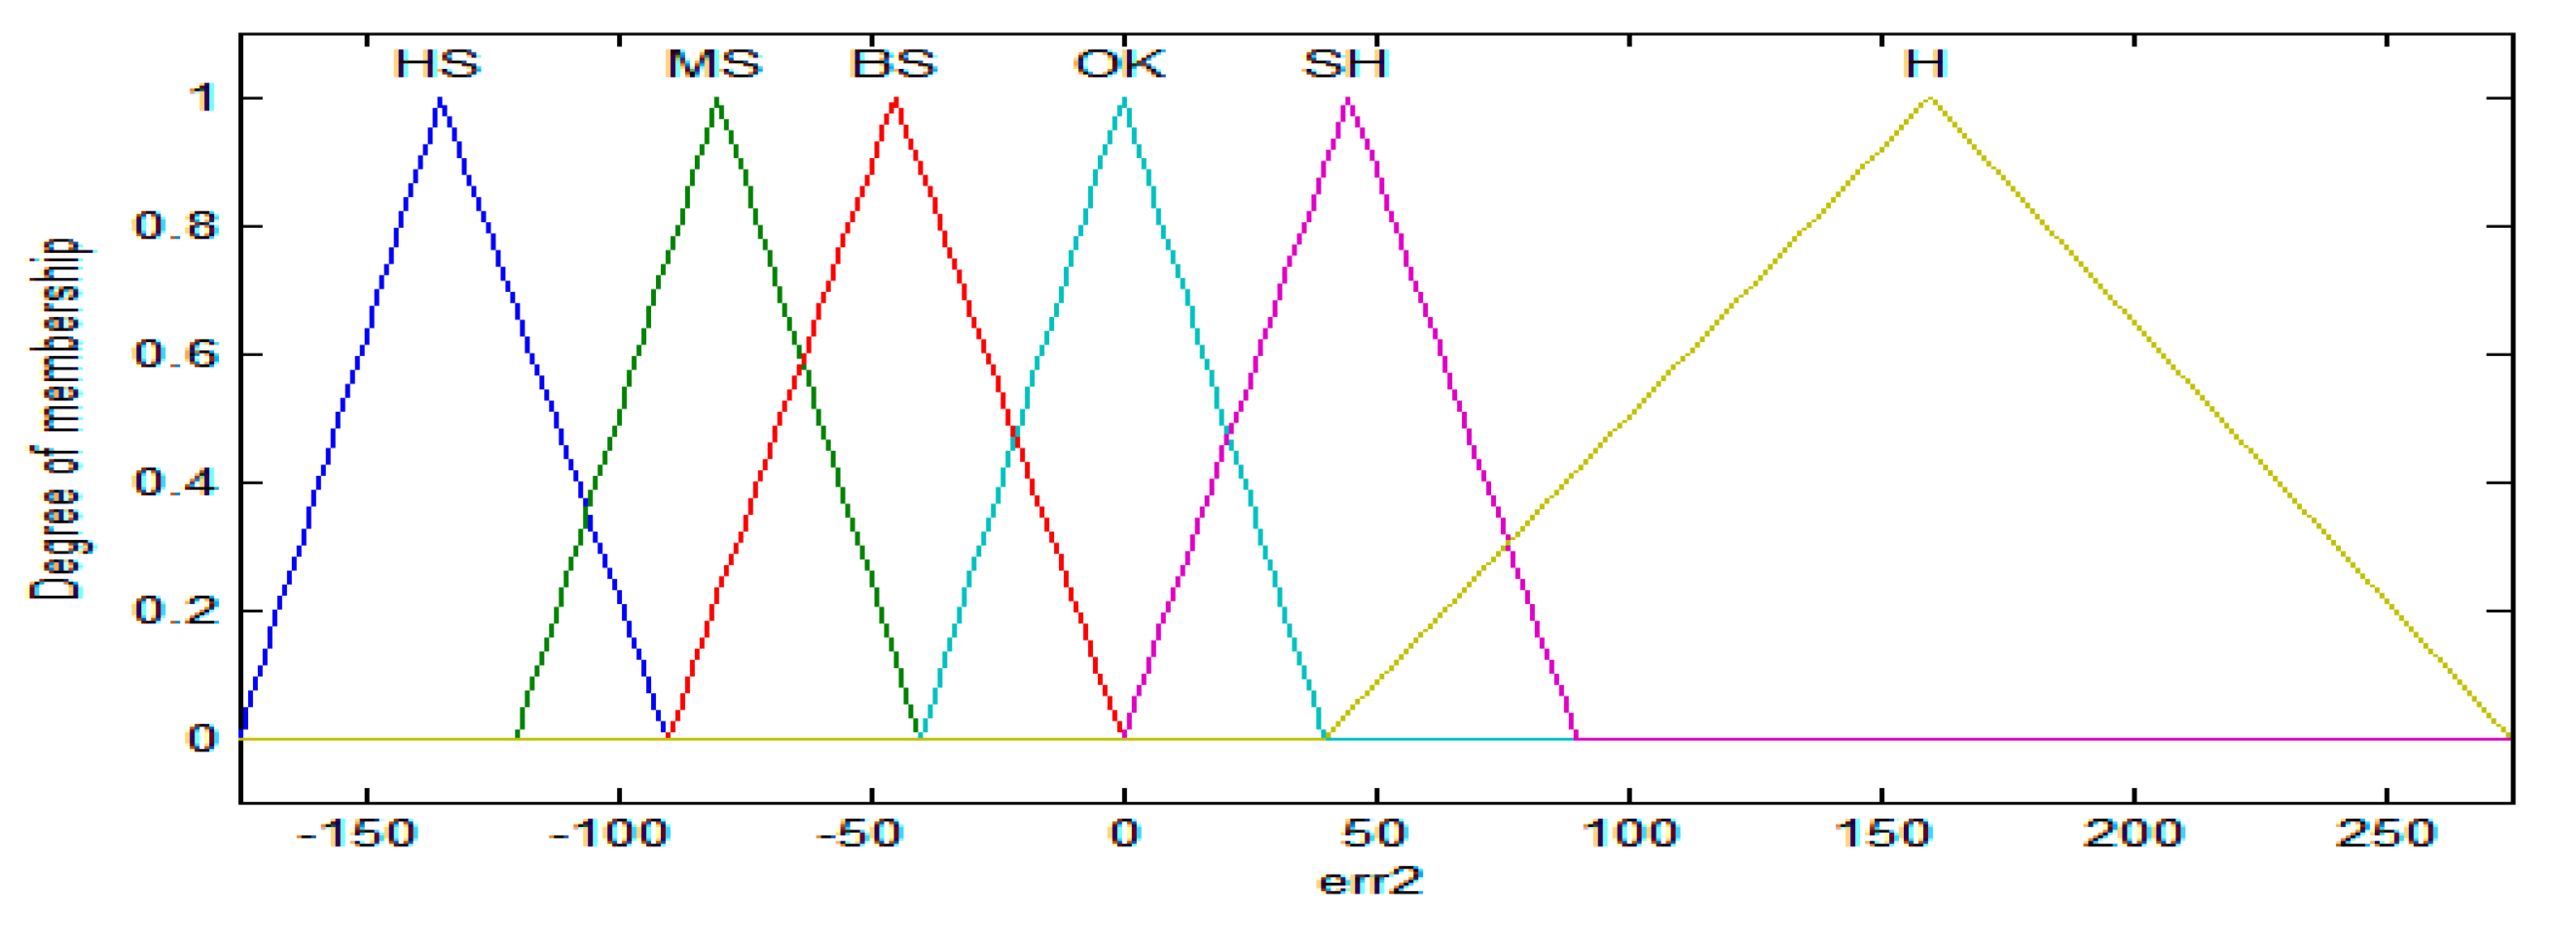
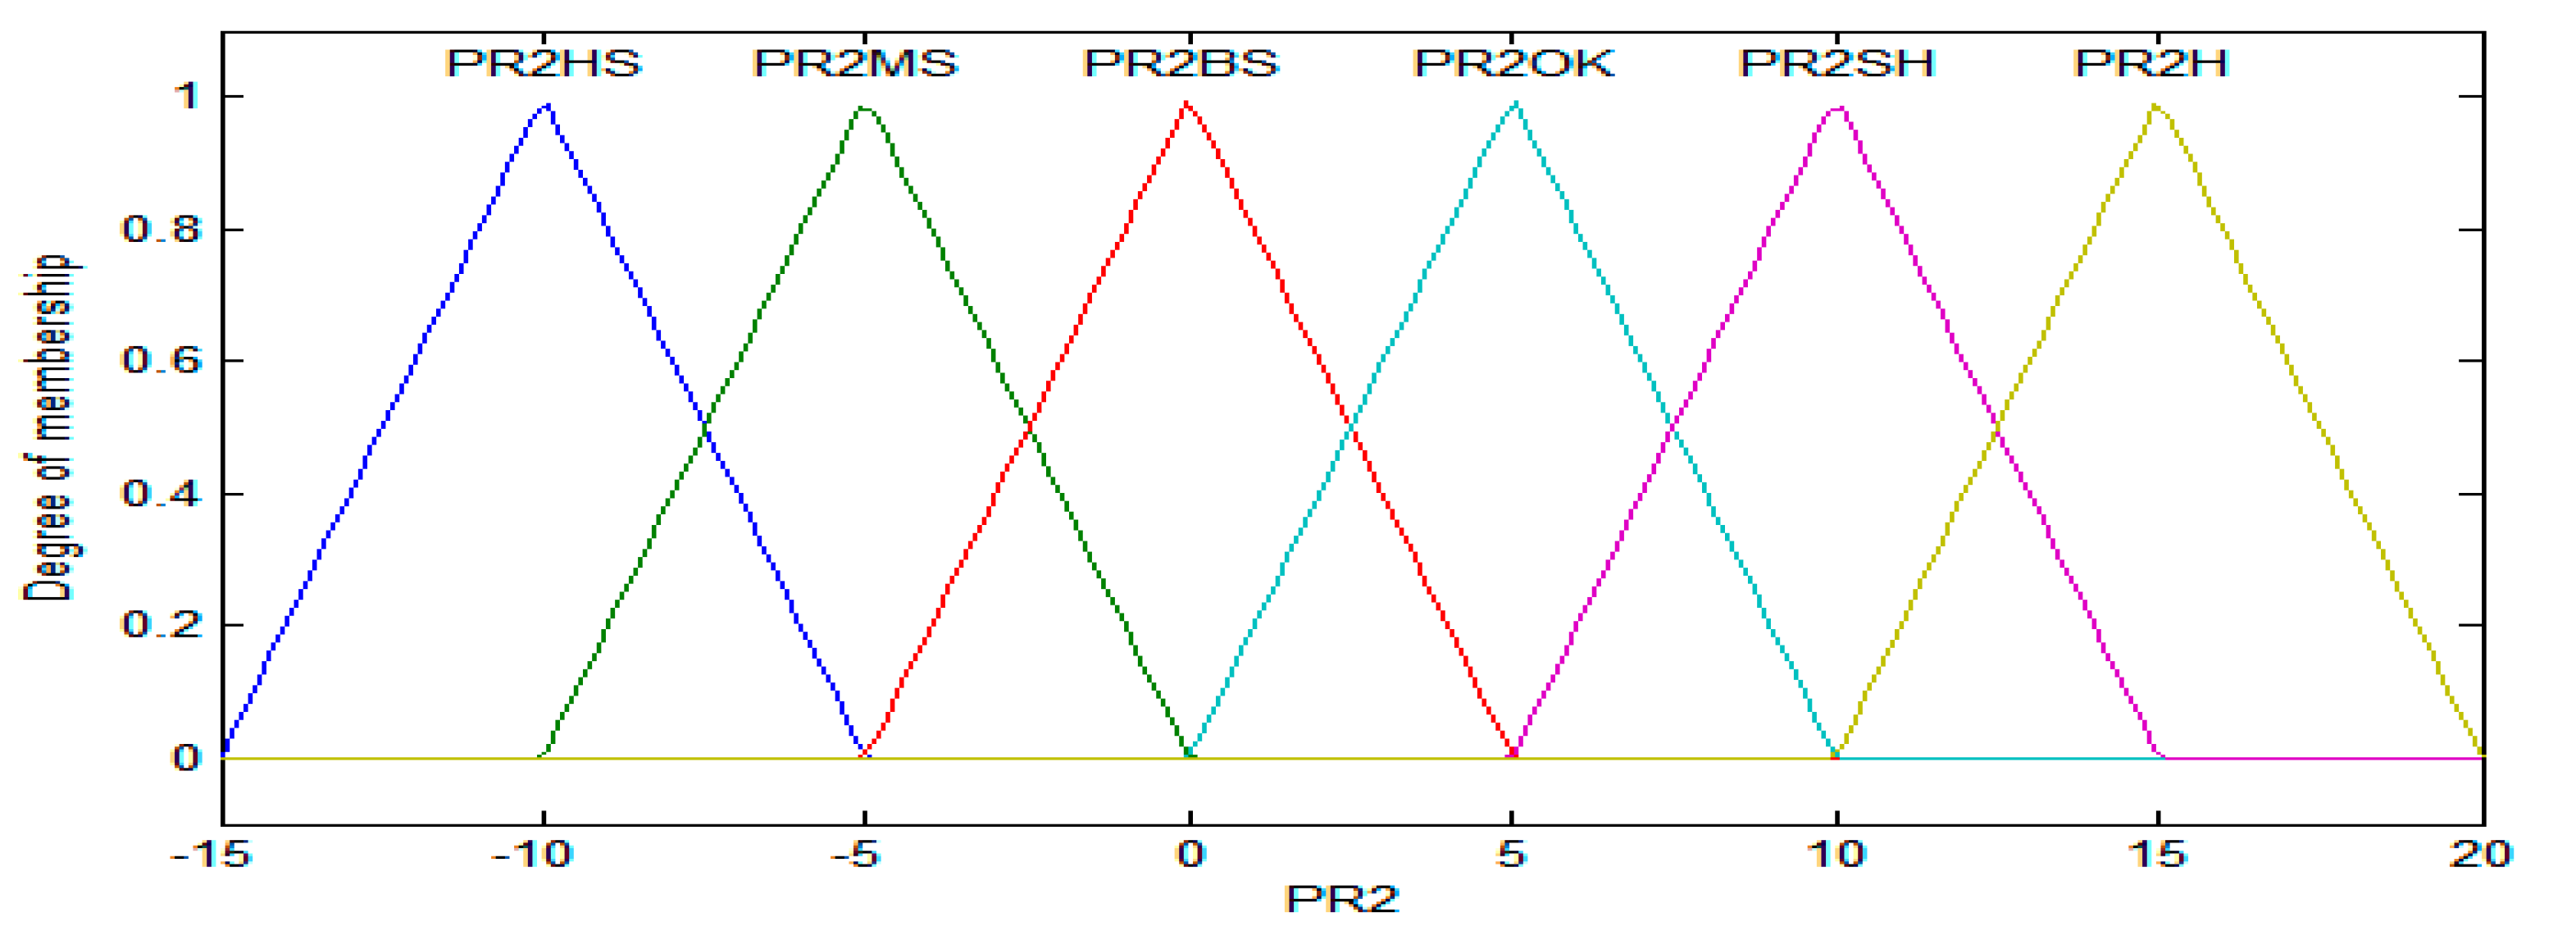
3.3.2. Illumination Fuzzy Controller

The inputs of the illumination fuzzy controller are the error between the external environmental illumination and the FA-GA-optimized illumination values based on Euclidean distance and generates the required power as the output, which is then used to update the lighting actuators status. The required inputs and outputs of the illumination fuzzy controller are given in the following rules:
  • If ( e r r 2 = = HS), then P R 2 = P R 2 HS
  • If ( e r r 2 = = MS), then P R 2 = P R 2 MS
  • If ( e r r 2 = = BS), then PR2 = P R 2 B S
  • If ( e r r 2 = = OK), then PR2 = P R 2 O K
  • If ( e r r 2 = = SH), then PR2 = P R 2 S H
  • If ( e r r 2 = = H), then PR2 = P R 2 H
In the above rules, e r r 2 is the error between the external environmental illumination and the FA-GA-optimized illumination calculated by Euclidean distance, and this error is used as the input to FIS. HS MS, BS, OK, SH, and H are different labels of membership functions of the input variable of illumination FIS. PR2 is the required power for illumination, and PR2 with input variable membership function labels in the output variable indicate the required power for the corresponding input membership function.

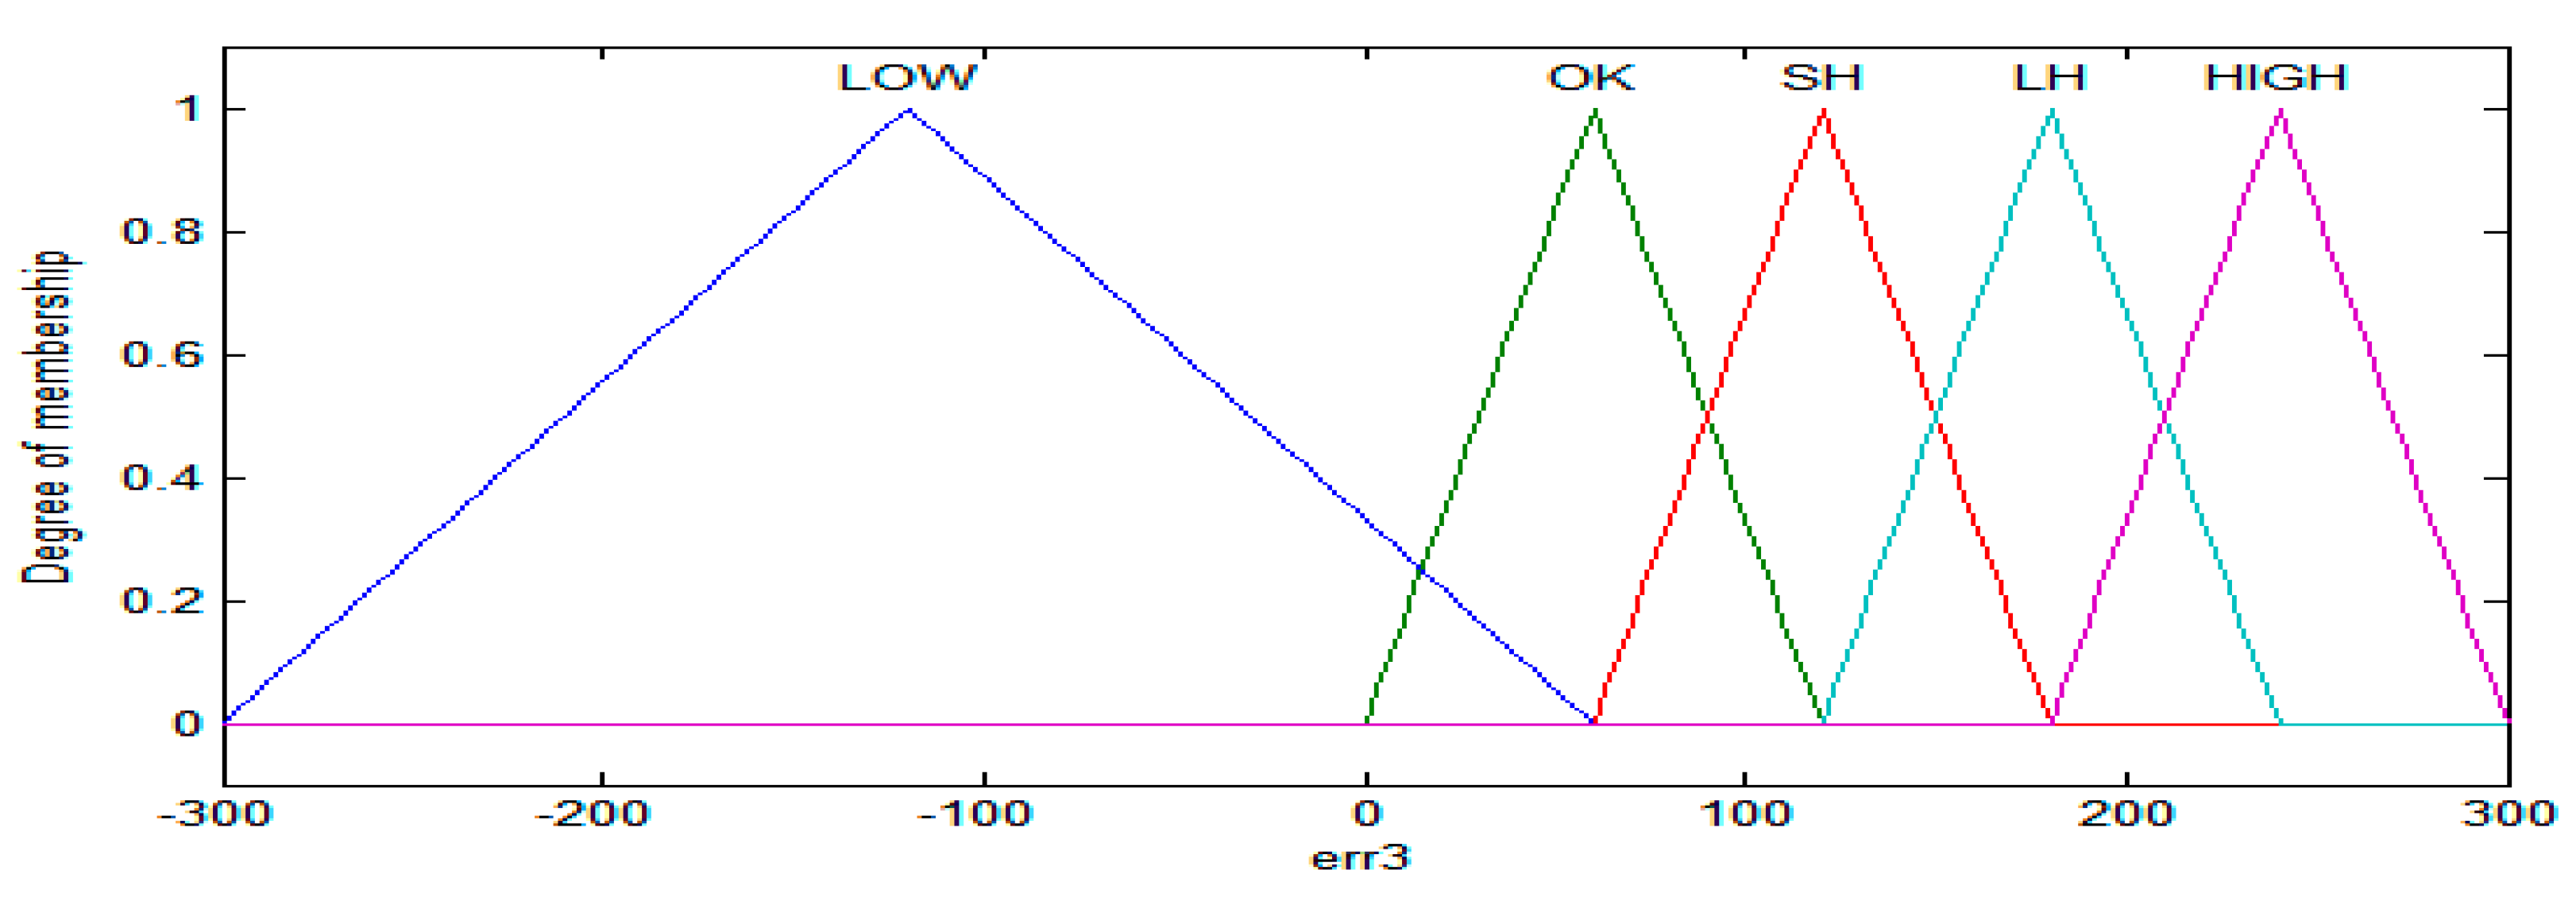
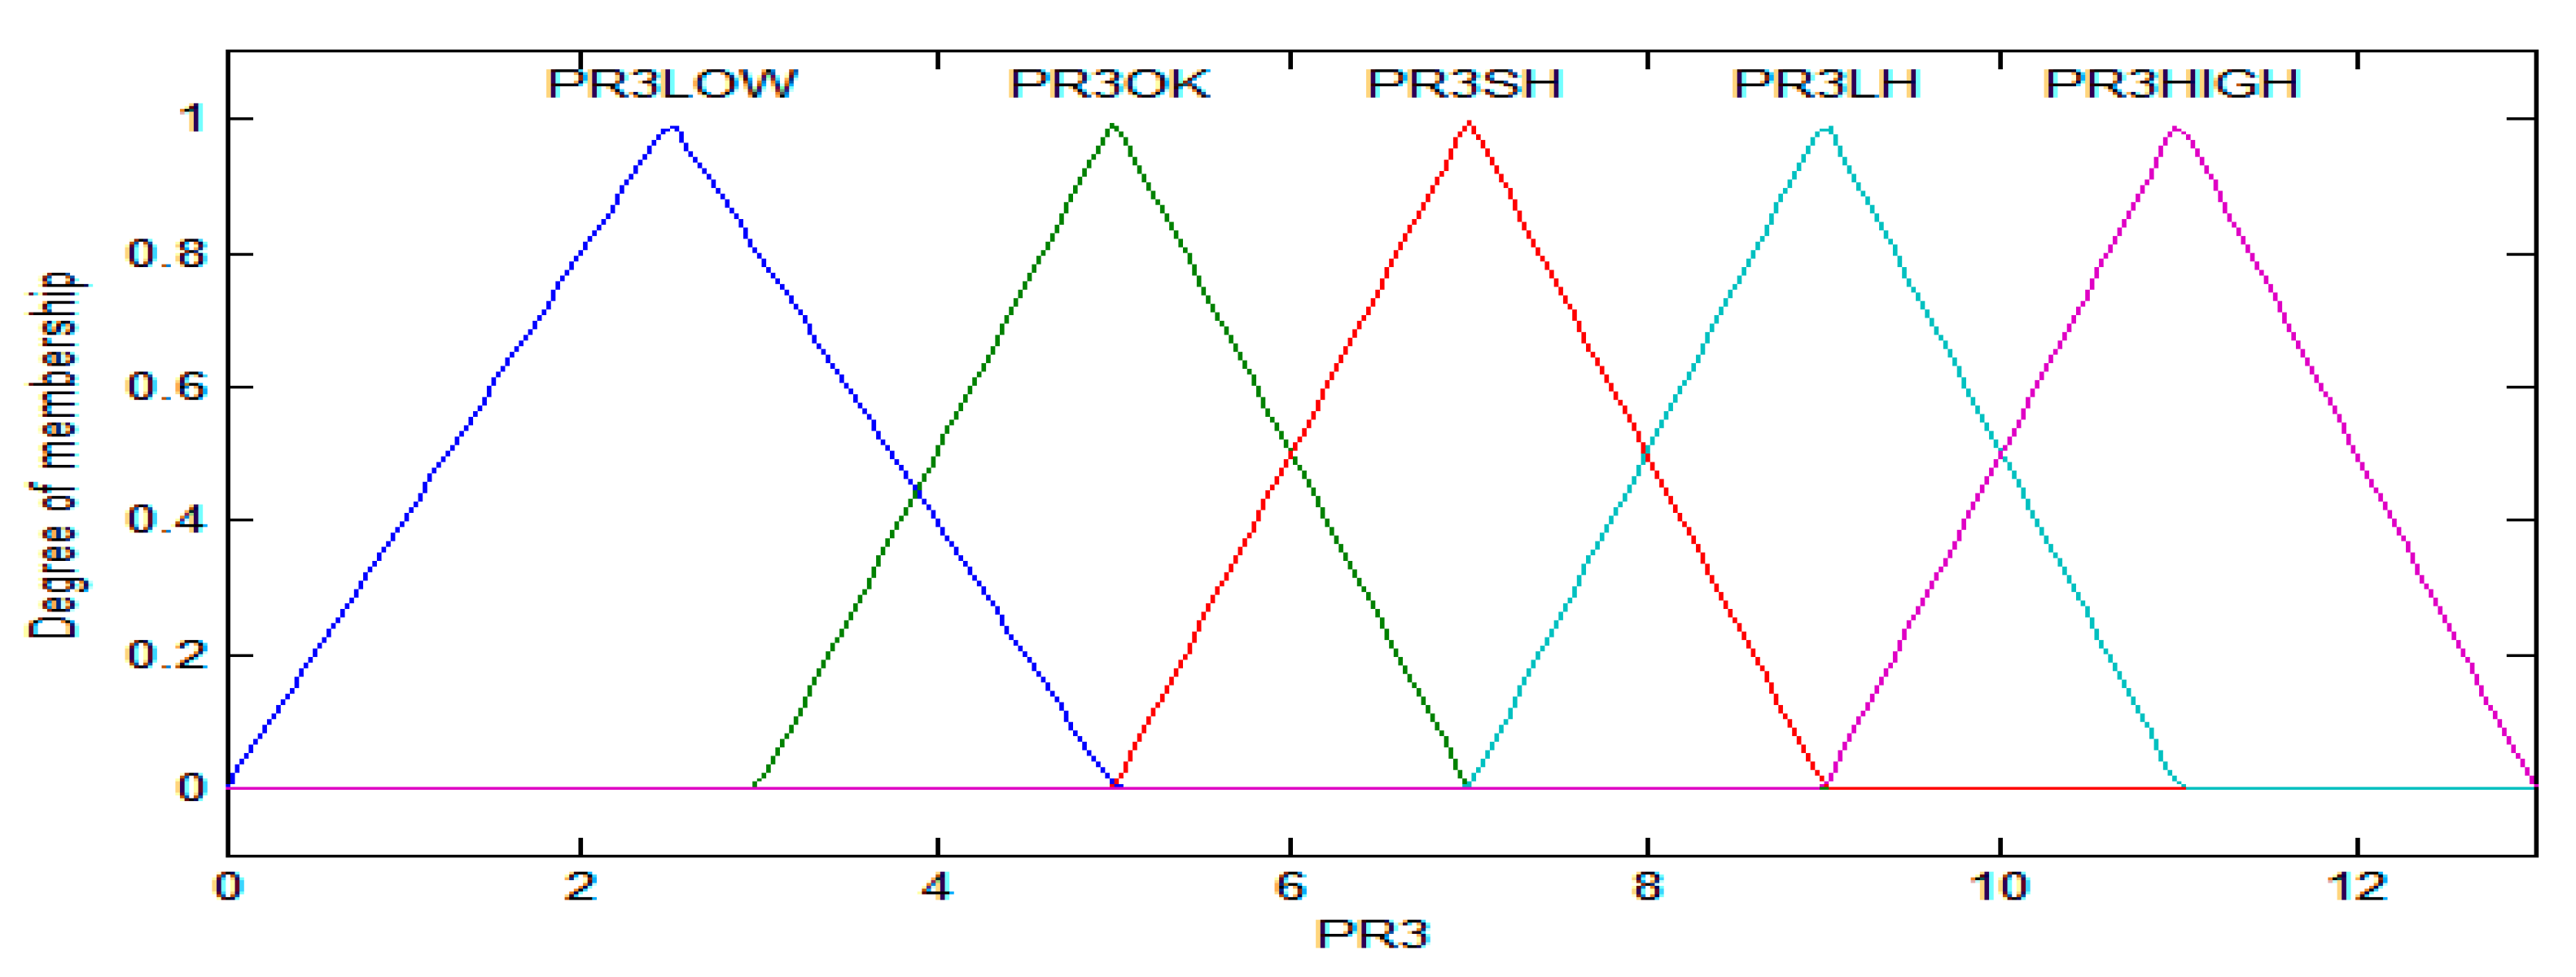
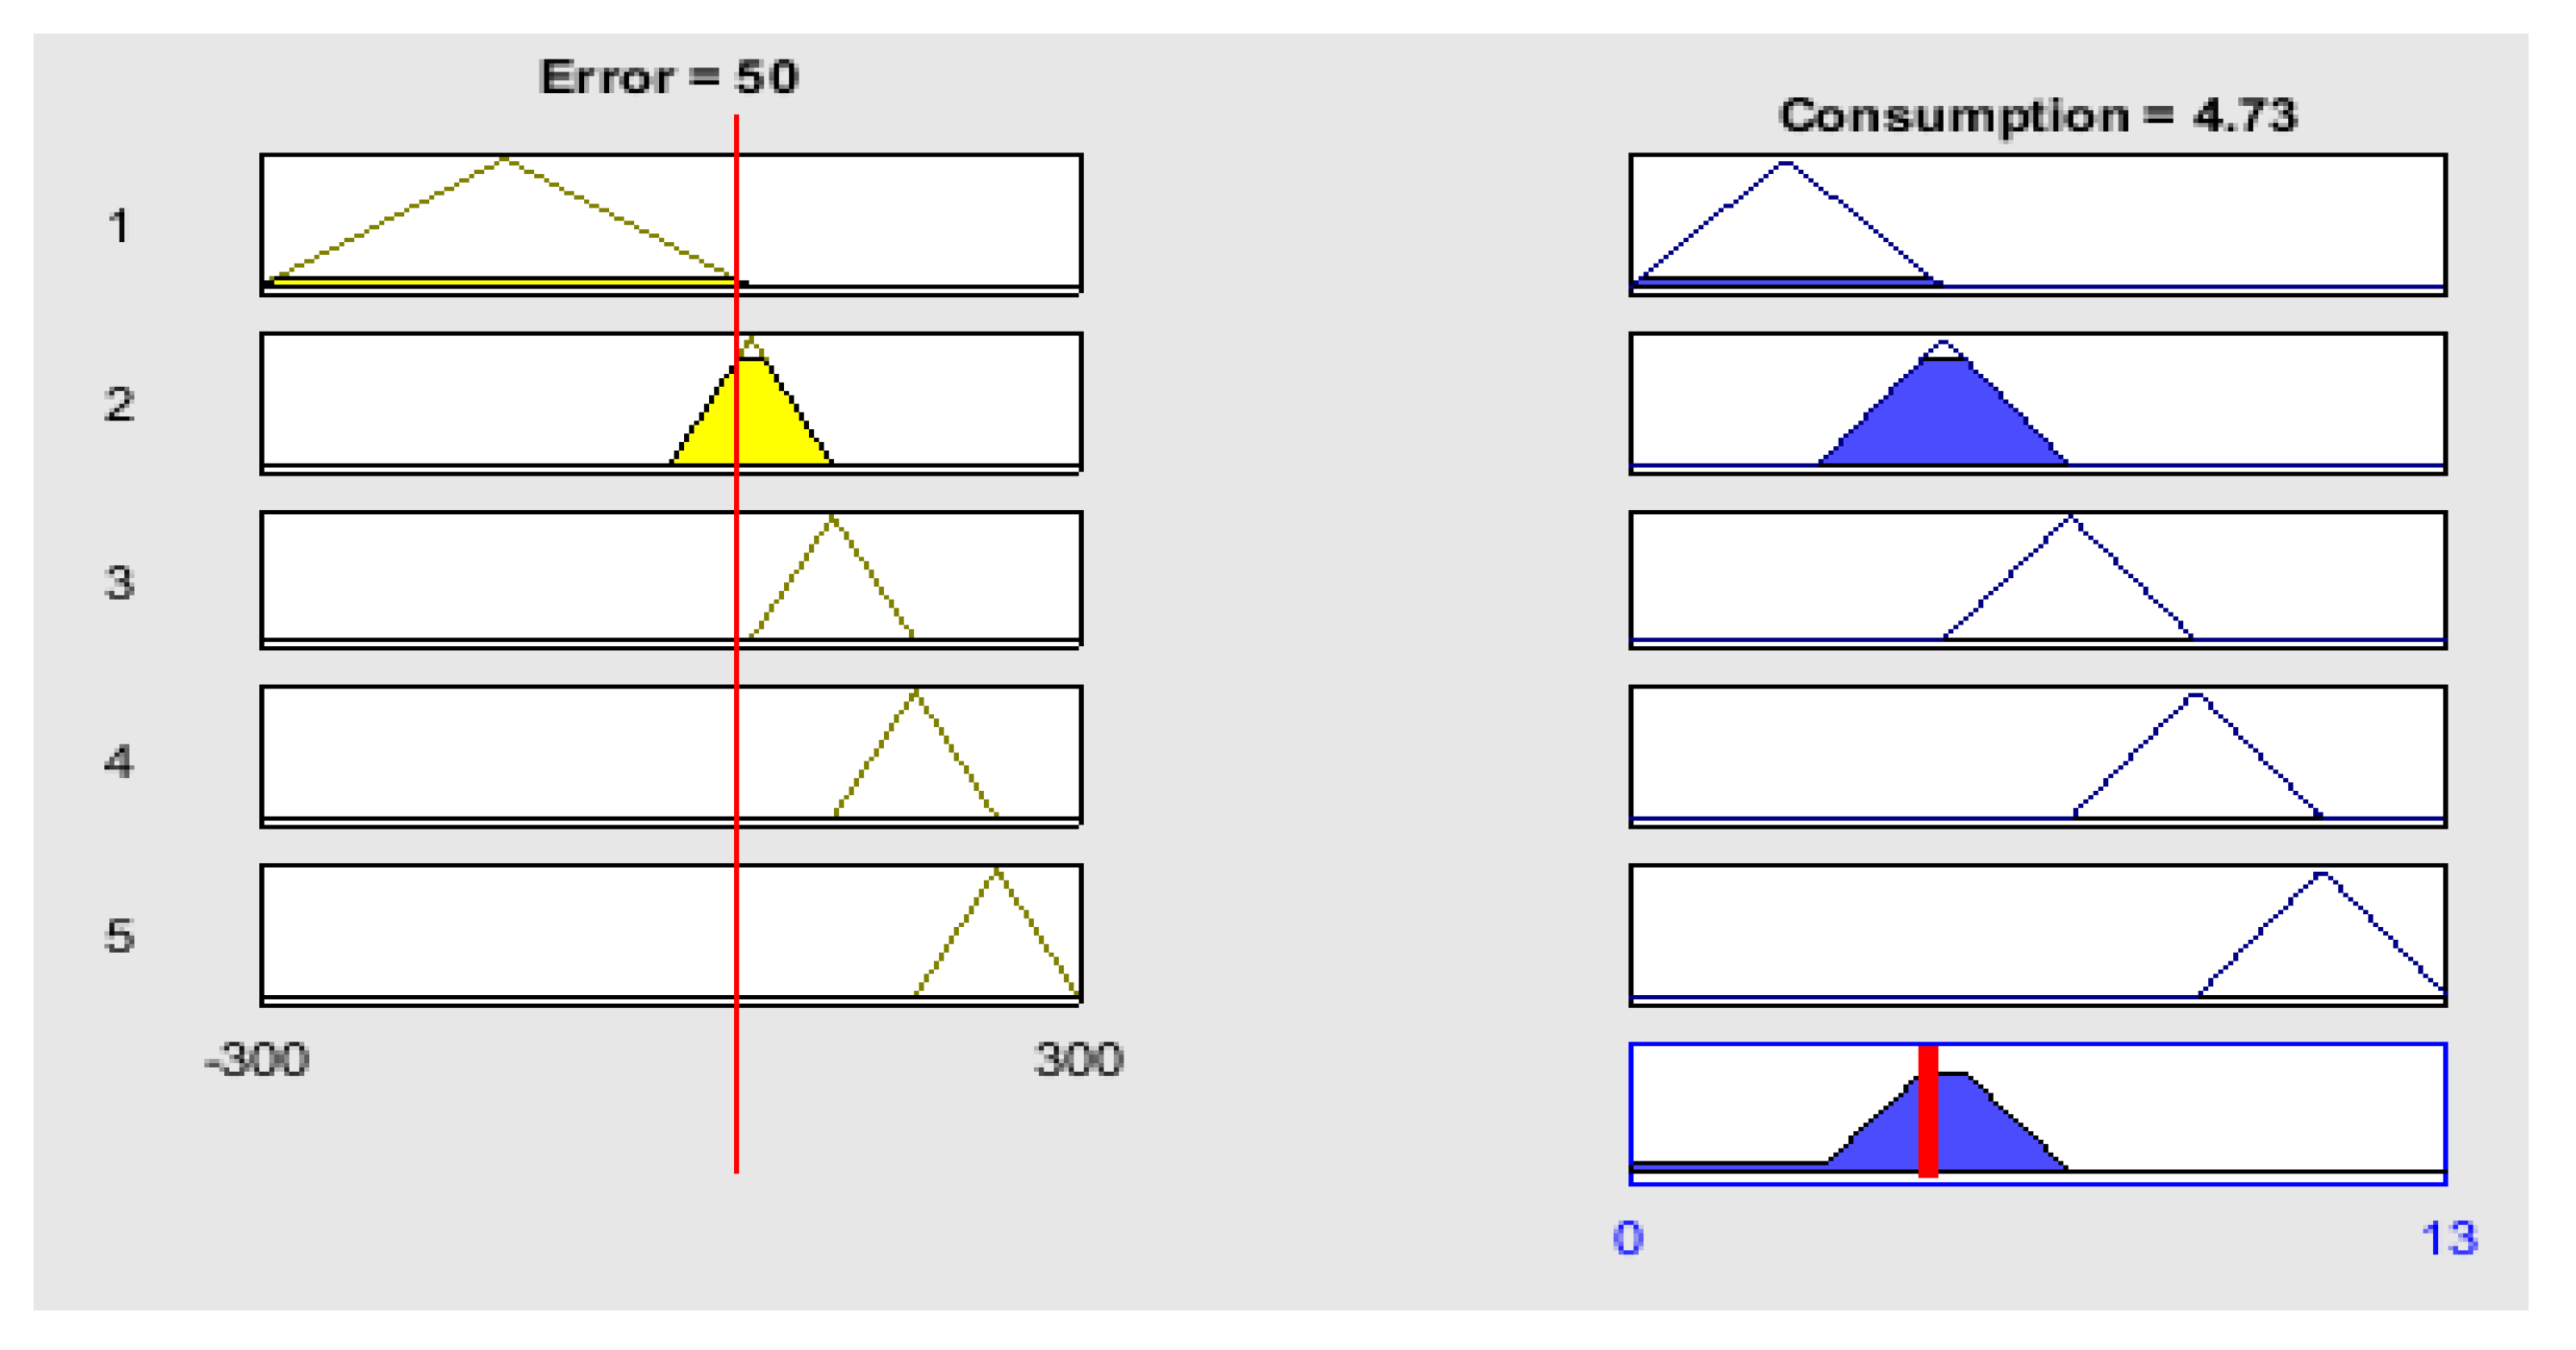
3.3.3. Air Quality Fuzzy Controller

The main purpose of the air quality controller is to calculate the required power for controlling the status of the air quality actuator. It takes the error difference between the environmental air quality and FA-GA-optimized air quality values and generates the required power as the output. The rules are given as:
  • If ( e r r 3 = = LOW), then P R 3 = P R 3 L O W
  • If ( e r r 3 = = OK), then P R 3 = P R 3 O K
  • If ( e r r 3 = = SH), then P R 3 = P R 3 S H
  • If ( e r r 3 = = LH), then P R 3 = P R 3 L H
  • If ( e r r 3 = = HIGH), then P R 3 = P R 3 H I G H
In the above rules, e r r 3 is the error between the external environmental illumination and the FA-GA-optimized illumination calculated by Euclidean distance, and this error is used as the input to FIS. LOW, OK, SH, LH, and HIGH are different labels of the membership functions of the input variable of the air quality FIS. PR3 is the required power for the air quality, and PR3 with input variable membership functions labels in the output variable indicate the required power for the corresponding input membership function.

3.4. Coordinator

The input for the coordinator is the total power energy needed by the controlling system for cooling and heating and lighting and ventilation and generates the output power available based on the power sources. The required power generated by the coordinator is calculated using Equation (18).
T R P = P R 1 + P R 2 + P R 3
In the above equation, TRP represent the total power energy required, P R 1 represents the power required by the cooling and heating system, P R 2 represents the power required by the lighting system, and P R 3 represents the power required by the ventilation system.

3.5. Actuators

All the equipment and devices, which require power energy in order to operate inside the buildings, are known as actuators. The main examples of actuators are air conditioners, freezers, and refrigerators; exhausts fans for ventilation purposes; and other light-emitting equipment for lightening. The status of each actuator updates based on the error difference calculated using the Euclidean distance between the environmental parameters and the FA-GA-optimized parameters.

4. Experimental Setup and Discussion

This section describes the overall hardware and software resources used in our research activity. The experiments for this paper were conducted on an Intel(R) core(TM) i5 CPU with a 2.7 GHz processor. For fast implementation, the proposed and comparative models and developed model were coded using MATLAB R2016a. The parameters of all the considered algorithms used in the experiments are given in Table 2.

4.1. Parameter Optimizations

The ranges of the considered parameters, including illumination, temperature, and air quality, are given in Table 3. The responsibility of the optimization algorithms is to keep these parameters in their specified ranges. When the environmental parameters are outside these ranges, the optimization algorithms will bring them to the ranges with the least possible differences with the environmental values.

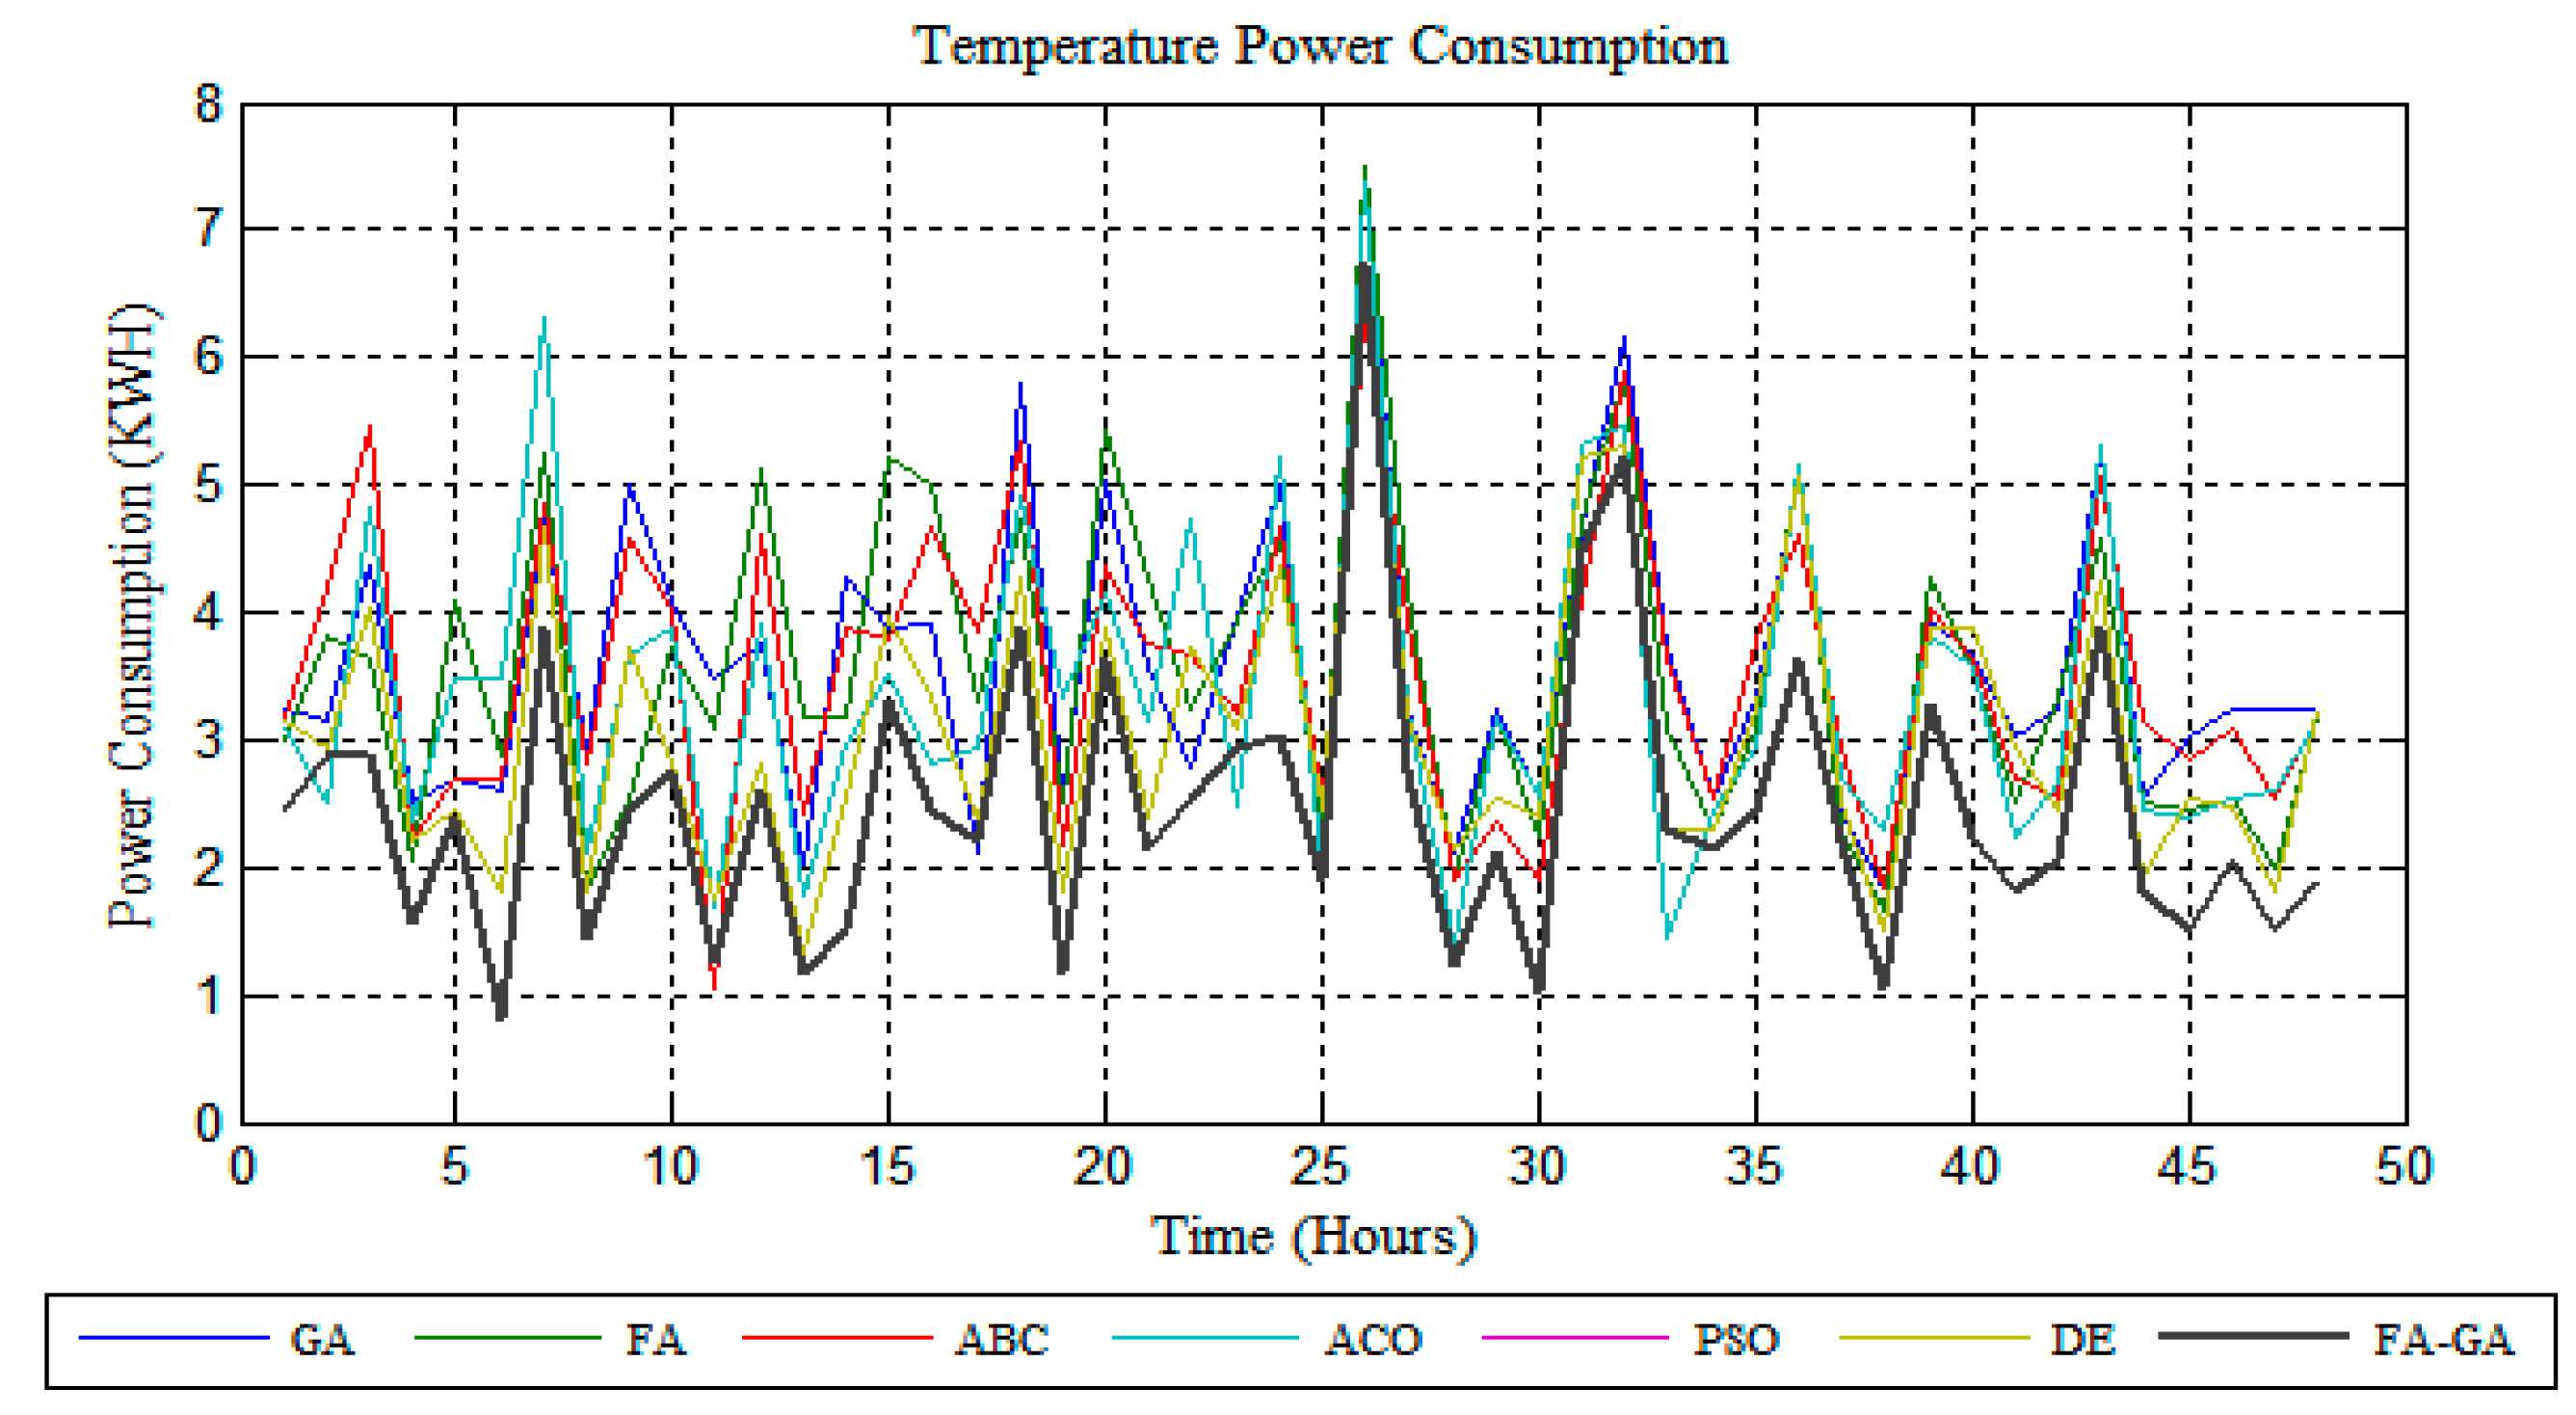
4.2. Temperature Control System

The major elements of the temperature control system are the computation of error differences, power consumption, and inputs/outputs for the fuzzy controller. The optimization algorithm reduces the error difference between the user central point and the environmental temperature. The aforementioned error difference is used for computing the temperature power consumption. The temperature power consumption using different optimization algorithms in comparison with the proposed technique is shown in Figure 3.
Table 4 shows the difference between the user-set values of the temperature (Kelvin) parameter and the environmental parameter after performing the optimization process. In the table, the optimization of the proposed FA-GA model is compared with other well-known models, including the genetic algorithm (GA), firefly algorithm (FA) artificial bee colony algorithm (ABS), ant colony algorithm (ACO), and differential equation (DE). The performances of all the models were compared in terms of minimizing the digital values of the temperatures. Although these values have been given their actual form, when considering them for optimization, their absolute values are considered when used for computing the comfort index values in the corresponding formula. The table clearly shows that the absolute digital values of the proposed FA-GA model are less than all the values observed by the other optimization algorithms when applied in their standard format for minimizing of these values, showing the efficiency of the technique in terms of the minimization of these values. If keenly observing the table, there are fluctuations in the optimization process of all the other algorithms considered. In some cases, the values observed for the GA are better than the FA, ABC, ACO, and DE, whereas, in other cases, the values may have different scenarios in value observations. Since the values obtained from different optimization algorithms are used in computing the power consumption and comfort index, the lesser values result in low power consumptions and high comfort values, and higher values of these parameters result in higher power consumptions and lower comfort values. Resultantly, the algorithms that provide lesser values will be efficient in terms of the minimum power consumptions and maximum comfort index.
The temperature fuzzy controller inputs the error difference as per Table 4 and generates the power consumption as the outputs. The input membership and output membership functions are shown in Figure 4 and Figure 5 for the error variance of the environmental temperature and optimized temperature, respectively.
An example of the input and output for the temperature fuzzy controller is given in Figure 5 and Figure 6, which show the complete inputs–outputs relationship for the temperature fuzzy controller. Balancing the relationship between inputs and outputs for the temperature fuzzy controller results in the most optimal solution.

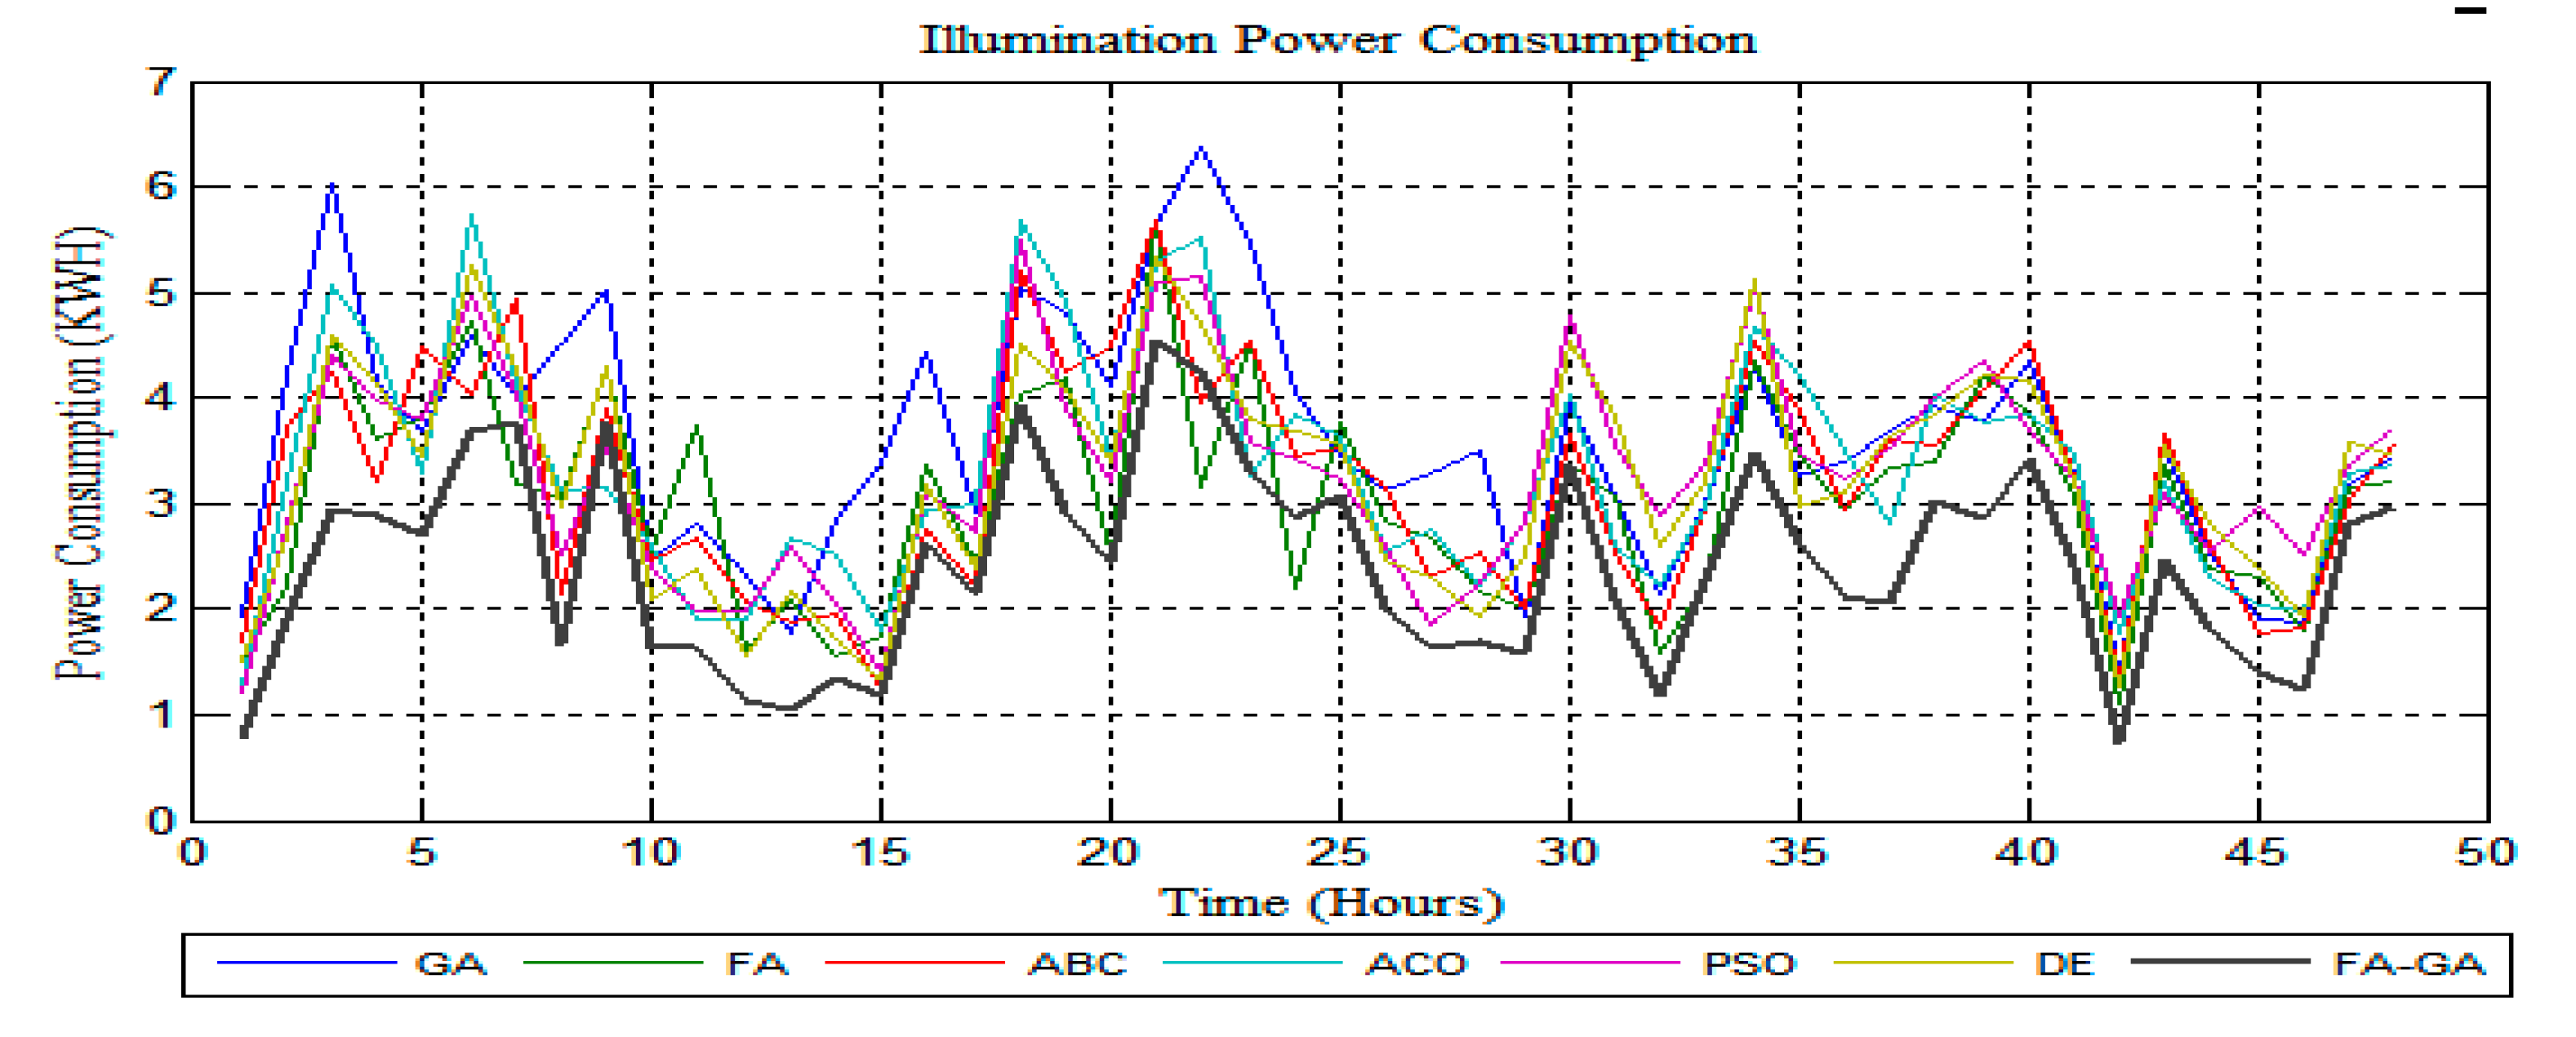
4.3. Illumination Control System

Similar to the temperature control system, the illumination control system has also the same elements working in the same manner as the temperature control system works. The major elements of the illumination parameter control system are the calculation of the error differences between the environmental illumination and the optimized illumination values, the power consumption for the illumination, and the fuzzy controller inputs and outputs system. Table 5 represents the error differences for the different optimization algorithms in combination with the proposed algorithm.
In the case of the illumination control system, a total of two days of data was observed on an hourly basis, and in Table 5, we have illustrated the results for the 24-h illumination error differences using Euclidean distance between the original value and optimized temperature value. As shown in Table 5, the illumination error values obtained by the proposed hybrid mode are lower than the standard FA and GA. A minor difference for the first few hours for all comparative approaches is relatively near, while from hour 8 to hour 12, the FA, GA, and FA-GA showed the minimum error difference. The error difference onward from hour 14 until hour 24 showed that the FA-GA produced the most optimal error difference for the actual and optimized temperatures. Relatively for all the observations of the illumination error optimization, the developed hybrid optimization model—namely, the FA-FA model, outperforms all the standard algorithms, e.g., the GA, FA, ABC, PSO, and ACO.
The difference between the optimized values and the user-set values are shown in Table 5 for the illumination parameter (lux). The performances of different algorithms were compared in terms of minimizing the absolute values of the differences between the user-set illumination and the environmental illumination parameters values. It is evident from the table that the values observed for the proposed FA-GA model are lesser than the other optimization algorithms considered for comparison. This clearly shows the performance of the proposed technique is better than the optimization algorithms applied in their standard format for achieving the goal of minimizing these values. The values observed for all other optimization algorithms have fluctuations for different models and values. In some cases, the values observed by the GA are better than the values observed by the standard FA, ABC, ACO, and DE. In other cases, the values obtained by ABC, ACO, FA, and DE are better than the other techniques considered, making all of them almost equally powerful in their standard operations for handling these values. The most powerful technique of all these models is the proposed FA-GA model, since it combines two optimization algorithms for the optimization process. The illumination parameter values obtained are used for computing the power consumption and the comfort index values. If these values are lesser, it will lead to less power consumption for the illumination parameters and vice versa. Similarly, these values are used for calculating the comfort index of the building. The lesser values of these observed parameters leads to a higher comfort index and vice versa. As a result, if these values are properly minimized by the optimization algorithm, it will result in lower power consumption and a higher comfort index, which are the basic requirements of the optimization model in the proposed system.
Based on the error difference, the power consumptions observed for various algorithms are shown in Figure 7. It can be clearly observed that the minimum power consumption has been carried out by the proposed model with few fluctuations. For the remaining techniques, there are variations in the power consumption; some approaches have little power consumption than the other ones.
The input and output rules of the illumination fuzzy controllers used for mapping the error differences into power consumption are shown in Figure 8 and Figure 9.
Figure 10a represents the power delivered by the illumination fuzzy controller for the lighting actuator, while the relationship between inputs and outputs for the illumination fuzzy controller is presented in Figure 10b.

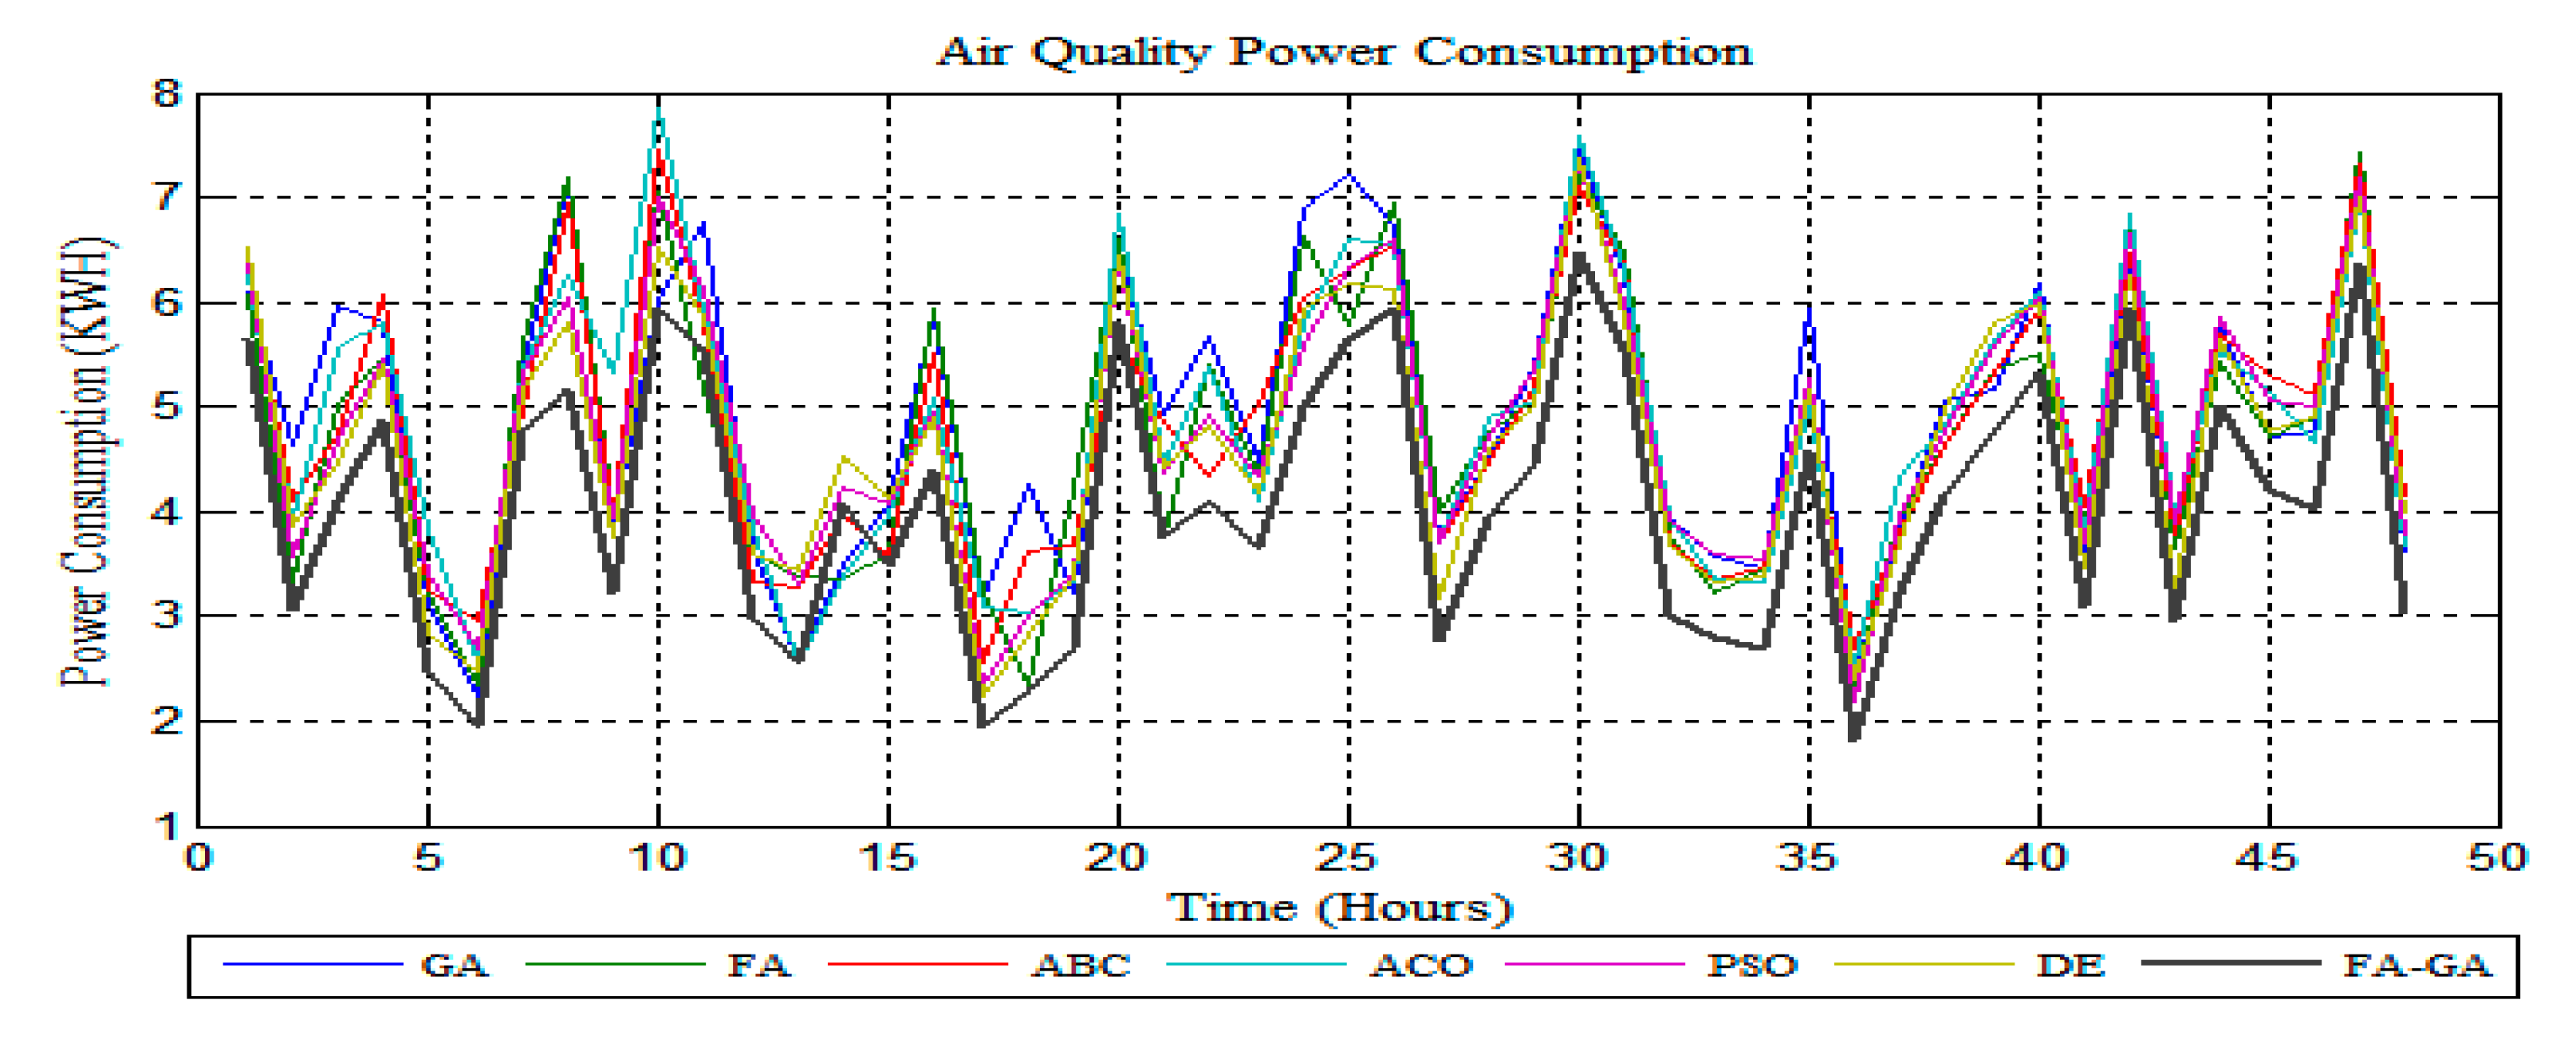
4.4. Air Quality Control System

Similar to the other two control systems, the air quality control system has also the same components working in the same manner as the temperature and illumination control systems work. The major components of the air quality control system are the calculation of the error differences between the environmental air quality and the optimized air quality values, the power consumption for the air quality, and the fuzzy controller inputs and outputs system. The error differences for the different optimization algorithms in combination with the proposed algorithm are shown in Table 6.
In the case of air quality power consumption, the data was also collected for two whole days on an hourly basis, while we have illustrated the results for one day with 24 h. As shown in Table 6, the air quality error difference obtained by the proposed hybrid mode is lower than the standard FA and GA. A gradual reducing error difference for the first few hours for all considered approaches can be seen. While, from hour 14 to hour 24, the results show that the FA-GA produced the most reduced error difference for the actual and optimized temperatures. The FA-GA model has been successful in minimizing the air quality difference more than the other optimization models considered. For the air quality control system, the lowest error was accomplished by the developed hybrid FA-GA model, followed by the GA, FA, ABC, and ACO, respectively. The effectiveness of the FA-GA model was observed in all the cases.
The error variance between the users’ defined air quality and the optimized air quality (CO2 concentration) for all of the considered approaches is shown in Table 6. The performance and efficiency of all the algorithms are measured in terms of the minimum values for these differences. These values are given in their standard forms, but when considered in the computations of power consumption and comfort index, these are taken in their absolute form. The major aim of all the optimization algorithms is to reduce the absolute values of these parameters. The table clearly indicates that this aim has been achieved by the proposed model in a better way as comparatively to the other optimization algorithms applied in their standard formats. The efficiency in the result of minimizing these values by the proposed model is the result of hybridizing two optimization algorithms in their conventional procedures. For all other optimization models, many fluctuations can be observed in these values. In some cases, one technique may outperform the other, whereas, in other cases, the result may be the opposite. Since these values are used in turn for calculating the air quality power consumption and the occupant’s comfort, the minimum values for this will result in less power consumption and higher user comfort, as outlined in the mathematical formula used for computing these values. The proposed model has been adequately proved to be the most powerful as compared to the other standard models. The result behind this efficiency is their combination of two standard models that combine the advantages of both the techniques while eliminating their disadvantages.
The power consumption observed for various algorithms shown in Figure 11 is based on the error difference shown in Table 6. It can be clearly observed that the minimum power consumption has been carried out by the proposed model, with few fluctuations. For the remaining techniques, there are variations in the power consumption, with some approaches having little power consumption than the other ones. The air quality fuzzy controller inputs, outputs, examples, and total consumptions observed are shown in Figure 12, Figure 13, Figure 14 and Figure 15, respectively.
According to the power energy utilized by the temperature control system shown in Figure 3, the power consumed by the illumination control system presented in Figure 7, and the power utilized by the ventilation control system shown in Figure 11, the total power utilized by other optimization approaches is illustrated in Figure 15.
The second major purpose of the optimization algorithm is the maximization of the user comfort. The user comfort is represented by the indoor environment preferred by the occupants residing inside the building. It is defined by three parameters—namely, temperature, illumination, and air quality—in our proposed system. The maximum value of the user comfort is 1, based on the division of preferences given by the user to each of the contributing components. After the parameters are optimized by the optimization algorithms, the user comfort index is computed using Equation (13). The user comfort calculated for the proposed approach in comparison with the other optimization techniques considered is shown in Figure 16.

5. Statistical Analysis of All Approaches

The statistical facts about the power consumption and the user comfort for various optimization algorithms are shown in Table 7. This analysis is based on the temperature power consumption, illumination power consumption, air quality power consumption, total power consumption, and user comfort outlined in Figure 3, Figure 7, Figure 11, Figure 15 and Figure 16. In the case of the power consumption for temperature, illumination, air quality, total consumption, and the comfort index, there are fluctuations in the observations of all the considered optimization algorithms. In the case of observations for the proposed model, the power consumption is less than all the other algorithms. Similar observations can be found for the user comfort as well. The highest user comfort was achieved for the proposed algorithm, whereas many fluctuations could be observed in the values of the other considered techniques.
The strength of the proposed FA-GA model is sufficiently evident from observing the data given in Table 7. The temperature, illumination, air quality power, and the total power consumption for all the other standard optimization models and the proposed FA-GA model are compared. It is clear from the table that the power consumption values of temperature, illumination, air quality, and the total power consumption for the proposed model are less than the other algorithms used in their standardized form, showing the better performance and efficiency of the proposed technique. When we observed the values obtained from the other models, many fluctuations could be seen in their performances. In the case of some values, the performance of the GA was better, whereas, in some other cases, the efficiency of the ABC, ACO, FA, and DE were better than the other considered techniques. The power consumption minimization was the first aim of the optimization process, which was obtained quite successfully by the FA-GA model in a better way than the other standard optimization models.
The second aim of the optimization process is the maximization of the user comfort index, as shown in the table. The minimum, maximum, and average user comforts obtained by different optimization models are shown in the last section of the table. The highest comfort index was achieved by the hybrid FA-GA model, followed by other standard optimization models, with various fluctuations for different considered approaches. In the same manner to the observations of power consumption, the proposed model outperforms the other standard models in terms of getting the maximum user comfort.
In the proposed approach, we combined two optimization algorithms—namely, the genetic algorithm and firefly algorithm. The computation complexity of the genetic algorithm is O (gnm), where g represents the number of generations, n indicates the size of the population, and m represents the individual sizes. In the proposed work, another firefly algorithm was used. The firefly algorithm is a metaheuristic algorithm, and it is very simple in terms of complexity and, hence, is easy to implement. The computation complexity of the firefly algorithm is O (n2t), where n represents the inner loops, and t denotes the outer loop. These asymptotic notations exhibit that the computation complexity of both algorithms is low; hence, both of these approaches are fast to run [35,36].

6. Conclusions and Future Work

In this paper, a hybrid algorithm of one EI technique—namely, the GA, and one SI approach called the FA was developed for the multi-objective optimization problem of energy consumption minimization and management of the IEQ of smart buildings. The proposed optimization model has been named the FA-GA, as it uses the FA as the first optimization technique, and after a fixed number of iterations, the GA is embedded for further improving the optimization process. A whole energy-efficient residential building with different components is proposed in which the optimization algorithm is used for minimizing the energy consumption and IEQ management. The inputs of the optimization algorithm are the ITQ, IVQ, and IAQ parameters from the environment, as well as the user-preferred ranges of the parameters. When the values of the environmental parameters are outside the user-preferred range, the optimization algorithm brings them to the range by minimizing their differences with the user-central points of the parameters. The outputs of the optimization algorithm are the optimized temperature, illumination, and air quality. Based on these values, the IEQ is computed. After the user-preferred values of the parameters are computed, the actuators are used to provide the required environment to the user. A power coordinator is used to control the flow of the required power to change the status of the actuators.
There are a few limitations associated with the building management system proposed in this work. Firstly, for the thermal sensation, only one temperature—namely, air temperature—was considered, which can be extended to other temperature dimensions, e.g., operative temperature and mean radiant temperature. Secondly, other parameters such as the weather conditions and building architecture also need attention for consideration when building management systems are developed.
In the current work, we have only considered three parameters. In the future, we will consider more parameters. In this work, the user-set parameters are static. In the future, we will make the user-set parameters dynamic.

Author Contributions

Conceptualization, F.W. and M.F.; methodology, F.W. and A.A.; software, M.F.; validation, M.M., M.F., M.A. and I.; formal analysis, M.M.; investigation, I. and M.M.; resources, M.F., A.A.; data curation, M.A.; writing–original draft preparation, F.W. and M.F.; writing–review and editing, M.F., A.A., M.A., I.; visualization, F.W.; supervision, M.M. All authors have read and agreed to the published version of the manuscript.

Funding

The APC was funded by the University of Central Asia, Bishkek, Kyrgyzstan.

Conflicts of Interest

The authors declare no conflict of interest.

References

  1. Ali, S.; Kim, D.H. Optimized Power Control Methodology Using Genetic Algorithm. Wirel. Pers. Commun. 2015, 83, 493–505. [Google Scholar] [CrossRef]
  2. Ali, S.; Kim, D.H. Effective and Comfortable Power Control Model Using Kalman Filter for Building Energy Management. Wirel. Pers. Commun. 2013, 73, 1439–1453. [Google Scholar] [CrossRef]
  3. Wang, Z.; Yang, R.; Wang, L. Multi-Agent Control System with Intelligent Optimization for Smart and Energy-Efficient Buildings. In Proceedings of the IECON 2010-36th Annual Conference on IEEE Industrial Electronics Society, Piscataway, NJ, USA, 7–10 November 2010; pp. 1144–1149. [Google Scholar]
  4. Dounis, A.I.; Caraiscos, C. Advanced Control Systems Engineering for Energy and Comfort Management in a Building Environment—A Review. Renew. Sustain. Energy Rev. 2009, 13, 1246–1261. [Google Scholar] [CrossRef]
  5. Wang, Z.; Yang, R.; Wang, L. Multi-Agent Intelligent Controller Design for Smart and Sustainable Buildings. In Proceedings of the 2010 IEEE International Systems Conference, Piscataway, NJ, USA, 5–8 April 2010; pp. 277–282. [Google Scholar]
  6. Emmerich, S.J.; Persily, A.K. State-of-the-Art Review of CO2 Demand Controlled Ventilation Technology and Application; Diane Publishing: Collingdale, PA, USA, 2003. [Google Scholar]
  7. Wahid, F.; Ismail, L.H.; Ghazali, R.; Aamir, M. An Efficient Artificial Intelligence Hybrid Approach for Energy Management in Intelligent Buildings. KSII Trans. Internet Inf. Syst. 2019, 13, 5904–5927. [Google Scholar] [CrossRef]
  8. Wahid, F.; Ghazali, R.; Ismail, L.H. Improved Firefly Algorithm Based on Genetic Algorithm Operators for Energy Efficiency in Smart Buildings. Arab. J. Sci. Eng. 2019, 44, 4027–4047. [Google Scholar] [CrossRef]
  9. Shaikh, P.H.; Nor, N.B.M.; Nallagownden, P.; Elamvazuthi, I.; Ibrahim, T. Intelligent Multi-Objective Control and Management for Smart Energy Efficient Buildings. Int. J. Electr. Power Energy Syst. 2016, 74, 403–409. [Google Scholar] [CrossRef]
  10. Alfano, F.R.D.; Olesen, B.W.; Palella, B.I.; Riccio, G. Thermal Comfort: Design and Assessment for Energy Saving. Energy Build. 2014, 81, 326–336. [Google Scholar] [CrossRef]
  11. EN Standard 16798-1. Indoor Environmental Input Parameters for Design and Assessment of Energy Performance of Buildings Addressing Indoor Air Quality, Thermal Environment, Lighting and Acoustics; Module M1-6—European Committee for Standardization: Brussels, Belgium, 2019. [Google Scholar]
  12. Fanger, P.O. Thermal comfort. Analysis and applications in environmental engineering. In Thermal Comfort. Analysis and Applications in Environmental Engineering; Danish Technical Press: Copenhagen, Denmark, 1970. [Google Scholar]
  13. Huang, L.; Zhu, Y.; Ouyang, Q.; Cao, B. A Study on the Effects of Thermal, Luminous, and Acoustic Environments on Indoor Environmental Comfort in Offices. Build. Environ. 2012, 49, 304–309. [Google Scholar] [CrossRef]
  14. ASHRAE. “Thermal Environmental Conditions for Human Occupancy”, ANSI/ASHRAE 55; American Society of Heating, Refrigerating and Air Conditioning Engineers: Atlanta, GA, USA, 1992. [Google Scholar]
  15. ISO Standard 7730. Ergonomics of the Thermal Environment—Analytical Determination and Interpretation of Thermal Comfort Using Calculation of the PMV and PPD Indices and Local Thermal Comfort; International Organization for Standardization: Geneva, Switzerland, 2005. [Google Scholar]
  16. Alfano, F.R.D.; Palella, B.I.; Riccio, G.; Toftum, J. Fifty Years of Fanger’s Equation: Is there Anything to Discover Yet? Int. J. Ind. Ergon. 2018, 66, 157–160. [Google Scholar] [CrossRef]
  17. Yang, X.-S. Firefly Algorithm. Eng. Optim. 2010, 20, 221–230. [Google Scholar] [CrossRef]
  18. Fister, I.; Yang, X.S.; Fister, D. Firefly Algorithm: A Brief Review of the Expanding Literature. In Cuckoo Search and Firefly Algorithm; Springer: Cham, Switzerland, 2014; pp. 347–360. [Google Scholar]
  19. Wetter, M.; Bonvini, M.; Nouidui, T.S. Equation-Based Languages—A New Paradigm for Building Energy Modeling, Simulation and Optimization. Energy Build. 2016, 117, 290–300. [Google Scholar] [CrossRef] [Green Version]
  20. Wang, Z.; Wang, L.; Dounis, A.I.; Yang, R. Multi-Agent Control System with Information Fusion Based Comfort Model for Smart Buildings. Appl. Energy 2012, 99, 247–254. [Google Scholar] [CrossRef]
  21. Bluyssen, P.M.; Aries, M.B.C.; Van Dommelen, P. Comfort of Workers in Office Buildings: The European HOPE Project. Build. Environ. 2011, 46, 280–288. [Google Scholar] [CrossRef]
  22. Marino, C.; Nucara, A.; Pietrafesa, M. Proposal of Comfort Classification Indexes Suitable for Both Single Environments and Whole Buildings. Build. Environ. 2012, 57, 58–67. [Google Scholar] [CrossRef]
  23. Korkas, C.D.; Baldi, S.; Michailidis, I.; Kosmatopoulos, E.B. Intelligent Energy and Thermal Comfort Management in Grid-Connected Microgrids with Heterogeneous Occupancy Schedule. Appl. Energy 2015, 149, 194–203. [Google Scholar] [CrossRef]
  24. Korkas, C.D.; Baldi, S.; Michailidis, I.; Kosmatopoulos, E.B. Occupancy-Based Demand Response and Thermal Comfort Optimization in Microgrids with Renewable Energy Sources and Energy Storage. Appl. Energy 2016, 163, 93–104. [Google Scholar] [CrossRef]
  25. Delgarm, N.; Sajadi, B.; Kowsary, F.; Delgarm, S. Multi-Objective Optimization of the Building Energy Performance: A Simulation-Based Approach by Means of Particle Swarm Optimization (PSO). Appl. Energy 2016, 170, 293–303. [Google Scholar] [CrossRef]
  26. Penna, P.; Prada, A.; Cappelletti, F.; Gasparella, A. Multi-Objectives Optimization of Energy Efficiency Measures in Existing Buildings. Energy Build. 2015, 95, 57–69. [Google Scholar] [CrossRef]
  27. Yu, W.; Li, B.; Jia, H.; Zhang, M.; Wang, D. Application of Multi-Objective Genetic Algorithm to Optimize Energy Efficiency and Thermal Comfort in Building Design. Energy Build. 2015, 88, 135–143. [Google Scholar] [CrossRef]
  28. Lu, Y.; Wang, S.; Zhao, Y.; Yan, C. Renewable Energy System Optimization of Low/Zero Energy Buildings Using Single-Objective and Multi-Objective Optimization Methods. Energy Build. 2015, 89, 61–75. [Google Scholar] [CrossRef]
  29. Carlucci, S.; Cattarin, G.; Causone, F.; Pagliano, L. Multi-Objective Optimization of a Nearly Zero-Energy Building Based on Thermal and Visual Discomfort Minimization Using a Non-Dominated Sorting Genetic Algorithm (NSGA-II). Energy Build. 2015, 104, 378–394. [Google Scholar] [CrossRef] [Green Version]
  30. Fayaz, M.; Kim, D. Energy Consumption Optimization and User Comfort Management in Residential Buildings Using a Bat Algorithm and Fuzzy Logic. Energies 2018, 11, 161. [Google Scholar] [CrossRef] [Green Version]
  31. Nguyen, T.A.; Aiello, M. Energy Intelligent Buildings Based on User Activity: A Survey. Energy Build. 2013, 56, 244–257. [Google Scholar] [CrossRef] [Green Version]
  32. Li, S.; Chen, H.; Wang, M.; Heidari, A.A.; Mirjalili, S. Slime Mould Algorithm: A New Method for Stochastic Optimization. Future Gener. Comput. Syst. 2020. [Google Scholar] [CrossRef]
  33. Faramarzi, A.; Heidarinejad, M.; Stephens, B.; Mirjalili, S. Equilibrium Optimizer: A Novel Optimization Algorithm. Knowl. Based Syst. 2020, 191, 105190. [Google Scholar] [CrossRef]
  34. Granite, E.J.; Hargis, R.A.; Pennline, H.W. Sorbents for Mercury Removal from Flue Gas (No. DOE/FETC/TR-98-01); Federal Energy Technology Center-Pittsburgh (FETC-PGH): Pittsburgh, PA, USA, 1998.
  35. Lobo, F.G.; Goldberg, D.E.; Pelikan, M. Time Complexity of Genetic Algorithms on Exponentially Scaled Problems. In Proceedings of the 2nd Annual Conference on Genetic and Evolutionary Computation, Las Vegas, NV, USA, 8 July 2000; pp. 151–158. [Google Scholar]
  36. Eberhart, R.; Kennedy, J. Particle Swarm Optimization. In Proceedings of the IEEE International Conference on Neural Networks, Perth, Australia, 27 November–1 December 1995; Volume 4. [Google Scholar]
Figure 1. Proposed firefly algorithm-genetic algorithm (FA-GA) approach for energy management.
Energies 13 04363 g001
Figure 2. Pseudocode of the proposed AI approach.
Energies 13 04363 g002
Figure 3. Temperature power consumption based on the considered approaches.
Energies 13 04363 g003
Figure 4. Temperature fuzzy controller inputs.
Energies 13 04363 g004
Figure 5. Temperature fuzzy controller outputs.
Energies 13 04363 g005
Figure 6. Applied rule for a single value based on the temperature fuzzy controller.
Energies 13 04363 g006
Figure 7. Power consumption for illumination based on the considered approaches.
Energies 13 04363 g007
Figure 8. Illumination fuzzy controller inputs.
Energies 13 04363 g008
Figure 9. Illumination fuzzy controller outputs.
Energies 13 04363 g009
Figure 10. (a) Applied rule for a single value based on the illumination fuzzy controller. (b) The power utilized with respect to illumination.
Energies 13 04363 g010
Figure 11. Power consumption for the air quality based on the considered approaches.
Energies 13 04363 g011
Figure 12. Air quality fuzzy controller inputs.
Energies 13 04363 g012
Figure 13. Air quality fuzzy controller inputs and outputs relationship.
Energies 13 04363 g013
Figure 14. Applied rule for a single value based on the air quality fuzzy controller.
Energies 13 04363 g014
Figure 15. Total power consumption based on the considered approaches.
Energies 13 04363 g015
Figure 16. Comfort index calculated.
Energies 13 04363 g016
Table 1. Notations with descriptions.
NotationDescription
TEnvironmental Temperature
TsUser Set Temperature
IEnvironmental Illumination
IsUser Set Illumination
AEnvironmental Air Quality
AsUser Set Air Quality
CIComfort Index
err1Error Difference between Environmental Temperature and User Set Temperature
err2Error Difference between Environmental Illumination and User Set Illumination
err3Error Difference Environmental Temperature and User Temperature
Prr1Preference Parameters for Temperature
Prr2Preference Parameters for Illumination
Prr3Preference Parameters for Air Quality
ETOTALTotal Required Power
ETPower Required for Temperature
EIPower Required to Illumination
EAPower Required for Air Quality
EmxMaximum Supplied Power
GAGenetic Algorithm
FAFirefly Algorithm
ABCArtificial Bee Colony
ACOArtificial Ant Colony
DEDifferential Equation
Table 2. Model parameters. FA: firefly algorithm and GA: genetic algorithm.
AlgorithmsParametersValues
FAIterations200
Population Size150
Gamma1
Beta2
Alpha0.2
GAIterations200
Population Size150
Type of Crossover One-Point Crossover
Probability of Crossover 0.5
Mutation Rate0.1
Proposed MethodIterations200
Population Size150
Gamma1
Beta2
Alpha0.2
Type of CrossoverOne-Point Crossover
Probability of Crossover Mutation Rate0.5
0.1
Table 3. Considered parameters and their value ranges.
ParameterUnitUser Lower LimitUser Upper LimitCentral PointEnvironment Lower LimitEnvironment Upper Limit
TemperatureKelvin68.078.073.060.085.0
IlluminationLux730.0880.0800.0700.0920.0
Air QualityCO2 730.0880.0800.0700.0920.0
Table 4. Temperature error differences based on the considered approaches.
GAFAABCACOPSODEFA-GA
10.5510.558.8810.349.3410.669.45
4.555.875.544.544.454.663.8
2.9652.652.6651.9963.0231.9981.75
4.5644.4533.3014.4543.5764.3432.96
3.5643.1322.6653.5643.3432.5541.45
6.5646.6655.7957.4767.3427.5546.32
8.6658.1788.2767.6657.45548.5547.34
−5.24−4.35−5.11−2.01−3.21−4.32−3.2
−3.57−3.21−3.57−3.44−3.21−4.14−3.0
−4.68−4.32−5.33−4.11−4.55−4.11−3.4
−7.13−7.23−6.47−7.24−7.11−5.77−5.1
−3.44−3.22−4.10−3.78−3.546−4.13−3.1
−2.57−2.32−2.57−3.24−2.103−3.13−1.6
−5.55−6.01−5.67−5.35−5.446−5.13−4.5
−5.13−4.99−5.13−5.02−5.436−4.55−3.1
−4.24−3.54−3.76−3.13−4.103−3.35−2.5
4.544.6753.5543.763.4534.5542.87
7.436.437.1327.455.957.555.45
3.5543.5464.443.452.693.652.5
4.2353.4433.993.343.562.9652.12
10.5510.558.8810.39.343210.6669.45
Table 5. The illumination error differences based on the considered approaches.
GAFAABCACOPSODEFA-GA
41.7737.8741.833.7634.6532.7626.87
43.65535.7730.836.7624.7630.5621.98
46.6528.8733.729.7629.8725.8722.65
25.6526.7626.837.8737.7633.5420.98
52.7644.8748.853.6763.8760.4544.76
40.8740.8733.834.4547.5450.7827.76
28.65520.9824.429.7638.6634.5515.87
39.7629.9839.639.6744.8742.7830.44
−57.22−58.1−60.3−62.3−67.3−68.2−46.3
−43.46−46.1−51.6−56.3−46.3−39.5−35.13
−45.33−39.3−39.2−46.5−43.2−41.3−28.13
−49.22−44.4−48.2−37.3−47.1−48.3−27.46
−52.23−45.2−47.4−53.6−53.4−51.4−40.43
−50.24−56.1−54.4−50.3−58.3−56.2−38.24
−58.12−51.1−60.3−51.2−49.1−55.5−45.56
−43.3−41.1−43.1−46.4−43.2−43.2−32.11
18.8714.817.823.625.8716.89.87
46.8744.748.742.841.2347.432.89
33.8731.734.830.833.9837.524.45
25.5430.623.626.939.4331.8718.65
24.87723.9824.4526.4333.5625.8716.565
Table 6. Air quality error differences based on the considered approaches.
GAFAABCACOPSODEFA-GA
138.6142134.8134.8135.7125.8121.8
76.7681.8775.8775.9875.8764.8756.87
92.7697.8791.87100.896.8794.7680.75
110.4103.8106.8103.8109.8102.791.65
153.6148.9145.8155.8150.6151.6132.7
128.8132.8130.5129.8122.8120.6113.8
80.7677.8775.8780.7680.6775.7661.65
−73.1−66.1−69.1−69.1−74.1−68.2−57.2
−71.0−71.3−71.1−68.2−72.5−69.5−55.1
−122−107−103−103−108−106.−94.2
−50.1−48.2−55.1−52.0−45.0−49.4−37.3
−78.1−81.2−78.2−89.1−81.5−76.1−66.3
−104−95.1−95.1−99.2−98.2−102−85.2
−106−110−109−116−115−119−98.2
−127−113−122−125−124−123−109
−74.2−79.1−83.1−78.1−76.1−71.1−63.2
131.7137.8132.8140.7136.8128.8121.8
77.8774.8777.9880.8779.8766.8760.76
118.9111.7116.9113.8120.5115.8102.8
96.896.87108.8105.103.997.8786.6
97.8100.7104.895.8102.7100.8782.87
Table 7. Statistical analysis based on all the considered approaches.
ParametersFeaturesGAFAABCACOPSODEFA-GA
Temperature Power ConsumptionMinimum2.165431.865552.43652.53242.15432.22391.26734
Maximum8.433568.5764410.2659.54679.56548.45786.1734
Average3.867554.597654.54315.32453.97864.12873.4167
Total187.79866192.4534193.65187.543182.565179.534159.6234
Illumination Power ConsumptionMinimum1.856541.654451.8541.595571.75641.67841.1785
Maximum6.53346.83247.2137.56846.98566.39055.16575
Average4.25544.1556443.7544.14564.39134.18453.2167
Total195.3545172.3546196.43184.6741177.653183.597152.5198
Air Quality Power ConsumptionMinimum2.32431.634451.85672.034781.78591.68191.1798
Maximum7.94337.54657.64568.12066.84237.11655.2344
Average5.576545.125444.32465.14084.89485.21093.1155
Total249.8548237.2546218.34227.5213229.643231.934197.4466
Total Power ConsumptionMinimum5.845357.4354627.43566.94456.47866.76594.3453
Maximum14.453728.345623.54616.897617.781220.37613.8335
Average11.343213.345612.42311.598712.198713.2389.6687
Total589.453561.6376594.56577.534568.385571.431523.3853
Comfort IndexMinimum0.943210.945340.93560.947680.949870.941670.95734
Maximum0.974350.964350.964350.968430.968710.967310.9873
Average0.955640.957670.95340.951650.95900.949560.9658

