Article

Understanding the Effect of Cementitious Grouting Pressure on Micro-Fracture Permeability for Rock Reinforcement Underground: A Lab Study

State Key Laboratory for Geomechanics and Deep Underground Engineering, China University of Mining and Technology, Xuzhou 221116, China
*
Author to whom correspondence should be addressed.
Energies 2020, 13(16), 4225; https://doi.org/10.3390/en13164225
Submission received: 12 July 2020 / Revised: 12 August 2020 / Accepted: 14 August 2020 / Published: 15 August 2020

Abstract

:
In grouting support projects, due to the small concealment of micro-fractures, the support effect often fails to meet design requirements. The percolation effect is a common factor that causes grouting failure, and the influence of grouting pressure on the percolation effect is very obvious. In this article, a design of a micro-fracture grouting experimental system is presented that can realize high-pressure grouting and then uses a variety of ultrafine cements to carry out high- and low-pressure grouting tests under different fracture opening conditions, thereby obtaining the grouting pressure and accumulated grouting weight during the grouting process. The results show that a combination of the grouting pressure curve and the cumulative grouting weight curve can determine whether the ultrafine cement will have a percolation effect. Increasing the grouting pressure can reduce the critical fracture opening value and also reduce the occurrence of the percolation effect. The research results provide a theoretical basis for the high-pressure grouting of micro-fracture rock masses and offer certain guiding significance for the design of high-pressure grouting support schemes.

Graphical Abstract

1. Introduction

With the continuous reduction of shallow coal resources, coal mines in many areas have entered the mining stage featuring wells thousands of meters deep [1]. Deep coal mining is the main direction of coal mine development in the future [2,3]. Unlike shallow coal mining, deep coal mining is exposed to high in situ stress and poor surrounding rock lithology, which makes it particularly difficult to support mine roadways. Under the action of high in situ stress, the fractures in the surrounding rocks of the roadway are commonly squeezed closed or squeezed into micro-fractures with small openings [4,5,6]. Due to the concealment of these micro-fractures, the supporting effect is poor. Under the action of long-term seepage factors, the surrounding rock mass of the roadway becomes seriously weakened, causing the roadway to significantly deform, affecting the construction progress and even causing casualties [7,8].
As a commonly used engineering support technology, grouting support has a significant effect on the reinforcement and seepage prevention when engineering surrounding rocks [9]. Grouting mainly involves injecting the grouting slurry into the fracture through grouting pressure, filling the fissure through the solidification of the slurry, and cementing the rock mass together to reinforce the surrounding rock. Through grouting, the surrounding rock can be modified to improve the overall bearing capacity of the rock mass [10].
For micro-fracture rock masses, chemical grouting materials are usually used because of the good injectability of organic materials and the low viscosity of the slurry [11]. Due to the low strength, poor durability, and environmental pollution of chemical grouting materials, they are banned in many projects. Compared to chemical grouting materials, ordinary Portland cement has obvious advantages, such as a lack of environmental pollution, high stone strength, good durability, and rich material sources [12]. However, ordinary Portland cement is a typical granular inorganic grouting material. After it is mixed with water, the cement particles are suspended in the slurry, forming a complex solid–liquid two-phase fluid. Due to the large particle size of the cement particles, the cement particles will block the entrance of the micro-fractures making it difficult to inject into the micro-fractures [13,14]. This phenomenon is called the percolation effect. During the grouting process, the percolation effect has a serious impact on the grouting effect. Cement particles will gradually accumulate at the entrance of the fracture and eventually block the fracture channel, resulting in the failure of the grouting. Especially for micro-fracture rock masses, this phenomenon is very obvious, so it is particularly important to study the cement slurry percolation effect under micro-fracture conditions.
At present, some scholars have studied the percolation characteristics of cement slurries using laboratory tests. The research methods are mainly divided into two types: filtration tests and fracture tests. A filtration test uses a filter device to indirectly simulate the fractures in the rock mass and study the slurry weight after the slurry passes through the filter device to judge the slurry percolation effect. For example, Jorne and Henriques [15], using a grouting test on a porous medium cylinder model, found that pore size and solid particle grading were the main factors affecting the groutability of the slurry. Axelsson et al. [16] measured two characteristic fracture openings of a cement slurry using experiments—namely, the minimum injectable fracture opening size and the minimum non-filtration fracture opening size. The fracture test uses a combination of two plates to simulate a real rock fracture and evaluates the percolation behavior of the slurry in the fracture by studying the grouting pressure and cumulative flow during the grouting process. For example, Eriksson et al. [17], through multiple repeated experiments, confirmed that the water–cement ratio, cement properties, and mixing equipment have significant effects on the cement slurry fluidity parameters. Through various cement grouting tests, Eklund and Stille [18] found that the cement particle size and particle size distribution are very important for cement slurry infiltration.
The research conducted above is of great significance for understanding the percolation characteristics of the slurry in a fracture. However, due to the limitations of the test models, most of the current research results were carried out under low grouting pressure; the highest was only 1.5 MPa. In engineering practice, especially during the construction of grouting supports for micro-fractured rock masses, the support effect under low grouting pressure is very limited. We thus need to increase the grouting pressure to ensure the supporting effect of the grouting. However, the percolation characteristics of the slurry under high grouting pressure remain to be explored.
Therefore, in this article, the design of a micro-fracture grouting experimental system is presented that can realize high-pressure grouting. Through a percolation test of the high-pressure and low-pressure grouting slurry under the micro-fracture model, the variation rules of grouting pressure and cumulative grouting weight during grouting were studied, and the percolation characteristics under different conditions were obtained. The slurry percolation characteristics under different conditions were also obtained, thereby providing a basis for grouting micro-fracture rock masses under high grouting pressure. This study will have a very important guiding role in the grouting of micro-fracture rock masses and related grouting construction design.

2. Development of the High-Pressure Grouting Test System for Micro-Fractures

The high-pressure grouting test system for micro-fractures is mainly composed of a grouting system, a micro-fracture model, and a data collection system for grouting pressure and cumulative weight. The grouting system simulates the grouting pump in the actual project, which uses high-pressure gas to drive the cement slurry into the micro-fracture model under constant grouting pressure. The pressure and weight during the grouting process are automatically recorded by the data collection system. The key technical parameters of the test device are introduced in detail below.

2.1. Grouting System

The grouting system is mainly composed of the following parts: nitrogen bottle, pressure reducing valve, pressure control system, slurry storage container, stirring device, and high-pressure gas pipeline. The nitrogen bottle is a high-pressure gas source; the highest pressure is 12.5 MPa. This high-pressure gas is connected to the pressure control system through the high-pressure gas pipeline after passing through the pressure reducing valve. The pressure reducing valve can set the maximum output pressure during the test, and the pressure control system can be operated by the pressure regulator and cut-off valve on the control panel to release, adjust, and cut off the high-pressure gas. The high-pressure gas flows out from the pressure control system and is connected to the slurry storage container. The slurry storage container is used to store the cement slurry required for the test, and a stirring device is installed at the bottom of the slurry storage container to ensure that the cement slurry will not separate and precipitate during the grouting process. Each part of the high-pressure grouting system is shown in Figure 1.

2.2. Micro-Fracture Model

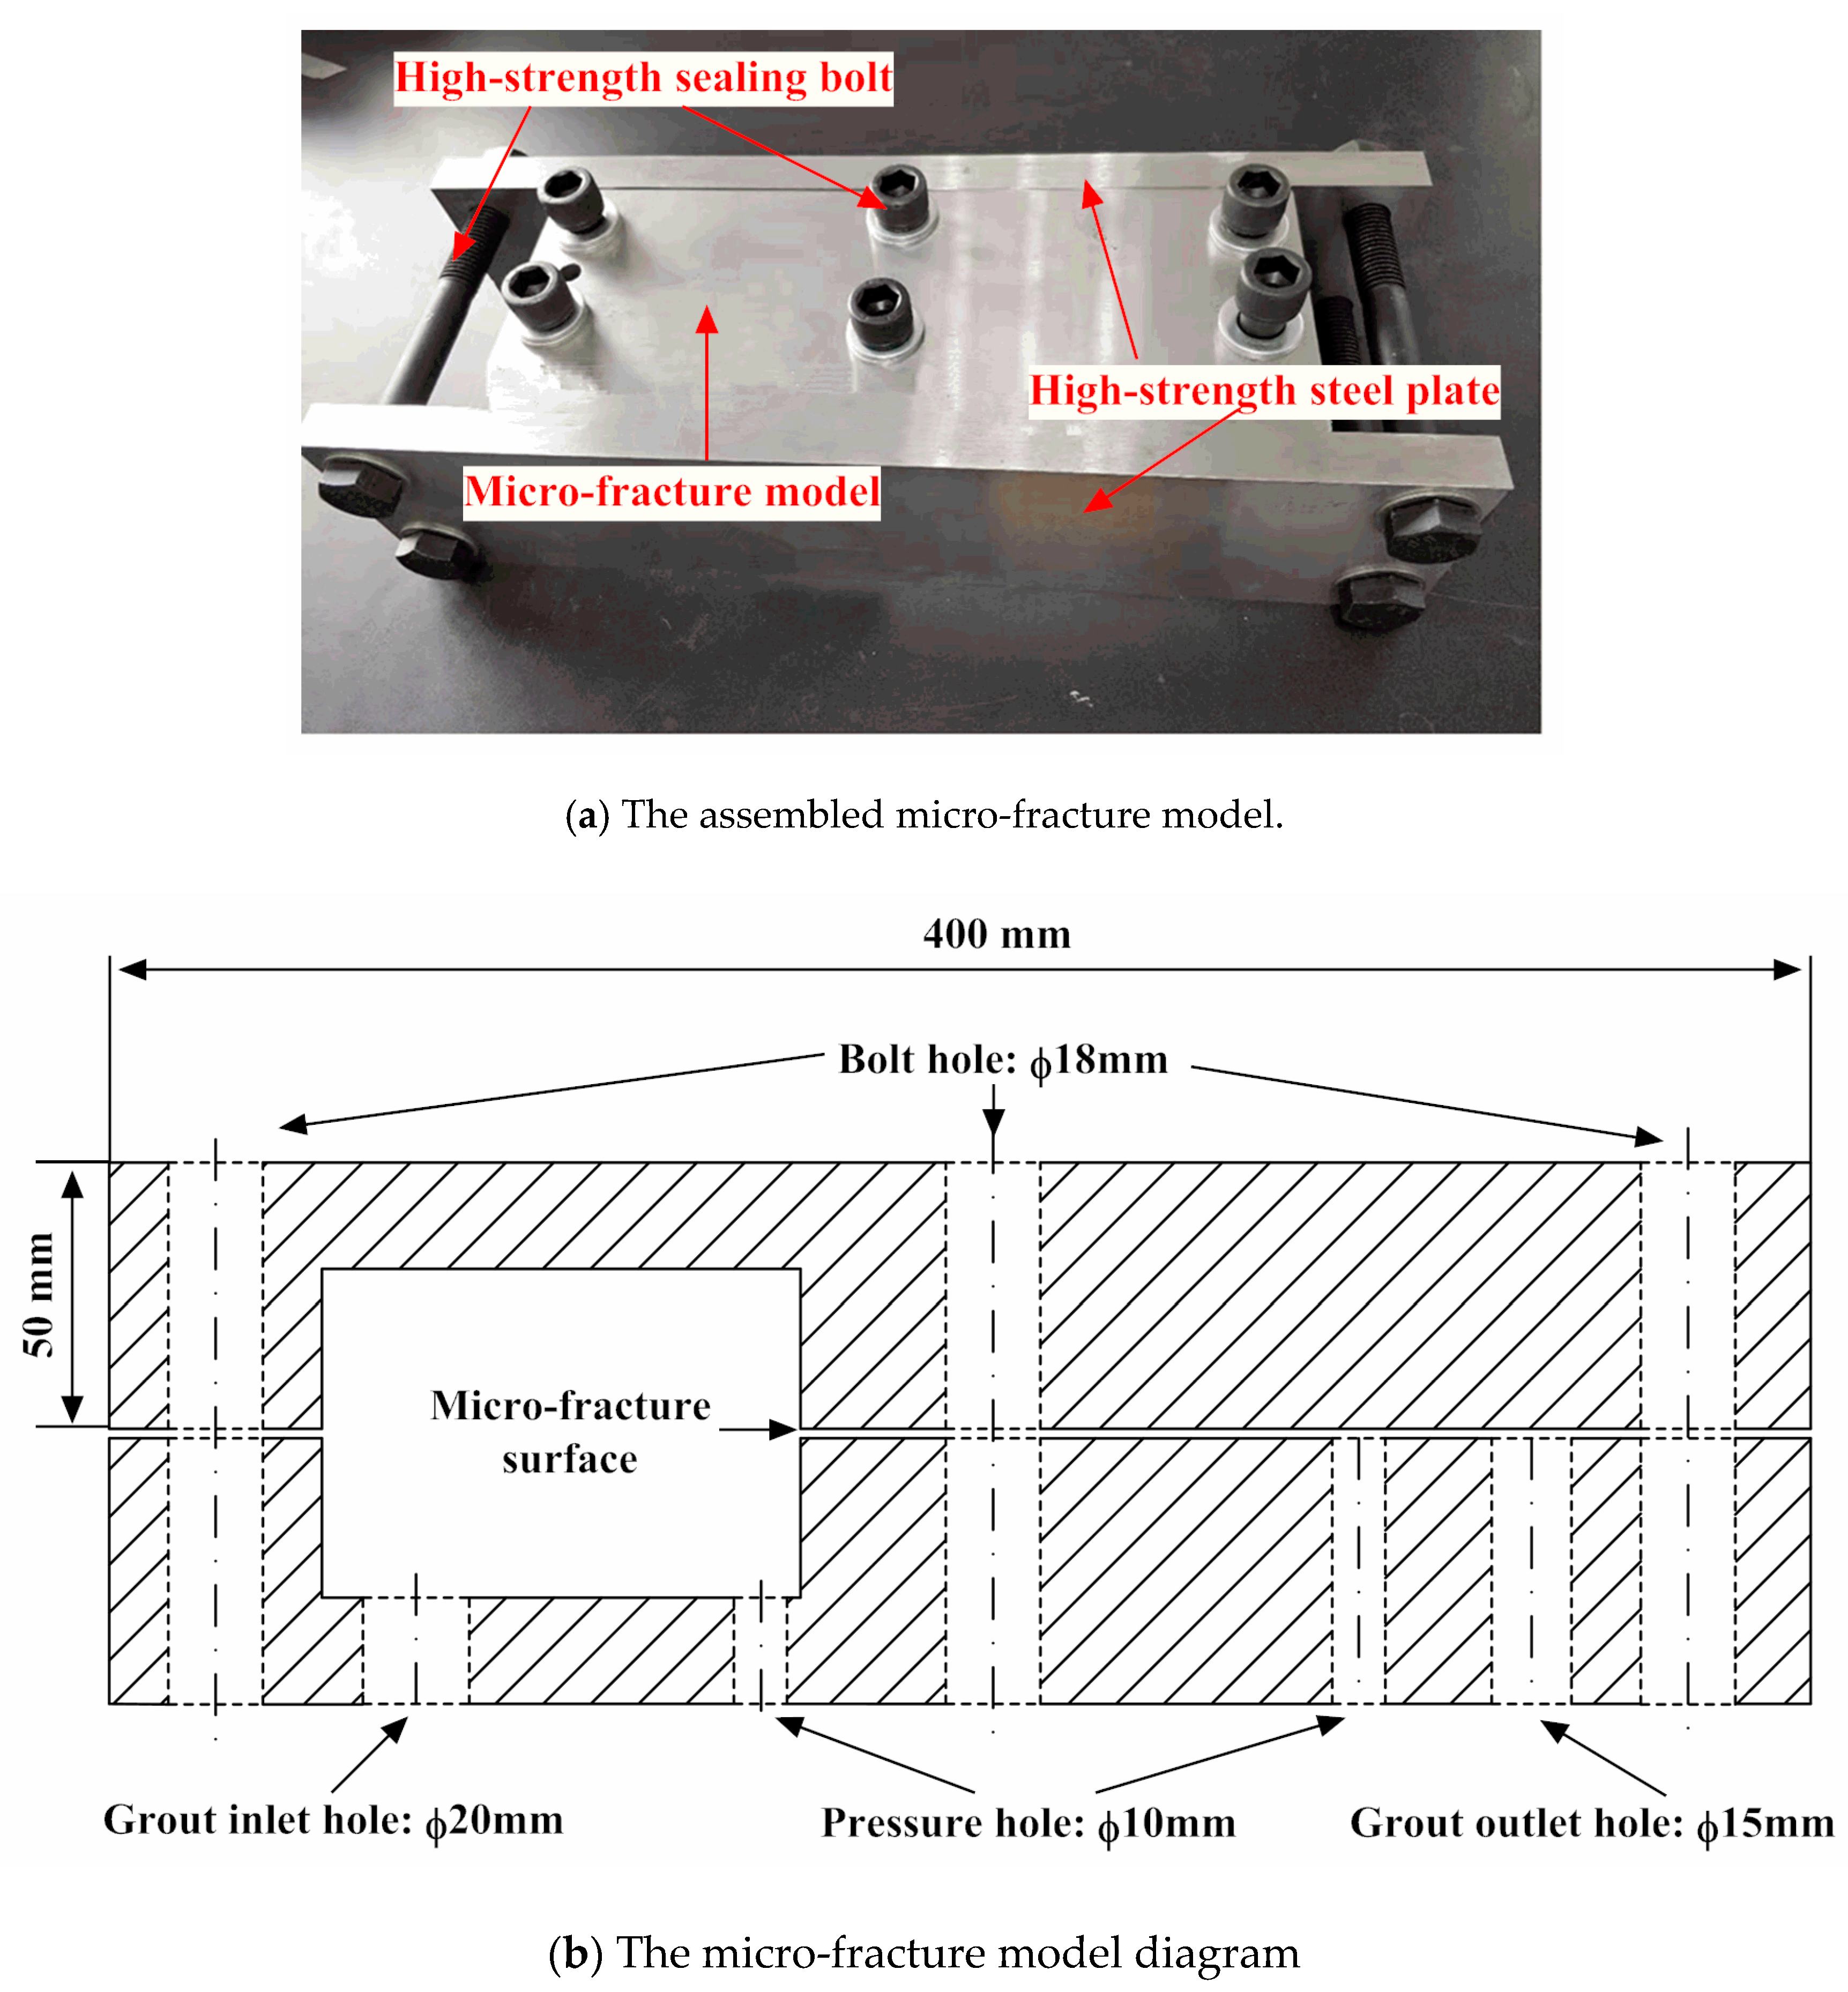
The micro-fracture model is composed of high-strength steel plates fixed together by sealing bolts, as shown in Figure 2. The model is 400 mm in length, 100 mm in width, and 100 mm in height. The cavity on the left side of the model simulates the drilling of a rock mass in an actual project, and the two upper and lower steel plate planes on the right form a micro-fracture. In this way, the model simulates the penetration of slurry from rock drilling into the fracture in an actual grouting project. The upper and lower parts of the model are fastened together by six high-strength sealing bolts (sized φ18 mm × 120 mm). The opening of the fracture on the right side of the model is controlled by placing six ultrathin stainless-steel gaskets of the same size between the two steel plate planes. The high-precision polishing technology is used to process the fracture surface to ensure that the upper and lower fracture surfaces are smooth and sufficiently parallel.
An inlet pressure monitoring hole is set in the left cavity of the fracture model immediately adjacent to the fracture entrance. An outlet pressure monitoring hole is set on the fracture surface on the right side of the model. These two pressure taps are used to install pressure transmitters. A slurry outlet is arranged close to the outlet pressure monitoring hole. When the slurry flows here, it will flow into the slurry collection barrel along the overflow hole, as shown in Figure 2.
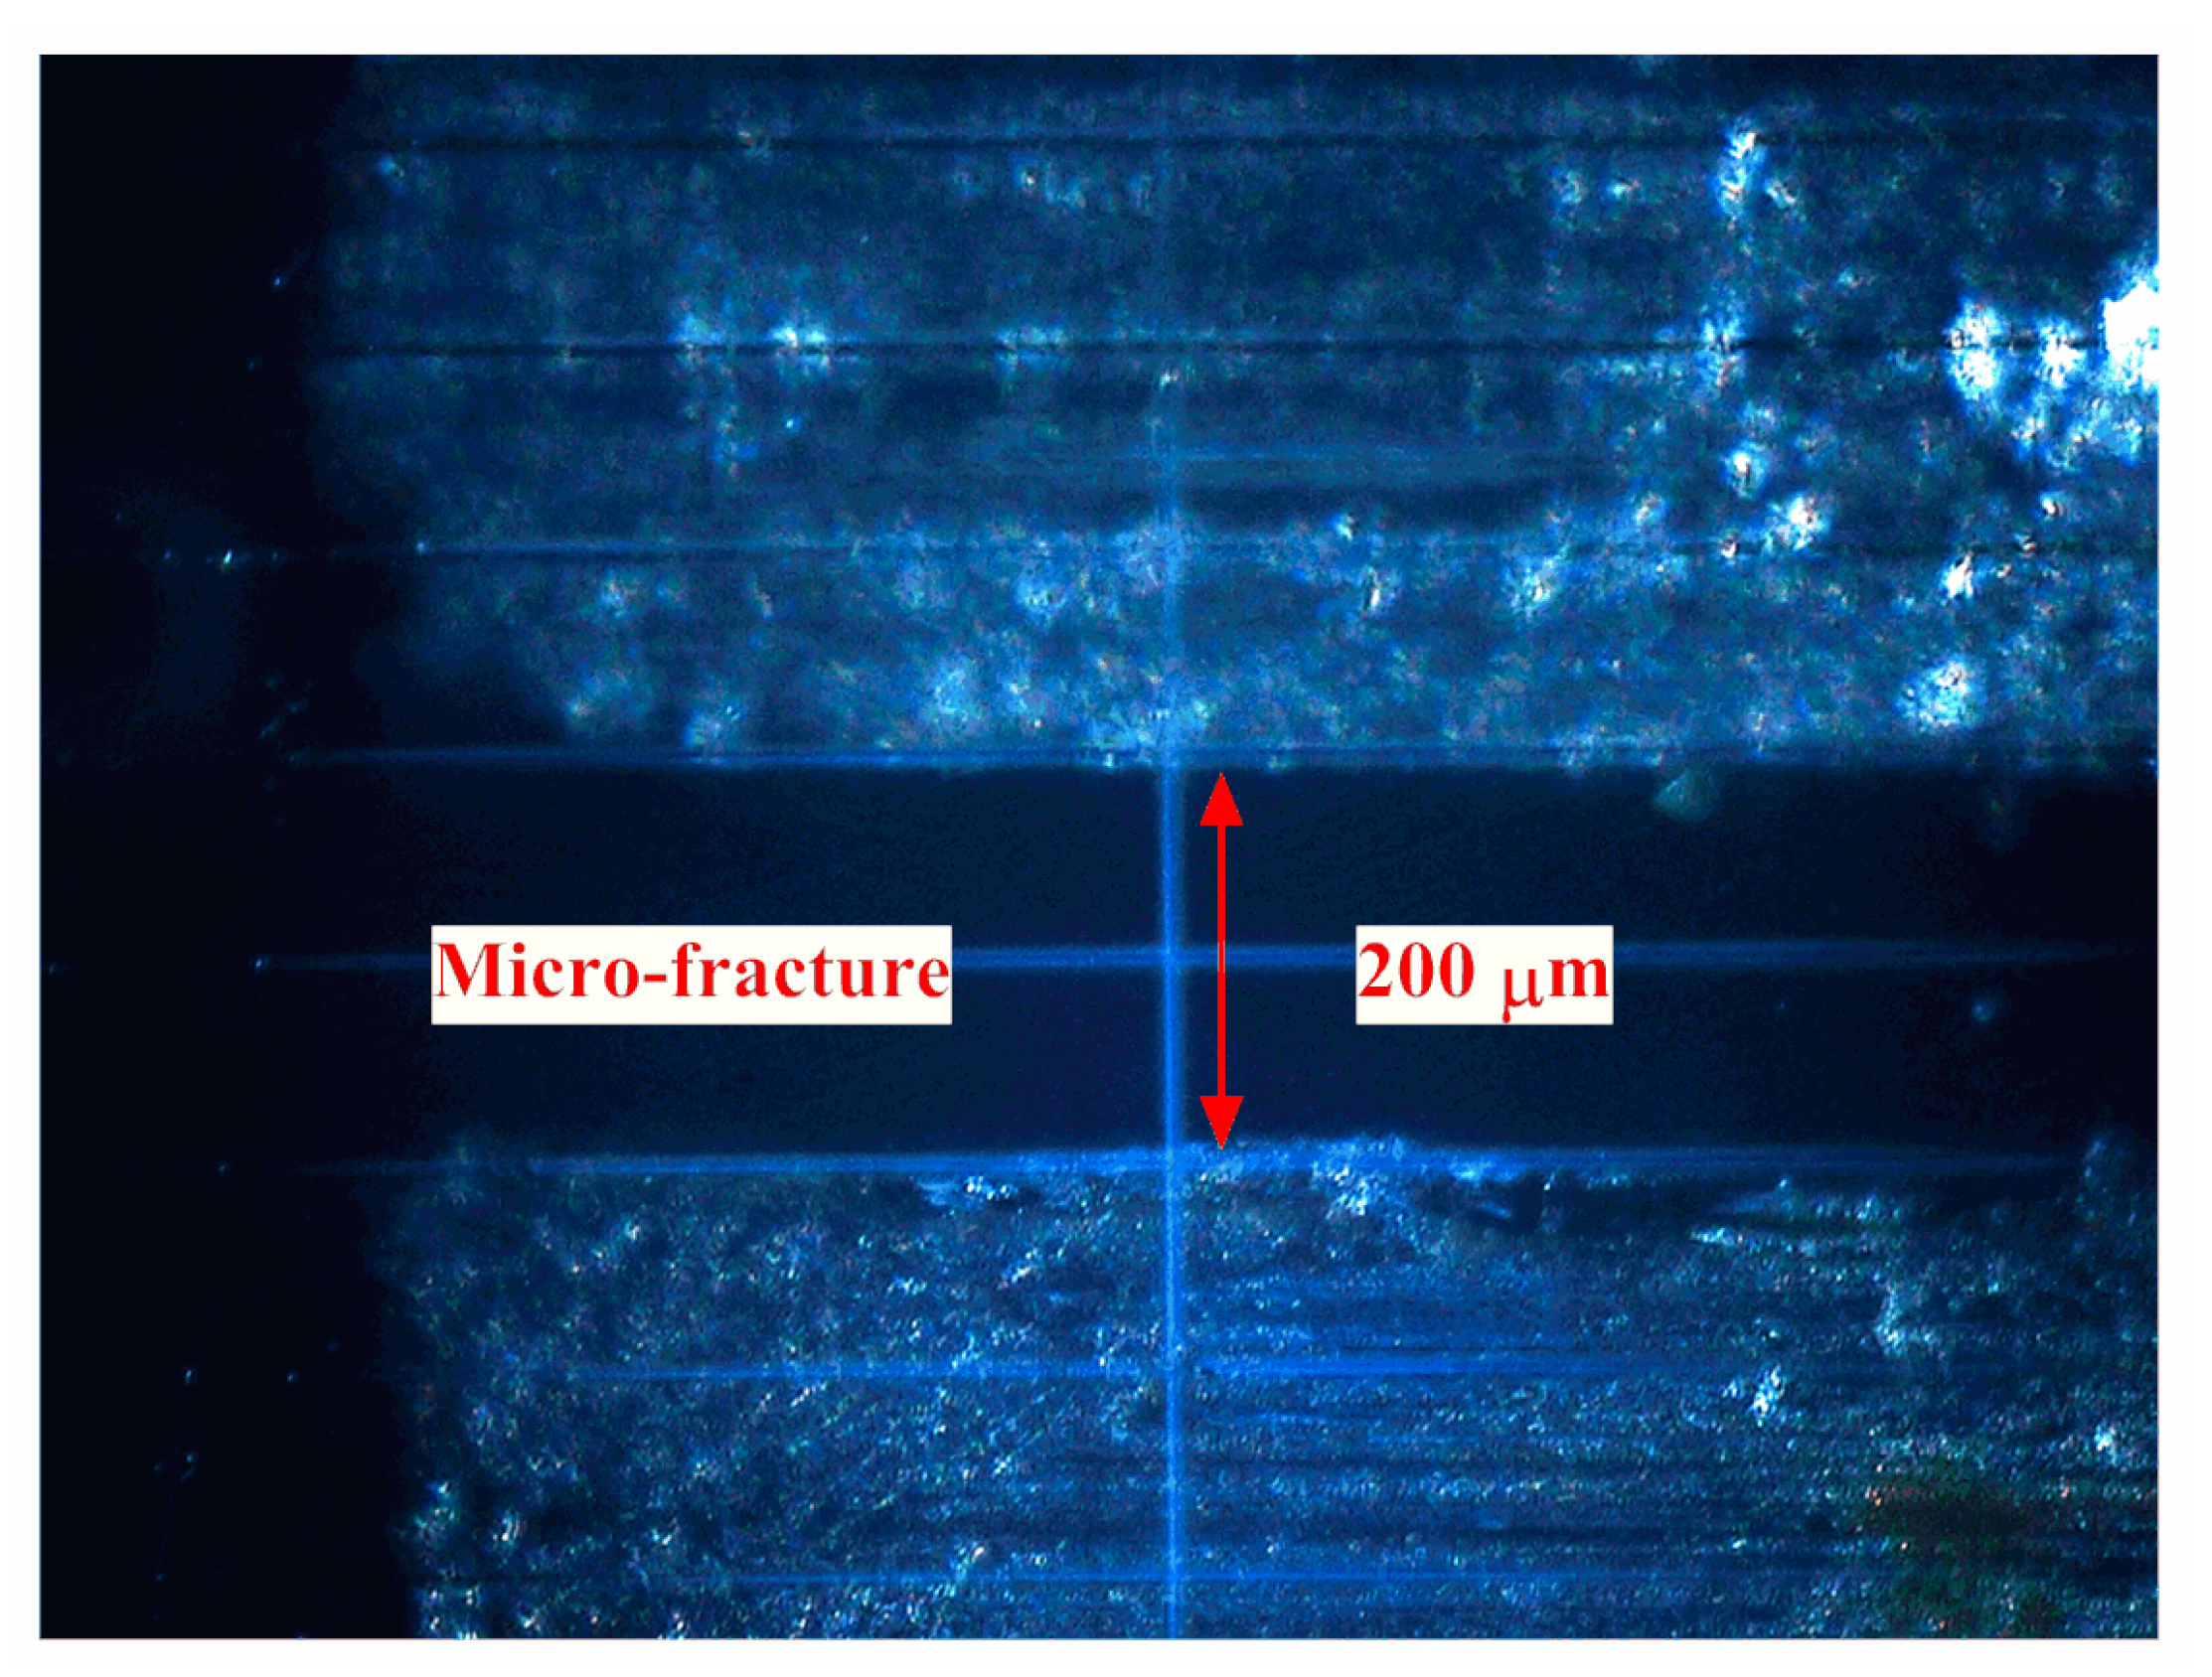
To ensure the tightness of the model, a layer of silicone pads (thickness, 1 mm) are placed on the front and back sides of the fracture model, high-strength steel plates (thickness, 30 mm) are arranged close to the silicone pads, and then four sets of high-strength sealing bolts (dimensions, φ10 mm × 50 mm) are used to form the fracture model and the sealing steel plate as a whole, as shown in Figure 3. The silicone pad has the advantages of low surface tension and tear resistance, which can effectively ensure the sealing of the fracture model. High-precision polishing technology is used to grind a groove of a certain depth on the right side of the lower plate of the device to form a grouting channel. During the test, fracture openings of 50 μm, 100 μm, 150 μm, 200 μm, 250 μm, and 300 μm (six cases) were selected for the test. After the model was assembled, the fracture opening degree was observed and measured by a long-distance microscope to determine the true fracture opening degree.

2.3. Data Collection System

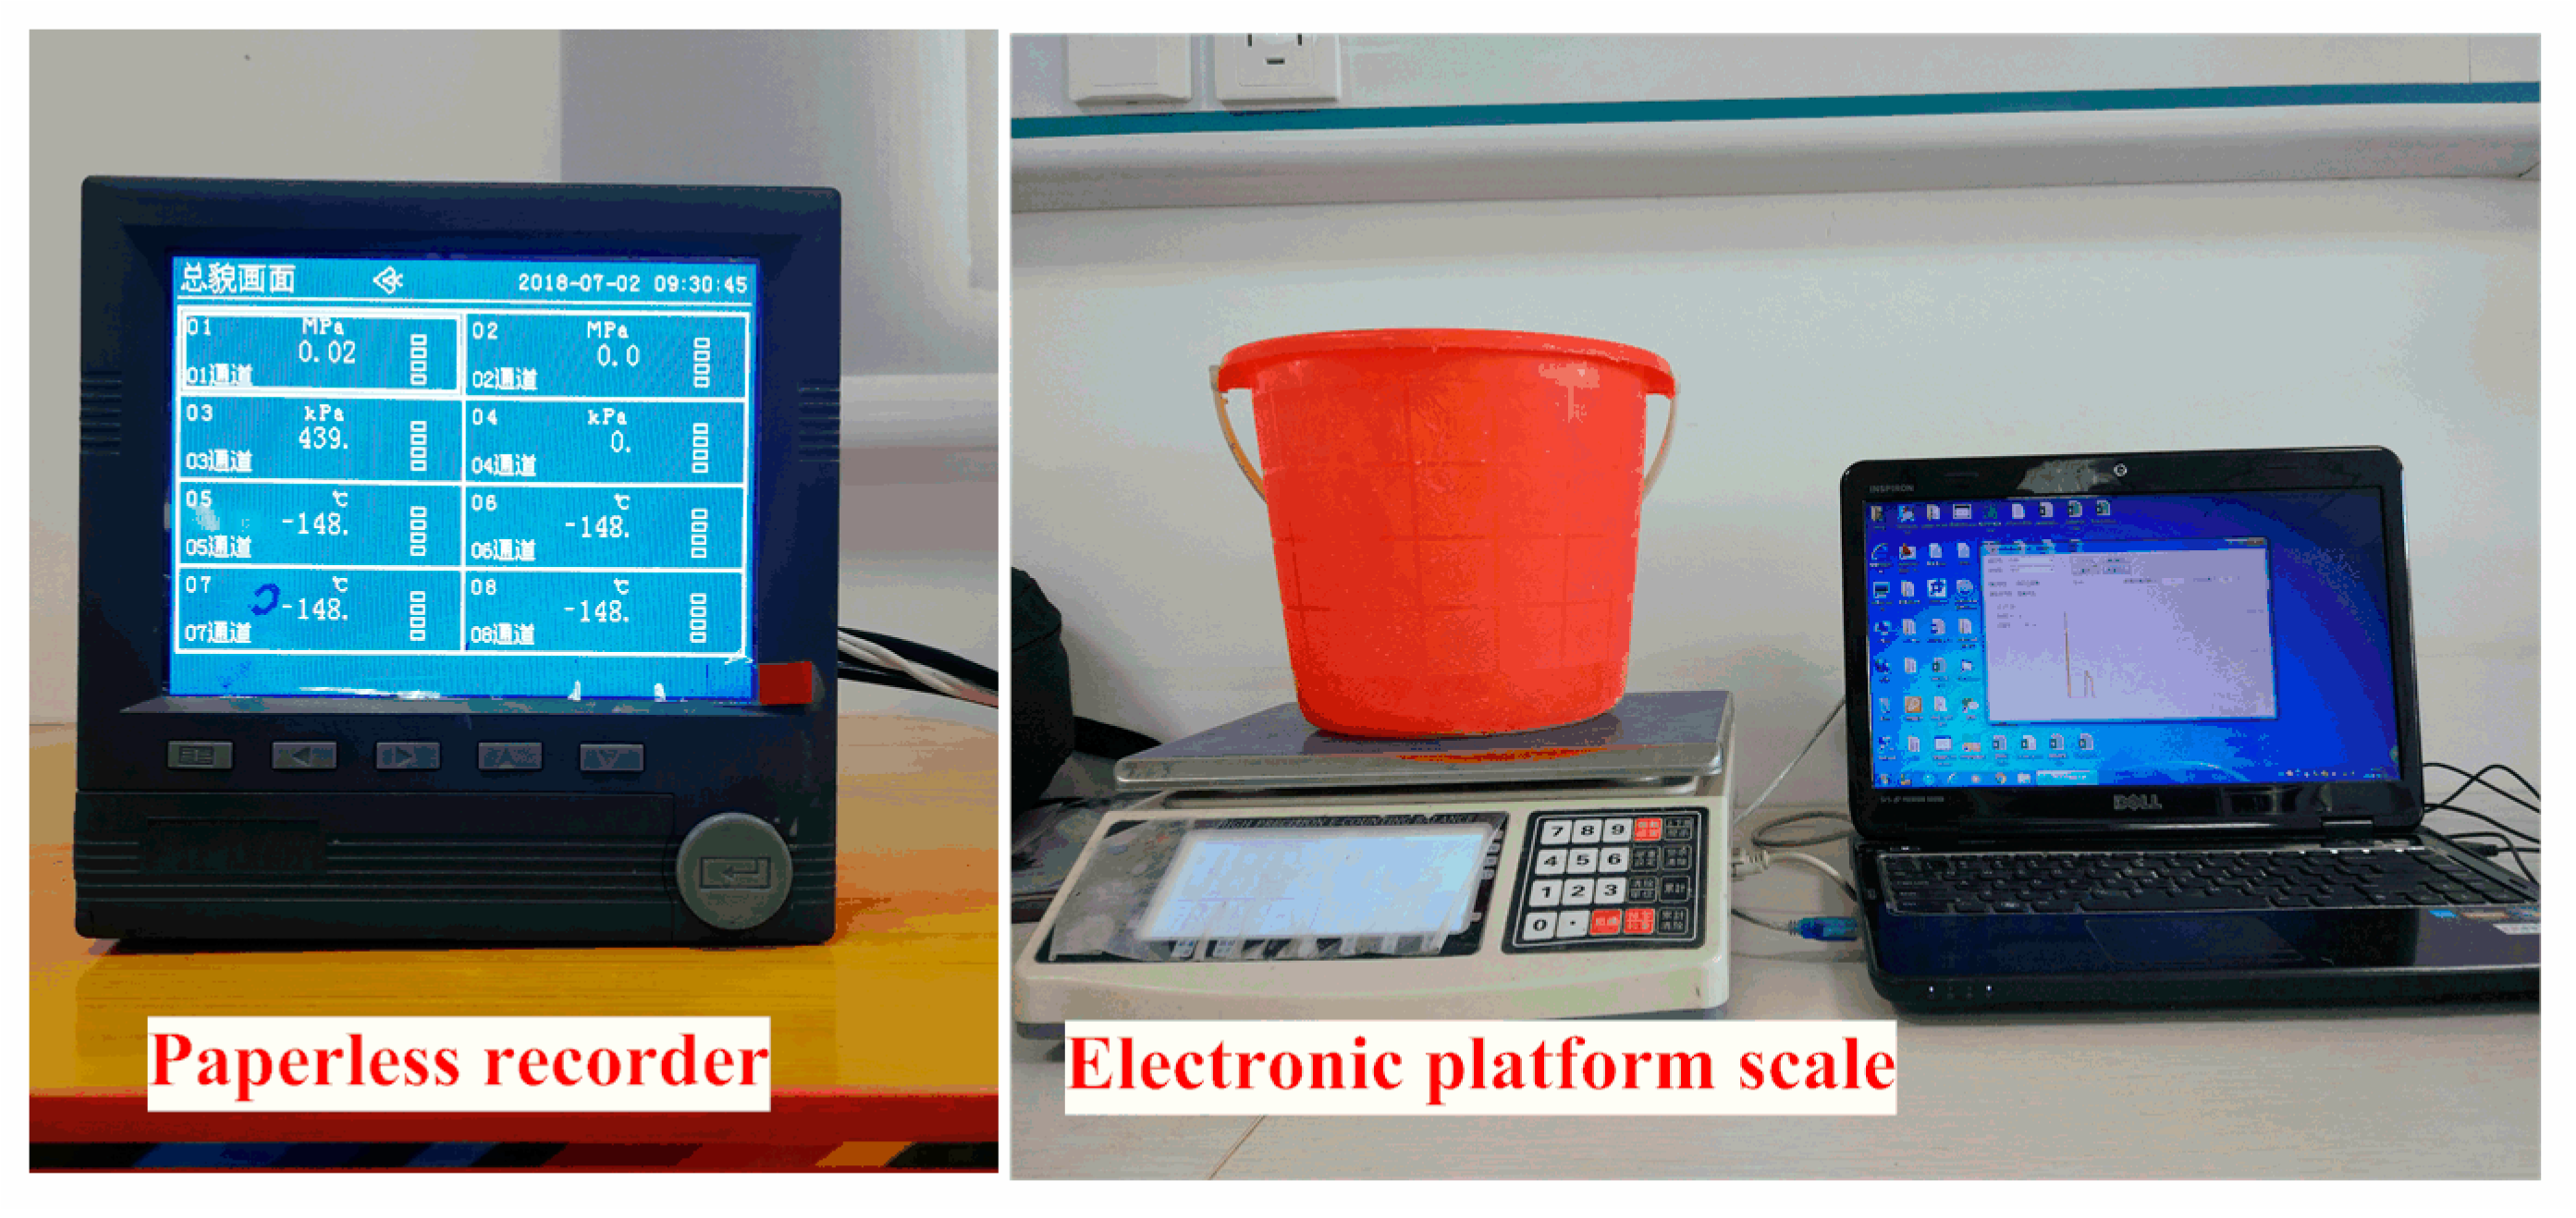
During the grouting test, pressure sensors and precision electronic scales were used to monitor the real-time monitoring of the grouting pressure and the cumulative outlet weight, respectively, as shown in Figure 4. The grouting pressure measurement uses a pressure transmitter to directly collect and record information. Its measurement accuracy is 0.025 MPa, and its range is 0–10 MPa. The cumulative outlet weight is monitored using a high-precision industrial electronic platform scale to measure the weight in the slurry collection barrel below the overflow hole of the micro-fracture model in real time. The measurement accuracy of the electronic platform scale is 0.1 g, and the measuring range is 0–3000 g.

3. Materials and Methods

3.1. Test Materials

The cement used in the experiment was ultrafine cement produced by Shandong Guangxing New Material Technology Co., Ltd. (Linyi, China). According to the particle size d95, this cement was divided into four kinds of superfine cement named UPC45, UPC24, UPC15, and UPC13. The main technical parameters are shown in Table 1.
A pure cement slurry has poor fluidity and injectability. Especially for ultrafine cement, due to its small particle size and large specific surface area, agglomeration between the slurry cement particles is likely to occur, resulting in a significant decrease in slurry fluidity. However, this phenomenon can be improved by incorporating a certain proportion of additives. A high-efficiency water-reducing agent can have a strong dispersion effect on the slurry cement particles and can effectively disperse the agglomeration between the cement particles in the slurry, thereby significantly improving its flow performance. Therefore, a high-performance polycarboxylic acid water-reducing agent was used in this experiment to improve the fluidity of the cement. In this study, the content of the high-efficiency water-reducing agent is 1.5%.

3.2. Test Methods

To study the influence of grouting pressure on the grout percolation phenomenon in a micro-fracture, grouting tests under low-pressure grouting (1.0 MPa) and high-pressure grouting (5.0 MPa) were carried out via the self-designed high-pressure grouting system and micro-fracture model, and the laws of grouting pressure and cumulative weight during the grouting process were obtained. Four kinds of ultrafine cement (UFC45, UFC24, UFC15, and UFC13) were used for the grouting tests under different fracture sizes (50 μm, 100 μm, 150 μm, 200 μm, 250 μm, and 300 μm). The experiment started with a fracture opening of 150 μm. If the slurry failed to pass completely under the fracture opening of 150 μm, a grouting test with a fracture opening of 200 μm was conducted. On the contrary, if the slurry completely passed under the condition of a fracture opening of 150 μm, a grouting test under the condition of a fracture opening of 100 μm was conducted. Finally, the minimum injectable fracture opening and the minimum non-filtration fracture opening were determined.

4. Test Results and Discussion

4.1. Test Results of Low-Pressure Grouting

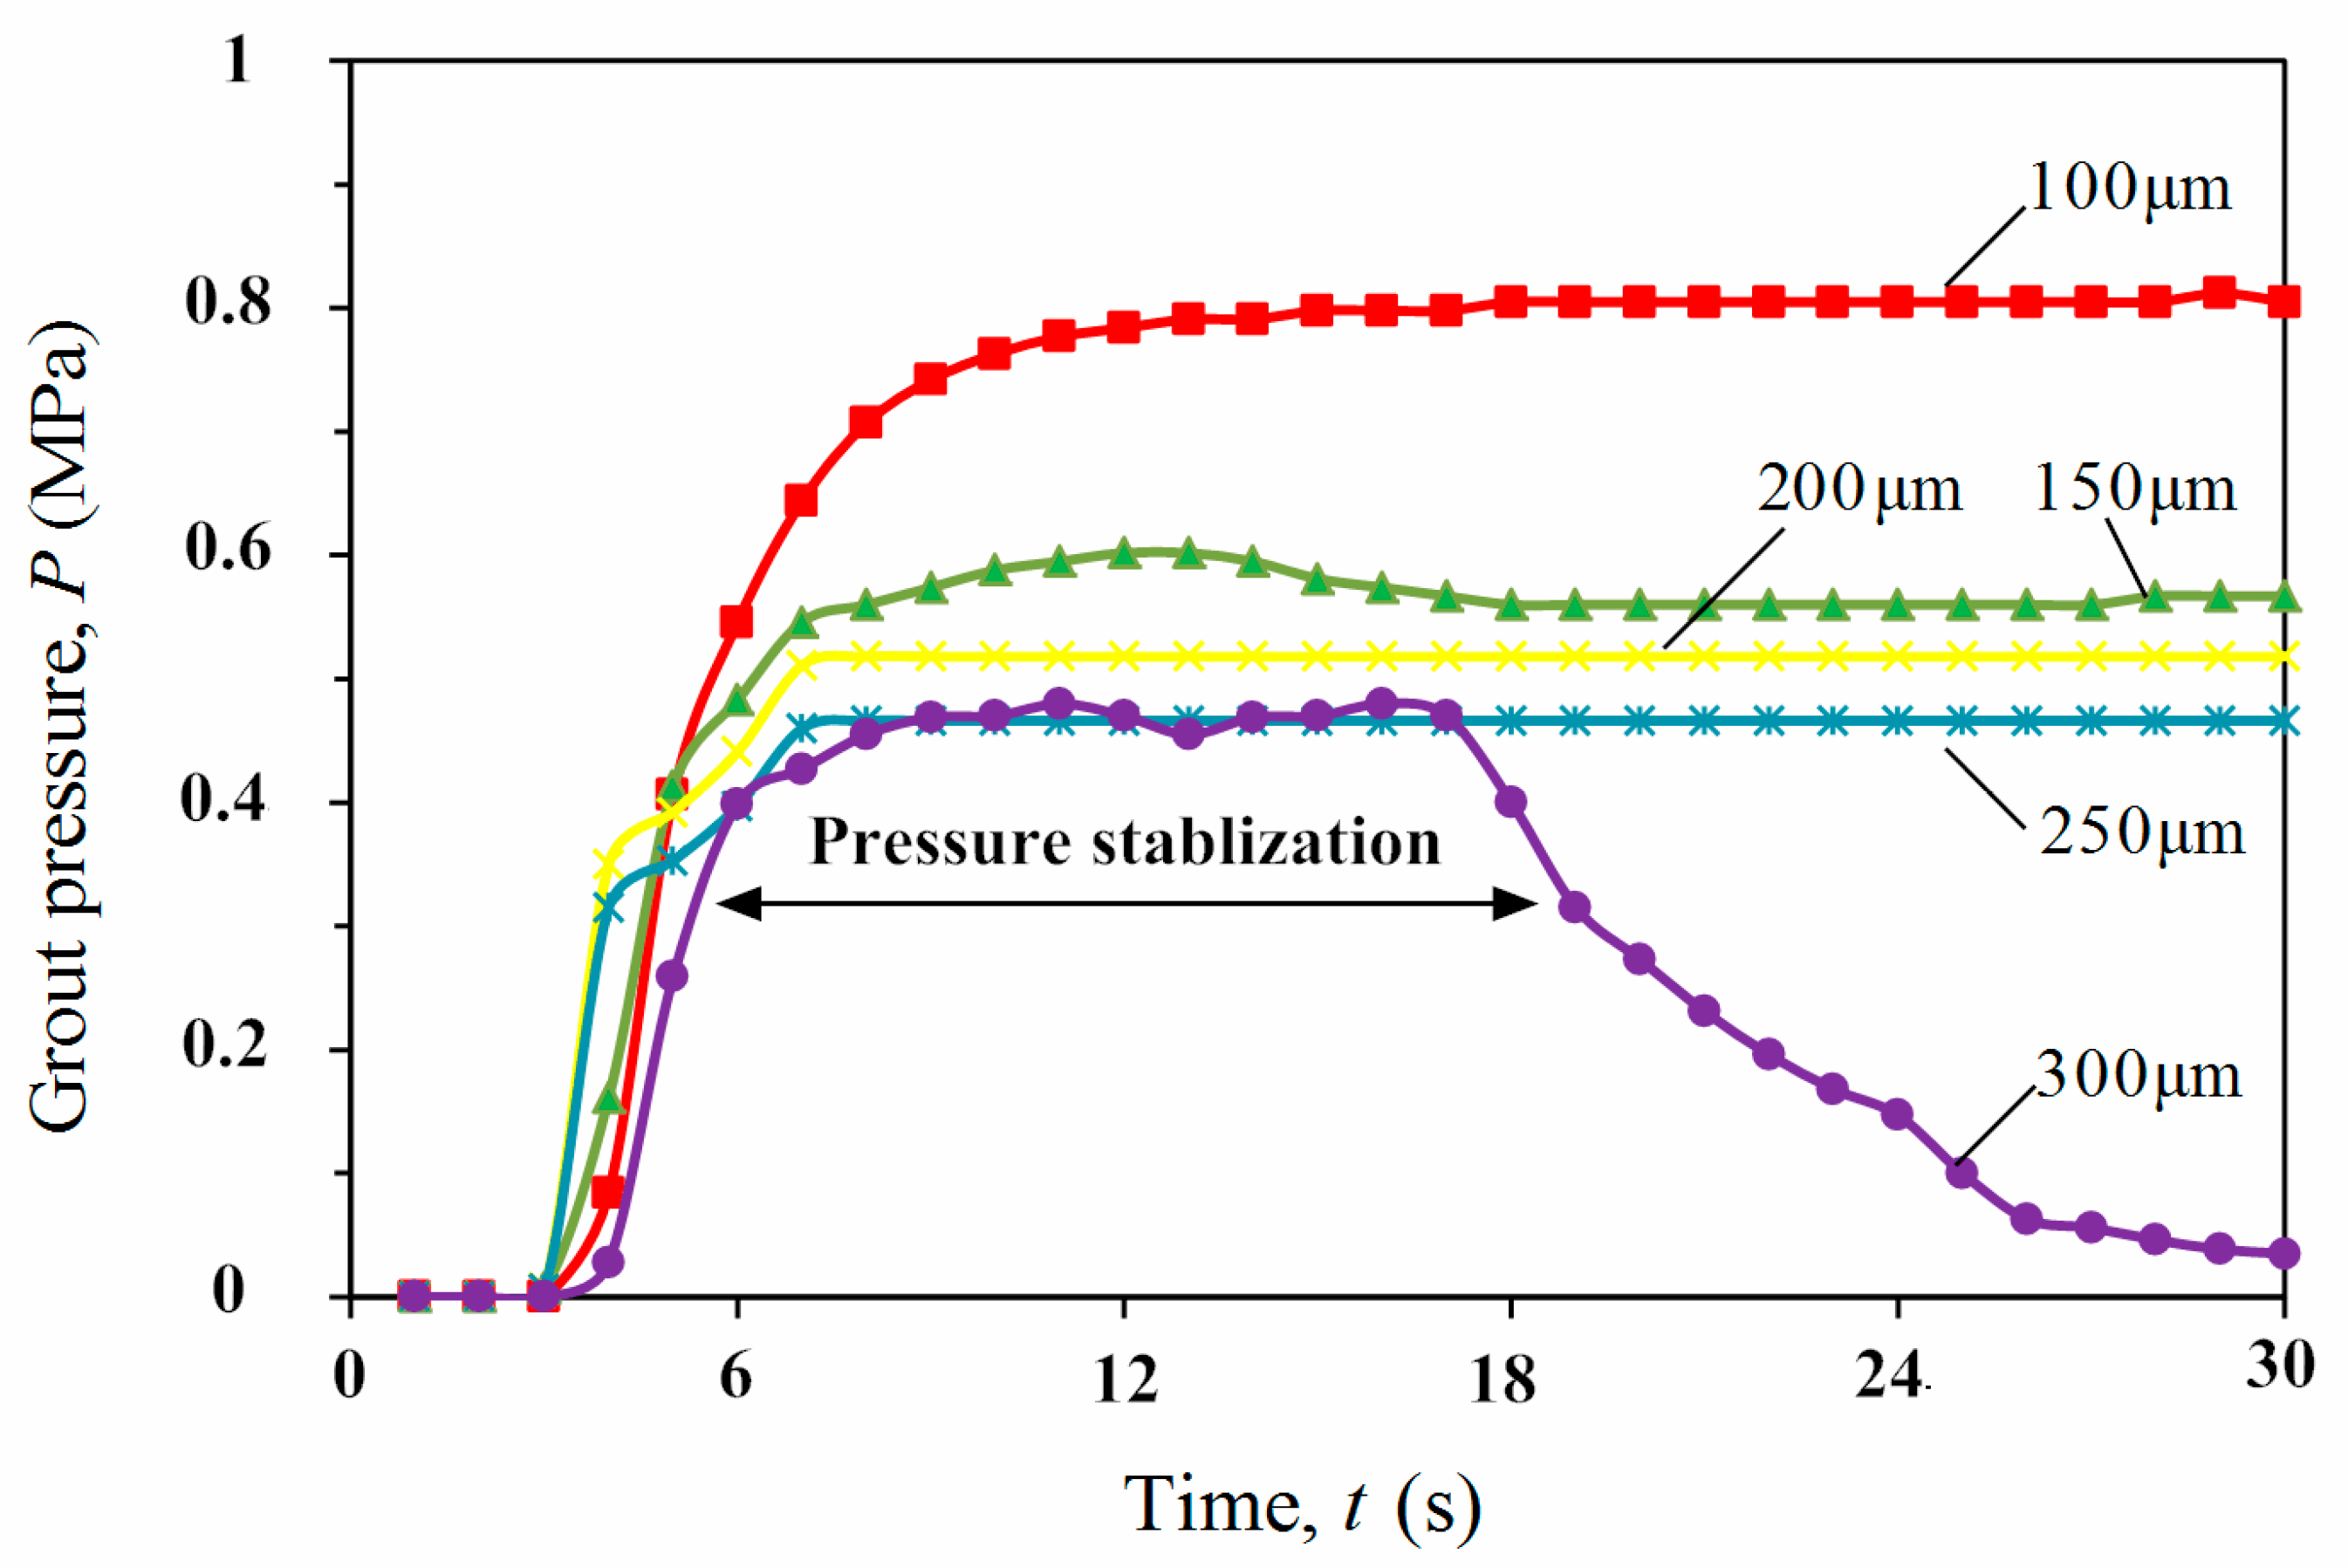
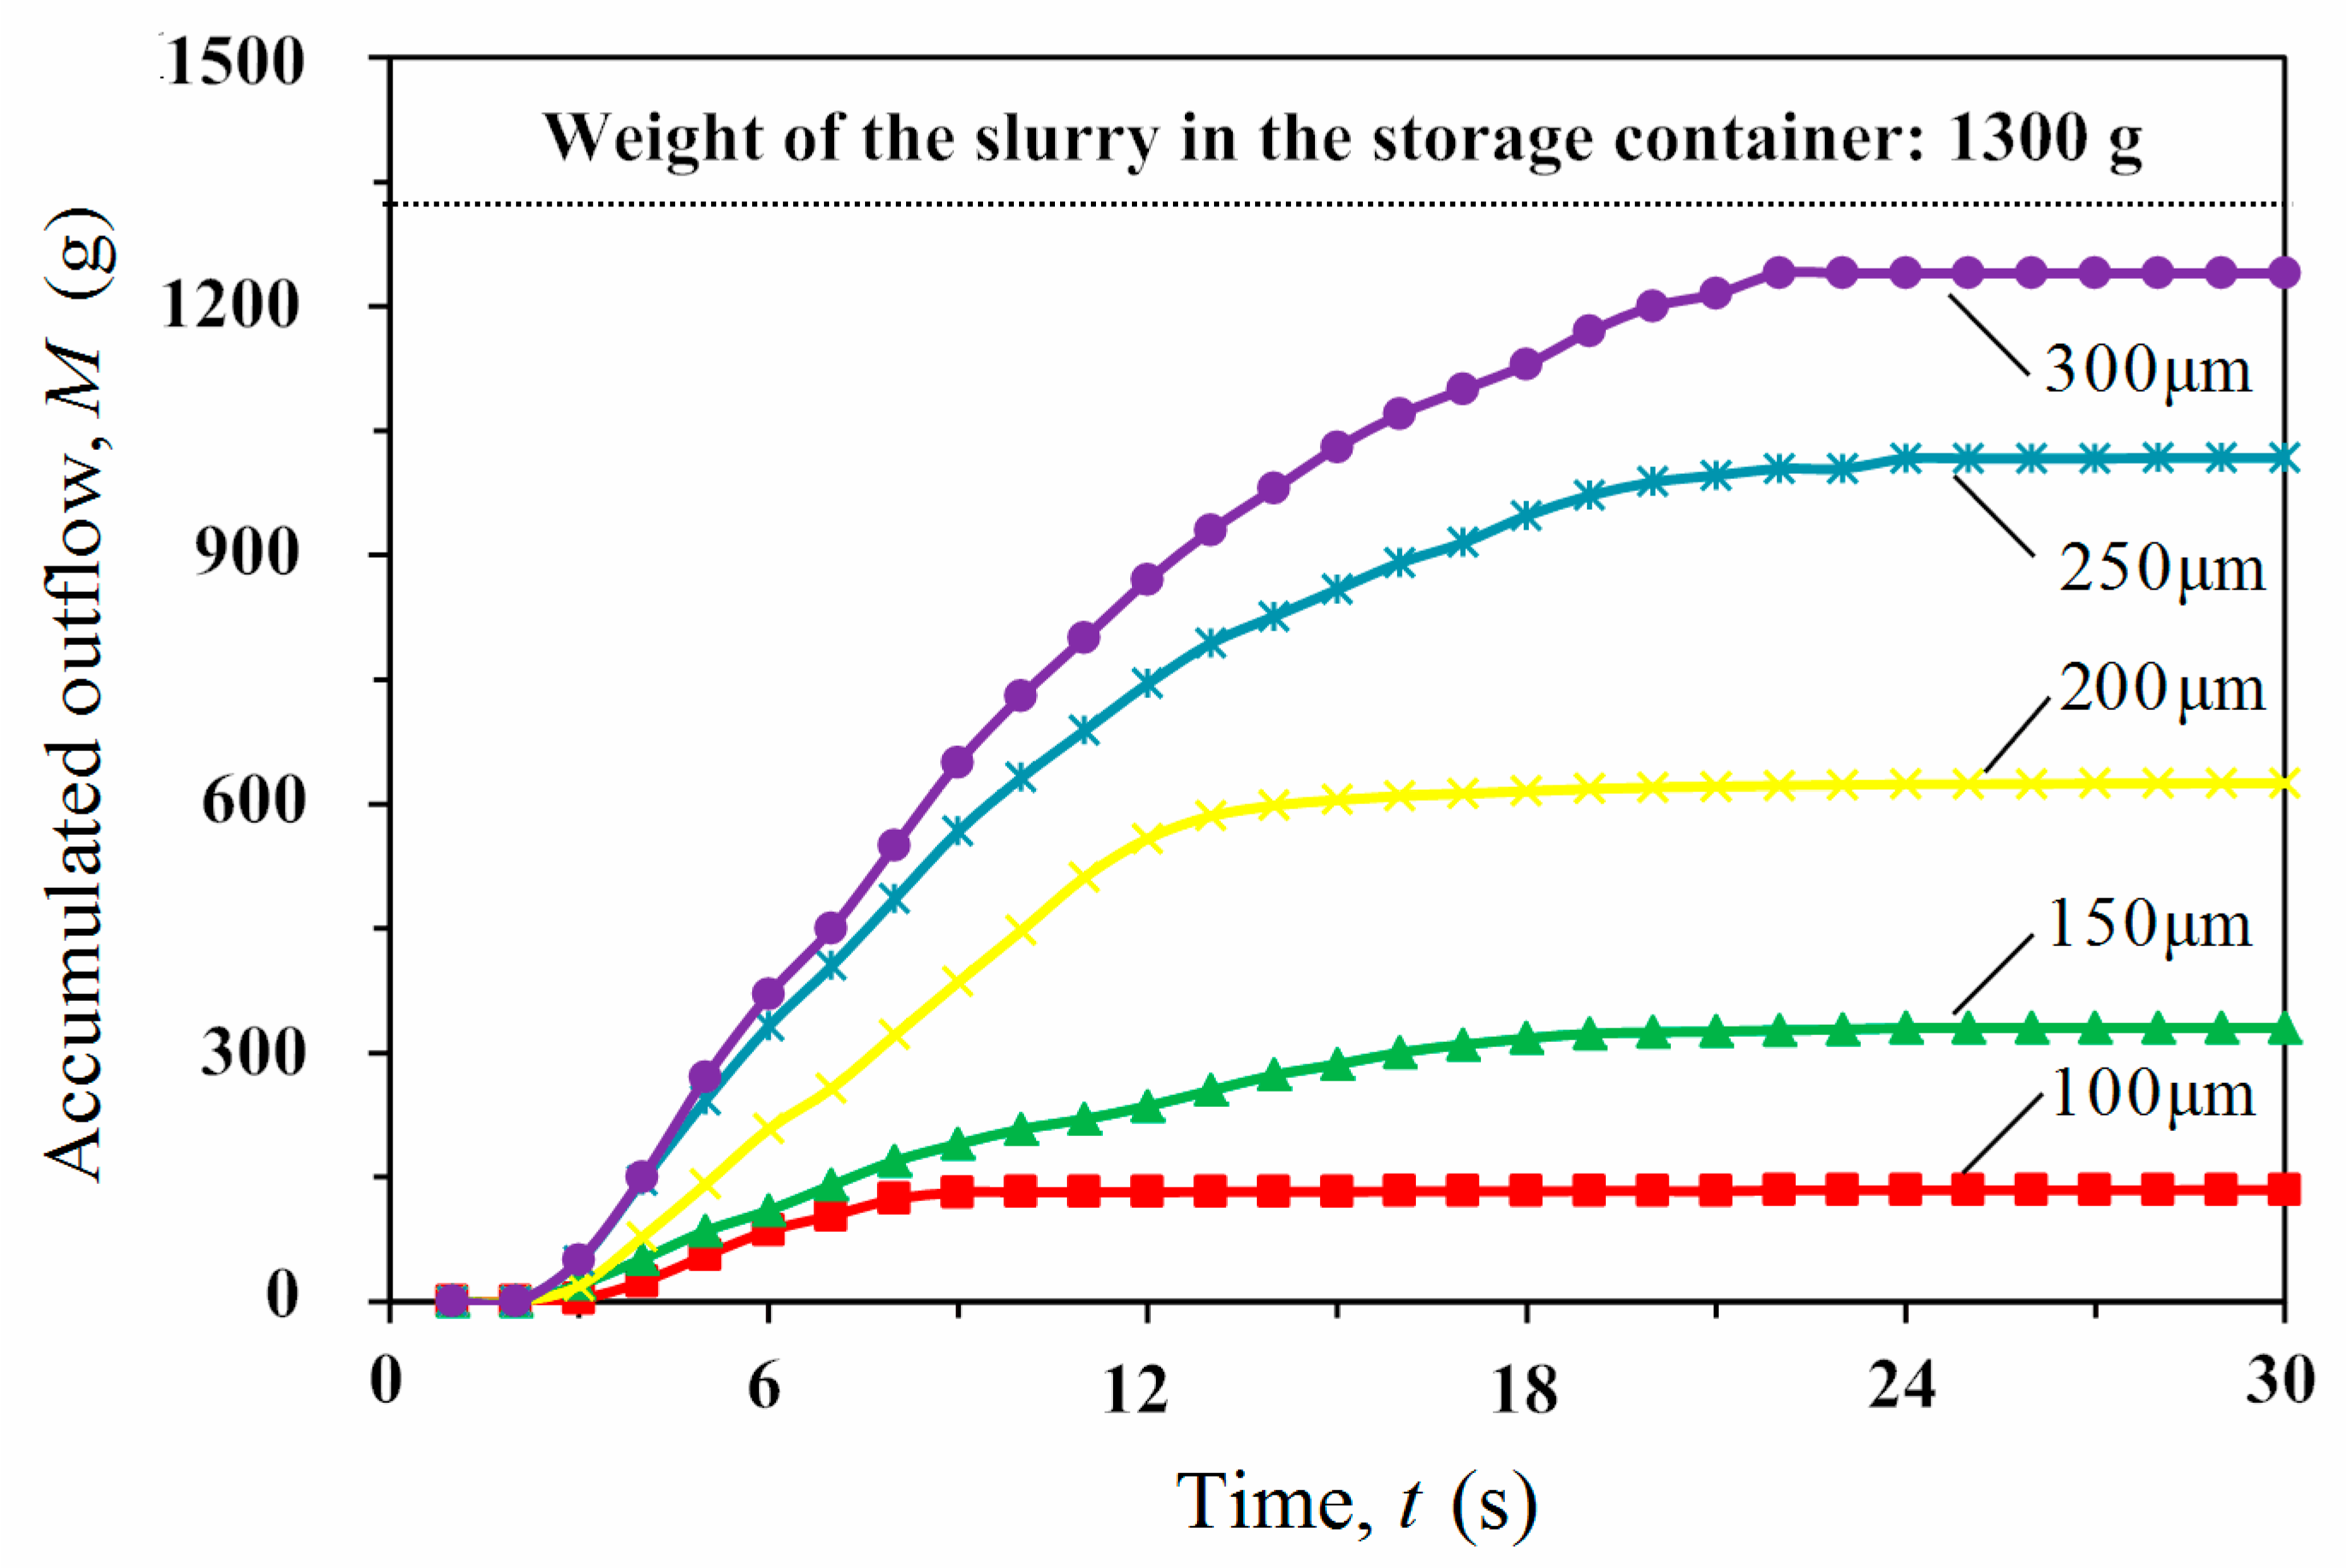
Figure 5 and Figure 6 show the permeability test results of UPC45 at different fracture openings when w/c = 1.2. Figure 5 presents the grouting-pressure change curve at different fracture openings at the entrance of the fracture during the grouting process. Figure 6 presents the curve of the cumulative flow rate of the outlet at different fracture openings during the grouting process.
There are two types of grouting pressure curves shown in Figure 5. One occurs when the fracture opening is 150 μm, 200 μm, and 250 μm; here, the grouting pressure rapidly increases after the grouting starts and maintains a relatively stable position until the grouting ends. The other occurs when the fracture opening is 300 μm; the grouting pressure decreases after the rapid pressure increase and pressure stabilization phase and gradually decreases to 0 by the end of the grouting process. Combined with Figure 6, it can be seen that when the fracture opening is 150 μm, the cumulative weight curve at the outlet is quickly stabilized after a brief increase. The cumulative weight is only 75.2 g, accounting for 5.7% of the total weight (1300 g) in the slurry storage container, which is far less than the total weight of the slurry. When the fracture opening is 200 μm and 250 μm, the cumulative weight at the outlet is greatly improved when the fracture opening is 150 μm—437.5 g and 904.3 g, respectively, accounting for 33.6% and 69.5% of the total weight of the slurry in the storage container. Compared to the total weight, the weight of the passed slurry is still less. When the fracture opening is 300 μm, the cumulative weight at the outlet increases to 1149.1 g, accounting for 88.3% of the total weight of the slurry in the storage container, which is slightly lower than the total weight. At this time, the cumulative weight is very close to the total weight of the slurry in the storage container, but some slurry still cannot enter the fissure due to the percolation phenomenon. When the fracture opening is small, the percolation effect occurs immediately after the grout enters the fracture inlet, and the grout forms a filter cake at the fracture inlet, leading to grouting channel blockage and grouting pressure stabilization. With an increase in the fracture opening, the time needed for the slurry to form a filter cake at the fracture entrance is delayed, but the filter cake will still be formed and block the fracture entrance. When the fracture opening increases to a critical fracture opening, no seepage effect will occur. When the slurry completely passes through the fracture, the grouting pressure will decrease rapidly.
To quantitatively evaluate the permeability of cement slurry in a fracture, two critical fracture opening values of bmin and bcrit are usually defined: bmin represents the minimum fracture opening that the grout can penetrate at all, and bcrit represents the minimum fracture opening that the grout can penetrate without filtration. We further define the slurry passing rate as the ratio of the outlet cumulative weight to the total weight of the slurry in the storage container. Since the slurry will remain in the grouting pipeline during the test, when the pass rate is less than 5%, the grout cannot penetrate into the fracture at all. Moreover, since that part of the slurry will remain in the storage container during the test, when the pass rate is greater than 90%, the grout can penetrate into the fracture without filtration. In addition, the K value is defined as the ratio of the fracture opening to the particle size d95, and the K values of the two critical fracture opening degrees are Kmin = bmin/d95 and Kcrit = bcrit/d95, respectively.
According to the above test results, when the fracture opening is 150 μm, the slurry pass rate is 5.7%. Here, the fracture opening is the minimum fracture opening that the grout can penetrate at all, bmin = 150 μm. When the fracture opening is 300 μm, the slurry passing rate is 88.3%, so the slurry passing rate has not yet reached 90%. At this time, the fracture opening is still not the smallest fracture opening value that the grout can penetrate without filtration. Therefore, we assume that the slurry can completely enter the fracture without the occurrence of percolation (bcrit = 325 μm). The d95 of UPC45 is about 45 μm, and the K values of the two corresponding critical fracture openings are Kmin = 3.3 and Kcrit = 7.2.
Next, we continue the permeability tests of UPC24, UPC15, and UPC13 under different fracture openings when w/c = 1.2. UPC45, UPC24, UPC15, and UPC13 have similar characteristics in their grouting pressure curves and cumulative weight curves at different fracture openings. Due to the differences in the particle sizes of the cement particles, the fracture openings that different cement slurries can pass through are also different. The test results for the example of UFC13 are shown in Figure 7 and Figure 8.
The grouting pressure curve experienced a pressure increase and pressure stabilization when the fracture openings were 100 μm, 150 μm, 200 μm, and 250 μm. Similarly, only at a fracture opening of 300 μm did the pressure curve experience three stages: pressure increase, pressure stability, and pressure decrease. According to the cumulative weight change curve, when the fracture opening is 100 μm, the cumulative weight is 72.4 g, which accounts for 5.56% of the total weight of the slurry in the storage container. When the fracture openings are 150 μm, 200 μm, and 250 μm, the cumulative weights are 329.9 g, 625.1 g, and 1017.4 g, respectively, accounting for 25.3%, 48.1%, and 78.2%. When the fracture opening is 300 μm, the cumulative weight increases to 1240 g, accounting for 95.3% of the total weight of the slurry in the storage container. The grouting pressure curve of UFC13 is similar to that of UFC45. However, with a decrease in the particle size, the fracture opening that the cement particle can be injected into decreases correspondingly. However, because the UFC ultrafine cement particle size is too small, the agglomeration between the particles is obvious, so the critical fracture opening of the slurry without the infiltration effect is still large.
According to the above test results, when the fracture opening is 100 μm, the slurry pass rate is 5.56%. The fracture opening at this time is the minimum fracture opening that the grout can penetrate at all (bmin = 100 μm). When the fracture opening is 300 μm, the slurry pass rate is 95.3%, so the minimum fracture opening that the grout can penetrate without filtration is 300 μm—that is, bcrit = 300 μm. The d95 of UFC13 is about 13 μm, and the K of the two corresponding critical fracture openings are Kmin = 7.7 and Kcrit = 23.1, respectively.

4.2. Test Results of High-Pressure Grouting

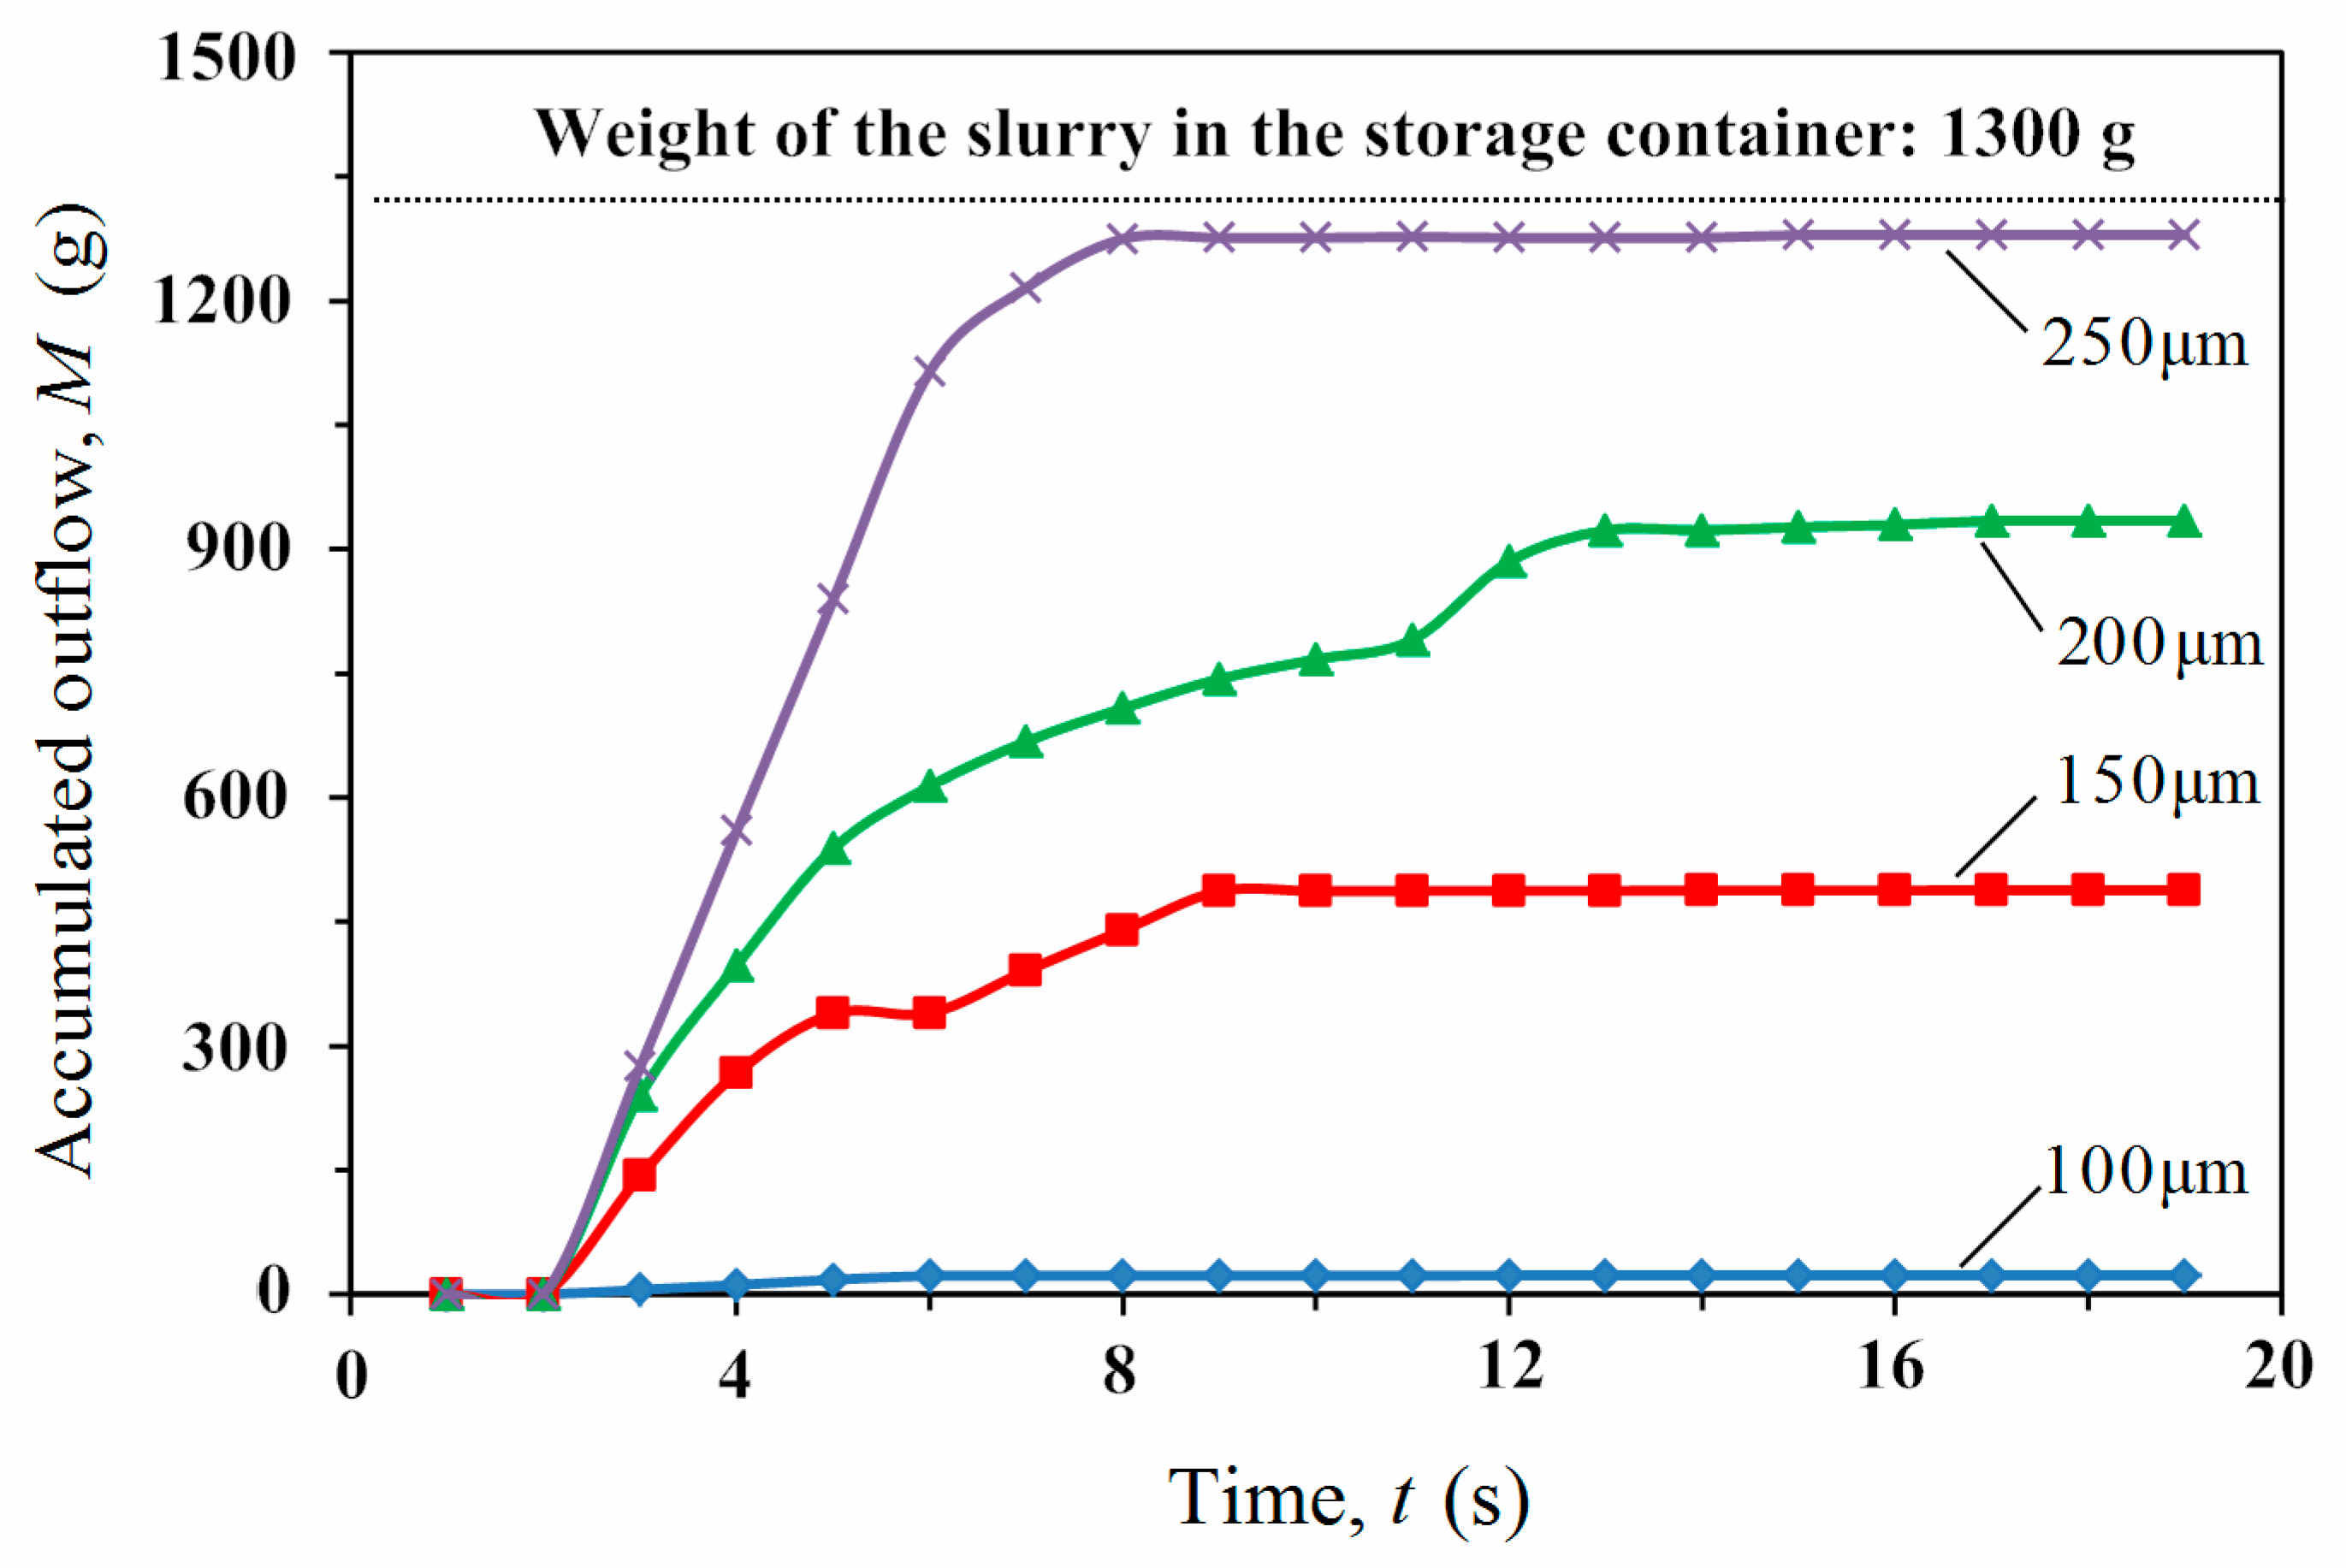
Compared to the low-pressure grouting test, the pressure change curve and the cumulative weight change curve under high-pressure grouting have similar characteristics. Figure 9 and Figure 10 show the permeability test results of UPC45 under different fracture openings when w/c = 1.2.
When the fracture openings are 100 μm, 150 μm, and 200 μm, the grouting pressure curve experienced a pressure increase and pressure stabilization phase. Only at a fracture opening of 250 μm did the pressure curve experience three phases: pressure increase, pressure stability, and pressure decrease. The difference here from low-pressure grouting is that when the fracture openings are 150 μm and 200 μm, the grouting pressure curve shows obvious fluctuations. As shown in Figure 10, when the fracture opening is 100 μm, the cumulative weight is only 22.9 g, accounting for 1.75% of the total weight of the slurry in the storage container, which is much lower than the total weight. When the fracture openings are 100 μm and 200 μm, the cumulative weights are 488.2 g and 934.4 g, respectively, accounting for 37.5% and 71.8% of the total weight of the slurry in the storage container. When the fracture opening is 250 μm, the cumulative weight increases to 1279.6 g, accounting for 98.4% of the total weight of the slurry in the storage container, which is slightly less than the total weight. Under high-pressure grouting, the grouting pressure curve shows an obvious fluctuation phenomenon, which occurs because the cement slurry is blocked at the entrance and exit of the fracture. However, under the action of high grouting pressure, the blockage at the entrance and exit of the fracture is washed away, and the fracture passage must be re-formed before the grouting can continue. However, a blockage quickly formed at the entrance to the fissure will end grouting. When the slurry can pass through the fracture completely, the grouting time is much lower than that of low-pressure grouting.
According to the above results, when the fracture opening is 100 μm, the slurry passing rate is only 1.75%, and when the fracture opening is 150 μm, the slurry passing rate is only 37.5%. The minimum fracture opening that the grout can penetrate at all is between 100 μm and 150 μm (bmin = 125 μm). When the fracture opening is 200 μm, the slurry pass rate is 71.8%, and when the fracture opening is 250 μm, the slurry pass rate is 98.4%. The minimum fracture opening that the grout can penetrate without filtration is between 200 μm and 250 μm (bcrit = 225 μm). The d95 of UPC45 is about 45 μm, and the K values of the two corresponding critical fracture openings are Kmin = 2.2 and Kcrit = 5, respectively.
Next, we continue the permeability tests of UPC24, UPC15, and UPC13 at different fracture openings when w/c = 1.2. The test results for the example of UFC13 are shown in Figure 11 and Figure 12.
The grouting pressure curve experiences a grouting pressure increase and pressure stabilization phase when the fracture openings are 50 μm and 100 μm. Only with a fracture opening of 150 μm does the pressure curve experience three phases: pressure increase, pressure stability, and pressure decrease. When the fracture opening is 100 μm, the pressure curve experiences fluctuations, similar to the former. As shown in Figure 12, when the fracture opening is 50 μm, the cumulative weight is only 72.6 g, which accounts for 5.6% of the total weight of the slurry in the storage. When the fracture opening is 100 μm, the cumulative weight is 989.8 g, accounting for 76.1% of the total weight of the slurry in the storage. When the fracture opening is 150 μm, the cumulative weight increases to 1292 g, accounting for 99.4% of the total weight of the slurry in the storage. Although UFC13 experiences the particle agglomeration phenomenon, under high-pressure grouting, a higher grouting pressure will promote the advance of the granules, reduce the occurrence of the filtration effect, and improve the injectability of the fracture. Here, grouting pressure instead of the fracture opening is the key factor.
According to the above test results, when the fracture opening is 50 μm, the slurry passing rate is 5.6%. The fracture opening at this time is the minimum fracture opening that the grout can penetrate at all (bmin = 50 μm). When the fracture opening is 100 μm, the slurry pass rate is 76.1%, and when the fracture opening is 150 μm, the slurry pass rate is 99.4%. The minimum fracture opening that the grout can penetrate without filtration is between 100 μm and 150 μm (bcrit = 125 μm). The d95 of UFC13 is about 13 μm, and the K values of the corresponding two critical fracture openings are Kmin = 3.8 and Kcrit = 9.6, respectively.

4.3. Discussion of the Test Results

The critical opening and permeability trends of UFC with different particle sizes from the low-pressure grouting test are shown in Table 2. As the particle size of the UFC continues to decrease, the minimum injectable fracture opening of the UFC changes to a value of 100 μm after decreasing continuously. When the particle size is reduced from UFC15 to UFC13, the bmin value is still 100 μm. This shows that reducing the particle size of cement is helpful for injection into micro-fractures, as cement particles with a small particle size are more likely to enter the fracture. However, by only reducing the cement particle size, the effect on reducing the minimum injectable fracture opening is limited. As the particle size of UFC continues to decrease, the trend of the bcrit value is to first decrease and then increase. When the particle size of UFC is 15 μm, the bcrit value is 275 μm. When the particle size of the UFC continues to decrease to 13 μm, the bcrit value becomes 300 μm, and the fracture opening increases. This mainly occurs because when the particle size of UFC decreases to a certain degree, its specific surface area is large, and the phenomenon of agglomeration between ultrafine cement particles is serious.
The critical opening and permeability trends of UFC from the high-pressure grouting test with different particle sizes are shown in Table 3. As the particle size of UFC continues to decrease, the bmin value decreases from 125 μm for UFC45 to 50 μm for UFC13. The overall trend shows a decrease, indicating that reducing the particle size of cement is helpful for injection into a micro-fracture, as cement particles of a small size are more likely to enter the fracture. As the particle size of UFC continues to decrease, the change trend of the bcrit value of UFC is the same as the bmin value, and both continue to decrease.
Compared to the low-pressure grouting, the critical fracture opening for high-pressure grouting is reduced to varying degrees. Under low-pressure grouting conditions, bmin is reduced from 150 μm at UFC45 to 100 μm at UFC15. At this time, reducing the sizes of the cement particles has little effect on grout injection, so the bmin of UFC13 is still 100 μm. Under the condition of high-pressure grouting, as the UFC particles continue to decrease, the bmin decreases from 125 μm at UFC45 to 50 μm at UFC13, and the overall change trend shows a decrease. When the fracture opening remains unchanged, the effect of increasing the grouting pressure alone on increasing the groutability of the cement slurry becomes smaller. Under the condition of low-pressure grouting, as the particle size of UFC continues to decrease, the change trend of bcrit is to decrease first and then increase; bcrit decreased from 325 μm at UFC45 to 275 μm at UFC15. When the particle size continued to decrease to UFC13, bcrit increased to 300 μm. This occurred mainly because the smaller the particle size of the cement is, the larger its specific surface area, and the more serious the agglomeration phenomenon between the cement particles will be. Under high-pressure grouting conditions, bcrit continued to decrease. Comparing bcrit under high- and low-pressure grouting conditions under the same particle size, increasing the grouting pressure significantly reduced bcrit to a maximum of 175 μm, indicating that it is more difficult for cement particles to occur at the entrance of the fracture under high grouting pressure. Under low-pressure grouting, the particle size dominates the percolation effect; in the case of high-pressure grouting, the grouting pressure instead of the particle size dominates the percolation effect.
The floor elevation of the third-level main roadway in Haizi Coal Mine is −1000 m. Under the action of high in situ stress, the fractures in the surrounding rock are mostly compressed and closed. The traditional grouting support is adopted in roadway support, but the grouting effect cannot meet the design requirements, which leads to serious roadway deformation and threatens the safety of coal mine production. According to the test results in this article, the reasons for the poor effect of the original grouting support are the improper grouting materials and low grouting pressure, which leads to the failure of the grout particles to enter the micro-fractures. Therefore, the grouting design scheme was improved to change the grouting material from ordinary Portland cement to UFC15 with the best injectability and fluidity, and the grouting pressure was increased from the original 2 MPa to 5 MPa. The improved support scheme can ensure that the grout can pass the micro-fracture with the opening less than 150 μm, thus ensuring the grouting effect and controlling the deformation of surrounding rock.

5. Conclusions

In this article a design of micro-fracture grouting experimental system was presented. This system can be used to conduct grouting percolation experiments under high grouting pressure and provides a new experimental method for further studying grout percolation behavior. Using this experimental system, high- and low-pressure grouting experiments of various ultrafine cement grouting under different fracture opening conditions were carried out, and the grouting permeability characteristics under different conditions were obtained.
The results show that a combination of the grout pressure curve and the cumulative grout weight curve can determine whether the ultrafine cement has a percolation effect. Under the same particle size, increasing the grouting pressure can reduce the bmin value and improve the injectability of ultrafine cement grouting. However, only increasing the grouting pressure has little effect on improving the grouting performance, which proves that the main reason for the improvement of grouting performance by high-pressure grouting is an increase in fracture openings. Increasing the grouting pressure significantly reduces the bcrit value, making it difficult for cement particles to gather at the entrance of the fracture, thereby reducing the percolation effect. However, with a continuous decrease in ultrafine cement particle size, the specific surface area becomes larger, resulting in more serious agglomeration between particles and a greater proclivity to the percolation effect at the fracture entrance. During grouting construction, ultrafine cement with an appropriate particle size should be selected. The critical fracture opening value under high-pressure grouting was obtained in the experiment, providing a theoretical basis for the high-pressure grouting of micro-fracture rock masses and offering guiding significance for the design of high-pressure grouting support schemes.

Author Contributions

Conceptualization, K.W. and L.W.; data curation, K.W., B.R., and H.F.; formal analysis, K.W.; writing—original draft, K.W. All authors have read and agreed to the published version of the manuscript.

Funding

This paper was funded by the National Key Research and Development Program of China (2017YFC0603004) and the China Postdoctoral Science Foundation funded project (2020M671649).

Acknowledgments

We thank all project partners for many fruitful discussions.

Conflicts of Interest

The authors declare no conflict of interest.

References

  1. Xie, H.; Yang, J.; Ren, S.; Gao, F.; Liu, J.; Zhu, Y. Theoretical and Technological Exploration of Deep in Situ Fluidized Coal Mining. Front. Energy 2019, 13, 603–611. [Google Scholar] [CrossRef]
  2. Malinowska, A. The Impact of Deep Underground Coal Mining on Earth Fissure Occurrence. Acta Geodyn. Geomater. 2016, 14, 321–330. [Google Scholar] [CrossRef] [Green Version]
  3. Qiao, W.; Li, W.; Zhang, X. Characteristic of Water Chemistry and Hydrodynamics of Deep Karst and Its Influence on Deep Coal Mining. Arabian J. Geosci. 2014, 7, 1261–1275. [Google Scholar] [CrossRef]
  4. Heping, X.; Hongwei, Z.; Dongjie, X.; Hongwei, W.; Ru, Z.; Feng, G. Research and Consideration on Deep Coal Mining and Critical Mining Depth. J. China Coal Soc. 2012, 37, 535–542. [Google Scholar]
  5. Kang, H.; Wu, Y.; Gao, F.; Lin, J.; Jiang, P. Fracture Characteristics in Rock Bolts in Underground Coal Mine Roadways. Int. J. Rock Mech. Min. Sci. 2013, 62, 105–112. [Google Scholar] [CrossRef]
  6. Konicek, P.; Soucek, K.; Stas, L.; Singh, R. Long-Hole Destress Blasting for Rockburst Control During Deep Underground Coal Mining. Int. J. Rock Mech. Min. Sci. 2013, 61, 141–153. [Google Scholar] [CrossRef]
  7. Chen, S.; Zhang, Z. Determination of Coal Pillar Width and Support Parameters in Deep Coal Mines—A Case Study. J. Test. Eval. 2019, 47, 3160–3173. [Google Scholar] [CrossRef]
  8. Gao, F.; Stead, D.; Kang, H. Simulation of Roof Shear Failure in Coal Mine Roadways Using an Innovative Udec Trigon Approach. Comput. Geotech. 2014, 61, 33–41. [Google Scholar] [CrossRef]
  9. Li, P.; Zhang, Q.; Zhang, X.; Li, S.; Li, X.; Zuo, J. Grouting Diffusion Characteristics in Faults Considering the Interaction of Multiple Grouting. Int. J. Geomech. 2017, 17, 04016117. [Google Scholar] [CrossRef]
  10. Yang, J.; Cheng, Y.; Chen, W. Experimental Study on Diffusion Law of Post-Grouting Slurry in Sandy Soil. Adv. Civ. Eng 2019, 2019, 1–11. [Google Scholar] [CrossRef] [Green Version]
  11. Jiang, H.; Zhong, R.; Peng, Z. Study on Preparation of Chemical Grouting and Its Hydraulic Properties and Application for Water Seepage Safety. J. Coast. Res. 2019, 94, 291. [Google Scholar] [CrossRef]
  12. Mclellan, B.; Williams, R.P.; Lay, J.; Van Riessen, A.; Corder, G.D. Costs and Carbon Emissions for Geopolymer Pastes in Comparison to Ordinary Portland Cement. J. Clean. Prod. 2011, 19, 1080–1090. [Google Scholar] [CrossRef] [Green Version]
  13. Dong, F.J.; Cao, Y.; Ren, D.Z.; Sun, W. Micro-Fracture Development Impact Factors Analysis and Its Effects on Well Production of Hua-Qing Area Ordos Basin in China. Int. J. Oil Gas Coal Technol. 2019, 21, 39. [Google Scholar] [CrossRef]
  14. Sun, H.; Duan, L.; Liu, L.; Fan, W.; Fan, D.; Yao, J.; Zhang, L.; Yang, Y.; Zhao, J. The Influence of Micro-Fractures on the Flow in Tight Oil Reservoirs Based on Pore-Network Models. Energies 2019, 12, 4104. [Google Scholar] [CrossRef] [Green Version]
  15. Jorne, F.; Henriques, F.M.A. Evaluation of the Grout Injectability and Types of Resistance to Grout Flow. Constr. Build. Mater. 2016, 122, 171–183. [Google Scholar] [CrossRef]
  16. Axelsson, M.; Gustafson, G.; Fransson, A. Stop Mechanism for Cementitious Grouts at Different Water-to-Cement Ratios. Tunn. Undergr. Space Technol. 2009, 24, 390–397. [Google Scholar] [CrossRef]
  17. Eriksson, M.; Stille, H.; Andersson, J. Numerical Calculations for Prediction of Grout Spread with Account for Filtration and Varying Aperture. Tunn. Undergr. Space Technol. 2000, 15, 353–364. [Google Scholar] [CrossRef]
  18. Eklund, D.; Stille, H. Penetrability Due to Filtration Tendency of Cement-Based Grouts. Tunn. Undergr. Space Technol. 2008, 23, 389–398. [Google Scholar] [CrossRef] [Green Version]
Figure 1. Diagram of grouting system device.
Energies 13 04225 g001
Figure 2. Structure of micro-fracture model.
Energies 13 04225 g002
Figure 3. Image of the fracture with a 200 μm opening.
Energies 13 04225 g003
Figure 4. Monitoring devices of grouting pressure and cumulative weight
Energies 13 04225 g004
Figure 5. Variation curve of grouting pressure under different fracture openings of the UFC45.
Energies 13 04225 g005
Figure 6. Cumulative weight change curve under different fracture openings of the UFC45.
Energies 13 04225 g006
Figure 7. Variation curve of grouting pressure under different fracture openings of the UFC13.
Energies 13 04225 g007
Figure 8. Cumulative weight change curve under different fracture openings of the UFC13.
Energies 13 04225 g008
Figure 9. Variation curve of grouting pressure under different fracture openings of the UFC45.
Energies 13 04225 g009
Figure 10. Cumulative weight change curve under different fracture openings of the UFC45.
Energies 13 04225 g010
Figure 11. Variation curve of grouting pressure under different fracture openings of the UFC13.
Energies 13 04225 g011
Figure 12. Cumulative weight change curve under different fracture openings of the UFC13.
Energies 13 04225 g012
Table 1. Performance index parameters of the ultrafine cement.
Cement Particle SizeSpecific Surface Area (m2/kg)Particle Size Distribution (μm)
d10d50d90d95
UPC45500≤1.5≤16.2≤38.4≤45.5
UPC24650≤0.9≤7.5≤19.9≤24.3
UPC15750≤0.8≤4.36≤12.7≤15.7
UPC13850≤0.3≤1.86≤9.7≤13.9
Table 2. Critical opening and permeability trends of UFC with different particle sizes under low-pressure grouting.
Cement Typebmin (μm)bcrit (μm)Kmin = bmin/d95Kcrit = bcrit/d95
UPC451503253.37.2
UPC241253005.212.5
UPC151002756.618
UPC131003007.623.1
Table 3. Critical opening and permeability trends of UFC with different particle sizes under high-pressure grouting.
Cement Typebmin (μm)bcrit (μm)Kmin = bmin/d95Kcrit = bcrit/d95
UPC451252252.25
UPC241002004.18.3
UPC1575150510
UPC13501253.89.6