1. Introduction
The ferroresonance phenomenon may happen in power configurations where a nonlinear inductance, e.g., representing a magnetizing branch of a voltage transformer (VT) or power transformer, etc., is connected to a capacitance [
1,
2]. Quite often, with a significant probability of occurrence, ferroresonance oscillations take place in distribution medium voltage (MV) networks with isolated neutral, where VTs are in parallel with the zero-sequence network capacitance [
1,
3]. Commonly, if the spectrum content of the signals is taken into account, four types of ferroresonance oscillations may be distinguished: fundamental mode, subharmonic mode, quasi-periodic mode, and chaotic mode. The ferroresonance oscillations may be initiated when the VT iron core inductance becomes saturated, which may be a case when the VT terminal voltage suddenly increases. This may be a consequence of switching operations in VT secondaries, clearing the nearby single-phase-to-ground fault, etc. Under such conditions, nonlinear oscillations may appear, being characterized by high voltage, significant currents, and waveform distortions, mainly by subharmonic and/or higher frequency components. Such a disturbance may be dangerous for power system elements, since it increases the thermal (due to overcurrent) and electrical (due to overvoltage) stresses that may destroy VT or other equipment. This may distort voltage and current measurements, which in turn may influence the protection operation.
In the literature, one can find a number of practical examples presenting damage of power system equipment due to ferroresonance oscillations. The case described in [
3] reported the destruction of 72 VTs in a 50 kV network in Norway. In [
4], the example in which a riser pole arrester was destroyed in a 12 kV distribution network in Thailand is noticed. The explosion of a VT in a 230 kV HVDC converter station in Manitoba is described in [
5]. The destruction of a voltage transformer in a 275 kV power system in England is presented in [
6]. In [
7], the overvoltages (2 p.u.) and loud humming noises (heard by the local operator) in a 400 kV substation in Ireland is reported. After the analysis of cited examples, it can be concluded that it is essential to correctly detect ferroresonance oscillations and then suppress them, which would protect the equipment from damage. The last practical example [
7] shows that the algorithm for ferroresonance detection would also be helpful to notify service personnel or, eventually, block protection devices. The identification of nonlinear oscillations is not simple and it is still not solved, since the ferroresonance phenomenon has complex behavior by its nonlinear and random nature.
Some solutions for the detection of ferroresonance oscillations can be found in [
8,
9,
10,
11,
12,
13]. They are mostly based on analysis of frequency components of voltage in open delta VT connection or phase currents and voltages. In the solutions presented in [
8,
9,
10,
11,
12,
13], the Wavelet analysis for various wavelet forms and S-transforms are mostly used. Additionally, sophisticated decision-making algorithms, e.g., artificial neural network (ANN), kernel principal component analysis, and support vector machine (SVM), are adopted and high sampling frequencies (at least 10 kHz) are used. The algorithm presented in [
14] is based on the analysis of vibration, and, for this purpose, the accelerometer sensor is needed and a digital filter bank is applied.
It can be concluded that the cited algorithms seem slightly too complex to be implemented in hardware or they require advanced software, which may cope with a large calculation burden.
One may also note that, in practice, any dedicated algorithm for the detection of ferroresonance is not applied. Generally, a method based on connecting a damping resistor (permanently or for a limited time) to the open delta VT connection is only used to suppress ferroresonance, as described in [
15]. However, with small values of damping resistances, overheating of VTs may happen during an earth fault, which may be seen as a severe drawback of such an approach.
Therefore, there is still a need for a new algorithm for the detection of ferroresonance, yet it needs to be less complicated so that it could be implemented on standard hardware. The algorithm should be capable of distinguishing ferroresonance from short-circuits and other disturbances so that they are not misclassified.
2. A Model for Ferroresonance Studies in Medium Voltage Power System
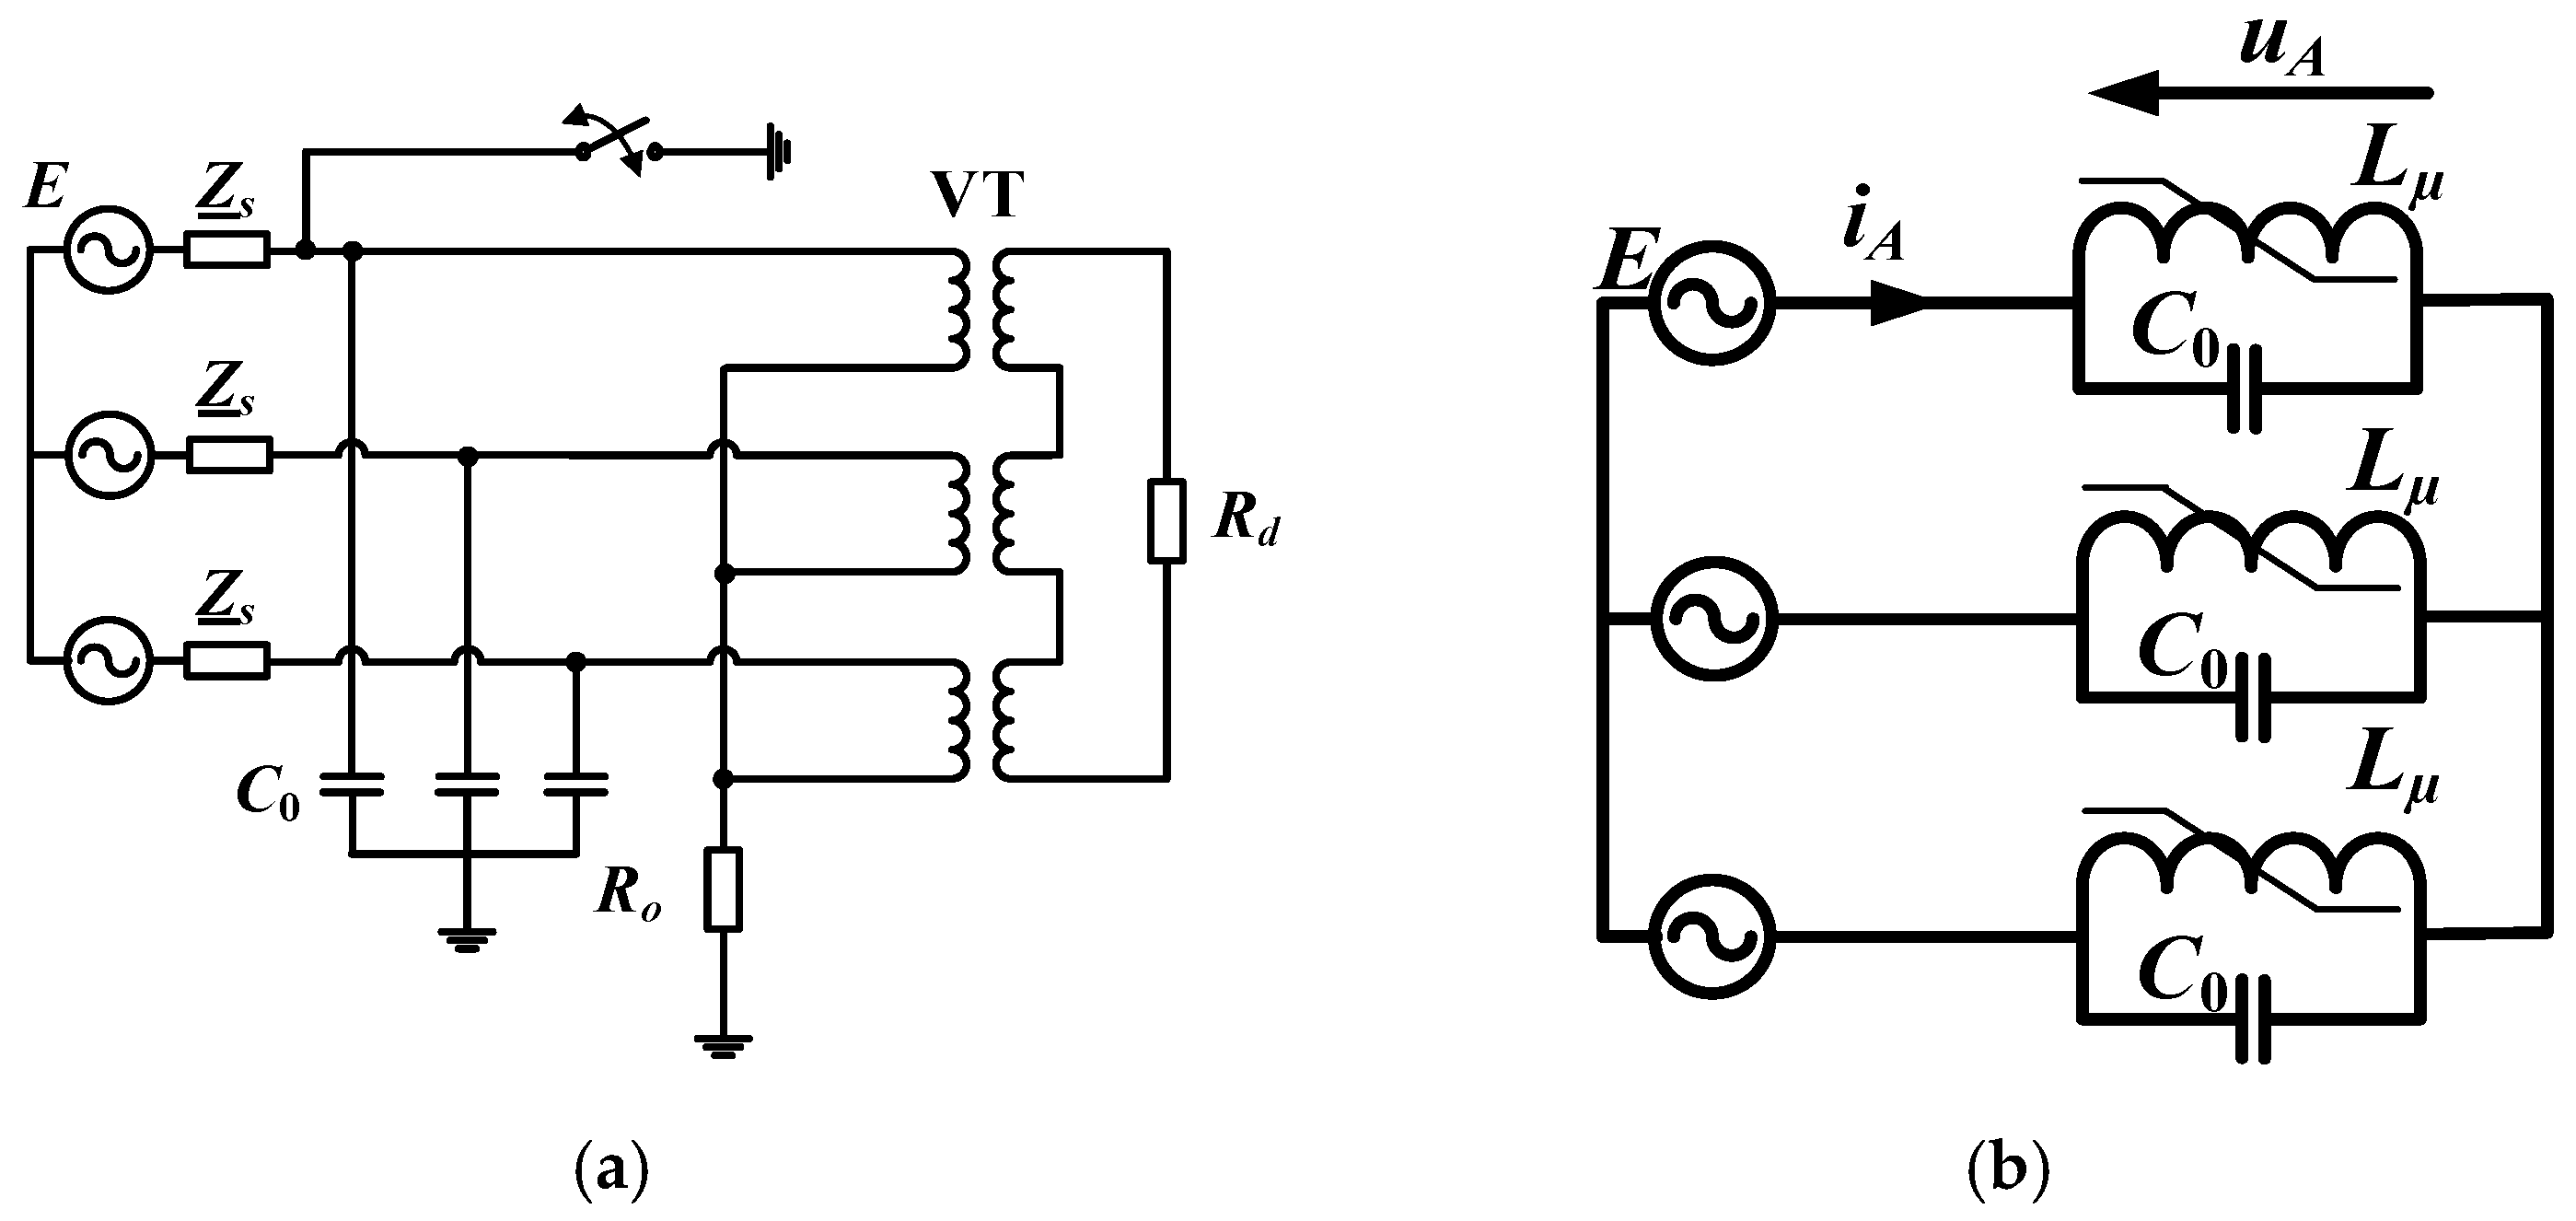
For the analysis of ferroresonance phenomena, a model of the MV power system shown in
Figure 1a was considered and developed in a MATLAB/Simulink environment [
16]. In such a configuration, ferroresonance oscillations were most frequently observed. As one can see, the model was an equivalent for distribution networks with an ungrounded neutral system, where VTs were in parallel with the zero-sequence network capacitance. For theoretical analyses, in order to explain the phenomena of ferroresonance, this model can further be simplified by omitting resistances and presented as a parallel combination of capacitance
C0 and nonlinear inductance
Lµ (
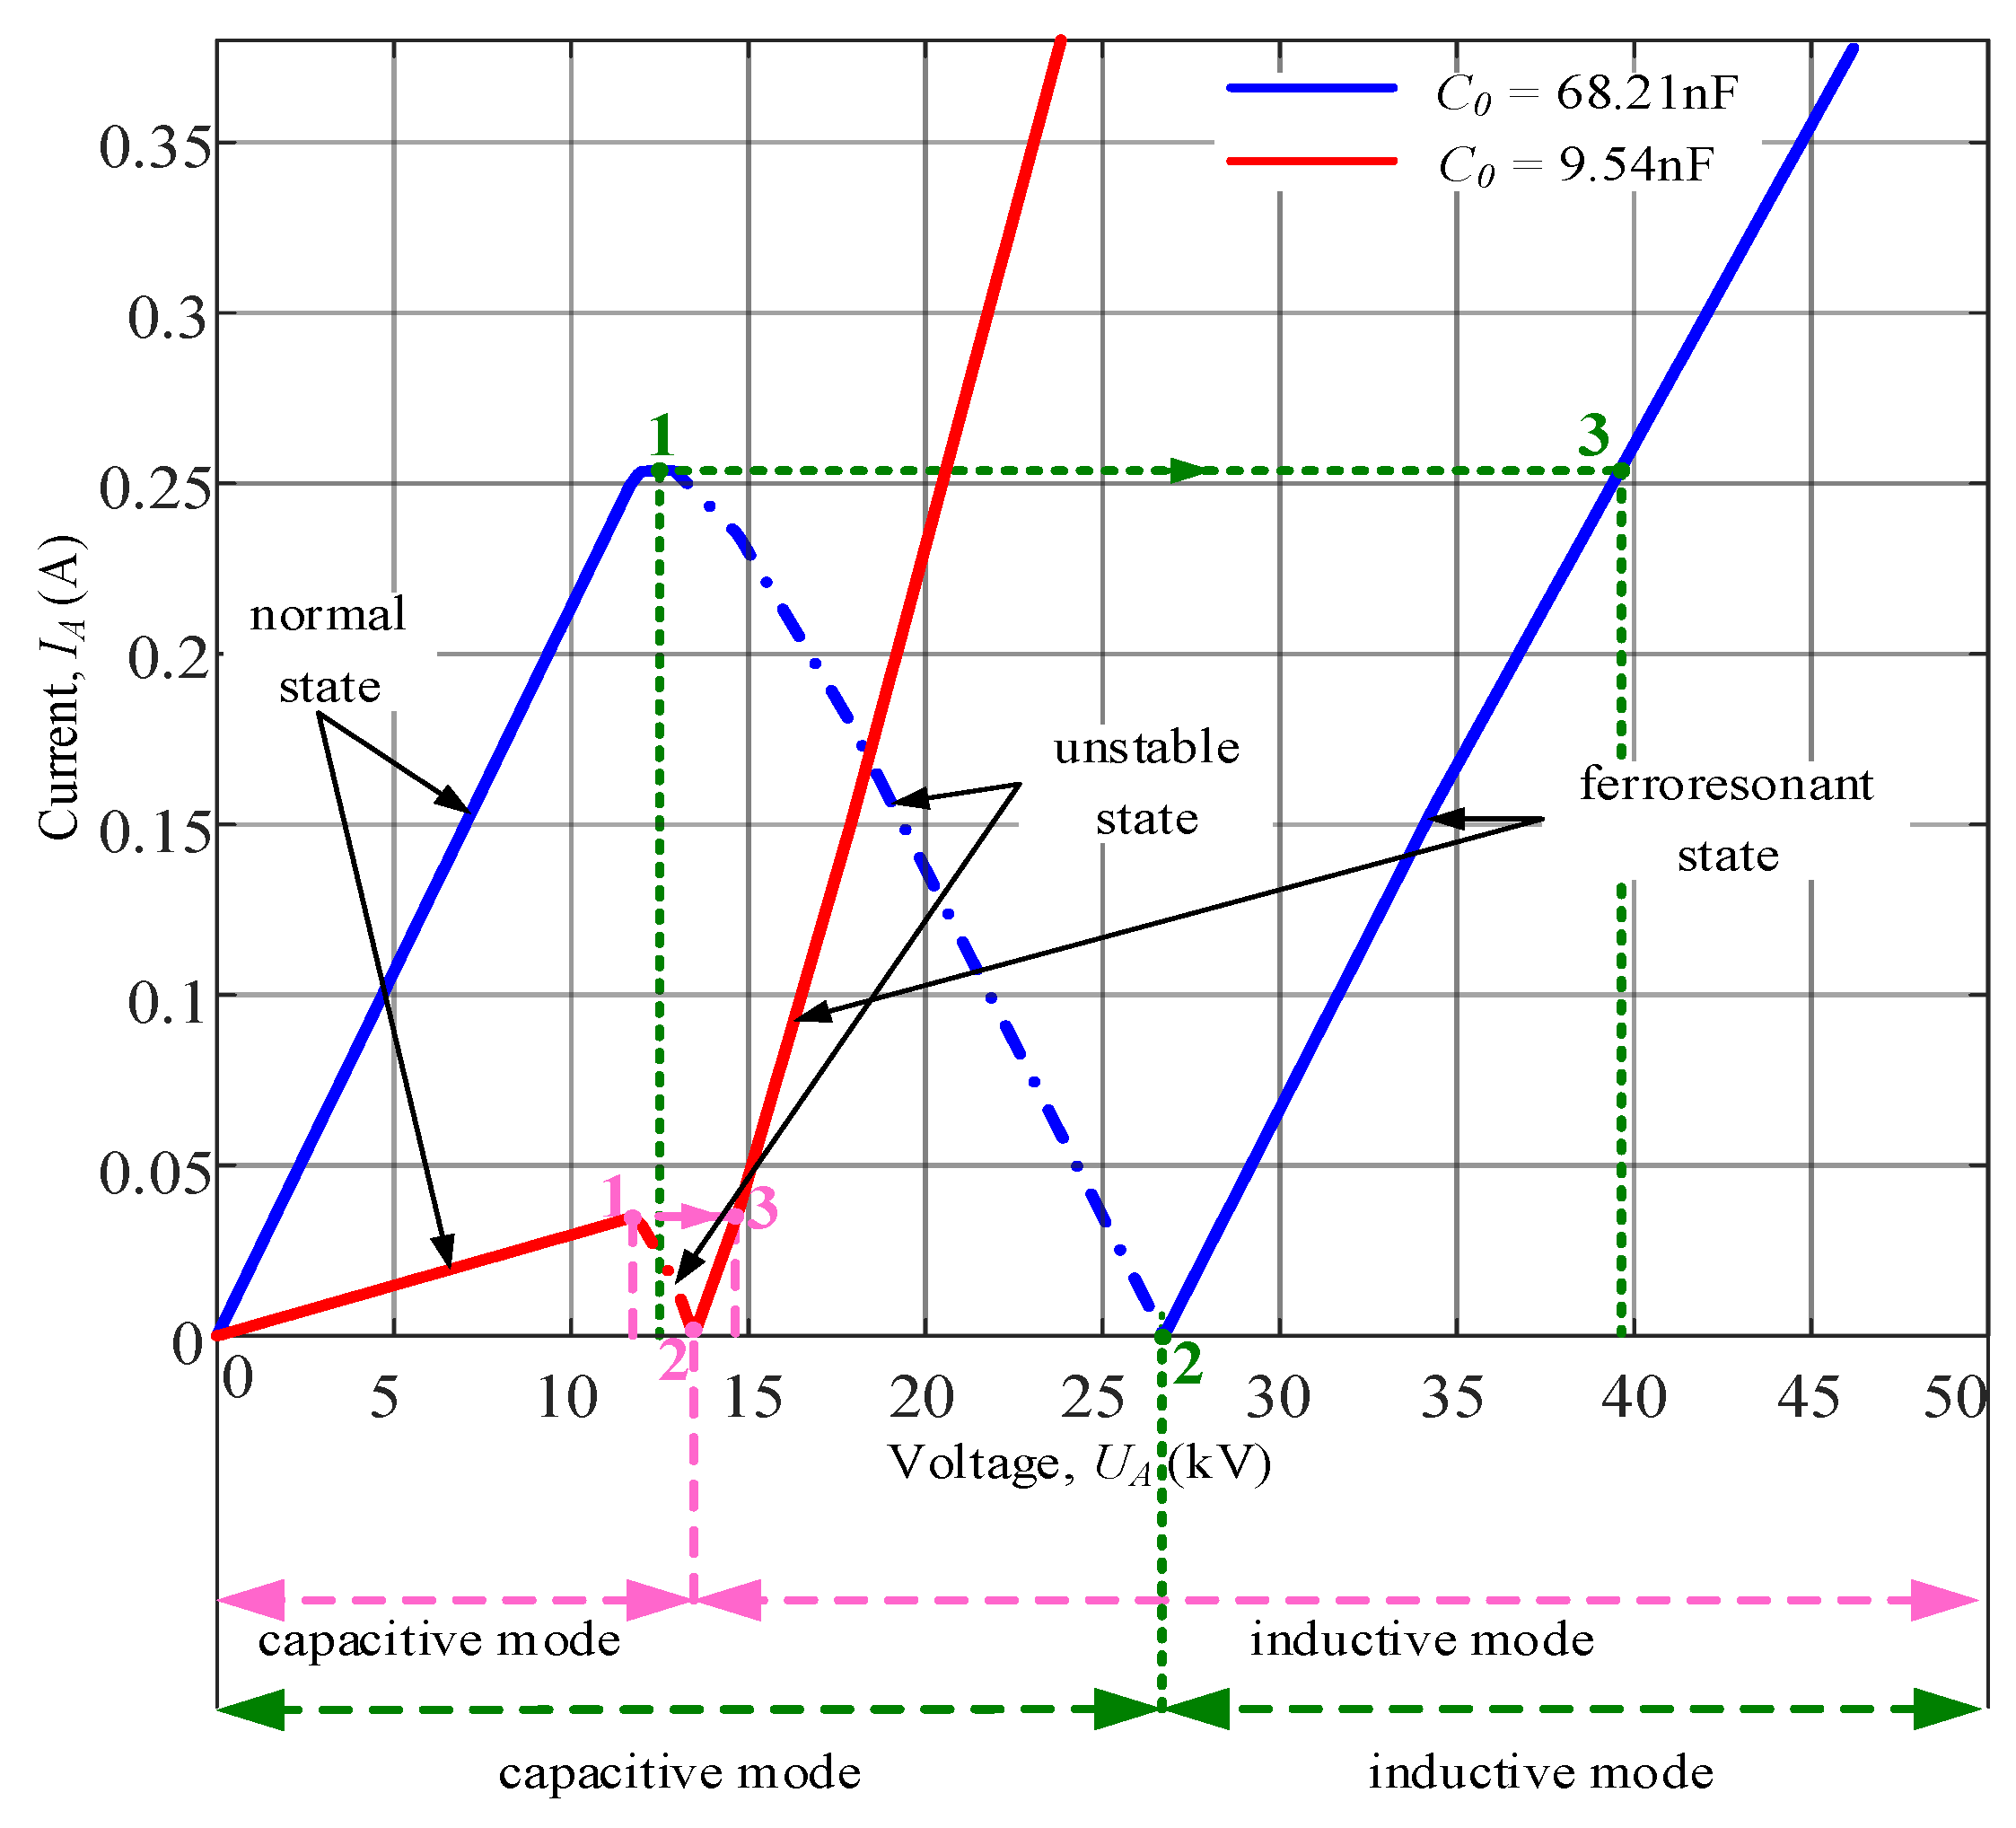
Figure 1b). Note that, in such a circuit, a current ferroresonance takes place. The current-voltage characteristic of parallel connection of capacitance
C0 and nonlinear inductance
Lµ for two different values of phase-to-ground capacitance
C0 = 68.21 nF and
C0 = 9.54 nF is presented in
Figure 2. This characteristic was obtained for fundamental frequency and steady-state conditions. Three modes of operation of this parallel circuit can be distinguished: normal state (from zero to point 1), ferroresonance state (straight line passing through points 2 and 3), and unstable state (from point 1 to point 2). It can be observed that to the left of point 2, the considered circuit operates in an inductive mode, while a capacitive mode exists for the area to the right of point 2. The transition from point 1 (normal state and capacitive mode) to point 3 (ferroresonance state and inductive mode) is accompanied by a phase change by π and voltage surge. Such a phenomenon can be observed when the circuit is supplied from a current source. Note that the voltage surge occurs for a small current change (see points 1 and 3). Here, the value of phase-to-ground capacitance is a critical parameter, since it affects the current level at point 1 and the voltage value at point 2. It can be observed that, for some values of phase-to-ground capacitance, the ferroresonance state will disappear, e.g., for
C0 = 198.94 nF. It should be noted that the presented analysis is very simplified just to explain the phenomenon. Therefore, for the following considerations and tests, the system presented in
Figure 1a was used.
The VTs from
Figure 1a were modeled as three single-phase saturable transformers with voltage ratios assumed at 20:0.1/3 kV/kV and nominal power at 100 VA. The primary windings of VTs were connected in grounded Wye, while the VT secondaries were connected in open delta. The VT model included a nonlinear magnetizing characteristic. The source impedance
ZS was calculated for an assumed short-circuit source capacity of 150 MVA.
It was already mentioned that the ferroresonance oscillations might be initiated when the VT iron core becomes saturated, which may happen when the VT terminal voltage suddenly increases, e.g., due to the clearing of a short-circuit. Therefore, the ferroresonance under simulation was initiated by a transient L1-phase-to-ground fault via fault resistance 0.1 Ω. The phase-to-ground capacitive reactance was changed in the range of 0.005 <
Xc/
Xm s < 15.0. Note that reference [
17] presents full details and analysis of the simplified model of the MV power system.
3. Algorithm for Detection of Ferroresonance Oscillations
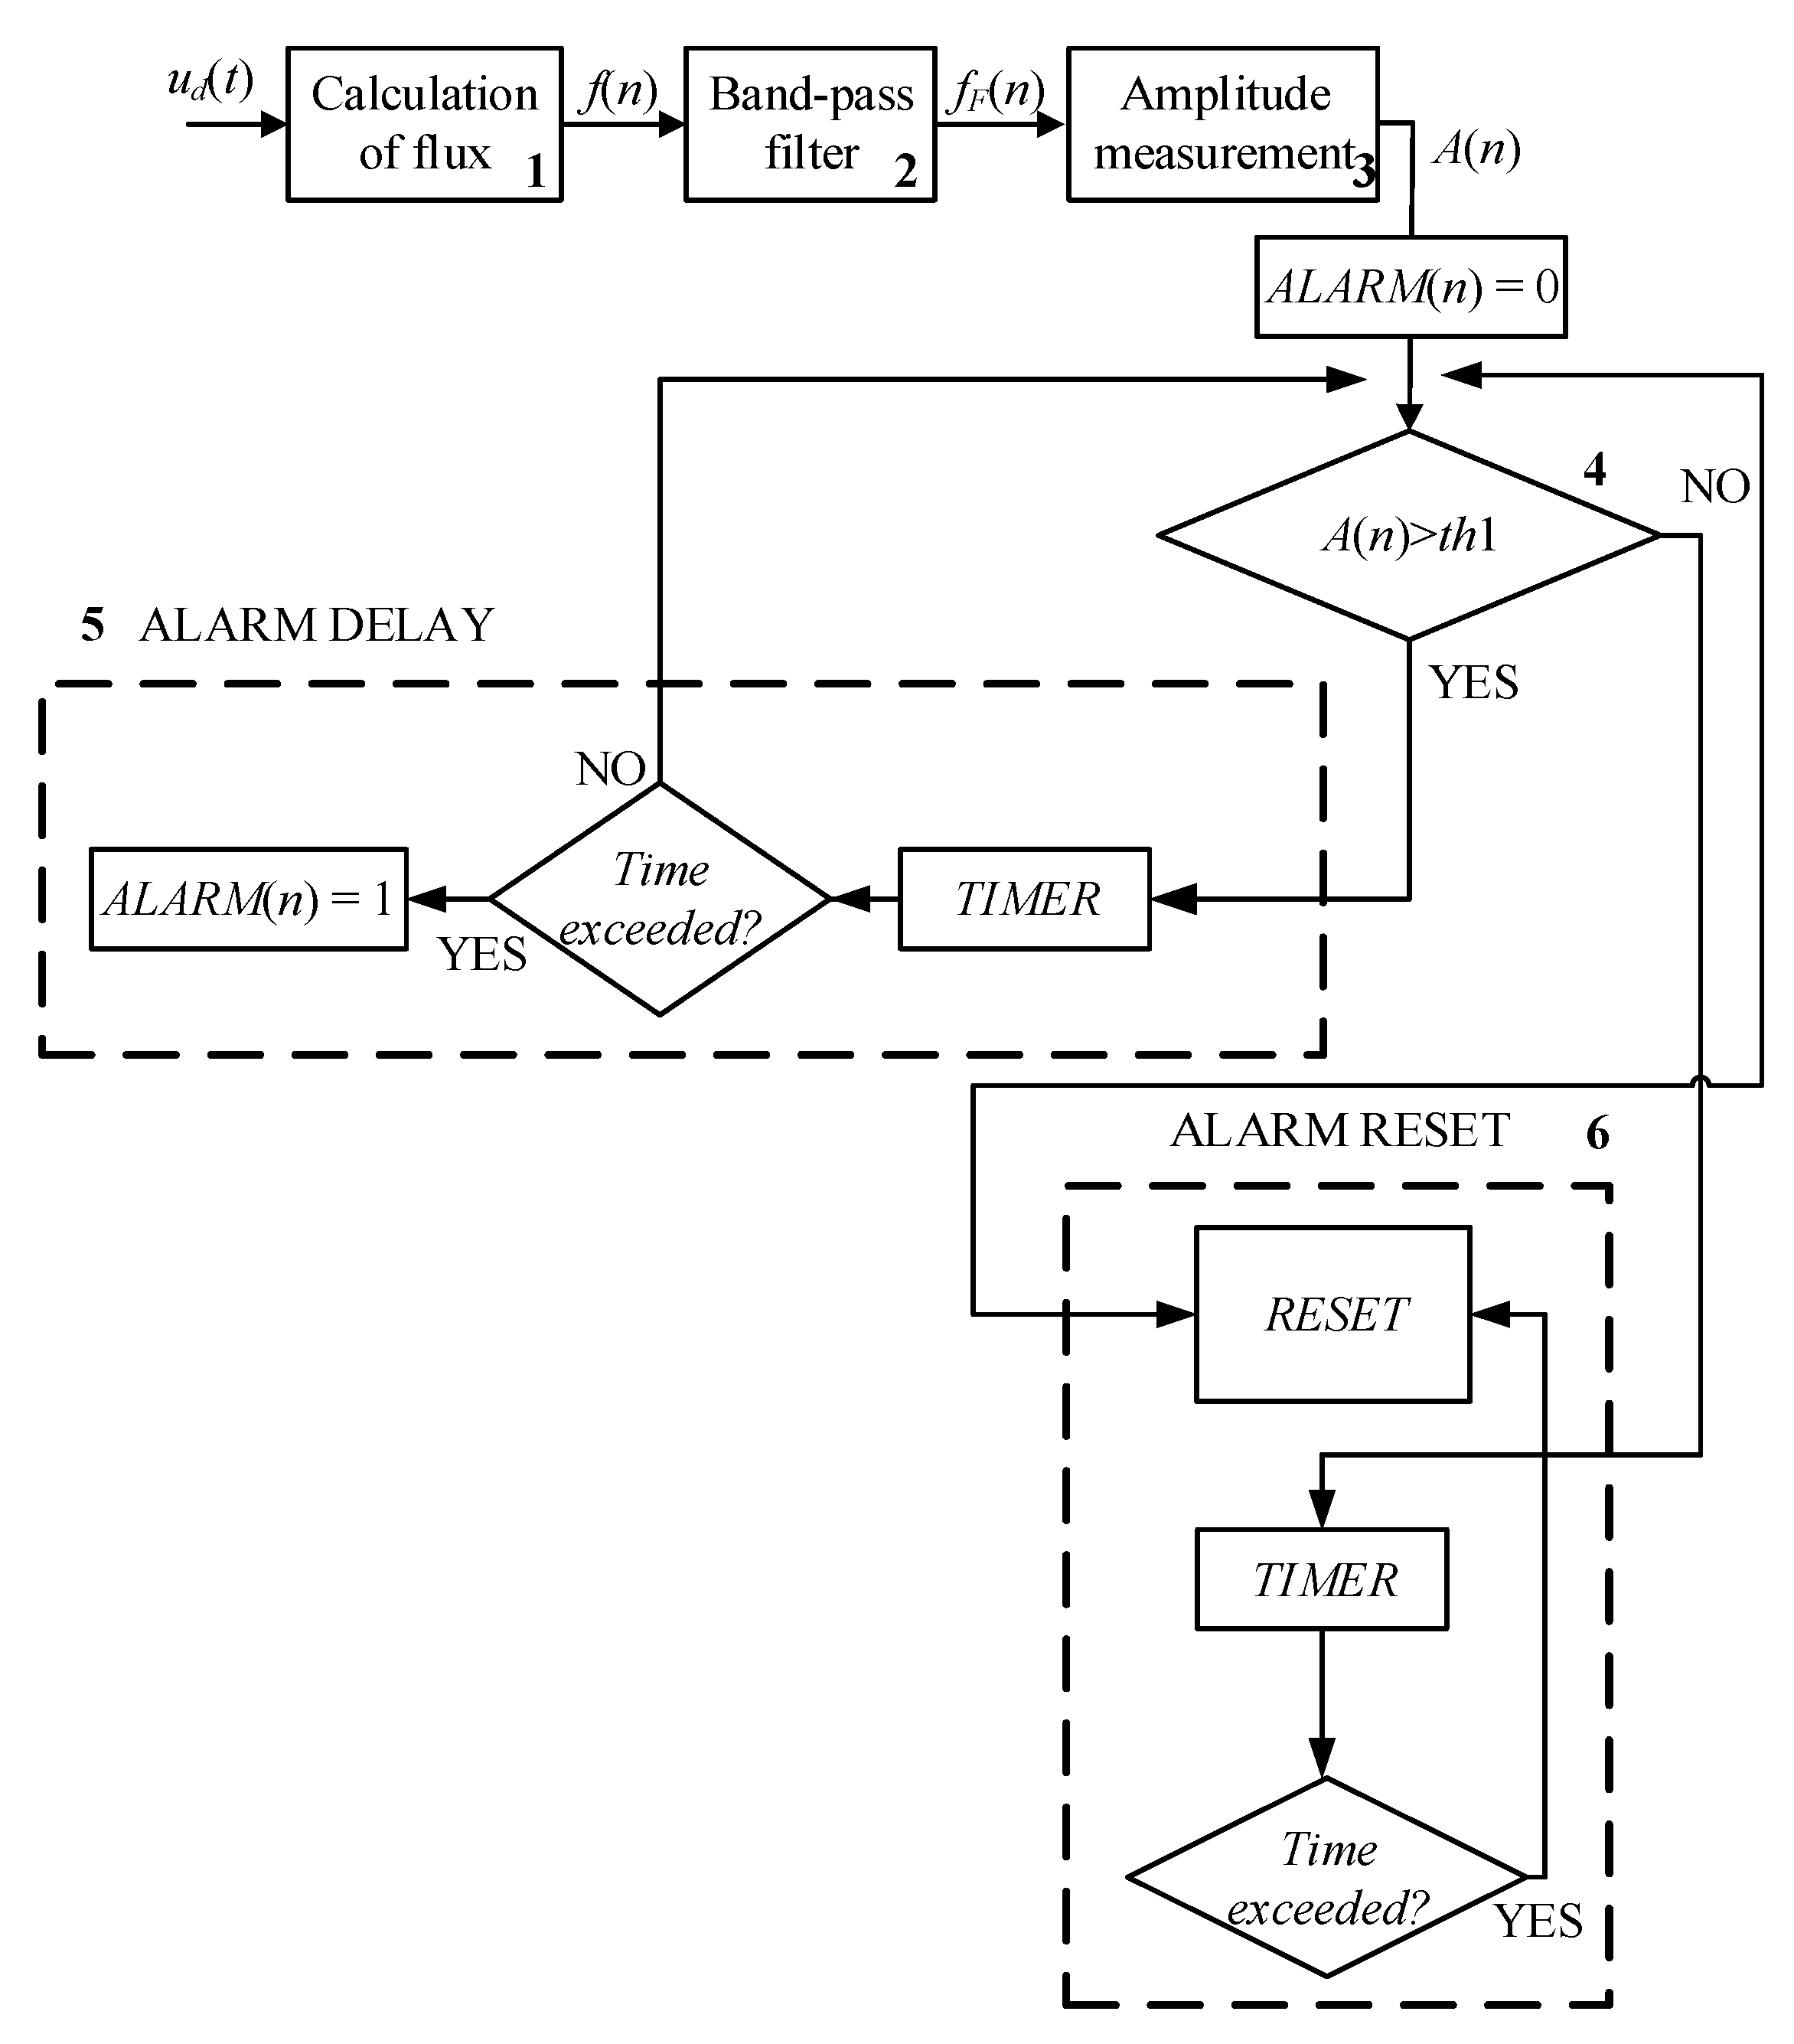
The proposed algorithm below is based on the analysis of estimated flux resulting from the voltage in open delta VT connection [
18].
Figure 3 shows the block scheme of the proposed algorithm. The operation of the protection scheme proceeds in the following steps (the numbers correspond to block numbers in
Figure 3).
Step 1. Calculation of flux; the voltage in open delta VT connection is processed by using a first-order low pass filter, instead of a pure integration, in order to avoid problems with DC-offset and initial conditions. The Laplace equation of the filtering process is:
and the filtering equation (with the Euler’s backward approximation of integration adopted) is given by the formula:
where
n is the number of sample (
n = 1,2,3,..., inf),
ud is the voltage in open delta VT connection,
Ts is the sampling period (here,
Ts = 0.001 s), and
Ta is the filter time constant (here
Ta = 0.005 s). Experiences show that the ratio
Ta/
Ts = 5 may be recommended.
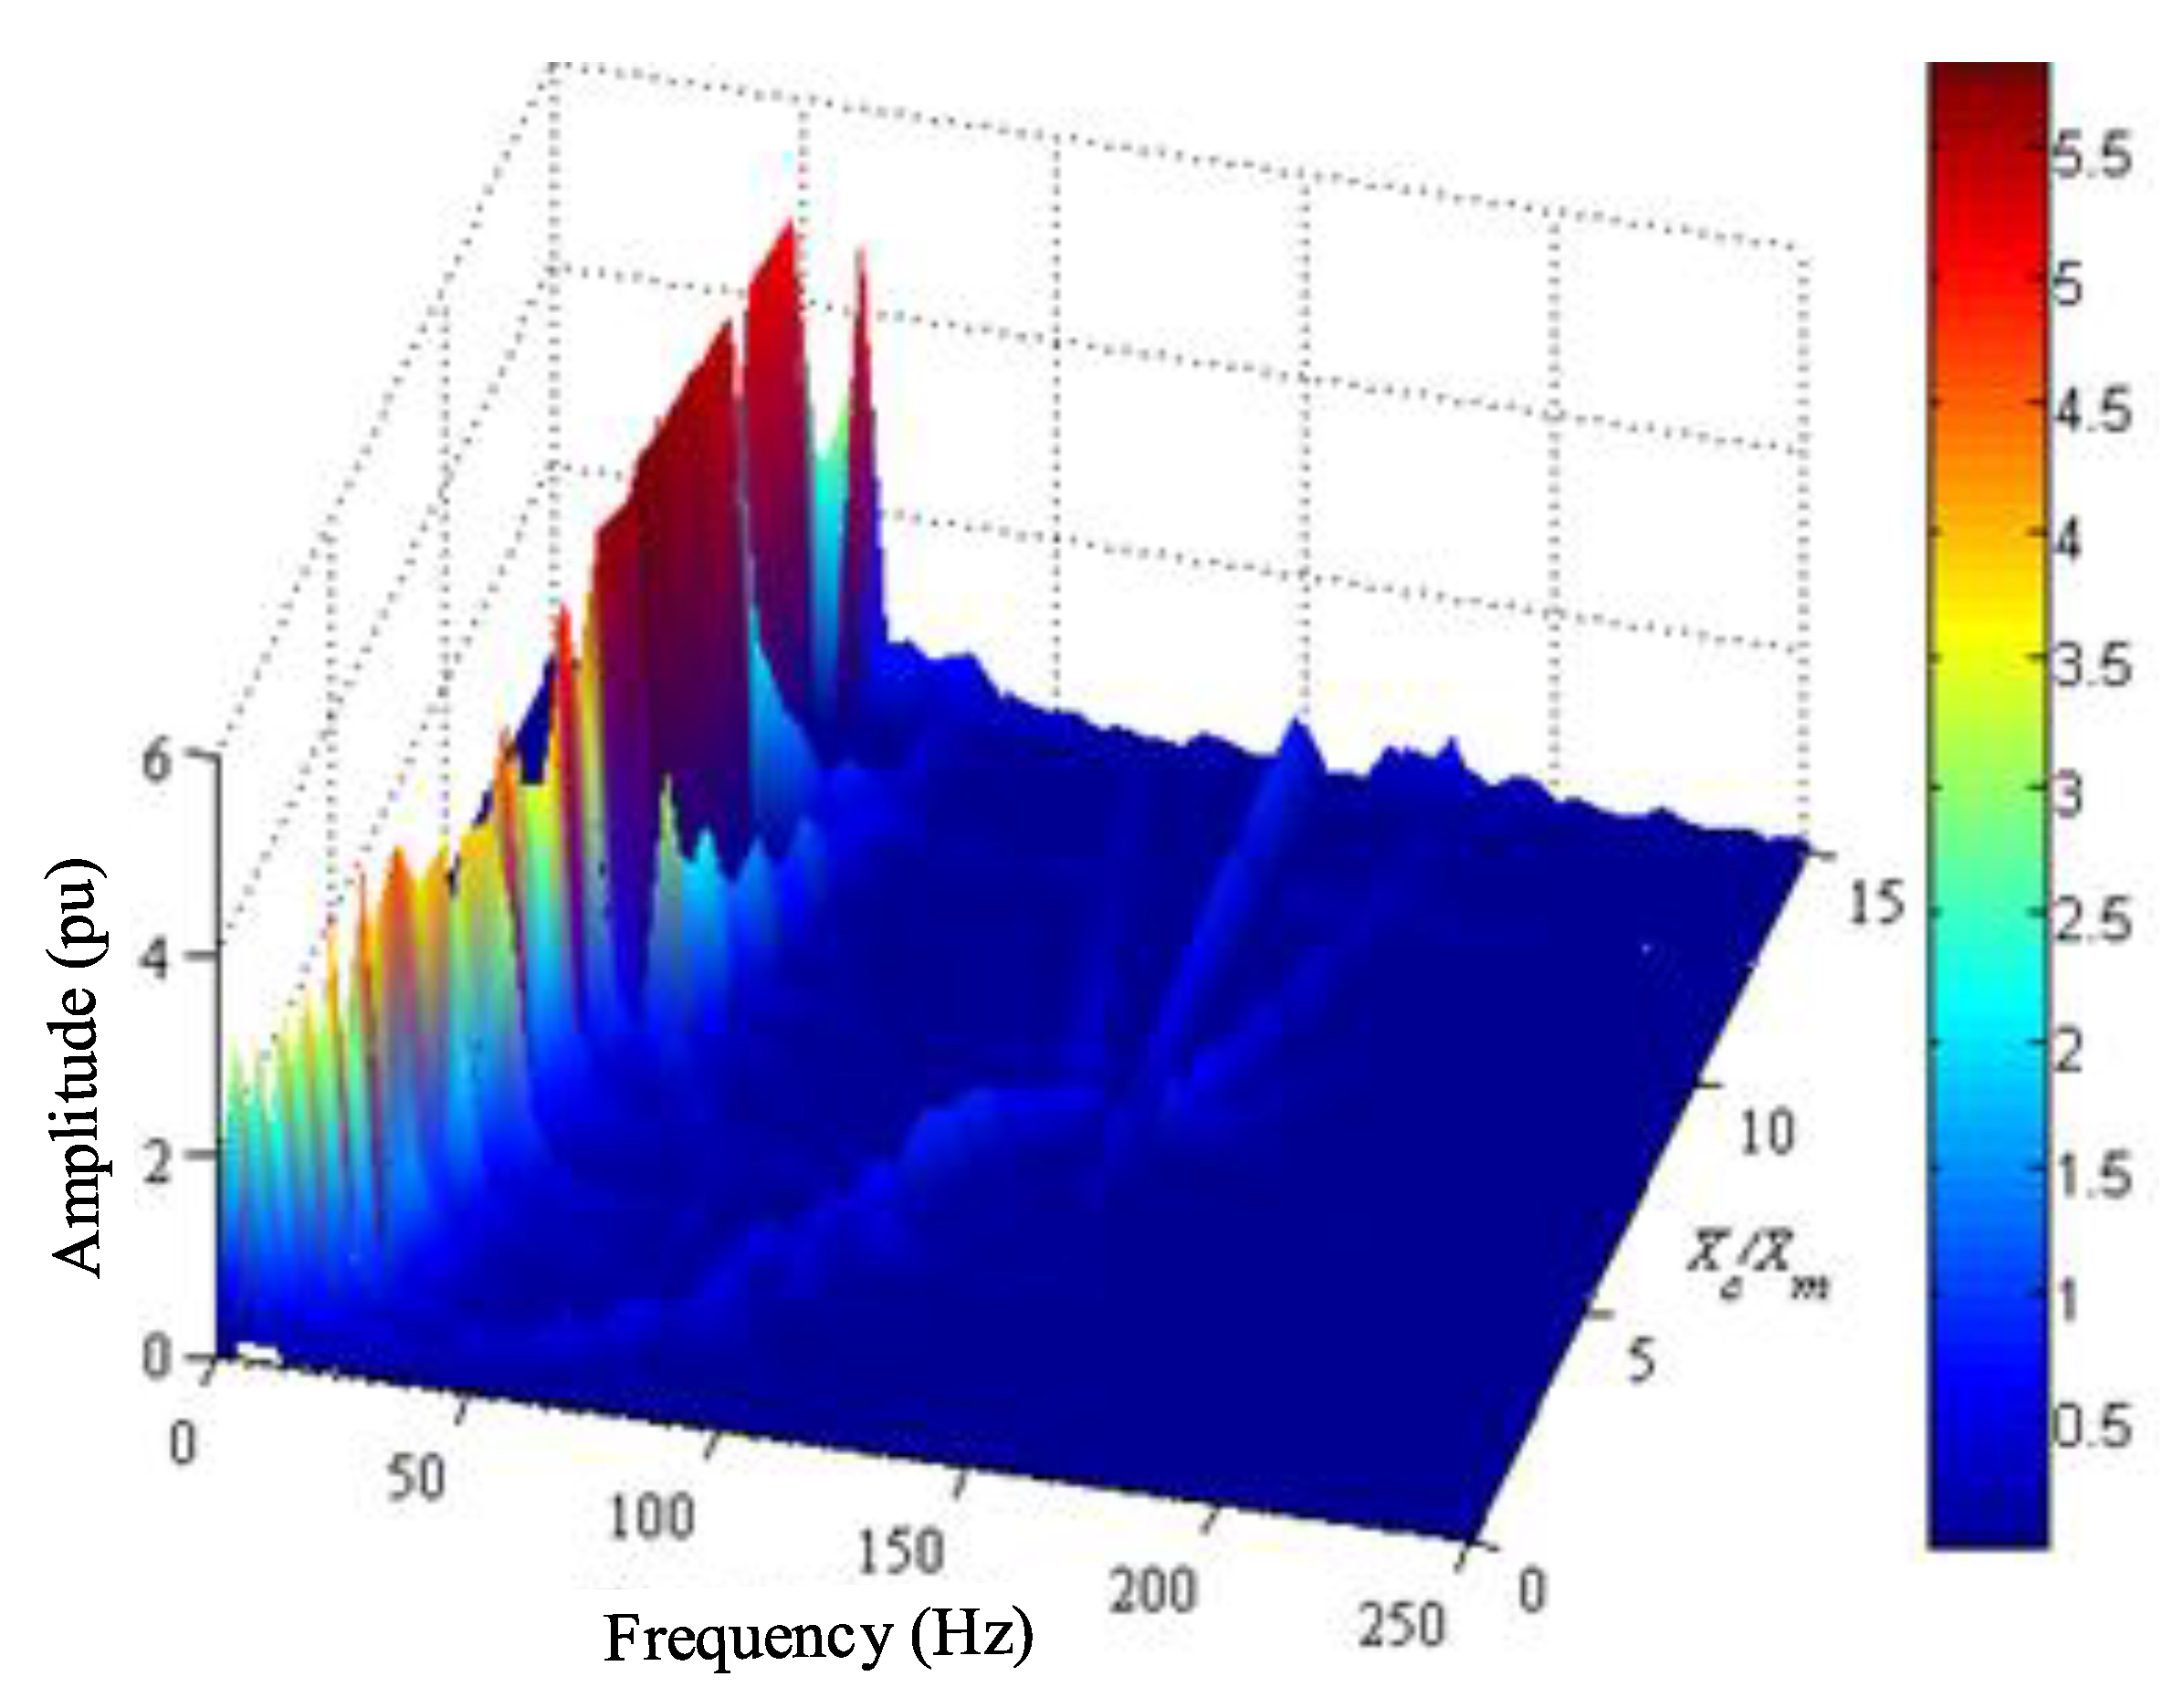
The estimated flux was analyzed, with particular attention paid to its frequency spectrum. For this purpose, 160-point discrete fourier transform (DFT) was applied.
Figure 4 presents the spectrum of estimated flux for the whole assumed range of the
Xc/
Xm ratio (
Xc is a zero-sequence capacitive reactance of the distribution network,
Xm is the VT-saturated magnetizing reactance). It can be observed that frequencies between 6.25 and 50 Hz predominate after ferroresonance inception. Thus, one can conclude that frequencies lower than 50 Hz can provide information about ferroresonance oscillations; therefore, this information is used by the proposed algorithm for ferroresonance detection.
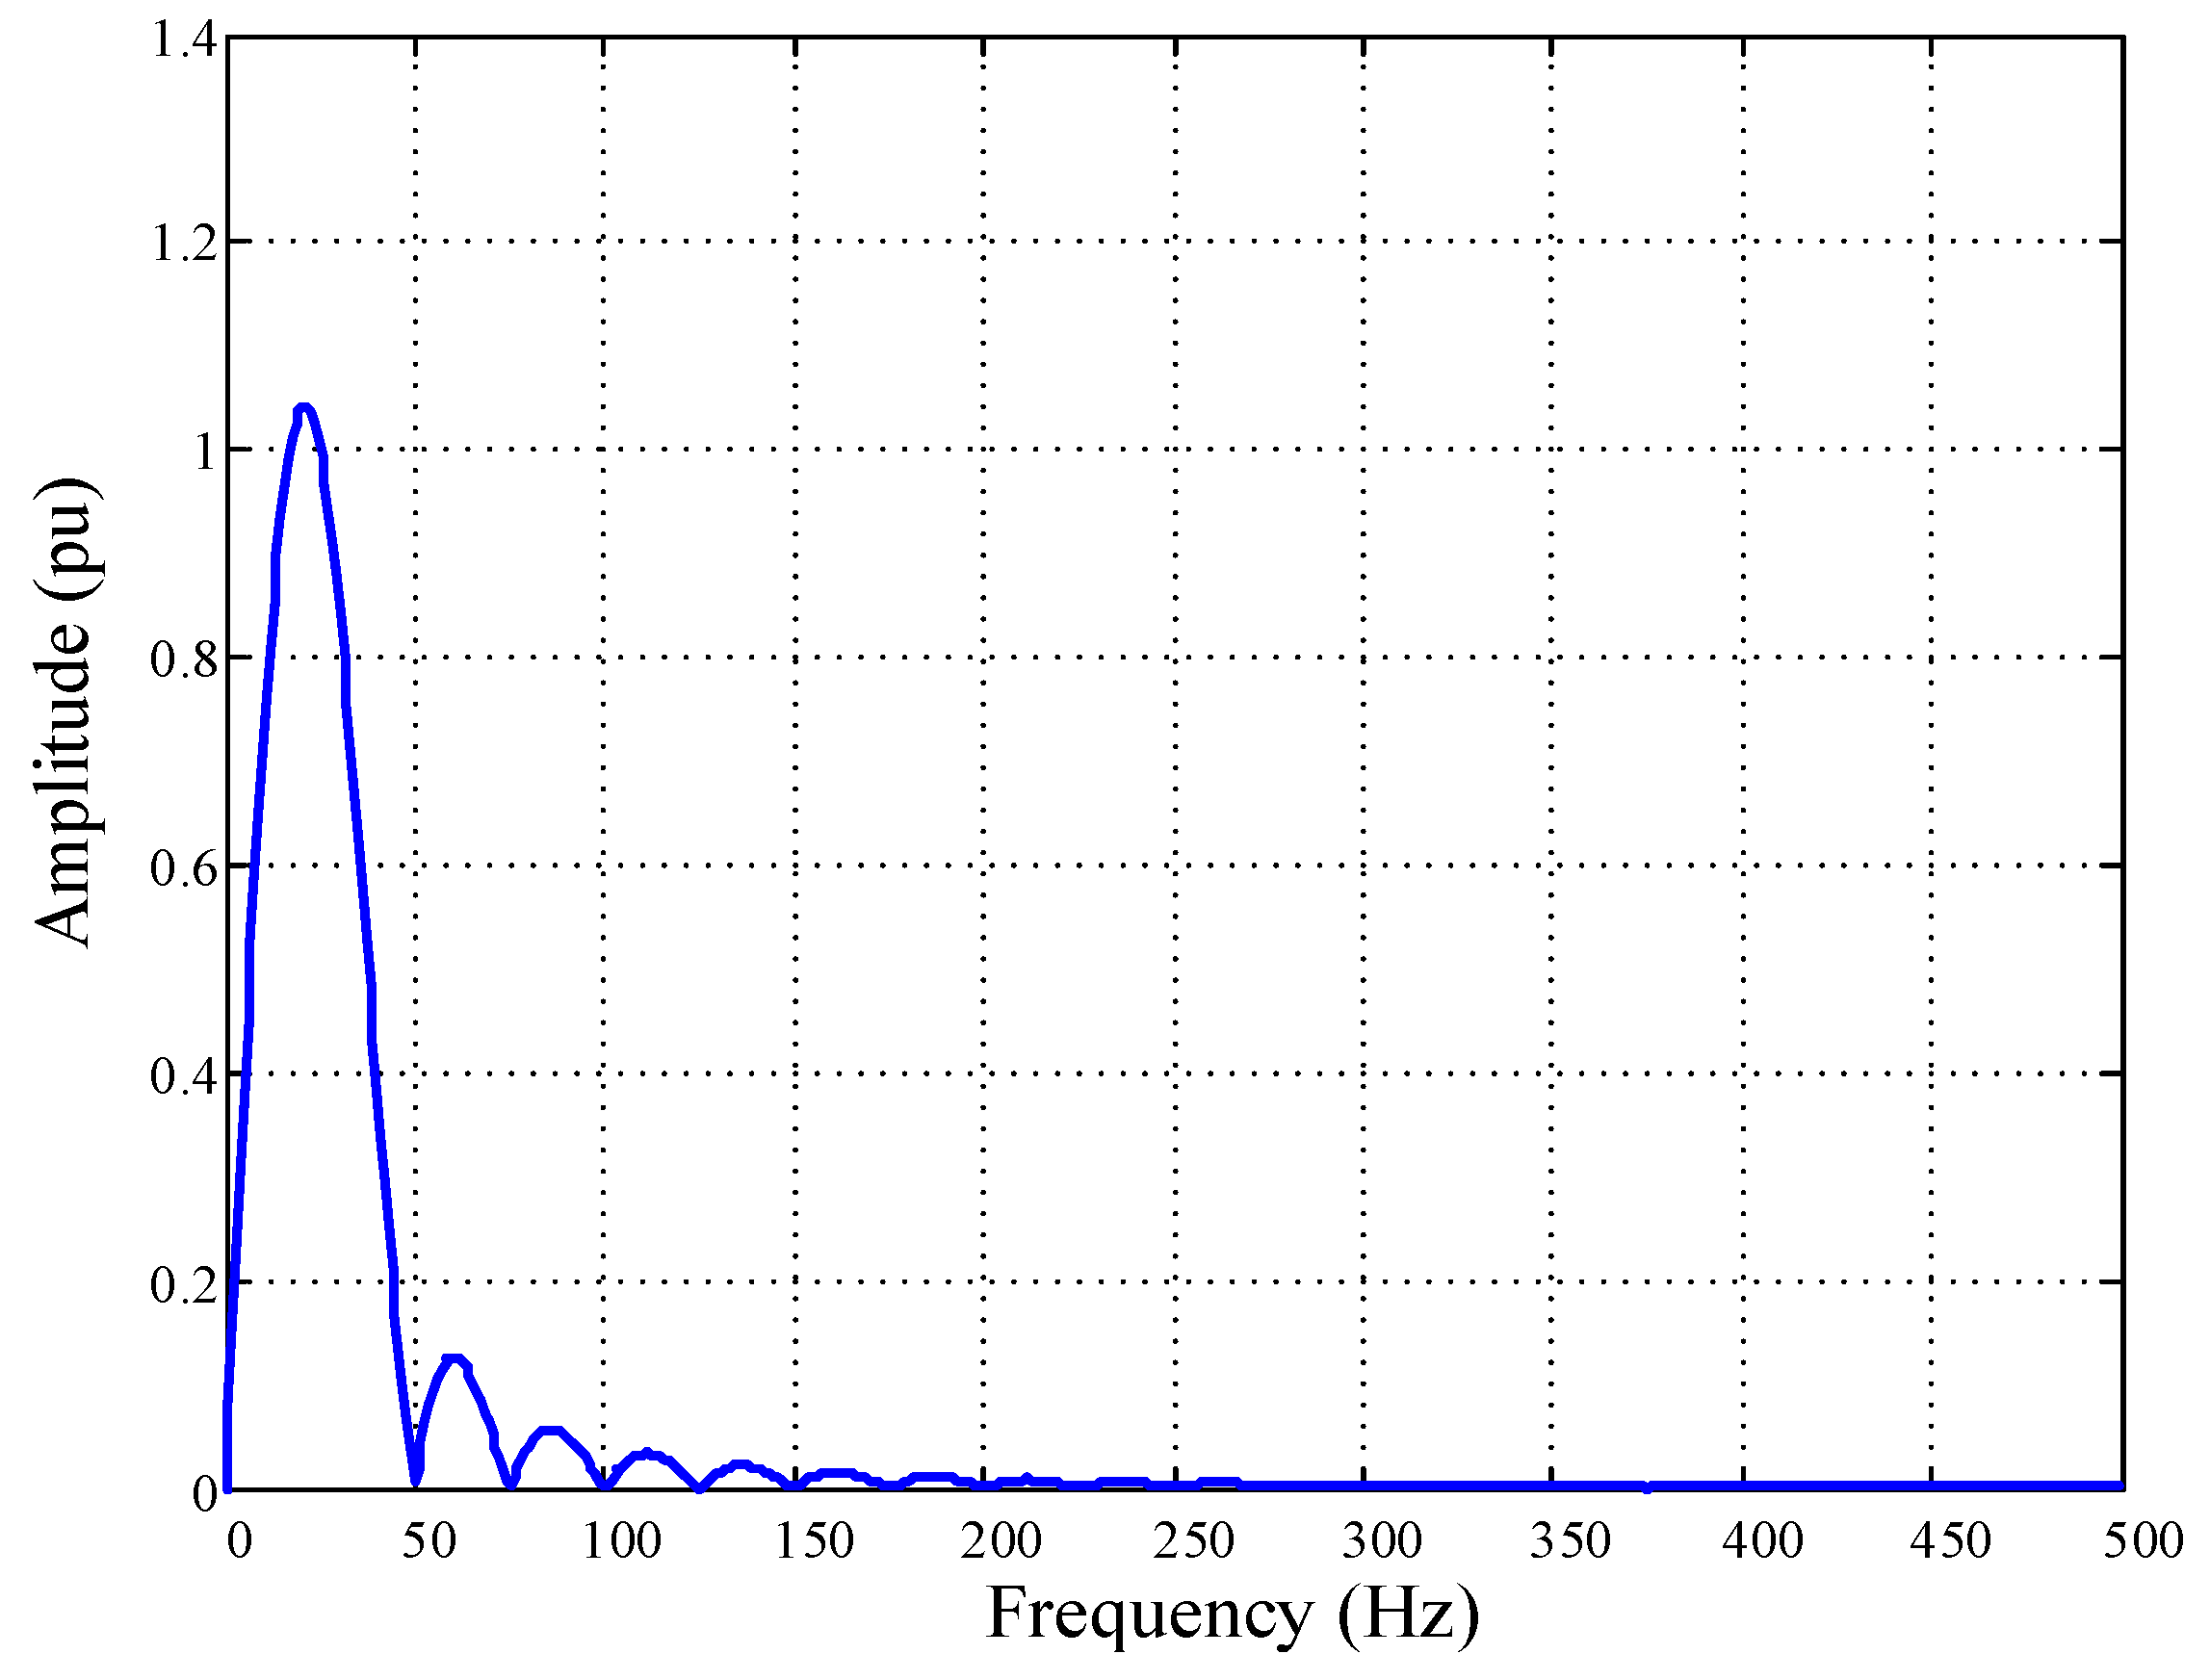
Step 2. Band-pass filter; the designed filter should reject the DC component, fundamental frequency (50 Hz), and frequencies higher than 50 Hz, which means that it should pass frequencies between 0 and 50 Hz. It was assumed that the band-pass filter has the following parameters: a finite impulse response (FIR) type, sine window, and window length
N = 40 for
fs = 1000 Hz (double-cycle). The equation gives the filter coefficients:
where
k = 0,1,2,...,
N − 1 and
.
The filter output signal is calculated as follows:
The frequency response of the proposed filter is shown in
Figure 5. As one can see, the developed filter fulfilled all the requirements related to the assumed frequency response.
Step 3. Amplitude measurement; estimation of amplitude of the filter output signal is performed using the digital integral method. The magnitude is measured according to the formula:
where
Ts is the sample time,
f25 is the constant value (
f25 = 25 Hz), and
Tx is the signal period that is not fixed.
Unfortunately, this algorithm cannot be used in such a form directly because the period of the signal is not fixed. As mentioned previously, the ferroresonance oscillations have a nonlinear nature, and, therefore, the signal period can vary after ferroresonance inception. Moreover, the period of the signal may change several times during the ferroresonance (especially for chaotic ferroresonance). Therefore, the amplitude measurement algorithm should be supplemented by an additional function of a zero-crossing detection. The amplitude measurement is performed adaptively, which means that the amplitude is calculated for each half period of signal that is assessed by the zero-crossing detection procedure.
Step 4. In this block, the measured amplitude is compared to an appropriate threshold; here, 0.025. This value of threshold was selected after analysis of all simulated ferroresonance oscillation and fault cases.
Step 5. Alarm delay is used to increase the reliability of the scheme operation. In this block, a time delay (expressed in the number of samples) between the activation of the detection procedure and the ALARM signal is introduced. The ALARM is activated when the condition is satisfied for at least 100 samples (100 milliseconds for sampling rate 1 kHz) (
AD = 100, see
Figure 3).
Step6. Alarm reset; this block is helpful when the condition is not met for a short period of time (e.g., for a few milliseconds). In such a case (thanks to ALARM RESET block), the ALARM signal is still on. The ALARM signal is cleared when the condition is not fulfilled for over 160 samples (160 milliseconds) (
AR = 160, see
Figure 3).
4. Testing of the Algorithm for Ferroresonance Detection
The figures below present selected cases and testing results of the new algorithm for the detection of ferroresonance oscillations.
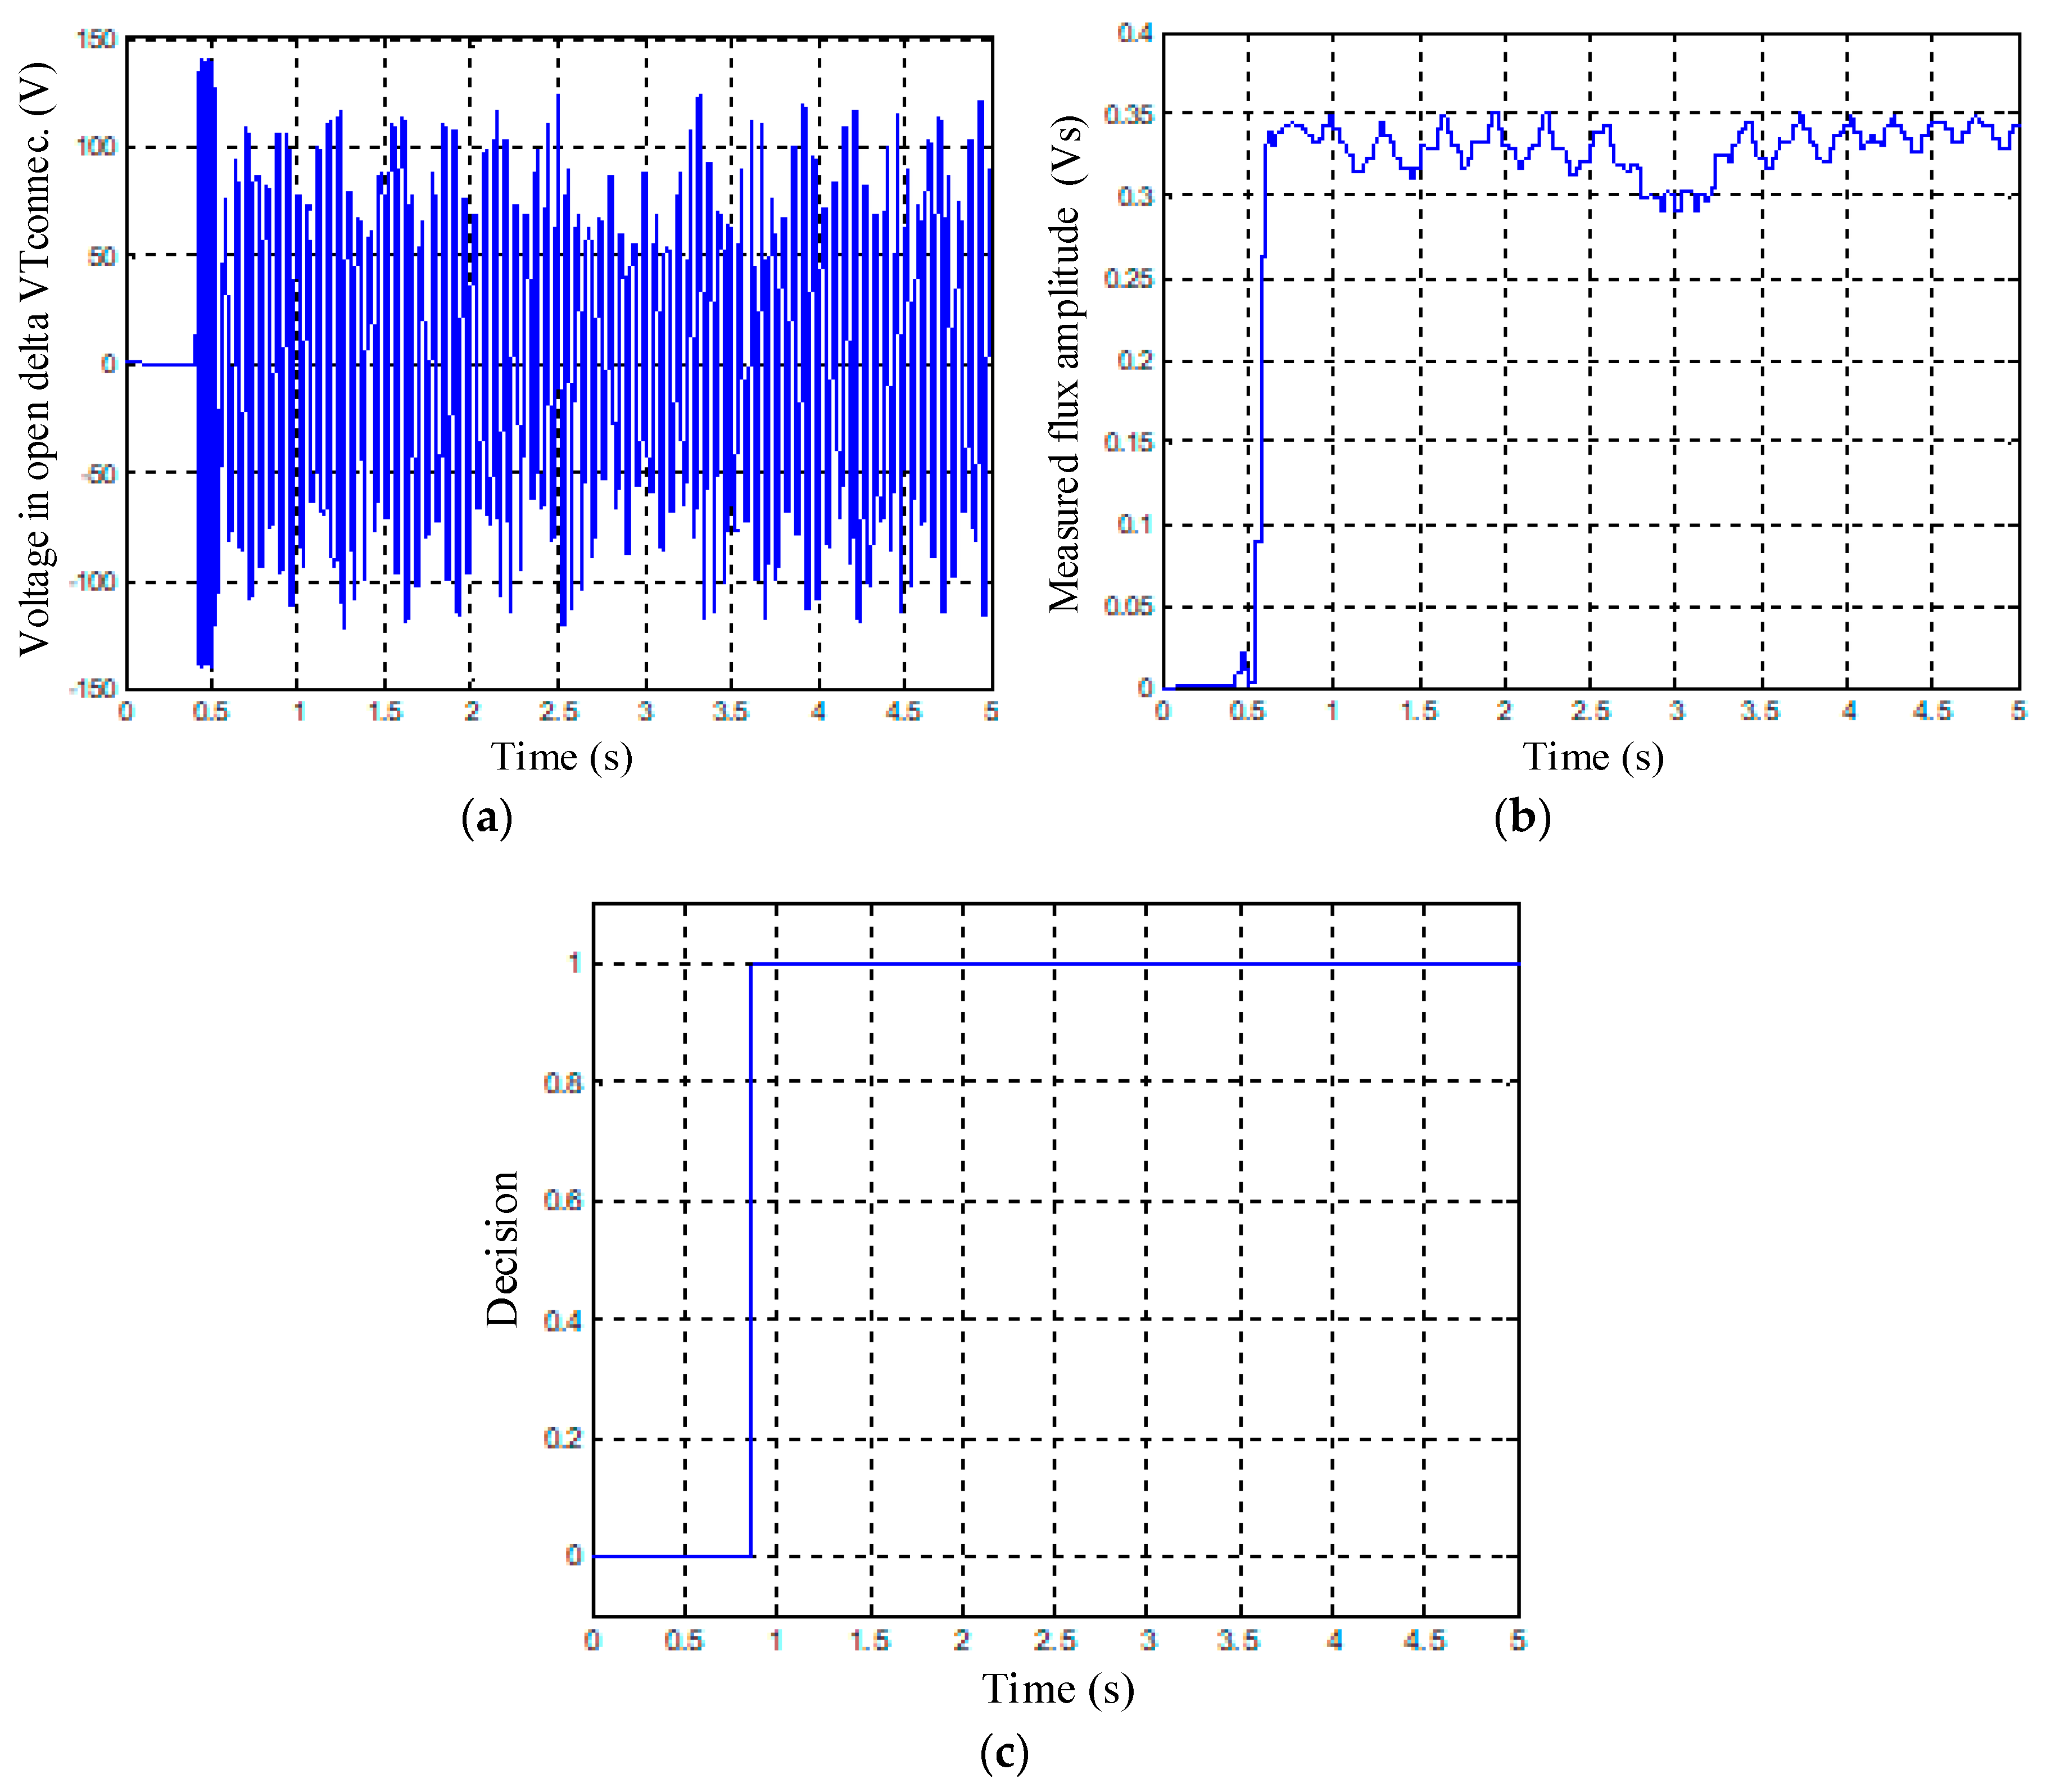
A case of a reference signal for pure 50 Hz is presented in
Figure 6. One can see that the measured flux amplitude (
Figure 6b) was greater than the threshold (here, 0.025). Such a situation was caused by the transient response of a filter after the sudden change of the input signal amplitude. However, the algorithm did not correctly identify this situation as ferroresonance because of the introduced time delay, which is helpful in such cases (
Figure 6c).
A case shown in
Figure 7a presents ferroresonance oscillations that arose after a transient fault in an ungrounded neutral system. The content of low frequencies (between 0 and 50 Hz) in voltage waveform in open delta VT connection was higher after ferroresonance inception, and, consequently, the measured flux amplitude (
Figure 7b) exceeded the setting threshold. Therefore, the proposed algorithm correctly identified this situation and an alarm signal was generated (
Figure 7c).
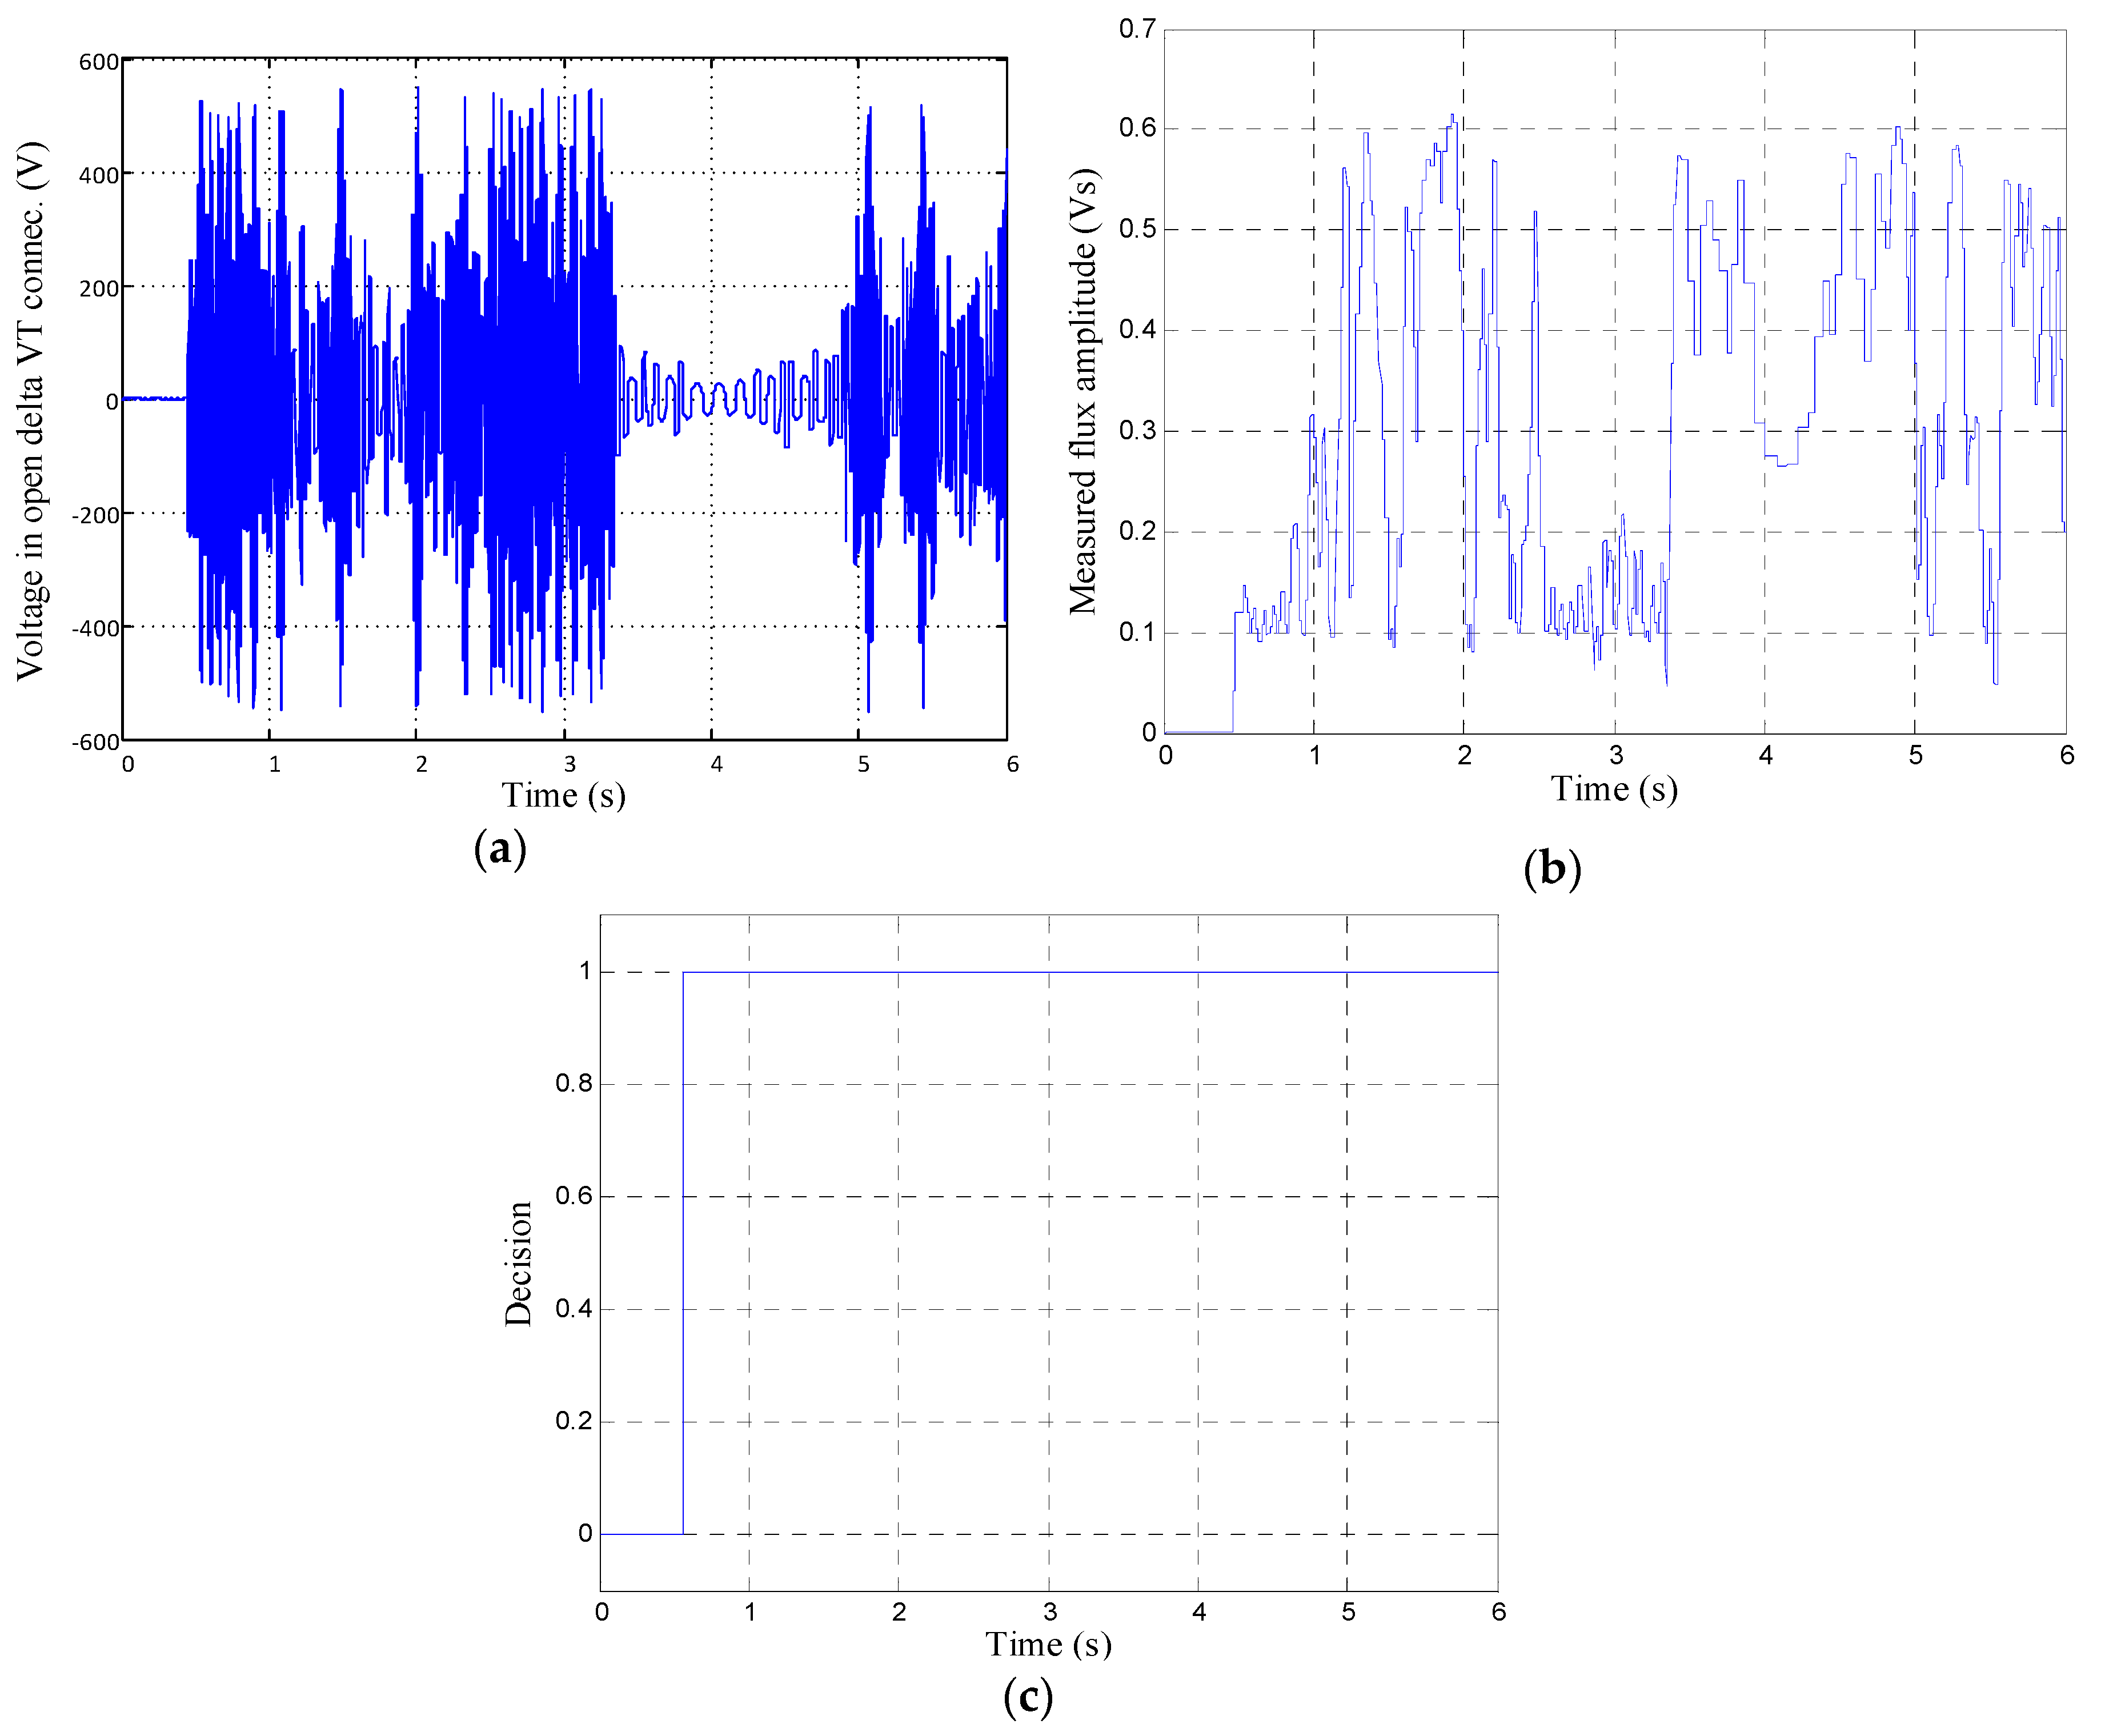
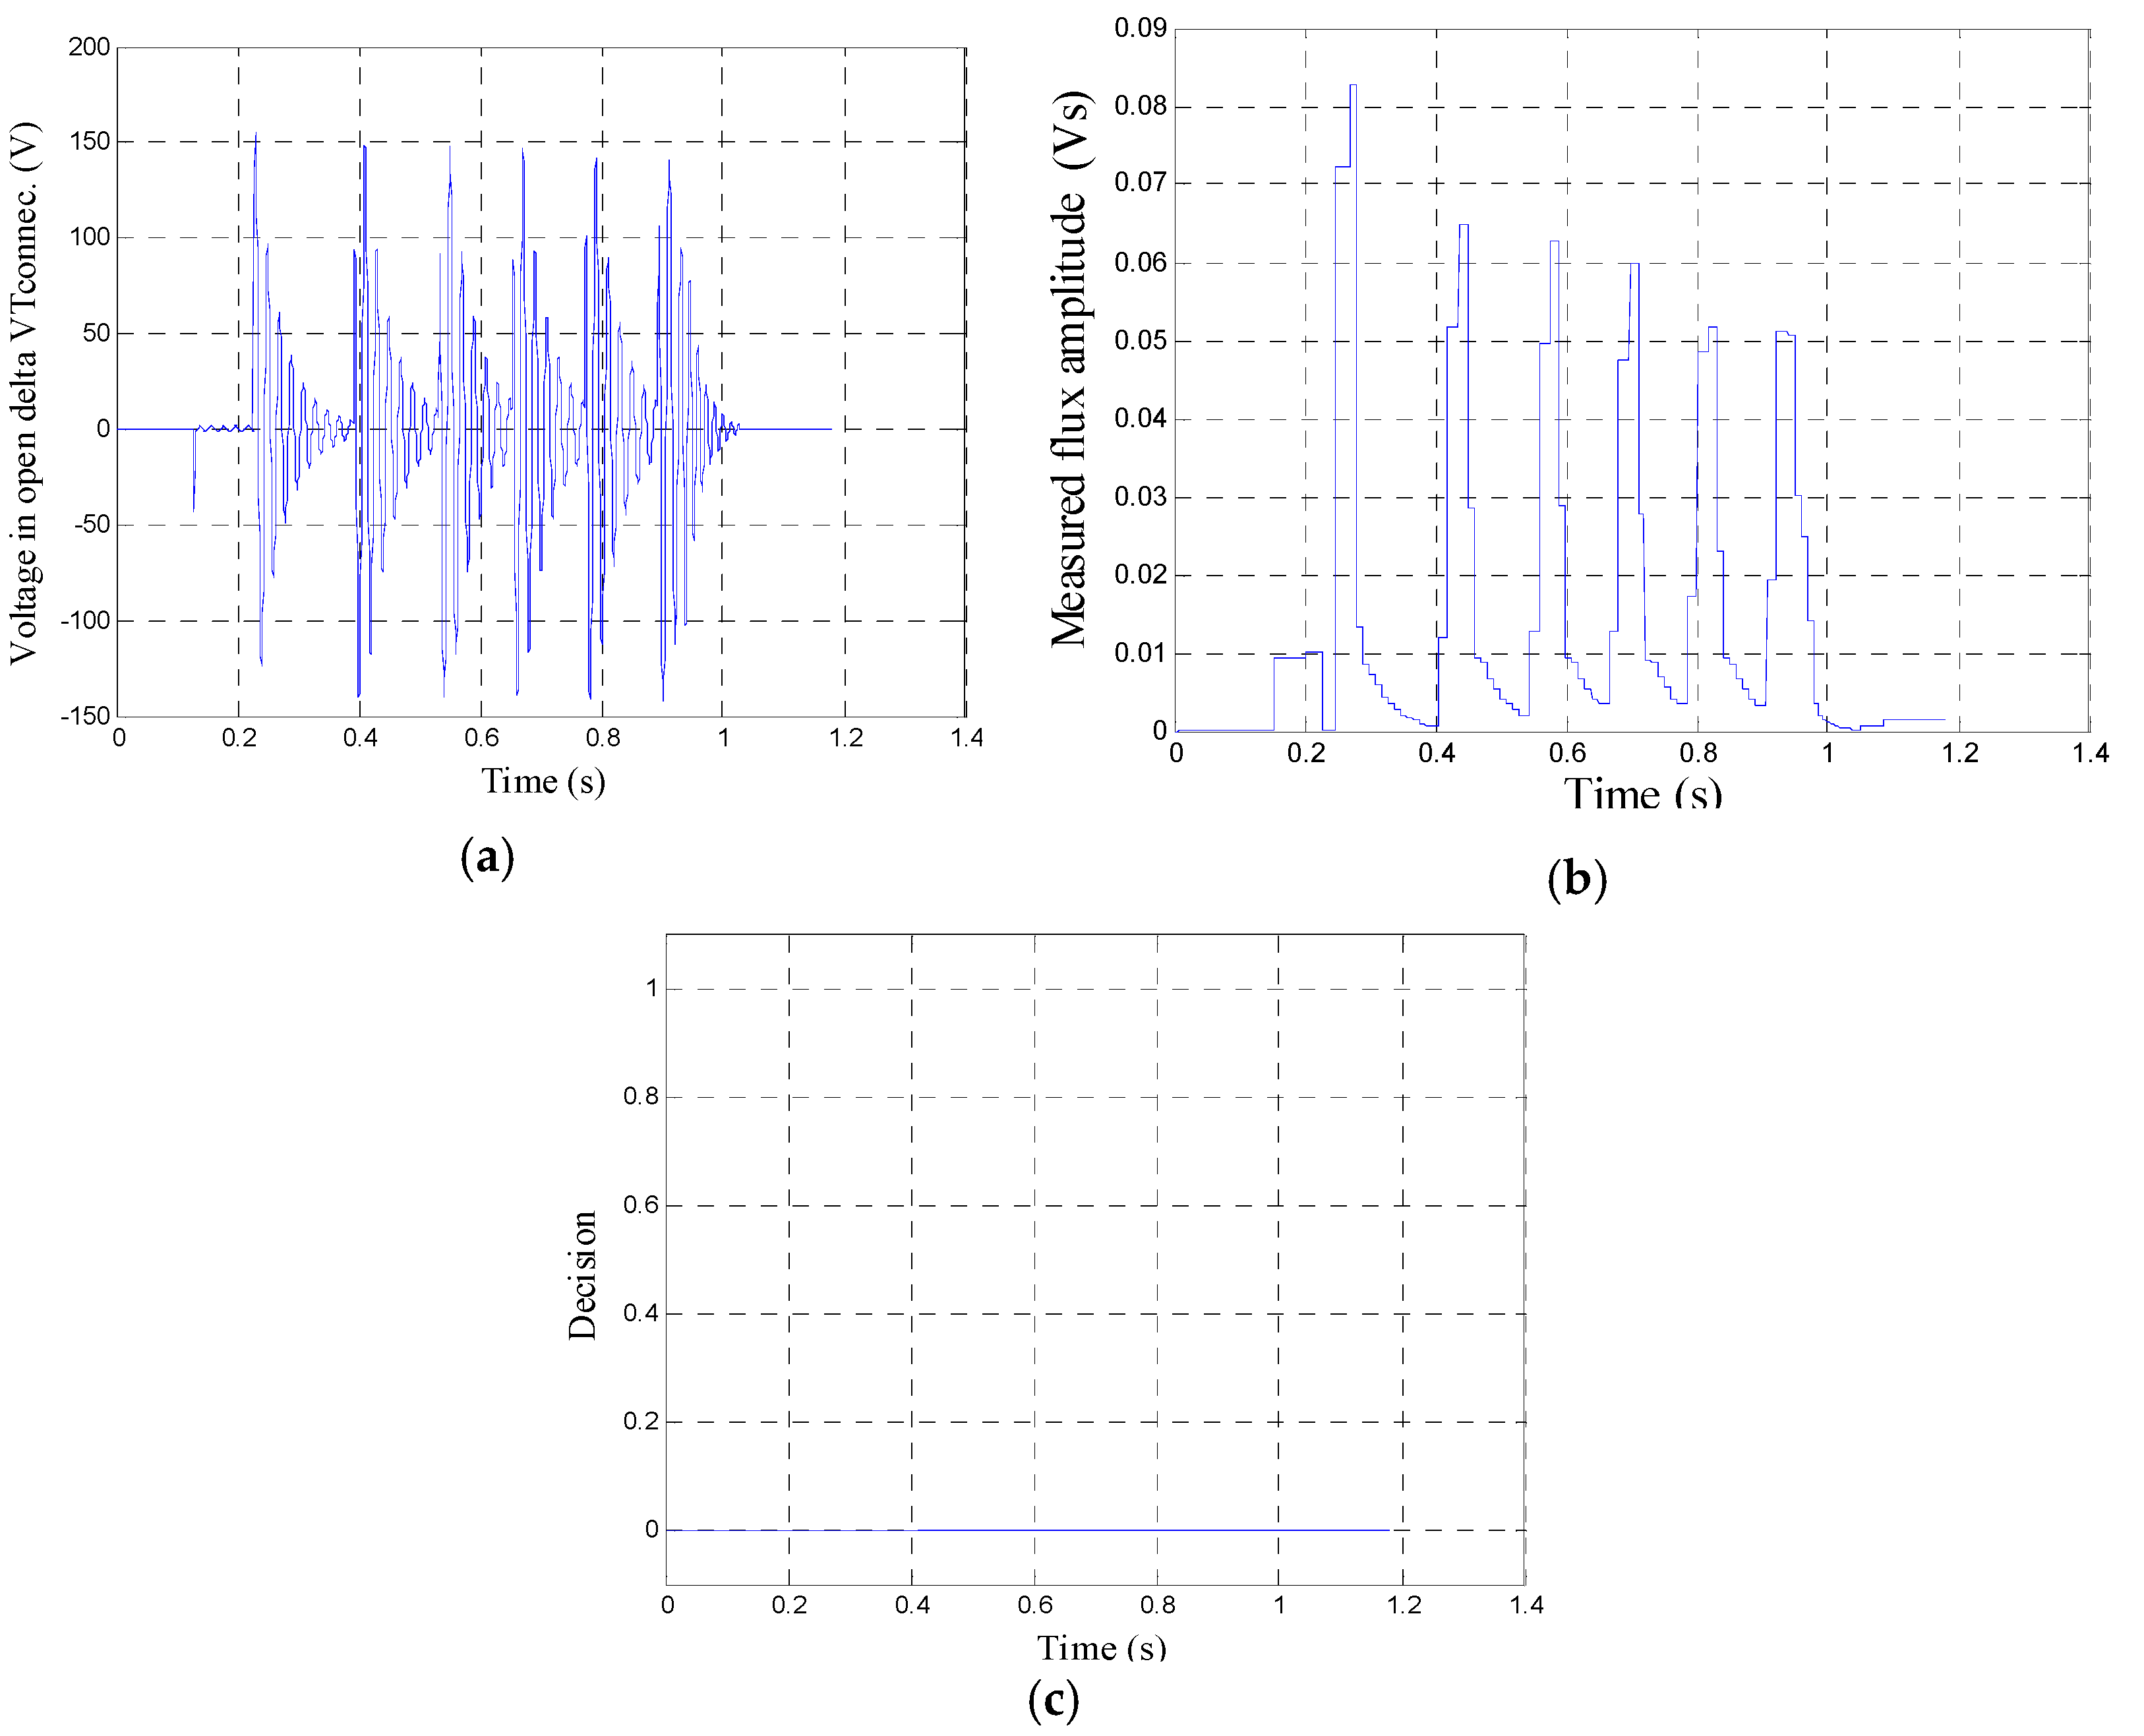
Figure 8 illustrates a ferroresonance case due to a transient ground fault for
Xc/
Xm = 6.3. First, at 0.45 s, a phase-to-ground (L1-G) fault took place, and then 60 milliseconds later, it was tripped, which initiated ferroresonance oscillations. One can see that a chaotic ferroresonance took place, characterized by a non-periodic waveform and high overvoltage (
Figure 8a). Additionally, the measured flux amplitude was greater than the threshold (
Figure 8b) and the proposed algorithm was able to detect ferroresonance reliably (
Figure 8c).
Further conducted simulation studies justify the statement that the proposed algorithm can quickly and successfully detect ferroresonance conditions occurring in ungrounded neutral systems for the whole assumed range of the Xc/Xm ratio.
The proposed algorithm was tested with the use of registered real-world signals. Here, only fault cases were used, since no ferroresonance recordings were available. As was mentioned, the proposed algorithm should be able to correctly distinguish fault cases and not react in such a situation.
Figure 9 presents the results for a selected, recorded fault case. One can note that the voltage waveshape, shown in
Figure 9a, is very similar to when ferroresonance oscillations take place, compared with
Figure 8a. However, mainly, the fundamental component predominates in the voltage in open delta VT connection. Therefore, for this case, the proposed algorithm works properly without indicating ferroresonance that did not occur (
Figure 9c).
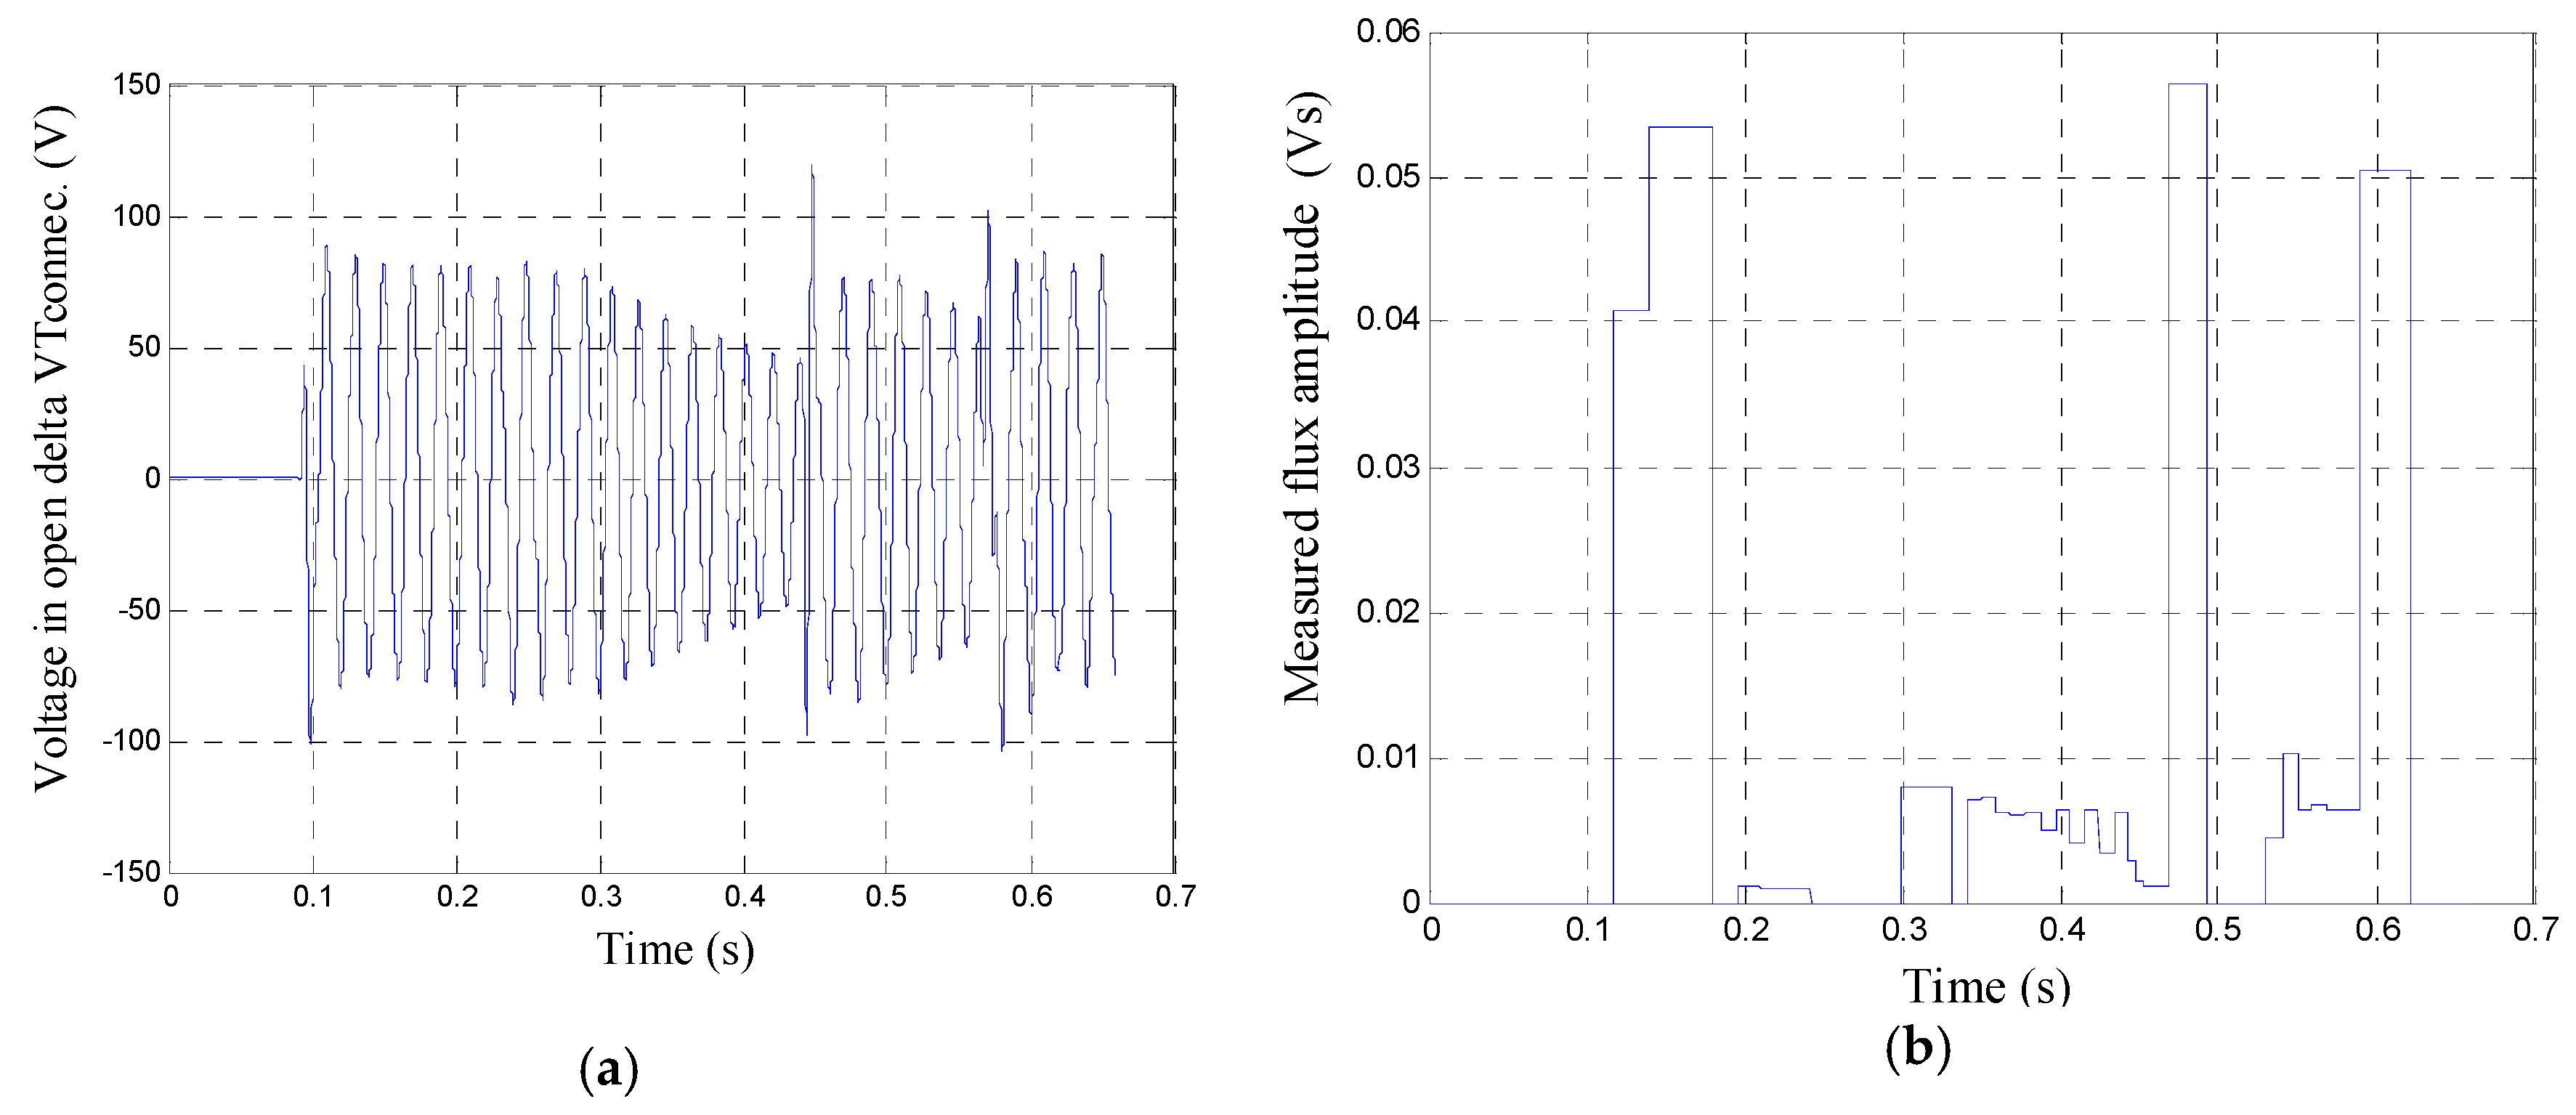
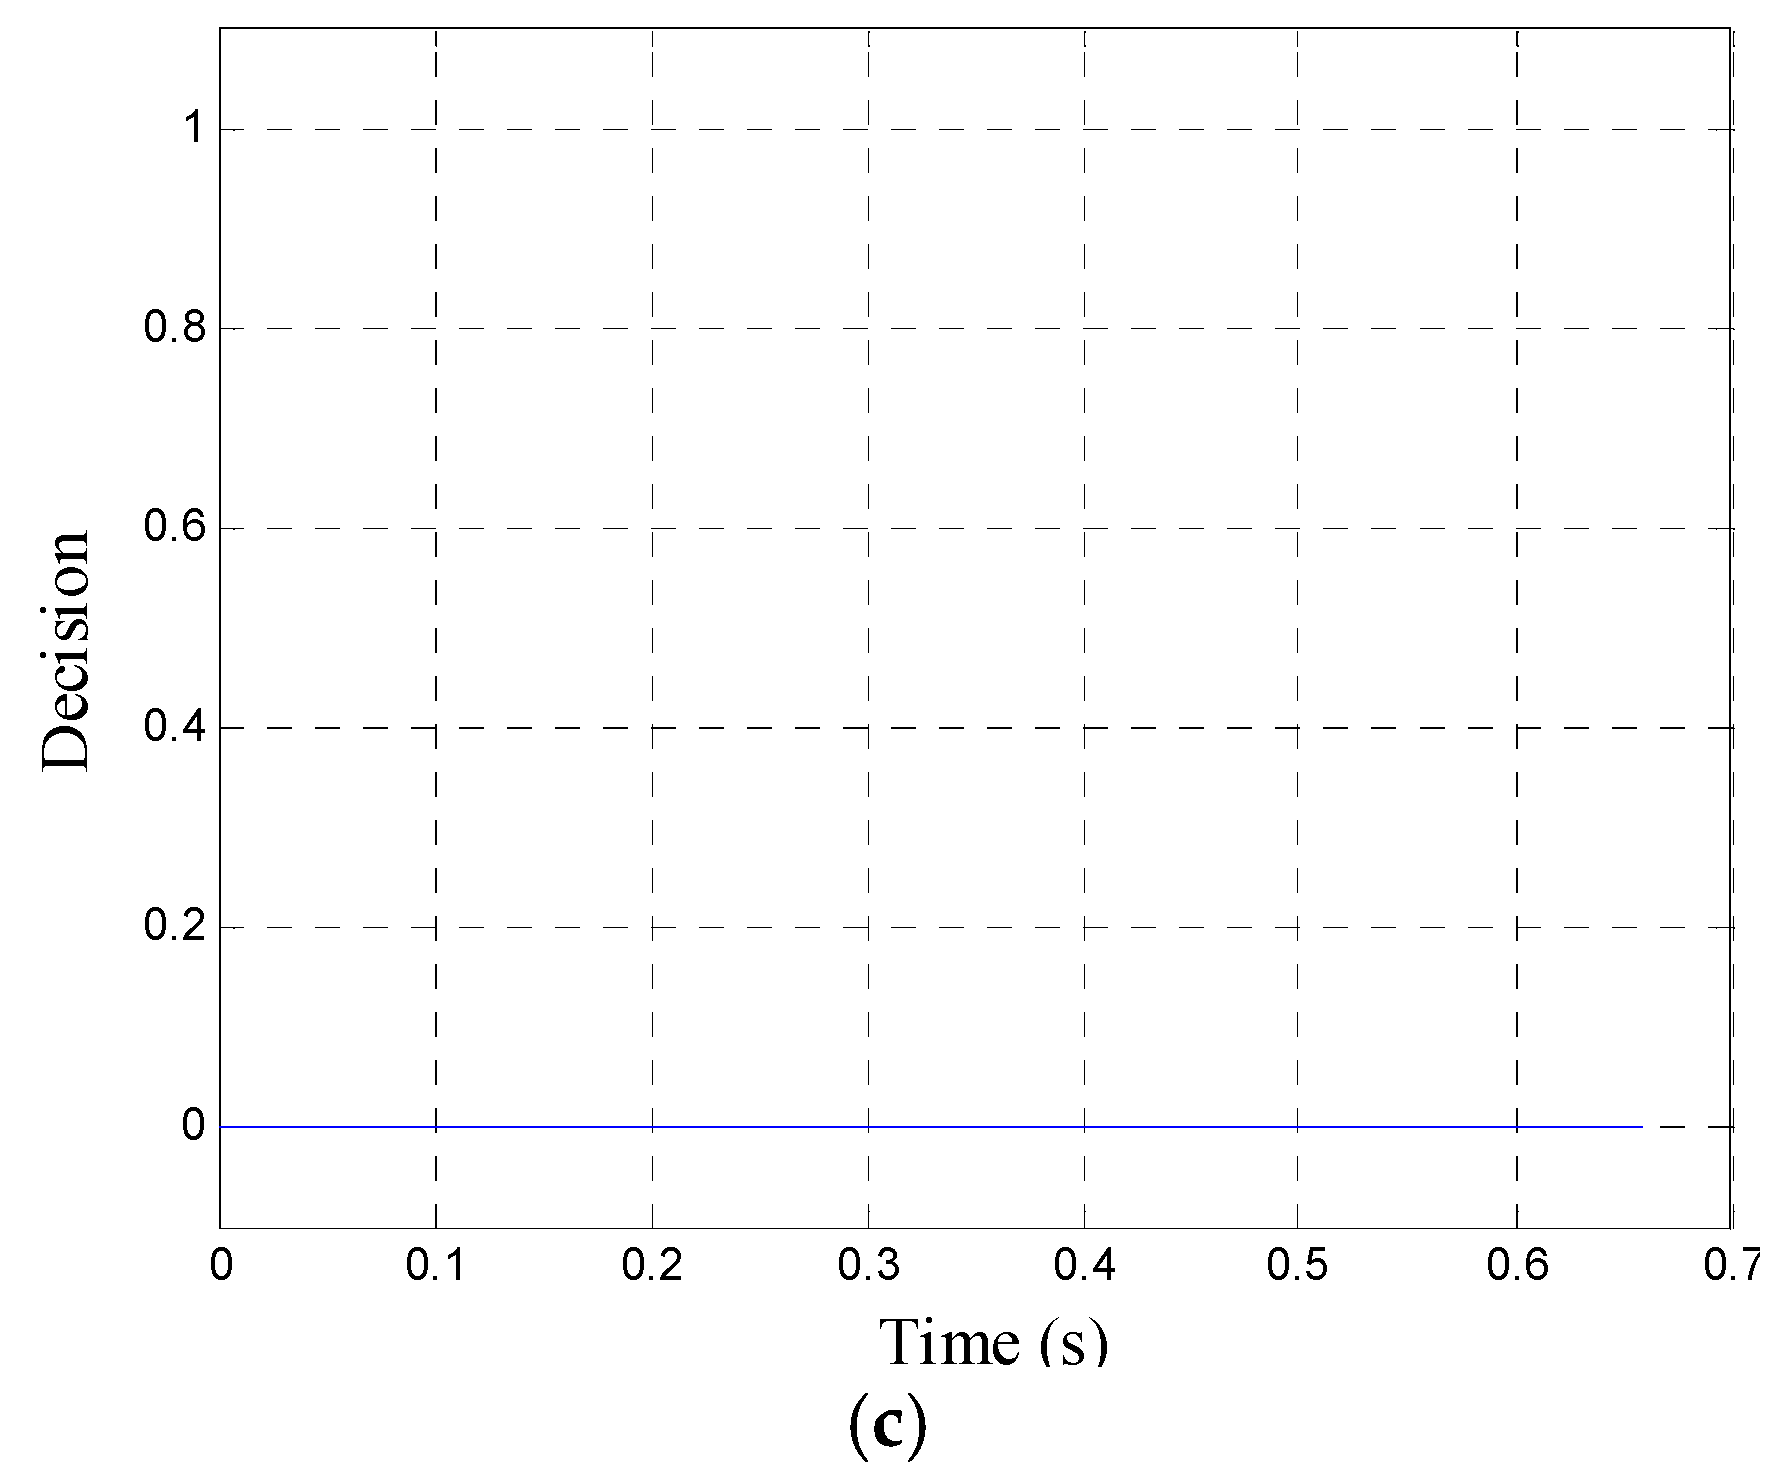
The next recorded fault case is presented in
Figure 10. It can be seen that, for this fault case, the new algorithm remained stable without issuing a detection decision (see
Figure 10c). The measured flux amplitude was close to 0; however, in the transient state, it was shortly greater than the setting threshold (
Figure 10b). The algorithm did not maloperate due to the introduced time delay for decision making (100 ms).
The last case presented in
Figure 11 is an interesting arcing fault with six restrikes. In this case, the proposed algorithm also operated correctly, which means that no undesired alarm signal was issued (
Figure 11c). One can conclude that the proposed algorithm is stable even under such severe transient conditions.
5. Conclusions
In this paper, the problems with ferroresonance phenomena and the new algorithm for the detection of ferroresonance oscillations are described. The proposed algorithm was based on an estimated flux resulting from the voltage in open delta VT connection. In this solution, appropriate filtering was applied, which passes only subharmonics that appear during ferroresonance oscillations. An adaptive algorithm was used to measure the flux amplitude after filtration, with on-line adjusting to the current period of the signal. Finally, proper logic of the decision making was applied, with special blocks for alarm resets and alarm delays.
The testing results have proven that the new solution detects ferroresonance oscillations quickly and reliably under all considered conditions. In addition, the proposed algorithm does not overreact during faults and is simple for practical implementation.
6. Patents
W. Rebizant, K. Solak, A. Wiszniewski, M. Kereit, “Method and device for generating a resonance signal indicating the presence of a ferroresonant oscillation in an electrical system”, European Patent No. EP3080885B1, Chinese Patent CN105981250B.
Author Contributions
Conceptualization, K.S.; methodology, K.S.; software, K.S. and W.R.; validation, K.S. and W.R.; formal analysis, K.S.; investigation, K.S.; resources, W.R. and M.K.; data curation, K.S.; writing—original draft preparation, K.S; writing—review and editing, W.R. and M.K.; visualization, K.S.; supervision, W.R.; project administration, W.R.; funding acquisition, M.K. All authors have read and agreed to the published version of the manuscript.
Funding
This research received no external funding.
Conflicts of Interest
The authors declare no conflict of interest.
References
- Ferracci, P. Ferroresonance, Cahier Technique No. 190; Groupe Schneider, 1998. Available online: https://www.se.com/us/en/download/document/ECT190/ (accessed on 10 June 2020).
- Iravani, M.R. Slow Transients Task Force of the IEEE Working Group on Modelling and Analysis of System Transients Using Digital Programs, “Modelling and Analysis Guidelines for Slow Transients—Part III: The Study of Ferroresonance”. IEEE Trans. Power Deliv. 2000, 15, 255–265. [Google Scholar] [CrossRef]
- Horak, J. A review of ferroresonance. In Proceedings of the 57th Annual Conference for Protective Relay Engineers, College Station, TX, USA, 30 March–1 April 2004; pp. 1–29. [Google Scholar]
- Pattanapakdee, C.B.K. Failure of Riser Pole Arrester due to Station Service Transformer Ferroresonance. In Proceedings of the International Conference on Power Systems Transients (IPST’07), Lyon, France, 4–7 June 2007. [Google Scholar]
- Jacobson, D.A.N.; Swatek, D.R.; Mazur, R.W. Mitigating potential transformer ferroresonance in a 230 kV converter station. In Proceedings of the 1996 Transmission and Distribution Conference and Exposition, Los Angeles, CA, USA, 15–20 September 2002; pp. 269–275. [Google Scholar]
- Emin, Z. Voltage transformer ferroresonance in 275 kV substation. In Proceedings of the 1999 Eleventh International Symposium on High Voltage Engineering, London, UK, 23–27 August 1999; pp. 283–286. [Google Scholar] [CrossRef]
- Escudero, M.V.; Dudurych, I.; Redfern, M. Characterization of ferroresonant modes in HV substation with CB grading capacitors. Electr. Power Syst. Res. 2007, 77, 1506–1513. [Google Scholar] [CrossRef]
- Zhang, B.; Lu, T. On the Use of Wavelet Decomposition for Ferroresonance Detection in Power System. In Proceedings of the 2009 Asia-Pacific Power and Energy Engineering Conference, Wuhan, China, 27–31 March 2009; pp. 1–4. [Google Scholar] [CrossRef]
- Mokryani, G.; Haghifam, M.-R.; Latafat, H.; Aliparast, P.; Abdolahi, A. Wavelet based kernel fisher classifier for ferroresonance identification. In Proceedings of the 15th International Conference on Intelligent System Applications to Power Systems, Curitiba, Brazil, 8–12 November 2009. [Google Scholar]
- Mokryani, G.; Haghifam, M.-R.; Esmaeilpoor, J. Identification of Ferroresonance based on wavelet transform and artificial neural network. In Proceedings of the 2007 Australasian Universities Power Engineering Conference, Perth, WA, Australia, 9–12 December 2007. [Google Scholar]
- Mokryani, G.; Haghifam, M.-R. Application of wavelet transform and MLP neural network for ferroresonance identification. In Proceedings of the 2008 IEEE Power and Energy Society General Meeting—Conversion and Delivery of Electrical Energy in the 21st Century, Pittsburgh, PA, USA, 20–24 July 2008. [Google Scholar]
- Guo, P.-Y.; Li, C.-Z.; Yan, S.; LiangCheng, J.; Zhang, J.-Y. Application of wavelet transform in ferroresonance detection. In Proceedings of the 2011 2nd International Conference on Artificial Intelligence, Management Science and Electronic Commerce (AIMSEC), Dengleng, China, 8–10 August 2011; pp. 3800–3803. [Google Scholar]
- Mokryani, G.; Siano, P.; Piccolo, A. Identification of ferroresonance based on S-transform and support vector machine. Simul. Model. Pract. Theory 2010, 18, 1412–1424. [Google Scholar] [CrossRef]
- Gutierrez, A.A.; Martinez, R.; Manana, M.; Pigazo, A.; Minguez, R. Detection of ferroresonance occurrence in inductive voltage transformers through vibration analysis. Int. J. Electr. Power Energy Syst. 2019, 106, 294–300. [Google Scholar] [CrossRef]
- Piasecki, W.; Florkowski, M.; Fulczyk, M.; Mahonen, P.; Nowak, W. Mitigating Ferroresonance in Voltage Transformers in Ungrounded MV Networks. IEEE Trans. Power Deliv. 2007, 22, 2362–2369. [Google Scholar] [CrossRef]
- SimPowerSystems User Guide; The MathWorks, Inc.: Natick, MA, USA, 2019.
- Solak, K.; Rebizant, W. Modeling of Ferroresonance Phenomena in MV Networks. In Proceedings of the IEEE Canada Electrical Power and Energy Conference, EPEC2018, Toronto, ON, Canada, 10–11 October 2018; pp. 422–427. [Google Scholar]
- Rebizant, W.; Solak, K.; Wiszniewski, A.; Kereit, M. Method and Device for Generating a Resonance Signal Indicating the Presence of a Ferroresonant Oscillation in an Electrical System. European Patent No. EP3080885B1; Chinese Patent CN105981250B, 16 October 2018. [Google Scholar]
© 2020 by the authors. Licensee MDPI, Basel, Switzerland. This article is an open access article distributed under the terms and conditions of the Creative Commons Attribution (CC BY) license (http://creativecommons.org/licenses/by/4.0/).

