Abstract
During development of substitute anode materials suitable for solid oxide fuel cell (SOFC), understanding of sintering mechanisms and effects is significant for synthesized porous structures and performance. A molecular dynamics (MD) model is developed and applied in this study for the SOFC anode sintered materials to reveal the sintering condition effects. It is predicted that, for the case of two nanoparticles of electron-conducting La-doped SrTiO3 (LST), the higher the sintering temperature, the faster the aggregation of nanoparticles and the higher the sintering degree. An increase in the nanoparticle size could delay the sintering, process but does not affect the final sintering degree. The MD model is further applied for the case of the multi-nanoparticles containing LST and ion-conducting electrolyte materials of gadolinium-doped ceria (GDC), i.e., the LST-GDC particles. The sintering conditions and effects on the LST-GDC particles are evaluated, in terms of the mean square displacement (MSD) and various structural parameters. Two important thermal properties are also calculated that agree well with the experimental values. The findings obtained from this study are useful to identify the optimized sintering parameters for development of the SOFC electrode materials.
1. Introduction
Solid oxide fuel cell (SOFC) is considered to be an effective electrical device for hydrogen energy and utilization [1]. High performance of SOFC electrodes requires effective transport of reactants/products through pores, while ensuring tightness of involved catalyst and electrolyte materials to provide effective electronic/ionic conductivity and large, three-phase boundary (TPB) length for electrochemical reactions. Understanding the effects of the SOFC electrode microstructures has drawn intensive attention over recent decades [2].
Perovskite La-doped SrTiO3 (LST) materials have strong carbon deposition resistance and sulfur resistance, chemical stability, as well as high electronic conductivity under high temperature reduction conditions, which is regarded as one of the potential SOFC anode materials [3,4]. The solid state material sintering process, often employed for fabricating SOFC anodes, plays a decisive role in the effective transport processes [5]. In the literature, an analysis and simulation method of sintering kinetics and microstructure changes mostly stays at a mesoscale level, about 10−6 m for the synthesis process of the SOFC electrodes [6], and for modeling of the catalytic layer and gas diffusion layer [7]. This kind of modeling method includes, for instance, the Discrete Element Method [8,9], Kinetic Monte Carlo [10,11], Lattice Boltzmann method [12], etc.
The molecular dynamics (MD) modeling method can be a good way to study the sintering process at the microscopic scale, able to observe the anode morphology evolution. Since the first usage by Alder in 1956 [13], the MD method has become a popular one for molecular level simulation (~ 10−9 m) [6], particularly in theoretical research for modern condensed matter. At present, MD research on the porous microstructure and processing of SOFC electrodes focuses on the molecular adsorption/desorption [14], exploring alternative materials [15], and effect of the electrolyte doping on the electrode performance degradation [16]. Furthermore, most of the MD studies developed for the substitute anode materials (such as LST, gadolinium-doped ceria (GDC), etc.) have been limited to investigate the effects of doping on the lattice constants, pair correlation function (PCF), etc. There is no study yet being put on the co-sintered metal oxide materials at the nanoparticles scale (<10 nm, i.e., <100 Å) [17], relating to the sintering process and effects of the substitute materials.
Firstly, the complete sintering process of LST nanoparticles is investigated by the MD method developed in this study, which describes the physical phenomena from adhesion and neck growth to full coalescence up to several hundred picosecond (ps). This method allows determining the sintering rate of very small LST nanoparticles (with particle diameter (dp) < 5 nm) by monitoring the evolution of their surface areas. Via this way, the sintering mechanism of LST may be unraveled, and rate of the sintering or coalescence process may be quantified to bridge the knowledge gap from a few molecules to several nanometers.
Further for practical SOFC applications, the ideal anode material should not only be an appropriate electronic conductor, but also an ionic conductor [18]. The manufacturing process of SOFC anode requires both materials being sintered together, which is often known as the co-sintering process [19]. Among various dopants studied, gadolinium-doped ceria (GDC) has been reported to have the highest ionic conductivity, which is often used as an electrolyte material with LST being the electron-conducting material in SOFC anodes [20]. Consequently, both GDC and LST nanoparticles are selected and investigated in this work by a multi-nanoparticles MD model to reconstruct the anode sintered structure. Various structural parameters have also been calculated to reveal the LST-GDC co-sintering process mechanism. In addition, the thermal parameters (e.g., the volume heat capacity and thermal conductivity) are calculated and evaluated, which are also compared with the available data for validating this multi-nanoparticles model.
2. Modeling Development and Experimental Validation Method
2.1. Mathematic Equations
The Verlet algorithm [21] and Ewald summation [22] are both employed in this study, as implemented by Large-scale Atomic/Molecular Massively Parallel Simulator (LAMMPS) [23], while the following equations are employed for the MD model to investigate the sintering process of two LST nanoparticles and multi-nanoparticles of the LST-GDC material.
In the MD modeling, the potential interactions include the bonded and non-bonded terms. For the nanoparticles appeared in the crystal materials, the bonded interactions contributed by the bond, angle and dihedral are omitted, and only non-bonded interactions Enonbond(rij) are considered as below:
where ECoulomb (rij) represents the interaction of long-term Coulombic electrostatic force between atoms i and j, EVan_der_Waals (rij) represents the Van der Waals interaction between different particles, rij is the distance between atoms i and j.
The Coulombic term is described as:
where qi and qj are the charges for each ion, ε0 is the vacuum permittivity which equals to 8.85 × 10⁻¹² F/m, εr is the relative permittivity equals to 1 in the vacuum condition.
For the Van de Waals interaction between the different particles in the crystal materials, the Born-Mayer-Huggins (BMH) potential function is commonly employed to describe the ionic interactions in the crystal particles, which is also appropriated to determine the ion diffusion and thermal properties as below:
where the first term represents the effects of Pauli exclusion, and f0 is the parameter for the unit adoption which equals to 4.19 kJ/(mol × Å), ai and aj are the length parameter depending on the interaction, bi and bj are the length parameters relating to the ionic pair; while the second term indicates the attraction effect, where Ci and Cj are the coefficients of attraction interaction. In LAMMPS, the cut-off distance of the long-range Coulomb potential is usually set to be longer than half of the box length. Here, we choose the cut-off distance of the hybrid potential to be 15 Å.
The above mentioned pair-style potential functions have been developed and reported in the literature: Lewis and Catlow assumed that all O2−-O2− interactions were identical for all the metal-oxides; for the interaction between anion and cation, the Coulombic potential and BMH potential were assumed as the long-term and short-term effects, respectively, while the effects between anions were ignored [24]. Based on these assumptions, researchers have parameterized the potential functions of LST and GDC using, e.g., ab initio calculation and density functional theory (DFT)method. In the current work, the potential functions and parameters used to describe LST and GDC are derived from the potential function fitting studies by Thomas and Inaba [25,26], as shown in Table 1, which are also employed by the recent work [27,28]. It should be noted that the classical force field is used because of its simple description of the inter-atomic potential and its fast computation speed, which is suitable for the simulation involving several thousand atoms. The classical force field is strongly dependent on the parameters of the potential function and has a much lower computational quality compared to quantum mechanical methods. It should be noted that the classical force field applied in this study cannot accurately reflect the energy change caused by the existence and migration of the oxygen vacancies, which affects the sintering behavior and related parameters. These kinds of limitations may be lighted by the first principles or density functional theory approaches.

Table 1.
Born-Mayer-Huggins (BMH) potential parameters and partial charges for the La-doped SrTiO3 (LST) [25,26].
In order to validate the employed potential function and parameters, the bulk materials sintered from two LST nanoparticles was annealed, and the thermal physical properties (e.g., thermal conductivity, volume heat capacity) and lattice parameter of the bulk material were calculated and further compared with the data obtained from the synthesized materials (described in Section 2.4). As shown in Table 2, the simulated volume heat capacity increases from 1.602 to 1.695 J cm−3 K−1, while the experimental data increase from 1.660 to 1.689 J cm−3 K−1, which gives the error between the experimental and the simulation result within 5.5%. Similarly, the error for the thermal conductivity and lattice parameters is less than 3%. In other words, the above- mentioned potential function and selected parameters are suitable for the current study.
Table 2.
Comparison of simulation results and experimental data (volume heat capacity (VHC), thermal conductivity (TC), and lattice parameter).
2.2. Modeling Methods of LST Nanoparticle and Sintering Process
A single nanoparticle model was designed for La0.3Sr0.7TiO3-δ based on the crystal data of the STO perovskite structure by using Atomic Simulation Environment (ASE) package, which provides Python-based modules for building and manipulating atoms, analyzing and visualizations, etc., at the atom level, as shown in Figure 1a. The obtained unit lattice model was extended to have a larger-scale periodic structure of LST crystal (i.e., a LST supercell), as shown in Figure 1b. Then, a spherical particle with diameter = 3.5 nm has been obtained from the supercell model. The atoms on the surface of the particle are deleted to keep the system electrically neutral and to generate a certain amount of oxygen vacancies. The processed single LST nanoparticle model contains 1212 atoms (La-56, Sr-170, Ti-299, O-836), as shown in Figure 1c.
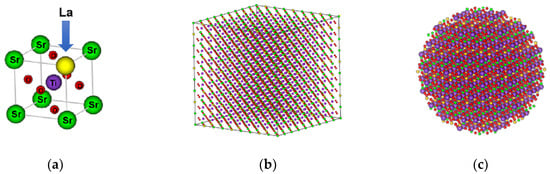
Figure 1.
Schematic diagram showing establishment of single LST nanoparticle. (a) Unit lattice model; (b) supercell model; (c) single nanoparticle model.
Two of the above-mentioned LST nanoparticles are placed in a simulation box, with the initial distance between them set to 12.5 Å to meet the potential cutoff distance, for the objective to better observe the approaching process of these nanoparticles. The Ewald summation method is employed to calculate the long-range Coulomb potential in LAMMPS, which is applicable to the simulation only with periodic boundary conditions (PBC). It is worth to mention that the PBC is applied in all directions in this study, which will cause mirror effect, i.e., the nanoparticles will rotate or move unnecessarily due to the existence of mirror particles, which obviously causes trouble to the modeling and predicted results. In order to eliminate this mirror effect, a vacuum layer of 40 Å was set up in each of all directions of the box, as shown in Figure 2.
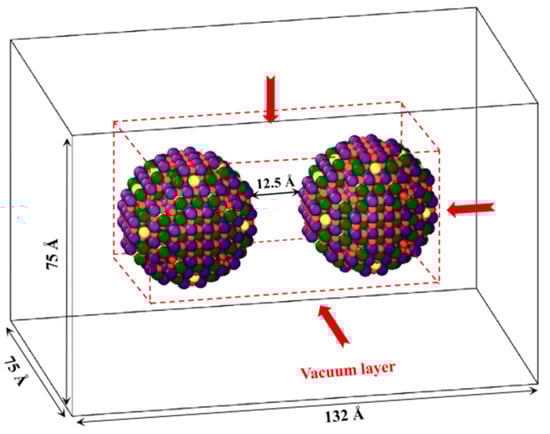
Figure 2.
Initial structure of two LST nanoparticles sintering process to be modeled.
The sintering process simulations have been carried out in the regular ensemble (NVT) method used in LAMMPS. The Verlet algorithm is performed to integrate the Newton motion equations with time, and the timestep is set as 1 fs. In order to avoid large electric dipoles due to the atom deletion, single nanoparticles were annealed, and the energy was minimized and equilibrated for 5000 timesteps at 300 K before conducting the sintering process simulation. It is found that the mean square displacement (MSD) value of the system does not change after 4 ps relaxation time, indicating that the initial configuration is reasonable. Then the sintering process simulation is performed at 1673 K for a total time of 500 ps by MD.
2.3. Modeling Method for LST-GDC Multi-Nanoparticles and Co-Sintering Process
The above-mentioned modeling method for the sintering process of the LST nanoparticles is further developed and applied to the SOFC sintered anode involving two different types of the materials, i.e., the electron-conducting material (e.g., LST) and the ion-conducting one. In this part, GdxCe1-xO2-δ is selected as the ion-conducting electrolyte material, which is modeled using the same method as the one for the LST particles. GDC lattice model was obtained by replacing Ce ions with Gd ions, and the Gd doping ratio x was selected to be 0.2. A single GDC nanoparticle after the electrical neutralization with a diameter of 3.5 nm contains 1319 atoms (i.e., Gd-82, Ce-359, O-890).
Ten GDC and ten LST nanoparticles were replicated and randomly distributed in a simulation box. The size of the initial box is continuously adjusted to 245 Å × 130 Å × 100 Å, which is longer in the x direction than that in y and z directions to better observe the electrode morphology evolution. More details of the specific adjustment will be discussed in Section 2.4. Similar to the one employed in the two LST nanoparticle model, the periodic boundary condition was also imposed in the co-sintering simulations. It is worth it to note that different atoms in LST and GDC nanoparticles are rendered in different colors for easy viewing, as shown in Figure 3a.
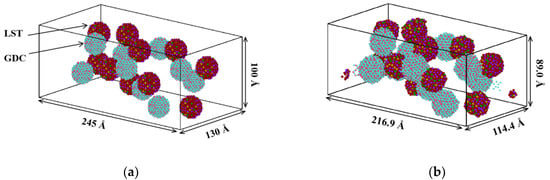
Figure 3.
Methodology for the LST-gadolinium-doped ceria (GDC) multi-nanoparticles co-sintering process. (a) Initial stage of nanoparticles randomly packed; (b) final stage of the sintered particles (LST particles are represented by red color and GDC particles by blue color).
All above-mentioned simulations were performed in the LAMMPS package. The equations of motion were integrated using the velocity Verlet algorithm with timesteps of 1 fs. The isobaric-isothermal (NPT) ensemble was employed by the Nose–Hoover thermostat and the Berendsen barostat. Before performing the sintering simulation, the equilibrated multi-nanoparticles model was stabilized for 50 ps at 300 K and 1 bar in the NPT ensemble. It is found that the total mean square displacement (MSD) of the system no longer changes at the time of 36 ps, which indicates that the structure has been fully equilibrated, and the size of the simulation box is reduced to 216.9 Å × 114.4 Å × 89.0 Å, as shown in Figure 3b.
2.4. Modeling Conditions and Validation
For validating the sintered LST nanoparticles predicted, the experimental preparation method of LST powder is employed. The La doping ratio was selected as 0.3 in the LST model, which was also employed by Park et al. [29], in which the authors pointed out that the nanostructure of La0.3Sr0.7TiO3-δ has the best thermoelectric performance and high thermal stability at the SOFC operating temperature. Generally, in order to achieve a suitable porous structure and a required density of the SOFC electrode, the sintering temperature should be higher than 1000 °C [30]. Here, using strontium nitrate, lanthanum nitrate, tetrabutyl titanate, etc., as raw materials, La0.3Sr0.7TiO3-δ powder synthesized by ourselves via sol-gel method after sintering at 1400 °C for 5 h. The X-ray diffraction (XRD) patterns and the high-resolution transmission electron microscopy (HRTEM) image of LST powder are shown in Figure 4.
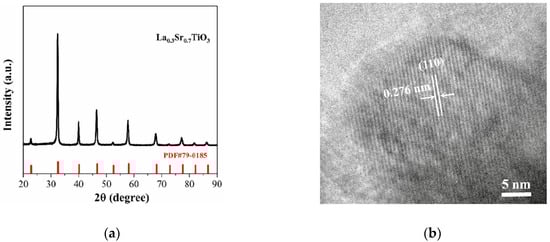
Figure 4.
(a) X-ray diffraction pattern (b) high-resolution transmission electron microscopy (HRTEM) image of La0.3Sr0.7TiO3-δ powder.
Figure 4a indicates that about 30% of the A-site Sr ions in the lattices structure of SrTiO3 are replaced by La ions, which is consistent with the unit lattice model operation of La-substituted. The lattice fringes of 0.276 nm shown in the HRTEM image (Figure 4b) correspond to typical (110) facets of cubic perovskite SrTiO3. To achieve the same crystal structure, our supercell model is expanded by multiple unit lattices, which can be ensured that the spherical LST nanoparticles cut from the supercell have the same perovskite lattice structure with the synthesized powders. Regarding choice of the nanoparticle size, a number of studies have revealed that the 3–4 nm diameter nanoparticles can well study the sintering process behavior of two nanoparticles for, e.g., nickels [31], coppers [32], golds [33], silicons, or titanium oxides [34,35]. Considering the balance of computation load and the sintering effect, it is very reasonable to select nanoparticle diameters of 3.5 and 4 nm for the sintering process modeling in this work.
The LST materials cannot be directly applied as SOFC anodes because it has a poor ionic conduction [36] and electrocatalytic activity [37]. Adding the GDC phase, which has a good O2- ionic conduction, into the LST phase to form composite anodes is a well-known and effective method [4,38]. GDC was thus selected as the ion-conducting or electrolyte material in our multi-nanoparticles model.
Experimentally, LST-GDC is synthesized by a solid-phase reaction method. It is worth noting that GDC powder with Gd doping ratio of 0.2 is selected to co-sintering with the previously prepared LST powder. This ratio is found to be the optimum value of the GDC impregnation phases [39]. The powders of the same quantity as GDC and LST were weighed, with the proportion (i.e., LST: GDC = 1:1) derived from the experimental exploration by Fan et al. [40]. It is found that with increasing amount of infiltrated GDC, the polarization resistance (Rp) value of the LST-GDC composite anodes gradually decreases. While the activation energy (Ea) decreases from 1.07 eV for LST-GDC (1:0.52) to 0.98 eV for LST-GDC (1:1.22). These results clearly indicate that doping amount of GDC remarkably enhances the catalytic activity of LST-GDC composite electrodes. The density of the processed powder was about 2.367 g/cm3, which is basically consistent with the equilibrated density of modeling (2.38 g/cm3). After 5 h of the solid state sintering at 1400 °C, the temperature was lowered to the room temperature with the furnace to synthesis the LST-GDC composite powder.
Figure 5 shows the HRTEM image of the sintered composite powder of LST-GDC. The lattice fringes of 0.276 nm and 0.270 nm correspond to typical (110) and (210) facets of LST and GDC, respectively. The obvious dividing boundary between the two materials indicates that the sintering process of composite powder at the temperature of 1400 °C has been performed well. This phenomena observed in the experiment verifies the setting of the parameters in the established LST-GDC multi-nanoparticles model, including the selection of the ratio of LST to GDC (10:10) and the setting of the simulated temperature (1673 K).
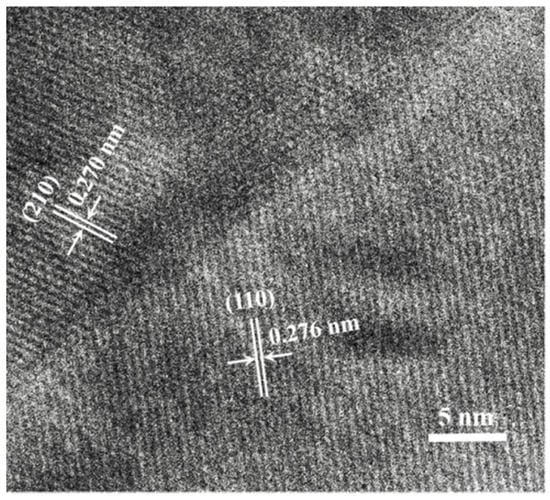
Figure 5.
HRTEM image of LST-GDC (1:1) powder.
3. Result and Discussion
3.1. Simulation Process of Two LST Nanoparticles
Four typical stages of the sintering process are shown in Figure 6. Initially, the two LST nanoparticles approach each other and slightly rotate to adjust their lattice planes, which has also been observed in the modeled gold nanoparticles [33] and experimentally [41]. This phenomenon might be an indication of an oriented attachment mechanism for the LST particles. Under the action of the electron cloud and Van der Waals force, the two nanoparticles approach slowly, and their centroid distance reaches about 3.5 nm at 24 ps. At the same time, the sintering process begins from the initial stage (24–50 ps), and the two contacting nanoparticles rapidly formed the sintering neck, i.e., the centroid distance decreases rapidly. Then, for a next stage (50–300 ps), the width of the sintered neck grows slowly, while the breach between the two particles is gradually filled to widen the sintered neck. Meanwhile, the centroid distance is linearly decreasing. After the time of 300 ps, the width of the sintered neck does not change, and the whole system is stable, which indicates that the sintering process reaches the final stage.
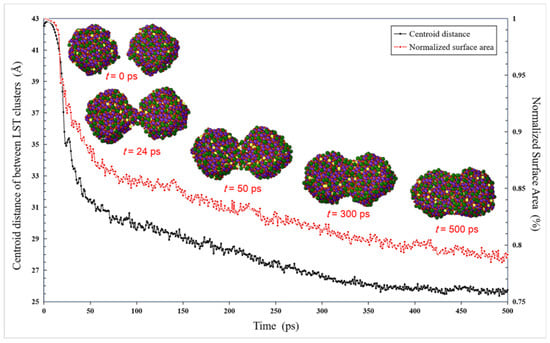
Figure 6.
Evolution of the LST nanoparticles with 3.5 nm diameter, together with centroid distance between nanoparticles and Normalized surface area along with the sintering time.
Figure 6 also presents the evolution of the normalized surface area of the two nanoparticles at 1673 K. First, the normalized surface area remains essentially constant due to the slow approaching movement before the time of 24 ps, then it decreases rapidly by about 12% duo to the sintering process at the time of 50 ps. From the time of 50 ps, the sintering process is slow, and the normalized surface area decreases by about 7% at the time of 300 ps. After the time stage of 300 ps, the system tends to be stabilized and the trend of its curve gradually becomes flat.
The atoms located at different internal positions (e.g., surface layer, intermediate layer and interior layer) of one LST nanoparticle may have different migration mechanisms, which show different characteristics in the sintering process. In order to analyze the microscopic mechanism of the single LST nanoparticle sintering process, with a 1/3 radius as the interval, each single nanoparticle is divided by three regions (i.e., a surface layer, an intermediate layer and an interior layer), as shown in Figure 7. The diffusion in the single LST nanoparticle was quantified and evaluated by MSD during the sintering process. The MSD can be mathematically described as follows [42]:
where r2(t) is the total MSD value of the atoms in the divided area, N is the total number of diffused atoms in the divided area, and t is the time of the simulation.
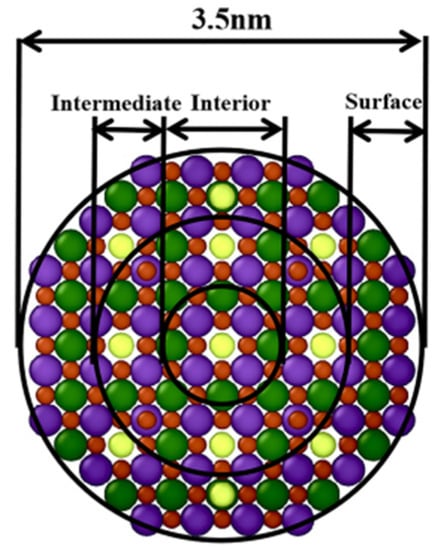
Figure 7.
Different layers inside a LST nanoparticle.
The MSD predicted for the atoms in different layers of a single nanoparticle are pretended in Figure 8. Before the two nanoparticles contact (0–24 ps), the value of MSD shows a J-shaped growth because the atoms move away from the initial positions and accelerate to approach each other for a contact. Furthermore, there is a mutation at the time of 24 ps due to the existence of the speed of movement. At the time stage of 24–50 ps, MSD experiences an increase, which is consistent with that shown in Figure 6, due to the rapid diffusion of two contacting nanoparticles to establish a sintered neck. In addition, the MSD of each atomic species located in the surface layer at this stage is calculated, and the diffusion rate of Sr ions (1.33 Å2/ps) and O ions (1.28 Å2/ps) is obtained by a linear fitting method. These diffusion rates are larger than that of the Ti ions (0.84 Å2/ps) and La ions (0.82 Å2/ps), which reveals that the width of the sintered neck is increased mostly by Sr ions and O ions.
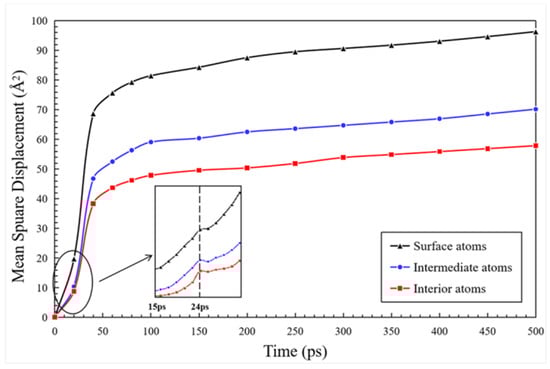
Figure 8.
Mean square displacement (MSD) predicted for atoms located in different layers of a single nanoparticle.
It can be seen, in Figure 8, that the MSD of the surface atoms is bigger than that of the intermediate and interior atoms, indicating that the diffusion speed of the surface atoms is the biggest, which is consistent with the sintering simulation of Ni/YSZ calculated by Xu et al. [43]. With the thermodynamic diffusion of the surface atoms, the intermediate and interior atoms of the LST nanoparticles tend to rearrange and migrate to outward, which may increase the MSD of these two layers of the atoms before 50 ps. However, in the next stage (50–100 ps), the interior atoms generally show no relative diffusion after moving to the neck region. At this time, the interior atoms behave like the solid state, while the surface atoms remain in the liquid state. This can explain why the MSD of the internal atoms tends to gradually increases during the slow sintering process after the time of 50 ps, while the MSD of the intermediate atoms and the surface atoms still shows a slight increase.
The characteristic of the sintering process at 1873 K is further studied in terms of the influence of the sintering temperature. The comparison of the sintered structure evolution is shown in Figure 9 for both the temperature of 1873 K and 1673 K. Compared with the sintering process at 1673 K, the coalescence of the particles also occurs starting from the time of 24 ps at 1873 K, i.e., the nanoparticles’ approaching process is not affected by the sintering temperature before the contacting neck is formed, which is caused by the driving force of the Van der Waals force and the Coulombic interaction. However, the width of the neck at the low temperature (1673 K) is smaller than that predicted at the high temperature (1873 K) at the same time stage, which indicates that a high sintering temperature can accelerate the formation of the sintered neck, and ultimately leads to a larger width of the sintered neck.
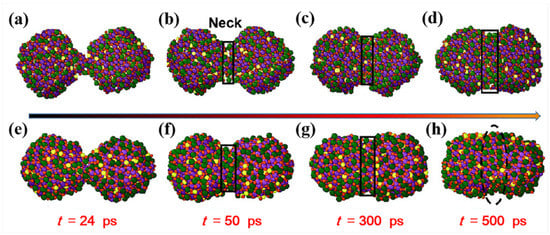
Figure 9.
Cross-sectional snapshots of the sintered structure of the LST particles at 1673 K (a–d) and 1873 K (e–h).
In order to evaluate the order/disorder of the sintered structure and characterize the sintering degree, the radial distribution function (RDF) of the sintered structure is further studied for different sintering temperature at 1673 K and 1873 K, as shown in Figure 10. The g(r) is predicted for 1673 K (red lines) and 1873 K (black lines), respectively, at 500 ps. The first peak of the g(r) (i.e., the peak of the nearest neighbor atoms) is broader for 1873 K, which indicates that the crystallinity is lower and the degree of sintering is higher at a higher sintering temperature.
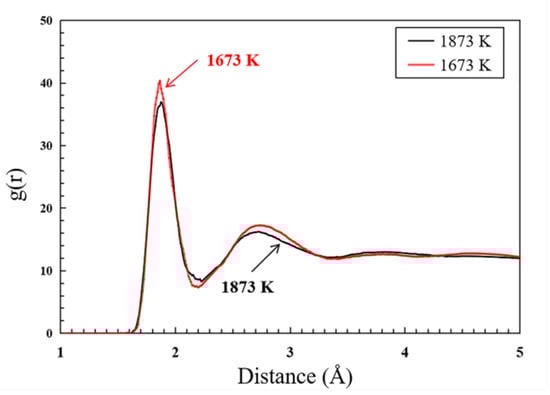
Figure 10.
Radial distribution function (RDF) of the LST nanoparticle at 1673 K and 1873 K.
Moreover, the influence of the initial nanoparticle size is analyzed for the sintered structure of the two LST nanoparticles. The evolution of the different nanoparticle sizes with the diameters of 3.5 nm and 4nm is shown in Figure 11. It is obvious that the particles with a large diameter contact later, but they will form the same structural morphology after a long enough sintering time. It can be concluded that the increase in the size of the nanoparticle slows the sintering process, whereas the sintering mechanism is not changed. This is consistent with that found in the previous studies [31,44].
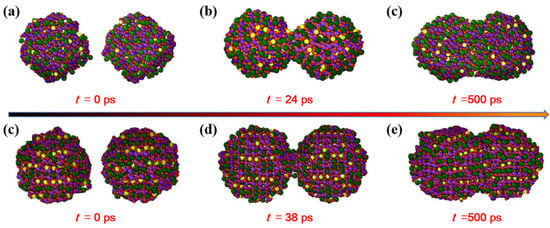
Figure 11.
Evolution of the nanoparticles with diameter of (a–c) 3.5 nm and (d–f) 4 nm at 1673 K.
3.2. Simulation of Co-Sintering LST-GDC Multi-Nanoparticles
An initial structure is stabilized at 300 K, as shown in Figure 12a. The box size after the relaxation is compressed to 216.9 × 114.4 × 89.0 Å, and the LST and GDC nanoparticles were randomly distributed in the box. Using this relaxed structure, the co-sintering process was performed at 1673 K. The structure of multi-nanoparticles after the co-sintering for 500 ps is shown in Figure 12b. It is found that most of the particles are deformed and sintered together in 500 ps, and the dimensions of the simulation box is further reduced under the sintering conditions due to the growth of the sintered neck between the nanoparticles. As highlighted by the black-circle areas shown in Figure 12b, the interface regions between different nanoparticles representing electronic conductors (LST) and ionic conductors (GDC) increase, and the junction formed between this interface and the gas phase is the so-called three-phase boundary (TPB). The volume of the simulation box is reduced by 67% at 500 ps, due to the shrinkage in the sintering condition with the density of 3.92 g/cm3. When the sintered structure is annealed and equilibrated for 500 ps at 300 K in NPT canonical ensemble, the density increases up to 4.16 g/cm3, which agrees with our experimental data (i.e., 4.05–4.21 g/cm3), obtained for the LST-GDC powders synthesized at 300 K.
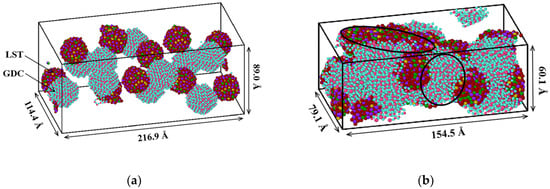
Figure 12.
Evolution of co-sintered multi-nanoparticles for (a) initial state, and (b) coalescence at 500 ps.
The detailed structures of the co-sintered LST-GDC multi-nanoparticles are further presented and examined by the cross-sectional snapshots obtained at different time points during the sintering process. The cross-sectional snapshots along the X direction is thus cleaved to observe the microstructure inside. Figure 13a–c shows the cross-section morphology of the LST-GDC multi-nanoparticles simulated at 0, 36, and 500 ps, respectively. To identify the sintering of atoms in the simulated box boundary, the area shown in the snapshot has been expanded in the Y and Z directions based on periodic boundary conditions. It is shown that the distance between the nanoparticles is gradually decreasing with the increase of the sintering time. In the contrast, LST nanoparticles move faster than GDC nanoparticles. At the time of 36 ps, the two LST nanoparticles come into contact and form the sintered neck. The sintering process of LST particles is becoming slower after the necks are stable, as shown in Figure 13b,c. On the other hand, the aggregations of GDC nanoparticles are relatively slower, and the final structure after the sintering time of 500 ps indicates that the LST and GDC nanoparticles are obviously gathered to form electronic/ionic conductors, respectively. Meanwhile, the pores with the continuous channels are formed, which can be observed from Figure 13.
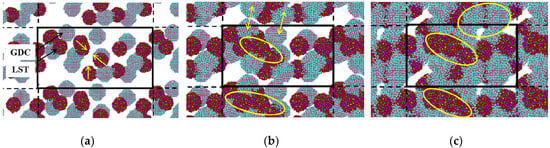
Figure 13.
Cross-sectional snapshots of co-sintered LST-GDC multi-nanoparticles at 1673 K for: (a) t = 0 ps, (b) t = 36 ps and (c) t = 500 ps.
Considering that LST and GDC have different atom migration mechanisms, the MSD values of the two different kinds of the nanoparticles is further evaluated by measuring MSD during the sintering simulation, as shown in Figure 14. Before the formation of the sintered neck, the MSD of the nanoparticles increased rapidly from the time stage of 0 to 36 ps, which is highly related to the thermal diffusion. During the time between 36 ps to 100 ps, the MSD of the atoms in the LST and GDC nanoparticles gradually tends to be stable, indicating that the diffusion of the atoms in the LST nanoparticles is close to be dynamic equilibrium after the simulation time of 100 ps. In addition, it is found that the MSD of the atoms in the LST nanoparticles is higher than that of the atoms in the GDC nanoparticles, indicating that the diffusion of the atoms in the LST nanoparticles is stronger than that in the LST nanoparticles, which may dominate a rebuilding of LST-GDC composite structure in the sintering conditions. In other words, its diffusion process controls the sintered nanoparticles.
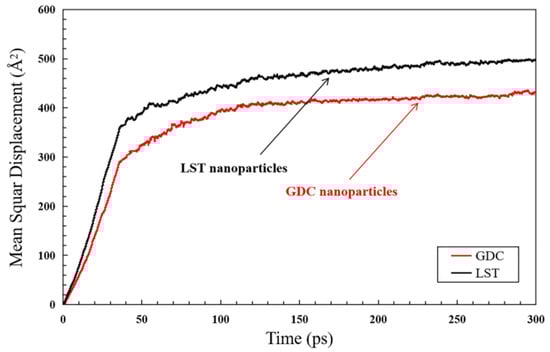
Figure 14.
Mean square displacement (MSD) for the atoms in the LST and GDC nanoparticles.
It is a fact that MSD and TPB length (LTPB) affected by the sintering conditions are highly correlated with surface catalytic reactions and charge exchange reactions. For evaluating the TPB length changes in the sintering process, the LTPB is calculated by using the Meyer method [45], as shown in Figure 15. The entire simulation domain is divided into several cubic grids with a length of 0.2 Å in three-dimensional space. The grids belonging to both the LST and GDC nanoparticles simultaneously are defined as the overlapping grids (green grids in Figure 15), and the surface grids of LST nanoparticles (red grids) in direct contact with the surface grids of GDC nanoparticles (black grids) are defined as the contact grids. The overlapping and contact grids being contacted with the pore phase grids are then determined as the TPB grids.
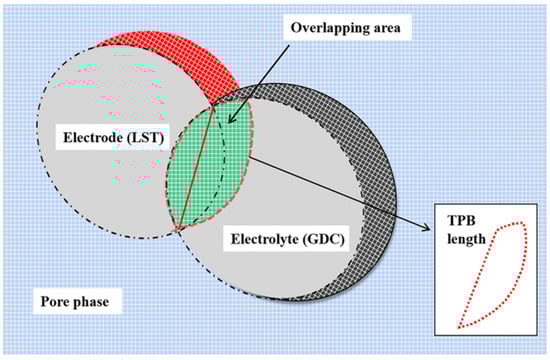
Figure 15.
Simple theoretical schematic diagram of Meyer method for three-phase boundary (TPB) length calculation.
In Figure 16, it is found that the TPB length increases rapidly during the initial stage of the sintering process. For instance, the TPB length increases to 5783.1 Å/Å3 at the time stage of 50 ps, which is about 93.6% of the maximum TPB length (i.e., 6172.3 Å/Å3 at the time of 53 ps). It is so because, along the LST-GDC co-sintering process, the distance between LST and GDC nanoparticles is reduced, and the contact surface is formed, as discussed in Figure 13. During the time of 53 to 300 ps, the TPB length is slightly down due to the increase of the density and the decrease of the pore volume in the sintering process. After the time of 300 ps, LTPB is stable.
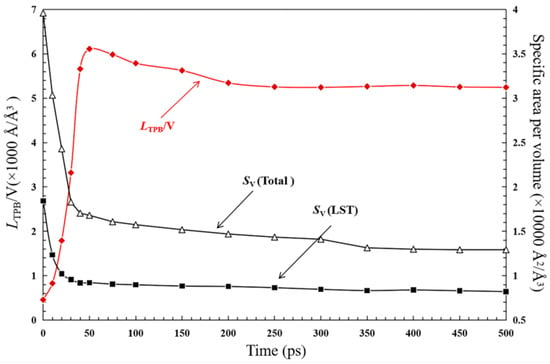
Figure 16.
Time evolution of TPB length per volume (LTPB/V) and Specific area per volume.
Furthermore, the surface area of the particles per volume (SV) is also evaluated and presented. In contrast with the TPB length, the surface area of the nanoparticles decreases rapidly within the initial stage since the nanoparticles are attracted and sintered together rapidly, leading to the rapid reduction of the surface area for each single nanoparticle. The specific surface area of LST (Sv(LST)) is larger than that of GDC. For instance, the Sv(LST) equals to 12,926.53 Å2/Å3, which is about 63.4% of the total particle surface area, Sv(total), at the time of 500 ps. As the main carrier for the hydrogen fuel adsorption and dissociation, the larger effective surface area of the LST nanoparticles leads to more hydrogen adsorption sites, which is beneficial to H2 adsorption/desorption reactions occurring on the surface of the LST catalyst particles. Overall, it is beneficial to increase TPB with the sintering time. At the same time, a significant decrease in Sv may affect the surface catalytic reactions. There seems to be a contradictory relationship between these two parameters. In a fact, further grinding the particles during the experimental synthesis process can increase both the TPB length and effective surface area, thereby reducing the negative impact of the sintering process.
Two thermal properties are also evaluated and presented in this part, partially for a purpose to verify the accuracy of the code developed. One of these is the volume heat capacity (VHC), which is an important parameter in the design and operation of SOFCs. In this study, VHC is defined as the ability of a substance of a given volume to store internal energy while undergoing a given temperature change without undergoing a phase transition, as described below [46]:
where CV is VHC (J cm−3 K−1); E is the internal energy (J); T is temperature (K); V is volume (cm3). The predicted VHC of the sintered structure is presented in Figure 17 for a temperature range from 500 °C to 1000 °C.
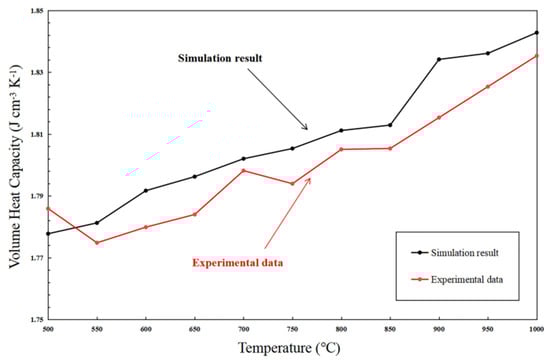
Figure 17.
Volume heat capacity predicted for the co-sintered structure at different temperature.
It is clearly noticed that the VHC is increased due to the particle densification with the increased sintering temperature. The predicted VHC is also compared with the experimental data of the sintered LST-GDC powder synthesized at 1673 K by ourselves, as shown in Figure 17. The gap between MD simulation results and our experimental data is observed, which can be explained by the small-scale simulation box effect [47]. Nevertheless, the error is within a small range (~0.02 J cm−3 K−1).
Thermal conductivity (κ) is also an important parameter for evaluating SOFC electrode performance. It is obtained by using the equilibrium molecular dynamics (EMD) simulation based on Green-Kubo (GK) [48] method. In the GK method, the thermal conductivity is related to the heat current auto-correlation function (HCACF) via the GK formula [27]:
where κ is thermal conductivity, V is volume of the studied case, kB is Boltzmann constant, J is heat flux auto-correlation function, and t is time correlation. The HCACF can be obtained from the equilibrium MD simulations, in which the heat flux is evaluated as follows:
where Ei and vi denote the energy and velocity of the atom i, respectively, and the per-atom viral stress Si is expressed as the outer product of relative position (rij = rj − ri) and derivative of the potential energy of the neighboring atoms with respect to the relative position.
Figure 18 shows the thermal conductivity of the co-sintered LST-GDC particles at 1673 K, and the inset is a plot for the representative normalized HCACF. It is observed that a correlation time of 100 ps is sufficient to achieve a converged value of the multi-nanoparticles model. The thermal conductivity of the co-sintered LST-GDC particles is predicted to have a value of 5.83 W m−1 K−1 at the sintered temperature of 1673 K, with a time correlation of 100 ps. Compared with the results of previous work (5–8 W m−1 K−1) [49,50], the evaluated thermal conductivity value from this study is well within the range.
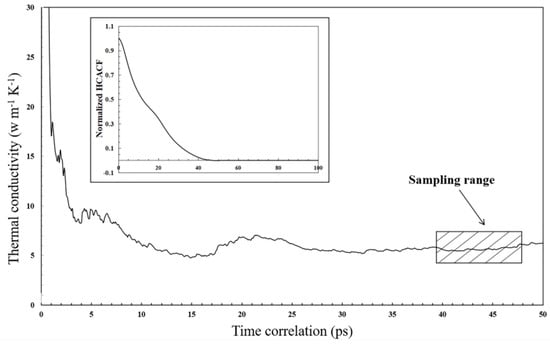
Figure 18.
Thermal conductivity predicted for the co-sintered structure at 1673 K. The inset shows a representative normalized heat current auto-correlation function (HCACF).
4. Conclusions
In this work, an MD simulation method is developed for evaluating and understanding the sintering of the LST and the co-sintering of the LST-GDC composite materials. The modeling hypothesis and conditions applied are validated by comparing the predicted structural and thermal properties with the experimental data or the findings presented in the literature. The simulation results reveal that the surface diffusion is the dominant sintering mechanism in the sintered LST nanoparticles, and the migration of Sr ions and O ions is the main driving factor for the growth of the sintering neck width. It is also found that the approaching process of the nanoparticles is not affected by the sintering temperature—the increase in the particle size will not change the sintering mechanism. For the co-sintered LST-GDC composite anode materials, the MSD of the atoms in the LST nanoparticles is higher than that in the GDC nanoparticles, indicating that the diffusion of the atoms in the LST nanoparticles is stronger than that in the GDC nanoparticles. The TPB length increases to 93.6% of its maximum value at 50 ps, i.e., the initial sintering process is an important stage for the formation of TPB in the sintering process. LST nanoparticles provide a larger specific surface area than GDC, which is beneficial to improve the H2 adsorption/desorption reactions occurring on the surfaces of the LST catalyst particles. This MD simulation method may be served as a useful research tool for optimizing of the sintering process connected to SOFC electrode development.
Author Contributions
Conceptualization and methodology, C.L., and C.Y.; data curation, X.L.; experimental design and analysis of results, P.L. and X.W.; editing and supervision, J.W. and J.Y. All authors have read and agreed to the published version of the manuscript.
Funding
This research was funded by National Key R&D Program of China (2018YFB1502204), Ningbo Innovation team grant (Ningbo [2017]74), Ningbo major special projects of the Plan “Science and Technology Innovation 2025” (2019B10043).
Conflicts of Interest
The authors declare no conflict of interest.
References
- Wiranarongkorn, K.; Arpornwichanop, A. Analysis of the Ca-looping sorption-enhanced steam reforming and solid oxide fuel cell integrated process using bio-oil. Energy Convers. Manag. 2017, 134, 156–166. [Google Scholar] [CrossRef]
- Yan, Z.; He, A.; Hara, S.; Shikazono, N. Modeling of solid oxide fuel cell (SOFC) electrodes from fabrication to operation: Correlations between microstructures and electrochemical performances. Energy Convers. Manag. 2019, 190, 1–13. [Google Scholar] [CrossRef]
- Shen, X.; Sasaki, K. Highly redox-resistant solid oxide fuel cell anode materials based on La-doped SrTiO3 by catalyst impregnation strategy. J. Power Sources 2016, 320, 180–187. [Google Scholar] [CrossRef]
- Zhou, X.; Yan, N.; Chuang, K.T.; Luo, J. Progress in La-doped SrTiO3 (LST)-based anode materials for solid oxide fuel cells. RSC Adv. 2014, 4, 118–131. [Google Scholar] [CrossRef]
- Lee, H.W.; Park, M.; Hong, J.; Kim, H.; Yoon, K.J.; Son, J.; Lee, J.; Kim, B.K. Constrained Sintering in Fabrication of Solid Oxide Fuel Cells. Materials 2016, 9, 675. [Google Scholar] [CrossRef]
- Andersson, M.; Yuan, J.; Sunden, B. Review on modeling development for multiscale chemical reactions coupled transport phenomena in solid oxide fuel cells. Appl. Energy 2010, 87, 1461–1476. [Google Scholar] [CrossRef]
- Ryan, E.M.; Mukherjee, P.P. Mesoscale modeling in electrochemical devices-A critical perspective. Prog. Energy Combust. Sci. 2019, 71, 118–142. [Google Scholar] [CrossRef]
- Lichtner, A.; Roussel, D.; Rohrens, D.; Jauffres, D.; Villanova, J.; Martin, C.L.; Bordia, R.K. Anisotropic sintering behavior of freeze-cast ceramics by optical dilatometry and discrete-element simulations. Acta Mater. 2018, 155, 343–349. [Google Scholar] [CrossRef]
- Martin, C.L.; Yan, Z.; Jauffres, D.; Bouvard, D.; Bordia, R.K. Sintered ceramics with controlled microstructures: Numerical investigations with the Discrete Element Method. J. Ceram. Soc. Jpn. 2016, 124, 340–345. [Google Scholar] [CrossRef]
- Yan, Z.; Kim, Y.; Hara, S.; Shikazono, N. Prediction of La0.6Sr0.4Co0.2Fe0.8O3 cathode microstructures during sintering: Kinetic Monte Carlo (KMC) simulations calibrated by artificial neural networks. J. Power Sources 2017, 346, 103–112. [Google Scholar] [CrossRef]
- Yan, Z.; Hara, S.; Shikazono, N. Effect of powder morphology on the microstructural characteristics of La0.6Sr0.4Co0.2Fe0.8O3 cathode: A Kinetic Monte Carlo investigation. Int. J. Hydrogen Energy 2017, 42, 12601–12614. [Google Scholar] [CrossRef]
- Cai, Q.; Adjiman, C.S.; Brandon, N.P. Modelling the 3D microstructure and performance of solid oxide fuel cell electrodes: Computational parameters. Electrochim. Acta 2011, 56, 5804–5814. [Google Scholar] [CrossRef]
- Alder, B.J.; Wainwright, T.E. Studies in molecular dynamics. I. General method. J. Chem. Phys. 1959, 31, 459–466. [Google Scholar] [CrossRef]
- David, P.; Alexander, C.; Kilner, J.A.; Grimes, R.W. Molecular dynamics study of oxygen diffusion in Pr2NiO4+δ. Phys. Chem. Chem. Phys. 2010, 12, 6834–6836. [Google Scholar]
- Hermet, J.; Dupé, B.; Dezanneau, G. Simulations of REBaCo2O5.5 (REGd, La, Y) cathode materials through energy minimisation and molecular dynamics. Solid State Ion. 2012, 216, 50–53. [Google Scholar] [CrossRef]
- Lu, H.; Dong, H.; Iqabl, T.; Zhang, X.; Li, G.; Zhang, D. Molecular dynamics simulations of the coke formation progress on the nickel-based anode of solid oxide fuel cells. Int. Commun. Heat Mass Transf. 2018, 91, 40–47. [Google Scholar] [CrossRef]
- Finke, R.G.; Watzky, M.A.; Whitehead, C.B. Response to “Particle Size Is a Primary Determinant for Sigmoidal Kinetics of Nanoparticle Formation: A “Disproof” of the Finke–Watzky (F-W) Nanoparticle Nucleation and Growth Mechanism”. Chem. Mater. 2020, 32, 3657–3672. [Google Scholar] [CrossRef]
- Fan, L.; Wang, Y.; Huo, H.; Xiong, Y. Performance of LST-GDC Composite Anodes for Solid Oxide Fuel Cells. ECS Trans. 2013, 57, 1193–1199. [Google Scholar] [CrossRef]
- Sindirac, C.; Cakirlar, S.; Buyukaksoy, A.; Akkurt, S. Lowering the sintering temperature of solid oxide fuel cell electrolytes by infiltration. J. Eur. Ceram. Soc. 2019, 39, 409–417. [Google Scholar] [CrossRef]
- Lee, M.-J.; Shin, J.-H.; Ji, M.-J.; Hwang, H.-J. Fabrication and electrochemical performance of nickel- and gadolinium-doped ceria-infiltrated La0·2Sr0·8TiO3 anodes for solid oxide fuel cells. J. Power Sources 2018, 374, 181–187. [Google Scholar] [CrossRef]
- Verlet, L. Computer “Experiments” on Classical Fluids. I. Thermodynamical Properties of Lennard-Jones Molecules. Phys. Rev. 1967, 159, 98–103. [Google Scholar] [CrossRef]
- Wigner, E.P. On the Quantum Correction for Thermodynamic Equilibrium. Phys. Rev. 1932, 40, 749–759. [Google Scholar] [CrossRef]
- Plimpton, S. Fast parallel algorithms for short-range molecular dynamics. J. Comput. Phys. 1995, 117, 1–19. [Google Scholar] [CrossRef]
- Lewis, G.V.; Catlow, C.R.A. Potential models for ionic oxides. J. Phys. C Solid State Phys. 1985, 18, 1149–1161. [Google Scholar] [CrossRef]
- Thomas, B.S.; Marks, N.A.; Begg, B.D. Developing pair potentials for simulating radiation damage in complex oxides. Nucl. Instrum. Methods Phys. Res. Sect. B Beam Interact. Mater. At. 2005, 228, 288–292. [Google Scholar] [CrossRef]
- Inaba, H.; Sagawa, R.; Hayashi, H.; Kawamura, K. Molecular dynamics simulation of gadolinia-doped ceria. Solid State Ion. Diffus. React. 1999, 122, 95–103. [Google Scholar] [CrossRef]
- Rittiruam, M.; Seetawan, T.; Yokhasing, S.; Matarat, K.; Thang, P.B.; Kumar, M.; Han, J.G. La/Sm/Er Cation Doping Induced Thermal Properties of SrTiO3 Perovskite. Inorg. Chem. 2016, 55, 8822–8826. [Google Scholar] [CrossRef]
- Cui, Z.; Sun, Y.; Qu, J. Molecular dynamics simulation of reduced CeO2. Solid State Ion. 2012, 226, 24–29. [Google Scholar] [CrossRef]
- Park, K.; Son, J.S.; Woo, S.I.; Shin, K.; Oh, M.-W.; Park, S.-D.; Hyeon, T. Colloidal synthesis and thermoelectric properties of La-doped SrTiO 3 nanoparticles. J. Mater. Chem. A 2014, 2, 4217–4224. [Google Scholar] [CrossRef]
- Taub, S.; Williams, R.E.A.; Wang, X.; McComb, D.W.; Kilner, J.A.; Atkinson, A. The effects of transition metal oxide doping on the sintering of cerium gadolinium oxide. Acta Mater. 2014, 81, 128–140. [Google Scholar] [CrossRef]
- Song, P.; Wen, D. Molecular dynamics simulation of the sintering of metallic nanoparticles. J. Nanopart. Res. 2010, 12, 823–829. [Google Scholar] [CrossRef]
- Zhu, H. Sintering processes of two nanoparticles: A study by molecular-dynamics simulations. Philos. Mag. Lett. 1996, 73, 27–33. [Google Scholar] [CrossRef]
- Arcidiacono, S.; Bieri, N.R.; Poulikakos, D.; Grigoropoulos, C.P. On the coalescence of gold nanoparticles. Int. J. Multiph. Flow 2004, 30, 979–994. [Google Scholar] [CrossRef]
- Koparde, V.N.; Cummings, P.T. Molecular Dynamics Simulation of Titanium Dioxide Nanoparticle Sintering. J. Phys. Chem. B 2005, 109, 24280–24287. [Google Scholar] [CrossRef] [PubMed]
- Buesser, B.; Grohn, A.J.; Pratsinis, S.E. Sintering Rate and Mechanism of TiO2 Nanoparticles by Molecular Dynamics. J. Phys. Chem. C 2011, 115, 11030–11035. [Google Scholar] [CrossRef] [PubMed]
- Moos, R.; Schollhammer, S.; Hardtl, K.H. Electron mobility of Sr1-xLaxTiO3 ceramics between 600 °C and 1300 °C. Appl. Phys. A 1997, 65, 291–294. [Google Scholar] [CrossRef]
- Marina, O.A.; Canfield, N.L.; Stevenson, J.W. Thermal, electrical, and electrocatalytical properties of lanthanum-doped strontium titanate. Solid State Ion. 2002, 149, 21–28. [Google Scholar] [CrossRef]
- Fan, L.; Xiong, Y.; Liu, L.; Wang, Y.; Kishimoto, H.; Yamaji, K.; Horita, T. Performance of Gd0.2Ce0.8O1.9 infiltrated La0.2Sr0.8TiO3 nanofiber scaffolds as anodes for solid oxide fuel cells. J. Power Sources 2014, 265, 125–131. [Google Scholar] [CrossRef]
- Hu, Q.; Fan, L.; Wang, Y.; Wang, Z.; Xiong, Y. Nanofiber-based LaxSr1−xTiO3-GdyCe1−yO2−δ composite anode for solid oxide fuel cells. Ceram. Int. 2017, 43, 12145–12153. [Google Scholar] [CrossRef]
- Fan, L.; Xiong, Y.; Wang, Y.; Kishimoto, H.; Yamaji, K.; Horita, T. Performance of Gd0. 2Ce0. 8O1. 9 infiltrated La0. 2Sr0. 8TiO3 nanofiber scaffolds as anodes for solid oxide fuel cells: Redox stability and effects of electrolytes. J. Power Sources 2015, 294, 452–459. [Google Scholar] [CrossRef]
- Iijima, S.; Ajayan, P.M. Substrate and size effects on the coalescence of small particles. J. Appl. Phys. 1991, 70, 5138–5140. [Google Scholar] [CrossRef]
- Shaw, A.; Deb, B.; Kabi, S.; Ghosh, A. Ion dynamics in single and mixed former glasses: Correlation between microscopic lengths and network structure. J. Electroceram. 2015, 34, 20–27. [Google Scholar] [CrossRef]
- Xu, J.; Sakanoi, R.; Higuchi, Y.; Ozawa, N.; Sato, K.; Hashida, T.; Kubo, M. Molecular Dynamics Simulation of Ni Nanoparticles Sintering Process in Ni/YSZ Multi-Nanoparticle System. J. Phys. Chem. C 2013, 117, 9663–9672. [Google Scholar] [CrossRef]
- Raut, J.S.; Bhagat, R.B.; Fichthorn, K.A. Sintering of aluminum nanoparticles: A molecular dynamics study. Nanostructured Mater. 1998, 10, 837–851. [Google Scholar] [CrossRef]
- Meyer, A.Y. Molecular mechanics and molecular shape. V.† on the computation of the bare surface area of molecules. J. Comput. Chem. 1988, 9, 18–24. [Google Scholar] [CrossRef]
- Wang, H.; Porter, W.D.; Bottner, H.; Konig, J.; Chen, L.; Bai, S.; Tritt, T.M.; Mayolet, A.; Senawiratne, J.; Smith, C.M. Transport Properties of Bulk Thermoelectrics: An International Round-Robin Study, Part II: Thermal Diffusivity, Specific Heat, and Thermal Conductivity. J. Electron. Mater. 2013, 42, 1073–1084. [Google Scholar] [CrossRef]
- Xie, H.; Fujii, M.; Zhang, X. Effect of interfacial nanolayer on the effective thermal conductivity of nanoparticle-fluid mixture. Int. J. Heat Mass Transf. 2005, 48, 2926–2932. [Google Scholar] [CrossRef]
- Nichenko, S.; Staicu, D. Molecular Dynamics study of the Mixed Oxide Fuel thermal conductivity. J. Nucl. Mater. 2013, 439, 93–98. [Google Scholar] [CrossRef]
- Tabei, S.A.; Sheidaei, A.; Baniassadi, M.; Pourboghrat, F.; Garmestani, H. Microstructure reconstruction and homogenization of porous Ni-YSZ composites for temperature dependent properties. J. Power Sources 2013, 235, 74–80. [Google Scholar] [CrossRef]
- Singh, S.P.; Kanas, N.; Desissa, T.D.; Johnsson, M.; Einarsrud, M.; Norby, T.; Wiik, K. Thermoelectric properties of A-site deficient La-doped SrTiO3 at 100–900 °C under reducing conditions. J. Eur. Ceram. Soc. 2020, 40, 401–407. [Google Scholar] [CrossRef]


© 2020 by the authors. Licensee MDPI, Basel, Switzerland. This article is an open access article distributed under the terms and conditions of the Creative Commons Attribution (CC BY) license (http://creativecommons.org/licenses/by/4.0/).