Perspectives for Mitigation of CO2 Emission due to Development of Electromobility in Several Countries
Abstract
1. Introduction
2. Materials and Methods
2.1. Development of Motorization in the Analysed Regions
2.2. Analysis of Electromobility Development Dynamics in the European Union, US and Japan
2.3. Energy Sources Mix
2.4. Primary Energy Factor
- is the quantity of electricity produced from the given source in the year r in the country,
- is the total quantity of electricity produced in the year in the country,
- is the efficiency of primary energy conversion into electricity for the respective fuel.
2.5. Environmental Effect and Emission Reductions (Tank-To-Wheel)
2.6. Environmental Effect and Emission Reductions—Adjusted Values (Well-To-Wheel)
3. Results
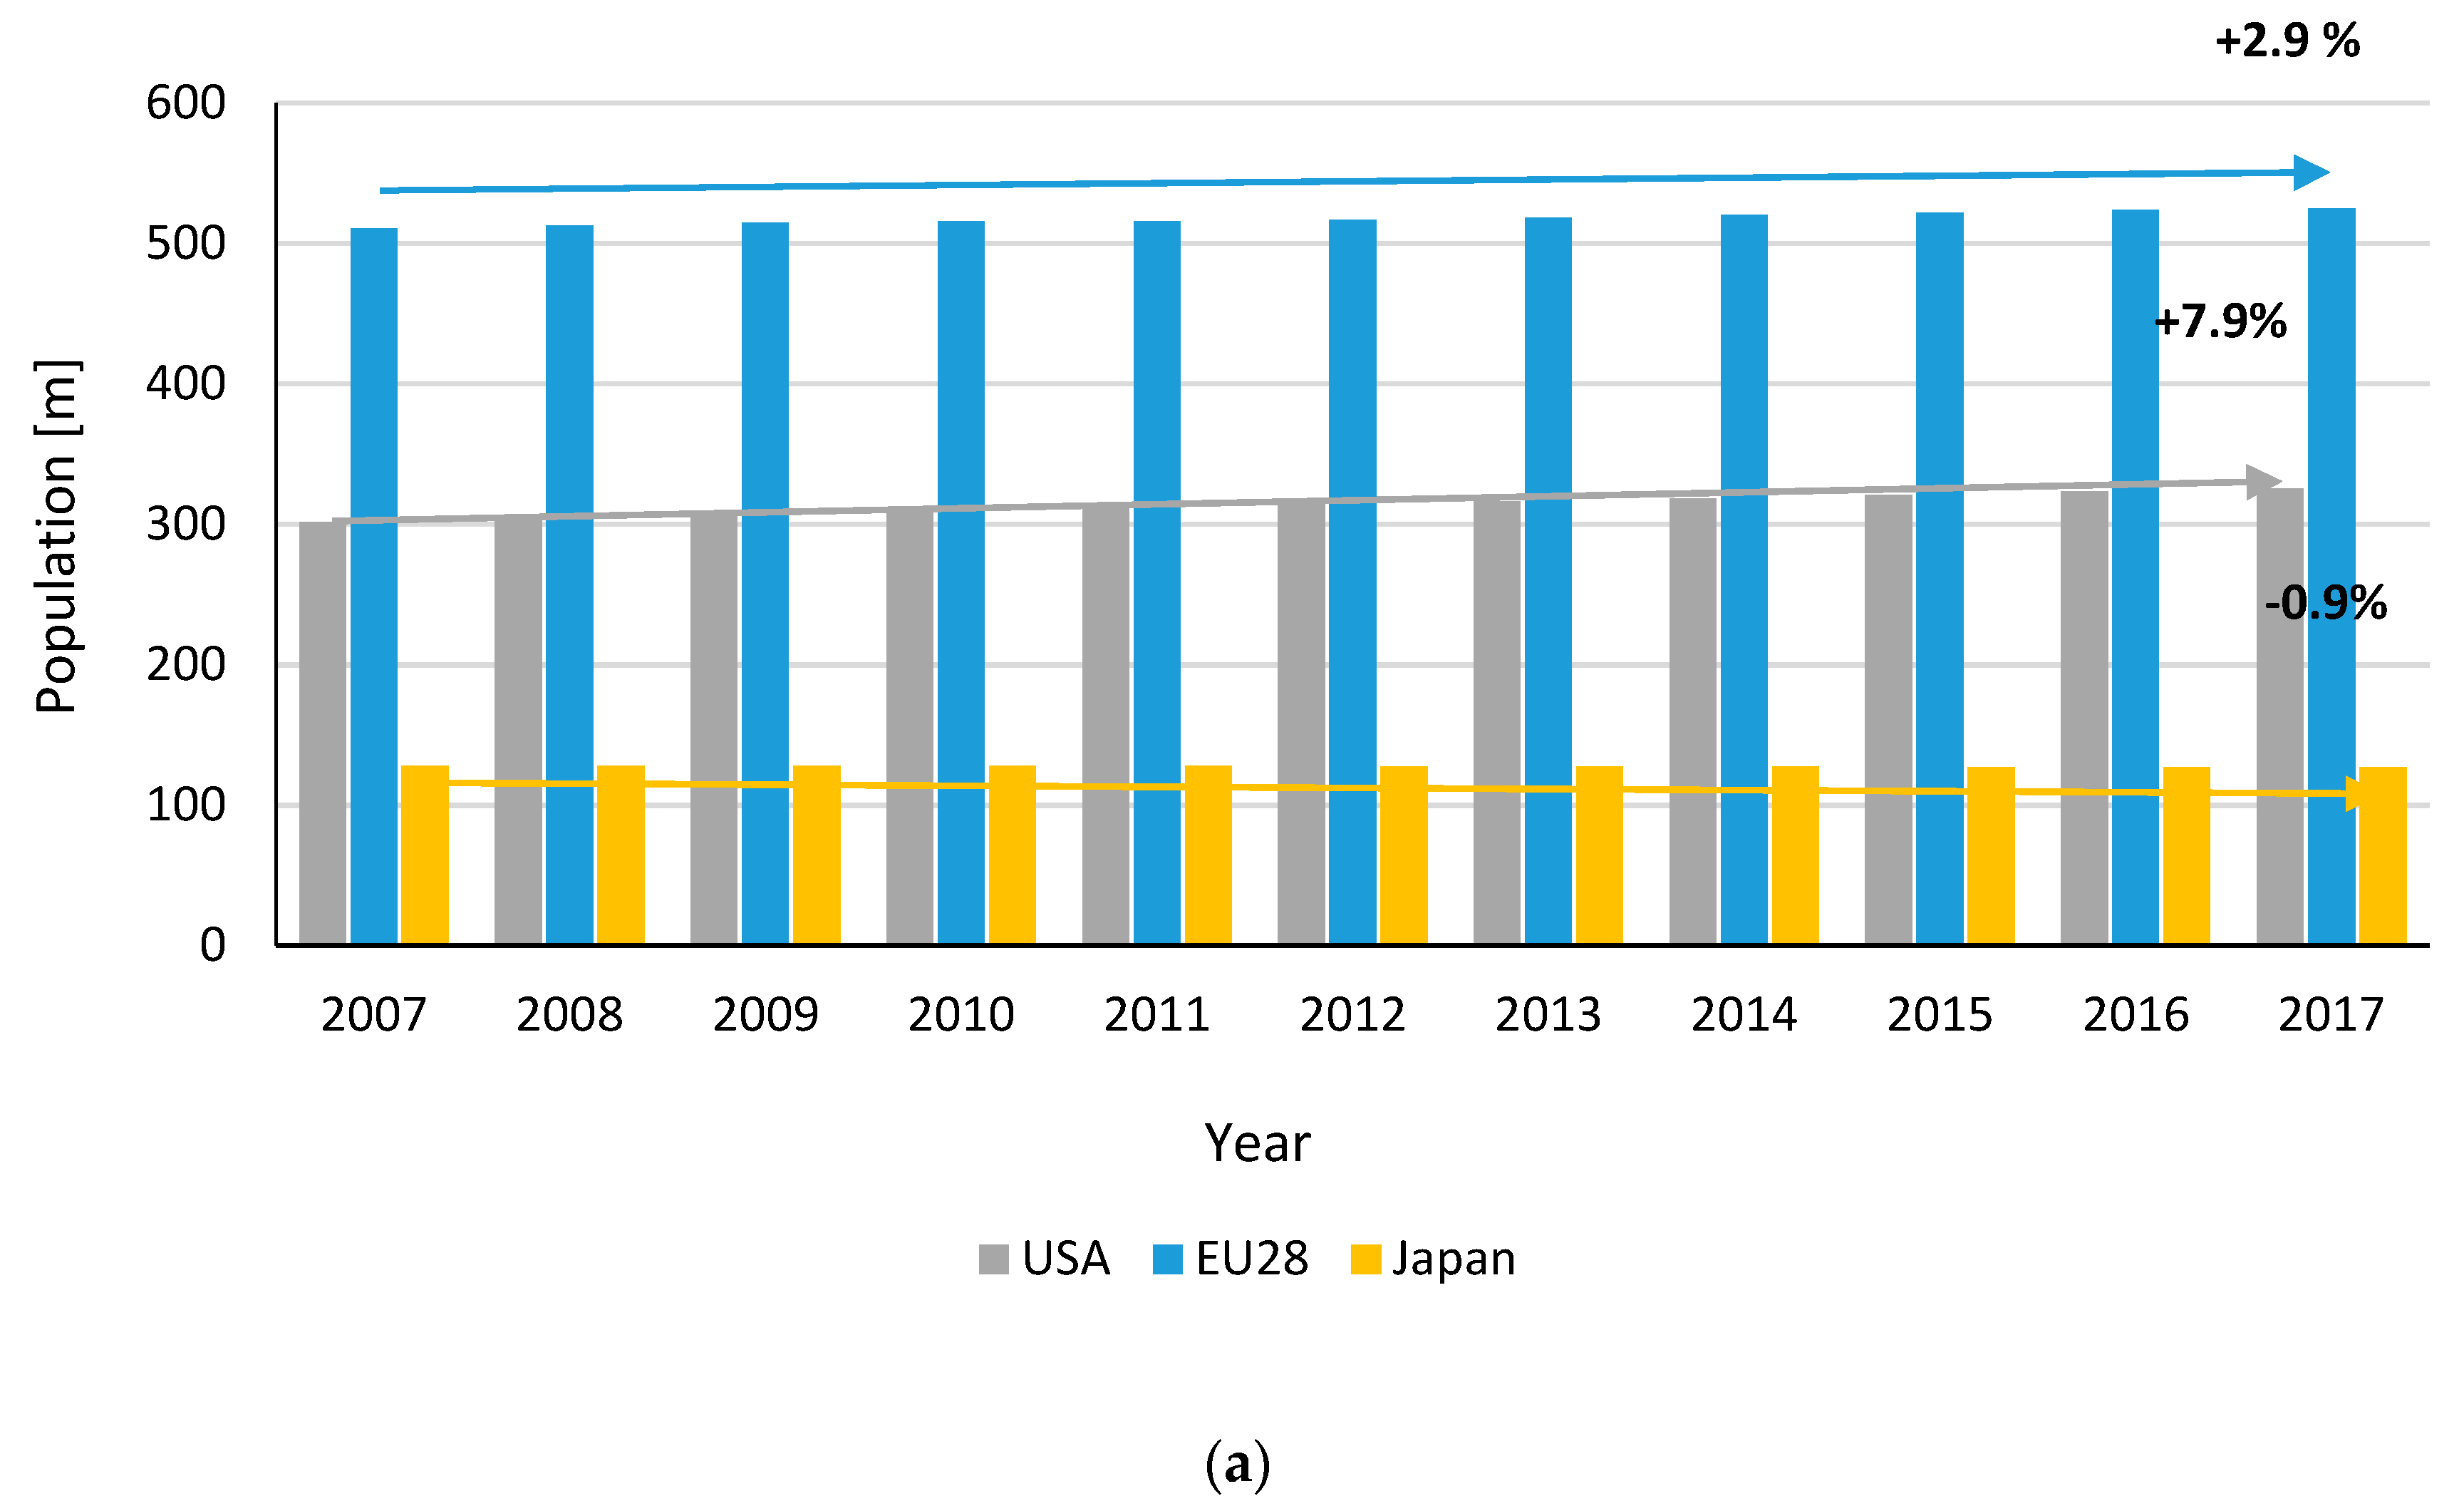
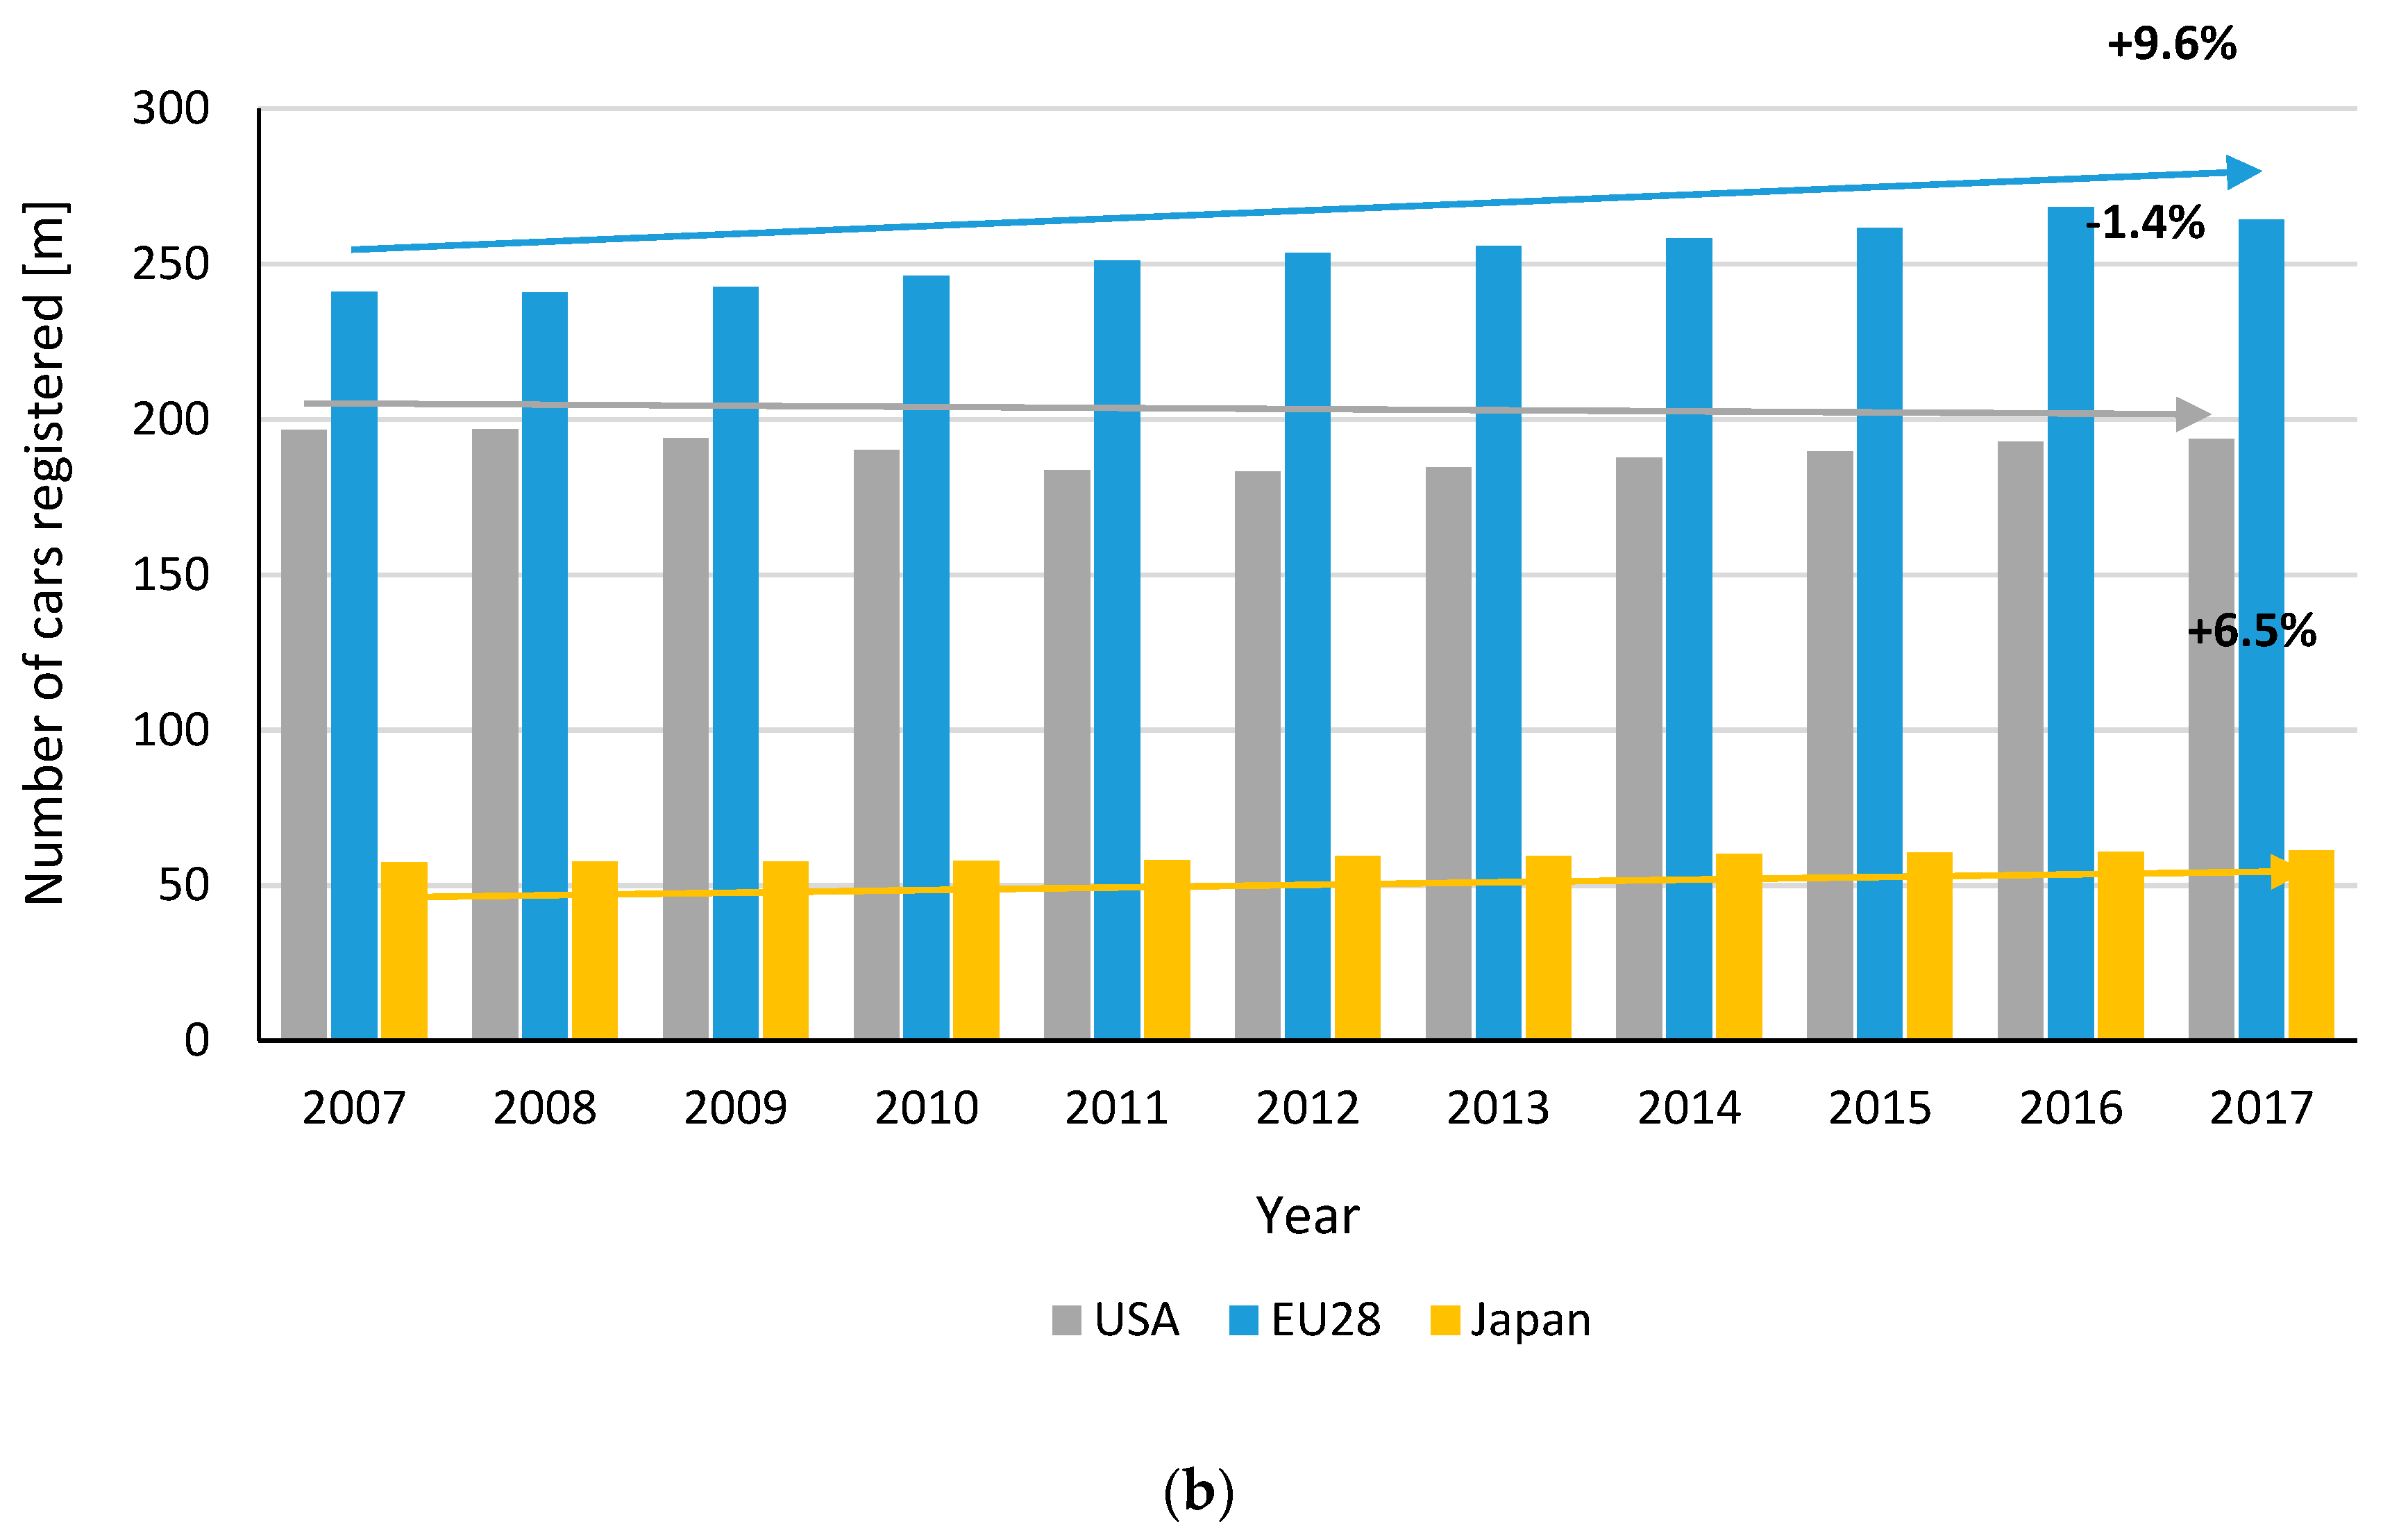
- During the period from 2007 to 2017, the population of the European Union increased by 2.9%, in the United States—by 7.9%, while the population of Japan decreased by 0.9%. During the same period, the number of passenger cars in the EU grew by 9.6%, in Japan—by 6.5%, and decreased in the US by −1.4%.
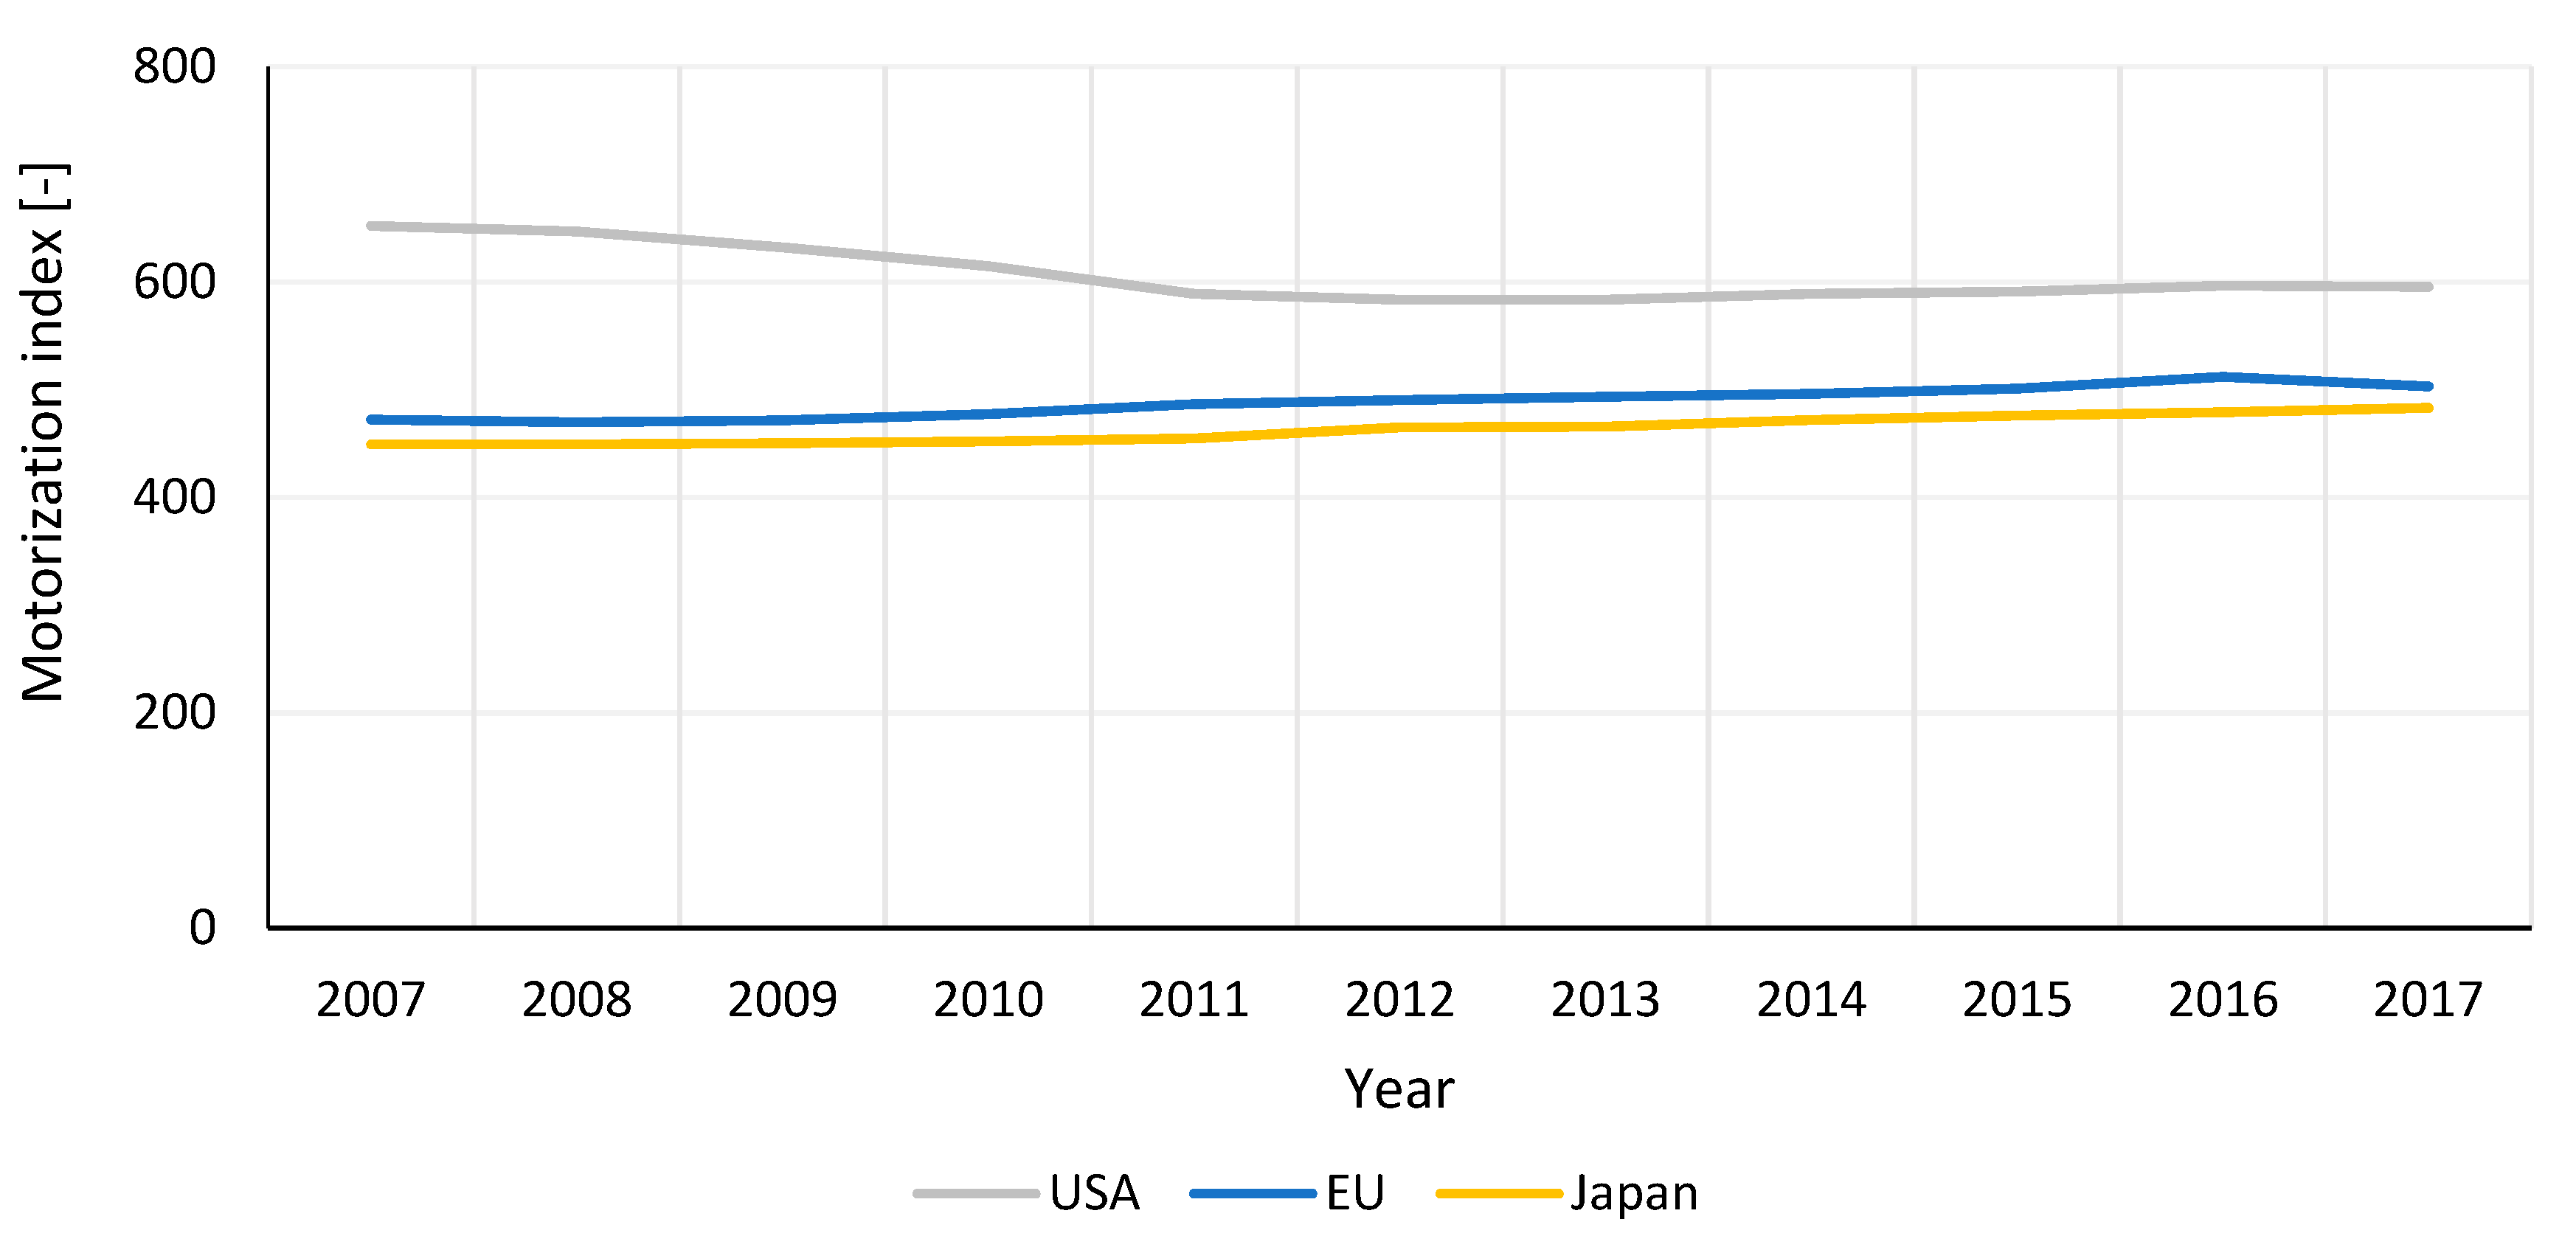
- The motorization index shows a growing trend in Japan and the European Union. In 2000–2017, it increased, respectively, by 33.8 in Japan (from 449.3 to 483.1) and by 31.0 in the EU (from 472.2 to 503.2). It was only in the territory of the US that a decrease by 56.6 was observed (from 652.3 to 595.7).
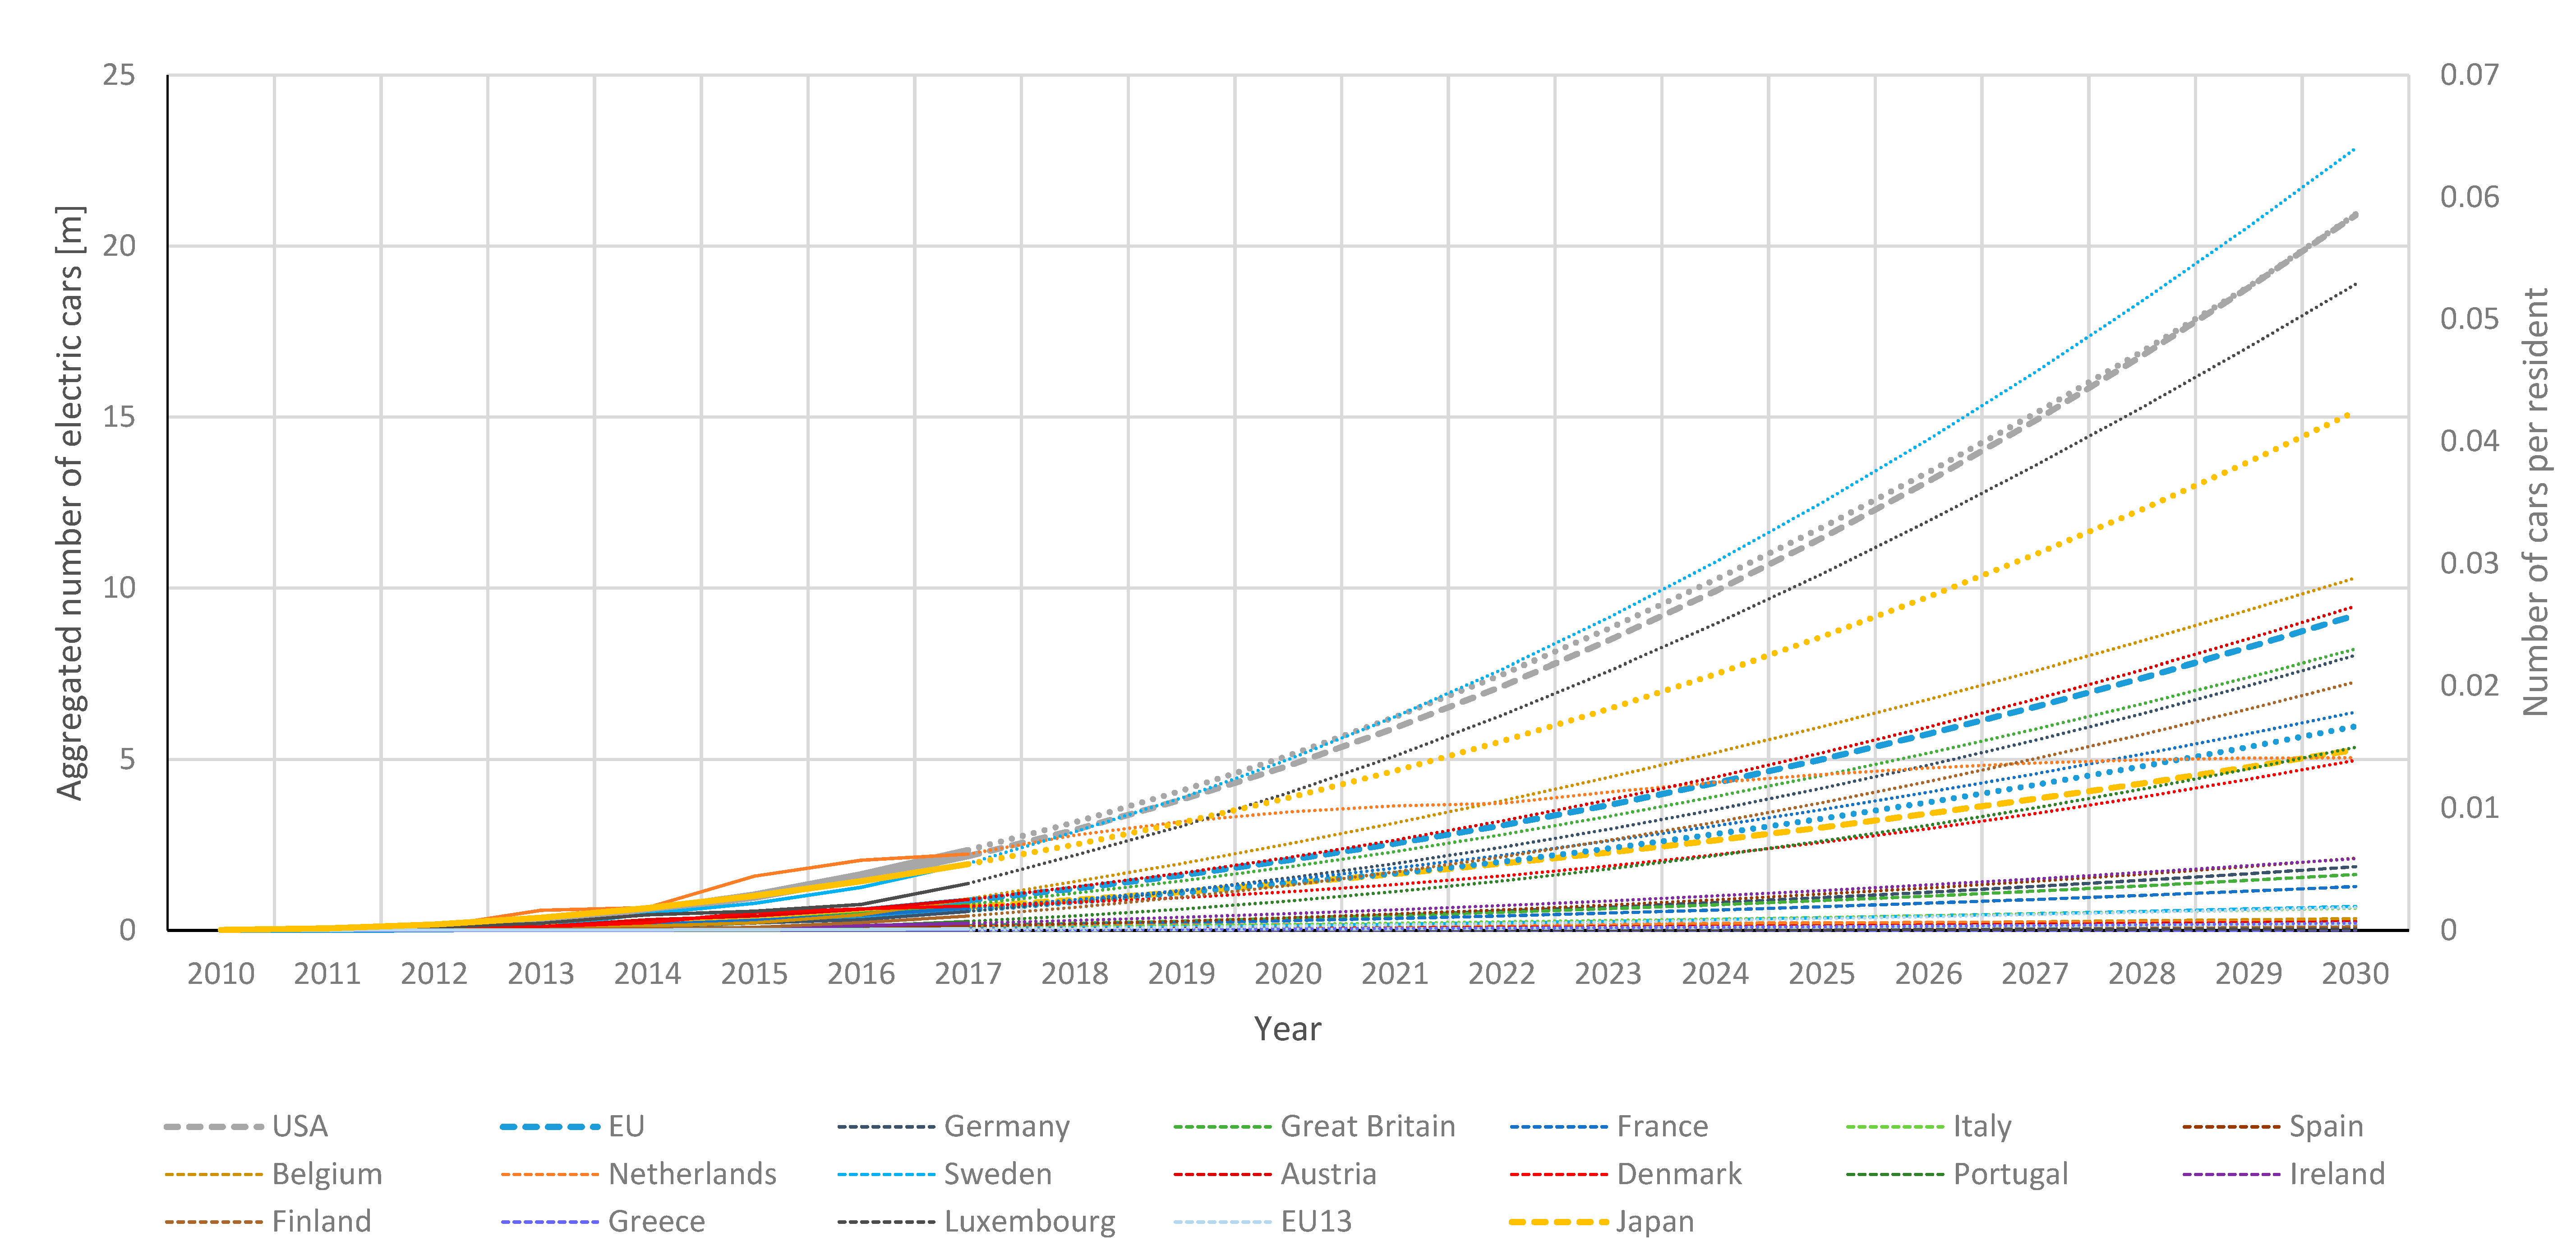
- The total of 868,320 electric cars were registered in 2010–2017 in the European Union, 2,163,569 in the United States and 685,301 in Japan. Based on the forecast, it was estimated that as many as 2,048,000 electric cars will be registered in the European Union in 2020, and the number will grow to 9,029,000 by 2030. In the US and Japan, the numbers will be respectively 4,808,000 and 1,366,000 cars in 2020, with 20,895,000 and 5,279,000 electric cars in 2030.
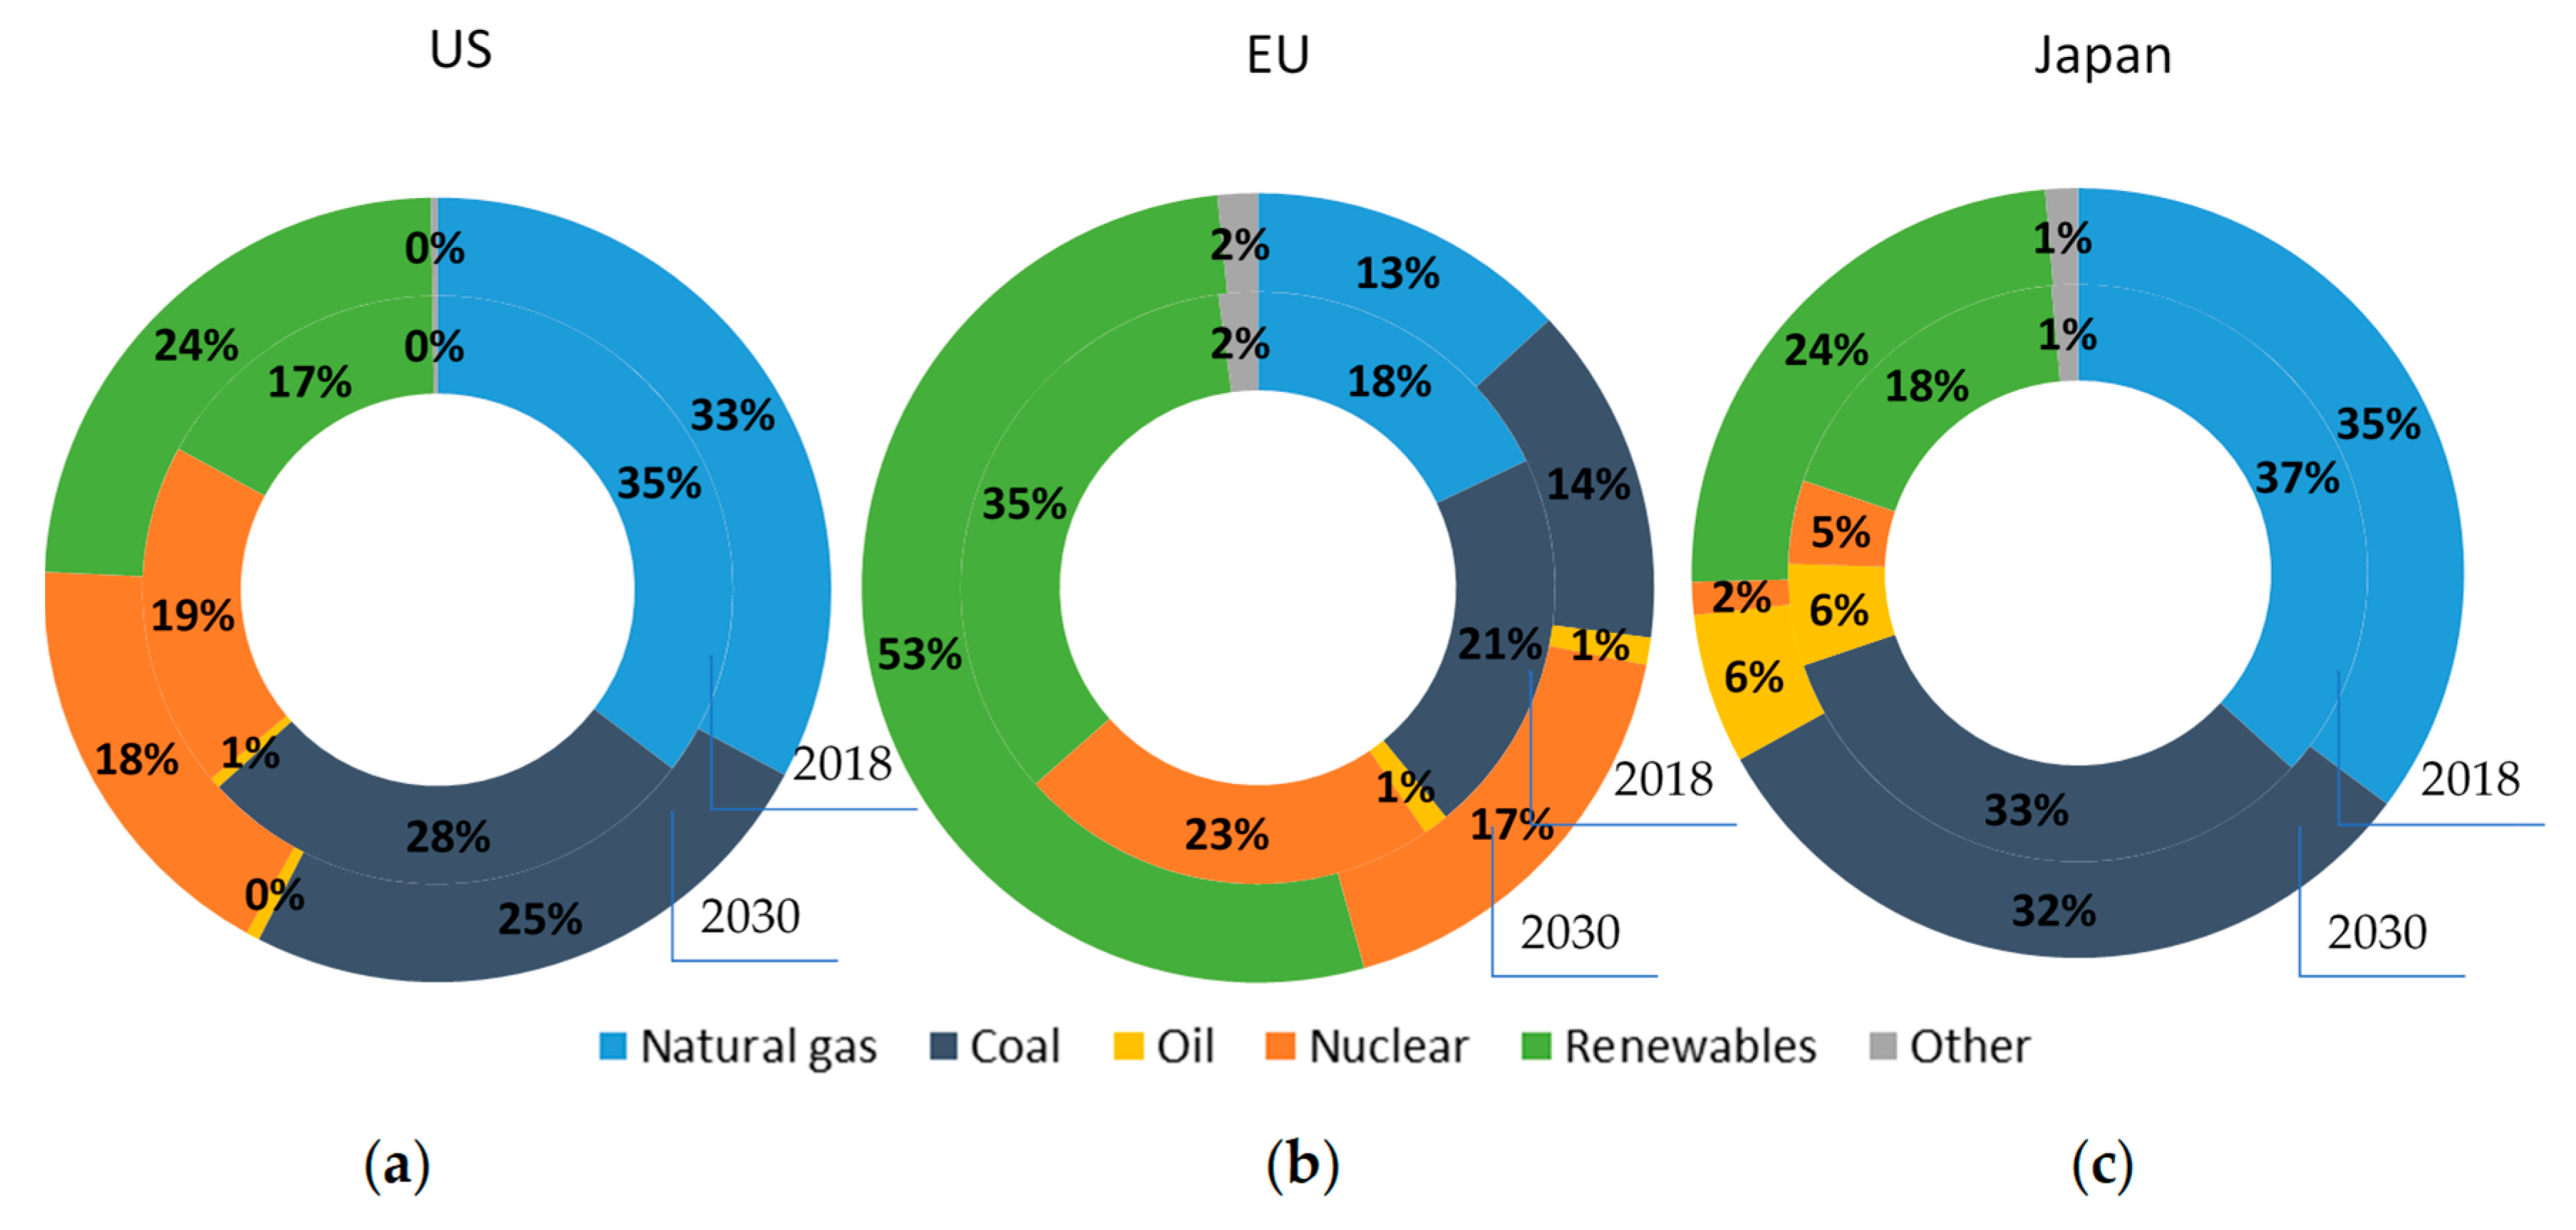
- The share of particular sources of energy used in electricity production in the analysed regions varies. The European Union is characterised with the highest share of renewable energy sources (35%) and nuclear power plants (23%). In the United States, RES account for as little as 17%, while in Japan—for 18%. In both those countries, the highest share is that of gas power plants—at 35% in the US and 37% in Japan, respectively. In all of the analysed regions, liquid fuel as a source of energy has a negligible share—under 1% in the US, 2% in the EU and 6% in Japan.
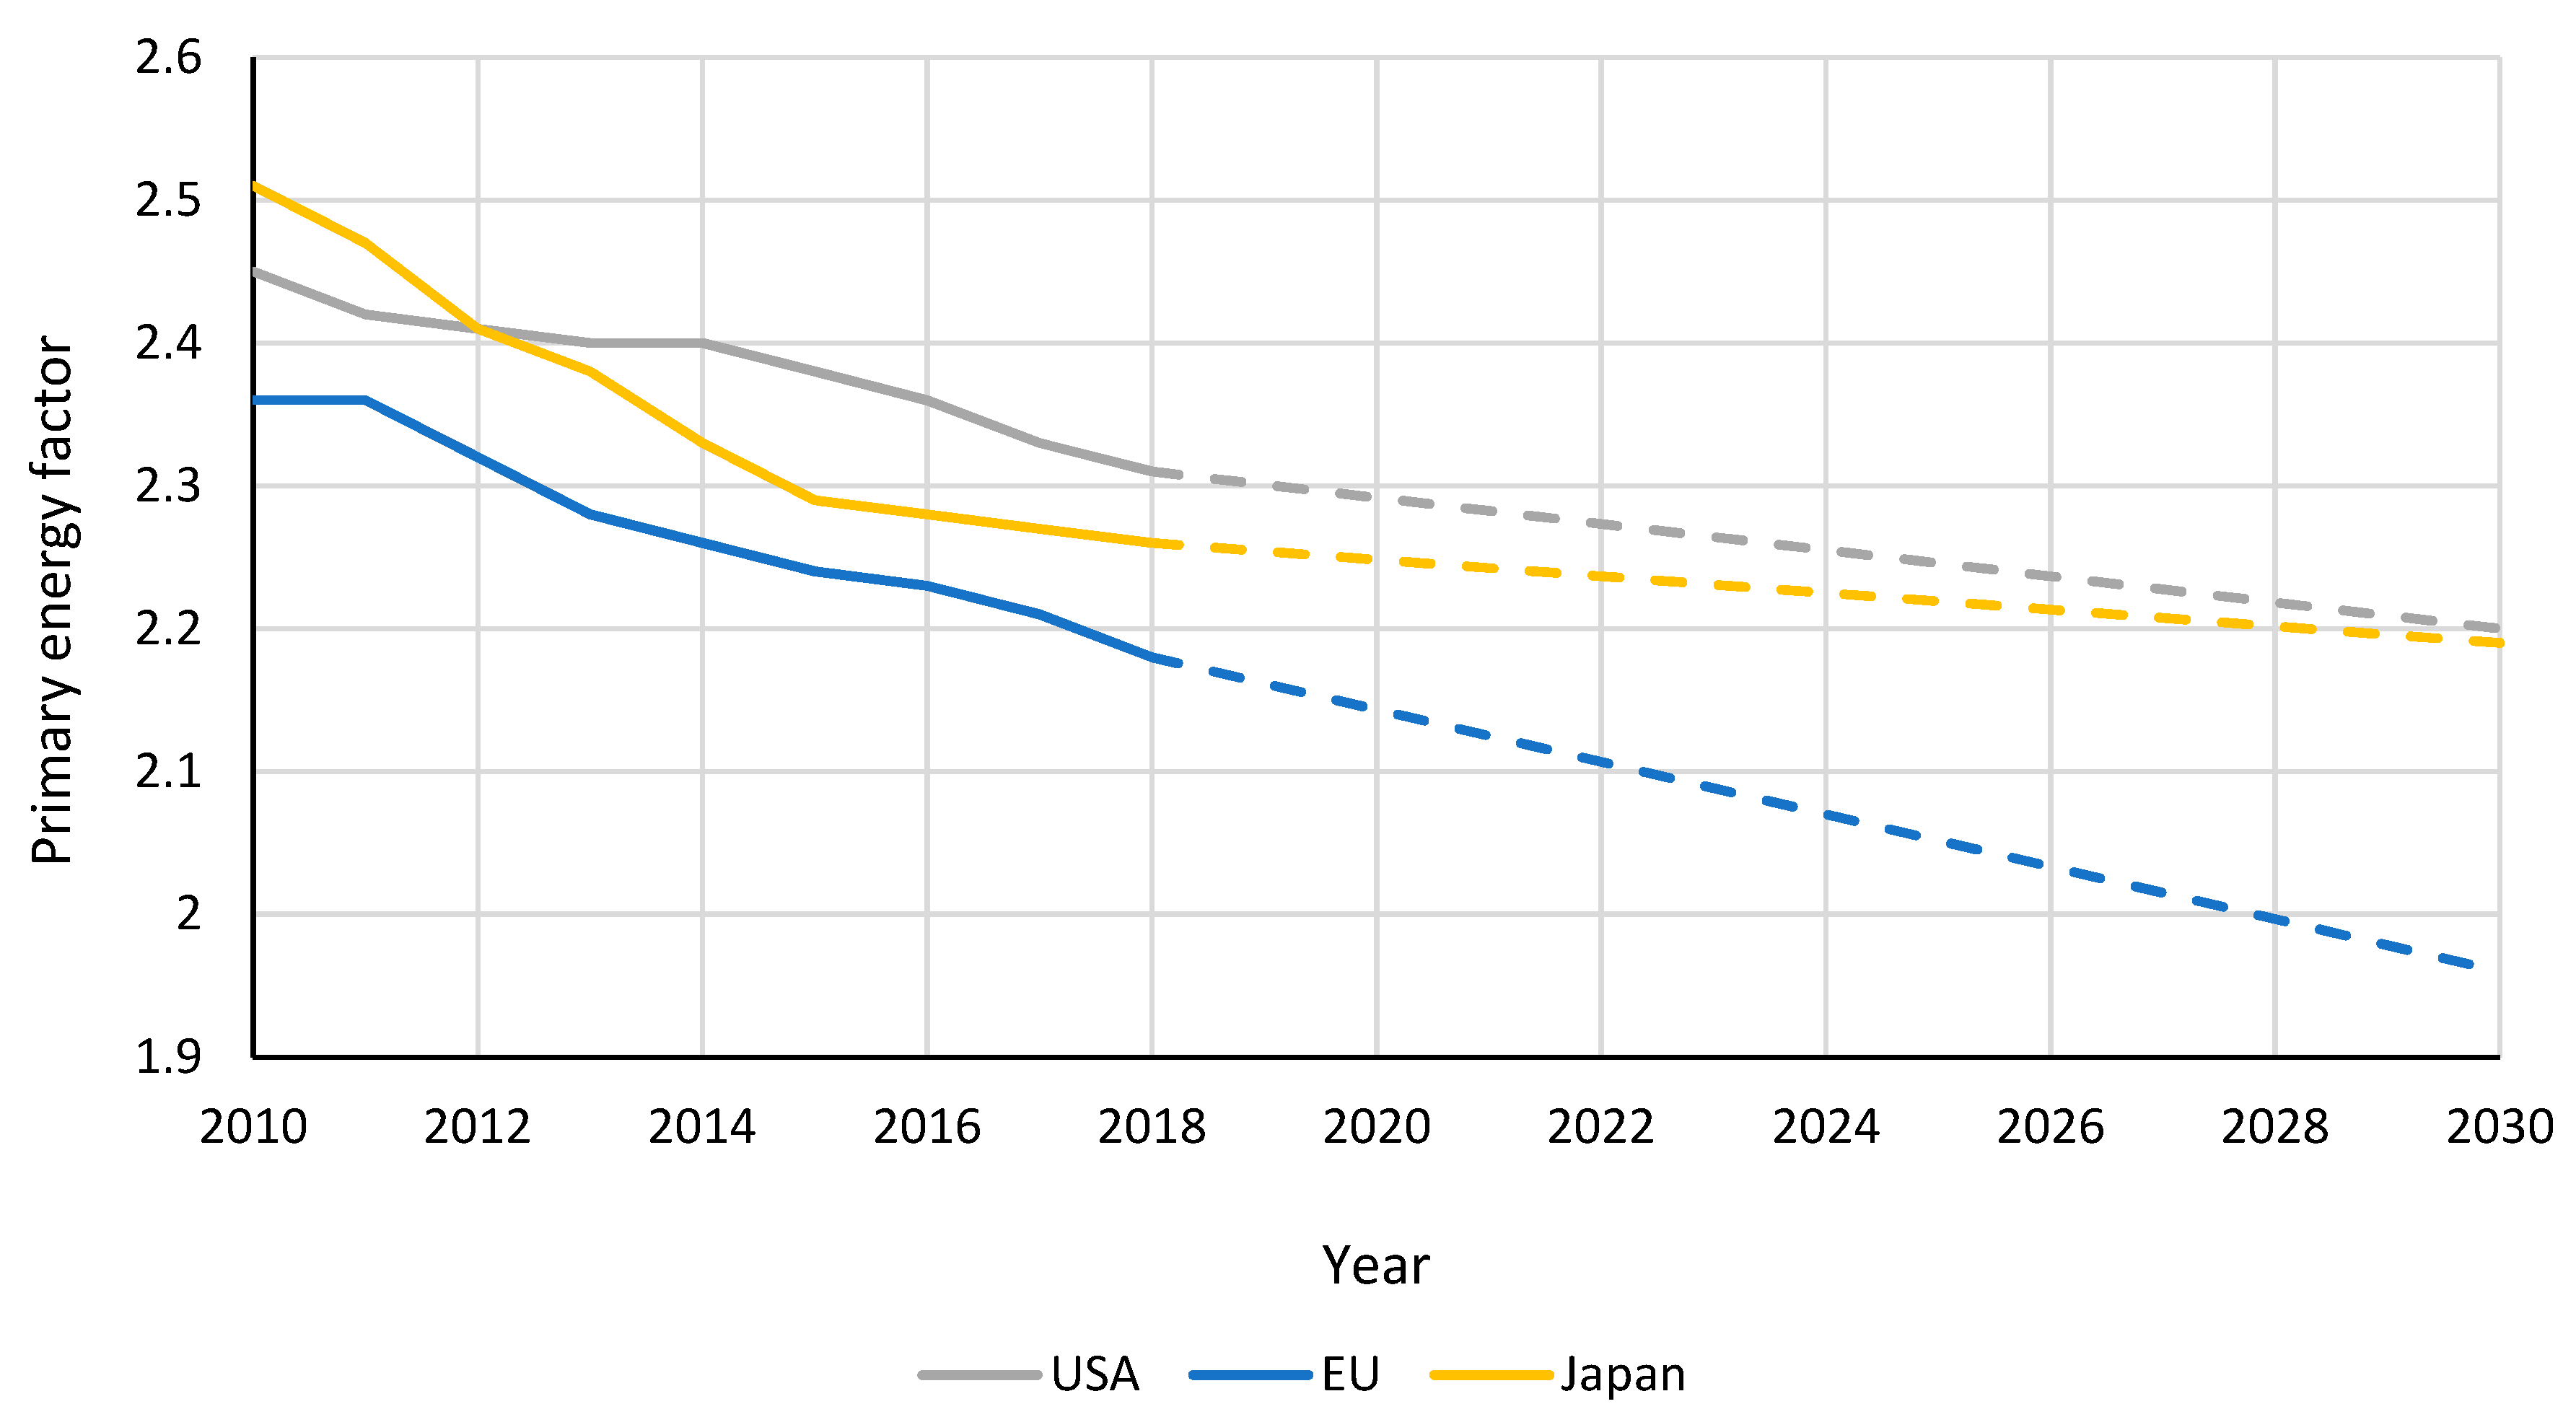
- Calculated pursuant to the authors’ original method, the primary energy factor has the lowest value in the European Union at 2.18, while in the United States is takes the value of 2.31, with 2.26 in Japan. As compared with historical data, a declining trend regarding PEF is observed in all the regions. The greatest PEF decrease is recorded in Japan (−9.96% during the analysed period), while the lowest decrease takes place in the US (−5.71%). The European Union is characterised with a stable decrease regarding this factor over the years covered – the average annual decrease is approximately −0.99% per year, while total decrease for the analysed period is −7.63%.
- The environmental effect resulting from car fleet replacement with electric vehicles is a significant reduction of air pollutant emissions, such as carbon monoxide (CO) and nitrogen oxides (NOx). In the territory of the European Union, emission reductions by 2017 were, respectively: 86,867 thousand tonnes of CO and 20,321 thousand tonnes of NOx. In the US, emissions of 122,453 thousand tonnes of CO and 17,594 thousand tonnes of NOx were avoided, while in Japan the reductions concerned 17,208 thousand tonnes of CO and 1719 thousand tonnes of NOx.
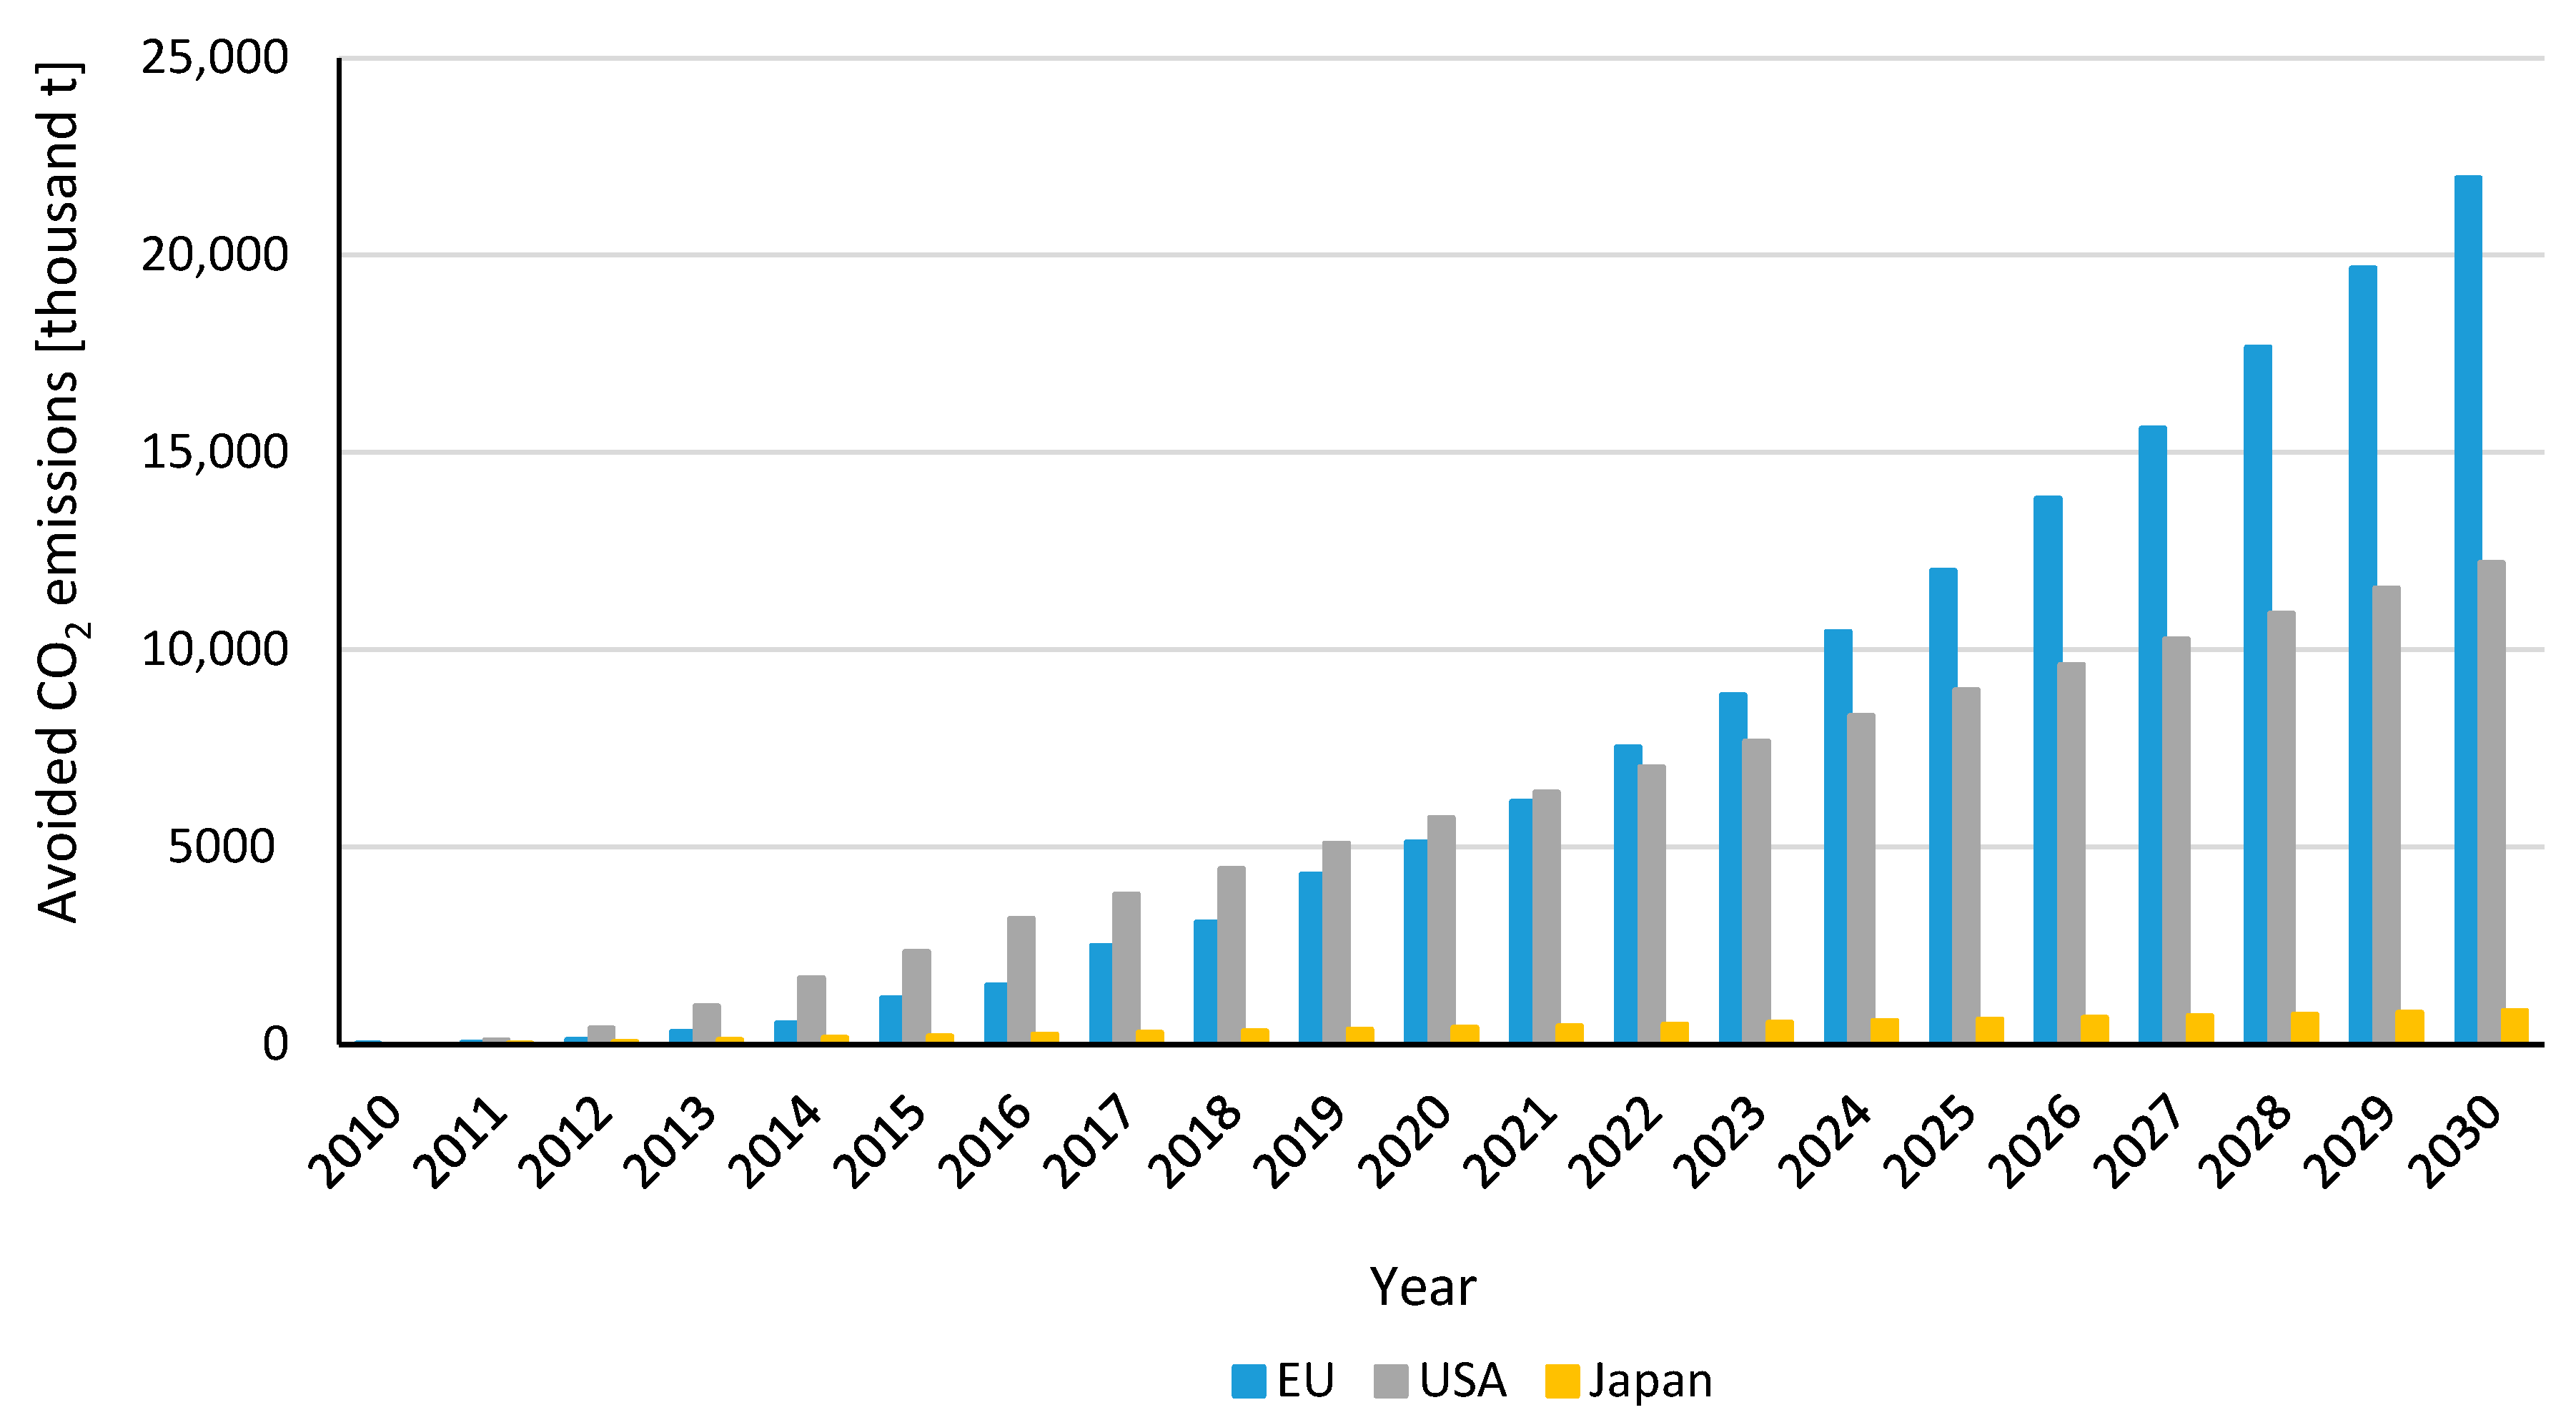
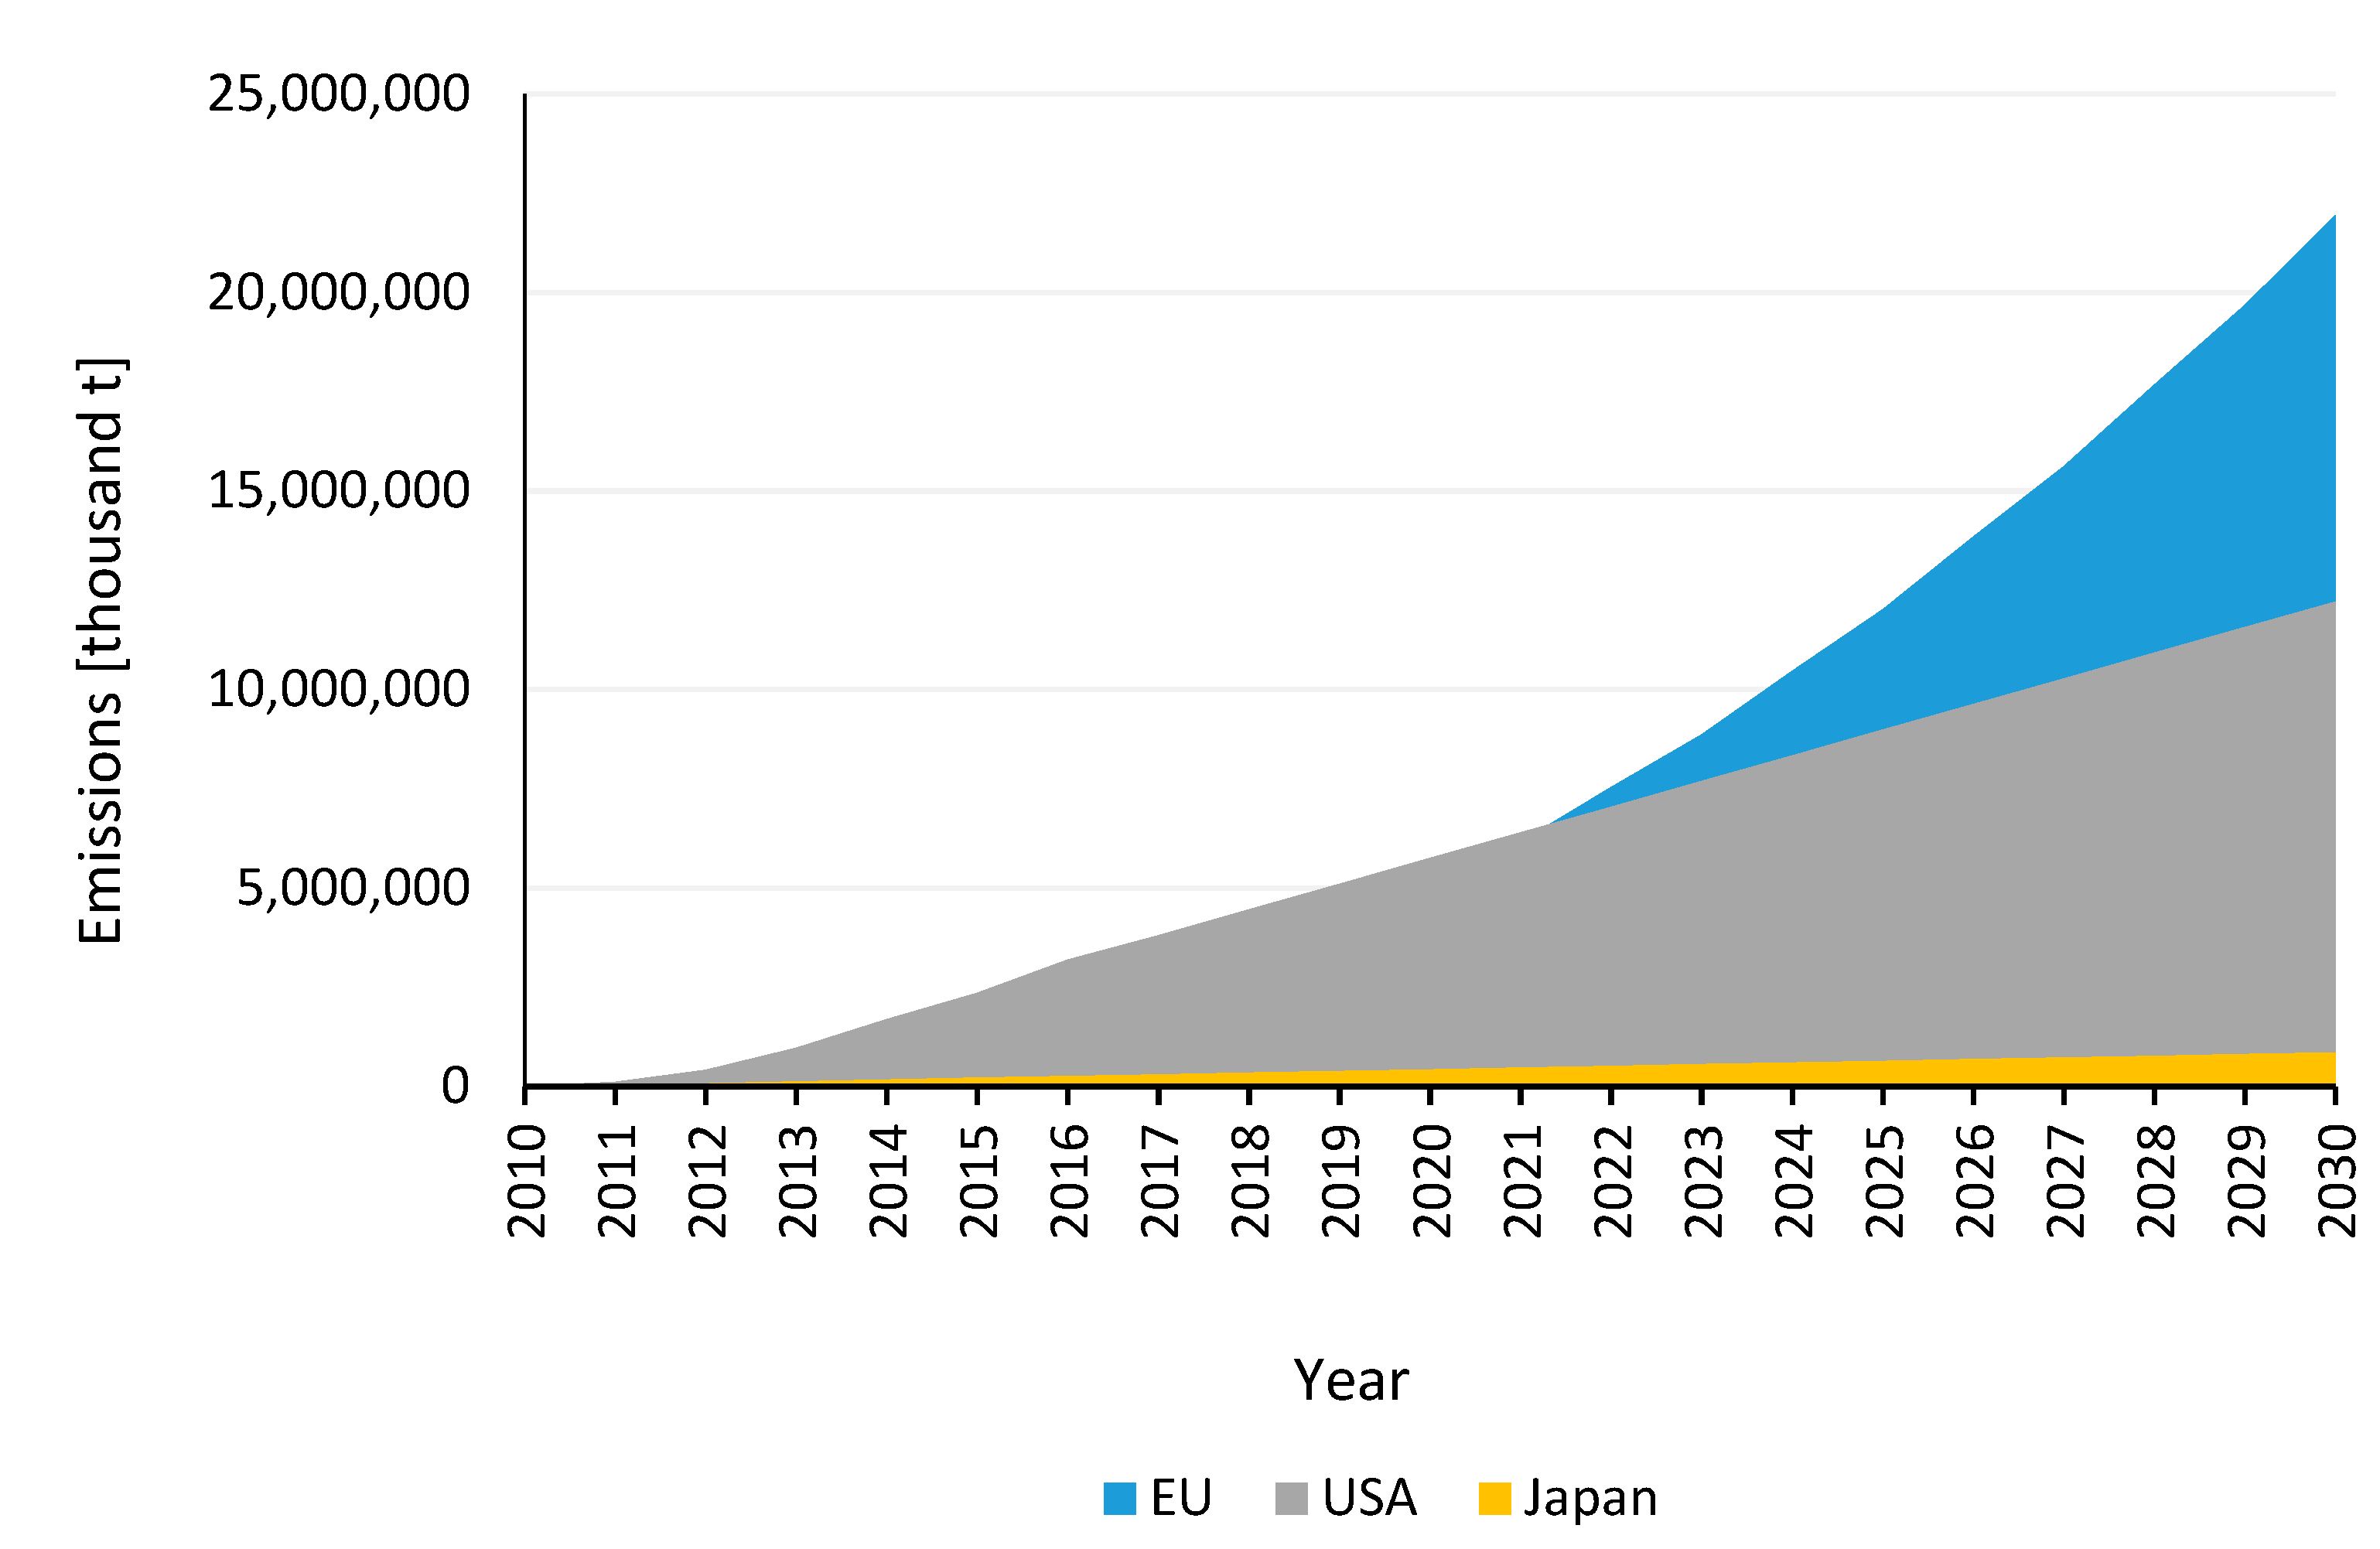
- The environmental effect also concerns carbon dioxide (CO2) emission reduction. In this area, enormous emission quantities were reduced. By 2017, it concerned 6,228,000 thousand tonnes in the EU, 12,508,000 thousand tonnes in the US and 1,154,000 thousand tonnes in Japan.
- However, this paper considers increased electricity requirements and resulting increased CO2 emissions from power plants. Despite that, the environmental effect in all the regions is still positive. After adjustment, the EU avoided the emission of 3,802,000 thousand tonnes of CO2 by 2017, the US—of 2,620,000 thousand tonnes, and Japan—of 83,312 thousand tonnes.
- It is forecast that during the year 2020 alone, emissions (adjusted) of 3,322,000 thousand tonnes of CO2 will be avoided in the EU, with 1,611,000 thousand tonnes avoided in the US and 46,000 thousand tonnes in Japan. If current trends are maintained, the reductions in 2030 may concern, respectively, over 14,908,000 thousand tonnes (EU), 3,786,000 thousand tonnes (US) and 111,683 thousand tonnes (Japan).
- Strategic planning of electricity generation sources including alternative resources together with implementation of electricity powered automobiles, and appropriate electric energy generation and distribution management should cause evident environmental impact also in countries other than analysed in the present paper.
- The existing fleet of vehicles with internal combustion engines must be replaced gradually. Future studies should consider vehicle replacement scenarios and the resulting effects on the climate and the economy. Research should also focus on technical aspects regarding the construction of vehicles, engines and methods of supplying electricity.
- During the development of the manuscript, the authors focused mainly on the topic of electromobility development in the studied areas. The calculation of the expected energy mix is based on historical data concerning changes in the structure of electricity sources, development of power grids and energy infrastructure. The assumptions do not take into account situations in which top-down decisions about giving up or subsidizing individual energy sources are taken at government level (for example, switching off nuclear power plants or subsidizing renewable energy). The assumptions made result from the nature of the method used—the creep trend, which is based on historical data. On the basis of these, a trend of change is determined under the assumption of the invariability of unpredictable external factors, such as the above mentioned top-down findings of national governments.
Author Contributions
Funding
Conflicts of Interest
References
- Swain, R.B.; Karimu, A. Renewable electricity and sustainable development goals in the EU. World Dev. 2020, 125, 104693. [Google Scholar] [CrossRef]
- Kristensen, H.S.; Mosgaard, M.A. A review of micro level indicators for a circular economy—Moving away from the three dimensions of sustainability? J. Clean. Prod. 2020, 243, 118531. [Google Scholar] [CrossRef]
- Matuszek, J. Trends and directions of production engineering development. Prod. Innow. Prod. Innov. 2005, 1, 2–7. [Google Scholar]
- Brodny, J.; Tutak, M. Analysis of the diversity in emissions of selected gaseous and particulate pollutants in the European Union countries. J. Environ. Manag. 2019, 231, 582–595. [Google Scholar] [CrossRef] [PubMed]
- Wiegmans, B.; Champagne-Gelinas, A.; Duchesne, S.; Slack, B.; Witte, P. Rail and road freight transport network efficiency of Canada, member states of the EU, and the US. Res. Trans. Bus. Manag. 2018, 28, 54–65. [Google Scholar]
- Production of Passenger Cars Worldwide from 1998 to 2018. Available online: https://www.statista.com/statistics/268739/production-of-passenger-cars-worldwide/ (accessed on 27 January 2020).
- Pettersson, P.; Johannesson, P.; Jacobson, B.; Bruzelius, F.; Fast, L.; Berglund, S. A statistical operating cycle description for prediction of road vehicles’ energy consumption. Trans. Res. Part D Trans. Environ. 2019, 73, 205–229. [Google Scholar] [CrossRef]
- Passenger Cars in the EU. Available online: https://ec.europa.eu/eurostat/statistics-explained/index.php/Passenger_cars_in_the_EU (accessed on 8 August 2020).
- European Vehicle Market Statistics. Pocketbook 2016/17. Available online: https://theicct.org/sites/default/files/publications/ICCT_Pocketbook_2016.pdf (accessed on 8 August 2020).
- Tucki, K.; Mruk, R.; Bączyk, A.; Botwińska, K.; Woźniak, K. Analysis of the Exhaust Gas Emission Level from a Diesel Engine with Using Computer Simulation. Rocz. Ochr. Środowiska 2018, 20, 1095–1112. [Google Scholar]
- Tucki, K.; Bączyk, A.; Klimkiewicz, M.; Mączyńska, J.; Sikora, M. Comparison of Energy Performance and Toxicity of Diesel Engine Fuelled with Diesel Oil, Rapeseed Oil and Oil Mixture. Available online: https://iopscience.iop.org/article/10.1088/1755-1315/214/1/012102 (accessed on 23 November 2019).
- Ghadikolaei, M.A.; Yung, K.F.; Cheung, C.S.; Lau, P.C. Chemical properties and composition of PM emitted from a diesel engine fueled with ternary fuel (diesel-biodiesel-ethanol) in blended and fumigation modes. Fuel 2019, 251, 368–382. [Google Scholar] [CrossRef]
- Nordelöf, A.; Romare, M.; Tivander, J. Life cycle assessment of city buses powered by electricity, hydrogenated vegetable oil or diesel. Trans. Res. Part D Trans. Environ. 2019, 75, 211–222. [Google Scholar] [CrossRef]
- Szymczyk, K.; Kadłubek, M. Challenges in general cargo distribution strategy in urban logistics—Comparative analysis of the biggest logistics operators in EU. Trans. Res. Procedia 2019, 39, 525–533. [Google Scholar] [CrossRef]
- Andrés, L.; Padilla, E. Driving factors of GHG emissions in the EU transport activity. Trans. Policy 2018, 61, 60–74. [Google Scholar] [CrossRef]
- Kondratyev, K.Y.; Varotsos, C. Atmospheric greenhouse effect in the context of global climate change. Il Nuovo Cimento 1995, 18, 123–151. [Google Scholar] [CrossRef]
- Adamenko, V.V.; Kondratyev, K.Y.; Varotsos, C.A. Climate Change in the Arctic and its Empirical Diagnostics. Energy Environ. 1999, 10, 469–482. [Google Scholar] [CrossRef]
- Veum, K.; Bauknecht, D. How to reach the EU renewables target by 2030? An analysis of the governance framework. Energy Policy 2019, 127, 299–307. [Google Scholar] [CrossRef]
- Haasz, T.; Vilchez, J.J.G.; Kunze, R.; Deane, P.; Fraboulet, D.; Fahl, U.; Mulholland, E. Perspectives on decarbonizing the transport sector in the EU-28. Energy Strategy Rev. 2018, 20, 124–132. [Google Scholar] [CrossRef]
- Krzywonos, M.; Skudlarski, J.; Kupczyk, A.; Wojdalski, J.; Tucki, K. Forecast for transport biofuels in Poland in 2020–2030. Przem. Chem. 2015, 94, 2218–2222. [Google Scholar]
- Katinas, V.; Gaigalis, V.; Savickas, J.; Marčiukaitis, M. Analysis of sustainable liquid fuel production and usage in Lithuania in compliance with the National Energy Strategy and EU policy. Renew. Sustain. Energy Rev. 2018, 82, 271–280. [Google Scholar] [CrossRef]
- Capros, P.; Zazias, G.; Evangelopoulou, S.; Kannavou, M.; Fotiou, T.; Siskos, P.; De Vita, A.; Sakellaris, K. Energy-system modelling of the EU strategy towards climate-neutrality. Energy Policy 2019, 134, 110960. [Google Scholar] [CrossRef]
- Santini, D.J. Electric Vehicle Waves of History: Lessons Learned about Market Deployment of Electric Vehicles. Available online: http://Cdn.intechweb.org/pdfs/18663.pdf (accessed on 23 November 2019).
- Chakraborty, D.; Bunch, D.S.; Lee, J.H.; Tal, G. Demand drivers for charging infrastructure-charging behavior of plug-in electric vehicle commuters. Trans. Res. Part D Trans. Environ. 2019, 76, 255–272. [Google Scholar] [CrossRef]
- Cansino, J.M.; Sánchez-Braza, A.; Sanz-Díaz, T. Policy Instruments to Promote Electro-Mobility in the EU28: A Comprehensive Review. Sustainability 2018, 10, 2507. [Google Scholar] [CrossRef]
- Ahmadi, P. Environmental impacts and behavioral drivers of deep decarbonization for transportation through electric vehicles. J. Clean. Prod. 2019, 225, 1209–1219. [Google Scholar] [CrossRef]
- Mersky, A.C.; Sprei, F.; Samaras, C.; Qian, Z. Effectiveness of incentives on electric vehicle adoption in Norway. Trans. Res. Part D Trans. Environ. 2016, 46, 56–68. [Google Scholar] [CrossRef]
- Hooftman, N.; Oliveira, L.; Messagie, M.; Coosemans, T.; Van Mierlo, J. Environmental Analysis of Petrol, Diesel and Electric Passenger Cars in a Belgian Urban Setting. Energies 2016, 9, 84. [Google Scholar] [CrossRef]
- Arat, H.T. Alternative fuelled hybrid electric vehicle (AF-HEV) with hydrogen enriched internal combustion engine. Int. J. Hydrogen Energy 2019, 1–12, in press. [Google Scholar] [CrossRef]
- Shankar, R.; Marco, J. Method for estimating the energy consumption of electric vehicles and plug-in hybrid electric vehicles under real-world driving conditions. Intell. Trans. Syst. IET 2013, 7, 138–150. [Google Scholar] [CrossRef]
- O’Driscoll, R.; Stettler, M.E.J.; Molden, N.; Oxley, T.; ApSimon, H.M. Real world CO2 and NOx emissions from 149 Euro 5 and 6 diesel, gasoline and hybrid passenger cars. Sci. Total Environ. 2018, 621, 282–290. [Google Scholar] [CrossRef]
- Electric Vehicles from Life Cycle and Circular Economy Perspectives. TERM 2018: Transport and Environment Reporting Mechanism (TERM) Report. Available online: https://www.eea.europa.eu/publications/electric-vehicles-from-life-cycle (accessed on 8 August 2020).
- Tomczak, J.; Pater, Z.; Bulzak, T. Effect of technological parameters on the rotary compression proces. Eksploat. Niezawodn. 2013, 15, 279–283. [Google Scholar]
- Gajek, J.; Awrejcewicz, J. Mathematical models and non-linear dynamics of a linear electromagnetic motor. Nonlinear Dyn. 2018, 94, 377–396. [Google Scholar] [CrossRef]
- Charge Your Car at One of Energa Network of Electric Vehicle Charging Points. Available online: https://emobility.pl/index.php/en/charging-network-eng/ (accessed on 23 November 2019).
- Kouchachvili, L.; Yaïci, W.; Entchev, E. Hybrid battery/supercapacitor energy storage system for the electric vehicles. J. Power Sources 2018, 374, 237–248. [Google Scholar] [CrossRef]
- Tucki, K.; Orynycz, O.; Wasiak, A.; Świć, A.; Dybaś, W. Capacity market implementation in Poland: Analysis of a survey on consequences for the electricity market and for energy management. Energies 2019, 12, 839. [Google Scholar] [CrossRef]
- Cao, Y.; Huang, L.; Li, Y.; Jermsittiparsert, K.; Ahmadi-Nezamabad, H.; Nojavan, S. Optimal scheduling of electric vehicles aggregator under market price uncertainty using robust optimization technique. Int. J. Electr. Power Energy Syst. 2020, 117, 105628. [Google Scholar]
- Monteiro, V.; Afonso, J.A.; Ferreira, J.C.; Afonso, J.L. Vehicle Electrification: New Challenges and Opportunities for Smart Grids. Energies 2019, 12, 118. [Google Scholar] [CrossRef]
- Varga, B.O.; Mariasiu, F.; Miclea, C.D.; Szabo, I.; Sirca, A.A.; Nicolae, V. Direct and Indirect Environmental Aspects of an Electric Bus Fleet Under Service. Energies 2020, 13, 336. [Google Scholar] [CrossRef]
- Alface, G.; Ferreira, J.C.; Pereira, R. Electric Vehicle Charging Process and Parking Guidance App. Energies 2019, 12, 2123. [Google Scholar] [CrossRef]
- Kvisle, H.H. The Norwegian Charging Station Database for Electromobility (NOBIL). World Electr. Veh. J. 2012, 5, 702–707. [Google Scholar]
- Dong, G.; Ma, J.; Wei, R.; Haycox, J. Electric vehicle charging point placement optimisation by exploiting spatial statistics and maximal coverage location models. Trans. Res. Part D Trans. Environ. 2019, 67, 77–88. [Google Scholar] [CrossRef]
- Zhao, Q. Electromobility research in Germany and China: Structural differences. Scientometrics 2018, 117, 473–493. [Google Scholar]
- United States Population. 2019. Available online: http://worldpopulationreview.com/countries/united-states-population/ (accessed on 23 November 2019).
- Rivera-Monroy, V.H.; Danielson, T.M.; Castañeda-Moya, E.; Marx, B.D.; Travieso, R.; Zhao, X.; Gaiser, E.E.; Farfan, L.M. Long-term demography and stem productivity of Everglades mangrove forests (Florida, US): Resistance to hurricane disturbance. For. Ecol. Manag. 2019, 440, 79–91. [Google Scholar] [CrossRef]
- Selected Automakers’ U.S. Ytd Market Share in 3rd Quarter 2019, by Key Manufacturer. Available online: https://www.statista.com/statistics/343162/market-share-of-major-car-manufacturers-in-the-united-states/ (accessed on 23 November 2019).
- How Many Polish Genes in the Polish Automotive Industry? Available online: https://www.arp.pl/__data/assets/pdf_file/0011/76178/Raport.pdf (accessed on 7 August 2020).
- Hu, L.; Dong, J.; Lin, Z.; Yang, J. Analyzing battery electric vehicle feasibility from taxi travel patterns: The case study of New York City, US. Trans. Res. Part C Emerg. Technol. 2018, 87, 91–104. [Google Scholar] [CrossRef]
- Feng, W.; Figliozzi, M. An economic and technological analysis of the key factors affecting the competitiveness of electric commercial vehicles: A case study from the US market. Trans. Res. Part C Emerg. Technol. 2013, 26, 135–145. [Google Scholar] [CrossRef]
- Thomas, V.J.; Maine, E. Market entry strategies for electric vehicle start-ups in the automotive industry—Lessons from Tesla Motors. J. Clean. Prod. 2019, 235, 653–663. [Google Scholar] [CrossRef]
- Liu, J.H.; Meng, Z. Innovation Model Analysis of New Energy Vehicles: Taking Toyota, Tesla and BYD as an Example. Procedia Eng. 2017, 174, 965–972. [Google Scholar] [CrossRef]
- Guo, Z.; Zhou, Y. Residual value analysis of plug-in vehicles in the United States. Energy Policy 2019, 125, 445–455. [Google Scholar] [CrossRef]
- Population and Population Change Statistics. Available online: https://ec.europa.eu/eurostat/statistics-explained/index.php/Population_and_population_change_statistics (accessed on 23 November 2019).
- EU: Total Population from 2009 to 2019. Available online: https://www.statista.com/statistics/253372/total-population-of-the-european-union-eu/ (accessed on 23 November 2019).
- Auvinen, H.; Järvi, T.; Kloetzke, M.; Kugler, U.; Bühne, J.A.; Heinl, F.; Kurte, J.; Esser, K. Electromobility Scenarios: Research Findings to Inform Policy. Trans. Res. Procedia 2016, 14, 2564–2573. [Google Scholar] [CrossRef]
- Habib, K.; Hansdóttir, S.T.; Habib, H. Critical metals for electromobility: Global demand scenarios for passenger vehicles, 2015–2050. Resour. Conserv. Recycl. 2020, 154, 104603. [Google Scholar] [CrossRef]
- Pregger, T.; Nitsch, J.; Naegler, T. Long-term scenarios and strategies for the deployment of renewable energies in Germany. Energy Policy 2013, 59, 350–360. [Google Scholar] [CrossRef]
- Council Directive 91/441/EEC of 26 June 1991 Amending Directive 70/220/EEC on the Approximation of the Laws of the Member States Relating to Measures to Be Taken Against Air Pollution by Emissions from Motor Vehicles. Available online: https://eur-lex.europa.eu/legal-content/en/ALL/?uri=CELEX%3A31991L0441 (accessed on 8 August 2020).
- Directive 94/12/EC of the European Parliament and the Council of 23 March 1994 Relating to Measures to Be Taken Against Air Pollution by Emissions from Motor Vehicles and Amending Directive 70/220/EEC. Available online: https://eur-lex.europa.eu/legal-content/en/ALL/?uri=CELEX%3A31994L0012 (accessed on 8 August 2020).
- Commission Directive 2002/80/EC of 3 October 2002 Adapting to Technical Progress Council Directive 70/220/Eec Relating to Measures to Be Taken Against Air Pollution by Emissions from Motor Vehicles (Text with EEA Relevance). Available online: https://eur-lex.europa.eu/legal-content/HR/TXT/?uri=CELEX:32002L0080 (accessed on 8 August 2020).
- Commission Regulation (EU) 2016/427 of 10 March 2016 Amending Regulation (EC) No 692/2008 as Regards Emissions from Light Passenger and Commercial Vehicles (Euro 6) (Text with EEA Relevance). Available online: https://eur-lex.europa.eu/legal-content/EN/TXT/?uri=CELEX%3A32016R0427 (accessed on 8 August 2020).
- Progress of EU Transport Sector towards Its Environment and Climate Objectives. Available online: https://www.eea.europa.eu/publications/progress-of-eu-transport-sector-1 (accessed on 8 August 2020).
- Helmers, E.; Leitão, J.; Tietge, U.; Butler, T. CO2-equivalent emissions from European passenger vehicles in the years 1995–2015 based on real-world use: Assessing the climate benefit of the European “diesel boom”. Atmos. Environ. 2019, 198, 122–132. [Google Scholar] [CrossRef]
- Teixeira, A.C.R.; Sodré, J.R. Impacts of replacement of engine powered vehicles by electric vehicles on energy consumption and CO2 emissions. Trans. Res. Part D Trans. Environ. 2018, 59, 375–384. [Google Scholar] [CrossRef]
- Hooftman, N.; Messagie, M.; Van Mierlo, J.; Coosemans, T. A review of the European passenger car regulations—Real driving emissions vs local air quality. Renew. Sustain. Energy Rev. 2018, 86, 1–21. [Google Scholar] [CrossRef]
- Japan Population. 2019. Available online: http://worldpopulationreview.com/countries/japan-population/ (accessed on 23 November 2019).
- Yagi, M.; Managi, S. Demographic determinants of car ownership in Japan. Transp. Policy 2016, 50, 37–53. [Google Scholar] [CrossRef]
- Portugal-Pereira, J.; Esteban, M. Implications of paradigm shift in Japan’s electricity security of supply: A multi-dimensional indicator assessment. Appl. Energy 2014, 123, 424–434. [Google Scholar] [CrossRef]
- United Nations Reform: Priority Issues for Japan. Available online: https://www.mofa.go.jp/policy/un/reform/priority.html (accessed on 1 February 2020).
- Universal Periodic Review Japan. Available online: https://www.ohchr.org/EN/HRBodies/UPR/Pages/JPIndex.aspx (accessed on 1 February 2020).
- Orecchini, F.; Santiangeli, A.; Zuccari, F. Hybrid-electric system truth test: Energy analysis of Toyota Prius IV in real urban drive conditions. Sustain. Energy Technol. Assess. 2020, 37, 100573. [Google Scholar] [CrossRef]
- Prokhorov, D.V. Toyota Prius HEV neurocontrol and diagnostics. Neural Netw. 2008, 21, 458–465. [Google Scholar] [CrossRef] [PubMed]
- Iwata, K.; Matsumoto, S. Use of hybrid vehicles in Japan: An analysis of used car market data. Trans. Res. Part D Trans. Environ. 2016, 46, 200–206. [Google Scholar] [CrossRef]
- Mishina, Y.; Muromachi, Y. Are potential reductions in CO2 emissions via hybrid electric vehicles actualized in real traffic? The case of Japan. Trans. Res. Part D Trans. Environ. 2017, 50, 372–384. [Google Scholar] [CrossRef]
- Paladugu, B.S.K.; Grau, D. Toyota Production System—Monitoring Construction Work Progress with Lean Principles. In Encyclopedia of Renewable and Sustainable Materials, 1st ed.; Hashmi, S., Choudhury, I.A., Eds.; Elsevier: Amsterdam, The Netherlands, 2020; Volume 5, pp. 560–565. [Google Scholar]
- Augustyn, K. Forecasts of Electricity Demand in Poland in the Period to 2015—Optimization Role of Business Intelligence. Available online: https://depot.ceon.pl/handle/123456789/9989 (accessed on 27 January 2020).
- Tucki, K.; Orynycz, O.; Świć, A.; Mitoraj-Wojtanek, M. The Development of Electromobility in Poland and EU States as a Tool for Management of CO2 Emissions. Energies 2019, 12, 2942. [Google Scholar] [CrossRef]
- Nævestad, T.O.; Størkersen, K.V.; Laiou, A.; Yannis, G. Framework conditions of occupational safety: Comparing Norwegian maritime cargo and passenger transport. Int. J. Trans. Sci. Technol. 2018, 7, 291–307. [Google Scholar] [CrossRef]
- Popova, O.; Gorev, A.; Shavyraa, C. Principles of modern route systems planning for urban passenger transport. Trans. Res. Procedia 2018, 36, 603–609. [Google Scholar] [CrossRef]
- Türe, Y.; Türe, C. An assessment of using Aluminum and Magnesium on CO2 emission in European passenger cars. J. Clean. Prod. 2020, 247, 119120. [Google Scholar] [CrossRef]
- Number of U.S. Aircraft, Vehicles, Vessels, and Other Conveyances. Available online: https://www.bts.dot.gov/content/number-us-aircraft-vehicles-vessels-and-other-conveyances (accessed on 23 November 2019).
- Report: Vehicles in Use—Europe. 2018. Available online: https://www.acea.be/uploads/statistic_documents/ACEA_Report_Vehicles_in_use-Europe_2018.pdf (accessed on 8 August 2020).
- The Automobile Industry Pocket Guide 2018–2019. Available online: https://www.acea.be/uploads/publications/ACEA_Pocket_Guide_2018-2019.pdf (accessed on 8 August 2020).
- Automobile Inspection & Registration Information Association. Available online: https://www.airia.or.jp/publish/statistics/number.html (accessed on 23 November 2019).
- Japan Automobile Manufacturers Association (JAMA). Available online: http://jamaserv.jama.or.jp/newdb/eng/index.html (accessed on 23 November 2019).
- GMS Regional Information Portal. Available online: https://portal.gms-eoc.org/charts/overview/vehicle-motorization-index (accessed on 1 February 2020).
- International Organization of Motor Vehicle Manufacturers. Available online: http://www.oica.net/world-vehicles-in-use-all-vehicles-2/ (accessed on 1 February 2020).
- Transport Statistics at Regional Level. Statistics Explained. Available online: https://ec.europa.eu/eurostat/statistics-explained/pdfscache/14273.pdf (accessed on 1 February 2020).
- Andrzejczak, K. Changes in the growth rate of passenger cars saturation. Wiad. Stat. Pol. Stat. 2012, 11, 22–34. [Google Scholar]
- Jamroz, K. Modelling motorization index at national level. Zeszyty Naukowo-Techniczne Stowarzyszenia Inżynierów i Techników Komunikacji w Krakowie 2012, 2, 111–120. [Google Scholar]
- Crude Oil Prices—70 Year Historical Chart. Available online: https://www.macrotrends.net/1369/crude-oil-price-history-chart (accessed on 23 November 2019).
- International Council on Clean Transport. Available online: https://theicct.org/publication-type/reports (accessed on 23 November 2019).
- The Motor Industry of Japan. 2019. Available online: https://www.jama.org/the-motor-industry-of-japan-2019/ (accessed on 23 November 2019).
- U.S. Light-Duty Advanced Technology Vehicle (ATV) Sales (2011–2019). Available online: https://autoalliance.org/energy-environment/advanced-technology-vehicle-sales-dashboard/ (accessed on 23 November 2019).
- International Energy Agency. Nordic EV Outlook. 2018. Available online: https://www.nordicenergy.org/wp-content/uploads/2018/05/NordicEVOutlook2018.pdf (accessed on 1 February 2020).
- Gnat, S. Prediction of Weekly Magazines Sale—Choosen Aproach. Studia i Prace Wydziału Nauk Ekonomicznych i Zarządzania / Uniwersytet Szczeciński 2008, 2, 97–108. [Google Scholar]
- Iwanejko, R.; Bajer, J. Application of mathematical models for prognosing the failures in water supply systems—The Krakow case study. Czas. Tech. Śr. 2012, 109, 19–148. [Google Scholar]
- Sroka, W.; Musiał, W. Multifarious forecasts concerning the use of mineral fertilizers in Poland in 2014–2025. J. Agribus. Rural Dev. 2015, 2, 291–302. [Google Scholar] [CrossRef]
- Holden, P. Territory, geoeconomics and power politics: The Irish government’s framing of Brexit. Polit. Geogr. 2020, 76, 102063. [Google Scholar] [CrossRef]
- Shaw, D.; Smith, C.M.; Scully, J. From Brexit to Article 50: Applying Critical Realism to the design and analysis of a longitudinal causal mapping study. Eur. J. Oper. Res. 2019, 276, 723–735. [Google Scholar] [CrossRef]
- Prescott, C.; Pilato, M.; Bellia, C. Geographical indications in the UK after Brexit: An uncertain future? Food Policy 2020, 90, 101808. [Google Scholar] [CrossRef]
- The Society of Motor Manufacturers and Traders (SMMT). Brexit. Available online: https://www.smmt.co.uk/industry-topics/brexit/ (accessed on 1 February 2020).
- Alamerew, Y.A.; Brissaud, D. Modelling reverse supply chain through system dynamics for realizing the transition towards the circular economy: A case study on electric vehicle batteries. J. Clean. Prod. 2020, 254, 120025. [Google Scholar] [CrossRef]
- Zhou, Y.; Wen, R.; Wang, H.; Cai, H. Optimal battery electric vehicles range: A study considering heterogeneous travel patterns, charging behaviors, and access to charging infrastructure. Energy 2020, 116945, in press. [Google Scholar] [CrossRef]
- Wang, Y.N. Power Battery Performance Detection System for Electric Vehicles. Procedia Comput. Sci. 2019, 154, 759–763. [Google Scholar] [CrossRef]
- Bellocchi, S.; Klöckner, K.; Manno, M.; Noussan, M.; Vellini, M. On the role of electric vehicles towards low-carbon energy systems: Italy and Germany in comparison. Appl. Energy 2019, 255, 113848. [Google Scholar] [CrossRef]
- Palkowski, K. Electric Car and Atmosphere Protection. Rocz. Ochr. Srodowiska Ann. Set Environ. Prot. 2016, 18, 628–639. [Google Scholar]
- Kosowski, K.; Tucki, K.; Piwowarski, M.; Stępień, R.; Orynycz, O.; Włodarski, W.; Bączyk, A. Thermodynamic Cycle Concepts for High-Efficiency Power Plans. Part A: Public Power Plants 60+. Sustainability 2019, 11, 554. [Google Scholar] [CrossRef]
- Mikielewicz, D.; Kosowski, K.; Tucki, K.; Piwowarski, M.; Stepien, R.; Orynycz, O.; Wlodarski, R. Gas Turbine Cycle with External Combustion Chamber for Prosumer and Distributed Energy Systems. Energies 2019, 12, 3501. [Google Scholar] [CrossRef]
- Tucki, K.; Orynycz, O.; Wasiak, A.; Swic, A.; Wichlacz, J. The Impact of Fuel Type on the Output Parameters of a New Biofuel Burner. Energies 2019, 12, 1383. [Google Scholar] [CrossRef]
- Dołęga, W. Ecology in Manufacturing. Available online: https://www.cire.pl/pliki/2/wytwarzanieenergiiaakologia.pdf (accessed on 23 November 2019).
- Meratizaman, M.; Monadizadeh, S.; Sardasht, M.T.; Amidpour, M. Techno economic and environmental assessment of using gasification process in order to mitigate the emission in the available steam power cycle. Energy 2015, 83, 1–14. [Google Scholar] [CrossRef]
- Kosowski, K.; Domachowski, Z.; Próchnicki, W.; Kosowski, A.; Stępień, R.; Piwowarski, M.; Włodarski, W.; Ghaemi, M.; Tucki, K.; Gardzilewicz, A.; et al. Steam and Gas Turbines with the Examples of Alstom Technology, 1st ed.; Alstom: Saint-Quen, France, 2007; ISBN 978-83-925959-3-9. [Google Scholar]
- Chmielniak, T. Technologie Energetyczne; Wydawnictwo Politechniki Śląskiej: Warrenton, OR, USA, 2008; pp. 230–560. (In Polish) [Google Scholar]
- Bejan, A. Advanced Engineering Thermodynamics; John Wiley & Sons: Hoboken, NJ, USA, 2016; pp. 394–460. [Google Scholar]
- Kotowicz, J.; Brzęczek, M. Analysis of increasing efficiency of modern combined cycle power plant: A case study. Energy 2018, 153, 90–99. [Google Scholar] [CrossRef]
- BP Statistical Review of World Energy. 2019. Available online: https://www.bp.com/content/dam/bp/business-sites/en/global/corporate/pdfs/energy-economics/statistical-review/bp-stats-review-2019-full-report.pdf (accessed on 8 August 2020).
- Latõšov, E.; Volkova, A.; Siirde, A.; Kurnitski, J.; Thalfeldt, M. Primary energy factor for district heating networks in European Union member states. Energy Procedia 2017, 116, 69–77. [Google Scholar] [CrossRef]
- Wilby, M.R.; González, A.B.R.; Díaz, J.J.V. Empirical and dynamic primary energy factors. Energy 2014, 73, 771–779. [Google Scholar] [CrossRef]
- Schicktanz, M.D.; Wapler, J.; Henning, H.H. Primary energy and economic analysis of combined heating, cooling and power systems. Energy 2011, 36, 575–585. [Google Scholar] [CrossRef]
- Data and Statistics. Explore Energy Data by Category, Indicator, Country or Region. Available online: https://www.iea.org/data-and-statistics (accessed on 1 February 2020).
- Final Report. Evaluation of Primary Energy Factor Calculation Options for Electricity. Available online: https://ec.europa.eu/energy/sites/ener/files/documents/final_report_pef_eed.pdf (accessed on 8 August 2020).
- Directive of the European Parliament and of the Council amending Directive 2012/27/EU on energy efficiency. Available online: https://www.actu-environnement.com/media/pdf/news-27990-directive-efficacite-energetique.pdf (accessed on 8 August 2020).
- Bukrejewski, P.; Skolniak, M.; Kowalski, L. Comparison of the environmental effect of M1 category vehicles fed with traditional and alternative fuels. Arch. Automot. Eng. 2017, 75, 5–21. [Google Scholar]
- Commission Delegated Regulation (EU) 2015/2402 of 12 October 2015 Reviewing Harmonised Efficiency Reference Values for Separate Production of Electricity and Heat in Application of Directive 2012/27/EU of the European Parliament and of the Council and repealing Commission Implementing Decision 2011/877/EU. Available online: https://eur-lex.europa.eu/eli/reg_del/2015/2402/oj (accessed on 8 August 2020).
- 2030 Climate and Energy Framework. Available online: https://ec.europa.eu/clima/policies/strategies/2030_en (accessed on 8 January 2020).
- Strategic Energy Plan. Available online: https://www.enecho.meti.go.jp/en/category/others/basic_plan/ (accessed on 8 January 2020).
- Center for Climate and Energy Solutions. Available online: https://www.c2es.org/content/renewable-energy (accessed on 8 January 2020).
- Wasiak, A. Modeling Energetic Efficiency of Biofuels Production. Green Energy and Technology, 1st ed.; Springer Nature Switzerland: Cham, Switzerland, 2018; pp. 29–47. ISBN 978-3-319-98430-8. [Google Scholar] [CrossRef]
- Wasiak, A.; Orynycz, O. Formulation of a model for energetic efficiency of agricultural subsystem of biofuel production. In Proceedings of the 2014 IEEE International Energy Conference, Cavtat, Croatia, 13–16 May 2014; pp. 1333–1337. Available online: https://ieeexplore.ieee.org/document/6850586 (accessed on 29 November 2019).
- Wasiak, A.; Orynycz, O. The effects of energy contributions into subsidiary processes on energetic efficiency of biomass plantation supplying biofuel production system. Agric. Agric. Sci. Procedia 2015, 7, 292–300. [Google Scholar] [CrossRef]
- Wasiak, A.; Orynycz, O. The Effect of Transportation Choices on Energetic Effectivenes of Rapeseed Plantation. IX International Scientific Symposium Farm Machinery and Processes Management in Sustainable Agriculture 2017, 400–405. Available online: https://depot.ceon.pl/handle/123456789/14763 (accessed on 29 November 2019).
- Orynycz, O.; Świć, A. The Effects of Material’s Transport on Various Steps of Production System on Energetic Efficiency of Biodiesel Production. Sustinability 2018, 10, 2736. [Google Scholar] [CrossRef]
- Climate for Poland—Poland for Climate: 1988–2018–2050. Available online: https://cop24.gov.pl/news/news-details/news/climate-for-poland-poland-for-climate-1988-2018-2050/ (accessed on 8 August 2020).
- Plötz, P.; Funke, S.A.; Jochem, P. The impact of daily and annual driving on fuel economy and CO2 emissions of plug-in hybrid electric vehicles. Trans. Res. Part A Policy Pract. 2018, 118, 331–340. [Google Scholar] [CrossRef]
- Lin, W.Y.; Hsiao, M.C.; Wu, P.C.; Fu, J.S.; Lai, L.W.; Lai, H.C. Analysis of air quality and health co-benefits regarding electric vehicle promotion coupled with power plant emissions. J. Clean. Prod. 2020, 247, 119152. [Google Scholar] [CrossRef]
- Pearce, P.; Johnston, V. A new fast lane or just a roadblock? Mitigating road transport GHG emissions under Australia’s Emissions Reduction Fund. Environ. Plan. Law J. 2016, 33, 181–202. [Google Scholar]
- Hunter, T.S. Offshore Petroleum Drilling and Risk. A Study of Proposed Deep-Sea Exploration Drilling in Commonwealth Regulated Waters of the Great Australian Bight. Available online: https://www.greenpeace.org.au/wp/wp-content/uploads/2019/05/Professor-Soliman-Hunter-GAB-Report-April-2019.pdf (accessed on 27 June 2020).
- Federal Highway Administration. Average Annual Miles per Driver by Age Group. Available online: https://www.fhwa.dot.gov/ohim/onh00/bar8.htm (accessed on 23 November 2019).
- Japan’s Used Cars Are Newer with Lower Mileage. Available online: https://integrityexports.com/japan-car-auction-academy/why-cars-from-japan/japans-used-cars-are-newer-with-lower-mileage/ (accessed on 23 November 2019).
- Average Lifespan for U.S. Vehicles. Available online: https://berla.co/average-us-vehicle-lifespan/ (accessed on 23 November 2019).
- Japan Automobile Manufacturers Association (JAMA). Motor Vehicle Statistics of Japan. Available online: http://www.jama-english.jp/publications/industry.html (accessed on 23 November 2019).
- Tucki, K.; Mruk, R.; Orynycz, O.; Wasiak, A.; Botwińska, K.; Gola, A. Simulation of the Operation of a Spark Ignition Engine Fueled with Various Biofuels and Its Contribution to Technology Management. Sustainability 2019, 11, 2799. [Google Scholar] [CrossRef]
- European Vehicle Market Statistics, 2018/2019. Available online: https://theicct.org/publications/european-vehicle-market-statistics-20182019 (accessed on 23 November 2019).
- Den Tonkelaar, W.A.M. CAR Smog: System for on-line extrapolation from hourly measurements to concentrations along standard roads within cities. Sci. Total Environ. 1996, 189–190, 423–429. [Google Scholar] [CrossRef]
- Frankowski, J. Attention: Smog alert! Citizen engagement for clean air and its consequences for fuel poverty in Poland. Energy Build. 2020, 207, 109525. [Google Scholar] [CrossRef]
- Reducing Pollution with Electric Vehicles. Available online: https://www.energy.gov/eere/electricvehicles/reducing-pollution-electric-vehicles (accessed on 23 November 2019).
- Moćko, W.; Ornowski, O.; Szymańska, S. Estimation of energy consumption of electric vehicle during road driving test. Zeszyty Problemowe Maszyny Elektryczne 2013, 2, 31–35. Available online: http://www.komel.katowice.pl/ZRODLA/FULL/99/ref_05.pdf (accessed on 8 January 2020).

| Parameter | Description | Unit |
|---|---|---|
| k | smoothing constant equal to the number of consecutive expressions of the time series | - |
| i | segmental equation number (i = l, ..., N − k + 1) | - |
| ai,bi | evaluation of the parameters of the i-th segmental equation | |
| fi(t) | smoothed (theoretical) value for the period t obtained from the i-th segment equation | - |
| Yt | the value of the forecast in period t | - |
| YN | the smoothed value of the forecast variable | - |
| the smoothed value of the trend increment of the forecast variables | - | |
| N | number of words of the time series of the forecast variables | - |
| VT | point prediction error | - |
| Wr | Theil’s discrepancy coefficient | - |
| Ei | quantity of electricity produced from the given source in the year in the country | [MWh] |
| Ec | total quantity of electricity produced in the year in the country | [MWh] |
| ηi | efficiency of primary energy conversion into electricity for the respective fuel | [%] |
| Type of System | Fuel | Efficiency [%] | Emission Coefficients [g/kWh] | ||||
|---|---|---|---|---|---|---|---|
| CO2 | CO | NOx | SO2 | Dust | |||
| Steam power plant | Coal | 34 | 1034 | 0.18 | 3.13 | 19.9 | 1.41 |
| Natural gas | 31 | 651 | 0.09 | 3.04 | 0 | 0.05 | |
| Gas turbine block | Natural gas | 38 | 532 | 0.3 | 0.5 | 0 | 0.04 |
| Kind of Primary Energy | Solid Fuels | Gas Fuels | Liquid Fuels | Nuclear Fuel | Renewable Energy Sources |
|---|---|---|---|---|---|
| Efficiency | 38.9% | 43.0% | 33.9% | 33.0% | 100.0% |
| Distance [km/year] | Period of Use [years] | |
|---|---|---|
| EU | 23,639.69 | 20.31 |
| US | 21,687.56 | 17.62 |
| Japan | 9300.00 | 12.91 |
| CO2 Emission Factor [kg/kWh] | |||
|---|---|---|---|
| EU | US | Japan | |
| 2010 | 501.15 | 529.92 | 577.88 |
| 2011 | 490.24 | 594.45 | 556.56 |
| 2012 | 480.31 | 620.21 | 531.61 |
| 2013 | 473.39 | 625.79 | 533.42 |
| 2014 | 470.49 | 628.10 | 528.44 |
| 2015 | 446.32 | 592.15 | 497.14 |
| 2016 | 423.49 | 571.71 | 472.19 |
| 2017 | 408.20 | 558.69 | 457.67 |
| Avoided Emissions [thousand tonnes] | Additional Emissions [thousand tonnes] | |||||
|---|---|---|---|---|---|---|
| EU | US | Japan | EU | US | Japan | |
| 2010 | 29,451 | 1994 | 5925 | 14,206 | 1935 | 5897 |
| 2011 | 47,474 | 105,019 | 27,172 | 22,062 | 96,917 | 26,105 |
| 2012 | 120,951 | 412,410 | 68,307 | 53,263 | 362,031 | 66,671 |
| 2013 | 321,165 | 970,375 | 116,917 | 139,410 | 851,197 | 111,647 |
| 2014 | 534,977 | 1,683,452 | 171,267 | 228,747 | 1,462,883 | 163,125 |
| 2015 | 1,170,973 | 2,343,927 | 212,769 | 471,331 | 1,900,218 | 197,183 |
| 2016 | 1,499,694 | 3,187,182 | 254,328 | 574,613 | 2,433,557 | 232,322 |
| 2017 | 2,502,919 | 3,803,375 | 296,882 | 922,341 | 2,778,997 | 267,304 |
| 2018 | 3,099,789 | 4,450,027 | 339,446 | 1,106,378 | 3,223,574 | 304,281 |
| 2019 | 4,315,720 | 5,096,686 | 382,010 | 1,529,564 | 3,679,789 | 341,699 |
| 2020 | 5,125,305 | 5,743,338 | 424,574 | 1,803,432 | 4,132,652 | 378,937 |
| 2021 | 6,155,468 | 6,389,997 | 467,139 | 2,149,948 | 4,582,087 | 415,993 |
| 2022 | 7,532,924 | 7,036,649 | 509,703 | 2,611,182 | 5,028,002 | 452,860 |
| 2023 | 8,855,955 | 7,683,308 | 552,267 | 3,046,024 | 5,470,321 | 489,535 |
| 2024 | 10,459,466 | 8,329,960 | 594,831 | 3,569,014 | 5,908,953 | 526,013 |
| 2025 | 12,008,579 | 8,976,619 | 637,395 | 4,064,299 | 6,343,822 | 562,290 |
| 2026 | 13,838,149 | 9,623,271 | 679,959 | 4,644,509 | 6,774,837 | 598,361 |
| 2027 | 15,613,327 | 10,269,930 | 722,525 | 5,195,600 | 7,201,922 | 634,223 |
| 2028 | 17,668,980 | 10,916,582 | 765,088 | 5,828,257 | 7,624,985 | 669,870 |
| 2029 | 19,670,222 | 11,563,241 | 807,652 | 6,430,280 | 8,043,950 | 705,298 |
| 2030 | 21,951,944 | 12,209,894 | 850,216 | 7,044,401 | 8,423,596 | 738,533 |
© 2020 by the authors. Licensee MDPI, Basel, Switzerland. This article is an open access article distributed under the terms and conditions of the Creative Commons Attribution (CC BY) license (http://creativecommons.org/licenses/by/4.0/).
Share and Cite
Tucki, K.; Orynycz, O.; Mitoraj-Wojtanek, M. Perspectives for Mitigation of CO2 Emission due to Development of Electromobility in Several Countries. Energies 2020, 13, 4127. https://doi.org/10.3390/en13164127
Tucki K, Orynycz O, Mitoraj-Wojtanek M. Perspectives for Mitigation of CO2 Emission due to Development of Electromobility in Several Countries. Energies. 2020; 13(16):4127. https://doi.org/10.3390/en13164127
Chicago/Turabian StyleTucki, Karol, Olga Orynycz, and Mateusz Mitoraj-Wojtanek. 2020. "Perspectives for Mitigation of CO2 Emission due to Development of Electromobility in Several Countries" Energies 13, no. 16: 4127. https://doi.org/10.3390/en13164127
APA StyleTucki, K., Orynycz, O., & Mitoraj-Wojtanek, M. (2020). Perspectives for Mitigation of CO2 Emission due to Development of Electromobility in Several Countries. Energies, 13(16), 4127. https://doi.org/10.3390/en13164127


