1. Introduction
Energy efficiency improvement and the sustainable development of developing countries require a better understanding of the linkage between energy price and energy efficiency. China, as the first developing country in the world in terms of its size, has made great achievements in its economic development, while at the same time, its energy constraint problems become more and more serious. According to British Petroleum [
1], the volume of primary energy consumption in China reached 3273.5 mtoe by the end of 2018, which is the largest one in the world. The energy consumption per unit of GDP (i.e., energy intensity (the higher the energy intensity, the lower the energy efficiency)) in China in 2015 was 0.027 mtoe per 100 million US dollars, 1.48 times that of the world average level (data are from the World Bank and calculated by the authors). This statistic suggests that China’s energy efficiency is quite low. Thus, it would be of great importance to investigate the key determinants of energy efficiency in China. Energy price, which can directly influence energy efficiency through price adjustment mechanism and substitution effect of production factor, as well as indirectly affect energy efficiency through promoting technology advancement and optimizing industrial structure, is supposed to play an important role in the improvement of energy efficiency.
However, the extant research conclusions regarding the relationship between energy price and energy efficiency are relatively mixed in empirical studies. Most empirical studies show that energy price has a significant and positive impact on energy efficiency [
2,
3,
4,
5,
6]. Based on the panel data analysis of 10 major countries, He et al. [
4] found that energy prices have a significant and positive impact on energy efficiency. Through the analysis of Canadian industrial data, Gamtessa’s [
6] research shows that energy prices are an important factor driving energy efficiency, no matter from the perspective of the industry as a whole or different types of industrial sectors. In the research on China, Wu [
3], Huang [
5], and Fisher et al. [
2] obtained similar conclusions through empirical analysis of province- and firm-level data. Whereas, several research articles show that there are no significant effects of energy price on energy efficiency or there is a very weak effect [
7,
8,
9,
10]. Song and Zheng [
7] used China’s provincial panel data from 1995 to 2009 and found that the impact of energy prices on energy intensity is insignificant. Based on the service industry data of 18 OECD countries, Mulder et al. [
8] shows that energy prices and energy efficiency have an insignificant relationship in most of the sub-sectors. Farajzadeh and Nematollahi [
10] found that although energy prices can significantly reduce Iran’s energy intensity, the degree of influence is very limited. Similarly, the research of Yang et al. [
9] shows that the impact of energy prices on China’s energy intensity is the smallest among many factors. In addition, a few pieces of the studies reported that a significantly negative impact of energy price on energy efficiency was observed [
11].
The complicated and inconsistent effect of energy price on energy efficiency from the existing empirical literature can be more deeply understood from two different perspectives. On the one hand, energy prices may have heterogeneous effects on energy efficiency. For example, using 120 countries over the period 1980–2013 as the sample, Antonietti and Fontini [
11] found that the effect of oil price on energy efficiency was different for different geographical areas. On the other hand, there is a potential nonlinear relationship between the two. In other words, the influence of energy price on energy efficiency of an area is also related to other factors (e.g., economic development level). When these factors are in different value ranges, the effect is different. Unfortunately, as far as we are concerned, there has not been any attempt made to look at the price–efficiency linkage in a nonlinear manner.
In order to better understand the relationship between energy prices and China’s energy efficiency, the current paper evaluates the linear and nonlinear impact of energy price on energy efficiency, based on the data of 30 provinces in China over the period 2003–2017. We contribute to the empirical literature as follows: on the one hand, different from existing literature which focuses on the linear effects investigation, besides the analysis of the linear relationship, the current study examines the nonlinear impact by exploring the role of four factors (i.e., energy price distortion, environmental regulation, economic development level, and economic growth rate) in moderating the price–efficiency link based on the panel threshold regression model which can provide a deeper understanding of the relationship between them. On the other hand, the currents paper looks at the linear influence in a comprehensive manner. In terms of the linear impact analysis, besides the assessment of the full sample, taking into account the huge differences in the level of economic and social development between different regions of China, we examined the heterogeneous effects between different regions of China. Simultaneously, to the best of our knowledge, we are the first to investigate the difference in the impact of energy price at different energy efficiency levels using panel quantile regression model.
The results show that the impact of energy price on energy efficiency in China is positive in general. However, the impact is significantly positive in the central–western area of China, while insignificant in the eastern area. Meanwhile, the effect is higher in provinces with middle level of energy efficiency than those with high and low levels of energy efficiency and is insignificant in low energy efficiency regions. Finally, the nonlinear effect analysis reports that the impact effect with the rise of the environmental regulation level and the economic growth rate, while decreases lower with the ascent of the degree of energy price distortion and the economic development level. Particularly, when the value of a region’s economic development level and economic growth rate is within a certain range, the effect is not statistically significant.
The current paper is structured as below:
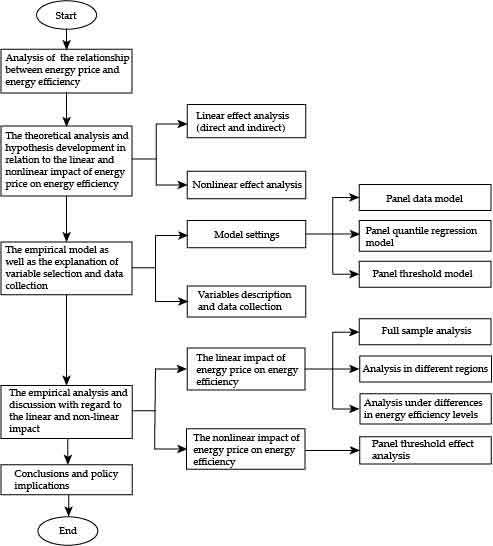
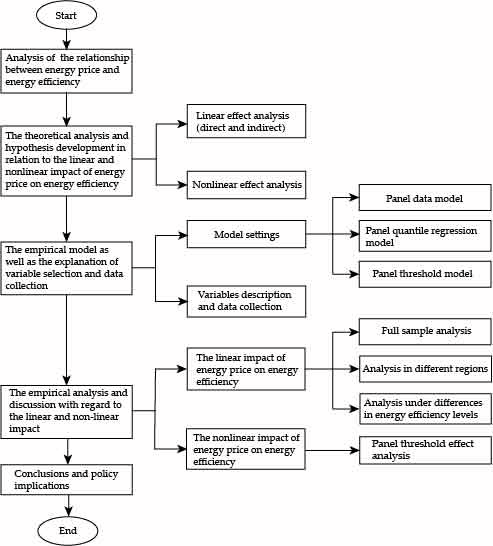
Section 2 provides the theoretical analysis in relation to the linear and nonlinear impact of energy price on energy efficiency.
Section 3 presents the empirical model as well as the explanation of variable selection and data collection.
Section 4 presents the empirical analysis and discussion with regard to the linear impact.
Section 5 provides the analysis and discussion in terms of the nonlinear relationship.
Section 6 summarizes and concludes the paper.
2. Theoretical Analysis and Hypothesis Development
According to the research content of this paper, the current paper first discusses the linear impact of energy price on energy efficiency from the theoretical perspective as well as puts forward research hypotheses, followed by the discussion and hypothesis development related to the nonlinear influence under the actual Chinese context.
2.1. Linear Effect of Energy Price on Energy Efficiency
In summary, energy prices can influence energy efficiency through the following direct and indirect impact channels which have a positive impact on the improvement of energy efficiency.
From the perspective of direct influence of energy price on energy efficiency, it can be explained by the demand–supply principle in economics. Energy, as a production factor, its quantity demanded is negatively related to the price level. That is, under the environment of perfect competition, an increase in energy price will reduce the quantity of energy demanded for the of whole society, which will further lead to a reduction in the volume of energy consumption. If we assume that the production efficiency of a social subject is consistent, the level of energy efficiency will increase. Therefore, the energy price can improve the level of energy efficiency though its price adjustment mechanism. In addition, a number of research studies show that there are substitute and complementary inter-relationships among capital, labor and energy [
12,
13,
14,
15,
16], and the substitute effect among different production factors can also explain the positive impact of energy price on energy efficiency [
4]. Theoretically, when there is an increase in the price level of one input factor, enterprises are more inclined to use other factors of production with relatively lower cost to replace this input factor in order to achieve the optimization of resource allocation and keep relatively higher levels of production capacity. Thus, with the rising price of energy, the cost of energy factor in the production process will increase; this will induce the enterprises to reduce the volume of energy consumption and orient to the use of labor and capital which can substitute the energy but with lower production costs, the purpose of which is to keep the volume of production unchanged. Therefore, under the assumption in economics that all the factors have the same marginal productivity, the positive influence of energy price on energy efficiency can be explained by the substitution effect among factors of production.
The energy price can positively affect energy efficiency indirectly through promoting technology advancement and optimizing industrial structure. At the moment, a great number of studies show that technology advancement can significantly improve energy efficiency [
12,
17,
18]. The rise of energy price will increase the production costs for the enterprises which use energy as one of the input factors, this will encourage enterprises to improve their technological level and accelerate energy-savings technological innovation. Therefore, energy price will influence energy efficiency in a positive way through technology advancement [
19]. Furthermore, the energy efficiency of a country or an area is closely related to the industrial structure. If the industrial structure of an area is dominated by energy-intensive industries (i.e., the dominated industries focus on secondary industries with high energy demand, in particular, the steel industry, non-ferrous metal, construction materials, chemical engineering), this will lead to excessive energy consumption per unit of output in the area, resulting in lower energy efficiency. A higher energy price indicates that the cost of consuming energy for enterprises will increase, more enterprises will turn to service industry or other industries with less intensive energy demand [
20]. The resulting structural adjustment effect can reduce the overall energy intensity of the area [
7], thereby promoting the improvement of energy efficiency. On the contrary, low energy prices will hinder the improvement of energy efficiency to a certain extent [
8,
21,
22].
Based on the above analysis, this paper proposes Hypothesis 1 as below:
Hypothesis 1 (H1). Energy prices have a significant and positive impact on China’s energy efficiency in general.
Although we expected energy prices to have a positive effect on China’s energy efficiency as a whole, the effects may be heterogeneous in different regions and at different energy efficiency levels. Specifically, as the eastern, central, and western regions of China are at different stages of economic development, the level of economic and social development varies greatly. As discussed in detail below, the industrial structure of regions at different stages of economic development differs significantly, the degree of dependence of economic development on energy consumption varies significantly, and the proportion of energy costs in enterprise production costs is also not the same. In this context, companies in different regions have significant differences in their motivation to reduce energy costs. Under the rise of energy prices, companies have different willingness to substitute energy factors in production and engage in technological innovation. Therefore, energy prices should have a heterogeneous effect on energy efficiency in different regions of China.
In addition, the regional differences in China’s energy efficiency are also very obvious, which is closely related to the different industrial structures in different regions. In addition, as a country transitioning from a planned economy to a market economy, China’s energy factor marketization is not high, and there are serious energy price distortions. Some scholars believe that energy price distortion is also an important factor affecting China’s energy efficiency [
23]. Therefore, regions with different energy efficiency levels in China may have significant differences in industrial structure and the degree of distortion of energy prices. This paper has already discussed in the previous section, because different industries have different levels of energy consumption dependence, there should be obvious differences in the effect of energy prices on energy efficiency in different regions under different industrial structures. In addition, in the following analysis, we found that in regions with different degrees of energy price distortions, the energy efficiency effects of energy prices were also different. Therefore, we believe that under the difference of energy efficiency levels, the impact of energy prices on energy efficiency was also heterogeneous.
In summary, this paper proposes the following Hypothesis 2 as follows:
Hypothesis 2 (H2). The impact of energy prices on China’s energy efficiency has heterogeneous effects in different regions and different energy efficiency levels.
2.2. Nonlinear Influence of Energy Price on Energy Efficiency
On top of the theoretical analysis of the linear impact, this subsection discusses the nonlinear influence considering the actual context in China with a number of issues, such as low degree of energy marketization which is the result of the Chinese market economy transitioned from the planned economy, and difference in the level of environmental regulation and economic development among different areas. More specifically, the current paper discusses the moderating roles played by degree of energy price distortion, level of environmental regulation, economic development, and economic growth on the relationship between energy price and energy efficiency.
Energy price distortion. We first discuss the moderating mechanism of energy price distortion. For a long time, the marketization level of energy factors in China was not high, the government regulated the price to a different extent on various energy products including electricity, petroleum, and gas, this incomplete energy pricing mechanism resulted in energy price distortion in China [
23,
24,
25,
26,
27]. Under these circumstances of energy price distortion, resource allocation cannot be optimized, and this will lead to misallocation of resources and losses in economic efficiency [
25,
26,
27,
28,
29,
30]. Distortion of China’s energy prices allow companies to obtain production factors at lower costs [
23,
26]. In regions where the degree of energy price distortion is higher, energy prices are depressed more severely, and the function of energy prices as a signal of energy scarcity will be weakened more obviously. The resulting serious resource misallocation problems make enterprises in the production process have ample space for the use of energy factors and room for profit; enterprises will increasingly lack motivation to reduce energy costs. Therefore, in regions with higher energy price distortions, the factor substitution effect, innovation promotion effect, and industrial structure optimization effect caused by energy price changes will be greatly reduced, and the final positive impact on energy efficiency will also be significantly weakened. We expect that compared to the areas with higher degrees of energy price distortion, the positive influence of energy price on energy efficiency will be more significant in the areas with lower degrees of energy price distortion.
Environmental regulation. Environmental regulation is a collection of mandatory or spontaneous environmental protection actions taken by the government and other organizations [
31]. Currently, the environmental regulation is the key factor paid attention to by the existing research in analyzing the determinants of energy efficiency [
32,
33,
34,
35]; it is supposed that it plays a moderating role in the price–efficiency relationship. More specifically, in the areas with higher levels of environmental regulation, the government and other organizations usually implement more stringent resource and environmental protection measures through administrative orders or market mechanisms. The scarcity of resources and energy and the cost of environmental damage will also be more fully reflected in these areas. In the process of production and operation of enterprises, there would be relatively higher costs in resource and environmental protection. Therefore, compared with areas with low levels of environmental regulation, enterprises in areas with high levels of environmental regulation have already assumed higher resource and environmental costs, and further increases in energy prices have prompted enterprises in these areas to accelerate technological innovation and have a stronger willingness to shift themselves to the industries with a lower energy consumption demand. Therefore, the promotion effect on energy efficiency improvement will be more obvious. Therefore, we expect that compared to the areas with lower levels of environmental regulation, there would be a more significant and positive influence in the areas with higher environmental regulation stringencies.
The level of economic development. Third, the current paper argues that the price–efficiency relationship is related to the level of economic development in the area. There was a huge difference in economic development levels among different provinces, there is a significance difference in the degree of dependency on energy for the areas undergoing different stages of industrialization in the process of economic development. The Kuznets hypothesis believes that an inverted U-shape relationship of “first increase and then decrease” exists between energy consumption and economic development level for one country or one area; this relationship has been confirmed comprehensively by other empirical studies [
36,
37,
38]. This is mainly due to the fact that when a country or region has a low level of economic development, industries that rely heavily on energy dominate the economic structure. As the level of economic development improves, its industrial structure will gradually shift from industry-led to service-led, and its dependence on energy will also weaken. Therefore, compared to the areas with lower levels of economic development, the production activities in the areas with higher ones will have lower degrees of reliance on energy, and the energy cost accounts for a small proportion in the enterprises’ total production costs (i.e., enterprises in the service industry). Since energy costs do not play a dominant role in the production costs of enterprises, changes in energy prices will have relatively little impact on the production, operation, and innovation activities of enterprises in areas with higher economic development levels, the effect of price adjustment, factor substitution, technological progress, and industrial restructuring derived from an increase in energy price is not significant. We expect that a less significant influence will be exhibited as the level of economic development increases.
Economic growth rate. Finally, the current paper thinks that the relationship between energy price and energy efficiency is correlated with the economic growth rate of the area. The existing research shows that economic growth has a significant pulling effect on energy consumption [
39]. Simultaneously, by investigating the relationship between clean energy consumption and GDP, CO
2 emissions, and GDP during business cycle frequencies, respectively, Yan [
40] and Doda [
41] found that both energy consumption and emissions are procyclical. What’s more, they have verified that both energy consumption and emissions are cyclically more volatile than GDP. This means that when a region is in a period of rapid growth (that is, the stage of economic expansion), the demand for energy consumption by enterprises will not only increase [
42] but will also show an accelerated increase rate. In this context, the energy cost of enterprises is rising rapidly, and the rise in energy prices has triggered an increase in the willingness of enterprises to accelerate technological innovation which, in turn, has a more obvious effect on the improvement of energy efficiency. In addition, Chang et al. [
43] took the OECD countries from 1997 to 2006 as the analysis object. The analysis based on the panel threshold model shows that the impact of energy prices on renewable energy development has a threshold effect on GDP growth rate. That is, when a country’s GDP growth rate is higher than 4.13%, energy prices have a significant and positive impact on renewable energy development. When the GDP growth rate is lower than 4.13%, there was no significant relationship between them. The author believes that this was because, compared with countries with lower economic growth rates, during the process of rising energy prices, countries with higher economic growth rates had an economic surplus through which the allocation of resource could support the renewable energy development; this will reduce the negative influence of the increase in the costs on economic growth. Similarly, compared with regions with lower economic growth rates, regions with higher economic growth rates in China promote energy-saving technological innovation and the development of renewable energy in the process of resource allocation, thereby they have higher ability and stronger willingness to reduce the energy cost increase. Therefore, the effect of rising energy prices on energy efficiency is becoming more obvious in areas with higher economic growth. To sum up, we expect that there will be a more significant effect of the positive impact of energy price on energy efficiency in the area with a high level of economic growth.
Based on the above discussion of the nonlinear relationship between energy price and energy efficiency, this paper proposes Hypothesis 3 as below:
Hypothesis 3 (H3). Environmental regulations and economic growth rate play a positive moderating role in the price–efficiency relationship, and energy price distortion and economic development level play a negative moderating role in the price–efficiency link.
3. Research Design
3.1. Model Settings
3.1.1. Model Settings for Linear Effect Analysis
According to the existing research of Huang et al. [
5] and Gu et al. [
44], the current study used data from 30 provinces in China over the period 2003–2017 to examine the linear effect of energy price on energy efficiency; the model is express as below (as all the variables in Equation (1) except energy intensity and energy price are in the form of proportion or index, the current paper only performed the logarithmic transformation for energy intensity and energy price):
In the model, EI represents energy intensity which can be regarded as the inverse of energy efficiency; EP is the core independent variable standing for energy price; the control variables include IS, ER, RD, and FDI, representing industrial structure, environmental regulation, research and development (R&D) investment, and foreign direct investment (FDI); i and t represent a specific province in a specific year, u is introduced in the model specification to control the province-specific fixed effect, the disturbance term is represented by ε.
In order to investigate whether there exist differences in terms of the effect for different levels of efficiencies, the current study further used the quantile regression (QR) approach to estimate the elasticity of energy efficiency with respect to energy price by distributing energy efficiency in various quantiles. In the panel data analysis, Koenker [
45] introduced the panel QR models with fixed effect to address the issue of unobserved individual heterogeneity which is wieldy applied in empirical studies [
46,
47,
48]. Combining the current study, the model can be expressed as follows:
where,
τ stands for quantile,
represents the conditional distribution function of the logarithm of energy intensity given explanatory variables with
τth quantile.
are vectors of independent variables including energy price, industrial structure, environmental regulation, R&D input, and FDI. The regression parameter of the
τth quantile
can be estimated as followed:
where
K is the number of quantiles;
is the loss function;
Wk is the weight corresponding to
kth quantile which controls the proportion of different quantile levels in the estimation of fixed-effect model; and
λ is the adjustment coefficient.
However, Powell [
49] argues that the additive fixed-effect QR model of Koenker [
45] estimates the distribution of
instead of estimating the distribution of
which would not offer the evidence of heterogeneity. Since the observations at the top of
distribution may be at the bottom of the ln
EIit distribution [
50]. The non-additive fixed-effect QR model introduced by Powell [
49] can address this issue, and the estimator of which performs well in simulations. Therefore, the non-additive fixed-effect QR model was employed to capture the impact of energy price on energy efficiency for different quantiles of efficiencies, following the studies of Behera and Dash [
50] and Elheddad et al. [
51].
3.1.2. Model Settings for Nonlinear Effects Analysis
As discussed previously, the influence of energy price on energy efficiency may be related to the degree of energy price distortion, level of environmental regulation, stage of economic development, and speed of economic growth. In other words, there should be a threshold effect of energy price on energy efficiency based on these four factors. Therefore, this subsection will examine the nonlinear effect through panel threshold model put forward by Hansen [
52].
First, the current paper uses the degree of energy price distortion as the threshold variable to look at the nonlinear relationship between the two variables. Under the consideration of single threshold effect (the panel threshold regression model with multiple thresholds can be extended accordingly. Please see Hansen [
52] for details), we establish the model as below:
In the model, I(·) is the indicative function; Dist represents the degree of energy price distortion which is the threshold variable; γ stands for the threshold value, for any possible threshold values, the estimated coefficient of the threshold variable and the sum of squared residuals estimated by the regression model can be obtained. Finally, the threshold can be determined by seeking the smallest sum of squared residuals, that is, .
Similarly, we use environmental regulation (ER), level of economic development (ED), and economic growth rate (EG) as the threshold variables to further evaluate the nonlinear linkage between energy price and energy efficiency; the models are expressed below:
3.2. Variables Description
In this subsection, the current paper will introduce the estimation of the dependent variable energy efficiency and then the measurement of the independent variables (including the core independent variable energy price and the control variables). Finally, the method of measuring the four threshold variables selected in this paper is described in the analysis of nonlinear effects.
3.2.1. The Measurement of the Dependent Variable
In summary, the previous research mainly used two indicators to measure energy efficiency including the single-factor energy efficiency and the total-factor energy efficiency. The former only considers energy as the input factor in the production process and it is mainly measured by the reciprocal of energy intensity. In comparison, the latter includes labor and capital in the measurement, and it is calculated as the target energy input divides by the actual input required for a given output [
4,
53,
54,
55]. Although the total factor energy efficiency more comprehensively considers the contributions and substitution effects of other factors of production other than energy and it is more related to the realistic economic production, its measurement involves the input factors such as labor, capital and efficiency, as well as output variables including both desirable outputs and undesirable outputs. There is an issue of difficulty in effectively separating the energy factor from labor and capital if energy is used as an input in energy efficiency estimation model [
56,
57,
58,
59], Therefore, its measurement results cannot well highlight the characteristics of energy. In comparison, energy intensity does not consider other production factors, it can reflect the definition of energy efficiency in a better and clearer manner, and also it has the advantage of easy calculation. Therefore, the current paper selects energy intensity to reflect the level of energy efficiency following He et al. [
4], Antonietti and Fontini [
11], and Pan et al. [
60]. To ensure the comparability of the data, in the calculation of energy intensity for different provinces, this article adjusts it to the actual value of constant prices in 1999. In addition, energy intensity is an inverse indicator, that is, the higher of the energy consumption per unit of GDP in an area, the lower of its energy efficiency.
3.2.2. The Measurement of Independent Variables
Energy price. Due to the fact that there are many kinds of energy sources, based on the consideration of data availability, the current study considers coal, petroleum, gas, and electricity as the four main energy products, following studies of Ouyang and Sun [
26] and Ouyang et al. [
23], and evaluate the comprehensive price levels through weighting the price levels of these four kinds of energy products based on the proportion of various types of energy consumption. In terms of the concrete construction steps of China’s comprehensive energy price, please refer to Tao et al. [
61] and Ouyang et al. [
23]. Additionally, this article adjusts the energy price to the actual value of constant prices in 1999.
Industrial structure. In the analysis related to the influencing factors of energy efficiency, industrial structure in one of the determinants considered by the existing empirical studies [
8,
21]. Among the biggest three industries in the economy, because the production activities in the secondary industry have a higher degree of reliance on energy, many energy-intensive industries are distributed in the secondary industry. Therefore, the greater the proportion of the secondary industry in the national economy, the more energy is consumed per unit of economic output. The industrial structure in the current study is measured by the ratio of the added value of the secondary industry to GDP [
27] and expect that its influence on energy intensity is positive.
Environmental regulation. The influence of this on energy efficiency is complicated. The enterprises’ investment in managing pollution will be increased by a strict environmental regulation which leads to a reduction in production investment and, therefore, it will have a negative impact on output; whereas, enhancing environmental regulation will form a forceful mechanism through which to motivate the enterprises to improve technology innovation [
62,
63] and further improve energy efficiency. With regard to the measurement of environmental regulation for Chinese provinces, the current paper follows Pan et al. [
55] to use two indicators including the ratio of industrial pollution management investment in industrial added value and the percentage of total investment in environmental pollution control in GDP. Meanwhile, the current paper integrates these two indicators into an environmental regulation index, from which to reflect comprehensively the environmental regulation intensity in various areas. Specific steps are as follows:
First, the current paper uses a Z-score to standardize the above two indicators: . In the equation, is the original value of the indicator j in a specific province i operating at the year t. and stand for mean and standard deviation over the sample period for the indicator j; is the standardized value of the indicator. Thereafter, we summed the equal weight standardized indicators to obtain the environmental regulation index ER.
Research and development investment. This is also an important factor that explains energy efficiency. Through an increase in the investment in this, enterprises can increase the efficiency of equipment through which to increase production capacity. This will also be helpful in reducing the production costs including energy input and further improve energy efficiency [
2,
5,
17,
64]. Following the existing literature [
2,
65,
66], the current study used the ratio of research and development expenses to GDP in the province as the indicator for the level of investment in research and development.
Foreign direct investment. Academic studies have engaged in a large amount of research investigating the influence of FDI on energy efficiency, while the results are not consistent. On the one hand, the spillover effect of FDI introduces advanced technologies and concepts, through which the energy conservation is promoted, and pollution emission is reduced, thereby improving the country’s ability to sustain development, thus reducing energy intensity and promoting energy efficiency [
5,
67,
68]. However, the improvement in energy efficiency may cause a rebound effect, that is, higher levels of energy efficiency will accelerate growth, meanwhile, it will increase the utility of natural resources, consume lots of energy, and cause greater pollution. This energy rebound effect offsets the energy conservation [
69,
70]. This argument is supported by Elliott et al. [
67] and Pan et al. [
55]. The current study uses the ratio of FDI to GDP to measure the level of FDI in every province [
71]. The amount of FDI will be converted to Renminbi (RMB) based on the exchange rate.
3.2.3. The Measurement of Threshold Variables
As discussed previously, the current study selected four threshold variables to analyze the threshold impact of energy price on energy efficiency. Since the measurement of environmental regulation level was already explained in the previous section, we focus now on the discussion related to the measurement of energy price distortion, economic development level, and economic growth rate.
Energy price distortion. The factor price distortion can be defined as the deviation of factor price level from the opportunity cost because of market imperfection; this will further lead to non-optimal allocation of production factors including price distortions of production factors such as capital, labor, and energy [
72]. Because the marketization level of China’s energy factor lags relatively behind, many empirical studies have investigated the economic influence of energy price distortion [
23,
25,
26,
27]. In the empirical analysis, there are several ways to measure the degree of distortion of production factors including the methods of production function, frontier technology analysis, shadow price calculation, and computable general equilibrium. Following Hsieh and Klenow [
25] and Tan et al. [
27], the degree of energy price distortion in every province is measured by the method of production function. The essence of this method is to estimate the level of energy price distortion through the comparison between the marginal output of a factor and the actual price of the factor. It has the advantage of clear definition and easy implementation. The estimation has the following steps:
First, assume that every province engages in the production activity according to the Cobb–Douglas production function; then, the production function of each province in different years can be expressed as:
Among which, Y represents output, A is the total factor productivity, K, L, and E stand for labor, capital, and energy investment, respectively.
In the measurement of indicators, we measured output using the provincial GDP, and estimated the capital stock to characterize the capital investment base from Zhang [
73] based on the perpetual inventory method. Labor investment and energy investment can be measured by the number of employees and the amount of energy consumption for a specific province by the end of the year. Meanwhile, the current study adjusts the provincial GDP and capital stock to the actual value of constant prices in 1999.
We took the logarithm for both sides of Equation (8), under the fixed-effect model estimation (The Hausman test results suggested that the FE specification was more suitable than RE specification), we obtained the energy output elasticity— equals to 0.622—and further we were able to obtain the energy marginal output using the formula: .
Finally, according to the definition of energy price distortion, we also considered the calculation of energy price illustrated earlier. We can work out the measurement method of energy price distortion as
. If the value of Dist equals to 1, it indicates the actual energy price equals to the marginal production revenue, and the energy price distortion does not exist. If the value of Dist is bigger than 1, it means that the average market price is higher than the actual price of the energy. If the value of Dist is smaller than 1, it indicates that the actual energy price is higher than one of the average market price. Our findings show that most provinces in China have a value of Dist bigger than 1, which reflects that the energy price level is relatively low, this is in line with the findings of most previous studies [
23,
29].
Level of economic development. The current study uses per capita GDP to measure this variable and adjust it to the actual value of constant price in 1999, following most previous studies [
74,
75].
Economic growth rate. The current study uses real GDP growth rate as the measurement of economic growth rate.
3.3. Data and Descriptive Statistics
Considering that many provinces in China had serious data missing problems in energy price, environmental regulations, and other indicators before 2003, the current paper examines the time period of 2003–2017. Due to the limited data in Tibet, Hong Kong, Macau, and Taiwan, the current paper selects 30 other provinces in China as the research focus.
There are different resources for the data, all the indicators were originally from the China Statistical Yearbook, China Energy Statistics Yearbook, China Industrial Economic Statistical Yearbook, China Science and Technology Statistical Yearbook, China Price Yearbook, China City (Town) Life, and Price Yearbook, The compilation of the third national industrial census in China in 1995 and also the statistical yearbook as well as energy statistical yearbook of every province. In terms of the missing data of specific indicators in specific province at a specific year, the current paper addresses this issue through linear interpolation.
Table 1 describes the statistics of the main indicators.
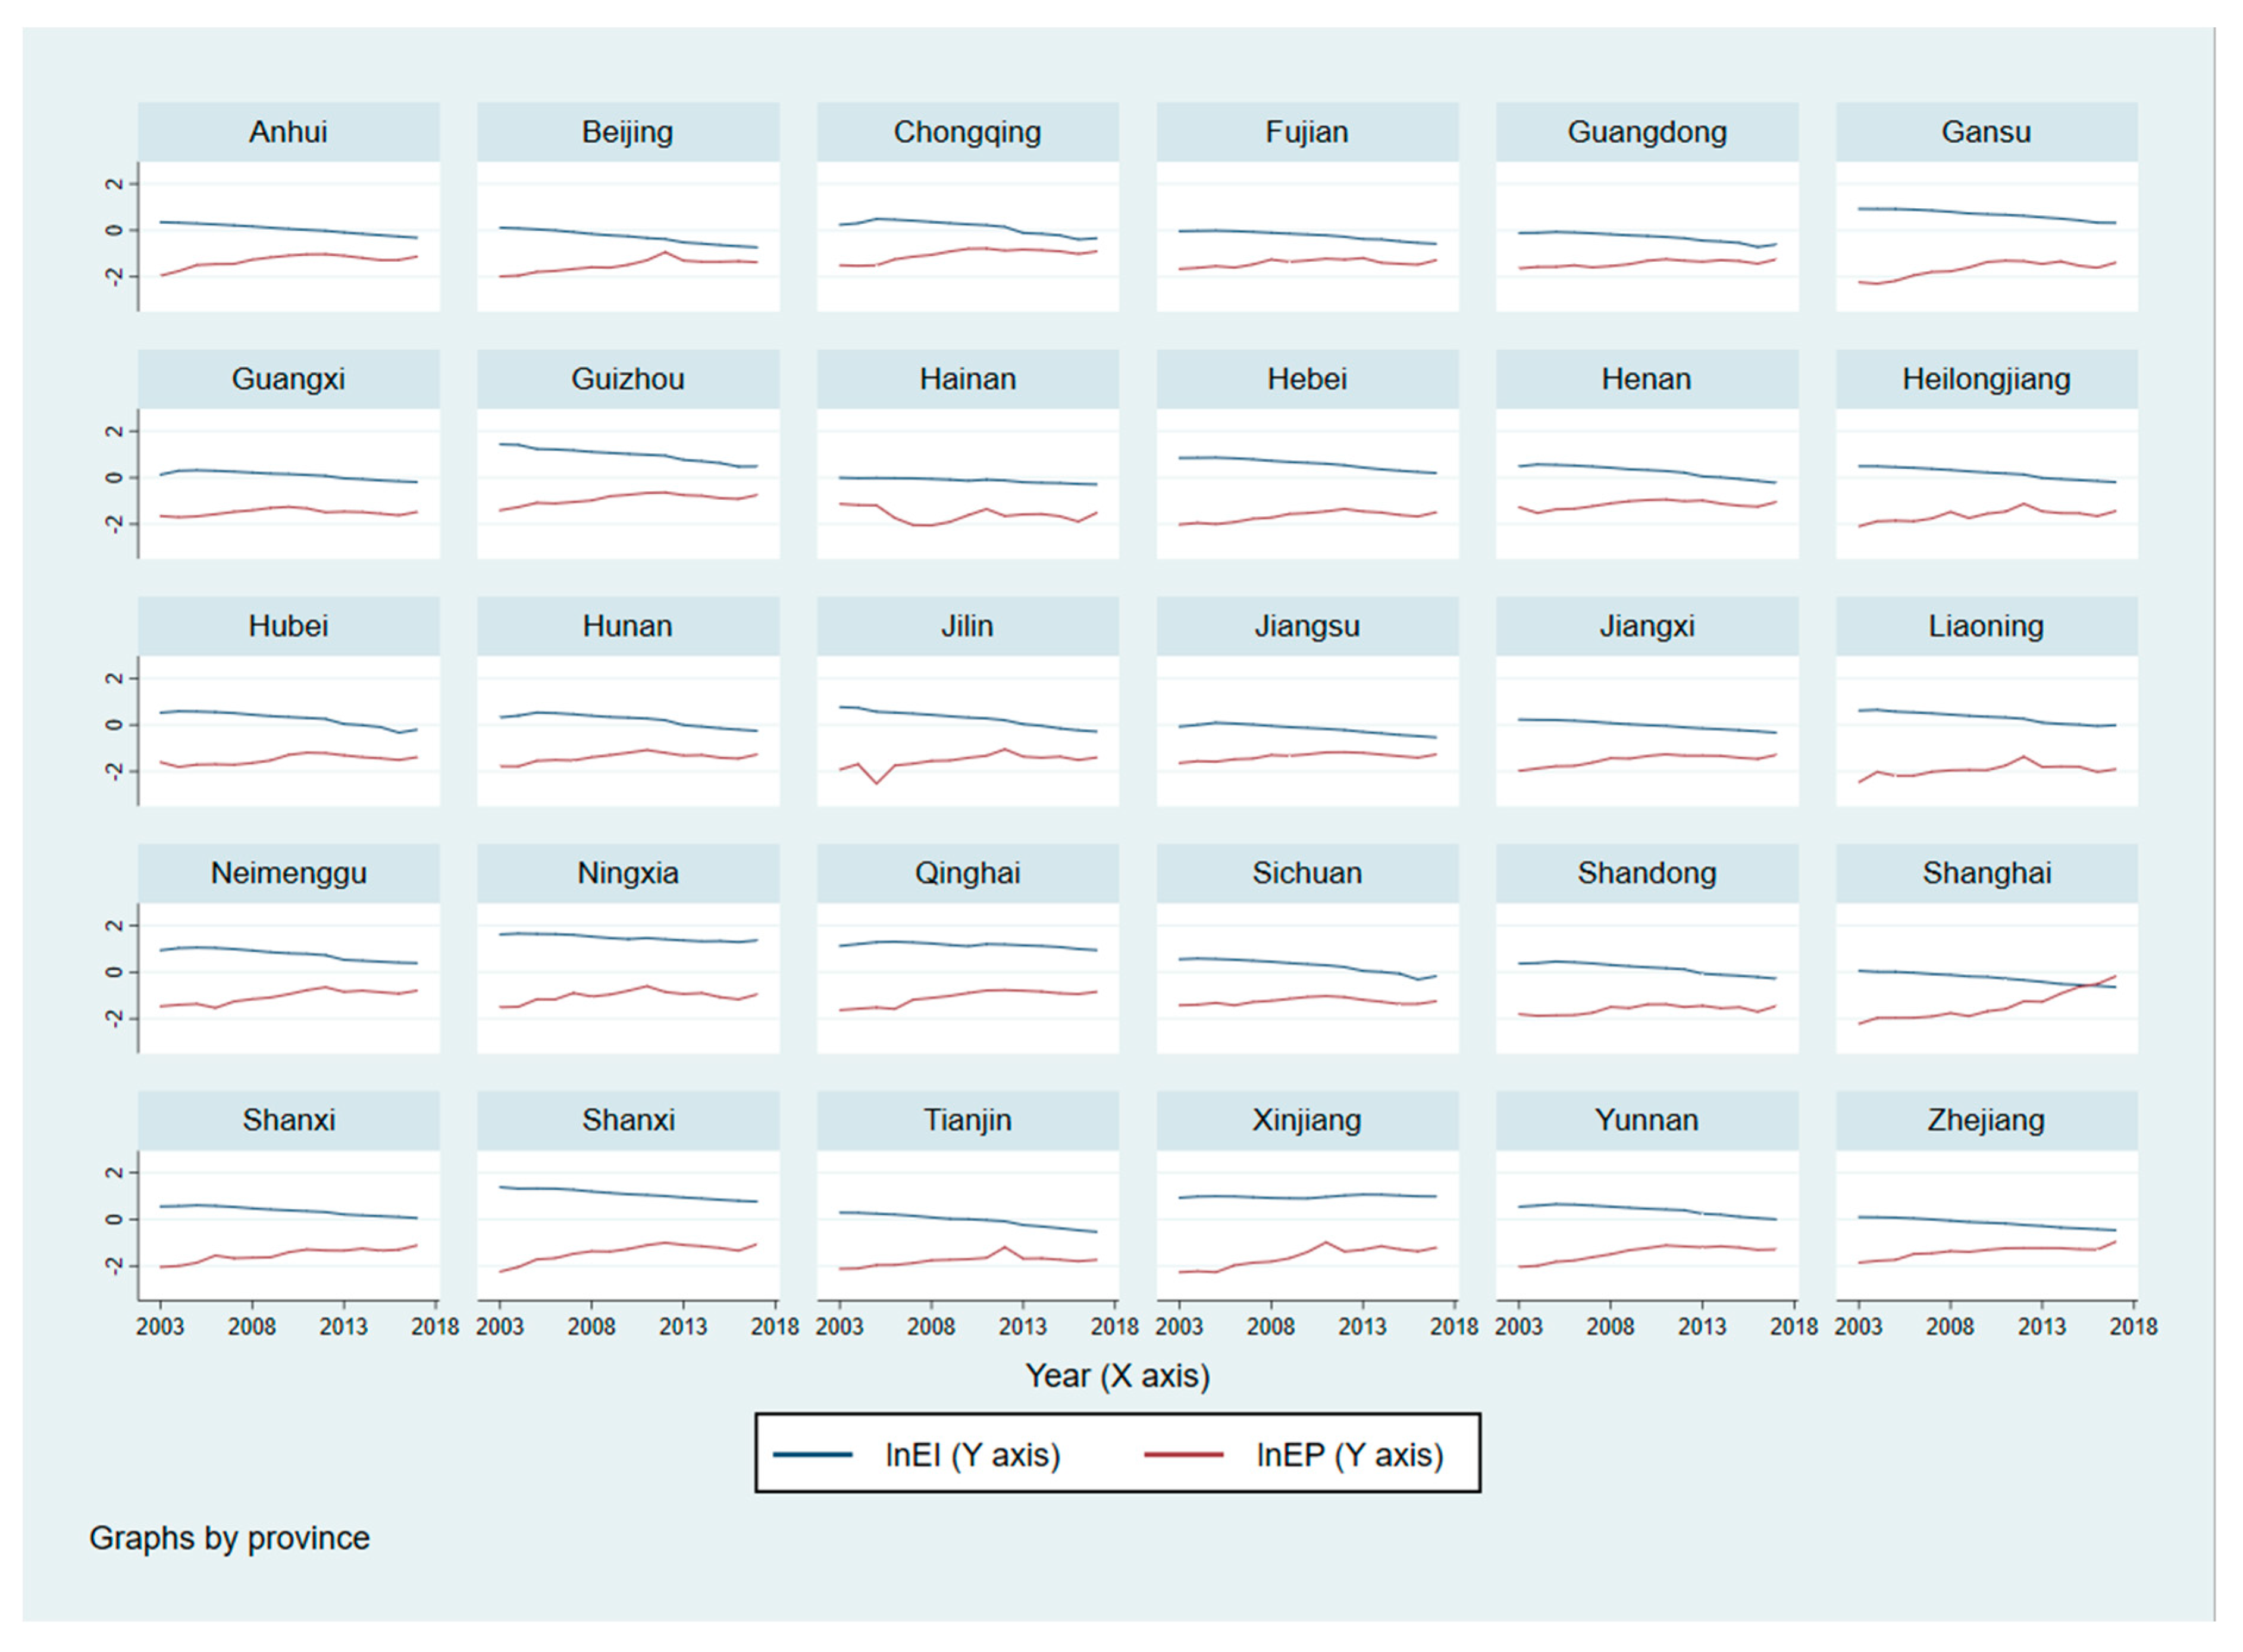
At the same time, this article draws a line chart of energy price and energy intensity in 30 provinces in China from 2003 to 2017, and in
Figure 1, it is shown that in most provinces, there is a trend of reverse changes, which intuitively reflects the negative correlation between China’s energy prices and energy intensity as a whole. In the next section, we will further engage in further investigations using econometric analysis.
4. Results and Discussion of the Linear Impact of Energy Price on Energy Efficiency
4.1. Full Sample Results
The current study initially estimates the impact of energy price on energy efficiency for the whole sample using Equation (1). In terms of the estimation strategy, the current paper uses both fixed- and random-effect models in order to control for province-individual effect, the results are reported in
Table 2.
The statistics from the column 2 and column 3 in
Table 2 show that at 1% significance level, the energy price exerts a significantly negative impact on energy intensity for both the fixed effect and random effect estimations. This means that higher levels of energy price facilitate the improvement of energy efficiency in China, this is in line with the findings of Wu [
3], He et al. [
4], and Gamtessa and Olani [
6]. Meanwhile, the results from the fixed-effect estimation show that the estimated coefficient of energy price was approximately 0.221 (A preference for the FE specification is shown based on the Hausman test, which is reported at the bottom of
Table 2); this suggests that a 1% change in the level of energy price will reduce per unit of GDP energy consumption by 0.221%.
In addition, in order to deal with the issues of biased estimation from the potential endogeneity derived from the bidirectional causality between energy price and energy efficiency, as well as, the unobserved variables not included the estimation framework, which may jointly affect the changes in energy price and energy efficiency, and measurement error of independent variables, the current study a used one-year lagged value of the core independent variable as the first instrument variable (that is, one-year lagged value of the log of energy price as the instrument variable) to further estimate the results under the fixed-effect instrumental variables (FE-IV) and random effect instrumental variables (RE-IV) following Wooldridge [
76]. The results from the Column 4 and 5 in
Table 2 report that the coefficient of energy price lnEP was still negative at a 10% significance level, further indicating that energy price exerts a significantly positive impact on energy efficiency. Simultaneously, as proposed by Lewbel [
77], the third-order centered moments of the log of energy price was chosen as the second instrument variable. In Column 6 and 7 in
Table 2, it is observed that the estimated coefficients of lnEP were still significant and negative under both the fixed-effect and random-effect instrumental variables models, which confirms the robustness of our estimation results.
In terms of the controlled variables, the estimated coefficients of industrial structure were significantly positive under different estimations strategies. This implies the higher proportion of the secondary industry in the national economy of an area, the larger its energy consumption intensity, which will have a negative impact on the improvement in energy efficiency. This is in line with Mulder et al. [
8] and Tan et al. [
27]. Concerning environmental regulation, its impact on energy efficiency in China was insignificant. Enhancing environmental regulation requires enterprises to spend more money on pollution management, less amount of funds will be available for production, the resulting decrease in the volumes of outputs will constrain the improvement of energy efficiency. However, strengthening environmental regulation reduces the enterprises’ energy consumption, the productivity can be achieved through higher levels of motivation derived from the forceful mechanism to improve technology, which will facilitate the improvement of energy efficiency. We argue that the impact of environmental regulation on energy efficiency is complex (that is, the influence can be both positive and negative); to a large extent this explains the overall insignificance of environmental regulation. The estimated coefficients of research and development investment as well as FDI are significantly negative, indicating that both of these two factors facilitate the improvement of energy efficiency. This is in accordance with Ma and Stern [
17] and Zeng et al. [
18]. This also reflects that increase in the volume of R&D as well as technology spillover from attracting FDI are helpful for energy efficiency improvement in China.
4.2. Results in Different Regions
Considering the huge differences in the level of economic and social development as well as the level of energy consumption among different areas in China, the current paper further analyzes the sub-samples including the western area, central area and eastern area, to see whether there are differences in the impact of energy price on energy efficiency for different areas (The area classification is based on the standard of the National Bureau of Statistics of China. For details, please visit [
78]). In the parameter estimation, the Hausman test reported at the bottom of
Table 3 shows that the eastern area and western area should use fixed-effect model, while the random effect model is suitable for the estimation on the central area. Then, we used the one-year lagged value of the log of energy price and the third-order centered moments of the log of energy price as the instrument variables to estimate the western area and eastern area through the fixed-effect instrumental variable model, and the random-effect instrumental variable model is used for the central area to check the robustness of the results.
The results from
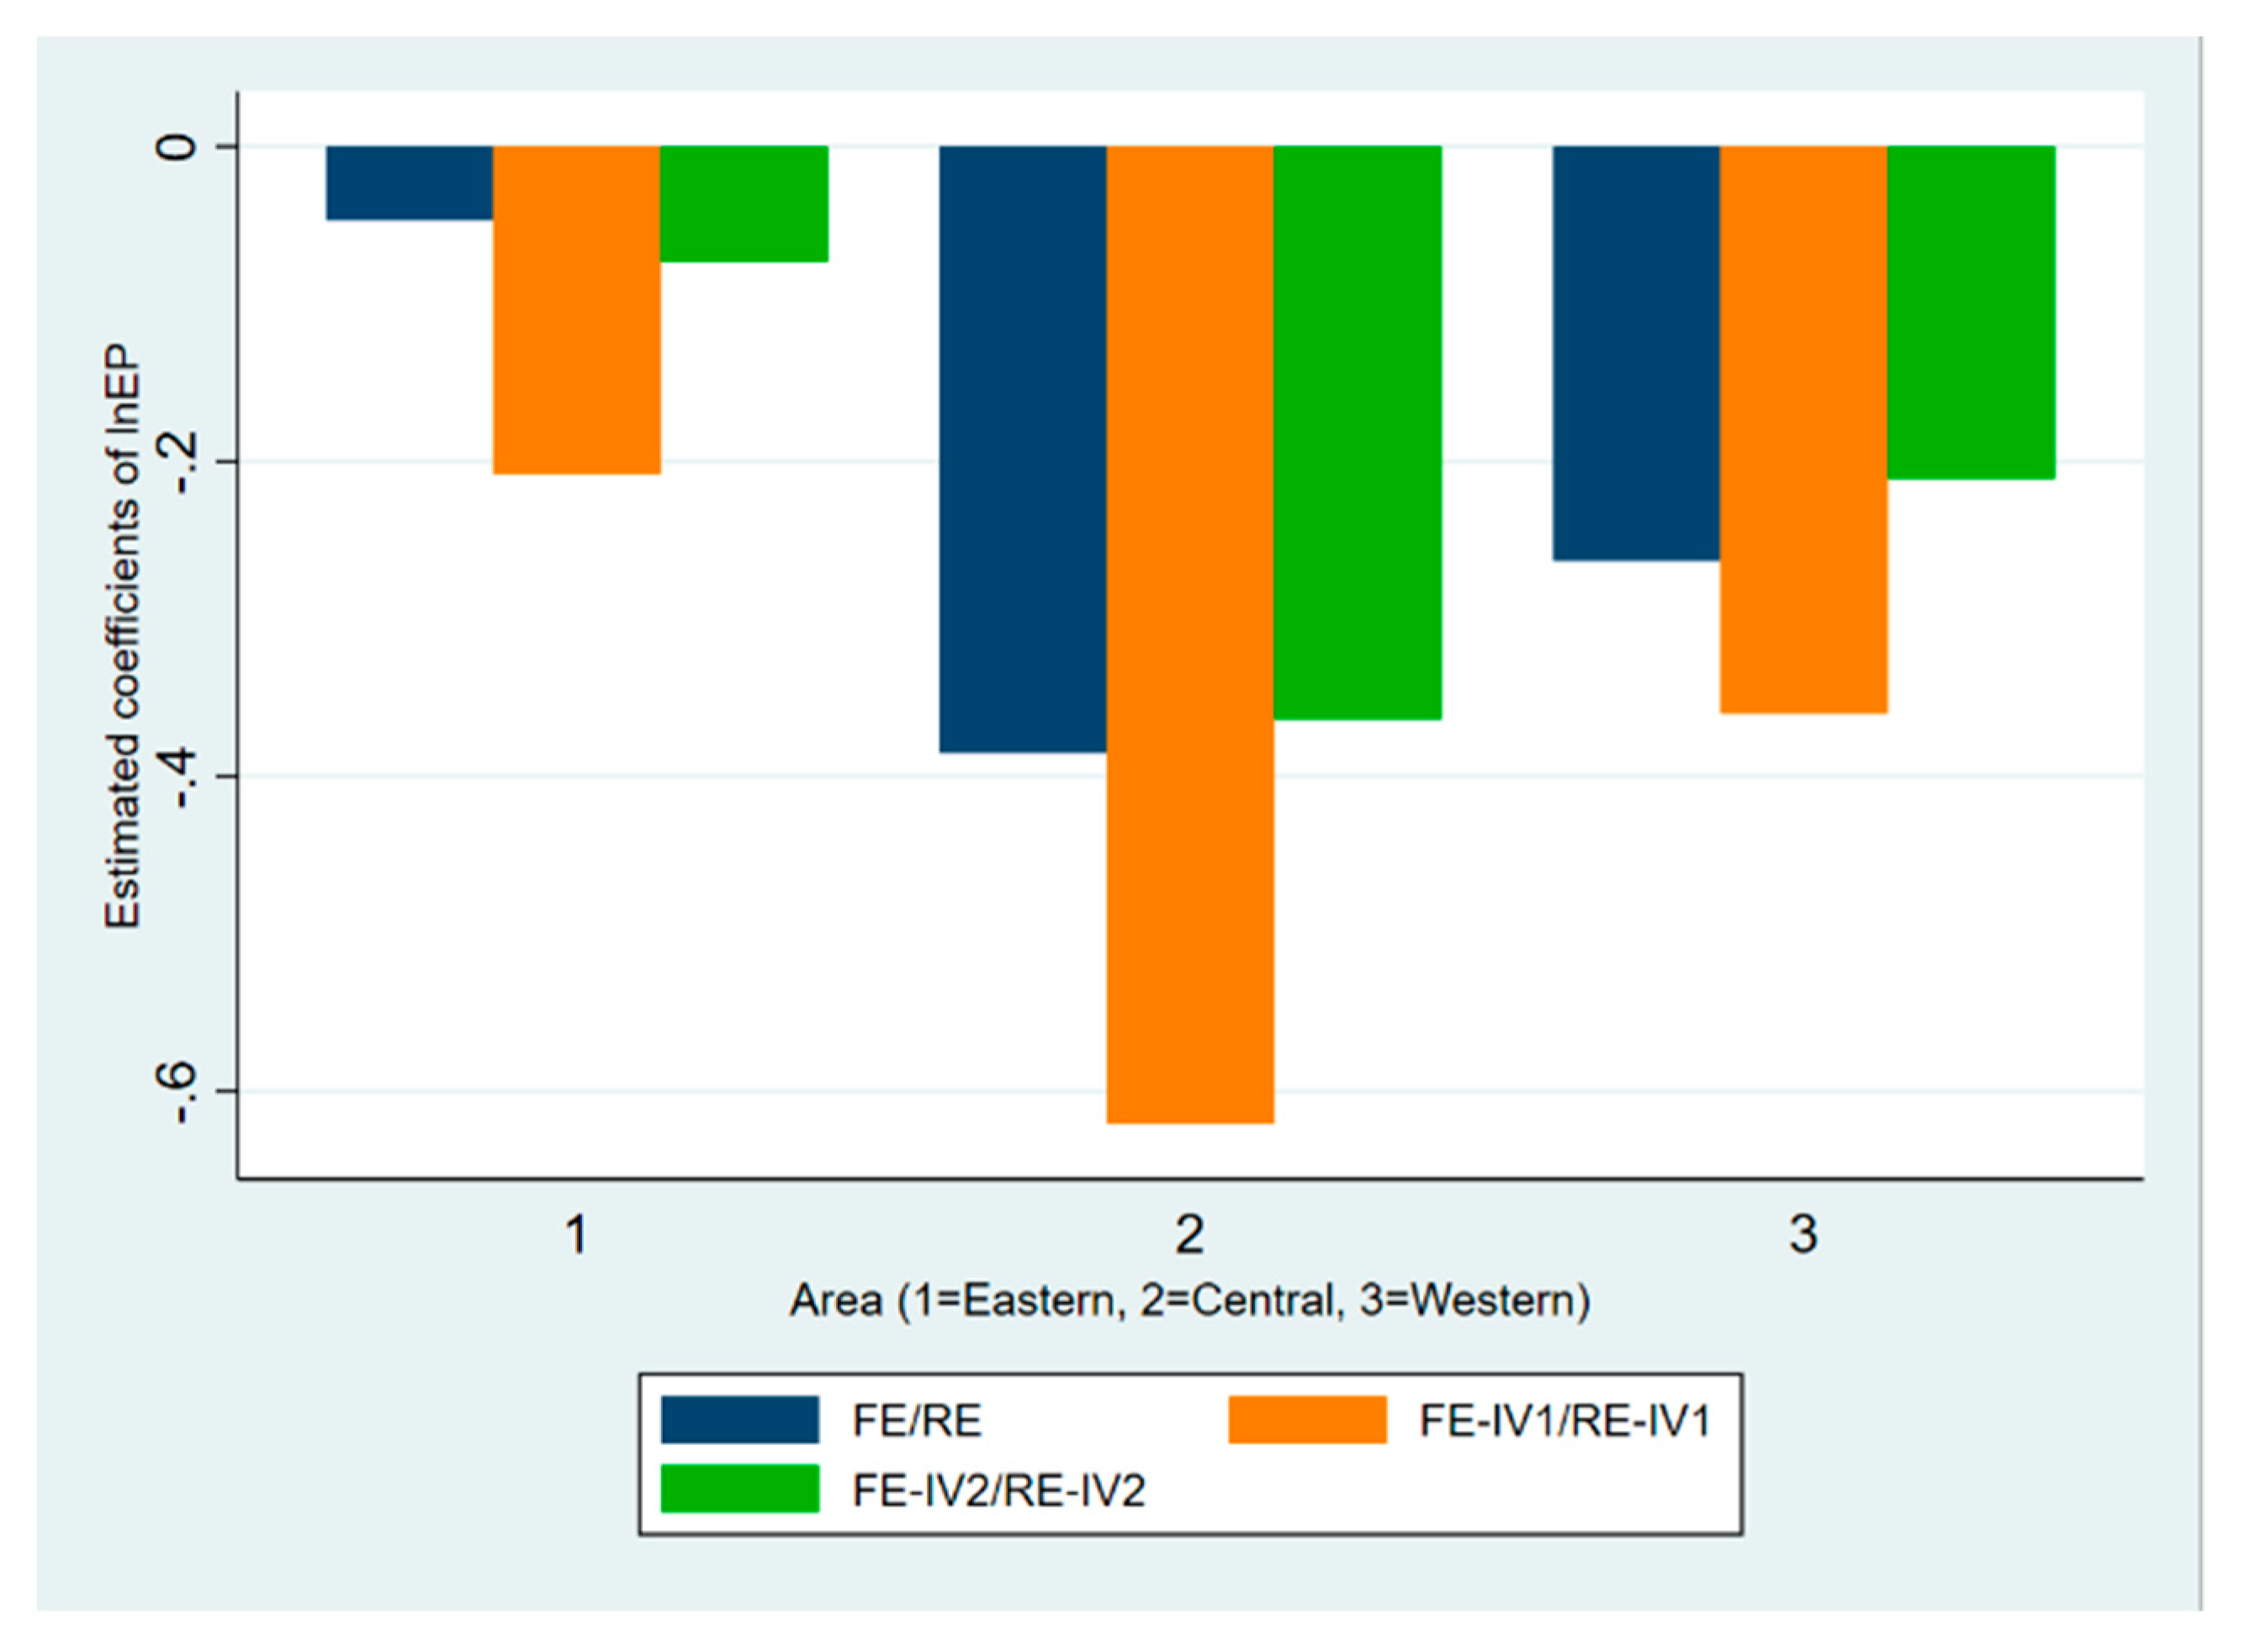
Table 3 show that the effect varies significantly between different areas of China. In terms of the western area, the results from all the fixed-effect model and two fixed-effect instrumental variables estimations with different instrument variables (i.e., the one-year lagged value of the log of energy price, the third-order centered moments of the log of energy price as the instrument variables) show that the estimated coefficient of lnEP is negative, indicating that there exists a significantly positive impact of energy price on energy efficiency in the western area of China. Concerning the central area, the findings from the random-effect estimation showed that energy price stimulates the improvement in energy efficiency, and the effects were still significant under the two random effect instrumental variables models, reflecting that the positive impact of energy price on energy efficiency in the central area was also robust. In terms of the eastern area, the estimated coefficients of lnEP were negative under different estimation methods. However, it was just statistically significant under the fixed-effect instrumental variables estimations, where the one-year lagged value of the log of energy price was selected as the instrument variable, indicating that the effect in the eastern area of China was insignificant in general.
It is observed in
Figure 2 that, compared to the eastern area, there was a clearer impact of energy price on energy efficiency in the western and central areas of China. This finding can be explained by the fact that the western and central areas have many more energy intensive industries compared to the eastern area where industrial structure focuses on the high technology industry and service industries; the energy intensive industries play an important role in the economic development of the central area and western area, the energy cost accounts for a large proportion of the production costs for the local enterprises in these areas, because of this, the facilitation effect of energy price on energy efficiency in the central and western areas becomes more significant.
4.3. Results under Differences in Energy Efficiency Levels
We previously analyzed the influence of energy price on energy efficiency for the whole sample as well as the sub-samples according to different areas; in this subsection, we are interested in examining whether there is a difference in the effect under differences in energy efficiency levels. Therefore, we estimated the parameters using the non-addictive fixed-effect panel quantile regression base on the Markov Chain Monte Carlo (MCMC) estimation method.
The findings from
Table 4 as well as
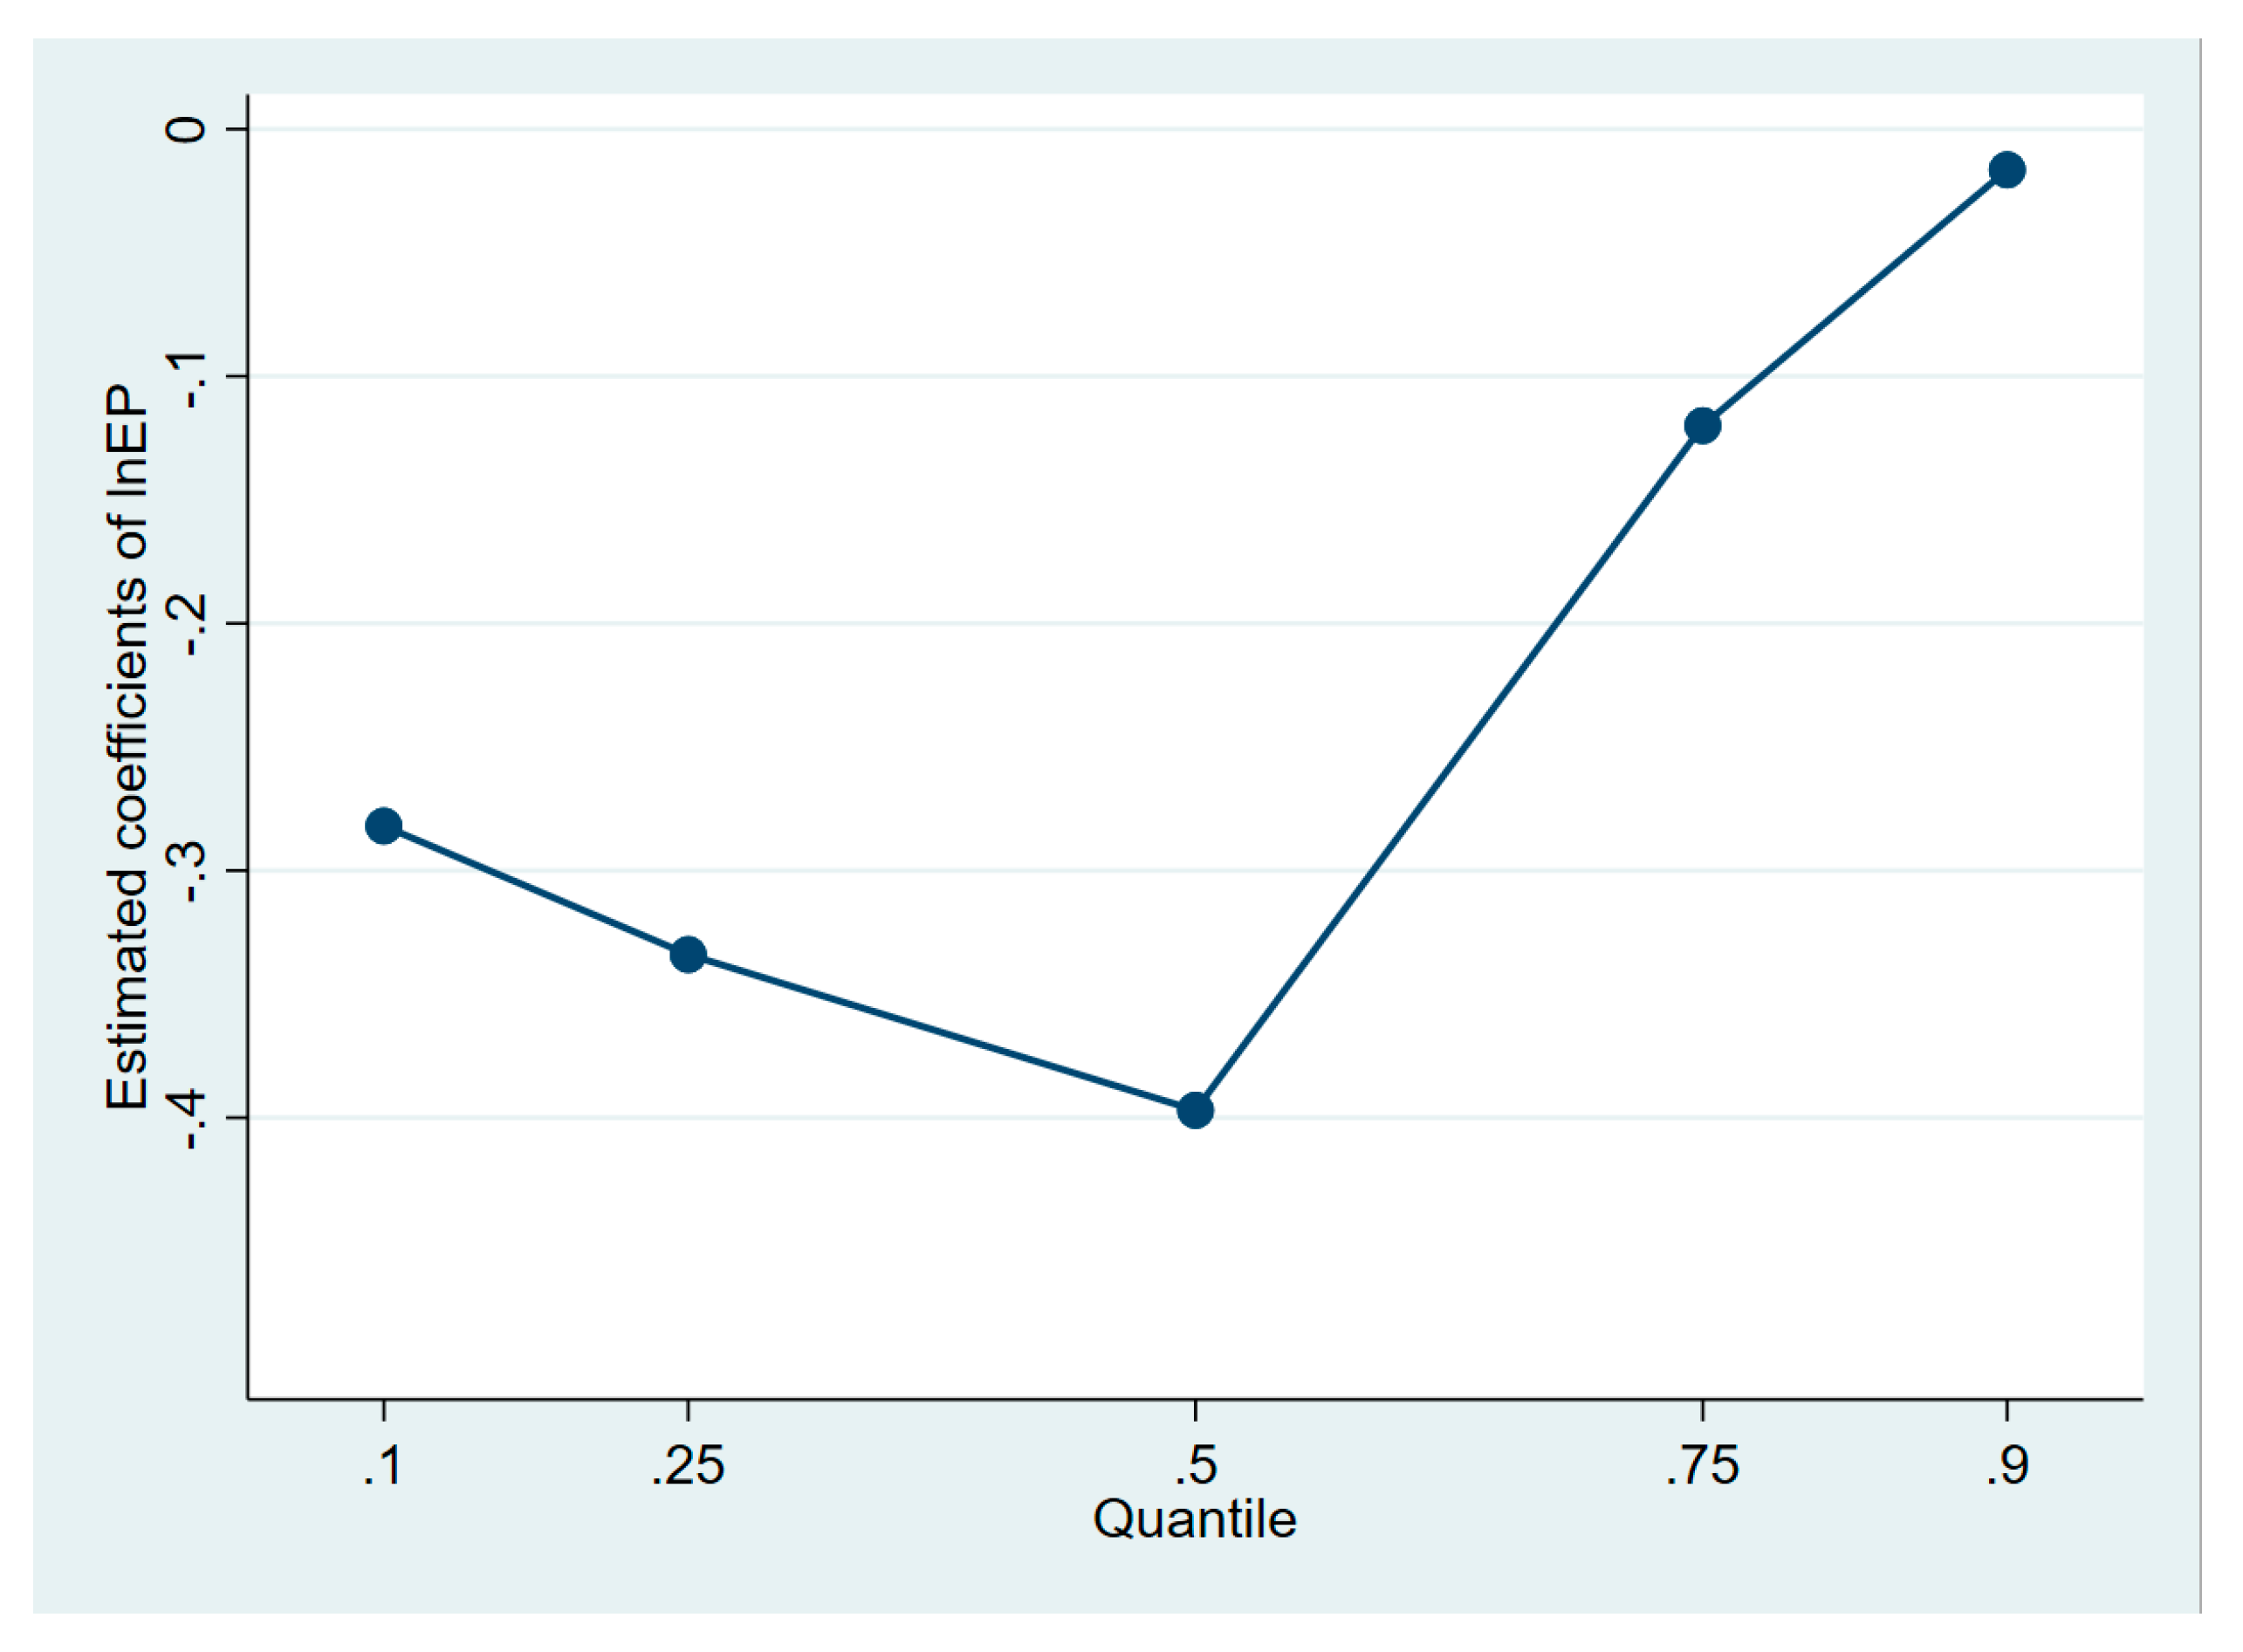
Figure 3 show that, similar to the results of the full sample, the coefficients of energy prices at the 0.1, 0.25, 0.5, 0.75, and 0.9 quantiles were all negative; in addition, we found that except for the 0.9 quantile high energy intensity (that is, low energy efficiency quantile), the coefficients were highly significant. Meanwhile, we further noticed that the absolute values of the coefficients of the energy price go in the same direction with the energy intensity, and it shows that there was an inverted U relationship. This indicates that between the areas with high efficiency and the one with lower efficiency, the influence of energy price on energy efficiency seemed to be most significant for an intermediate level of efficiency. On the one hand, this can be explained by the fact that there was a relatively more sound market mechanism for the areas with higher levels of energy efficiency, and the issues of resource misallocation derived from energy price distortion was relatively smaller, and the energy prices were more prominent in promoting energy efficiency in these areas. On the other hand, the industrial structure in areas with high energy efficiency was more optimized, economic development was less dependent on energy efficiency; therefore, the effect was relatively limited. This explains to a large extent why the effect of energy prices was most prominent in the middle level of energy efficiency. It is worth mentioning, in particular, compared to the areas with low energy efficiency (i.e., 75% and 90% quantiles of energy intensity), the effect was significantly greater in the areas with high levels of energy efficiency (i.e., 10% and 25% quantiles of energy intensity).
Regarding control variables, the influence direction of industrial structure, environmental regulation, R&D investment, and FDI on energy efficiency at different levels of energy intensity are generally consistent, but the degree of influence varies.
5. Results and Discussion of the Nonlinear Impact of Energy Price on Energy Efficiency
The current paper further used the panel threshold model to examine whether the effect of energy price on energy efficiency of an area in China was related to the degree of energy price distortion, level of environmental regulation, economic development, and economic growth of the area to see whether there was a nonlinear relationship between the two.
The current paper firstly treated the above four factors as the threshold variables and examined whether there was a significant threshold effect.
Table 5 shows that when the degree of energy price distortion was used as the threshold variable, the null hypothesis that the triple threshold effect did not exist cannot be rejected (
p-value = 0.83), but the null hypothesis can be rejected—that there was no double threshold effect (
p-value is 0.002). This indicates that the effect of energy prices on China’s energy efficiency had a double threshold in terms of the degree of energy price distortion; the two thresholds estimated were 2.1159 and 3.2593. Similarly, it can be found that the impact also had a double threshold effect on economic development level and the rate of economic growth. When the environmental regulation was used as the threshold variable, a single threshold effect can be observed. The abovementioned results demonstrate the existence of the nonlinear price–efficiency linkage in China.
Besides the existence of the significant threshold effect, the current paper further estimates the parameters of Equations (4)–(7).
Table 6 as well as
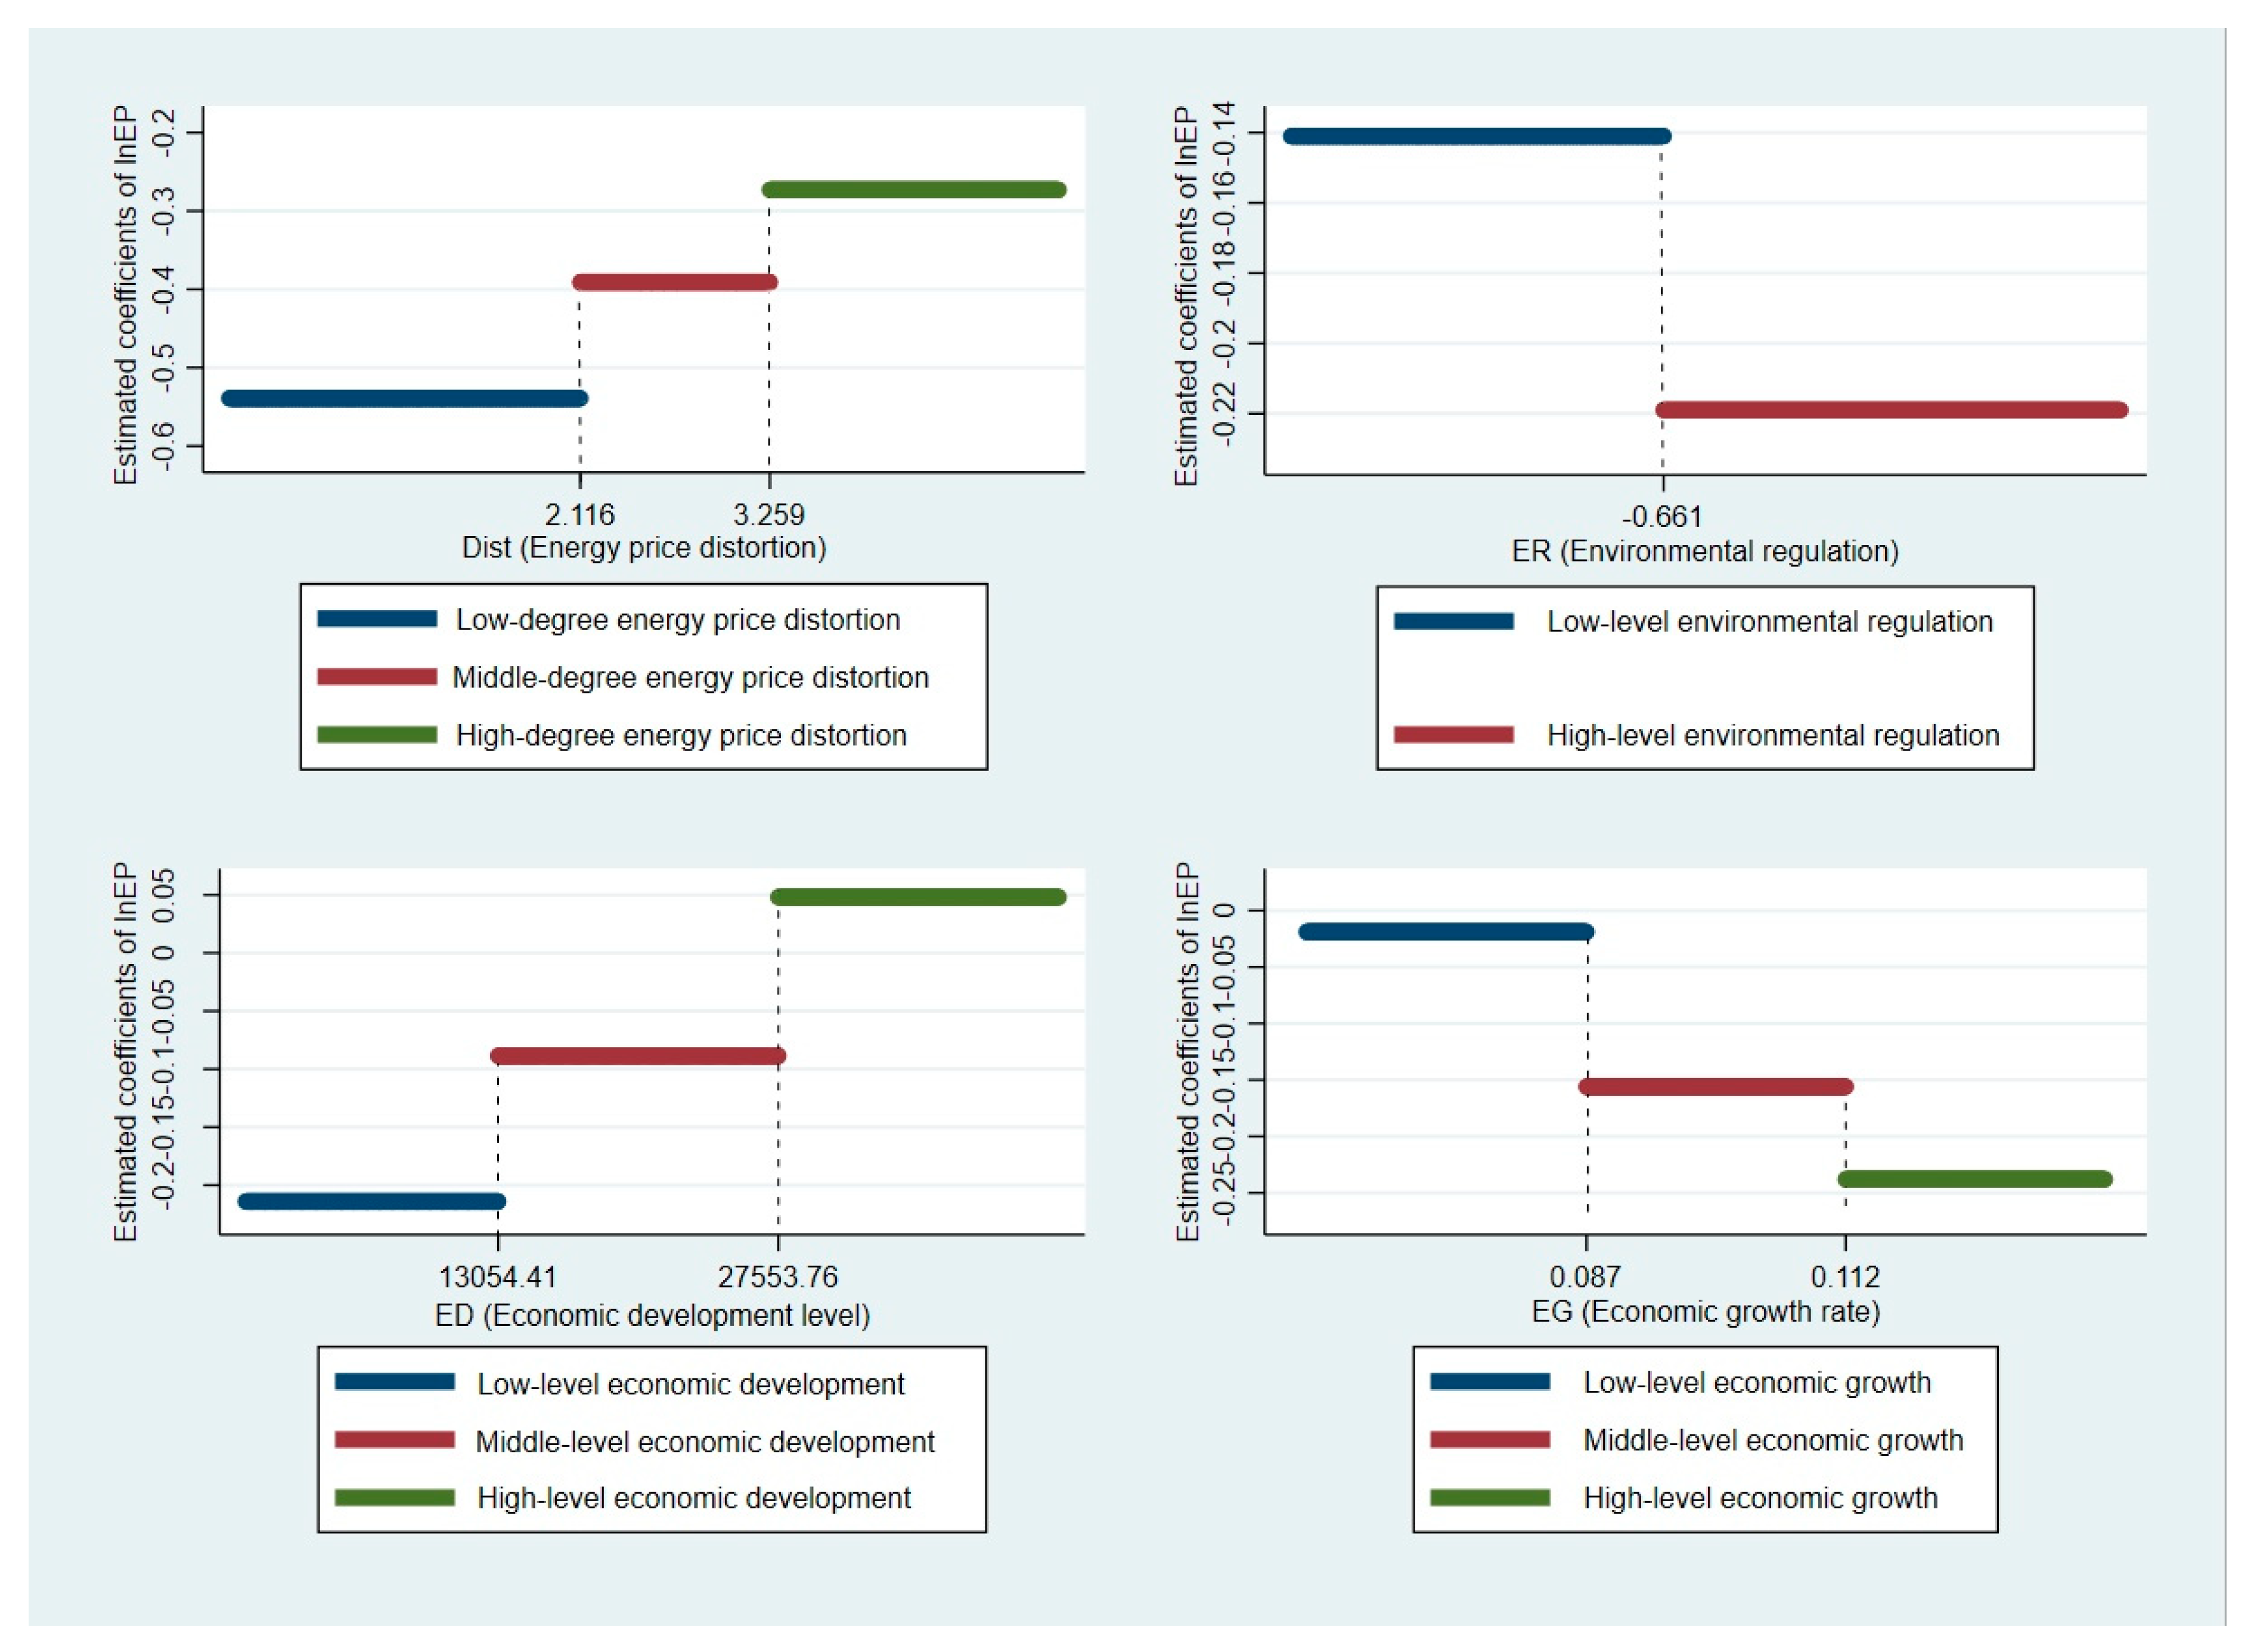
Figure 4 present the findings. The table shows that when the threshold variable is in different value ranges, the impact of energy prices on China’s energy efficiency was also significantly different. When we used degree of energy price distortion as the threshold variable, the estimated results from the Column 2 of
Table 6 (top left corner of
Figure 4) suggested that whether the degree of energy price distortion was lower than the first threshold value of 2.116, between the first and the second threshold values, or higher than the second threshold value of 3.259, the estimated coefficients of energy price lnEP were all significantly negative. This indicates that when energy price distortion was in different value ranges, the influence of energy price on energy intensity in China was significant and negative, that is, the energy price facilitated the improvement of energy efficiency. However, the estimated coefficient of energy prices differed significantly in different intervals; its absolute value gradually decreased as the degree of energy price distortion increased. This reflects that as the degree of energy price distortion became higher, the degree of resource mismatch became more obvious; the impact of energy prices on China’s energy efficiency was correspondingly smaller. This is in accordance with the previous theoretical analysis.
In addition, the Column 3 of
Table 6 (top right corner of
Figure 4) reports that when there are different value ranges for environmental regulation, the estimated coefficients of energy price lnEP were all significantly negative; this indicates that under different environmental regulations, energy prices always have a promoting impact on China’s energy efficiency. However, when the environmental regulation index was below the threshold of −0.661, the absolute value of the lnEP coefficient was 0.141. When it crossed the threshold of −0.661, the absolute value of the coefficient increased to 0.219. This indicated that in areas with higher environmental regulation intensity, the effect was more obvious. As discussed in the previous theoretical analysis, the areas with higher levels of environmental regulation have higher environmental governance costs and greater motivation for technological progress, and rising energy prices can further promote energy factor substitution and enterprise technological innovation which, in turn, will produce a more obvious positive effect on energy efficiency.
When we use per capita GDP as the threshold variable, we found from the Column 4 of
Table 6 (bottom left corner of
Figure 4) that the effect of energy price on energy efficiency varied for different levels of economic development. More specifically, when the per capital GDP was lower than the value of the first threshold, which was 13,054.41 yuan/person (1999 as the constant price), the coefficient of lnEP was still significantly negative, but its absolute value decreased to 0.089 when it was higher than the second threshold value which was 27,533.76 yuan/person (1999 as the constant price); the estimated coefficient is not statistically significant. This means that the level of economic development goes in the opposite direction with the degree of influence of the energy price. As explained in the previous theoretical analysis, the overall industrial structure improves and the dependence on energy consumption declines with an increase in the degree of economic development, so the effect of energy prices on China’s provincial energy efficiency was correspondingly smaller.
Finally, the Column 5 of
Table 6 (bottom right corner of
Figure 4) shows that when GDP growth rate was used as the threshold variable, the coefficient of lnEP was negative in different ranges of GDP growth rate, but the size and significance of the coefficient varied. More specifically, when GDP growth rate was higher than the first threshold of 11.2%, the absolute value of the coefficient of lnEP reached 0.238. When the GDP growth rate was between the first and the second thresholds, the absolute value of its estimated coefficient dropped to 0.156. When the GDP growth rate was higher than the second threshold, the absolute value of the estimated coefficient further decreased to 0.019 and is no longer statistically significant. This also reflects the promotion effect of energy prices on China’s provincial energy efficiency which generally weakens as the economic growth rate increases. The reason is mainly because when the economy is in a period of rapid expansion, the energy demand for economic development is more robust, the energy cost is correspondingly higher, and the promotion of energy efficiency by energy prices is also more prominent.
6. Conclusions
In the context of improving energy efficiency, which is increasingly a topic of concern in countries around the world, the impact of energy price on energy efficiency has also attracted the attention of academia. However, the empirical conclusions are relatively mixed. In order to fully understand the relationship between energy price and energy efficiency in China, this paper introduces nonlinear effect analysis in the investigation of the effect of energy prices on energy efficiency. In addition to the full sample analysis, the linear relationship investigation also considers the heterogeneity effect under regional differences and differences in energy efficiency levels. This not only complements and expands the existing studies, but also provides more comprehensive and targeted policy recommendations for China to improve energy efficiency from the perspective of energy prices.
Based on the panel data analysis of China’s 30 provinces between 2003 and 2017, we obtained the following main conclusions.
First, overall, energy prices had a positive impact on energy efficiency in China, and this effect was highly robust under different estimation methods.
Second, there existed heterogeneity in relation to the influence of energy price on energy efficiency in different regions and at various energy efficiency levels. Specifically, the effect was significantly positive in the central-western area of China, while insignificant in the eastern area in general. In addition, the effect showed to be higher in provinces with a middle level of energy efficiency than those with high and low levels of energy efficiency and was insignificant in the regions with low energy efficiency.
Finally, the nonlinear analysis based on the panel threshold model indicates that, when the energy price distortion degree, environmental regulation intensity, economic development level, and economic growth rate were in different threshold value ranges, the effects of energy price on energy efficiency were notably different. To be specific, the effect decreased with the degree of energy price distortion and the level of economic development and increased with the increase in environmental regulation and economic growth. In particular, when the value of a region’s economic development level and economic growth rate was within a certain range, the effect was not statistically significant. The research conclusion of this article has obvious policy implications. On the one hand, considering that energy prices generally exert a significant influence on energy efficiency in a positive manner, the Chinese government should speed up the establishment of market-determined energy price formation mechanisms for electricity, natural gas, and oil, and reduce the low energy prices caused by government control, so that energy prices can fully reflect the cost of energy use through energy price reform to optimize energy allocation efficiency and, ultimately, promote China’s energy efficiency. On the other hand, we report that for different areas and different levels of energy efficiency, the effect has heterogeneous characteristics, and its impact will also be affected by the degree of energy price distortion in a region, the environment regulatory, economic development level and economic growth rate. Therefore, the market-oriented reform of China’s energy prices should not adopt a “one size fits all” approach but should be differentiated and promoted according to the actual conditions in different regions.
There are still some shortcomings in this research. For example, this article interpolated some missing data which may have a certain impact on the estimation results. In terms of areas of future research, considering that the Chinese government has implemented many measures to reform the energy factor market in recent years, it will be an interesting research topic to examine the impact of energy prices on energy efficiency in the context of the reform. In addition, we also plan to collect relevant data from nearly 300 cities and industries in China and conduct further in-depth research on related topics regarding the relationship between energy prices and energy efficiency.


