1. Introduction
As the fourth industrial revolution has begun in earnest, a large amount of electrical and electronic equipment is being used in various fields in addition to advanced mechanical devices. Power semiconductor devices, which are composed of electrical and electronic devices, are very vulnerable to surges due to their low insulation level. A metal oxide varistor (MOV) for high voltage is connected in series or parallel in the circuit to protect the low-voltage electronic devices from surges [
1,
2]. However, the MOV deteriorates gradually due to manufacturing, mechanical and thermal defects or repeated protective operations against surges [
3,
4,
5]. These defects cause the thermal runaway of MOV and finally result in a short-circuit and a line-to-ground fault, leading to the explosion and electric fire of electrical and electronic devices [
6,
7]. Replacing a defective MOV at an early stage is very important because the failure of electronic devices can result in the unexpected cessation of electrical and electronic equipment operation when the MOV deteriorates. In addition, there are no specific deterioration criteria for replacing a MOV, and most are replaced at the same time or along with defective MOVs found by visual inspection [
8]. Therefore, the reliable assessment of the condition of MOV deterioration is required for electrical and electronic equipment.
When a MOV has degraded, the leakage current increases while the reference voltage decreases. When the reference voltage changes by more than 10% compared with the initial value, MOV deterioration can be determined [
9,
10]. On-line measurement for the reference voltage, however, is impossible, and the MOV is separated for off-line measurement. Besides, an accelerated degradation test must be performed to analyze the MOV deterioration. To date, when most accelerated degradation tests for the MOV are performed, an 8/20 μs standard surge current is applied under de-energized conditions, which is unlike the actual operating environment [
11]. Therefore, it is essential to select the optimal parameter instead of the reference voltage and to perform the accelerated degradation test under energized conditions to evaluate MOV deterioration reliably [
12].
This paper consists of five sections: Introduction, Surge Generator, Analysis of MOV Characteristics, Assessment of MOV Deterioration, and Result and Discussion. A surge generator was designed and fabricated for an accelerated degradation test. The surge generator applies the 8/20 μs standard surge current, which can be synchronized with the AC power-frequency voltage to replicate the actual MOV operating environment. Three leakage currents were used to analyze the variation of electrical characteristics in the deteriorated MOVs, comparing this with the reference voltage variation. Furthermore, a condition assessment of the MOV deterioration under energized and de-energized conditions was performed [
6,
13].
2. Surge Generator
2.1. Design and Fabrication
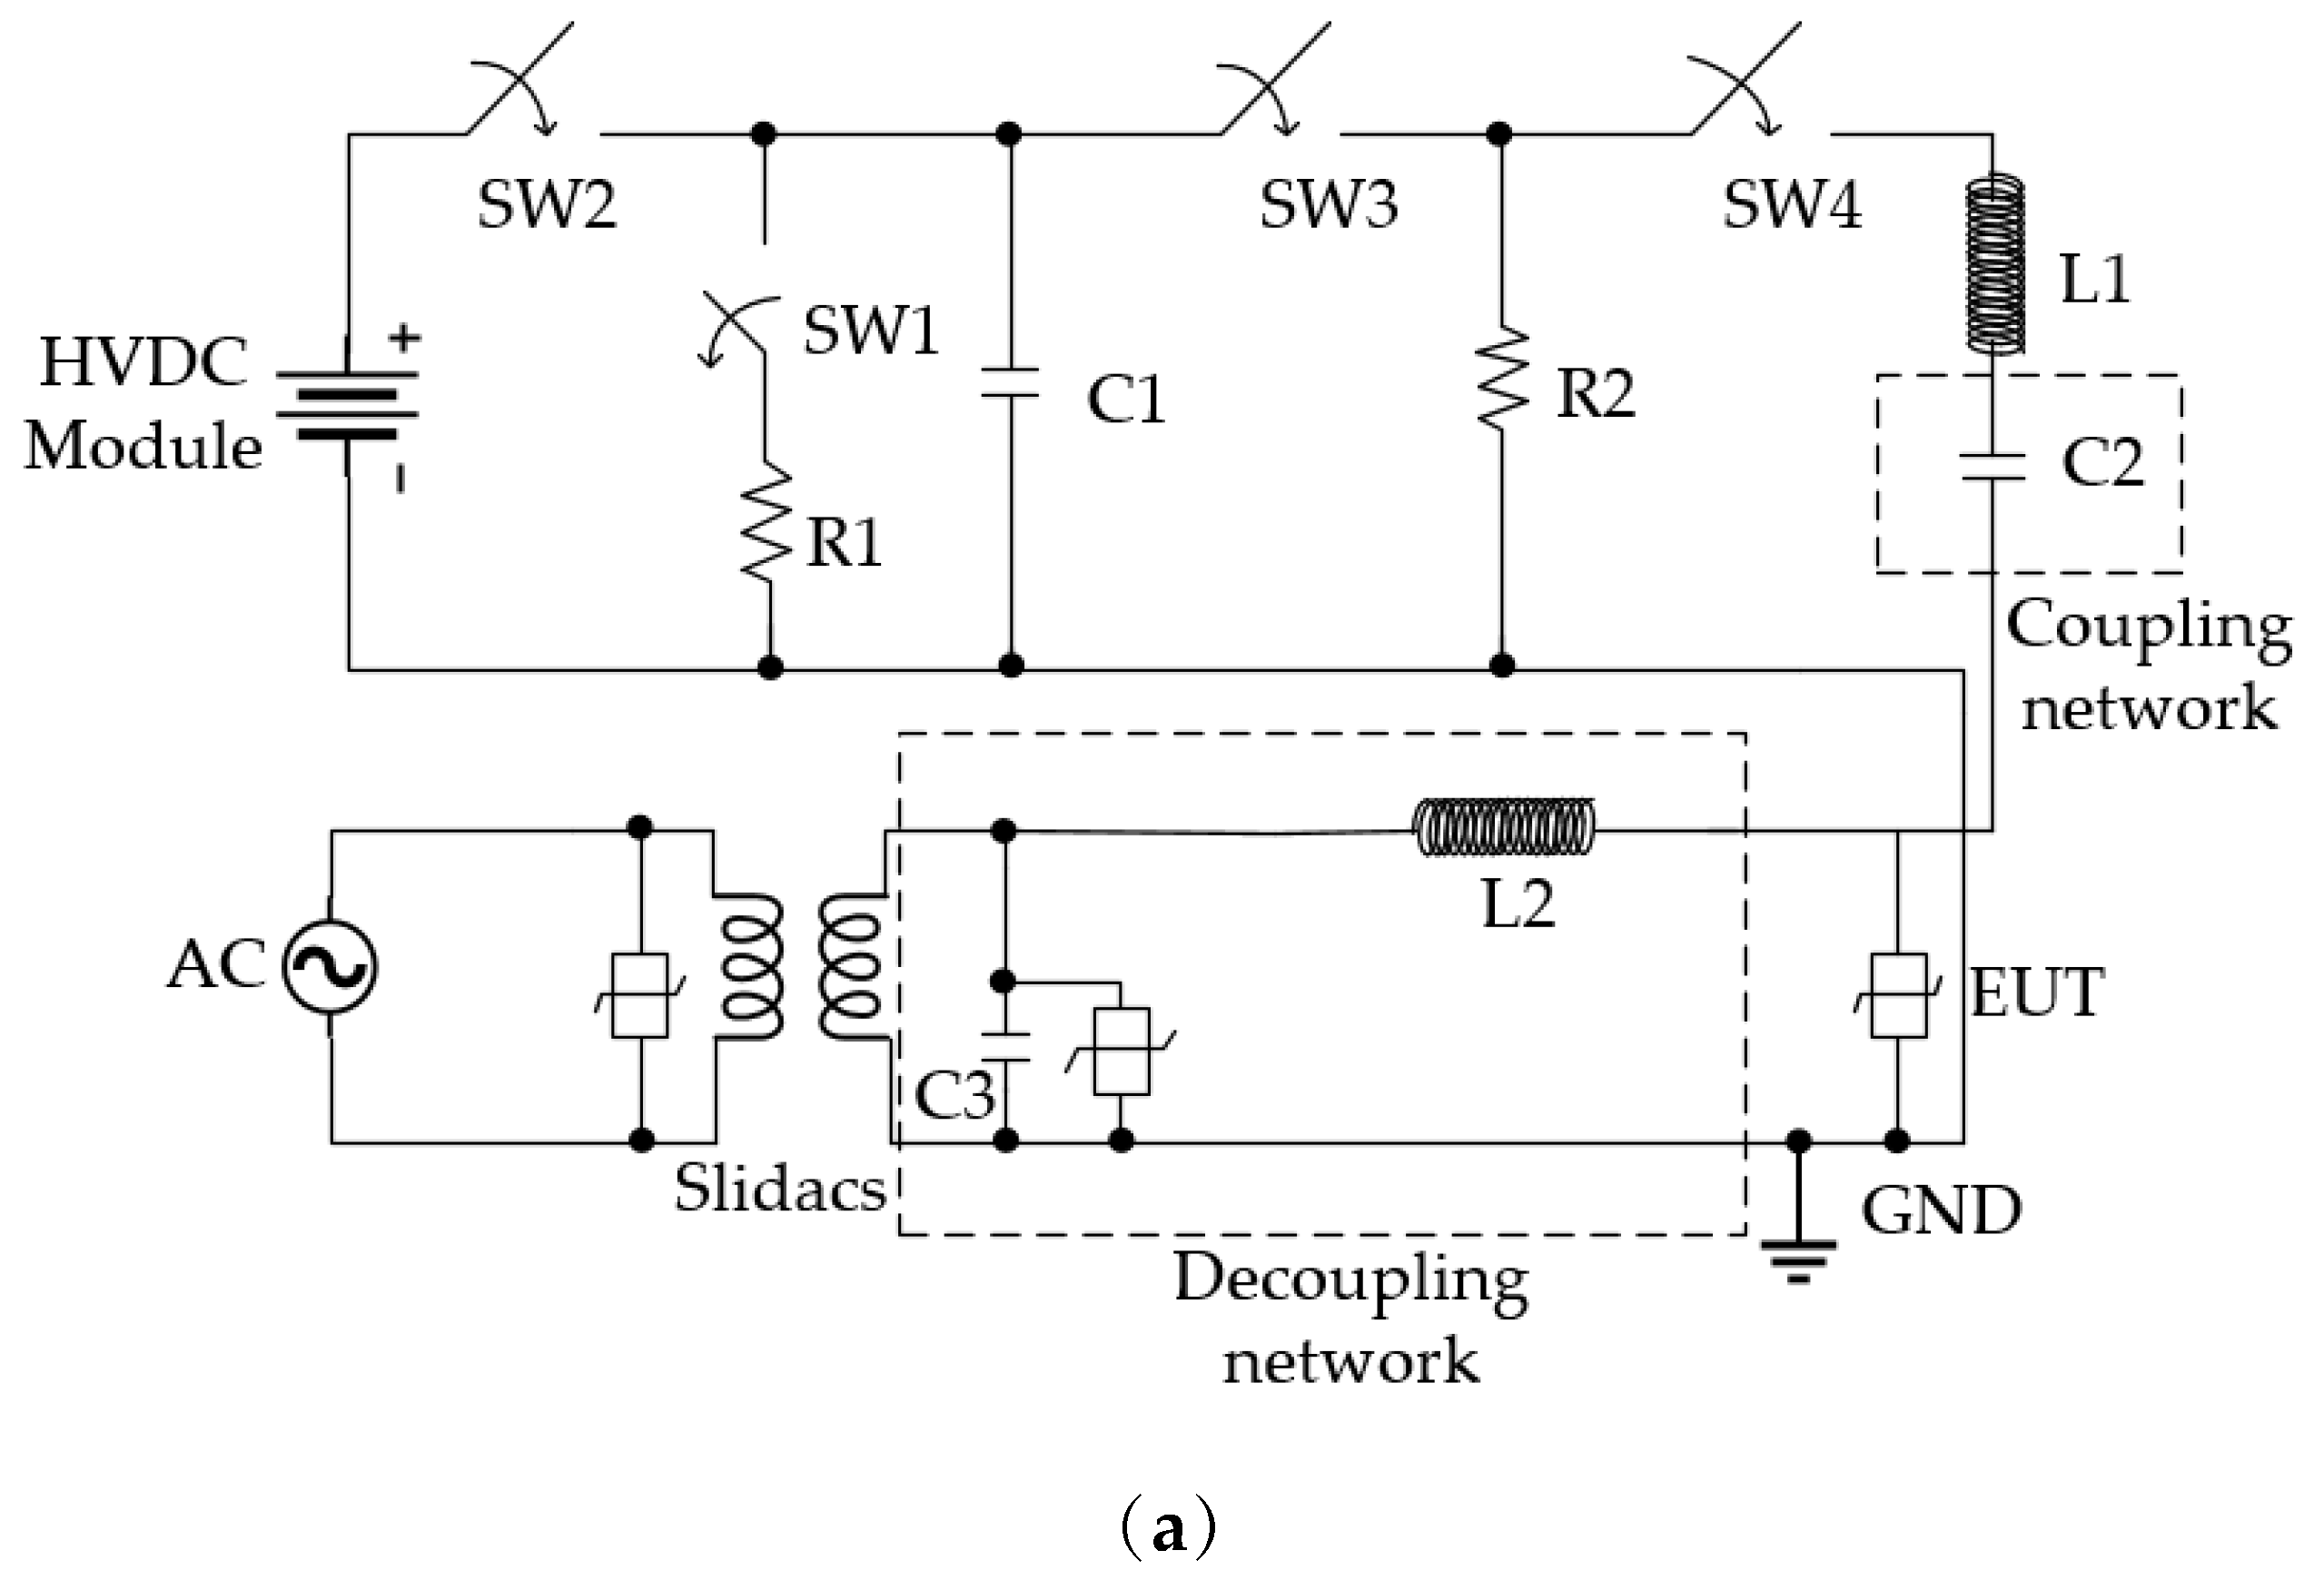
Figure 1 shows the configuration used to generate a surge current and the photograph of the fabricated surge generator. The circuit is composed of a coupling and decoupling network (CDN) used to apply a surge current to MOVs under energized conditions to simulate the actual operating environment of a MOV. To protect power lines and other equipment from a surge current, capacitor C2 is used for the coupling network with a high impedance system to block AC source transmission into the surge generator, in addition to a low impedance system used for protection when a surge current with a high-frequency component flows into the MOVs. In contrast, the decoupling network operates as a high impedance system to block a surge current flowing into the AC power source and as a low impedance system to apply an AC power source to the MOVs. Capacitor C1 is charged by a high voltage direct current (HVDC) source when switch SW2 is turned on, and the surge waveform is adjusted by resistor R2 and inductor L1; surge current flows into the coupling system when switches SW3 and SW4 are turned on. When switch SW1 is turned on, the residual charge remaining in the C1 is discharged by resistor R1. Finally, the surge generator can apply a surge current continuously to accelerate MOV deterioration under the energized condition. The algorithm was designed based on the LabVIEW program for the reliable and precise operation of switches, and all switches are based on a pneumatic cylinder for electrical insulation.
2.2. Surge Waveforms
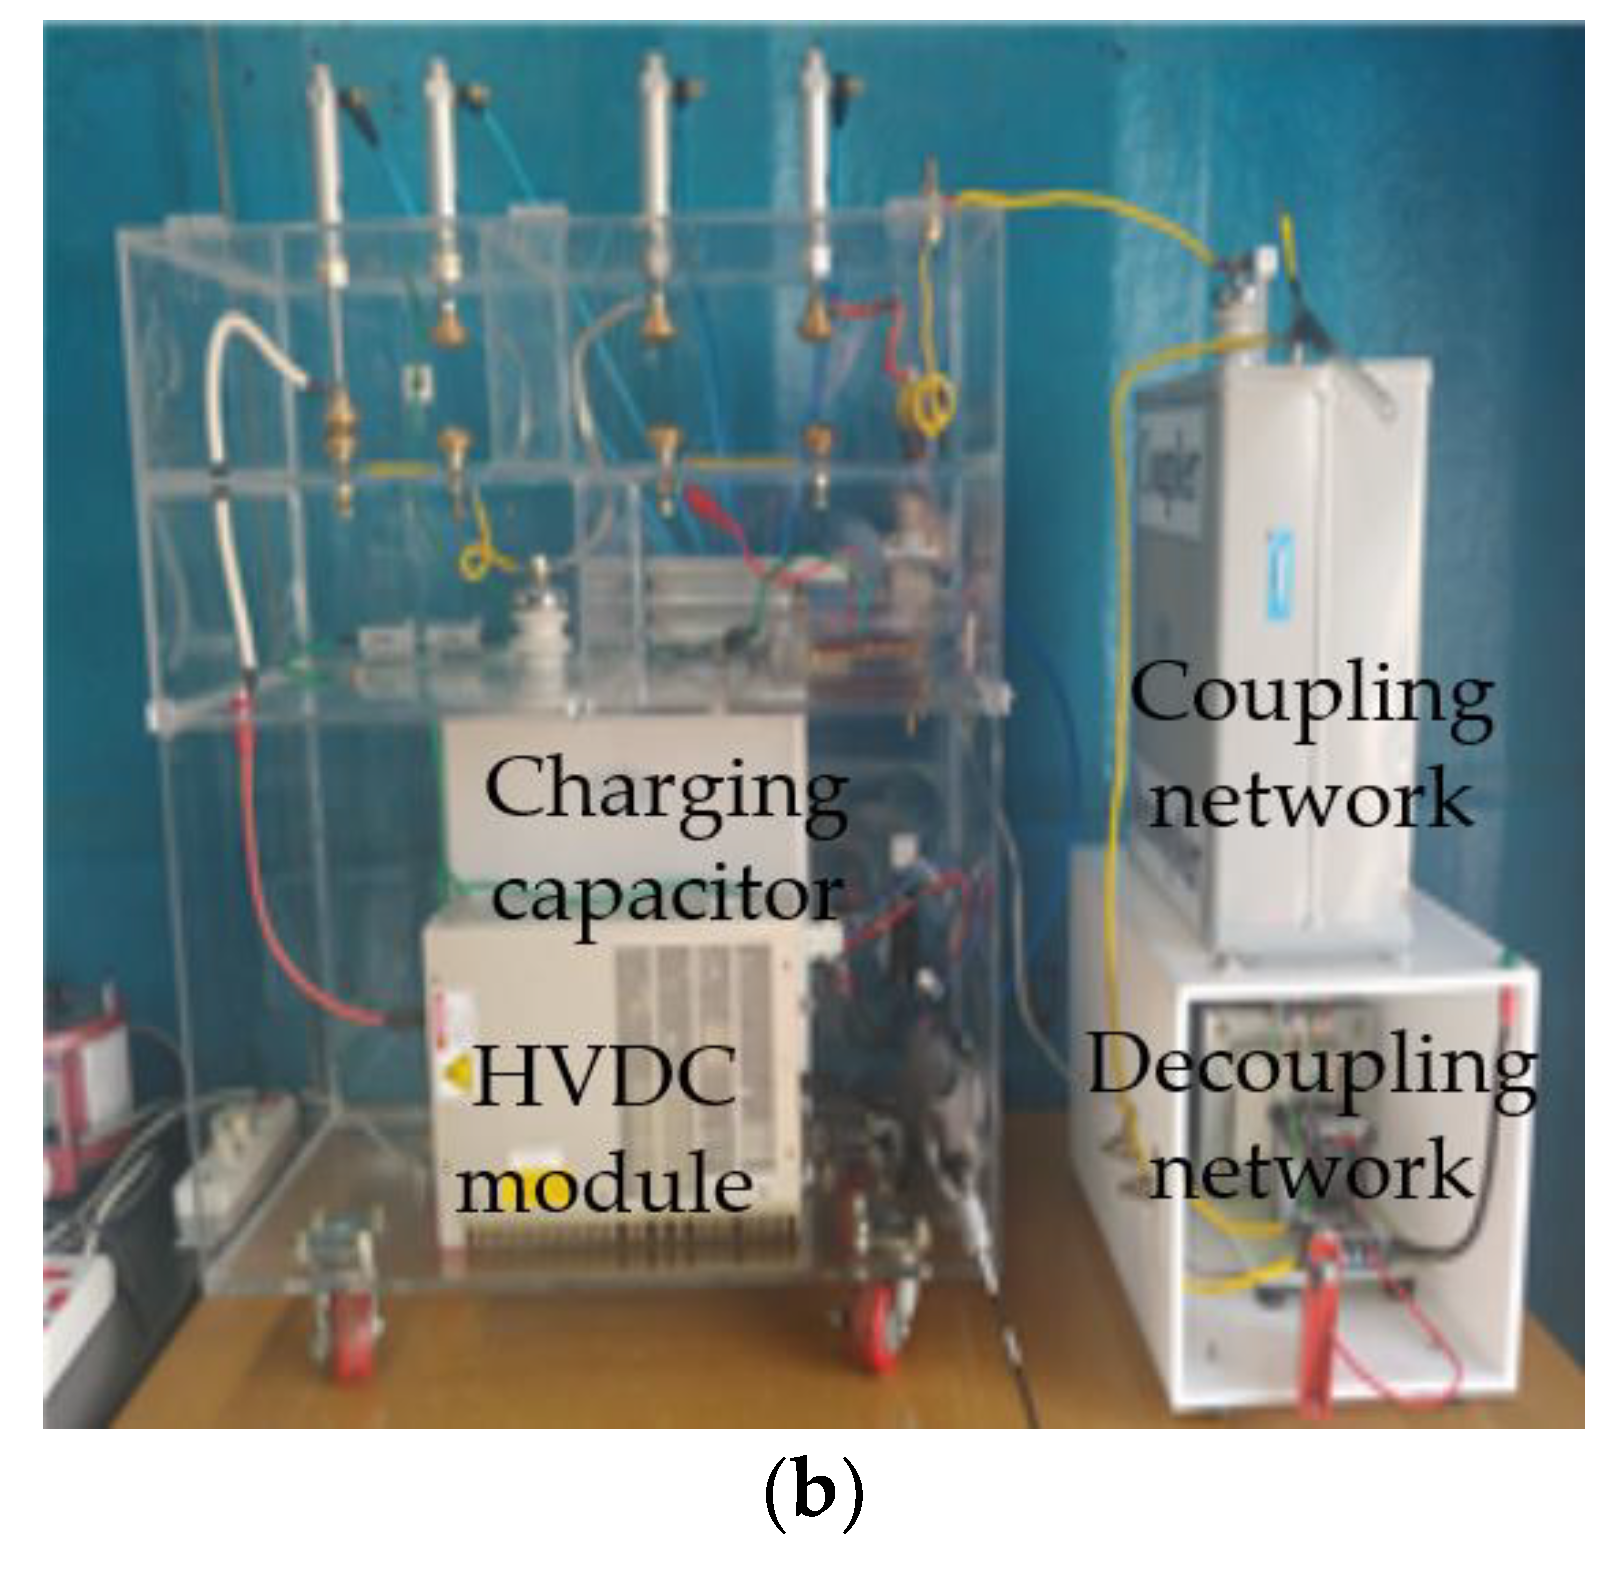
The current waveform of the surge generator fabricated in this study is shown in
Figure 2. The surge current flows from the surge generator while the AC power source is applied to the circuit with CDN.
Figure 2a shows the surge waveform with the AC power source. The surge current is well coupled on the AC power source and satisfies a tolerance of ±20% for the virtual front time of 8 μs and the time to a half-value of 20 μs according to IEC 61000-4-5 [
8]. The surge current, MOV clamping voltage, and absorbed energy are shown in
Figure 2b. The clamping voltage and absorbed energy were 1360 V and 150 J, respectively, when a surge current with a magnitude of 10 kA was applied to the MOV samples.
3. Analysis of MOV Characteristics
3.1. Electrical Parameters
To determine MOV deterioration, off-line and on-line measuring methods were used. The reference voltage—one of the off-line measuring methods—is the voltage across the varistor when a current of 1 mA as a reference current flows into the varistor, as specified in the IEC 60099-4 [
14]. In addition, the MOV degradation is defined by a 10% decrease of reference voltage in the IEC 61643-311 [
15], and then the MOV should be replaced to protect the circuit, including electrical and electronic devices. A leakage current is one of the effective electrical parameters for on-line measurement. The total leakage current is composed of a resistive leakage current and capacitive leakage current due to the equivalent model connected with a resistor and capacitor in the circuit. The resistive component increases and the capacitive component does not change when a MOV deteriorates. Therefore, the resistive component of the total leakage current is a very important indication of MOV deterioration. The third harmonic component, however, is widely used to determine MOV deterioration since the resistive component is much less than that of the capacitive component and cannot be measured directly. The third harmonic component increases due to the distortion of the total leakage current waveform as a resistive component with the degradation of MOV and is easily acquired.
Table 1 shows the strengths and weaknesses of electrical parameters for determining MOV deterioration.
3.2. Experimental Set-Up
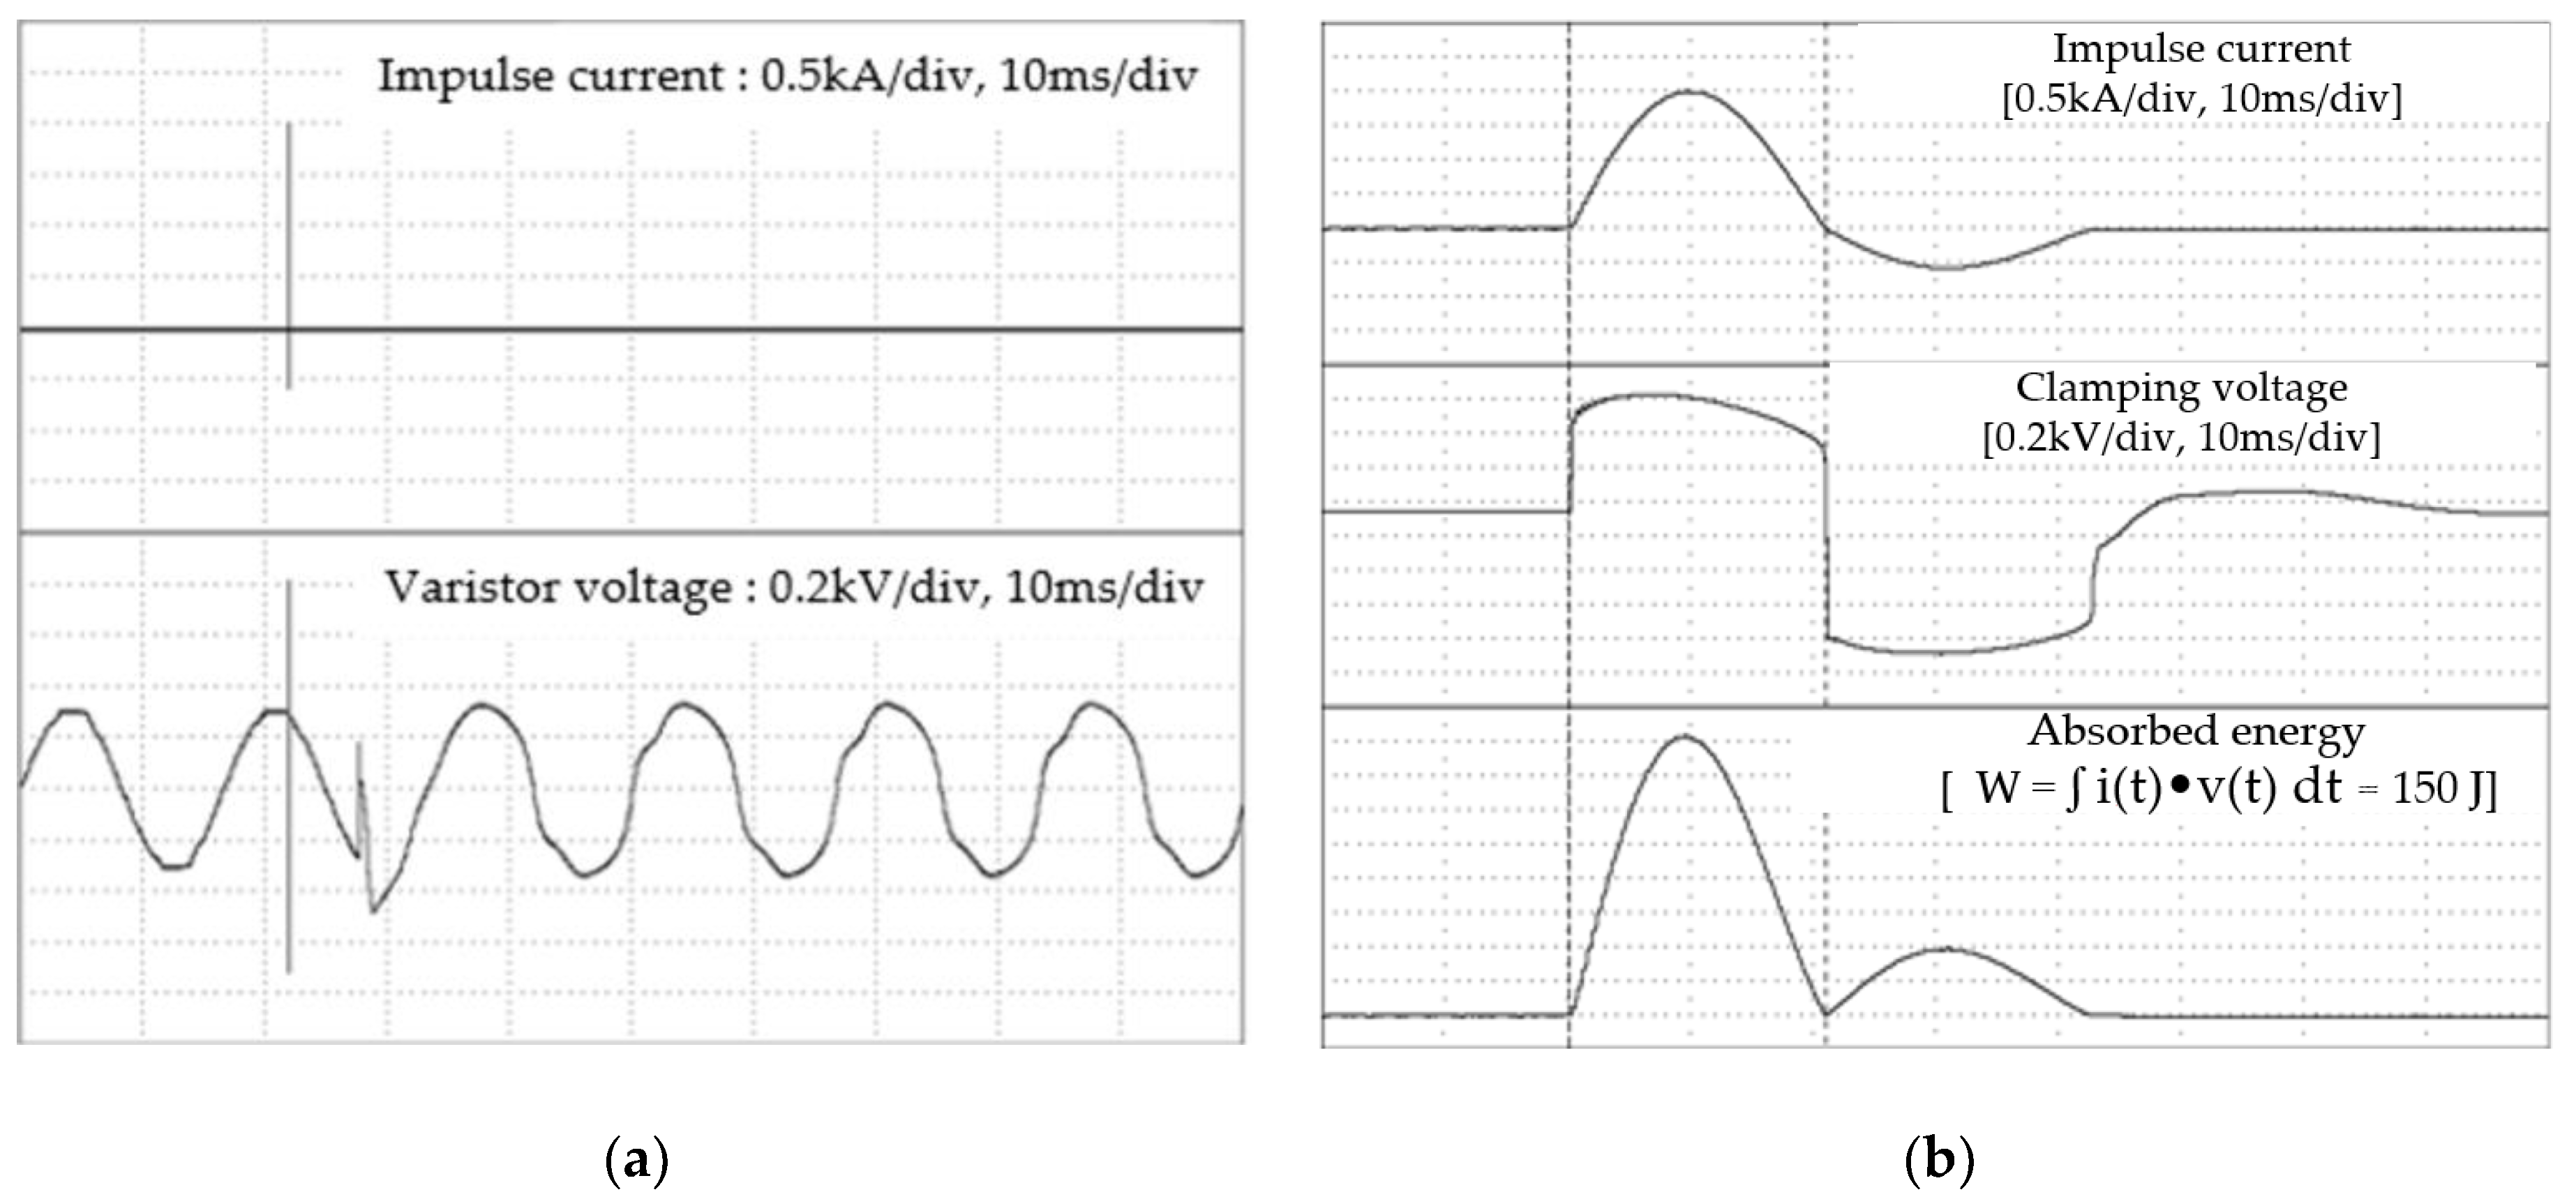
To measure the electrical parameters of MOV samples, an experimental set-up was used, as shown in
Figure 3. Data acquisition (DAQ) and digital oscilloscope (DSO) were used to measure the total leakage current and the third harmonic component. Additionally, a low-pass filter and a fast Fourier transform were used to eliminate an external noise signal. To detect the resistive leakage current, a digital multimeter (DMM) was used when the HVDC switch was turned on. The reference voltage was measured by surge protector test set (Model 4030, BOURNS, Riverside, USA).
Table 2 shows the two MOV samples with different specifications used in this study.
The test conditions used to compare the deterioration characteristics of MOVs in the case of high voltage under two energized conditions—simulating the actual MOV operating environment and the de-energized condition which contrasts with the actual MOV operating environment—are shown in
Table 3. The maximum absorbed energies with a surge current of 10 kA gradually decreased when the applied power–frequency voltage increased. The tests were performed after every about 100 kJ was applied until the reference voltage of the MOV decreased 15% more than its initial value.
4. Assessment of MOV Deterioration
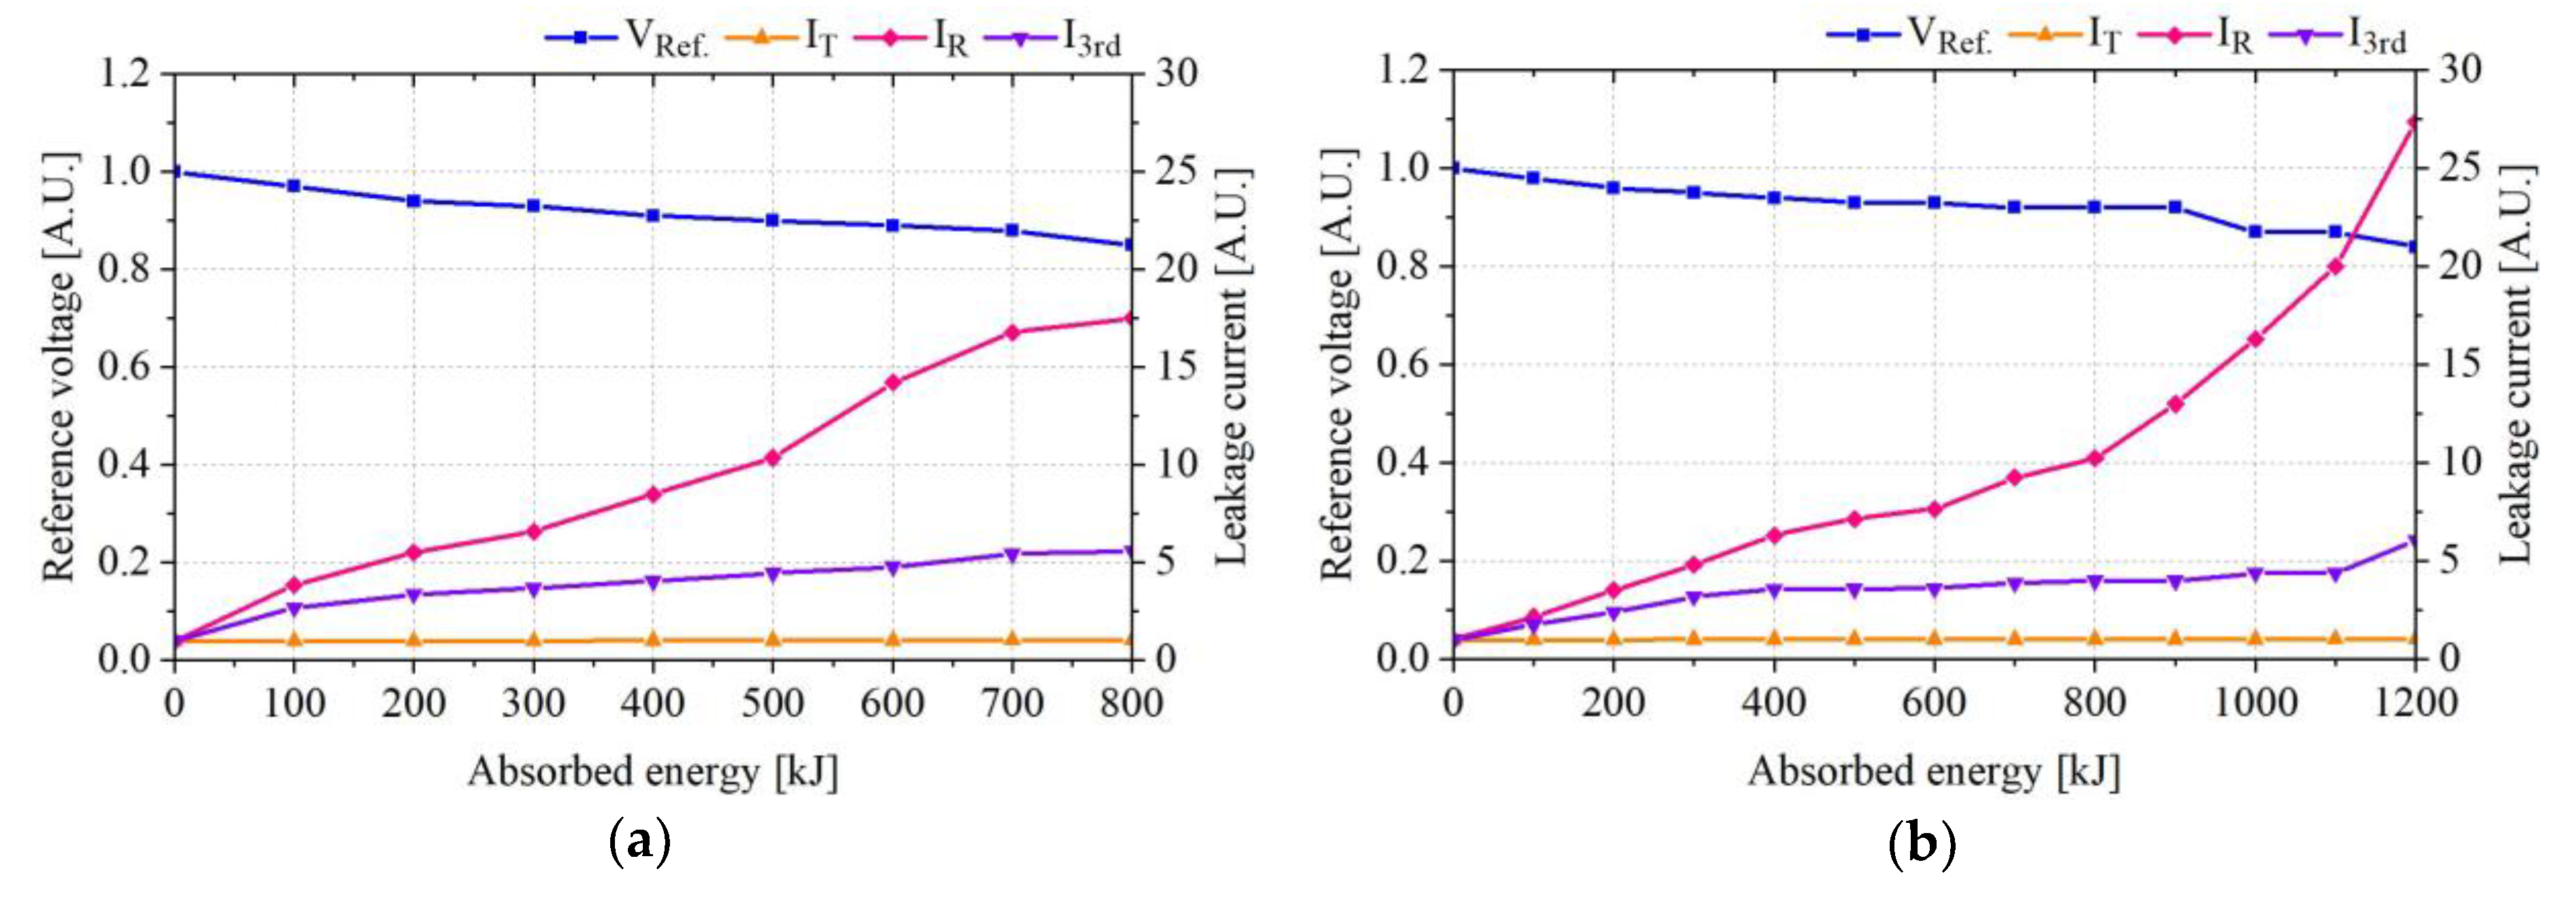
In the non-energized condition,
Figure 4 shows the change rates of the electrical parameters and the electrical parameters of Samples A and B changed with the absorbed energies in
Table 4, respectively. The reference voltage of Samples A and B decreased 15% after 800 kJ and 15% after 1200 kJ. The unit of y-axis in the figure is amplitude unit (A.U.). The resistive leakage current and the third harmonic component increased significantly, while the total leakage current did not change significantly. The third harmonic components of Samples A and B increased to more than six times their initial values, whereas the resistive leakage currents also increased to 18 and 27 times their initial values, respectively; however, it was difficult to determine the MOV degradation due to the small change rates with absorbed energies.
When 220 V AC was applied, the change rates of their electrical parameters are shown in
Figure 5 and the electrical parameters of Samples A and B were changed with the absorbed energies in
Table 5. The reference voltage of Samples A and B decreased 15% each after 650 kJ and after 900 kJ. The resistive leakage current and the third harmonic component increased significantly while the total leakage current did not change significantly. The third harmonic components of Samples A and B increased to more 10 times each their initial values, whereas the resistive leakage current changes were still insignificant. Compared with the de-energized condition, the absorbed energies of Samples A and B decreased 150 and 300 kJ, respectively, until the reference voltage decreased to approximately 15%.
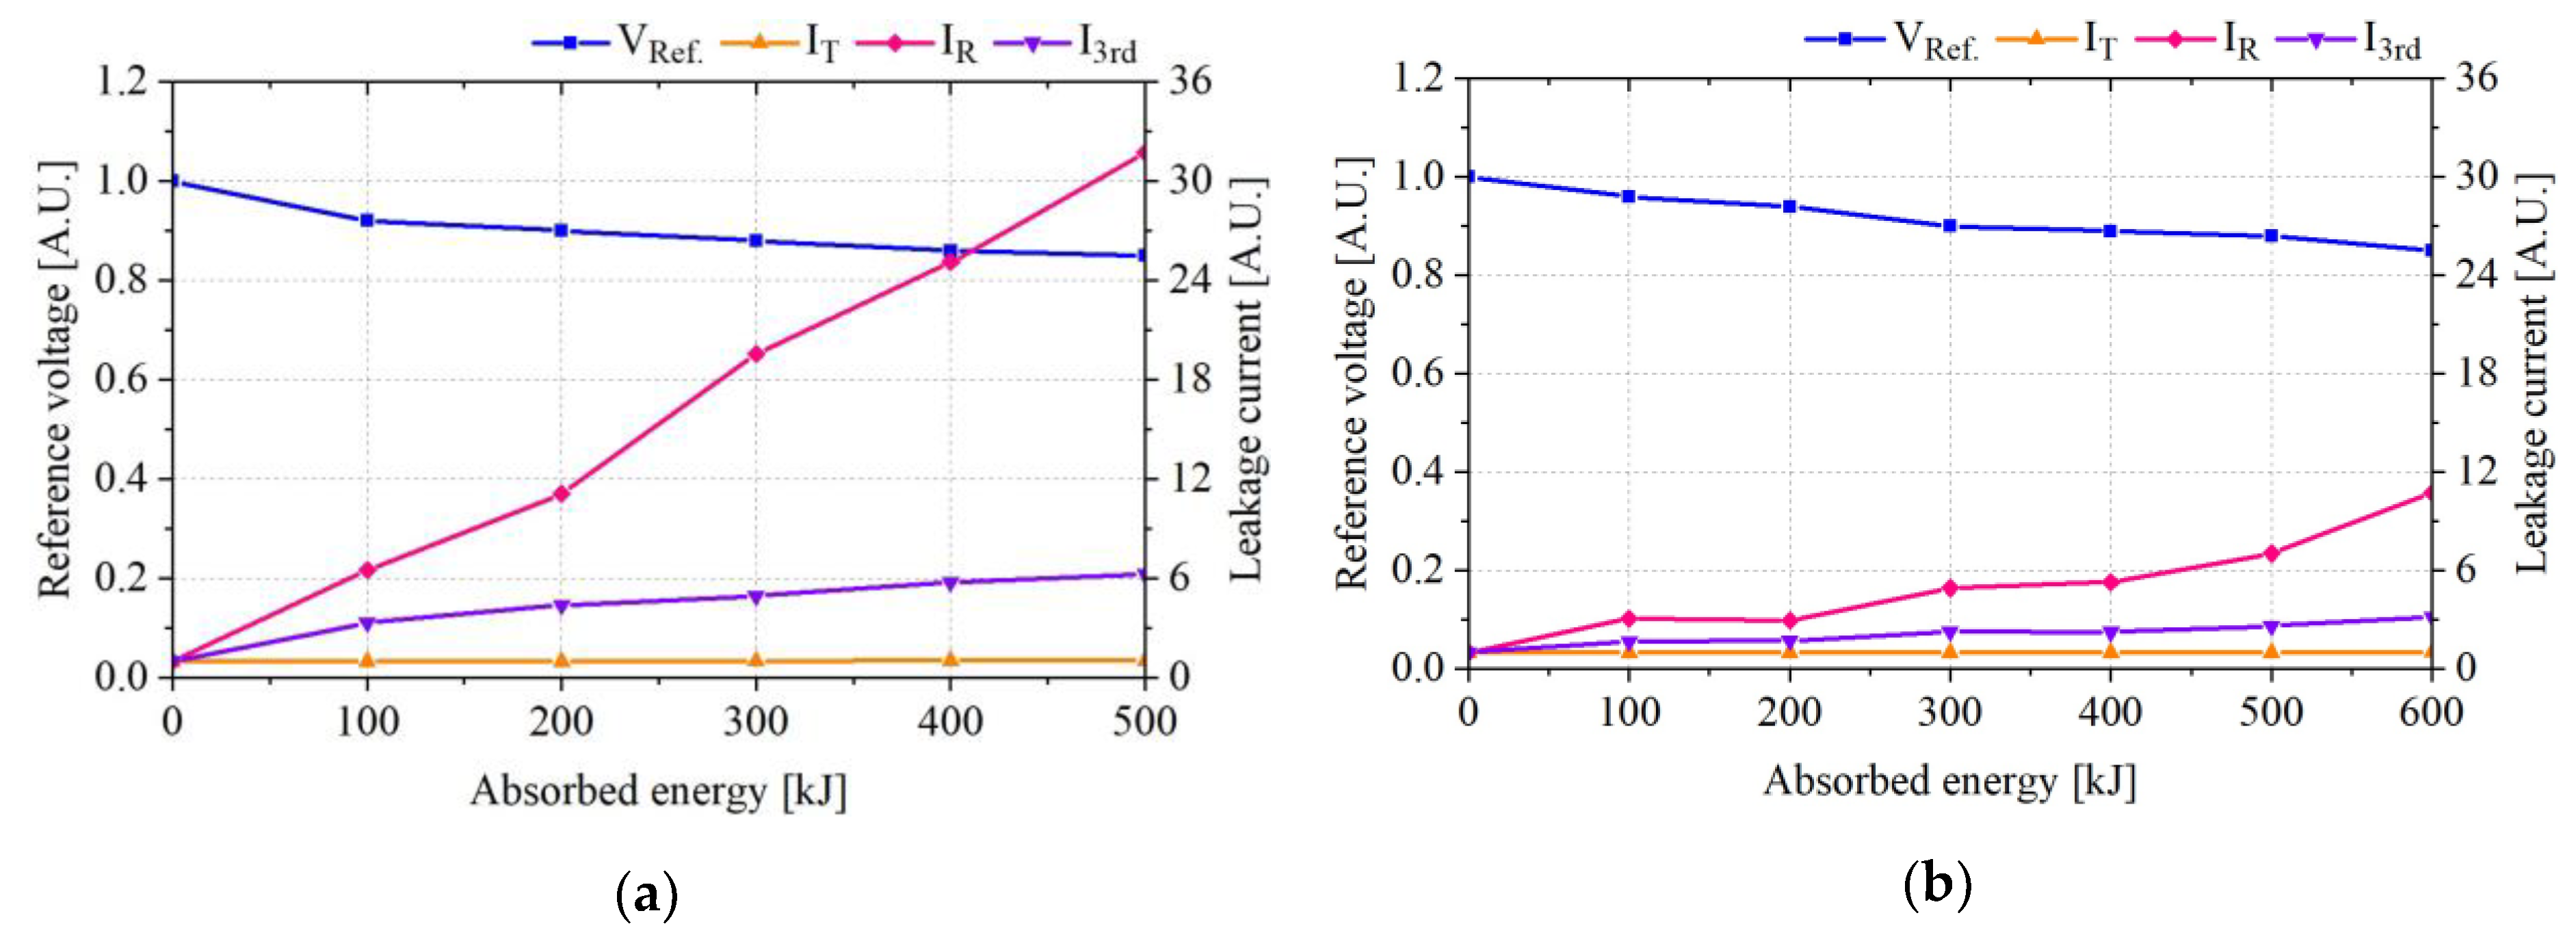
Figure 6 shows the change rates and electrical parameters of Samples A and B with absorbed energies at the maximum continuous operating voltage (MCOV) shown in
Table 6. The reference voltage of Samples A and B decreased 15% after 500 kJ and 15% after 600 kJ. The total leakage current, resistive leakage current, and the third harmonic component had the same tendency of increasing and decreasing in correlation with the absorbed energies under the de-energized condition and 220 V AC. The absorbed energies of Samples A and B decreased by 150 and 300 kJ, respectively, compared with the 220 V AC condition.
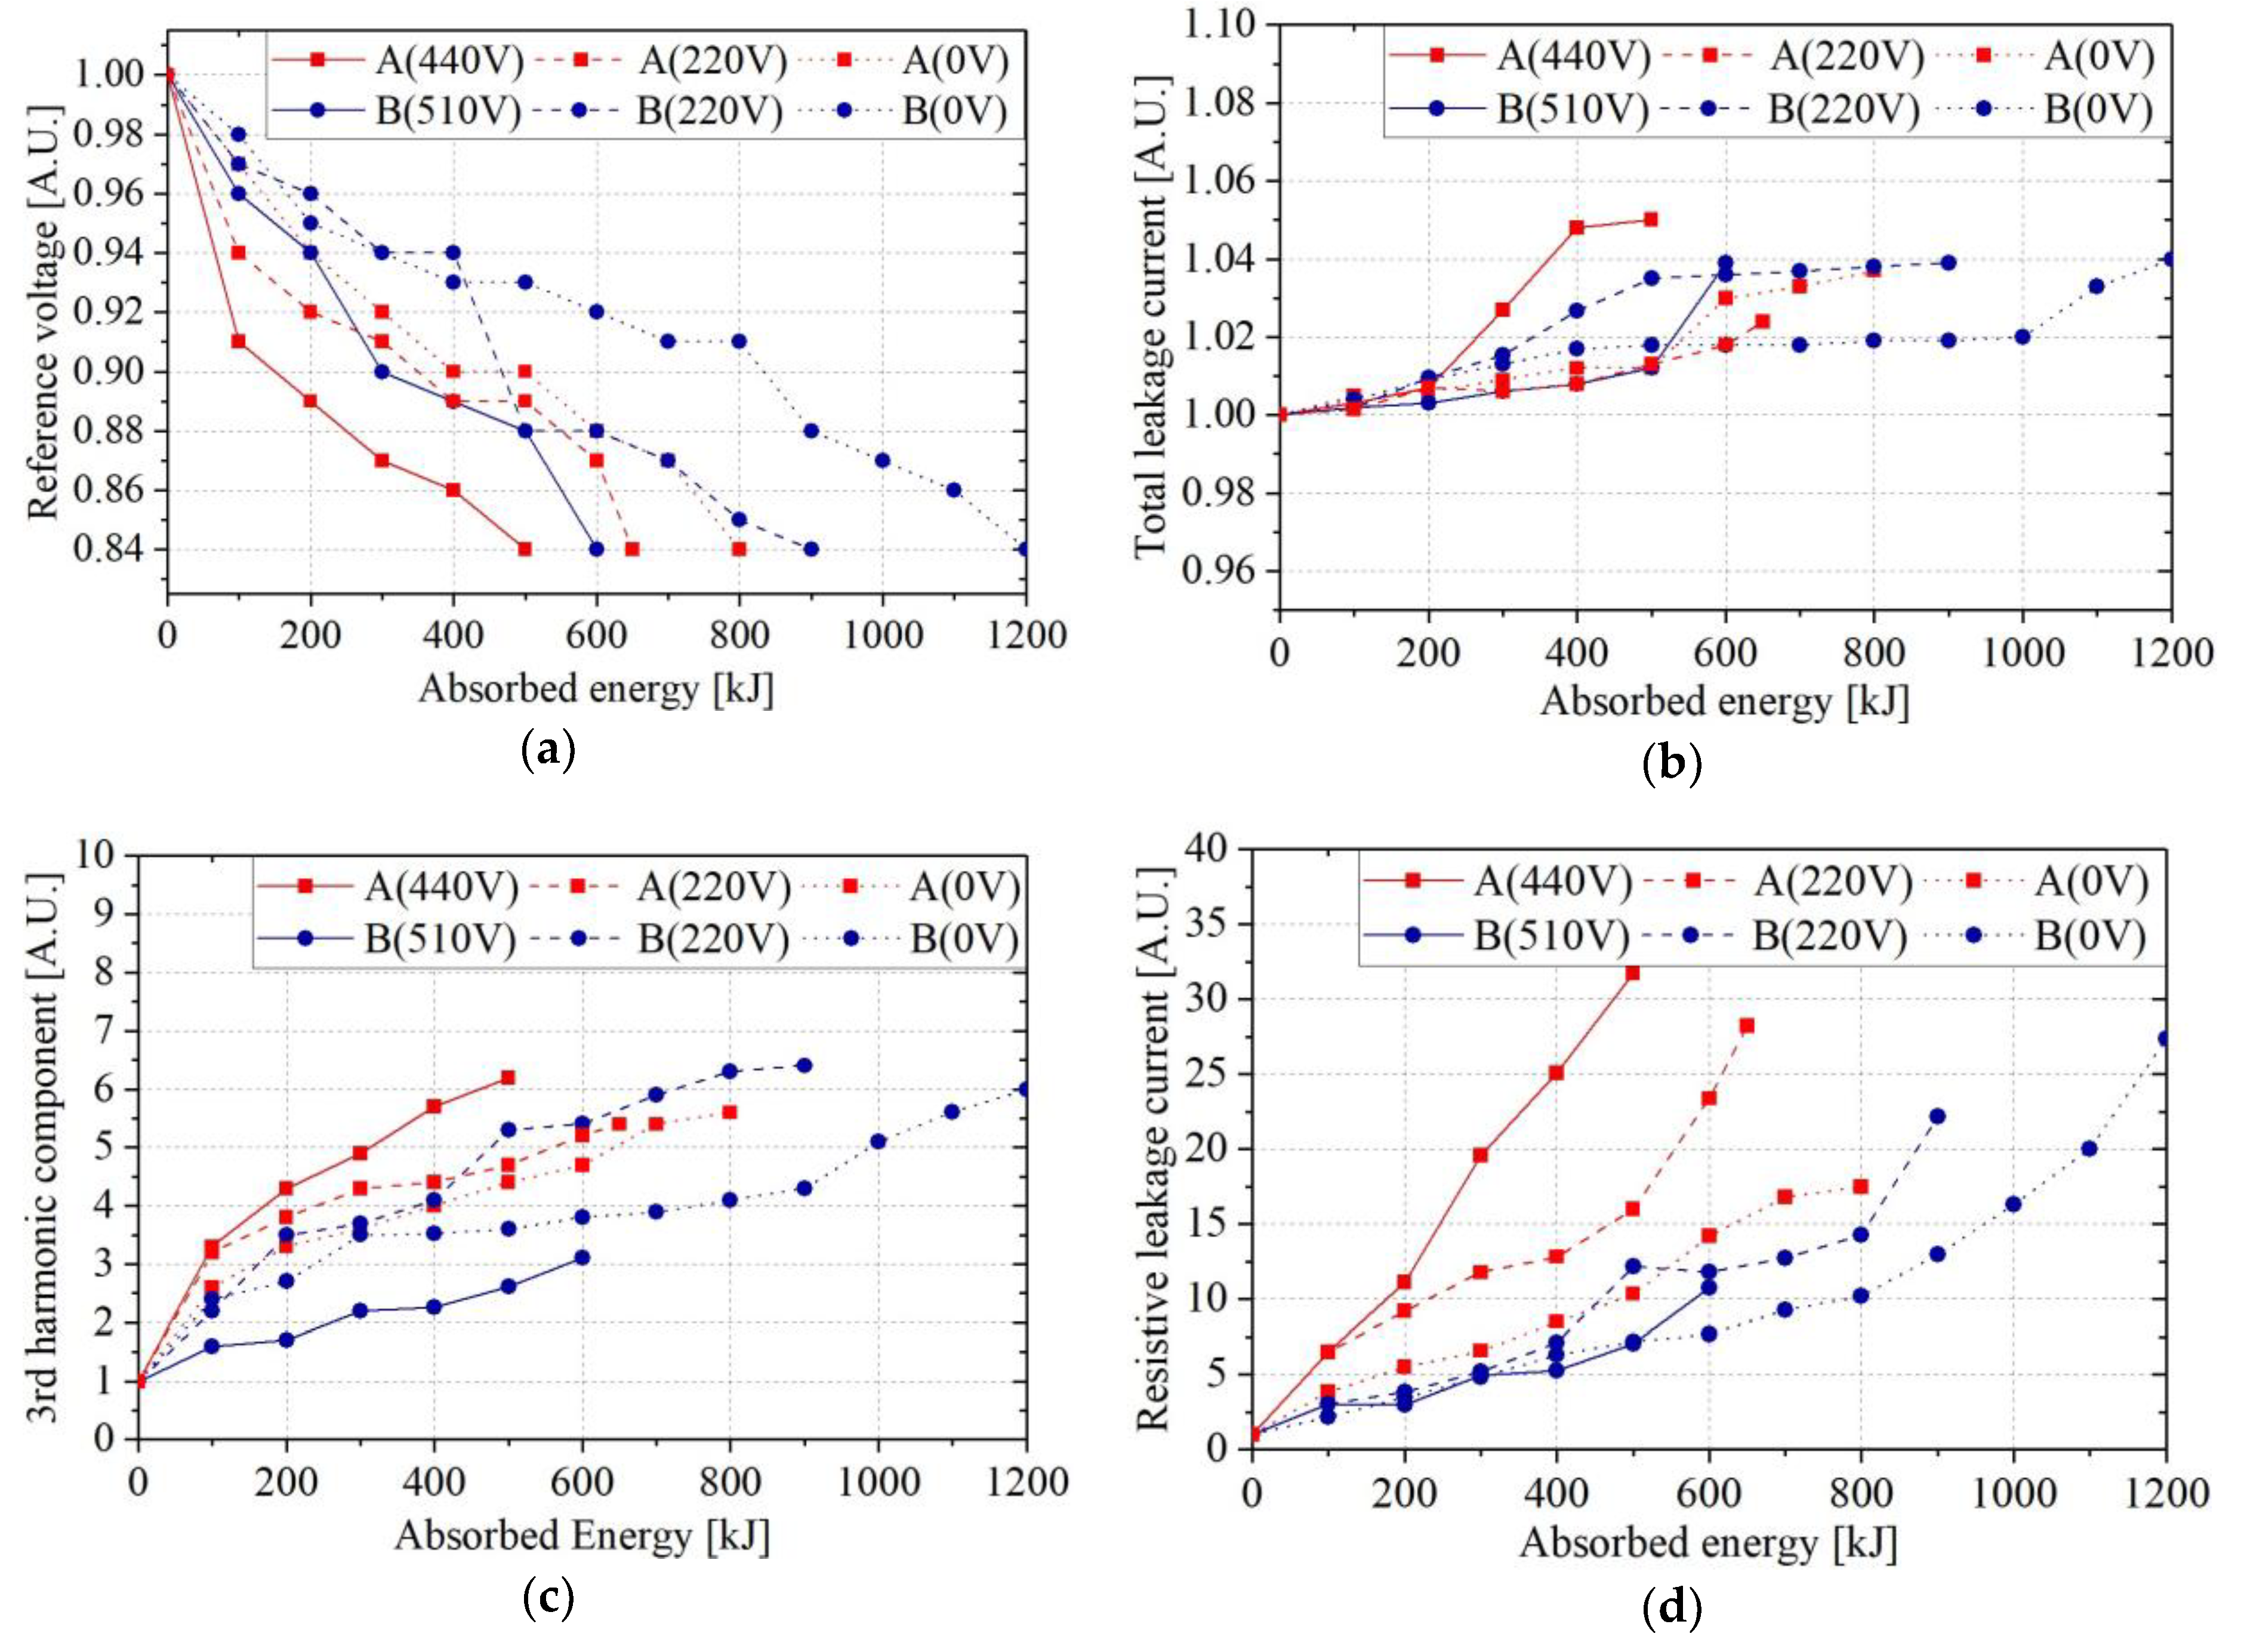
To analyze the change rates of electrical parameters with MOV operating conditions,
Figure 7 shows the comparisons of change rates in electrical parameters with MOV operating conditions. It can be seen that the MOVs deteriorated more quickly when the magnitude of the MOV operating voltage was at the same absorbed energy. The absorbed energies of Samples A and B decreased from 800 to 500 kJ and from 1200 to 600 kJ, respectively, at the MCOV compared with the de-energized condition until the reference voltage decreased to about 15%. The results of the experiment show that a 15% reduction of the reference voltage in the energy-accredited state of absorption, which is judged to be a major degradation factor, occurred in the energy-concentration state alone, and about twice the amount of energy consumed, or 1200 kJ, was required to absorb 1200 kJ of energy. Accordingly, the total leakage current, the leakage current of the resistor, and the leakage current of the third harmonic component could be seen to increase to suit the degree of deterioration.
5. Results and Discussion
The existing accelerated degradation test for evaluating MOV deterioration is performed by off-line measurement under de-energized conditions. However, an on-line method is essential to evaluate MOV deterioration reliably, since the deterioration of MOVs progresses under energized conditions.
In this study, a surge generator with CDN was designed and fabricated to apply a surge current to MOVs under energized conditions to simulate an actual MOV operating environment. Besides, three parameters—total leakage current, resistive leakage current, and third harmonic leakage component—were measured under energized conditions and compared with the reference voltage under de-energized conditions to select the optimal parameter for evaluating MOV deterioration in an actual operating environment.
Compared with the de-energized condition, it was confirmed that the MOV deteriorated more quickly under energized conditions—such as AC power frequency voltage and MCOV—than under a de-energized condition. The absorbed energies of Samples A and B at MCOV were reduced by 300 and 600 kJ, respectively, until the reference voltage decreased to about 15%.
The total leakage currents of the three measured parameters are not suitable for on-line measurement due to the small change rates compared to reference voltage changes. The change rate of the resistive leakage current is the largest of the parameters, but its detection circuit is complicated and it has low accuracy due to its initial value being too small. However, the third harmonic component can be useful for the on-line measurement of MOVs because it changes significantly and can be easily detected.
From the results, it was confirmed that the level of MOV deterioration was different between de-energized conditions and energized conditions and that the optimal parameter for on-line measurement was the third harmonic component. Therefore, the results in this paper can be expected to be useful as basic data for the evaluation of MOV deterioration in an actual operating environment.
Author Contributions
N.-H.K. performed the formal analysis and collected the data. S.-W.K. conceived and designed the experiment and analysis. S.-W.K. wrote the paper and G.-s.K. performed the review, editing and supervision. All authors have read and agreed to the published version of the manuscript.
Funding
This research was funded by the Technology Innovation Program (No. 20010965, Development of Electronic Current Voltage Transformer and Spacer based on eco-friendly solid insulation) funded by the Ministry of Trade, Industry & Energy (MOTIE) and the Korea Evaluation Institute of Industrial Technology (KEIT) of the Republic of Korea.
Conflicts of Interest
The authors declare no conflict of interest.
References
- Kil, G.S.; Han, J.S.; Han, M.S. A Study on the deterioration progress of railway arresters. J. Korean Soc. Railw. 2004, 7, 307–311. [Google Scholar]
- Kil, G.S.; Song, J.Y.; Kim, I.K.; Moon, S.B.; Shin, G.C. Diagnostic techniques of lightning arresters for DC electric traction vehicles. J. Korean Soc. Railw. 2006, 9, 357–361. [Google Scholar]
- Kim, W.H.; Hwang, S.C.; Wang, G.; Kil, G.S.; Ahn, C.H. Electrical characteristic changes of ZnO varistors by energy absorption. J. Korean Inst. Electr. Electron. Mater. Eng. 2017, 30, 817–821. [Google Scholar]
- Yan, X.; Wen, Y.; Yi, X. Study on the resistive leakage current characteristic of MOV surge arresters. In Proceedings of the IEEE/PES Transmission and Distribution Conference and Exhibition, Yokohama, Japan, 6–10 October 2002; pp. 683–687. [Google Scholar]
- Bokoro, P.N. A review of leakage current-based condition assessment of gapless surge arresters. In Proceedings of the International Conference on Power and Energy Systems, Gaborone, Botswana, 5–7 September 2016. [Google Scholar]
- Lundquist, J.; Stenstrom, L.; Schei, A.; Hansen, B. New method for measurement of the resistive leakage currents of metal-oxide surge arresters in service. IEEE Trans. Power Deliv. 1990, 5, 1811–1822. [Google Scholar] [CrossRef]
- Christodoulou, C.A.; Avgerinos, M.V.; Ekonomou, L.; Gonos, I.F.; Stathopulos, I.A. Measurement of the resistive leakage current in surge arresters under artificial rain test and impulse voltage subjection. IET Sci. Meas. Technol. 2009, 3, 256–262. [Google Scholar] [CrossRef]
- International Electrotechnical Commission. Electromagnetic Compatibility (EMC)—Part 4-5: Testing and Measurement Techniques—Surge Immunity Test; IEC 61000-4-5; International Electrotechnical Commission: Geneva, Switzerland, 2014. [Google Scholar]
- Wang, G.M.; Kim, W.H.; Kil, G.S. Design of a surge generator using coupling and decoupling network for energized test. In Proceedings of the 2018 Spring Conference of the Korea Society for Railway, Mokpo, Korea; 2018; pp. 236–237. [Google Scholar]
- International Electrotechnical Commission. Components for Low-voltage Surge Protective Devices—Part 331: Performance Requirements and Test Methods for Metal Oxide Varistors (MOV); IEC 61643-331; International Electrotechnical Commission: Geneva, Switzerland, 2017. [Google Scholar]
- Khodsuz, M. Evaluation of ultraviolet ageing, pollution and varistor degradation effects on harmonic contents of surge arrester leakage current. IET Sci. Meas. Technol. 2015, 9, 979–986. [Google Scholar] [CrossRef]
- Wang, G.M.; Kim, W.H.; Lee, J.H.; Kil, G.S. Condition monitoring and deterioration analysis of metal oxide varistor. J. Electr. Eng. 2018, 69, 352–358. [Google Scholar] [CrossRef]
- Han, Y. A Decomposition Method for the Total Leakage Current of MOA Based on Multiple Linear Regression. IEEE Trans. Power Deliv. 2016, 31, 1422–1428. [Google Scholar] [CrossRef]
- International Electrotechnical Commission. Surge arresters—Part 4: Metal-oxide Surge Arresters without Gaps for a.c. Systems; IEC 60099-4; International Electrotechnical Commission: Geneva, Switzerland, 2014. [Google Scholar]
- International Electrotechnical Commission. Components for Low-voltage Surge Protective Devices—Part 331: Performance Requirements and Test Methods for Gas Discharge Tubes (GDT); IEC 61643-331; International Electrotechnical Commission: Geneva, Switzerland, 2013. [Google Scholar]
© 2020 by the authors. Licensee MDPI, Basel, Switzerland. This article is an open access article distributed under the terms and conditions of the Creative Commons Attribution (CC BY) license (http://creativecommons.org/licenses/by/4.0/).


