A Novel Algorithm for MPPT of an Isolated PV System Using Push Pull Converter with Fuzzy Logic Controller


 ,
,  , ,
, ,  ,
,  ,
, 
Abstract
1. Introduction
- Design of fuzzy logic based MPPT, which can track the continuous power without oscillations and noise near the maximum point.
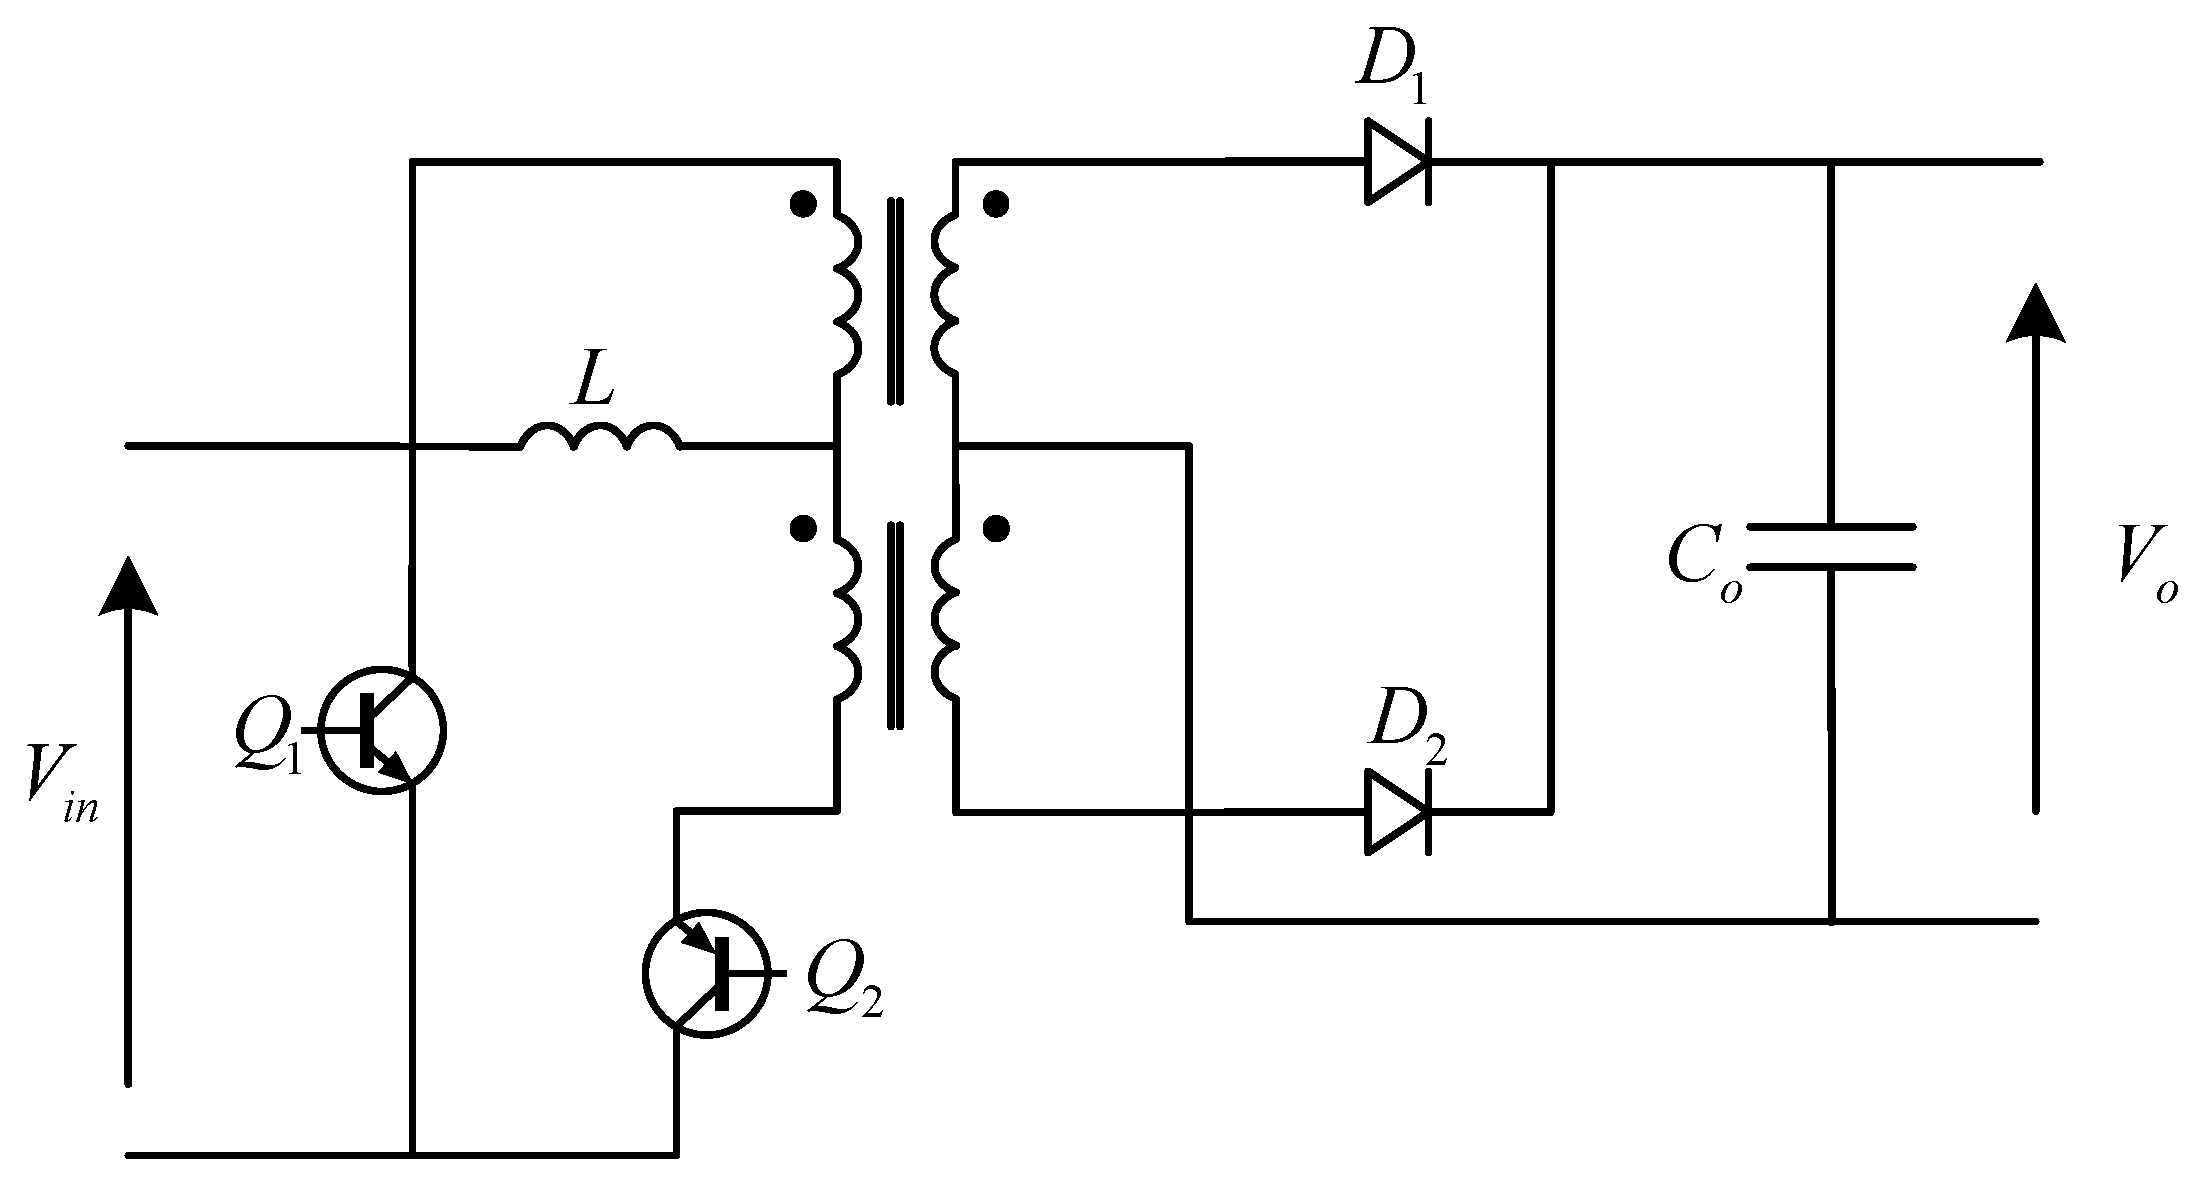
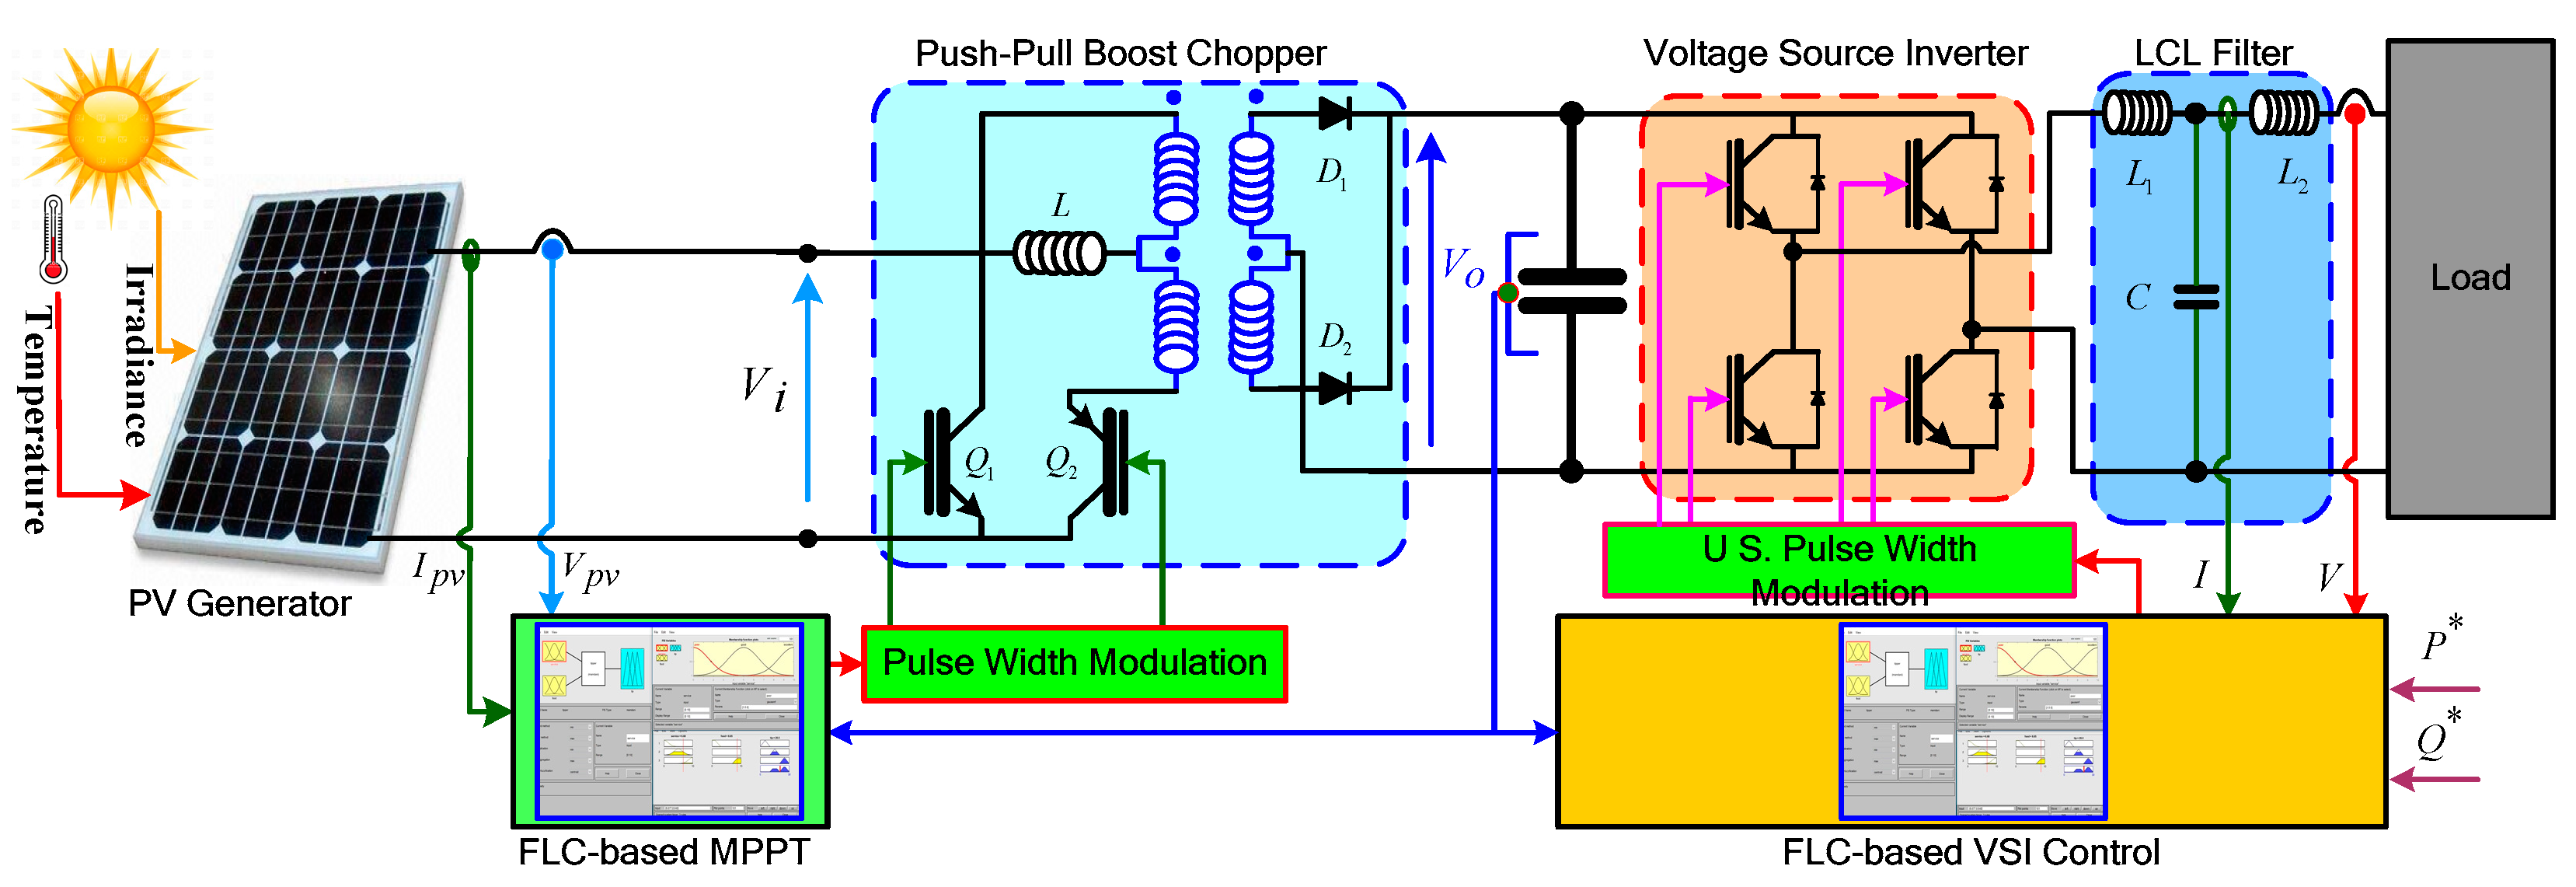
- Implementation of a push pull current-fed boost chopper in which high frequency transformer is used to provide the galvanic isolation between input and output, along with a high conversion ratio.
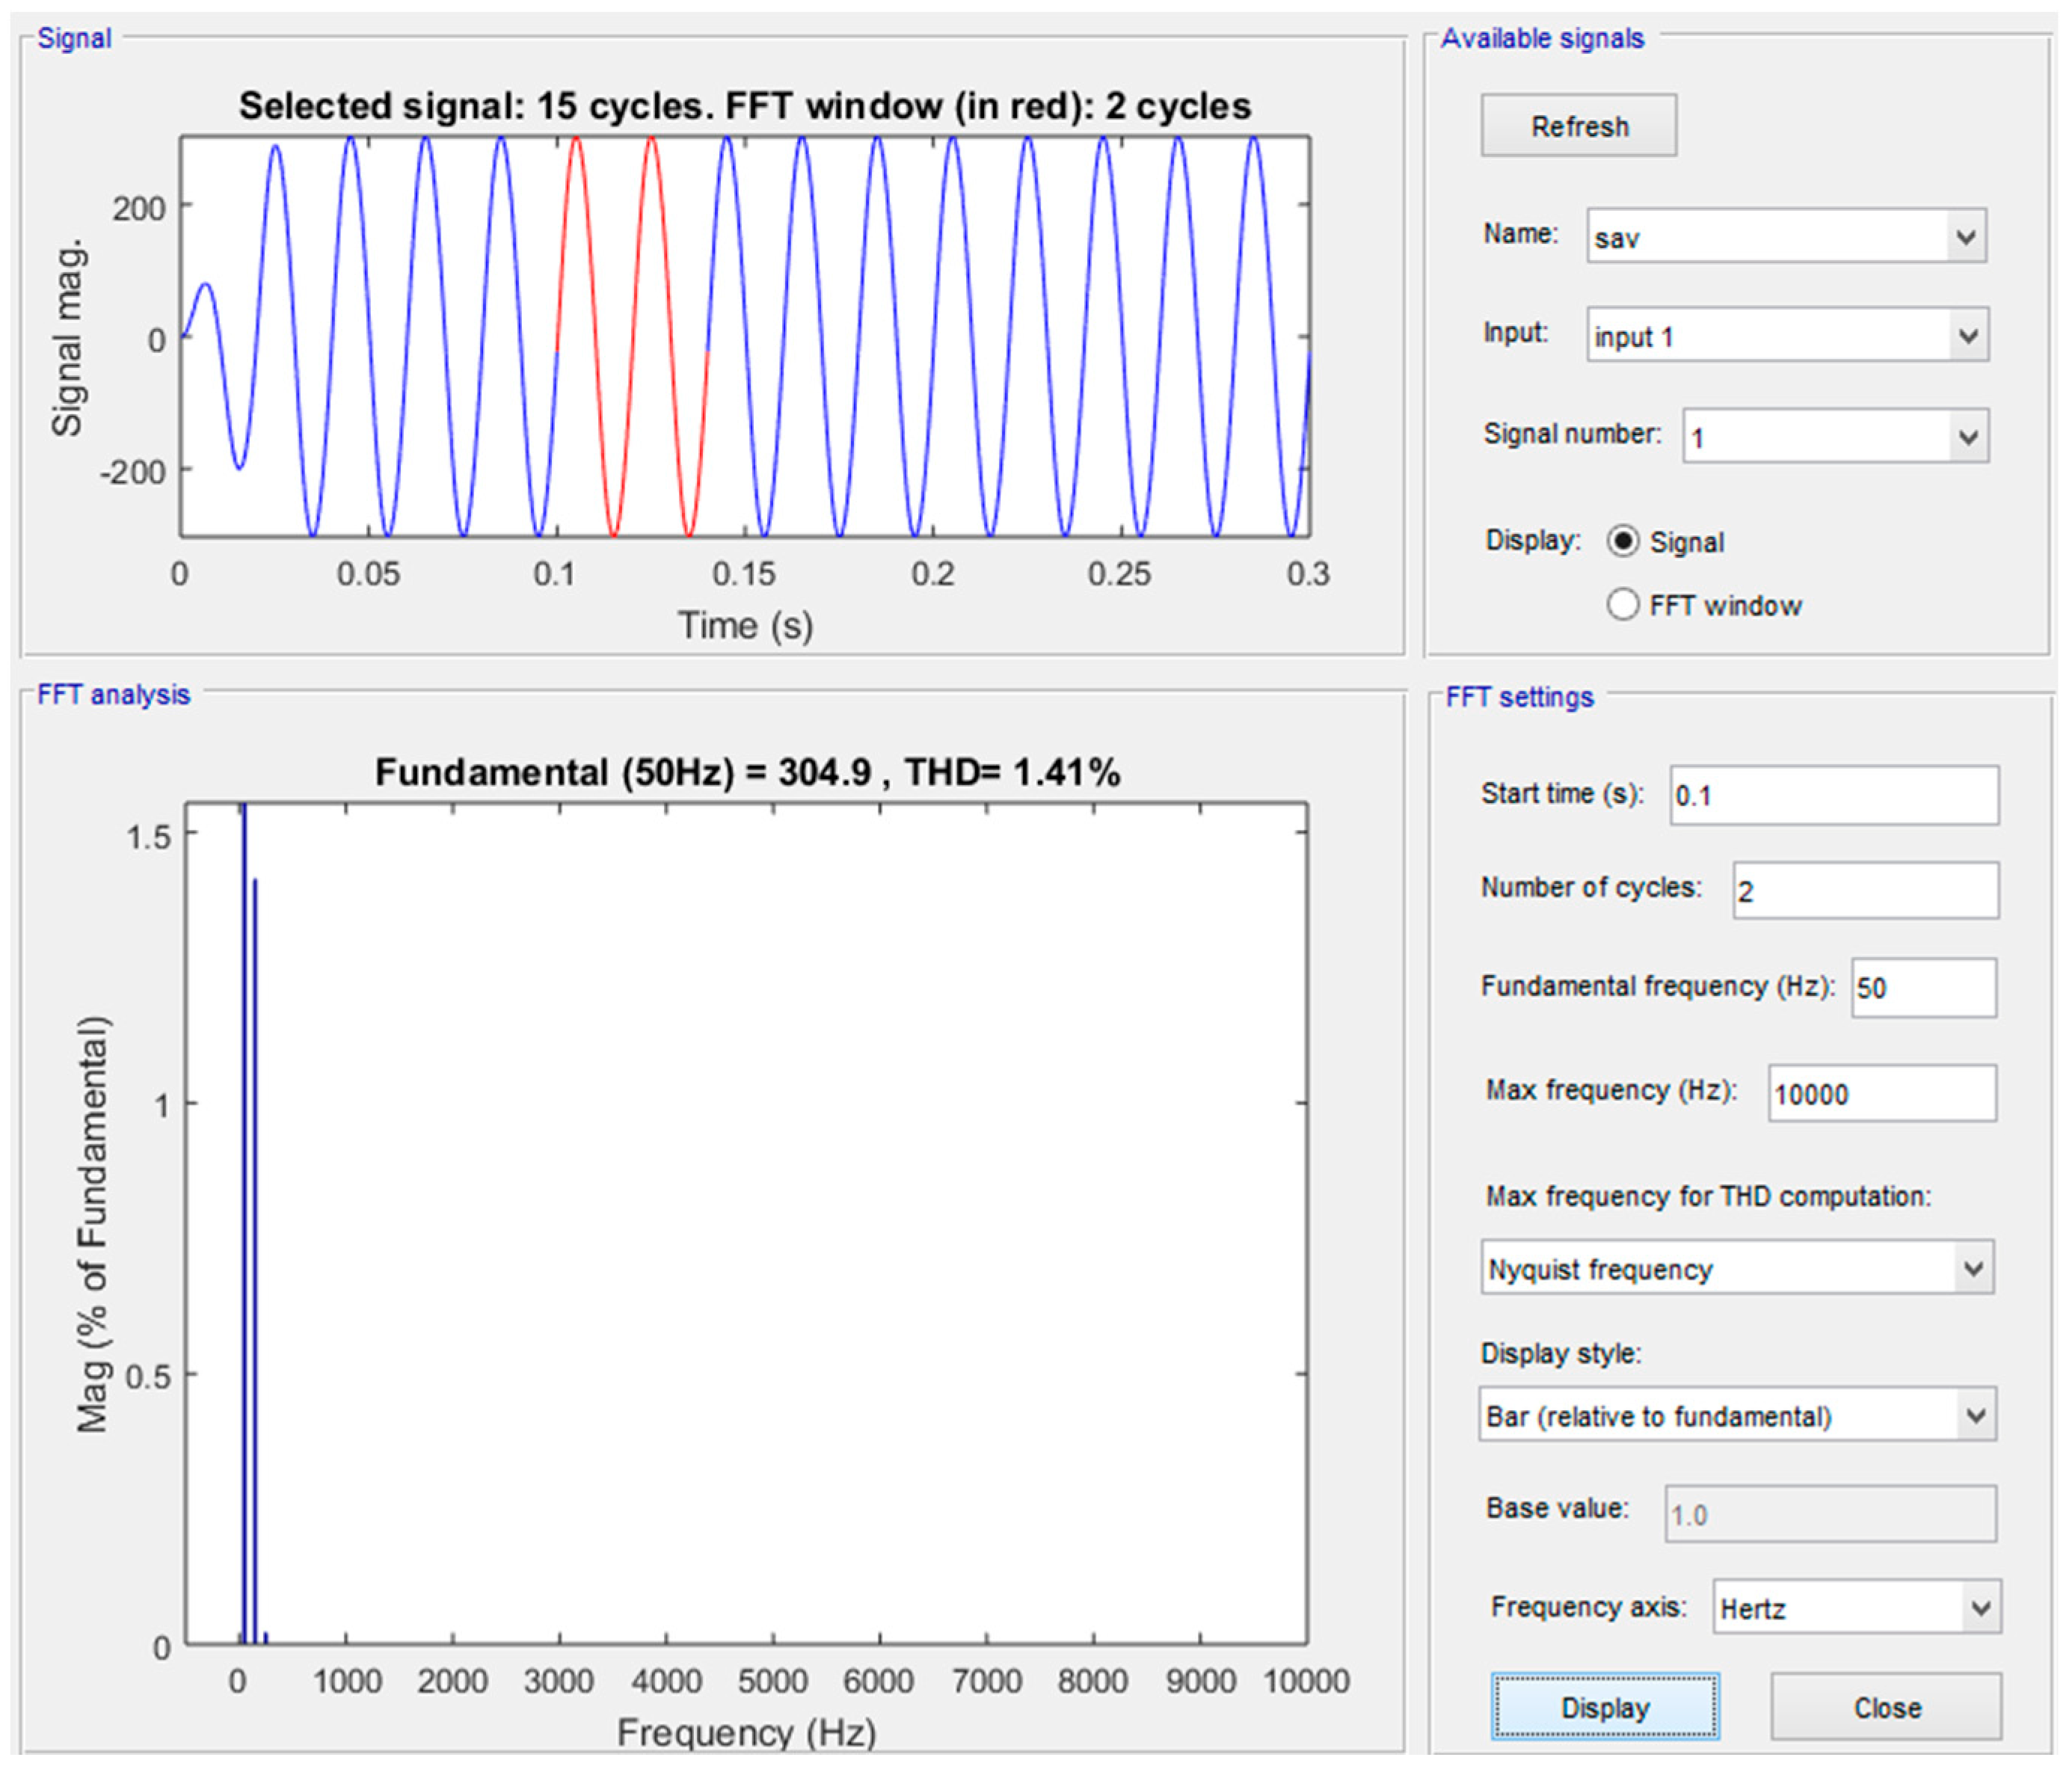
- Implementation of a voltage source inverter (VSI) with a fuzzy logic closed loop controller, which improves the power quality of the AC voltage and provides very low THD.
- Applications of two fuzzy logic controllers (FLCs) are employed in the proposed system and each has its unique fuzzy rule. The first one tracks the MPPT, and the second is used in VSI with a proper designed low pass filter to reduce the THD value.
2. Proposed Work Methodology
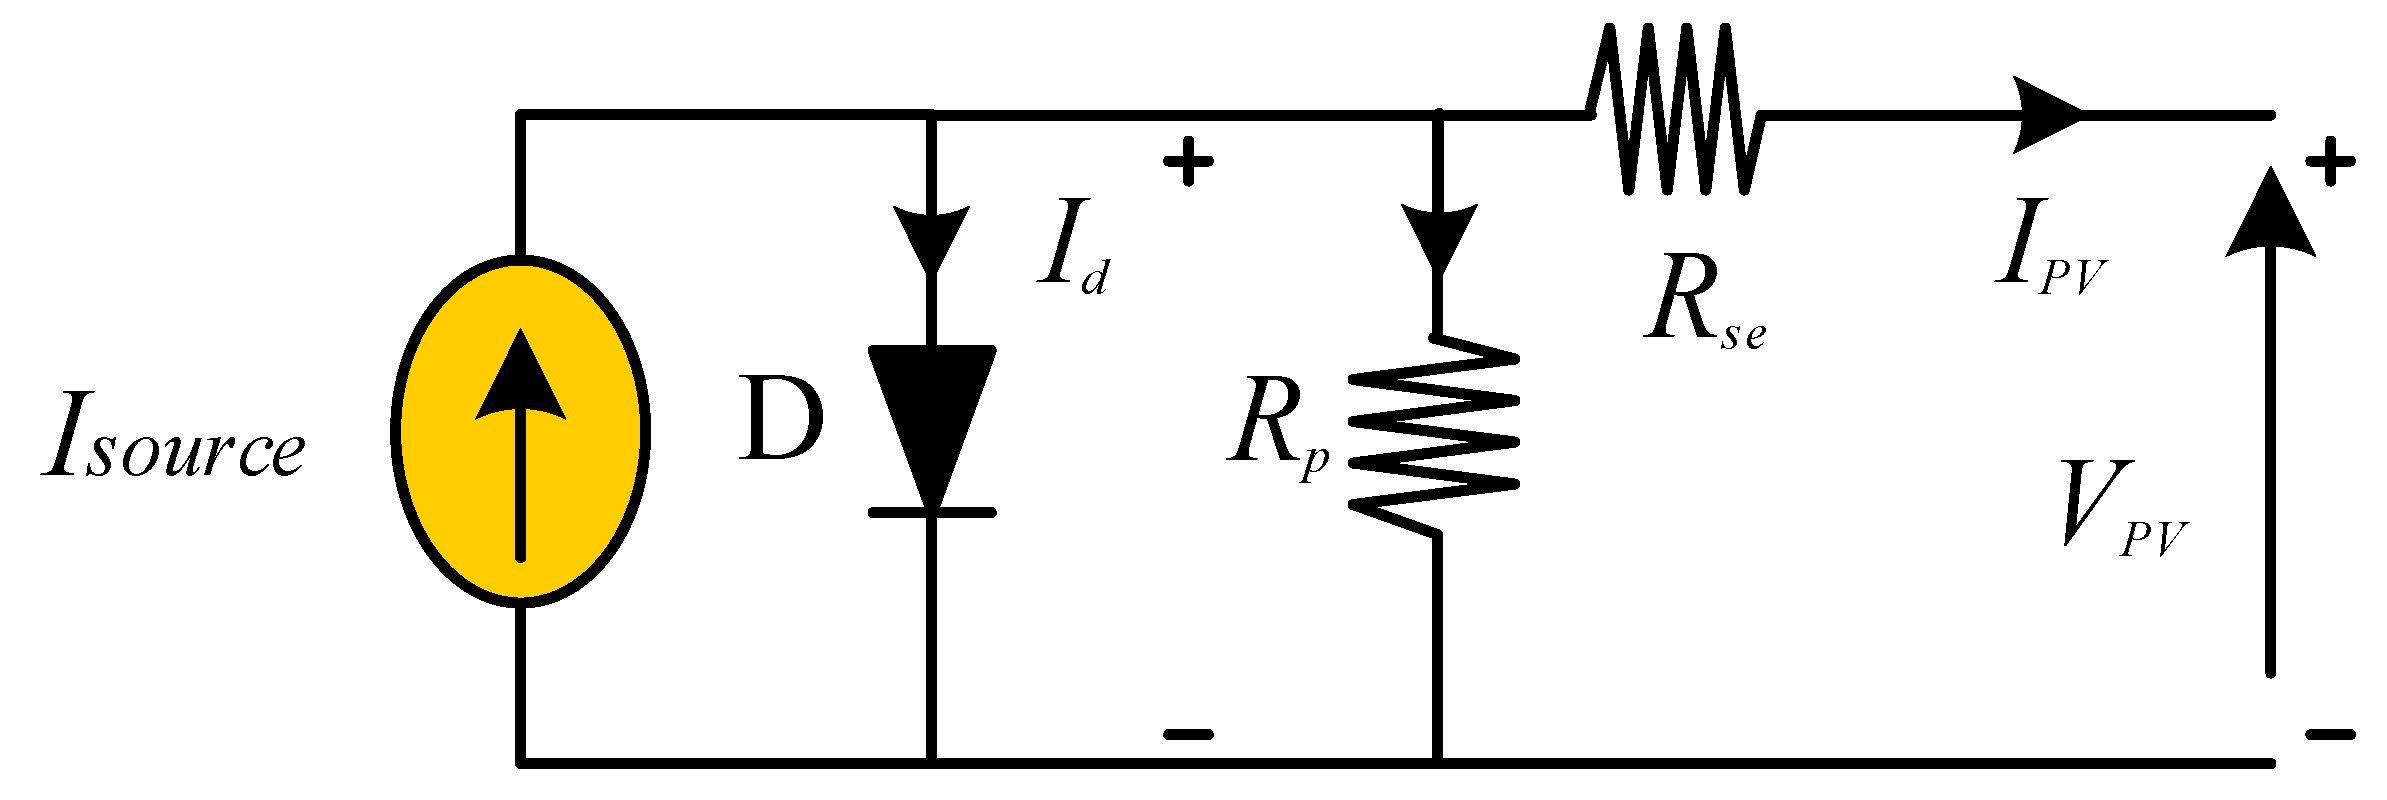
2.1. Solar Cell Equivalent Circuit
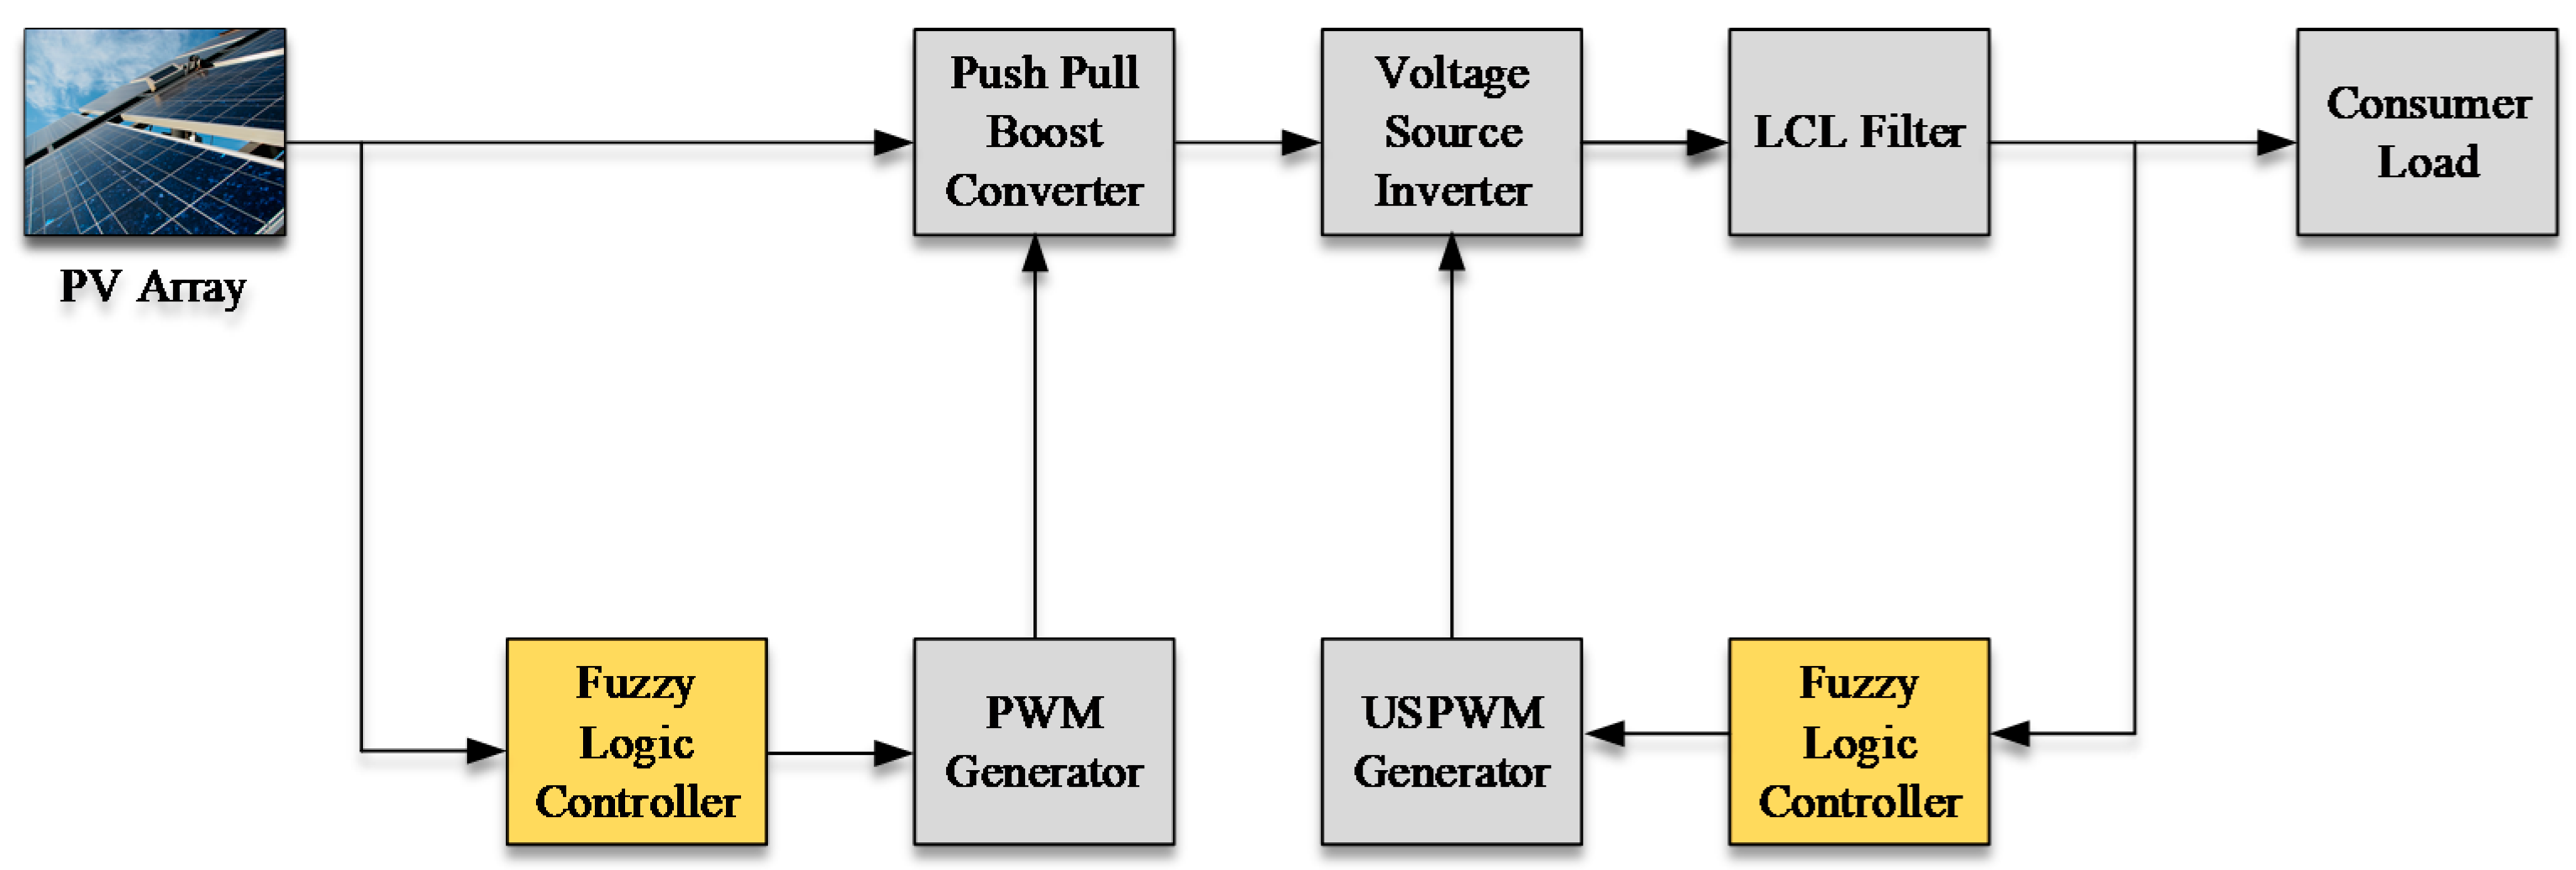
2.2. Proposed Topology
2.3. Fuzzy Logic Control
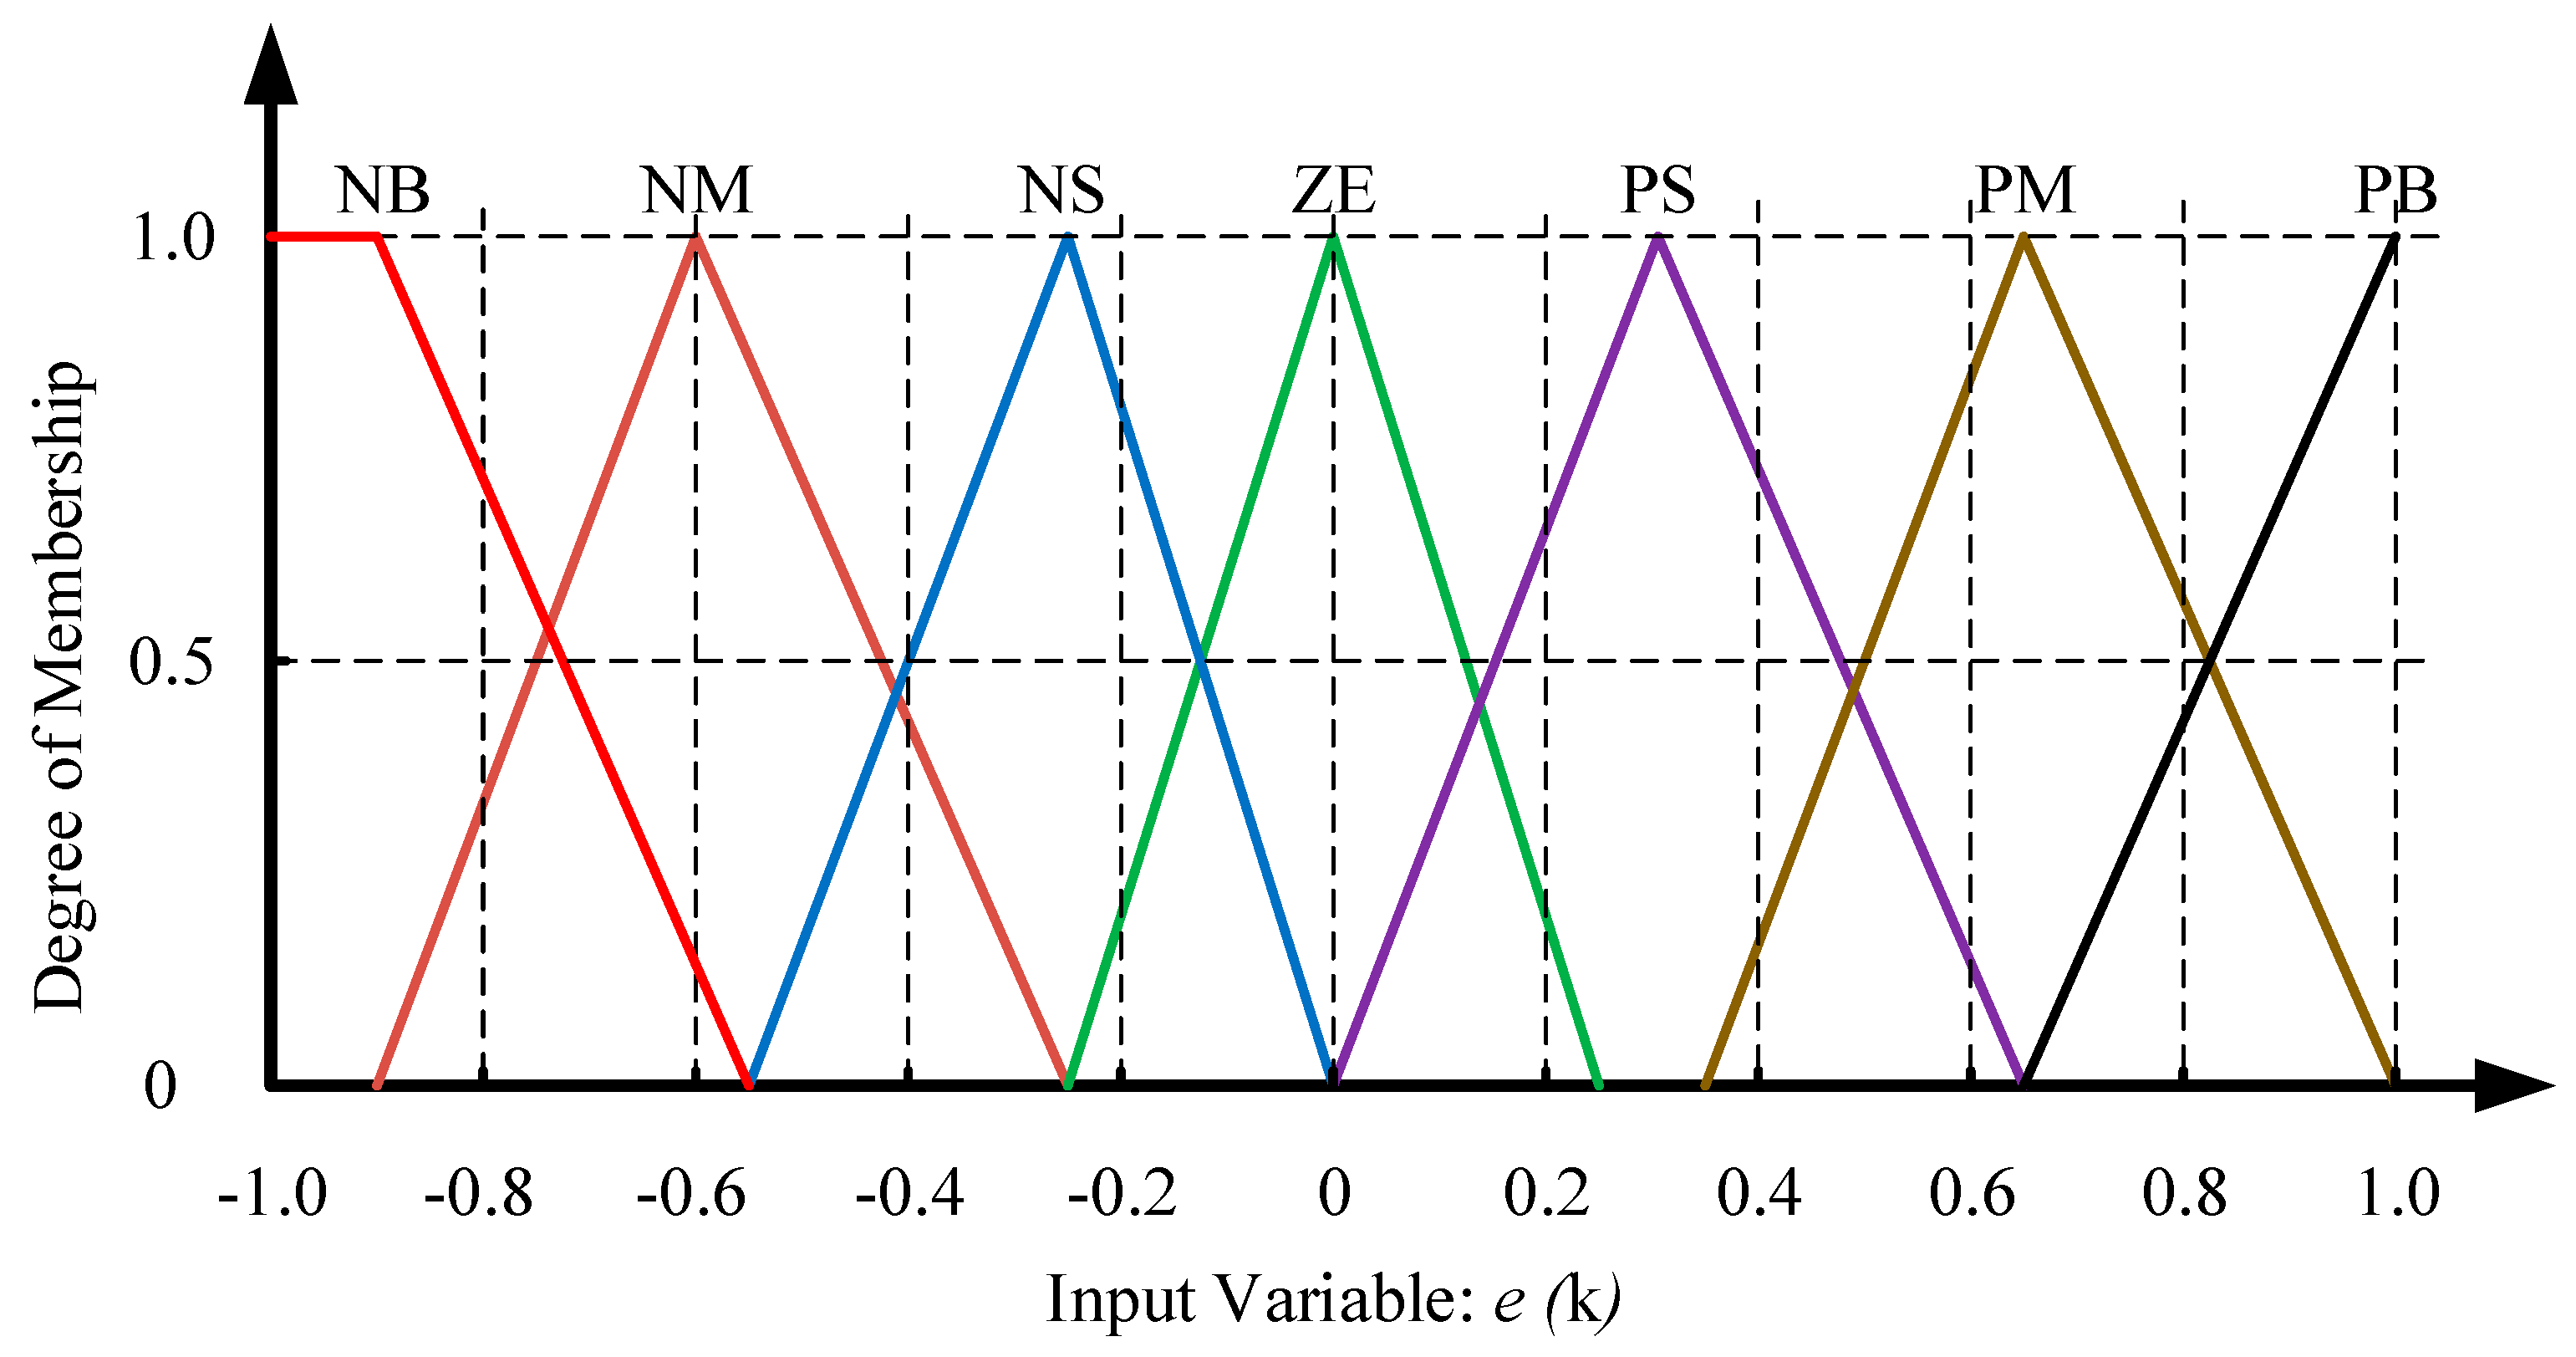
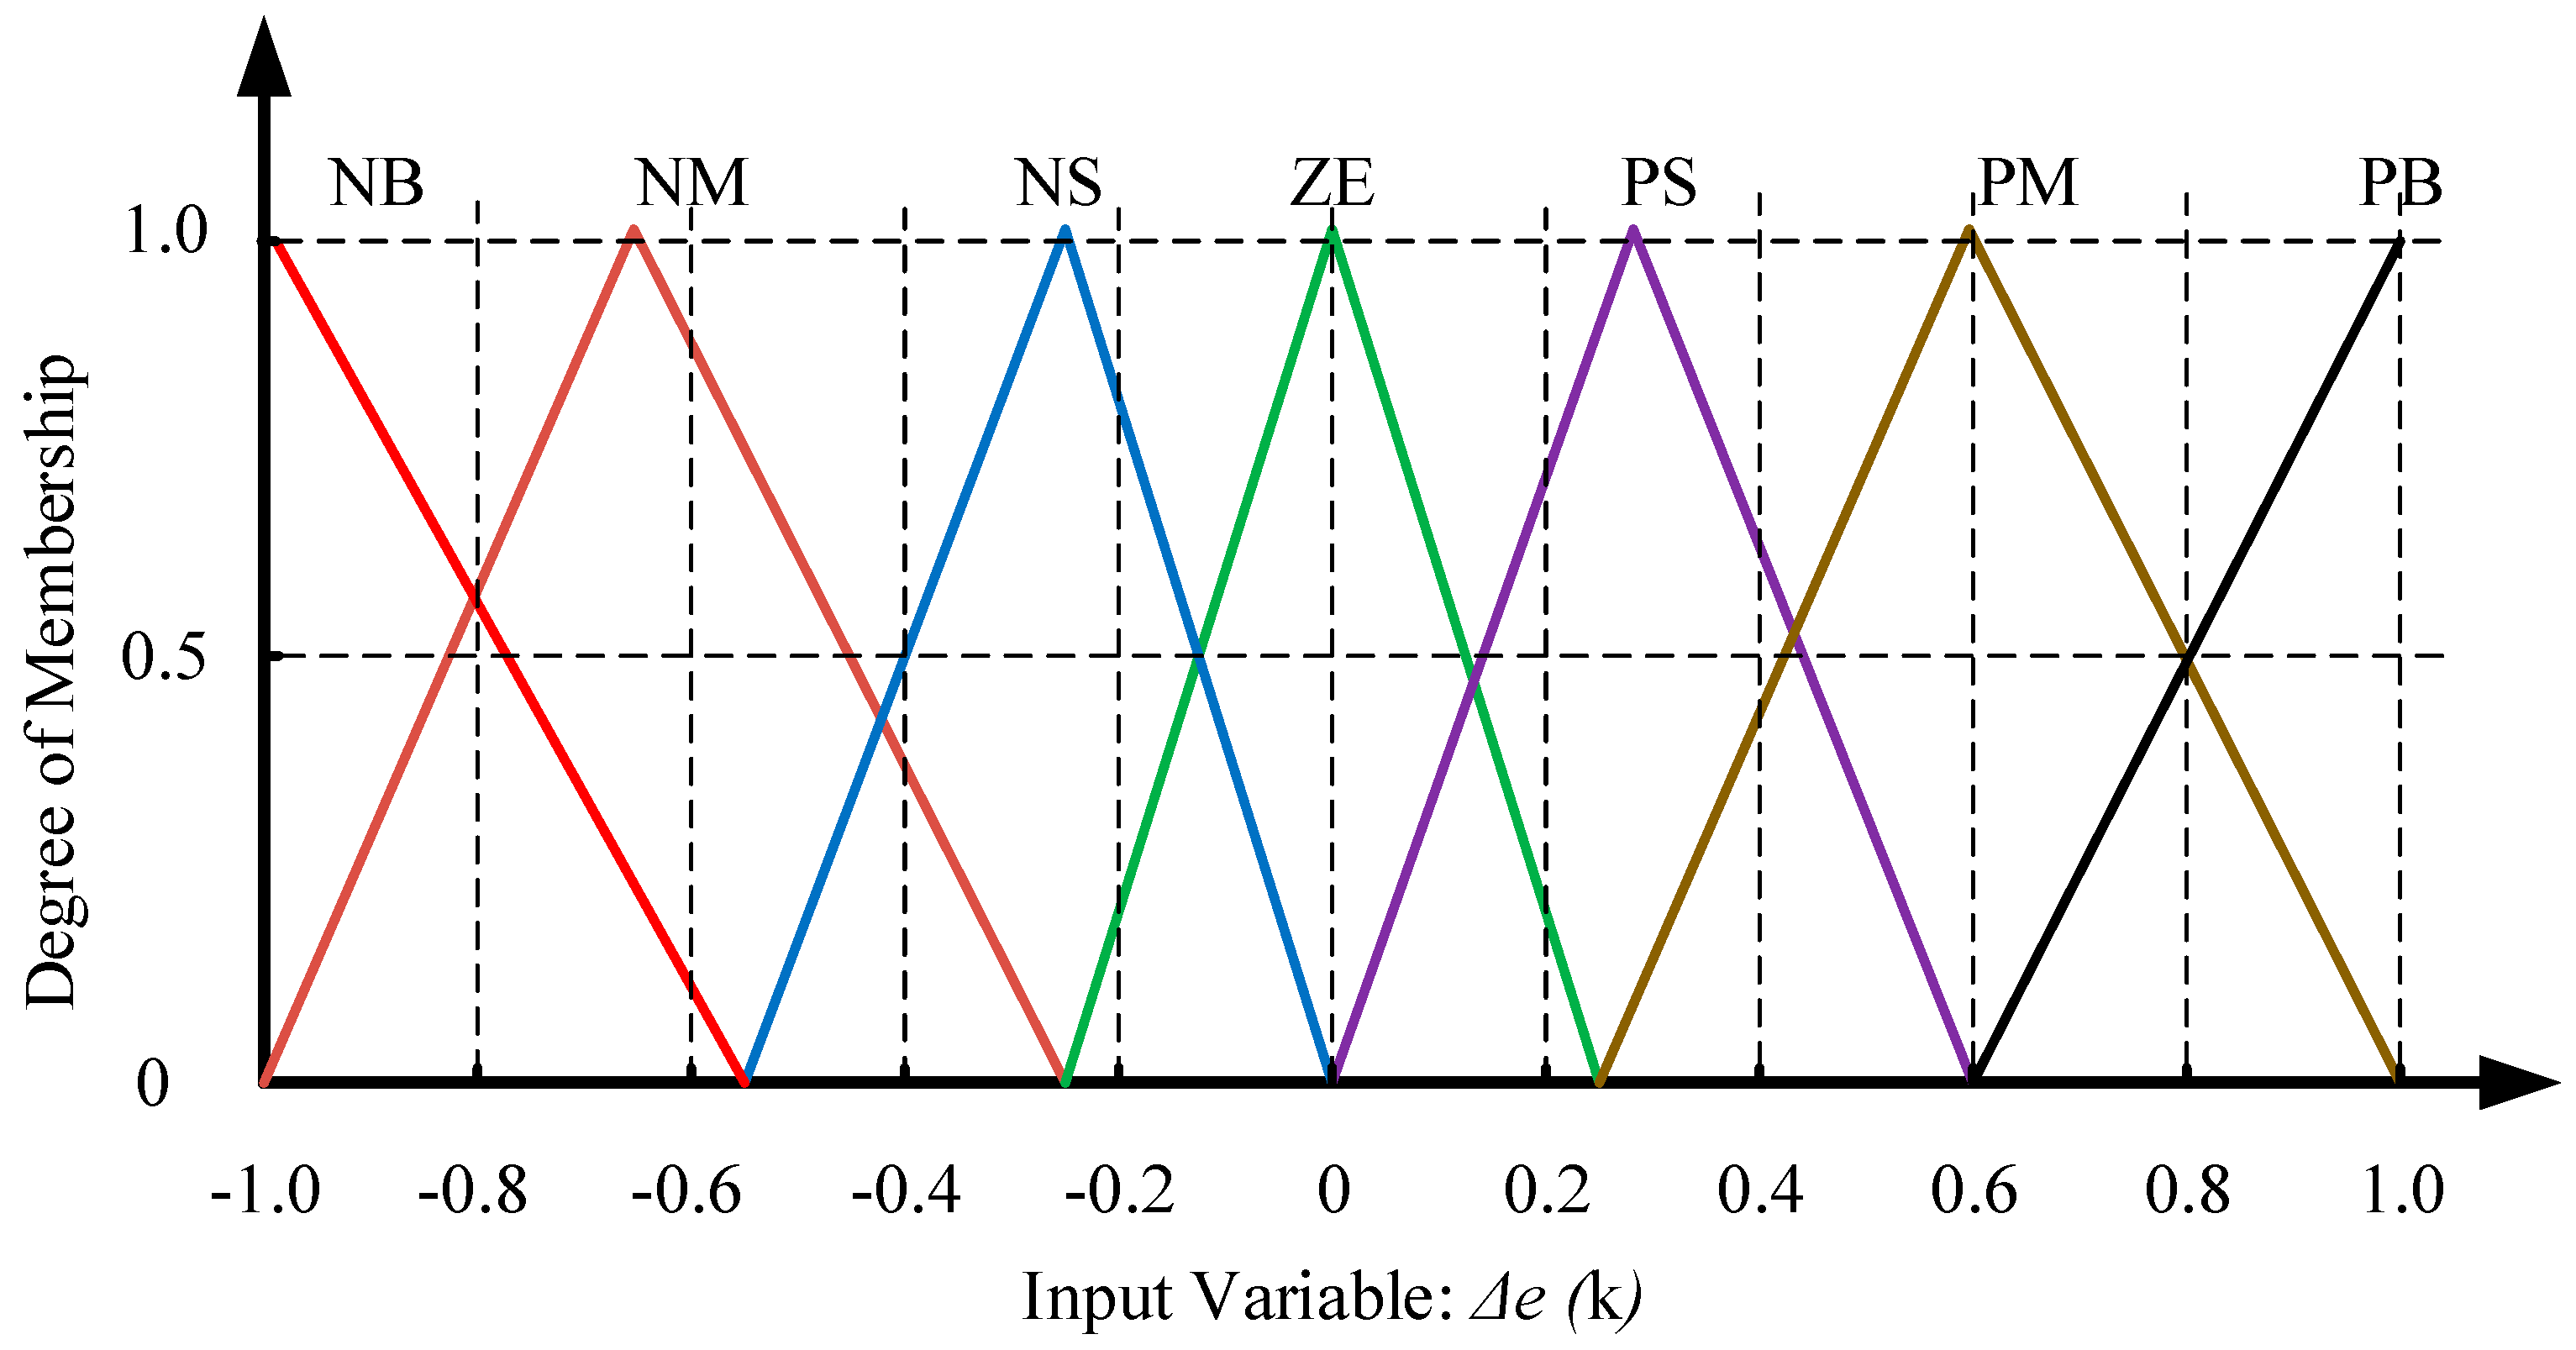
2.3.1. Fuzzifier
2.3.2. Interference
- Rule (1)
- IF X is A2 OR Y is B1 Then Z is C1
- Rule (2)
- IF X is A2 AND Y is B2 Then Z is C3
- Rule (3)
- IF X is A1 Then Z is C3
2.3.3. Defuzzification
3. Push Pull Converter and Its Design Aspects
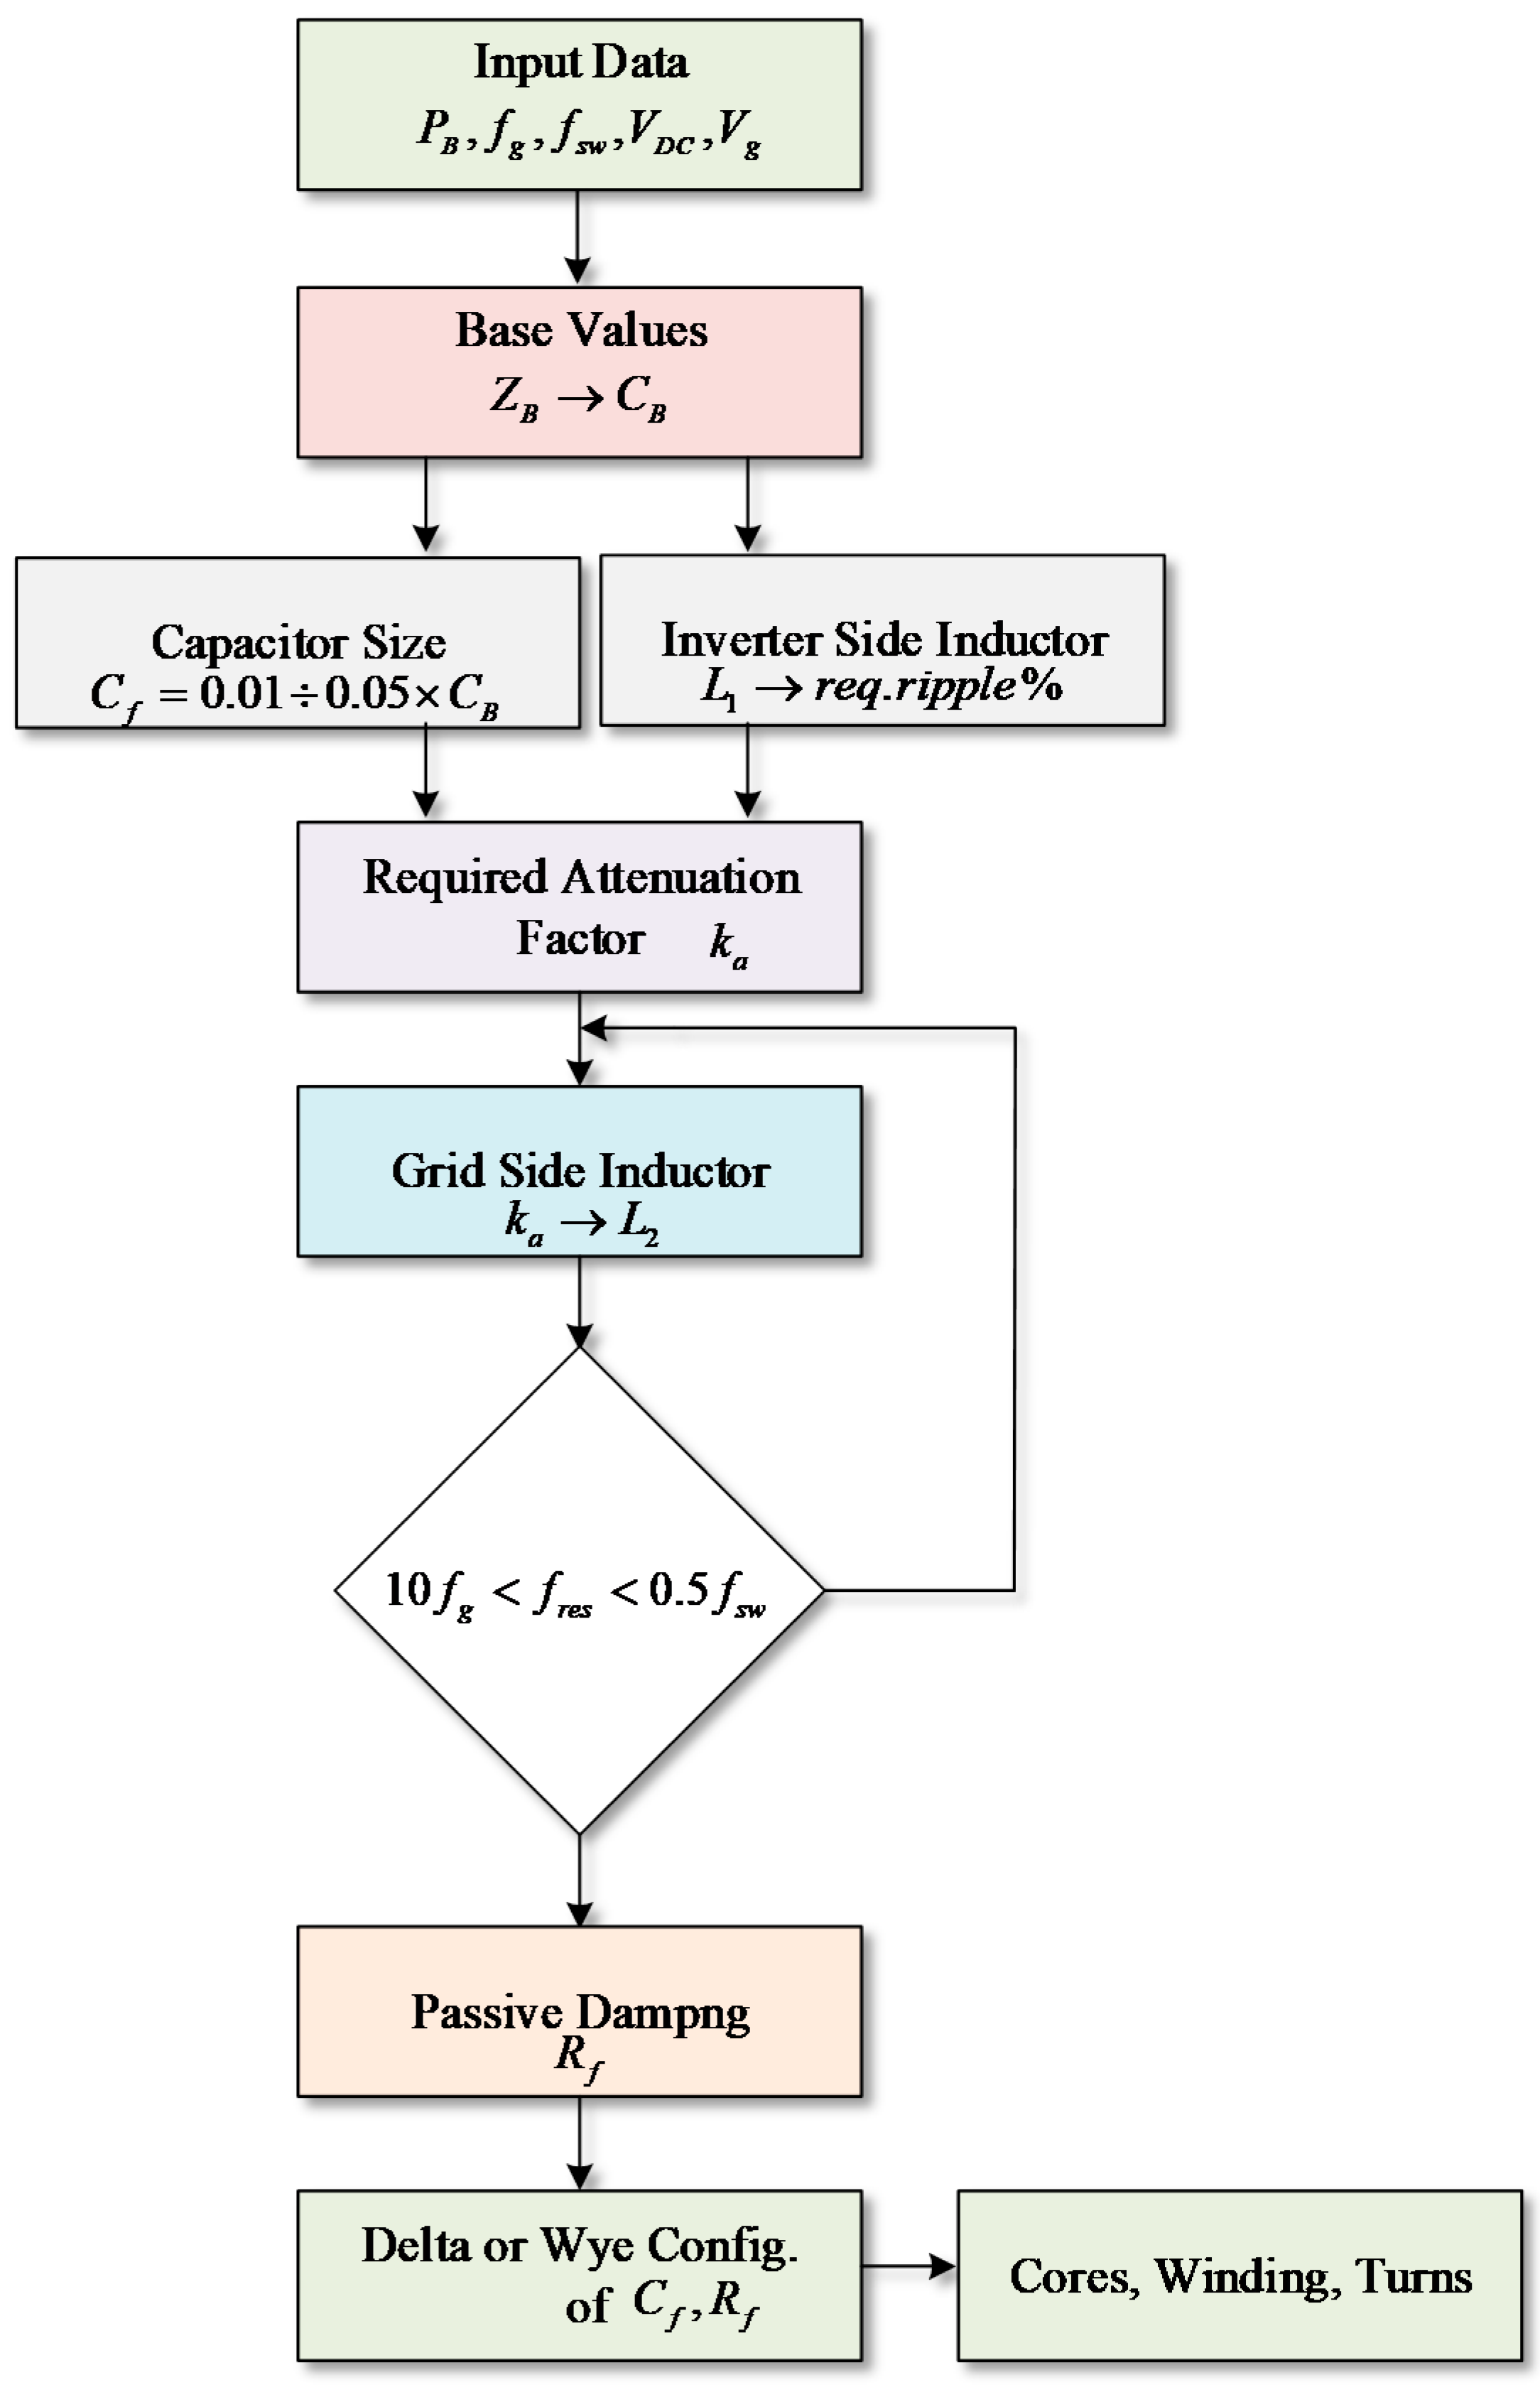
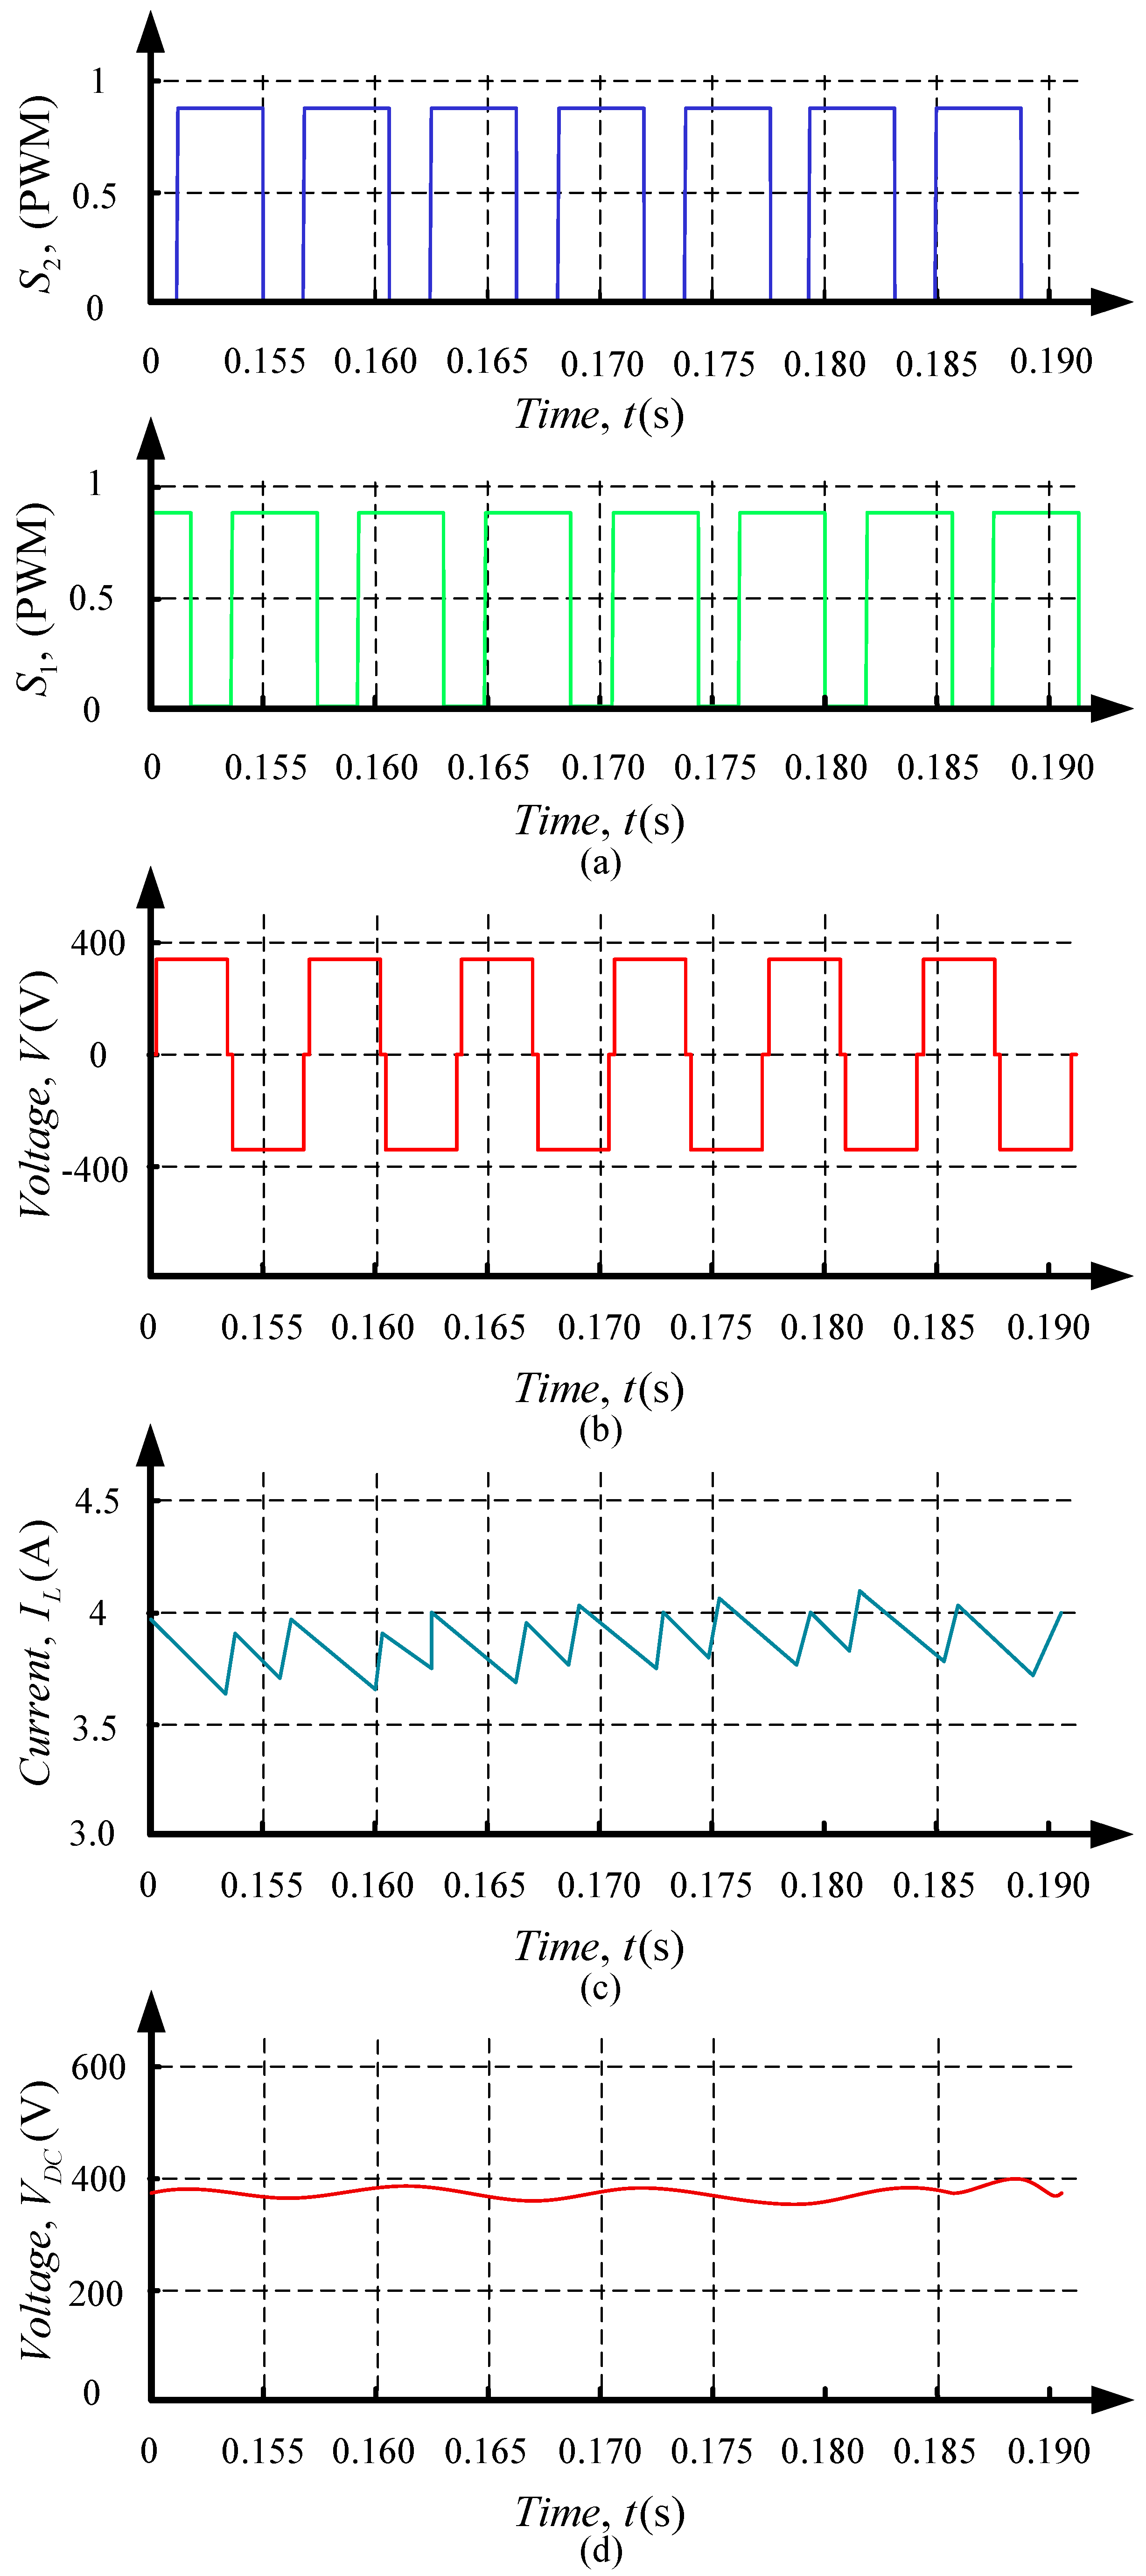
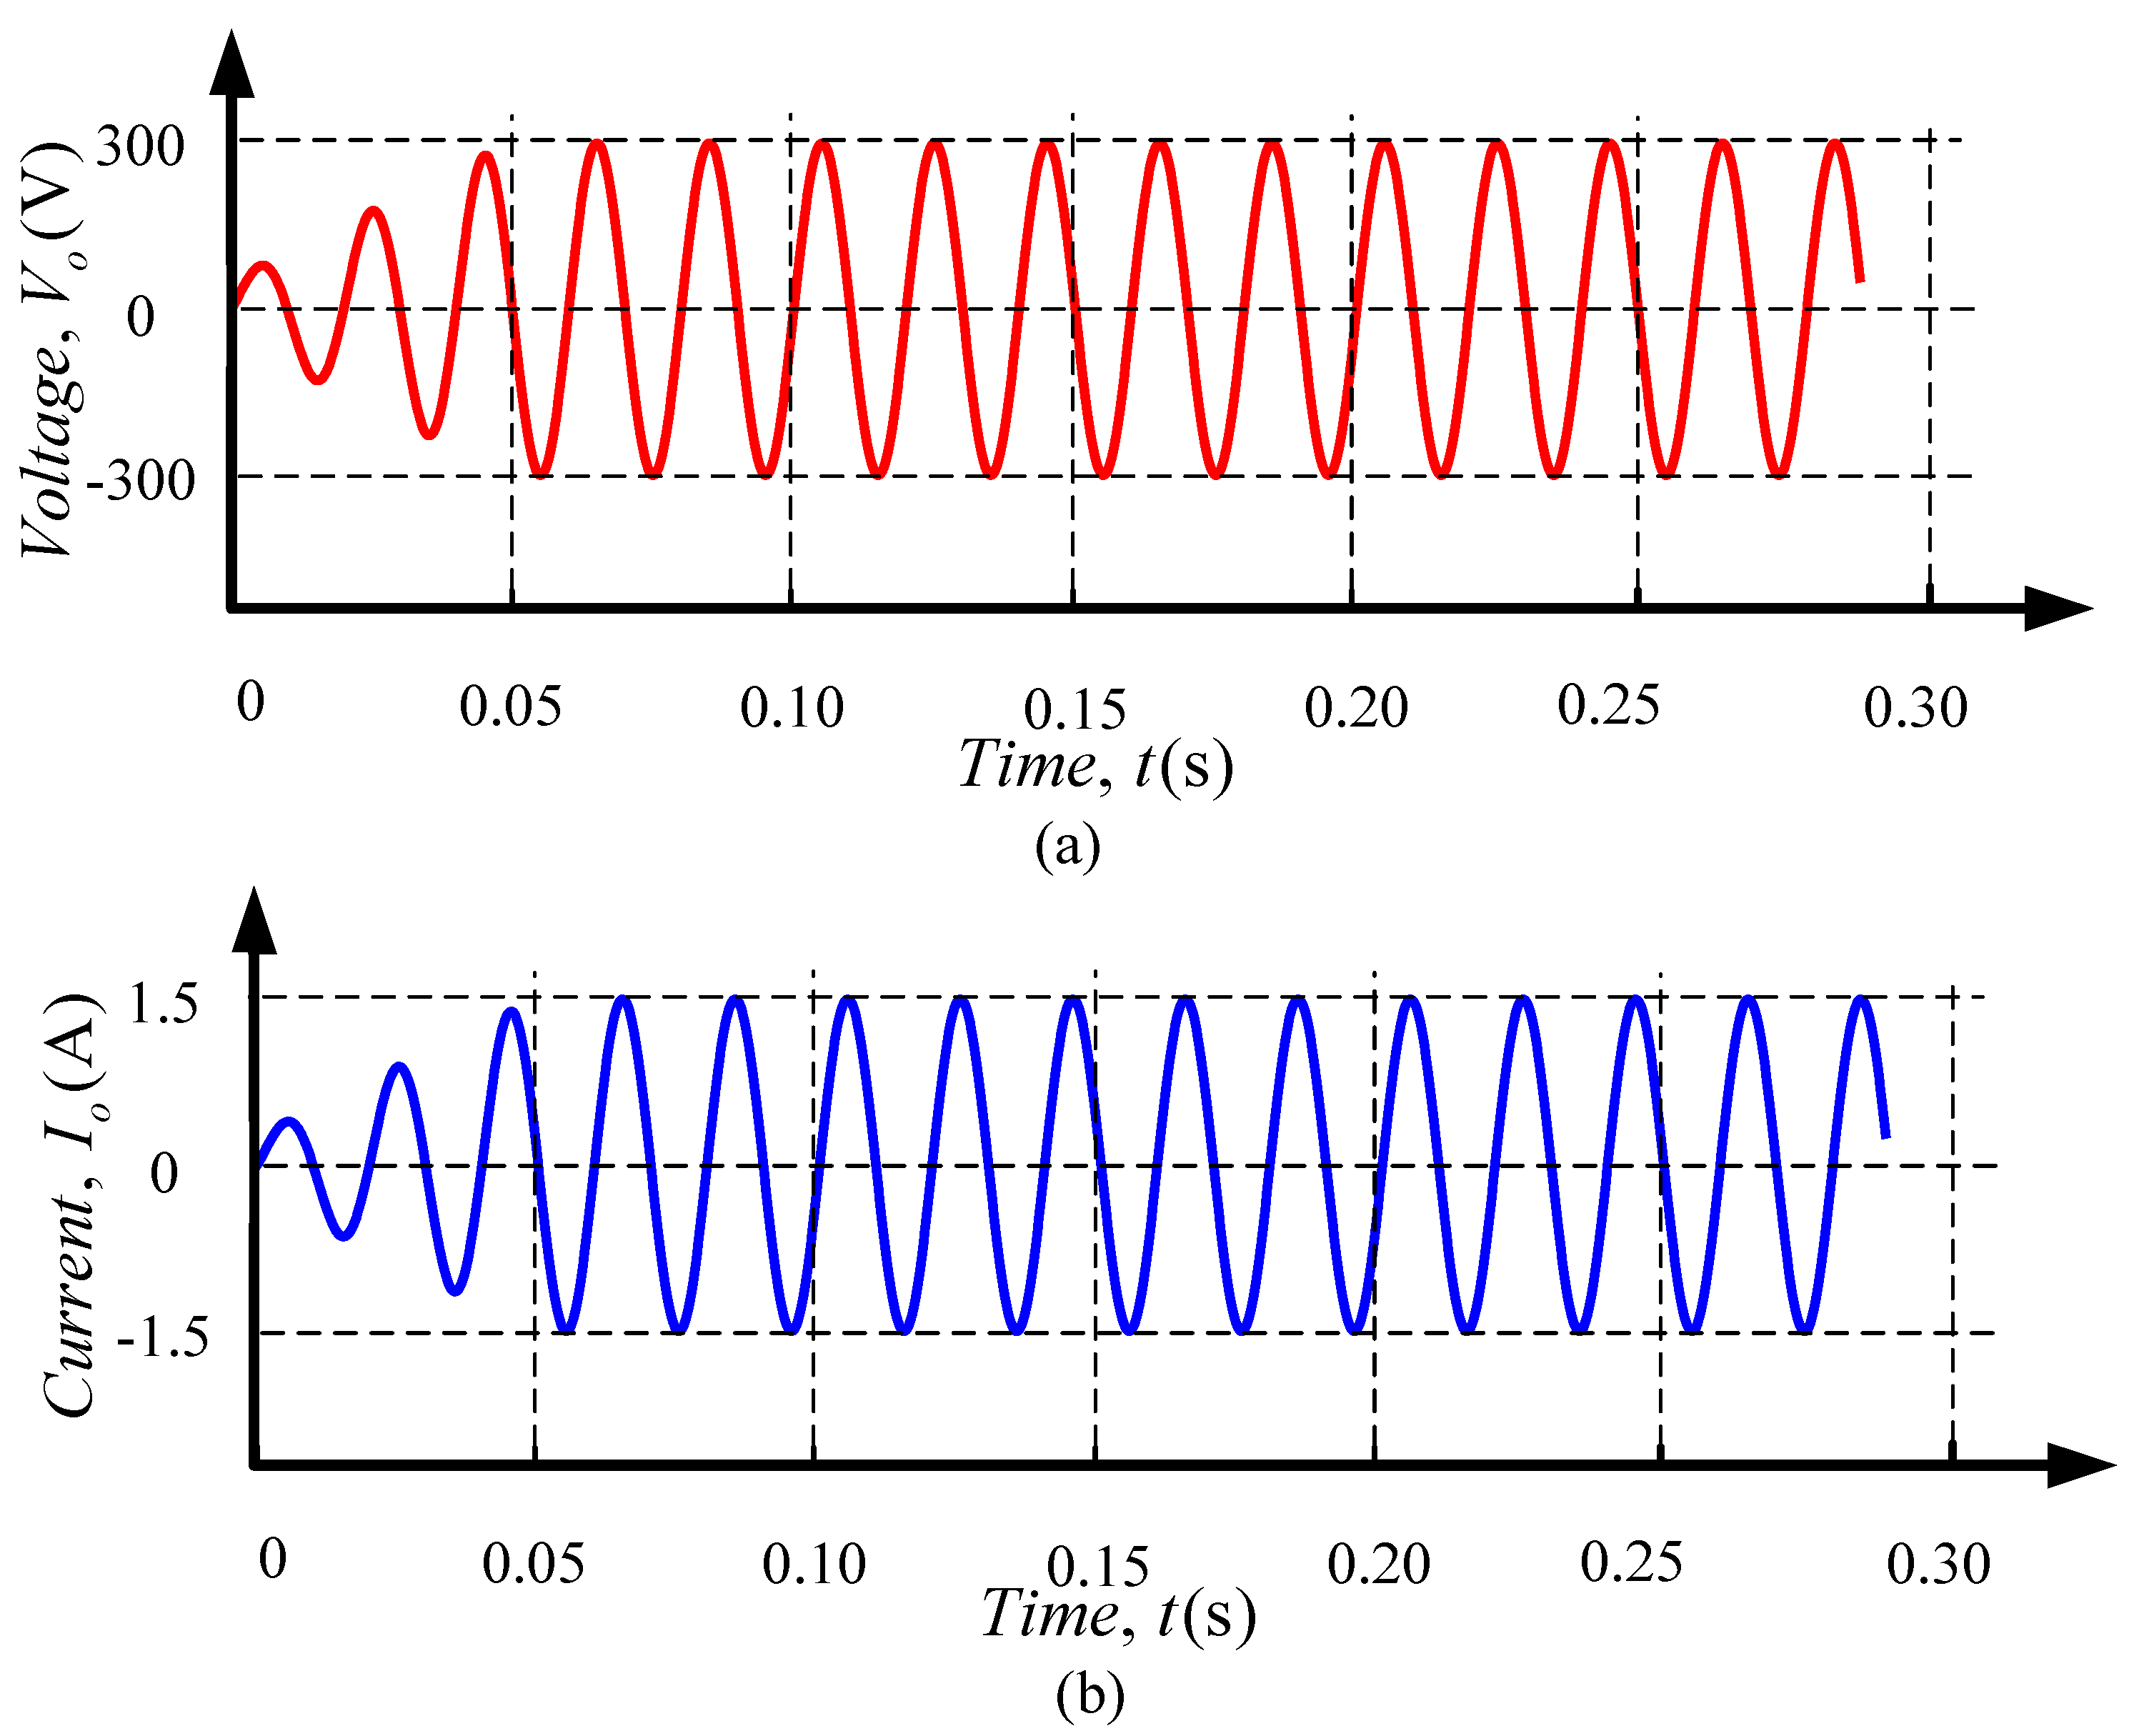
4. VSI and Low Pass Filter Design
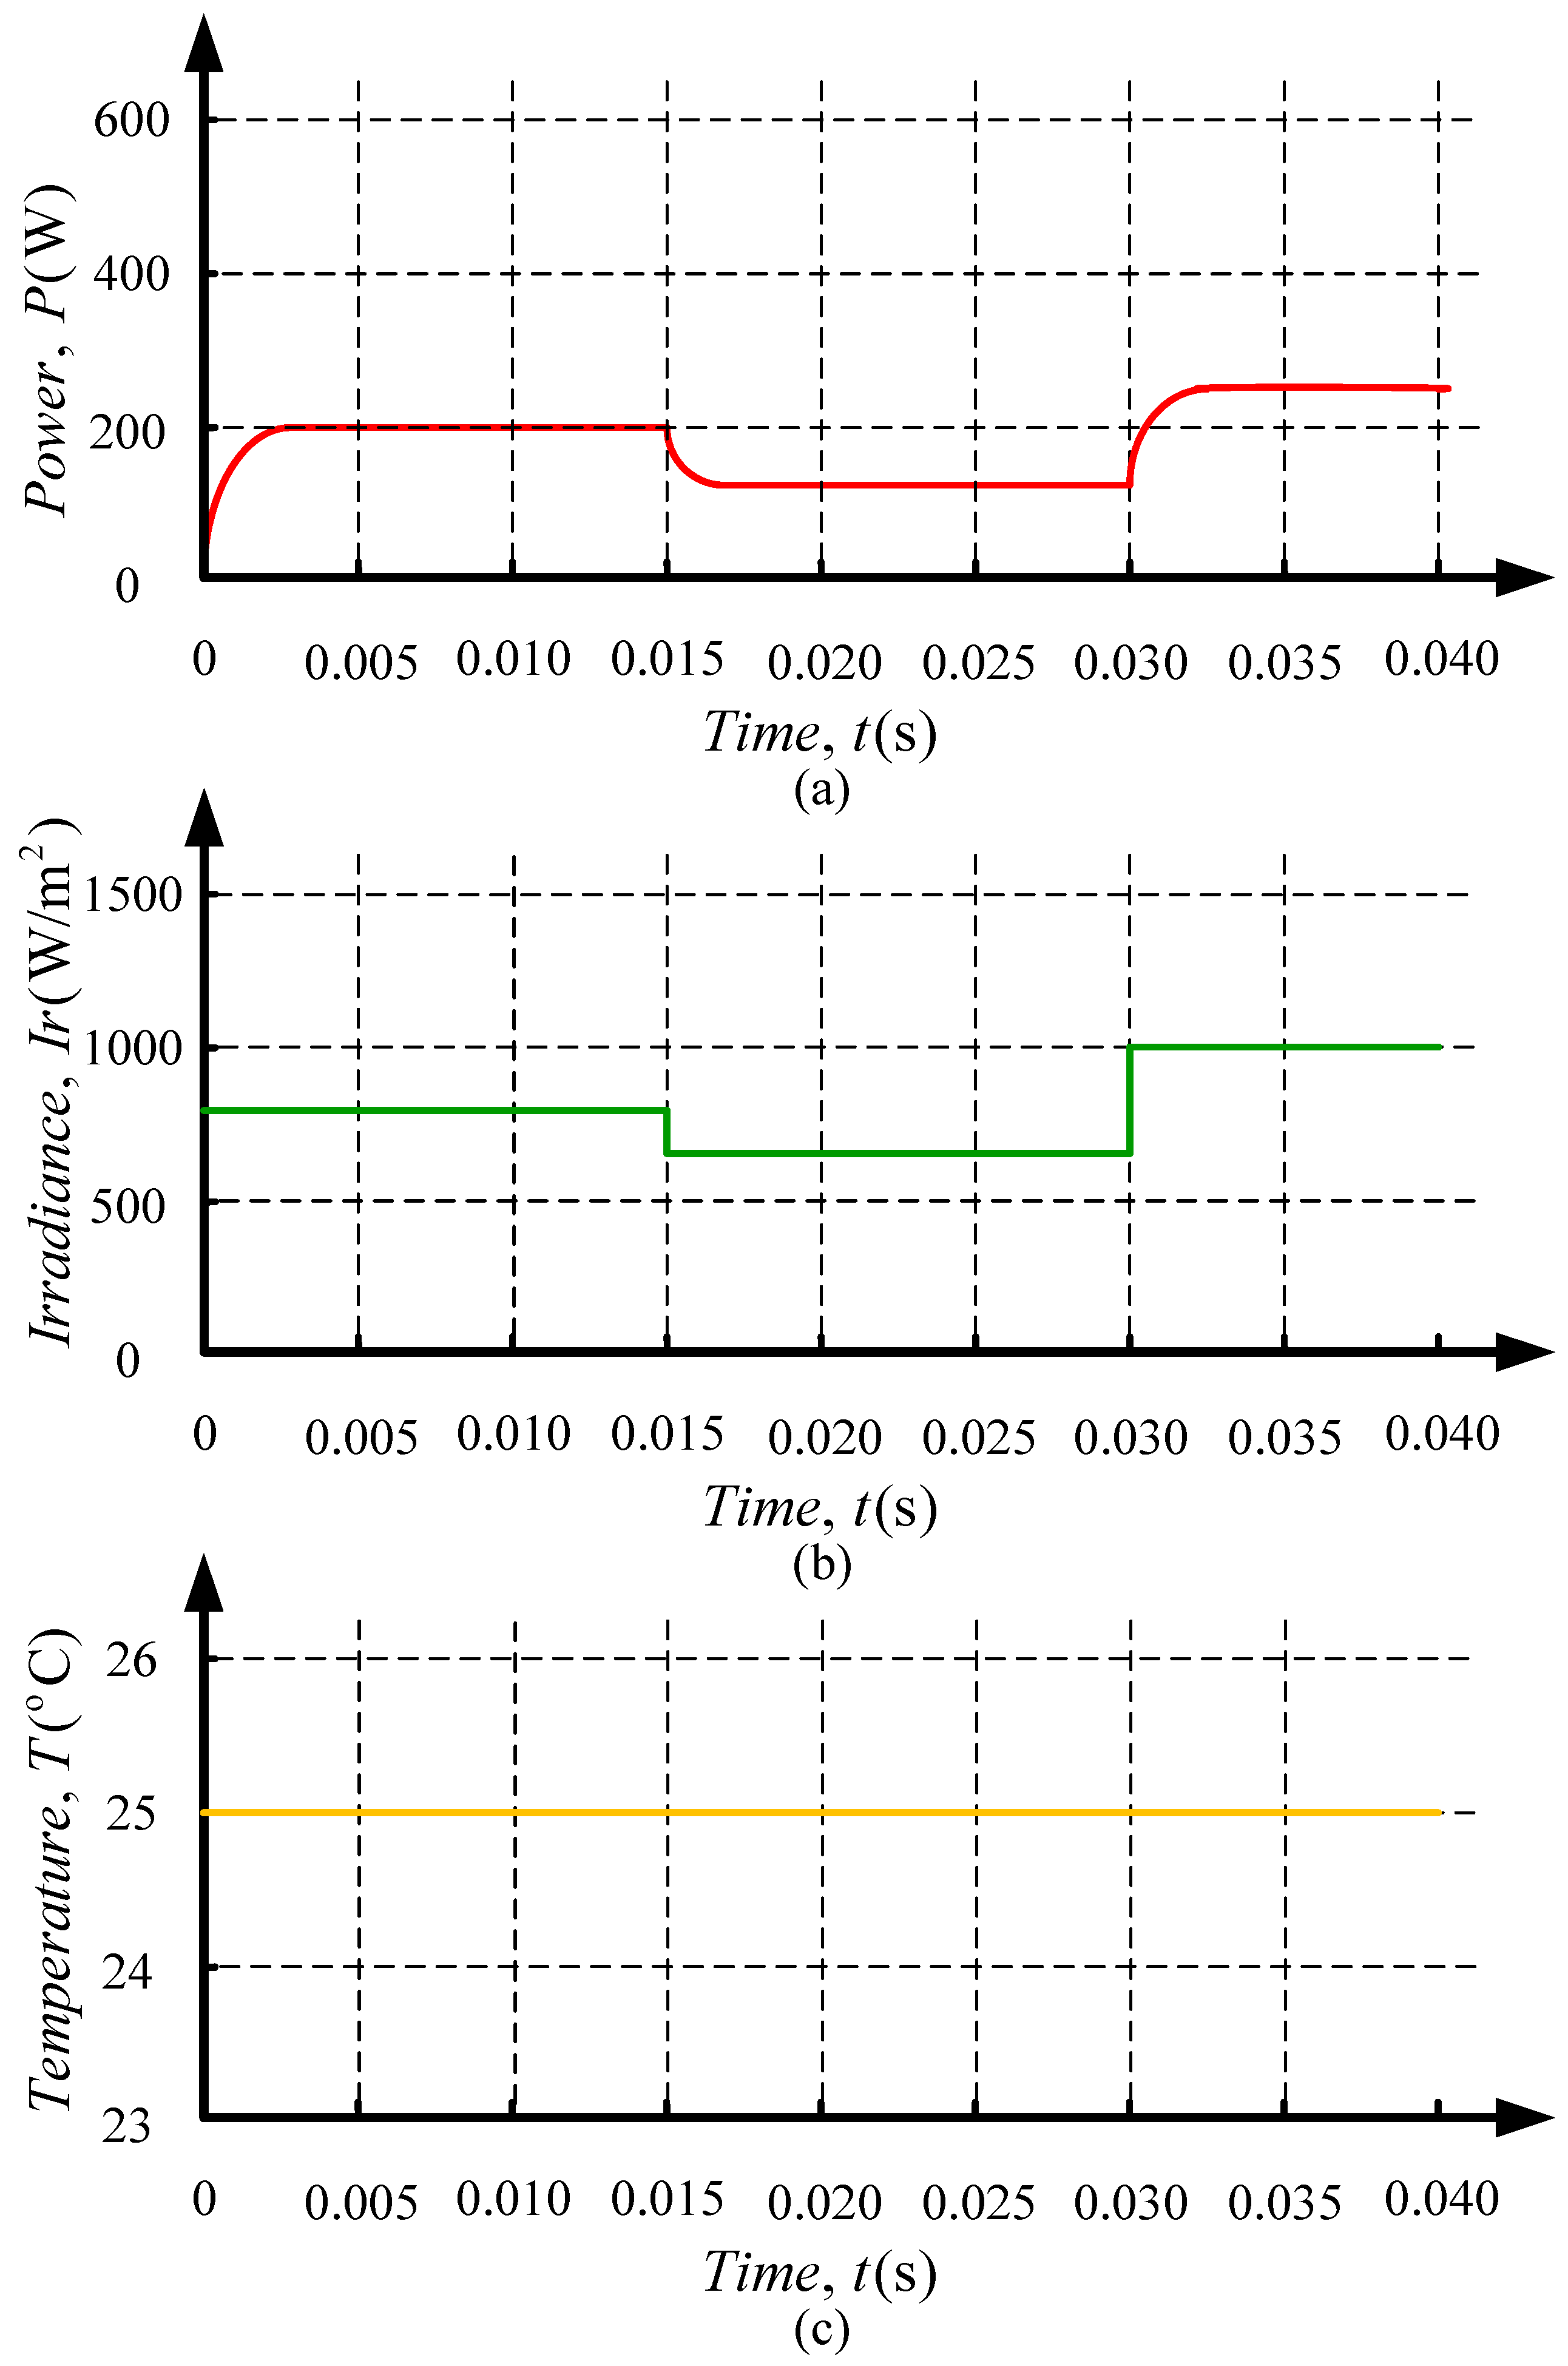
5. Results and Discussion
Comparative Analysis
6. Conclusions
Author Contributions
Funding
Conflicts of Interest
References
- Tahir, M.F.; Haoyong, C.; Mehmood, K.; Ali, N.; Bhutto, J.A. Integrated energy system modeling of China for 2020 by incorporating demand response, heat pump and thermal storage. IEEE Access 2019, 7, 40095–40108. [Google Scholar] [CrossRef]
- Tahir, M.F.; Haoyong, C.; Khan, A.; Javed, M.S.; Laraik, N.A.; Mehmood, K. Optimizing size of variable renewable energy sources by incorporating energy storage and demand response. IEEE Access 2019, 7, 103115–103126. [Google Scholar] [CrossRef]
- Cheema, K.M. A comprehensive review of virtual synchronous generator. Int. J. Electr. Power Energy Syst. 2020, 120, 106006. [Google Scholar] [CrossRef]
- Tahmasebi, H. Boost Integrated High Frequency Isolated Half-Bridge DC-DC Converter: Analysis, Design, Simulation and Experimental Results; University of Victoria Libraries: Victoria, BC, Canada, 2015. [Google Scholar]
- Dolara, A.; Faranda, R.; Leva, S. Energy comparison of seven MPPT techniques for PV systems. J. Electromagn. Anal. Appl. 2009, 2009, 725. [Google Scholar] [CrossRef]
- Tahir, M.F.; Chen, H.; Javed, M.S.; Jameel, I.; Khan, A.; Adnan, S. Integration of different individual heating scenarios and energy storages into hybrid energy system model of China for 2030. Energies 2019, 12, 2083. [Google Scholar] [CrossRef]
- Alquthami, T.; Butt, S.E.; Tahir, M.F.; Mehmood, K. Short-term optimal scheduling of hydro-thermal power plants using artificial bee colony algorithm. Energy Rep. 2020, 6, 984–992. [Google Scholar]
- Khan, I.; Li, Z.; Xu, Y.; Gu, W. Distributed control algorithm for optimal reactive power control in power grids. Int. J. Electr. Power Energy Syst. 2016, 83, 505–513. [Google Scholar] [CrossRef]
- Bhattacharjee, V.; Khan, I. A non-linear convex cost model for economic dispatch in microgrids. Appl. Energy 2018, 222, 637–648. [Google Scholar] [CrossRef]
- Khan, I.; Xu, Y.; Sun, H.; Bhattacharjee, V. Distributed optimal reactive power control of power systems. IEEE Access 2017, 6, 7100–7111. [Google Scholar] [CrossRef]
- Khan, I.; Xu, Y.; Kar, S.; Sun, H. Compressive sensing-based optimal reactive power control of a multi-area power system. IEEE Access 2017, 5, 23576–23588. [Google Scholar] [CrossRef]
- Li, Z.; Mehmood, K.; Zhan, R.; Yang, X.; Qin, Y. Voltage-current double loop control strategy for magnetically controllable reactor based reactive power compensation. In Proceedings of the 2019 IEEE Sustainable Power and Energy Conference (iSPEC), Beijing, China, 20–24 November 2019; pp. 825–830. [Google Scholar]
- Mehmood, K.; Hassan, H.T.U.; Raza, A.; Altalbe, A.; Farooq, H. Optimal Power generation in energy-deficient scenarios using bagging ensembles. IEEE Access 2019, 7, 155917–155929. [Google Scholar] [CrossRef]
- FaizanTahir, M. Optimal load shedding using an ensemble of artificial neural networks. Int. J. Electr. Comput. Eng. Syst. 2016, 7, 39–46. [Google Scholar]
- Muhammad Faizan, T.; Chen, H.; Kashif, M.; Noman Ali, L.; Asad, K.; Muhammad Sufyan, J. Short term load forecasting using bootstrap aggregating based ensemble artificial neural network. Recent Adv. Electr. Electron. Eng. 2019, 12, 1–11. [Google Scholar] [CrossRef]
- Li, J.; Wang, H. Maximum power point tracking of photovoltaic generation based on the fuzzy control method. In Proceedings of the 2009 International Conference on Sustainable Power Generation and Supply, Nanjing, China, 6–7 April 2009; pp. 1–6. [Google Scholar]
- Priyadarshi, N.; Padmanaban, S.; Mihet-Popa, L.; Blaabjerg, F.; Azam, F. Maximum power point tracking for brushless DC motor-driven photovoltaic pumping systems using a hybrid ANFIS-FLOWER pollination optimization algorithm. Energies 2018, 11, 1067. [Google Scholar] [CrossRef]
- Kebir, T.; Filiz, G.; Larbes, C.; Ilinca, A.; Obeidi, T.; Tchoketch Kebir, S. Study of the intelligent behavior of a maximum photovoltaic energy tracking fuzzy controller. Energies 2018, 11, 3263. [Google Scholar] [CrossRef]
- Priyadarshi, N.; Ramachandaramurthy, V.K.; Padmanaban, S.; Azam, F. An ant colony optimized MPPT for standalone hybrid PV-wind power system with single Cuk converter. Energies 2019, 12, 167. [Google Scholar] [CrossRef]
- Wang, Y.; Yang, Y.; Fang, G.; Zhang, B.; Wen, H.; Tang, H.; Fu, L.; Chen, X. An advanced maximum power point tracking method for photovoltaic systems by using variable universe fuzzy logic control considering temperature variability. Electronics 2018, 7, 355. [Google Scholar] [CrossRef]
- Ma, S.; Chen, M.; Wu, J.; Huo, W.; Huang, L. Augmented nonlinear controller for maximum power-point tracking with artificial neural network in grid-connected photovoltaic systems. Energies 2016, 9, 1005. [Google Scholar] [CrossRef]
- Li, C.; Chen, Y.; Zhou, D.; Liu, J.; Zeng, J. A high-performance adaptive incremental conductance MPPT algorithm for photovoltaic systems. Energies 2016, 9, 288. [Google Scholar] [CrossRef]
- Piegari, L.; Rizzo, R.; Spina, I.; Tricoli, P. Optimized adaptive perturb and observe maximum power point tracking control for photovoltaic generation. Energies 2015, 8, 3418–3436. [Google Scholar] [CrossRef]
- Cheema, K.M.; Mehmood, K. Improved virtual synchronous generator control to analyse and enhance the transient stability of microgrid. IET Renew. Power Gener. 2020, 14, 495–505. [Google Scholar] [CrossRef]
- Yau, H.-T.; Wu, C.-H. Comparison of extremum-seeking control techniques for maximum power point tracking in photovoltaic systems. Energies 2011, 4, 2180–2195. [Google Scholar] [CrossRef]
- Salas, V.; Olias, E.; Barrado, A.; Lazaro, A. Review of the maximum power point tracking algorithms for stand-alone photovoltaic systems. Sol. Energy Mater. Sol. Cells 2006, 90, 1555–1578. [Google Scholar] [CrossRef]
- Srndovic, M.; Familiant, Y.L.; Grandi, G.; Ruderman, A. Time-domain minimization of voltage and current total harmonic distortion for a single-phase multilevel inverter with a staircase modulation. Energies 2016, 9, 815. [Google Scholar] [CrossRef]
- Dolara, A.; Leva, S. Power quality and harmonic analysis of end user devices. Energies 2012, 5, 5453–5466. [Google Scholar] [CrossRef]
- Trubitsyn, A. High Efficiency DC/AC Power Converter for Photovoltaic Applications; Massachusetts Institute of Technology: Cambridge, MA, USA, 2010. [Google Scholar]
- Sharaf, F.Y. Designing Power Inverter with Minimum Harmonic Distortion Using Fuzzy Logic Control. 2014. Available online: https://195.189.210.17/handle/20.500.12358/18855 (accessed on 15 June 2020).
- Li, J.; Wang, H. A novel stand-alone PV generation system based on variable step size INC MPPT and SVPWM control. In Proceedings of the 2009 IEEE 6th International Power Electronics and Motion Control Conference, Wuhan, China, 17–20 May 2009; pp. 2155–2160. [Google Scholar]
- Cheng, P.-C.; Peng, B.-R.; Liu, Y.-H.; Cheng, Y.-S.; Huang, J.-W. Optimization of a fuzzy-logic-control-based MPPT algorithm using the particle swarm optimization technique. Energies 2015, 8, 5338–5360. [Google Scholar] [CrossRef]
- Maiti, D.; Mondal, N.; Biswas, S. Design Procedure of a Push Pull Current-Fed DC-DC Converter; Jadavpur University: Kolkata, India, 2010. [Google Scholar]
- Blooming, T.M.; Carnovale, D.J. Application of IEEE Std 519-1992 harmonic limits. In Proceedings of the Conference Record of 2006 Annual Pulp and Paper Industry Technical Conference, Appleton, WI, USA, 18–22 June 2006; pp. 1–9. [Google Scholar]
- Adhikari, N.; Singh, B.; Vyas, A.L.; Chandra, A. Analysis and design of isolated solar-PV energy generating system. In Proceedings of the 2011 IEEE Industry Applications Society Annual Meeting, Orlando, FL, USA, 9–13 October 2011; pp. 1–6. [Google Scholar]
- Singh, S.; Mathew, L.; Shimi, S. Design and simulation of intelligent control MPPT technique for PV module using MATLAB/SIMSCAPE. Int. J. Adv. Res. Electr. Electron. Instrum. Eng. 2013, 2, 4554–4566. [Google Scholar]
- Wang, C. A Study of Membership Functions on Mamdani-Type Fuzzy Inference System for Industrial Decision-Making. Master‘s Thesis, Lehigh University, Bethlehem, PA, USA, 2015. [Google Scholar]
- Usta, M.A.; Akyazi, Ö.; Altaş, İ.H. Design and performance of solar tracking system with fuzzy logic controller used different membership functions. In Proceedings of the 2011 7th International Conference on Electrical and Electronics Engineering (ELECO), Bursa, Turkey, 1–4 December 2011; pp. II-381–II-385. [Google Scholar]
- Mudi, R.K.; Pal, N.R. A robust self-tuning scheme for PI-and PD-type fuzzy controllers. IEEE Trans. Fuzzy Syst. 1999, 7, 2–16. [Google Scholar] [CrossRef]
- Shehata, A.; Metered, H.; Oraby, W.A. Vibration control of active vehicle suspension system using fuzzy logic controller. In Vibration Engineering and Technology of Machinery; Springer: Berlin/Heidelberg, Germany, 2015; pp. 389–399. [Google Scholar]
- Reznik, A.; Simões, M.G.; Al-Durra, A.; Muyeen, S. $ LCL $ filter design and performance analysis for grid-interconnected systems. IEEE Trans. Ind. Appl. 2013, 50, 1225–1232. [Google Scholar] [CrossRef]
- Mendel, J.M. Fuzzy logic systems for engineering: A tutorial. Proc. IEEE 1995, 83, 345–377. [Google Scholar] [CrossRef]
- Kahlane, A.; Hassaine, L.; Kherchi, M. LCL filter design for photovoltaic grid connected systems. J. Renew. Energies 2014, 2014, 227–232. [Google Scholar]
- Suwannatrai, P.; Liutanakul, P.; Wipasuramonton, P. Maximum power point tracking by incremental conductance method for photovoltaic systems with phase shifted full-bridge dc-dc converter. In Proceedings of the 8th Electrical Engineering/Electronics, Computer, Telecommunications and Information Technology (ECTI) Association of Thailand-Conference 2011, Khon Kaen, Thailand, 17–19 May 2011; pp. 637–640. [Google Scholar]
- Rezk, H.; Aly, M.; Al-Dhaifallah, M.; Shoyama, M. Design and hardware implementation of new adaptive fuzzy logic-based MPPT control method for photovoltaic applications. IEEE Access 2019, 7, 106427–106438. [Google Scholar] [CrossRef]
- Liu, C.-L.; Chen, J.-H.; Liu, Y.-H.; Yang, Z.-Z. An asymmetrical fuzzy-logic-control-based MPPT algorithm for photovoltaic systems. Energies 2014, 7, 2177–2193. [Google Scholar] [CrossRef]
- Ozdemir, S.; Altin, N.; Sefa, I. Fuzzy logic based MPPT controller for high conversion ratio quadratic boost converter. Int. J. Hydrogen Energy 2017, 42, 17748–17759. [Google Scholar] [CrossRef]
- Robles Algarín, C.; Taborda Giraldo, J.; Rodríguez Álvarez, O. Fuzzy logic based MPPT controller for a PV system. Energies 2017, 10, 2036. [Google Scholar] [CrossRef]
- El Khateb, A.; Abd Rahim, N.; Selvaraj, J.; Uddin, M.N. Fuzzy-logic-controller-based SEPIC converter for maximum power point tracking. IEEE Trans. Ind. Appl. 2014, 50, 2349–2358. [Google Scholar] [CrossRef]
- Kottas, T.L.; Boutalis, Y.S.; Karlis, A.D. New maximum power point tracker for PV arrays using fuzzy controller in close cooperation with fuzzy cognitive networks. IEEE Trans. Energy Convers. 2006, 21, 793–803. [Google Scholar] [CrossRef]
- Zainuri, M.A.A.M.; Radzi, M.A.M.; Soh, A.C.; Abd Rahim, N. Development of adaptive perturb and observe-fuzzy control maximum power point tracking for photovoltaic boost dc–dc converter. IET Renew. Power Gener. 2013, 8, 183–194. [Google Scholar] [CrossRef]
- Alajmi, B.N.; Ahmed, K.H.; Finney, S.J.; Williams, B.W. Fuzzy-logic-control approach of a modified hill-climbing method for maximum power point in microgrid standalone photovoltaic system. IEEE Trans. Power Electron. 2010, 26, 1022–1030. [Google Scholar] [CrossRef]
- Tang, S.; Sun, Y.; Chen, Y.; Zhao, Y.; Yang, Y.; Szeto, W. An enhanced MPPT method combining fractional-order and fuzzy logic control. IEEE J. Photovolt. 2017, 7, 640–650. [Google Scholar] [CrossRef]


| Input | E | |||||||
|---|---|---|---|---|---|---|---|---|
| NB | NM | NS | ZE | PS | PM | PB | ||
| NB | ZE | ZE | ZE | NB | NB | NB | NM | |
| NM | ZE | ZE | ZE | NS | NM | NM | NM | |
| NS | NS | ZE | ZE | ZE | NS | NS | NS | |
| ΔE | ZE | NM | NS | ZE | ZE | ZE | PS | PM |
| PS | PS | PM | PM | PS | ZE | ZE | ZE | |
| PM | PM | PM | PM | ZE | ZE | ZE | ZE | |
| PB | PB | PB | PB | ZE | ZE | ZE | ZE | |
| Parameters | Values |
|---|---|
| Power | 500 W |
| Input voltage | 60 V |
| Output voltage | 340 V |
| Turn ratio (n) | 1:6 |
| Switching frequency | 40 kHz |
| Duty cycle | 0.0523 |
| Inductor | 518 μH |
| Output capacitor | 100 μF |
| Input Inductor current | 9.38 A |
| PWM switching frequency | 10 KHz |
| Input DC voltage | 340 V |
| Output voltage | V rms |
| Resistive load | 100 Ω |
| Input | E | |||||||
|---|---|---|---|---|---|---|---|---|
| NB | NM | NS | ZE | PS | PM | PB | ||
| NB | NB | NB | NB | NB | NM | NS | ZE | |
| NM | NB | NB | NB | NM | NS | ZE | PS | |
| NS | NB | NB | NM | NS | ZE | PS | PM | |
| ΔE | ZE | NB | NM | NS | ZE | PS | PM | PB |
| PS | NM | NS | ZE | PS | PM | PB | PB | |
| PM | NS | ZE | PS | PM | PB | PB | PB | |
| PB | ZE | PS | PM | PB | PB | PB | PB | |
| PV Array | Parameters |
|---|---|
| No. of Cells and Connections | 96 |
| Open Circuit Voltage | 59.4 V |
| Maximum Power Voltage | 48.7 V |
| Short Circuit Current | 5.49 A |
| Maximum Power Current | 5.14 A |
| Maximum Power | 250.318 W |
| Diode saturation current | 2.9177 × 10⁻¹¹ |
| Diode ideality factor | 0.93246 |
| Shunt resistance | 428.442 Ohm |
| MPPT Algorithms | Tracking Time of PV Power |
|---|---|
| P&O | 0.300 s |
| INC | 0.250 s |
| Fuzzy Logic | 0.005 s |
| Ref. | Methodology | Implementation | Generalization | Input MFs | Hardware | Noise and Oscillations Near MPP | THD | Proper Filter Design |
|---|---|---|---|---|---|---|---|---|
| Proposed | Dual FL based MPPT with PPC | Simple | Sym./Asym. membership | ΔP/ΔI | ✕ | ✕ | ✓ | ✓ |
| [45] | AFL based MPPT | Simple | Sym./Asym. membership | Δ(ΔP/ΔI) | ✓ | ✓ | ✕ | ✕ |
| [46] | FL based MPPT | Complex | Asym. membership | ΔP/ΔV, Δ(ΔP/ΔV) | ✓ | ✓ | ✕ | ✕ |
| [32] | FL based MPPT with PSO | Complex | Asym. membership | ΔP, ΔV | ✓ | ✓ | ✕ | ✕ |
| [47] | FL based MPPT | Complex | Sym. membership | ΔP, ΔV | ✓ | ✓ | ✕ | ✕ |
| [48] | FL based MPPT | Simple | Sym./Asym. membership | ΔP/Δt, ΔV/Δt | ✕ | ✓ | ✕ | ✕ |
| [49] | FL based MPPT | Simple | Asym. membership | ΔP/ΔV, Δ(ΔP/ΔV) | ✓ | ✓ | ✕ | ✕ |
| [50] | FL based MPPT | Simple | Sym. membership | V, ΔV | ✕ | ✓ | ✕ | ✕ |
| [51] | FL + P&O MPPT | Complex | Sym. membership | ΔP, ΔI | ✓ | ✓ | ✕ | ✕ |
| [52] | FL + HC MPPT | Complex | Asym. membership | ΔP/ΔV, Δ(ΔP/ΔV) | ✓ | ✓ | ✕ | ✕ |
| [53] | FL + FO MPPT | Complex | Sym. membership | ΔP, ΔI | ✓ | ✓ | ✕ | ✕ |
© 2020 by the authors. Licensee MDPI, Basel, Switzerland. This article is an open access article distributed under the terms and conditions of the Creative Commons Attribution (CC BY) license (http://creativecommons.org/licenses/by/4.0/).
Share and Cite
Hassan, T.-u.; Abbassi, R.; Jerbi, H.; Mehmood, K.; Tahir, M.F.; Cheema, K.M.; Elavarasan, R.M.; Ali, F.; Khan, I.A. A Novel Algorithm for MPPT of an Isolated PV System Using Push Pull Converter with Fuzzy Logic Controller. Energies 2020, 13, 4007. https://doi.org/10.3390/en13154007
Hassan T-u, Abbassi R, Jerbi H, Mehmood K, Tahir MF, Cheema KM, Elavarasan RM, Ali F, Khan IA. A Novel Algorithm for MPPT of an Isolated PV System Using Push Pull Converter with Fuzzy Logic Controller. Energies. 2020; 13(15):4007. https://doi.org/10.3390/en13154007
Chicago/Turabian StyleHassan, Tehzeeb-ul, Rabeh Abbassi, Houssem Jerbi, Kashif Mehmood, Muhammad Faizan Tahir, Khalid Mehmood Cheema, Rajvikram Madurai Elavarasan, Farman Ali, and Irfan Ahmad Khan. 2020. "A Novel Algorithm for MPPT of an Isolated PV System Using Push Pull Converter with Fuzzy Logic Controller" Energies 13, no. 15: 4007. https://doi.org/10.3390/en13154007
APA StyleHassan, T.-u., Abbassi, R., Jerbi, H., Mehmood, K., Tahir, M. F., Cheema, K. M., Elavarasan, R. M., Ali, F., & Khan, I. A. (2020). A Novel Algorithm for MPPT of an Isolated PV System Using Push Pull Converter with Fuzzy Logic Controller. Energies, 13(15), 4007. https://doi.org/10.3390/en13154007