Article

Assessment of the External Costs of Life Cycle of Coal: The Case Study of Southwestern China

1
School of Earth Sciences and Resources, China University of Geosciences (Beijing), Beijing 100083, China
2
CAS Center for Excellence in Tibetan Plateau Earth Sciences, Key Laboratory of Continental Collision and Plateau Uplift, Institute of Tibetan Plateau Research, Chinese Academy of Sciences, Beijing 100101, China
3
Department of Land, Environment, Agriculture and Forestry, University of Padova, 35020 Legnaro (PD), Italy
*
Authors to whom correspondence should be addressed.
Energies 2020, 13(15), 4002; https://doi.org/10.3390/en13154002
Submission received: 6 July 2020 / Revised: 27 July 2020 / Accepted: 31 July 2020 / Published: 3 August 2020
(This article belongs to the Section B: Energy and Environment)

Abstract

:
Coal will continue to be the main energy source in China for the immediate future, although the environmental pollution and ecological impacts of each stage in the full life cycle of coal mining, transportation, and combustion generate large quantities of external costs. The Late Permian coals in southwestern (SW) China usually contain high amounts of fluorine (F), arsenic (As), and ash, which together with high-F clays cause abnormally high levels of endemic fluorosis, As poisoning, and lung cancer in areas where coal is mined and burned. In this paper, we estimate the external costs of the life cycle of coal. The results show that the externalities of coal in SW China are estimated at USD 73.5 billion or 284.3 USD/t, which would have accounted for 6.5 % of the provincial GDP in this area in 2018. The external cost of human health accounts for 87.2% of the total external costs, of which endemic skeletal fluorosis diseases and related lung cancers have the most important impact. Our study provides a more precise estimate of externalities compared with its counterparts in other provinces in China. Therefore, several policy recommendations would be proposed to internalize the external cost.

Graphical Abstract

1. Introduction

Coal is an important energy source, supplies about 40% of the world’s electricity, and is likely to continue to provide significant amounts of energy in the foreseeable future [1]. The increasing demand for electricity in southern and southeastern Asia, including China, India, and Indonesia, will continue to cause an increase in the use of coal. Coal consumption currently accounts for 59% of all energy consumed in China with its production and consumption continuing to grow in recent years [2]. Thus, finding sources of efficient and clean energy is a primary concern when addressing the severe environmental pollution and ecological damage caused by the use of coal energy.
The mining, transportation, and combustion of coal are generally harmful to the environment and human health. Many fatal accidents have been caused by underground water leakage, poisoning, and methane explosions during underground mining. For example, over 100,000 coal miners have been killed in the United States since 1900 [3]. In China, coal mine fatalities fell from 2630 in 2009 to 333 in 2018 so that mining of one million tons of coal resulted in an average of 0.093 deaths in 2018 [2]. Inhalation of dust generated during underground mining often causes coal workers’ pneumoconiosis (CWP; black lung disease). In 2018, about 19,468 cases of CWP were reported in China [4]. Mountaintop removal (MTR) mining has negative impacts on carbon storage, water quality, air pollution, and the biosphere [5]. Direct hazards caused by the transportation of coal include road dust, death and injuries from accidents, air pollution, and greenhouse gas (GHG) emissions [5]. Coal combustion releases many harmful chemicals into the environment exposing people to potentially harmful effluents: this problem is particularly obvious in China [6]. For example, endemic fluorosis is only discovered in southwestern (SW) China [7]. Moreover, the by-products of coal combustion include CO2, methane, PM 2.5, nitrogen oxides (NOx), and sulfur oxides (SOx), which will cause air pollution, acid precipitation, and climate change through the effects of GHGs created by burning coal [5]. Therefore, these negative impacts exert additional external costs on coal use.
External costs or externalities indicate to the unaccounted and uncompensated impacts of a production process imposed on society or environment that cannot be reflected from the market pricing [8,9]. External costs should reflect the monetized value of the damage caused by the life cycle of coal mining, transportation, and combustion on human health, the environment, streams, forests, and ecosystems [10]. These external environmental costs have received much attention from many researchers. Epstein et al. [5] reviewed the life cycle of coal and estimated the external costs of coal-fired power generation in the Appalachian region in the US. Rabl and Spadaro [11] presented the results of the external costs of the combustion of fossil fuels that caused significant air pollutants. Spath et al. [12] provided a detailed technical report with a life cycle assessment (LCA) related to the production of electricity from coal that was performed in order to examine the environmental aspects of current and future pulverized coal boiler systems. Mahapatra et al. [10] performed an LCA on the production of electricity from conventional coal-based electricity generating systems in two cities in western India. These studies attempted to estimate the costs of damages and assigned monetary values to human health, crops, and building materials by using dose–response functions. Karkour et al. [13] evaluated the recent external cost of electricity generation in G20 countries using a global LCA method. The above studies provided the externalities of coal-fired electricity generation. Jorli et al. [14] further estimated and compared the external costs from fossil electricity generation from 13 developing countries. Moreover, some authors further suggested post-tax subsidies which reflect the gap between consumer prices and economically efficient prices [15,16,17] and proposed to carry out the reform of the electricity environmental protection price [18] based on the externality of coal in China.
Nevertheless, external costs of coal in China have received little attention. A pioneer research published in 2003 estimated huge costs spent in maintaining health and the environment from the air pollution caused by coal-fired power plants in Shandong province [19]. Dang et al. [20] calculated the economic losses caused by environmental pollution and ecological damage from coal mining activities in Shanxi province. Costs related to the ecological damage due to coal mining in this region were also calculated by Zhang and Lian [21] and Cao [22]. Feng et al. [23] calculated the atmospheric damage caused by air pollution from coal combustion in Fuxin, Liaoning, China. In these studies, the external environmental costs of coal included costs of losses associated with environmental pollution and ecological damage. However, most research conducted in China is related to the environmental costs of coal that only occupies a certain stage of the coal chain, while the life cycle of coal is not considered enough. For example, coal mining and transportation were not covered to reflect the true external environmental costs. Moreover, ecological damage and human impacts aspects have usually been overlooked. Recently, a few studies have been published based on life cycle analysis of the coal chain in China. Liu et al. [24] estimated the external environmental cost of coal for its full life cycle in China. Zhang [25] and Lv et al. [26] calculated the external environmental costs of coal in Shanxi and Inner Mongolia, respectively. Wang et al. [27] used the LCA method to analyze how coal-fired power generation impacted the environment in China. These authors established an accounting system including costs for environmental pollution, the ecological damage, and impacts to human health during the life cycle of coal. The environmental externalities for biomass- and coal-fired electricity [9,28], flue gas cleaning processes, and carbon emissions of coal-fired power generation [29,30] in China were also assessed. SW China is the only region that endemic fluorosis is discovered for coal burning all around world. However, there is little knowledge that has been shared about the external costs of coal in SW China.
To fill in the aforementioned gap, comprehensively calculated external costs of the life cycle of coal are needed to focus on coal mining, transportation, and combustion to indicate the true cost of coal use in SW China. In this paper, we aim to (1) monetize the external costs using the life cycle of coal in SW China for the first time; (2) compare our results with other researches in order to reveal the main sources of external costs; and (3) propose helpful policy recommendations.

2. Materials and Methods
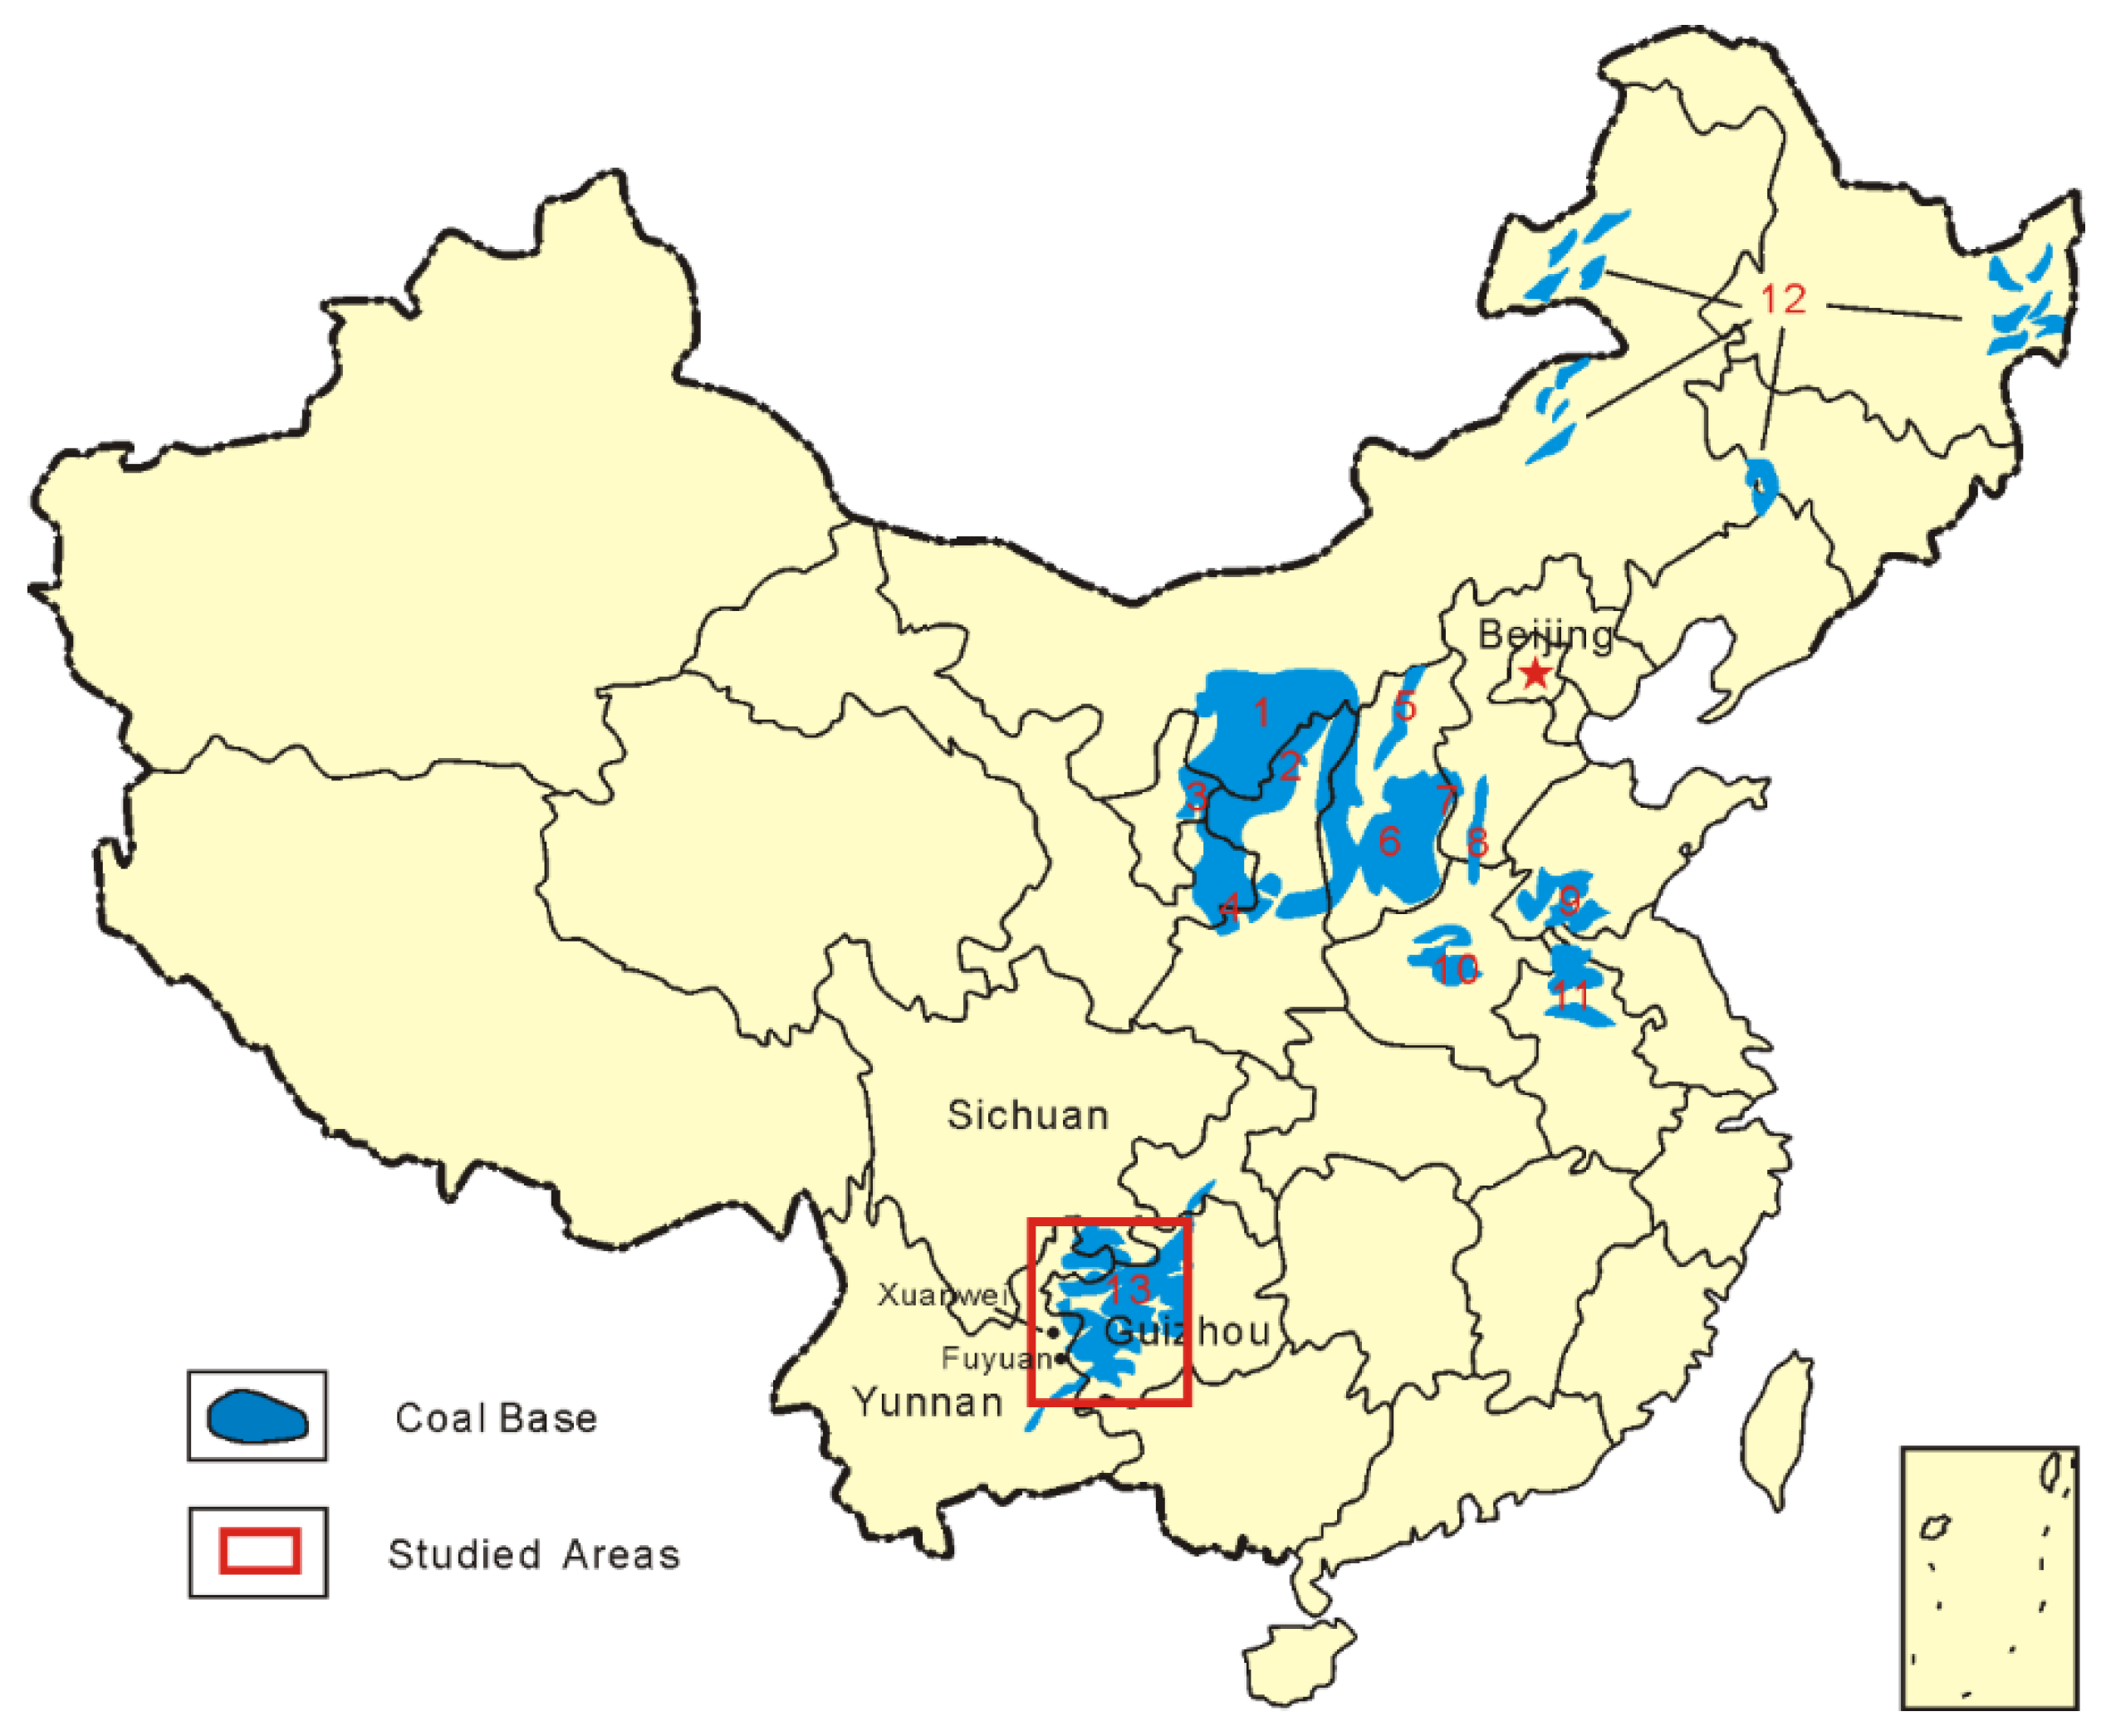
2.1. Study Site

Coal has played an important role in China’s economic development especially in SW China (Yunnan, Sichuan, and Guizhou provinces), where coal was relied heavily on as a means of economic development (Figure 1), despite concerns related to air pollution and GHG emissions. China has coal reserves of about 1.67 trillion tons [31], while SW China has reserves of about 0.11 trillion tons [32]. Coal production and consumption account for a large proportion of total energy produced in SW China, although these have been declining for the past decade (Table 1) in these provinces. SW China is blessed with abundant hydroelectric power resources accounting for about 80% of the total undeveloped capacity of hydropower in China [33], which can provide a good alternative energy source in the future.
The Late Permian is an important period of coal accumulation in geological history [37]. During this period, rich coal resources formed in SW China, and these became an important coal base [37]. The coal-bearing basins are located in the western part of the Yangtze Block. The Late Permian marine incursion changed the paleoenvironments from terrigenous to marine in the western Yangtze Block and formed most of the coal sequences [38], including the Changxing and Longtan formations of that period [39]. High ash yields in these coals are attributed to the high detrital input [40]. High detrital input with marine influence, volcanic ash input, and high hydrothermal solution is the primary geological factor causing trace element anomalies in coal in SW China [41,42,43]. Thus, geologically, the types of Permian coal in SW China typically differ from coal found in other provinces.
Coal contains almost all of the elements found in the periodic table. In particular, F, As, Hg, Cd, Pb, and U are usually considered to be toxic to human health and in the environment [6,43]. The F content in Chinese coals averages 130 µg/g [43]. Endemic fluorosis has been reported in Guizhou and Yunnan provinces [6,43,45], which is caused by the burning of coal and clay with high F levels resulting in the closure of some mines [6]. Endemic fluorosis related to coal burning is only discovered in China. Clay with the F content averaging 1027.6 mg/kg is used as an additive for coal-burning or as a briquette binder for fine coal [46], which is much higher than those in western Guizhou and other Chinese coals [43]. A recent study has shown that As in coal is highly enriched in southwestern Yunnan and part of Guizhou [47]. Endemic arsenism caused by domestic As-rich coal combustion is locally very severe in southwestern Guizhou [43]. Coals with high Hg content occur in SW China including in the coalfields of Guizhou and Yunnan provinces [48]. The arithmetic mean of cadmium in Chinese coals is 0.43 µg/g, while Cr is enriched in Sichuan province with a mean content of 5.91 µg/g [49]. The Pb content in coals of SW China averaged 25.54–29.51 µg/g [50], higher than the mean value of Dai et al. [43]. Almost all of the U-rich coals in China come from southwestern and northwestern China [51]: the mean U content was 200–229 and 153–167 mg/kg in the Guiding coalfield in Guizhou and the Yanshan coalfield in Yunnan, respectively [41,51,52]. Beyond that, indoor emissions from household coal burning in Xuanwei County in Yunnan caused this region to have the highest female lung cancer mortality rates in China [53], which was attributed to nanometer-scale quartz in coals [54].
As a result, most types of coal found in SW China are rich in toxic trace elements including F, As, Hg, Cd, Pb, and U. Endemic diseases such as fluorosis, arsenism, and lung cancer are mainly restricted in this region of China, which not only increase the potential health risk but also generate a large number of external environmental costs. However, no known published papers were found that assessed the externalities of coals in this type of area.

2.2. Methods

Life cycle analysis that examines all stages of coal production from mining to utilization calculates the full external costs and is critical to informing the public and guiding policy formulation [28]. The external costs in this study are shown in Figure 2. Usually, two kinds of methods have been considered to assess the external environmental costs. One is based on cost control, while the other more popular approach is based on damage loss [27]. Since the 1990s, damage losses have been used to account for external environmental costs of power generation in the US and EU [27]. The damage loss method includes market value, opportunity cost, and human capital methods.

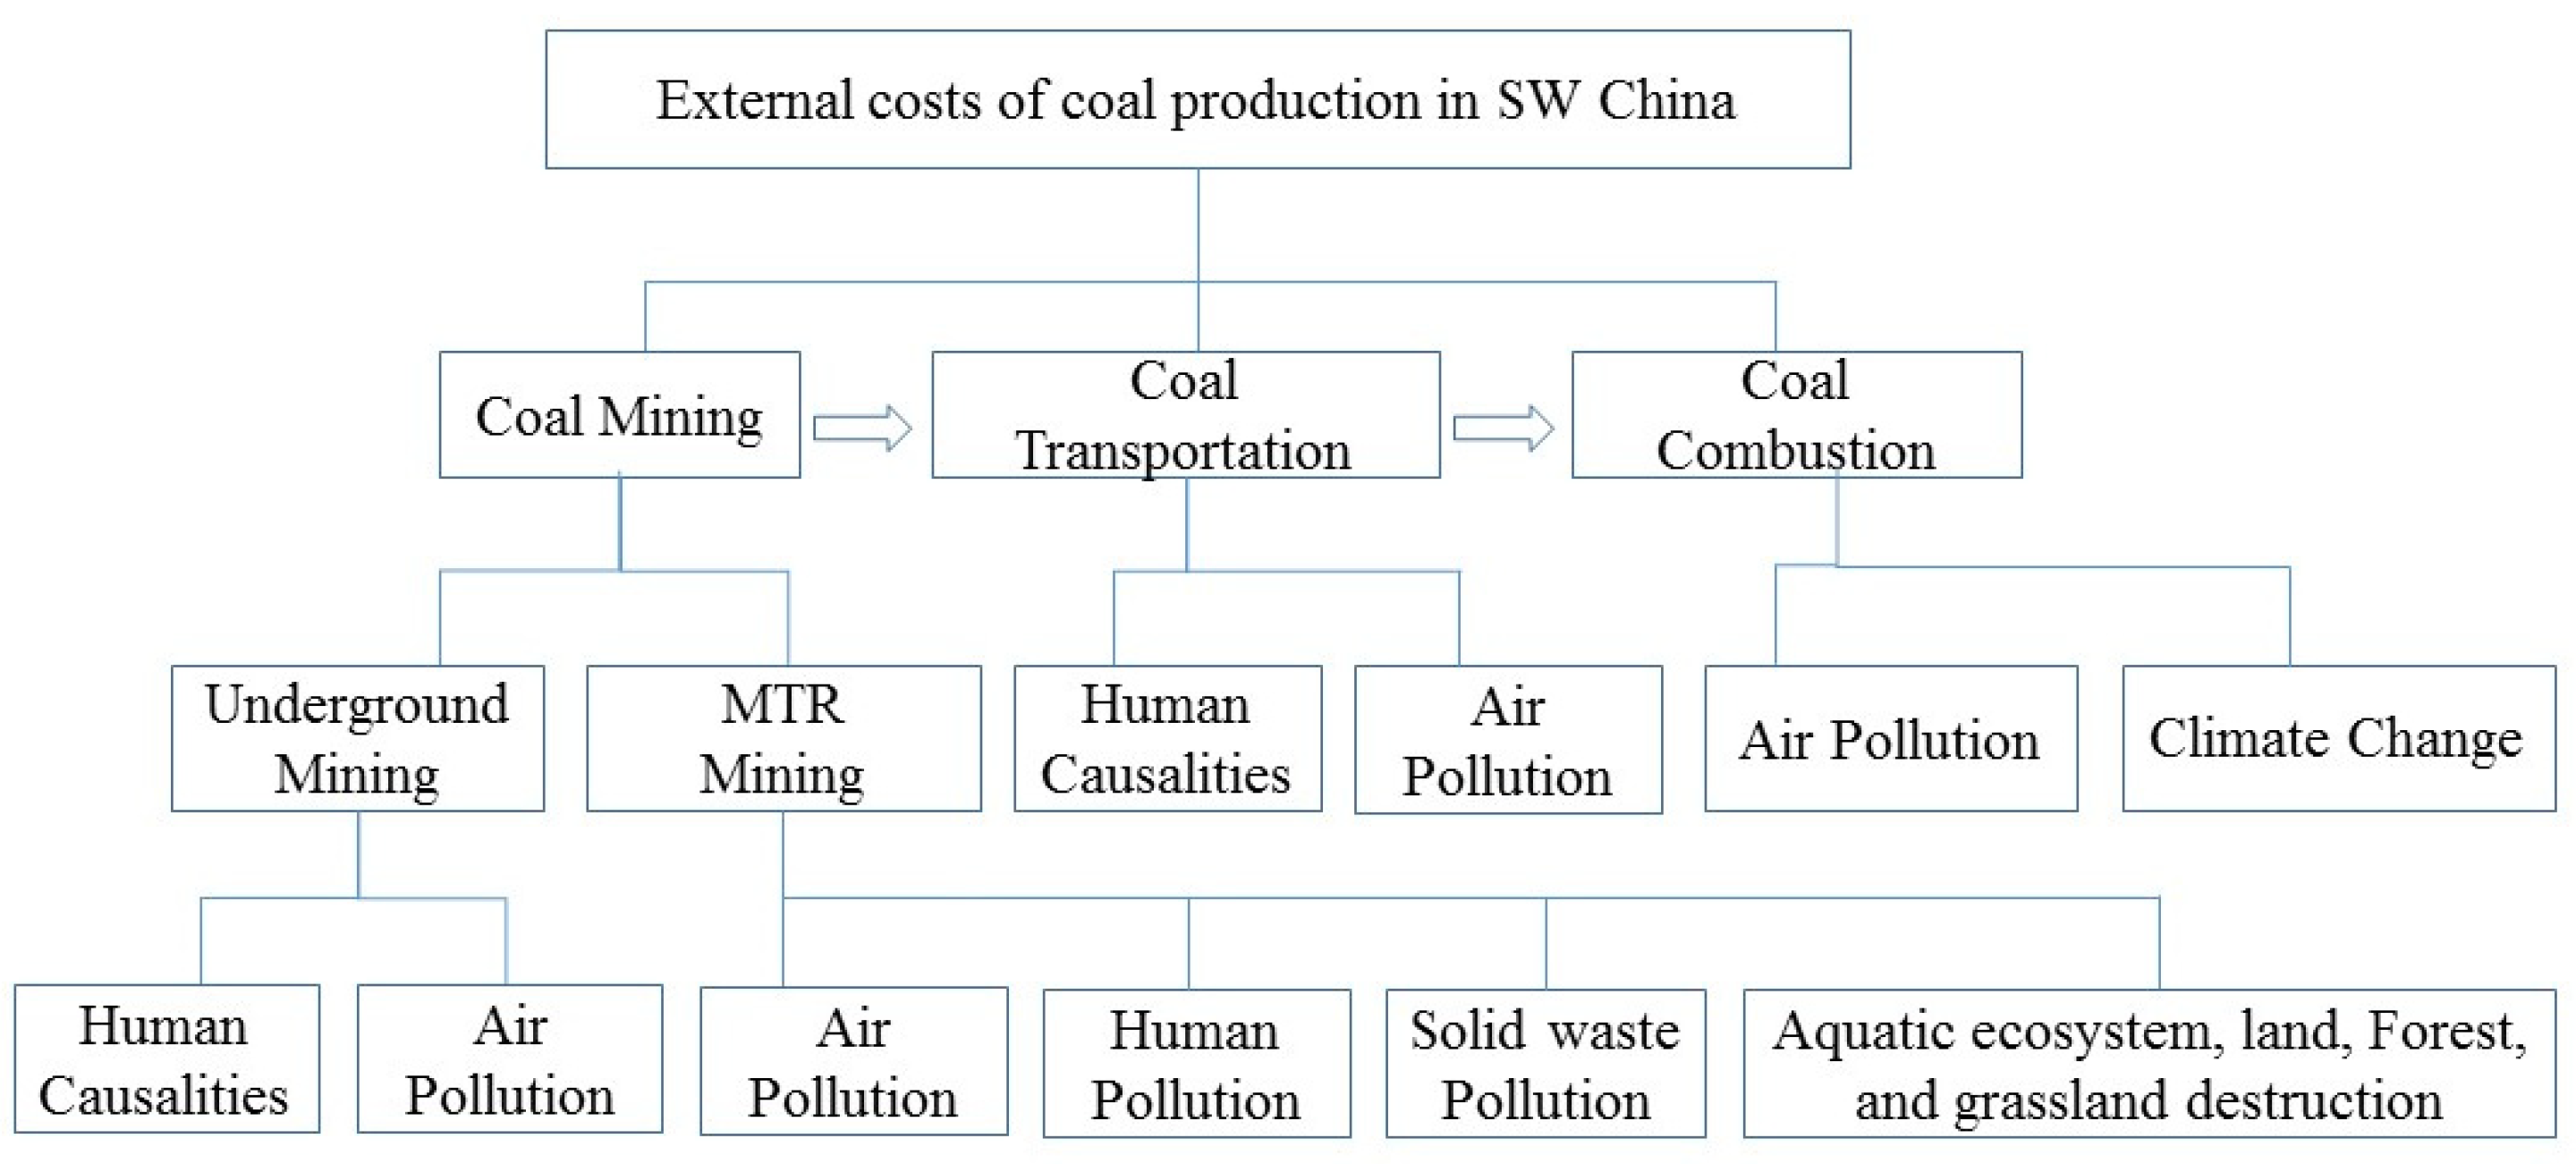
2.2.1. System Boundaries

Usually, for the coal-fired power plant, the external costs consist of three subsystems: coal mining, transportation, and electricity generation [12]. Some authors suggested five subsystems including coal mining, processing, transportation, coal-fired power generation, and resource utilization [30]. In this study, the external environmental costs are defined as costs created when the coal industry exerts a negative impact on the environment and human health including costs related to coal mining, transportation, and utilization. Coal usage consists of the combustion of coal-fired power stations and indoor burning. The ecological damage and environmental pollution, which includes negative effects on human health, are considered in all three stages of coal extraction and use. The ecological damage can be divided into impacts on forests, farmland and crops, grasslands, as well as lakes and rivers. Environmental pollution includes air, water, and solid waste pollution. The external costs of human health are composed of casualties in coal mining, transportation, and diseases related to air pollution during the life cycle of coal production.

2.2.2. Index Systems

This paper focuses on the monetized impacts and is limited by data availability based on the actual situation in SW China in 2018. Given that, only human health, environmental pollution, and ecological degradation or damage are accounted for in the external costs. Costs in crop failure caused by wastewater pollution, wetland destruction, storage of coal and related dust pollution, and tourism loss are excluded in this study. A series of accounting items of physical quantities are tabulated in Table 2.

2.2.3. Accounting Model

(a)
Air pollution cost
During the coal mining stage, black lung disease or pneumoconiosis can often lead to chronic obstructive pulmonary disease and is the primary occupational disease affecting mine workers. Some endemic diseases including fluorosis, arsenism, and lung cancer are the primary diseases caused by the burning of coal in SW China. The human capital method was adopted [26,55]. In addition to these diseases, air pollution will affect human health and lead to higher morbidity and mortality in the human population of the region. Further, acid rain caused by coal combustion contaminates the soil and causes crop failure. The total cost to human health caused by air pollution was calculated using Equation (1):
C 1 - 1 = i = 1 n ( P i   ×   C Ai   + P i   ×   D Hi   ( C W + C PA ) + P i   ×   D Li   ×   C W + P Di   ×   D i   ×   C W ) ,  
where C1-1 is the total cost to human health caused by air pollution, i is the ith type of disease, n is the numbers of diseases, Pi is the total number of people with the ith type of disease, PDi is the total number of fatalities caused by the ith type of disease, CAi is the per capita cost of treatment of the ith type of disease, CW is the average wage per mining worker per year, CPA is the average wage of attendants per patient, DHi and DLi are the total number of days of a hospital stay and total days of incapacity to work for all patients of the ith type of disease, and Di is the per unit indication to the losses of working years for all deceased patients of the ith type of disease.
The total cost for crop reduction caused by air pollution was calculated using Equation (2):
C 1 - 2 = i = 1 n ( Q i   ×   R i   /   ( 1 - R i )   ×   P i ) ,  
where C1-2 is the total cost for crop failure caused by air pollution, i is the ith kind of crop, n is the numbers of crops, Qi is the annual yield of the ith kind of crop with air pollution, Ri is the rate of yield reduction of the ith kind of crop (%), and Pi is the market value per kilogram of the ith kind of crop.
(b)
Death and injury costs
For deaths and injuries caused directly by accidents during the mining and transportation of coal, the human capital method was adopted. The present study only considered work-related fatalities because limited information was available related to injuries. The cost of such deaths was calculated using Equation (3):
C2 = PD × CP,
where C2 is the total cost caused by fatalities caused by direct accidents during the mining and transportation of coal, PD is the total number of such fatalities, and CP is the per compensation unit that was paid to surviving relatives in every case of work-related death based on laws.
(c)
Dust pollution costs
The cost of dust pollution caused by the transportation of coal trucks and movement of coal by water was considered in SW China. Coal dust caused by the transportation, loading, and unloading of coal will make the skin of people as well as the walls and furniture in homes dirty. The restoration or replacement cost approach of Lv et al. [26] was adopted to calculate the related costs using Equation (4):
C3 = CPW (PTi × Ki + PTi × KLi),
where C3 is the cost of damage caused by coal dust pollution, i is the ith kind of transportation type, PTi is the transportation capacity, CPW is the expense related to general dust emissions, Ki is the pollution coefficient of coal dust, and KLi is the production coefficient of coal dust during loading and unloading.
(d)
Water pollution costs
Mountaintop removal mining without careful mitigation often contaminates downstream waters and increases the costs of wastewater treatments. The restoration or replacement cost approach was adopted to analyze these costs in Equation (5):
C4 = PW × CW,
where C4 is the cost of wastewater treatment, PW is the total water consumption of the mining industry, and CW is the cost of wastewater treatment per m3.
(e)
Solid waste pollution costs
Coal gangue increases the cost of coal mining by causing negative effects on the landscape near a mine. The shadow price approach was adopted to calculate the cost of managing gangue using Equation (6):
C5 = PST × CST,
where C5 is the external cost of managing coal gangue, PST is the total volume of coal gangue, and CST is the shadow price per unit volume.
(f)
Effects on aquatic ecosystems
Coal mining causes water pollution and soil erosion, which can increase the external expenses of coal mining. The shadow price approach was adopted for water and soil conservation and water resource value loss as calculated in Equation (7):
C6 = PA × AA × CA+ PA × AR × CR,
where C6 is the cost of negative effects to aquatic ecosystems, PA is the total volume of coal extracted, AA is the volume of soil erosion caused by each ton of coal mined (m2/ton), CA is the cost per unit of water and soil conservation, AR is the amount of underground water polluted for each ton of coal mined (m3/ton), and CR is the shadow price per unit of protecting water resources.
(g)
Effects on forests
Coal mining operations consume large amounts of pit wood and also displace forests, which will not only reduce tree growth but also affect the value of ecological services provided by forests. The market values method was adopted to calculate this indirect cost of mining using Equation (8):
C7 = PA × AF × CF + AFT × CFT + PF × AFT × CFS,
where C7 is the cost of tree harvest and forest displacement, AF is the unit consumption of wood for per ton of coal production (m3/t), AFT is the total area of affected forest, CF is the unit market price of wood (USD/m3), CFT is the unit price of forest (USD/ha), PF is the oxygen released per unit area of forest (t/ha), and CFS is the market price of per m3 oxygen.
(h)
Effects to grassland
Coal mining will occupy and displace grasslands and cause the loss of the value of ecological services provided by grasslands. The shadow price approach was adopted to estimate this change using Equation (9):
C8 = AFG × CFG,
where C8 is the total value of ecological services lost through the effects on grasslands, AFG is the area of grasslands affected by mining, and CFG is the shadow price per unit of the value of grassland ecological services (USD/ha).
(i)
Losses of industrial and residential lands
Coal mining often caused industrial lands to subside and thus wasteland resources. Moreover, a coal mining plant often occupies and pollutes lands surrounding the mines and causes the local residents to relocate [26]. The restoration or replacement cost approach was adopted to measure this cost using Equation (10):
C9 = PA ×AL × CID + PA × MP × CRD,
where C9 is the total cost of the loss of industrial and residential lands, AL is the area of land subsidence caused by each ton of coal mined (ha/ton), MP is the number of residents having to relocate per each ton of coal mined (person/ton), CID is the cost of land subsidence based on each ton of coal mined (USD/ha), and CRD is the per unit cost of the relocation of each resident.
(j)
GHG emissions
Coal mining and burning release GHGs (CH4, CO2) and thus have the potential to contribute to global warming. The damage cost value method was adopted to calculate this cost using Equation (11):
C10 = CG × (PA × WM + PC × WC),
where C10 is the total cost of the negative effects caused by GHG emissions, PC is the total amount of coal burned in coal-fired plants and rural villages, WM is the emission coefficient of methane for each ton of coal mining (m3/ton), WC is the emission coefficient of CO2 for each ton of coal burning, and CG is the cost per unit of the negative effect of each ton of CO2 equivalent released (USD/ton).

2.3. Data Sources

Statistics from the database in SW China, 2018 were used in this study, e.g., the total production of coal, waste discharge, pollutants, monetized values of patients’ treatment, death compensation. The benefit transfer method was used in calculating some monetized values due to the unavailable data in SW China [56,57,58], e.g., the value of water and soil erosion, forest and grassland destruction. Usually, the benefit transfer method includes the unit value transfer and the function transfer [59]. Due to the similarities in economic and environmental conditions between Shanxi, Inner Mongolia, and SW China, authors preferred to perform the unit value transfer. Black lung disease or pneumoconiosis as well as endemic diseases such as fluorosis, arsenism, and lung cancer are the main diseases caused by coal mining and combustion in SW China. Data related to the number of patients with pneumoconiosis and/or endemic diseases, average medical expense, average time of hospitalization, and average wage of per coal miner were mainly obtained from the Fifth Analysis Resort of National Health Services Survey in China [60], China Public Health Yearbook [61], Sichuan Public Health Yearbook [62], and the Sichuan, Guizhou, and Yunnan statistical yearbooks produced by the statistical bureaus of Sichuan [34], Guizhou [35], and Yunnan [36], respectively. All the statistical reports provide the lowest reasonable estimates because the diseases of many people likely go unreported in the rural villages in SW China. Data related to the incidence of disease, total number of coal miners, and known populations of these provinces were used to present high estimates of the related costs. The value of medical expenses is from the Sichuan Public Health Yearbook [62]. Data related to the total water consumption and the areas of soil erosion, forest, and grassland degradation as well as the amounts of gangue storage related to coal mining are from the statistical year books [34,35,36].
Data related to transportation accidents are from the yearbooks of each province and China’s Work Safety Yearbook [63]. Data related to the dust released during the transportation of coal was estimated based on the total volume of coal transported and then multiplied by the emission coefficient of transportation. Data related to the concentration of SO2 and precipitation pH values are from the respective Ecological Environment Bulletins of Sichuan, Guizhou, and Yunnan published by the respective Department of Ecology and Environment [64,65,66].

3. Results

3.1. Coal Mining

3.1.1. Mortality

In 2018, in Sichuan, Guizhou, and Yunnan provinces, a total of 42, 17, and 13 coal miners were killed in underground mining accidents, respectively [67]. The compensation for mining-related fatalities in each province is 20 times the per capita disposable income of urban residents [68]. Thus, the total cost for human fatalities in 2018 was about USD 6.8 million (Table 3). This is a low estimate because the limited data did not allow us to calculate the costs of coal mine injuries.

3.1.2. Coal Miner Pneumoconiosis

In 2014, a total of 934 cases of coal miner pneumoconiosis (CMP) were reported in Guizhou [69]. In 2007, a total of 1996 cases of CMP were reported in Yunnan and with a mortality rate of about 32.7% [70]. In addition, 720 cases of CMP were reported in Sichuan in 2018 [71]. Based on Wang et al. [72], the number of patients reported to have CMP only accounts for 6.7% of the estimated number of CMP because many patients are reluctant to go to a hospital. They estimated the mean numbers of CMP patients at about 2.05 and 73.41 persons for coal production in one million tons in large and other enterprises, respectively. Thus, the median number for the infection of pneumoconiosis is 37.7 persons per 1 million tons of coal production. In addition, we thus calculated the number of fatalities based on a mortality rate at about 22% of the people who contract these diseases [73]. The estimated number is closer to a recent survey, which reported that about 9538 CMP patients died in 2015 in China [74]. Therefore, we estimated that the total cost of CMP in SW China was about USD 421.6 million in 2017 (Table 3).

3.1.3. Wastewater

Underground mining and MTR will produce a large quantity of wastewater resulting in a large cost for wastewater treatment. The total wastewater discharged in 2018 was about 507.9, 174, and 206.1 million tons in Sichuan, Guizhou, and Yunnan, respectively [34,35,36]. Coal production and processing discharged about 8.7% of the total industrial wastewater in 2017 in China [75]. We thus estimate that the total amount of wastewater discharged by coal production and processing facilities was about 77.26 million tons, and the total external cost for wastewater treatment was USD 44.1 million (Table 3).

3.1.4. Gangue

Coal mining activities produce a large amount of solid waste, most of which is gangue. The ratio of gangue to coal during coal extraction is about 13% using current technology. The total coal production in SW China was 258.4 million tons in 2018. The shadow price of gangue was USD 3.57/t [20]. Thus, we estimate that the total gangue was about 33.6 million tons, and the total external cost for gangue was about USD 120.0 million (Table 3).

3.1.5. Contaminated Underground Water and Soil Erosion

Underground mining and MTR would often pollute or displace underground water resources. About 2.54 m3 of underground water would become contaminated for every one ton of coal production [76]. It is estimated that a total of 656.3 million tons of underground water resources would be contaminated. Thus, the total external cost for underground water resource contamination was about USD 728.5 million in 2018. Moreover, coal mining would lead to an increasing trend of water and soil erosion. Based on related statistics from 2018, about 26.46 million hectares of soil experienced erosion in SW China [77]. We referred to Lv et al. [26] and concluded that a total of 63,308 ha of soil erosion were caused by coal mining with a total cost of USD 98.6 million (Table 3).

3.1.6. Land Subsidence and Residents Relocation

Coal mining will create a number of mined-out areas that can result in land subsidence, which can disrupt or destroy the land resources on the surface. Further, land subsidence would often destroy villages and force local residents to be relocated. Usually, about 200 people relocate for every 1 million tons of coal production in the densely populated plain areas among China’s population [78]. In view of the geomorphology and population density in SW China, this number goes to 100 people for every million tons of coal produced. Thus, the total cost of land resource loss caused by land subsidence and the relocation of residents is about USD 205.2 million (Table 3).

3.1.7. Forest Destruction

Coal mining that creates large amounts of mined-out areas will result in a loss of forest resources. Land subsidence will not only destroy areas of forest and reduce tree growth but also decrease the value of ecological services provided by forests. In 2018, about 5168ha of lands was totally mined-out. We used the mined-out area influence coefficient of 2.6 [21] and believe that about a total of 13,436.8ha areas has been affected in SW China. Based on the forest coverage rate in SW China [64,65,66], we thus calculated the total affected area of forest was 7133.8 ha in 2018. Therefore, we estimate that the external costs of forest resource destruction were about USD 815.7 million in total (Table 3).

3.1.8. Grassland Destruction

Moreover, the mined-out areas caused by coal mining would destroy many areas of grassland and thus damage the value of the ecological services they provide. Based on the grassland coverage rate in SW China, the total area of affected grassland was 609.1 ha in 2018. Thus, the total loss of the grassland ecological service value was USD 0.5 million (Table 3).

3.2. Coal Transportation

3.2.1. Mortality

Coal transportation accounts for about 60% of all rail traffic and 10% of all highway freight transportation in China [45]. We assumed that the rail and highway accidents are in the same proportion as coal transportation by rail and highway. Thus, we calculated about 56 and 315 people were killed by railroad and highway accidents in 2018 [63] based on the coal extraction ratio in SW China [2] for a total external cost of USD 34.7 million (Table 3).

3.2.2. Dust Pollution

Coal in SW China is largely transported by railway (75%) and highway (25%) [25]. In 2018, there were 34.3, 26.1, and 41.1 million tons of coal transported in Sichuan [34], Guizhou [35], and Yunnan [36], respectively. Thus, the total costs of dust pollution were USD 261.7 million (Table 3).

3.3. Coal Combustion

3.3.1. Skeletal Fluorosis

Based on the latest data, about 12 million (1.03, 8.79, and 2.19 million in Sichuan, Guizhou, and Yunnan, respectively) dental fluorosis patients and nearly 1.8 million (0.17, 1.08, and 0.57 million in Sichuan, Guizhou, and Yunnan, respectively) skeletal fluorosis patients had been identified by the end of 2013 [61]. We only considered the skeletal fluorosis patients for external costs. All skeletal fluorosis patients with moderate and severe illness lost their ability to work based on Zang [89]. From the surveillance of local government, the median of skeletal fluorosis with moderate and severe illness is about 48.5% in Sichuan [86], 39.5% in Guizhou [87], and 35.6% in Yunnan [88]. The total costs of skeletal fluorosis patients in SW China are about USD 57.5 billion (Table 3).

3.3.2. Endemic Arsenism and Lung Cancer

Endemic arsenism was only reported in Guizhou in SW China with 2848 patients identified [60]; those patients had a high potential to experience lung cancer. The heart and skin diseases caused by endemic arsenism will cost about USD 164.3/person [61,93]. The cost for endemic arsenism is about USD 1.1 million (Table 3).
Besides endemic arsenism, crystalline silica and fine quartz particles from coal emissions in Xuanwei and Fuyuan counties also have a high potential to cause lung cancer [45,53]. Thus, we only accounted for the endemic arsenism patients in Guizhou (50% of all patient), while Xuanwei and Fuyuan counties are reported to have the highest incidence of female lung cancer and mortality [53]; then, we estimated the number of lung cancer patients caused by the burning of coal. The incidences of lung cancer in Xuanwei and Fuyuan for men and women were 482.78/100,000 and 387.98/100,000 [90]. The mortality rate from lung cancer in China is about 30.8 fatalities per 100,000 people [61]; in Xuanwei, there were 87.2 fatalities per 100,000 people [94]. The total cost of lung cancer caused by coal combustion was USD 1.2 billion in 2018 (Table 3).

3.3.3. Pollutants

The emissions of SO2, NOX, and PM10 as air pollutants will affect human health. The burning of coal for industry and domestic use is the major contributor to regional air pollution in Guizhou and Yunnan provinces and contributes about 60% of these air pollutants emitted in Sichuan province [95]. In 2018, the total volume of SO2, NOX, and PM10 emissions was 487,200 t, 451,000 t, and 272,000 t in Sichuan [64], 687,500 t, 359,669 t, and 196,800 t in Guizhou [65], as well as 384,400 t, 268,834 t, and 224,154 t in Yunnan [66], respectively. Therefore, the cost of human health caused by the burning of coal was about USD 5.3 billion (Table 3).

3.3.4. Global Warming

Climate impacts were monetized, and the value of damages was estimated at about USD 30/ton of CO2 equivalent (CO2e) [92]. In China, about 7–8 m3 CH4 is emitted for every one ton of coal production [25]. We only consider the CH4 emissions during coal mining and estimated that the total emissions in 2018 were 1.94 billion m3, which is equivalent to 29.1 million t CO2e. About 2.494 t of CO2 was emitted for every one ton of standard coal combustion in China’s coal-fired power plants [91]. In SW China, coal combustion is used not only for power generation but also for heating and cooking in rural villages. The indoor combustion efficiency was about 50% of that from power plants [96]. Thus, the total coal combustion including personal use in SW China was 116.17 million tons, and the total emissions of CO2 were 194.9 million tons. We estimate that the total costs of climate change from GHG emissions were USD 6.7 billion (Table 3).

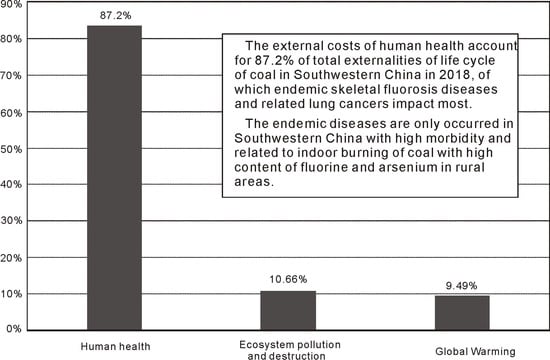
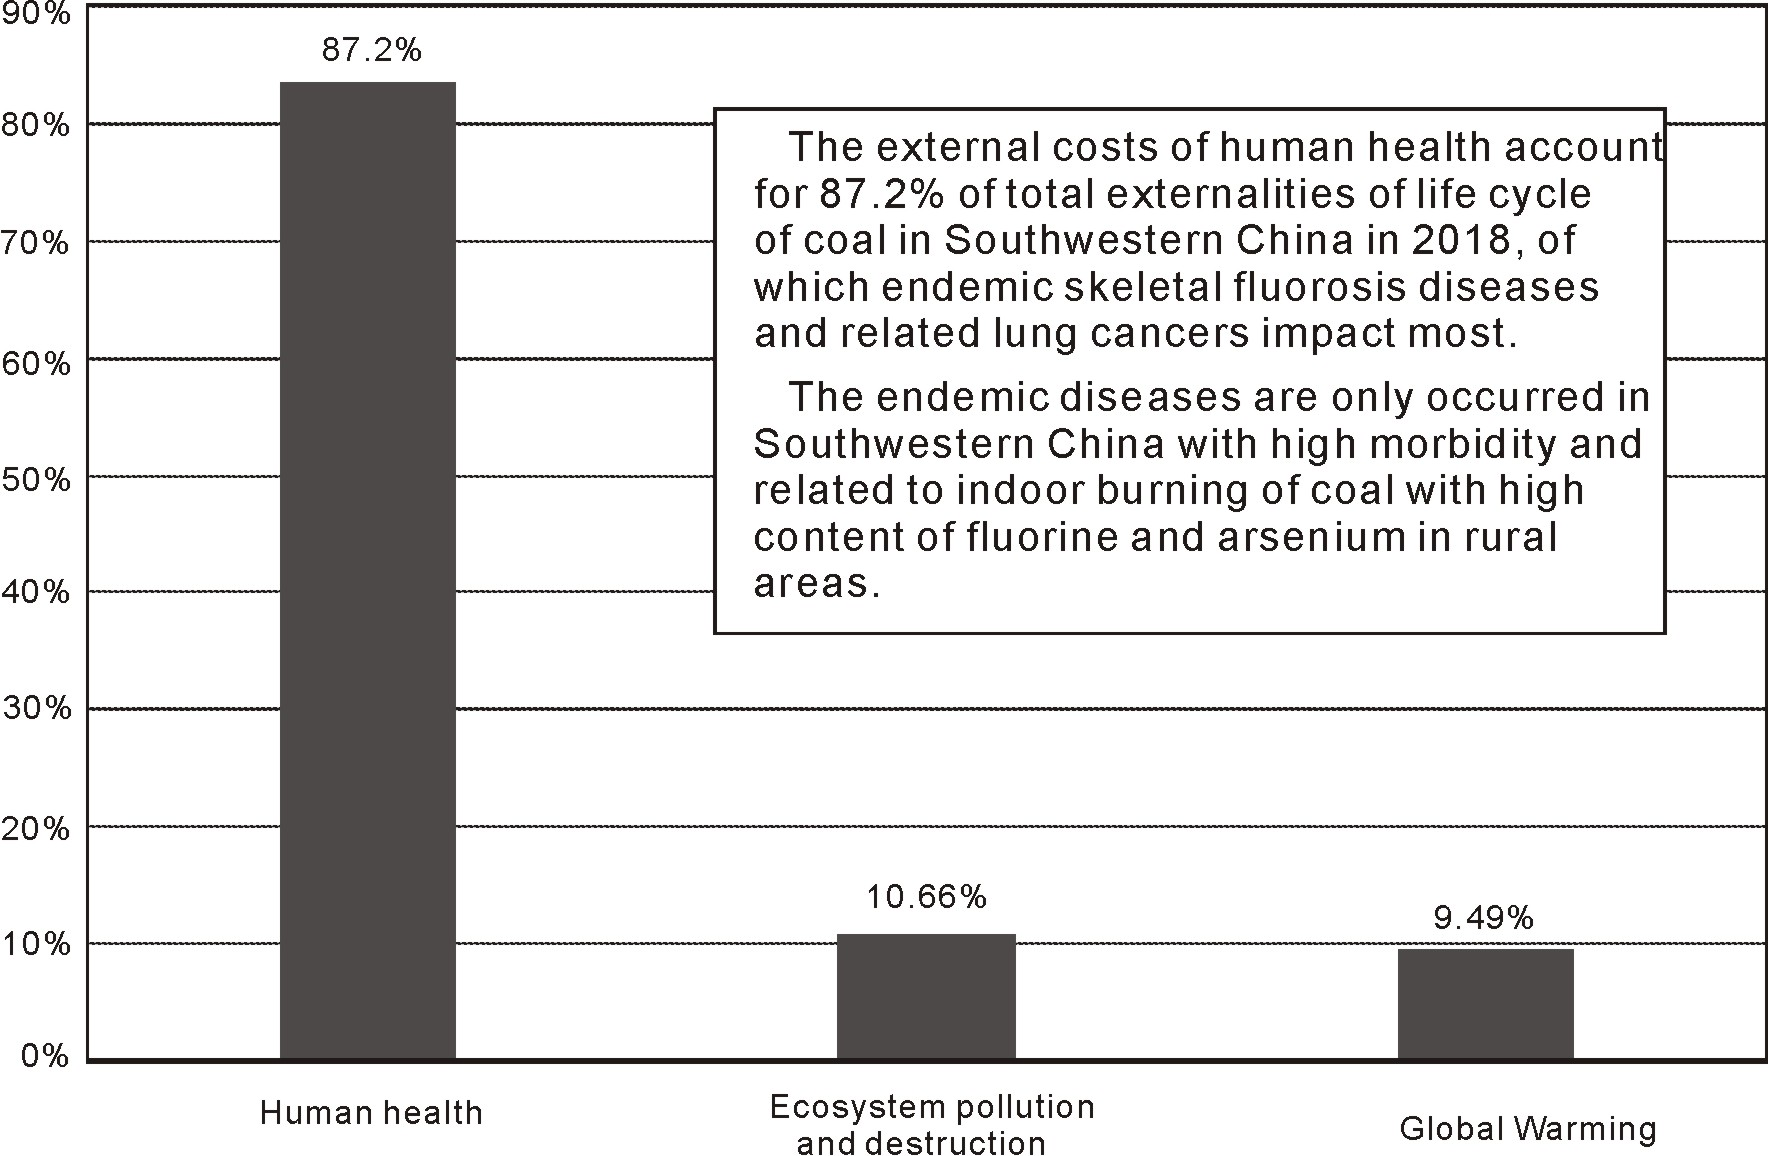
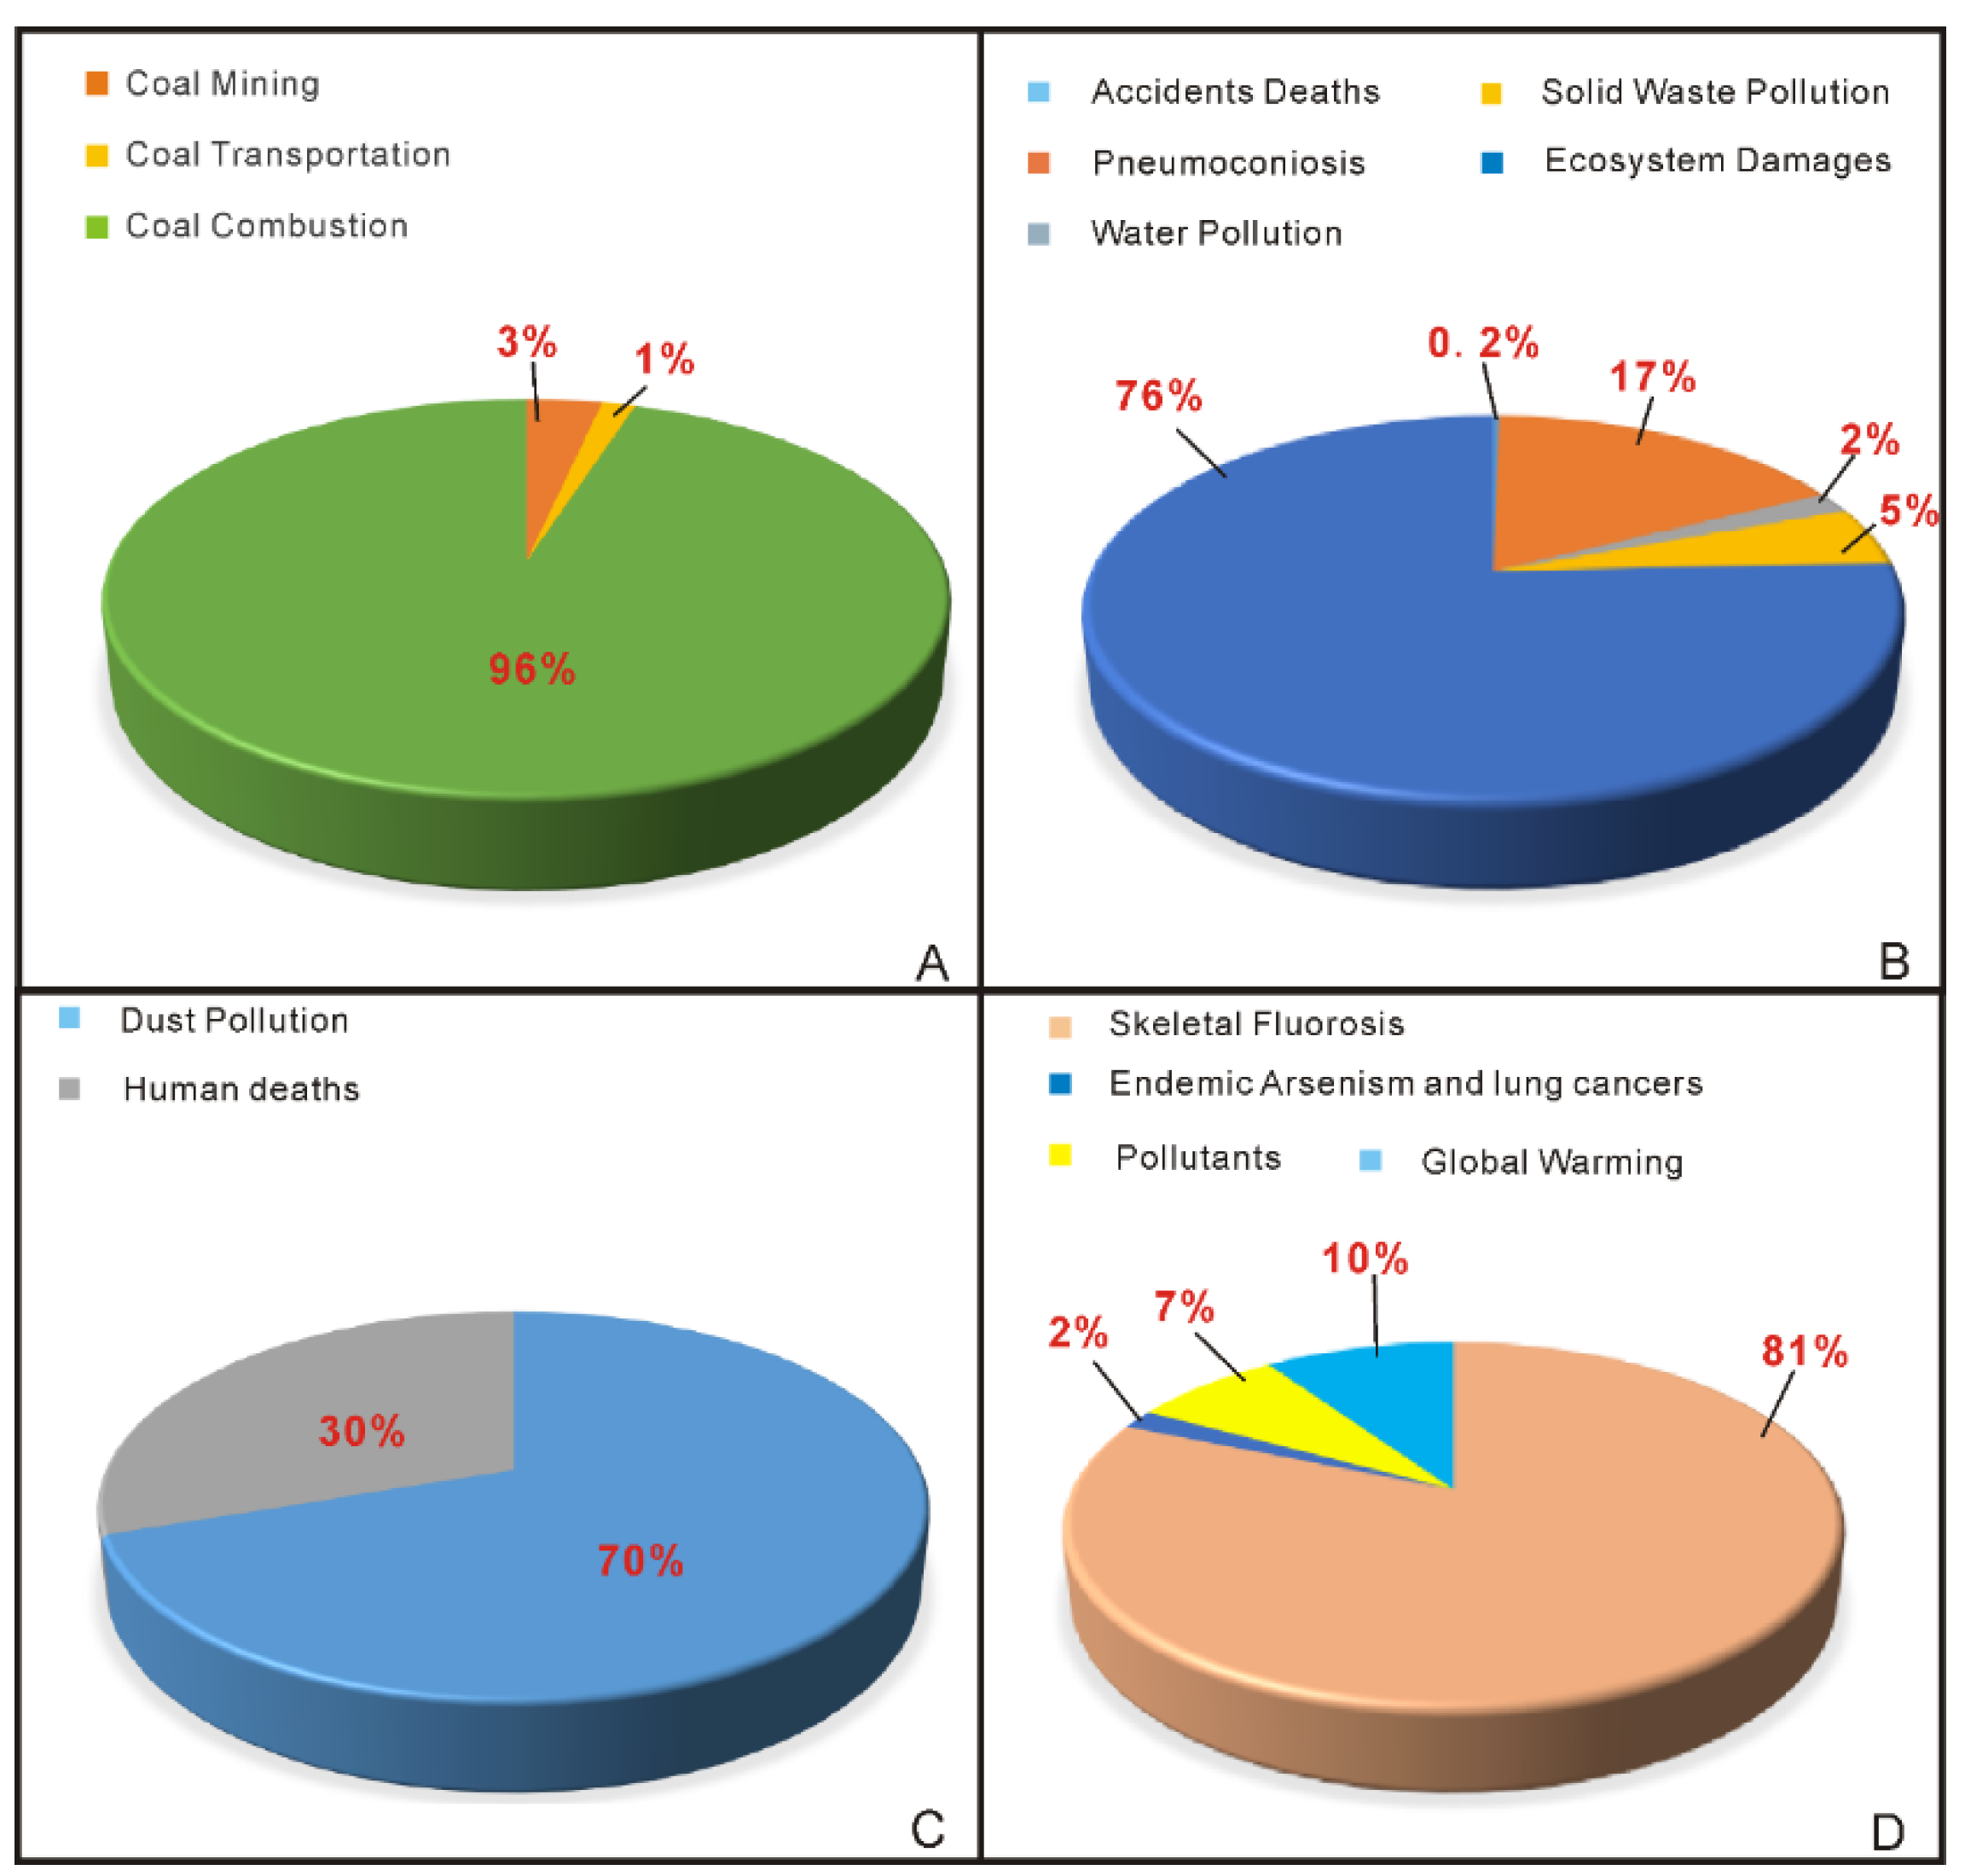
3.4. Comprehensive Analysis on External Costs

By estimating the external costs for the life cycle of coal, our understanding of the true environmental effects of mining and burning coal in SW China could be benefited as well. The total externalities related to coal were USD 73.5 billion in 2018 (Table 4), which is equivalent to USD 284.3/t. The total external costs accounted for 6.5% of the GDP of these provinces in 2018. The external costs are far beyond the actual price of each ton of coal in China. Therefore, coal use in SW China is very costly in terms of the combined costs. Coal combustion takes up about 96% of the total external environmental costs (Figure 3A) and was about USD 70.7 billion in 2018 (Table 4). The cost of externalities in coal mining and transportation were USD 2.4 billion and USD 0.3 billion in 2018, respectively (Table 4). The costs of damages to the ecosystem include about 76% of the total cost of externalities during the coal mining stage and thus have the most serious impact (Figure 3B). The costs of pneumoconiosis caused by air pollution during the coal mining stage account for 17% of total costs. Dust pollution is the primary impact on the environment and accounts for 70% of the externalities caused by coal transportation (Figure 3C). During the coal combustion stage, the most seriously affected of the externalities is skeletal fluorosis, accounting for 87%, with endemic arsenism and related lung cancer of 10% (Figure 3D).

4. Discussion

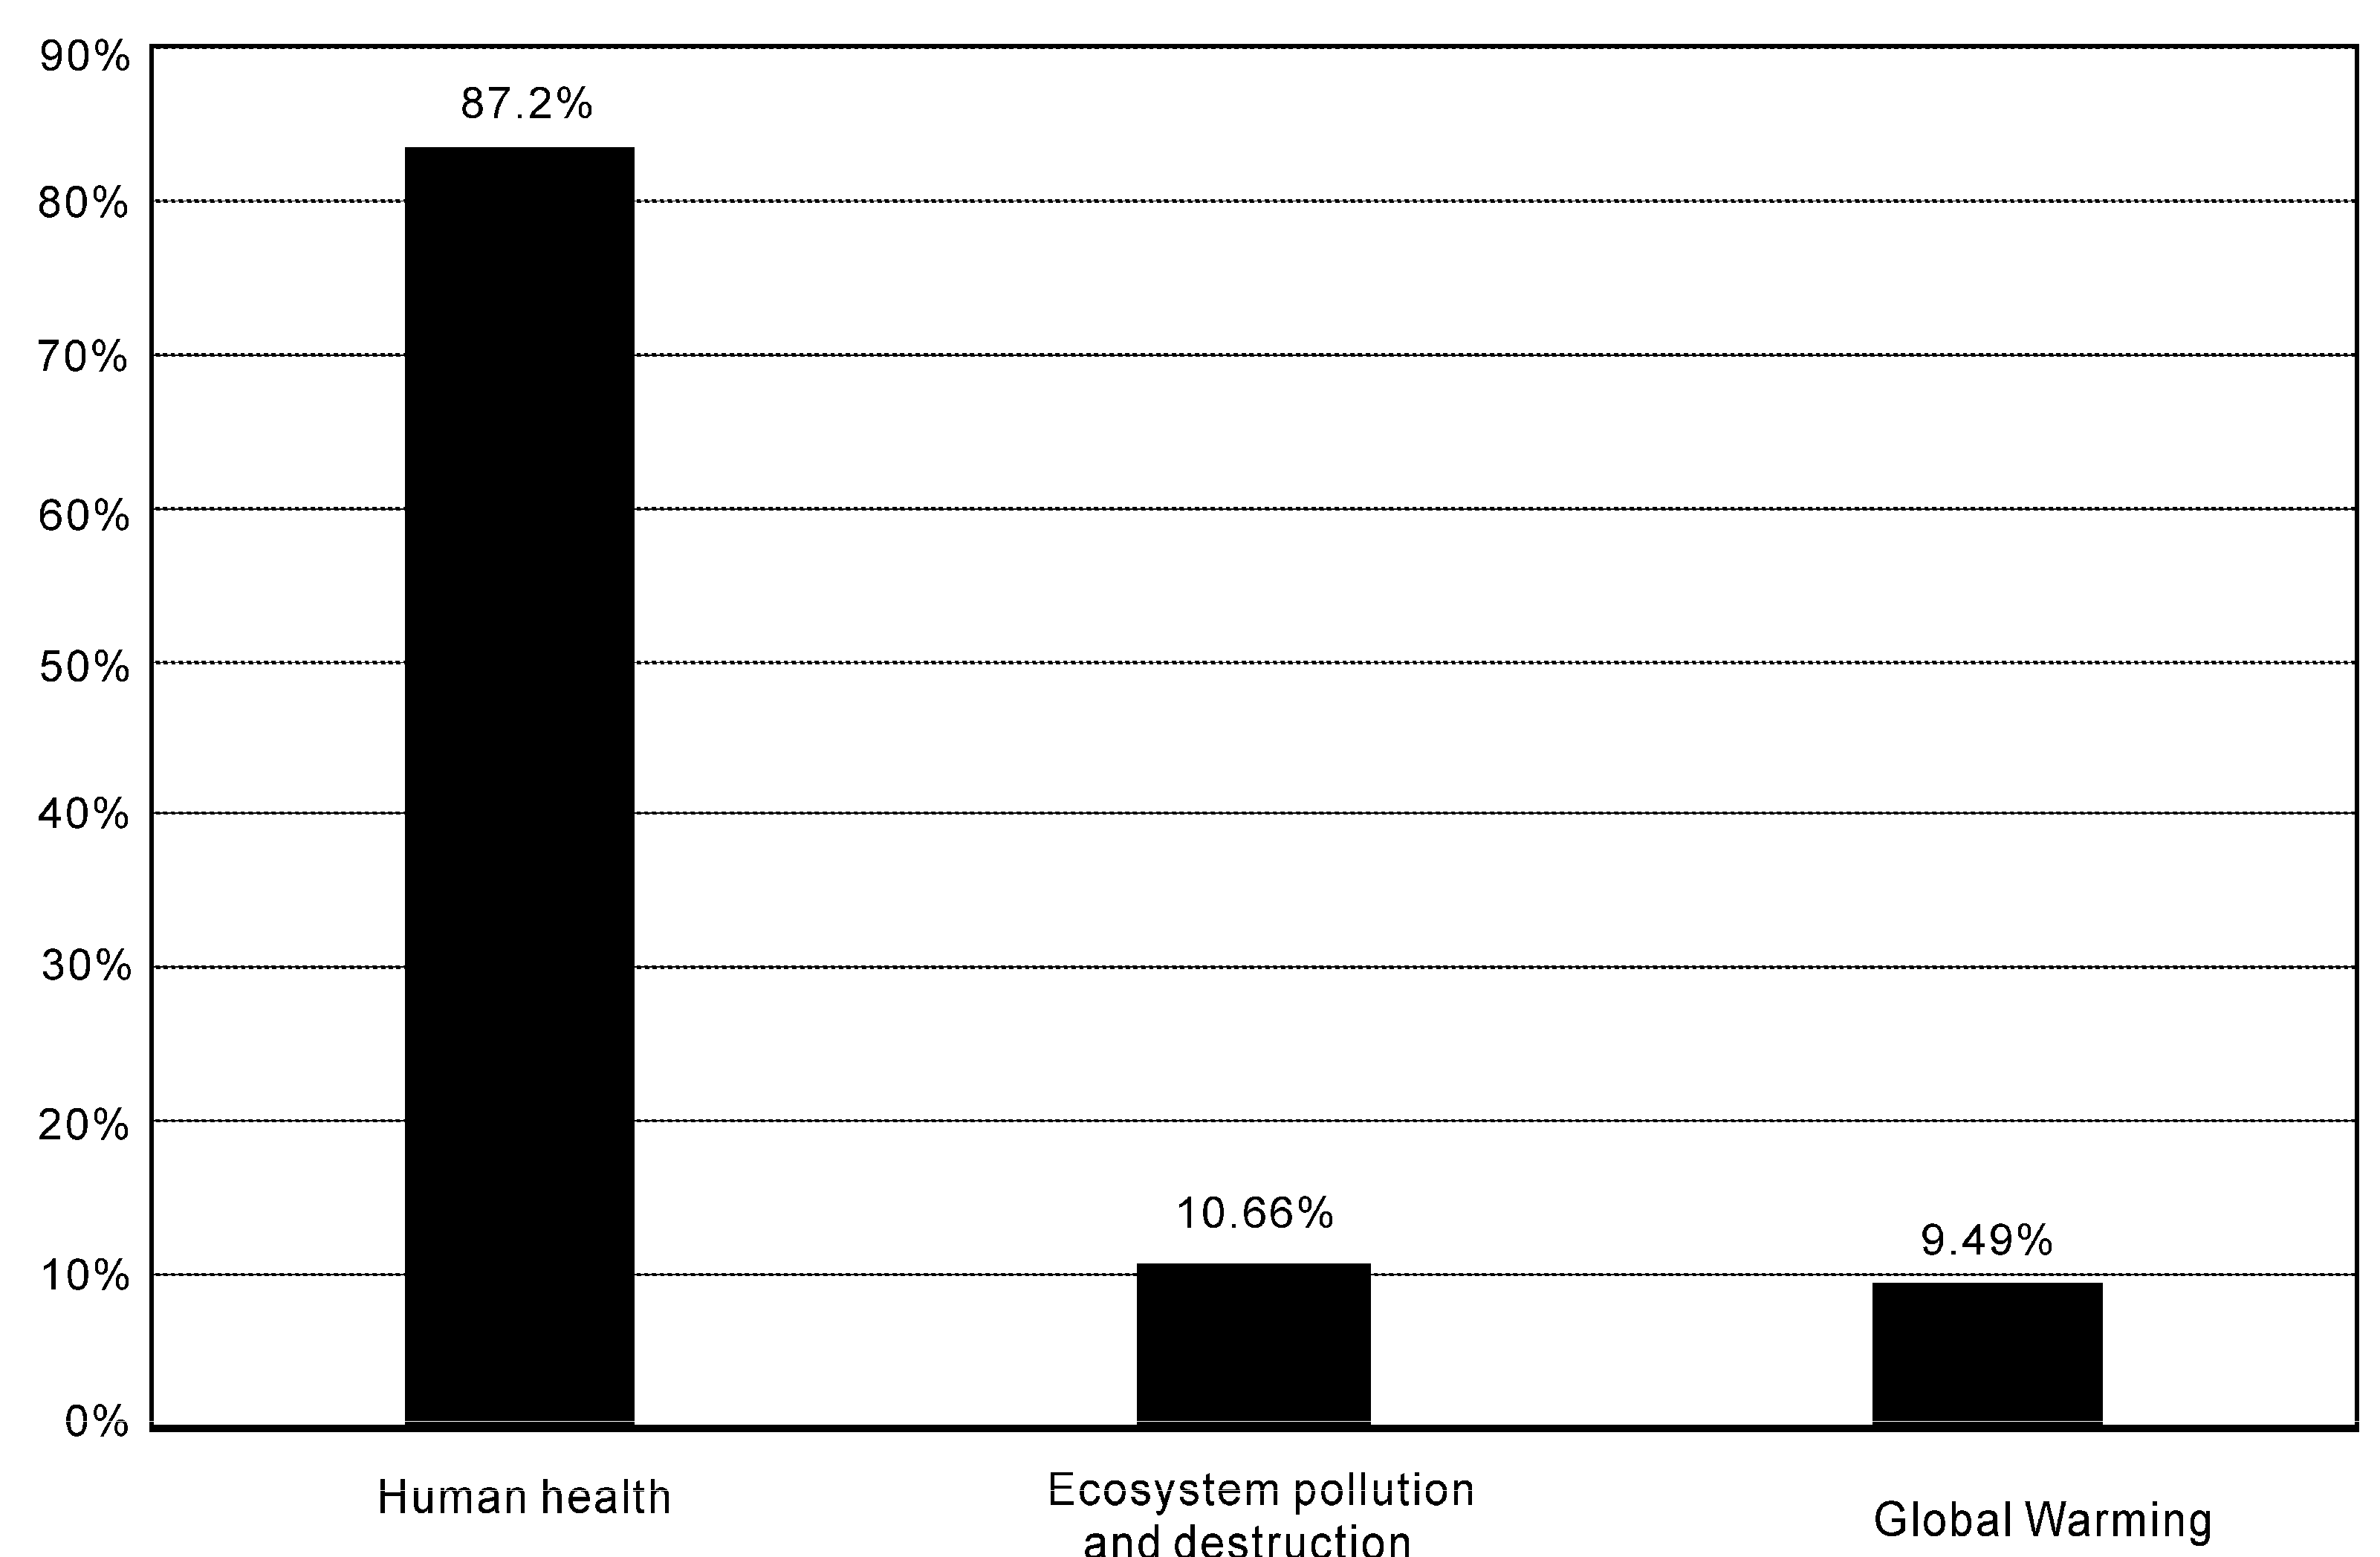
4.1. Externalities Structure

4.1.1. Human Health

The external costs in the life cycle of coal can be categorized into three sections, i.e., human health, ecosystem pollution and destruction, and global warming. Human health includes mortality, as this is prone to appear during the process of underground mining and transportation, and common fatal diseases include pneumoconiosis, skeletal fluorosis, endemic arsenism, and lung cancers. It clearly shows that human health accounted for 87.2% of the total external costs in SW China in 2018 (Figure 4).
Underground mining accidents often cause fatalities in SW China because of the difficult geographic and geomorphic conditions in mines. The mining fatalities in SW China caused many deaths and injuries with methane-related accidents causing the most fatalities [97], although the numbers have dramatically decreased in the past ten years from 352 in 2012 to 72 in 2018 [67,98]. Most fatalities were caused by trucks during coal transportation, which results in greatly increased road hazards. Expenses in fatalities contributed to about USD 41.5 million of external cost in 2018 (Table 4). Nevertheless, decreasing the number of accidents during coal mining and increasing the safety of the rail transportation of coal are essential. The numbers of coal miners who were infected by pneumoconiosis as they were overly exposed to the harmful environment during coal mining and using took up 50% of the total pneumoconiosis patients in China [72]. With the external costs at about USD 421 million in 2018 (Table 4), it shows a 14.2% year-on-year decrease compared with 2017 in terms of the number of CMP patients in China, indicating that a significantly effective solution had been adopted to prevent and treat the disease, e.g., increasing mechanical mining, strengthening the supervision to mining industries.
As mentioned above, coal and clay are highly enriched with F and As in SW China, and thus endemic fluorosis and arsenism have been reported [6,43,45,46]. Moreover, the high content of crystalline silica or fine quartz particles in coal from northeastern Yunnan may cause lung cancer with high mortality rates [43,53]. In SW China, the highest externalities came from the damage and losses caused by endemic diseases resulting from the indoor burning of coal which lead to an external cost of USD 58.7 billion in 2018 (Table 4), of which skeletal fluorosis accounted for 97.93% of total externalities caused by these diseases. These results are consistent with the trend of pollutant emissions in China from 2008 to 2015. Pollutant emissions of S, Hg, As, and F have increased dramatically in rural communities since 2008, which is in sharp contrast to the decrease in emissions from coal-fired power plants in China [99]. A recent survey showed that there is an increased trend of endemic skeletal fluorosis [7]. Therefore, reducing the incidence of endemic diseases is the best way to decrease the externalities in SW China. The high incidence of endemic diseases in SW China has several causes. First, these areas have rural villages in the mountainous areas with extremely poor economic conditions. The residents cannot afford clean energy to replace coal, and the coal they use has a high F and As content [45]. Second, the most important cause of the coal-related disease is that the residents usually eat food cooked indoors on open coal-fired stoves, which increases the high potential for disease. As such, the local government should help to build solar energy facilities to heat rural communities and connect natural gas pipelines to support city life. Moreover, the residents should change their lifestyles and abandon the use of open coal fires for heating food. Last but not least, the local government should implement policy to forbid using any coal with high F and As contents, which means any coal mines producing such coal must be shut down and abandoned.

4.1.2. Ecosystem Pollution and Destruction

The externalities of ecosystem pollution and destruction accounted for 10.66% of the total external costs of the life cycle of coal in SW China in 2018 (Figure 4). Ecosystem pollution and destruction includes wastewater and gangue pollution, underground water, soil, land, forest, and grassland destruction from coal mining, dust pollution from coal transportation, as well as air pollutants from coal combustion (Table 4).
Based on our calculation, the externalities of wastewater are much lower than the gangues. Since only a limited amount of data was available, only the external costs of wastewater discharged during coal production and washing were considered. The large quantity of wastewater produced by coal-fired power plants was not concluded. We only considered the storage of gangue during the coal mining stage and did not include the burning of coal or the effects of fly ash. A large quantity of fly ash is produced in coal-fired power plants [100]. The real cost of fly ash produced during coal combustion is about seven to ten times that of gangue [27]. Although an underestimate of about 90% to the real externalities was adopted in the present study, it will have little effect on our analysis due to the minimum value.
The ecological damage that occurs during coal mining was estimated at USD 1.85 billion of the external costs (Table 4). The external costs of impacts on water and forest destruction were USD 728.5 million and USD 815.7 million, respectively, accounting for 83.5% of the total ecosystem damage. The externalities caused by impacts on grassland were the lowest of total ecosystem damage. These results are related to the geographic and geomorphic conditions in SW China. Most coal mines in this region are in rural mountainous areas and thus have a more severe impact on water and forest resources than on grasslands.
The externalities of dust pollution from coal transportation are estimated at much lower than those of air pollutants during the coal combustion stage (Table 4). These external costs are extremely low when compared with those of endemic diseases (Table 4).
Sulfur dioxide produced during the process of coal combustion has the most significant impact on the acidification of waterbodies [78]. Generally, SW China has excellent air quality based on the region’s physical geography and environmental capacity to disperse pollutants. Therefore, no effects of SO2 emissions and acid precipitation caused a reduction in crop yield.

4.1.3. Global Warming

The use of coal is the main contributor to GHG emissions including CH4, that is mainly emitted in the coal mining stage, and CO2; CO is also emitted during the burning of coal [5,27]. However, CO2 is the main contributor from coal use to global warming. The external costs of GHG emissions in SW China were estimated to be USD 6.7 billion, which contributed to 9.49% of total externalities (Figure 4). The International Energy Agency reported about 14.50 billion tons emissions from coal occurred worldwide in 2017. By 2020, the Chinese government committed to a 40%–45% reduction in CO2 emissions per unit of GDP compared with emissions in 2005 [95]. To accomplish this goal, using clean coal and very efficient coal-burning processes will provide the main methods of lowering total carbon emissions. Carbon dioxide capture and storage is considered to be a promising technology for the abatement of GHG emissions [101]. The International Energy Agency called the third power plant constructed in the Waigaoqiao District of Shanghai the cleanest coal-fired power plant in the world: this power plant has clean and very efficient emission technology so that emissions from this plant are far lower than from natural gas-powered plants [102]. The technology includes an ultra-supercritical 1000 MW generator, flue gas desulfurization technology with zero energy consumption, and all-weather denitration [103,104]. This plant has been proven to be successful, and large-scale popularization and application of this technology should be implemented.

4.2. Limitations and Comparisons

This study is primarily based on the available data from a wide range of government organizations and literature. Data limitations suggested us to omit some environmental impacts. For example, the externalities of fly ash, PM 2.5, NOx, and Hg released into the environment and the effects of coal combustion on human health are not easily quantifiable. Moreover, several parameters that were involved in the mathematic model are not based on local research; these parameters should have a wide range to show the low and high estimates rather than providing a definite value. Thus, some LCA software, e.g., SimaPro, should be used.
Moreover, the monetized values and data that came from other regions made the research results less persuasive. For example, the shadow price of gangue disposal and underground water, the cost for the restoration of water, soil conservation and land per unit, as well as the data collected from Shanxi and Inner Mongolia which shows the external cost for dealing with dust pollution per unit (Table 3). However, these numbers only make up a small part of the total externalities and are much lower than their counterpart in human health. Thus, we believe that final results would not be heavily affected with these numbers.
Shanxi and Inner Mongolia are the largest coal-producing provinces in China. Zhang [25] analyzed the external costs of the coal-fired power plants in Shanxi and estimated external costs of about USD 4.6 billion or USD 1.89/kW h, which is comparable to Wang et al. [27] but is much lower than the estimate of Epstein et al. [5]. For Inner Mongolia in 2014, the total external environmental costs of coal were USD 12.5 billion or USD 22.77/t [26]. Liu et al. [24] estimated the total externalities at about USD 28.2/t in China in 2010. In this study, we estimated the external costs for the life cycle of coal in SW China were USD 284.3/t in 2018. Our study reveals a much higher cost compared with similar studies in other provinces in China. The main reason is that we considered endemic diseases in the total external costs for the first time, which are a typical characteristic side-effect of the use of coal in SW China.

5. Conclusions and Policy Recommendations

This paper estimated the total external costs for the life cycle of coal in SW China by performing damage cost theory. In 2018, the total externalities in SW China were estimated to be USD 73.5 billion or 284.3 USD/t, which accounts for 6.5% of the provincial GDP in this area. The external costs show that the true cost of using coal is far beyond the price of extraction and use alone, meaning that using coal is truly not very economical. The different costs of the life cycle of coal mining, transportation, and combustion were estimated to cost about USD 2.4 billion, USD 0.3 billion, and USD 70.7 billion, respectively. The external costs of human health account for 87.2% of the total external costs, of which endemic skeletal fluorosis diseases and related lung cancers impact the most, while the externalities of ecosystem pollution and destruction and global warming are estimated to account for 10.66% and 9.49% of the whole. The endemic diseases which only occur in SW China with high morbidity caused the much higher externalities.
The growth of coal use is expected to accelerate with the increasing demands for electricity and economic development in the rural areas of SW China. We suggest that the results would provide local governments a more serious assessment in terms of the true cost and impact of coal use.
To internalize the external cost, several policy recommendations are proposed. First, clean and highly efficient technology for coal combustion should be provided to the local coal-fired power plants in order to reduce GHG and air pollutant emissions. Second, by reducing the huge fanatical subsidies to the coal industry [17] and taxing the wastewater and gangue, the real cost of coal will be reflected in the price. By adjusting various types of coal taxes and fees, the government can implement increases in environmental taxes and fees that reflect the external cost of coal on the environment reasonably and thus achieve the goals of adjusting the energy consumption structure in China through a price transmission mechanism. Third, the electricity tariff should be priced in consideration of the external costs. Thus, the reform of the electricity environmental protection price should be gradually pursued [18]. Last but not least, the real situation shows that high externalities in SW China are related to endemic diseases caused mostly by indoor burning in rural areas. Thus, local governments should help communities in rural areas to build solar energy facilities for heating, encourage the use of enclosed coal-fired stoves indoors, and connect natural gas pipelines to limit the use of coal in cities. Moreover, the residents should radically change their lifestyle so they can avoid eating food cooked on open coal-fired stoves.

Author Contributions

X.W., L.W., and J.C. designed the research, analysis, and writing. S.Z. and P.T. participated in drafting the manuscript and provided constructive comments. All authors have read and agreed to the published version of the manuscript.

Funding

This research is financially supported by Strategic Priority Research Program of Chinese Academy of Sciences (XDA 20170303) and the Second Tibetan Plateau Scientific Expedition and Research Program (STEP 2019QZKK080302).

Acknowledgments

The authors thank LetPub (www.letpub.com.cn) for its linguistic assistance during the preparation of this manuscript. Four anonymous referees and editors are thanked to improve the quality of the previous manuscript.

Conflicts of Interest

The authors declare no conflict of interest.

References

  1. International Energy Agency. Coal. 2019. Available online: https://www.iea.org/reports/coal-2019 (accessed on 15 February 2020).
  2. National Bureau of Statistics of China (NBSC). China Statistical Yearbook; China Statistics Press: Beijing, China, 2019. [Google Scholar]
  3. Goodell, J. Big Coal: The Dirty Secret behind America’s Energy Future; Houghton Mifflin Press: New York, NY, USA, 2006. [Google Scholar]
  4. National Health Commission of China (NHCC). Statistical Bulletin on the Development of China’s Health Undertakings in 2018. Available online: http://www.nhc.gov.cn/guihuaxxs/s10748/201905/9b8d52727cf346049de8acce25ffcbd0.shtml (accessed on 15 February 2020).
  5. Epstein, P.R.; Buonocore, J.J.; Eckerle, K.; Hendryx, M.; Stout, B.M., III; Heinberg, R.; Clapp, R.W.; May, B.; Reinhart, N.L.; Ahern, M.M.; et al. Full cost accounting for the life cycle of coal. Ann. NY Acad. Sci. 2011, 1219, 73–98. [Google Scholar] [CrossRef]
  6. Finkelman, R.B.; Tian, L.W. The health impacts of coal use in China. Int. Geol. Rev. 2017, 1–11. [Google Scholar] [CrossRef]
  7. Liu, Y.; Ma, P.; Luo, K.; Li, L. The state and trend of Endemic fluorosis from 1991 to 2012 in China. J. Chongqing Nor. Univ. Nat. Sci. 2016, 33, 142–151, (Chinese Journal with English Abstract). [Google Scholar]
  8. Owen, A.D. Renewable energy: Externality costs as market barriers. Energy Policy 2006, 34, 632–642. [Google Scholar] [CrossRef]
  9. Wang, C.B.; Zhang, L.X.; Zhou, P.; Chang, Y.; Zhou, D.Q.; Pang, M.Y.; Yin, H. Assessing the environmental externalities for biomass-and coal-fired electricity generation in China: A supply chain perspective. J. Environ. Manag. 2019, 246, 758–767. [Google Scholar] [CrossRef] [PubMed]
  10. Mahapatra, D.; Shukla, P.; Dhar, S. External cost of coal based electricity generation: A tale of Ahmedabad city. Energy Policy 2012, 49, 253–265. [Google Scholar] [CrossRef]
  11. Rabl, A.; Spadaro, J.V. External costs of energy: How much is clean energy worth. J. Sol. Eng. 2016, 138, 040801. [Google Scholar] [CrossRef]
  12. Spath, P.L.; Mann, M.K.; Kerr, D.R. Life cycle assessment of coal-fired power production. Off. Sci. Tech. Inf. Techn. Rep. 1999, 1–172. [Google Scholar]
  13. Karkour, S.; Ichisugi, Y.; Abeynayaka, A.; Itsubo, N. External-cost estimation of electricity generation in G20 countries: Case study using a global life-cycle impact-assessment method. Sustainability 2020, 12, 2002. [Google Scholar] [CrossRef] [Green Version]
  14. Jorli, M.; Van Passel, S.; Saghdel, H.S. External costs from fossil electricity generation: A review of the applied impact pathway approach. Eng. Environ. 2018, 29, 635–648. [Google Scholar] [CrossRef] [Green Version]
  15. Wang, X.L.; Lin, B.Q. Electricity subsidy reform in China. Eng. Environ. 2018, 28, 245–262. [Google Scholar] [CrossRef]
  16. Yuan, J.H.; Guo, X.X.; Zhang, W.R.; Chen, S.S.; Ai, Y.; Zhao, C.H. Deregulation of power generation planning and elimination of coal power subsidy in China. Util. Policy 2019, 57, 1–15. [Google Scholar] [CrossRef]
  17. Xiang, H.J.; Kuang, Y.X. Who benefits from China’s coal subsidy policies? A computable partial equilibrium analysis. Resour. Energy Econ. 2020, 59, 101124. [Google Scholar] [CrossRef]
  18. Zhao, Y.; Zhang, J.J.; Wang, Z.X. Cost analysis of environmental protection price of coal-fired plants in China. Environ. Sci. Pollut. Res. 2020, 27, 18729–18742. [Google Scholar] [CrossRef] [PubMed]
  19. Eliasson, B.; Lee, Y.Y. Integrated Assessment of Sustainable Energy Systems in China; Springer Science+ Business Media: Dordrecht, The Netherlands, 2003; pp. 44–5586. [Google Scholar]
  20. Dang, J.H.; Jia, C.X.; Xu, T.; Xu, S.Z. Study on environmental damage accounting by coal mining activities in Shanxi Province. R. Environ. Sci. 2007, 20, 155–160, (Chinese Journal with English Abstract). [Google Scholar]
  21. Zhang, W.L.; Lian, P. Study on the ecological costs and redemption during coal mining. China Energy 2008, 30, 29–32, (Chinese Journal with English Abstract). [Google Scholar]
  22. Cao, J.L. Environment damage evaluation of mining coal in Shanxi Province, China. Geol. Bull. China. 2009, 28, 685–690, (Chinese Journal with English Abstract). [Google Scholar]
  23. Feng, S.J.; Ma, Y.D.; Liu, H.; Pan, R.F. On the way of calculating the atmospheric environmental damage due to the pollution in the coal-mining resource cities. J. Saf. Environ. 2012, 12, 138–142, (Chinese Journal with English Abstract). [Google Scholar]
  24. Liu, Q.Q.; Qin, C.B.; Ge, C.Z.; Cheng, C.Y.; Long, F. Economic accounting of external environmental cost of coal in China. China Environ. Sci. 2015, 35, 1892–1900, (Chinese Journal with English Abstract). [Google Scholar]
  25. Zhang, N.N. Research of Coal-Fired Electricity External Costs Based on The Theory of Life Cycle Taking Shanxi as an Example. Master’s Thesis, Shandong University of Science and Technology, Qingdao, China, 2015. [Google Scholar]
  26. Lv, H.D.; Zhou, J.S.; Yang, L.; Li, Y.M.; Liu, L. An accounting of the external environmental costs of coal in Inner Mongolia using the pollution damage method. Environ. Dev. Sustain. 2020, 22, 1299–1321. [Google Scholar] [CrossRef]
  27. Wang, J.; Wang, R.; Zhu, Y.; Li, J. Life cycle assessment and environmental cost accounting of coal-fired power generation in China. Energy Policy 2018, 115, 374–384. [Google Scholar] [CrossRef]
  28. Wang, L.L.; Watanabe, T.; Xu, Z.W. Monetization of external costs using lifecycle analysis—A comparative case study of coal-fired and biomass power plants in Northeast China. Energies 2015, 8, 1440–1467. [Google Scholar] [CrossRef] [Green Version]
  29. Wu, X.C.; Wu, K.; Zhang, Y.X.; Hong, Q.Q.; Zheng, C.H.; Gao, X.; Cen, K.F. Comparative life cycle assessment and economic analysis of typical flue-gas cleaning processes of coal-fired power plants in China. J. Clean. Prod. 2017, 142, 3236–3242. [Google Scholar] [CrossRef]
  30. Wang, N.; Ren, Y.; Zhu, T.; Meng, F.; Wen, Z.; Liu, G. Life cycle carbon emission modelling of coal-fired power: Chinese case. Energy 2018, 162, 841–852. [Google Scholar] [CrossRef]
  31. Ministry of Natural Resources of China (MNRC). China Mineral Resources; Geological Publishing House: Beijing, China, 2018. [Google Scholar]
  32. Song, H.Z. Study on the Distribution Characteristics and the Exploration and Development Prospect of Coal Resource of China. Ph.D. Thesis, China University of Geosciences, Beijing, China, 2013. [Google Scholar]
  33. Zhang, D. Study on economics of Southwestern China’s hydropower exploitation and transmission. Electr. Power 2012, 45, 4–6, (Chinese Journal with English Abstract). [Google Scholar]
  34. Statistical Bureau of Sichuan (SBS). Sichuan Statistical Yearbook; China Statistics Press: Beijing, China, 2018. [Google Scholar]
  35. Statistical Bureau of Guizhou (SBG). Guizhou Statistical Yearbook; China Statistics Press: Beijing, China, 2018. [Google Scholar]
  36. Statistical Bureau of Yunnan (SBY). Yunnan Statistical Yearbook; China Statistics Press: Beijing, China, 2018. [Google Scholar]
  37. Shang, Y.; Lu, S.; Li, X.; Hei, P.; Lei, X.; Gong, J.; Liu, J.; Zhai, J.; Wang, H. Balancing development of major coal bases with available water resources in China through 2020. Appl. Energy. 2017, 194, 735–750. [Google Scholar] [CrossRef]
  38. Shao, L.Y.; Gao, C.X.; Zhang, C.; Wang, H.; Guo, L.J.; Gao, C.H. Sequence, paleogeography and coal accumulation of Late Permian in Southwestern China. Acta Sedimentol. Sin. 2013, 31, 856–866, (Chinese Journal with English Abstract). [Google Scholar]
  39. Shao, L.Y.; Liu, H.M.; Tian, B.L.; Zhang, P.F. Sedimentary evolution and its controls on coal accumulation for the Late Permian in the Upper Yangtze area. Acta Sedimentol. Sin. 1998, 16, 55–60, (Chinese Journal with English Abstract). [Google Scholar]
  40. Li, B.; Zhuang, X.; Li, J.; Querol, X.; Font, O.; Moreno, N. Geological controls on mineralogy and geochemistry of the Late Permian coals in the Liulong Mine of the Liuzhi Coalfield, Guizhou Province, Southwest China. Int. J. Coal Geol. 2016, 154, 1–15. [Google Scholar] [CrossRef]
  41. Dai, S.; Li, T.; Seredin, V.V.; Ward, C.R.; Hower, J.C.; Zhou, Y.; Zhang, M.; Song, X.; Song, W. Origin of minerals and elements in the Late Permian coals, tonsteins, and host rocks of the Xinde Mine, Xuanwei, eastern Yunnan, China. Int. J. Coal Geol. 2014, 121, 53–78. [Google Scholar] [CrossRef]
  42. Li, B.; Zhuang, X.; Li, J.; Querol, X.; Font, O.; Moreno, N. Enrichment and distribution of elements in the Late Permian coals from the Zhina Coalfield, Guizhou Province, Southwest China. Int. J. Coal Geol. 2017, 171, 111–129. [Google Scholar] [CrossRef] [Green Version]
  43. Dai, S.; Ren, D.; Chou, C.-L.; Finkelman, R.B.; Seredin, V.V.; Zhou, Y. Geochemistry of trace elements in Chinese coals: A review of abundances, genetic types, impacts on human health, and industrial utilization. Int. J. Coal Geol. 2012, 94, 3–21. [Google Scholar] [CrossRef]
  44. Dai, S.; Seredin, V.V.; Ward, C.R.; Hower, J.C.; Xing, Y.; Zhang, W.; Song, W.; Wang, P. Enrichment of U–Se–Mo–Re–V in coals preserved within marine carbonate successions: Geochemical and mineralogical data from the Late Permian Guiding Coalfield, Guizhou, China. Miner. Deposita. 2015, 50, 159–186. [Google Scholar] [CrossRef]
  45. Chen, J.; Liu, G.J.; Kang, Y.; Wu, B.; Sun, R.Y.; Zhou, C.C.; Wu, D. Coal utilization in China: Environmental impacts and human health. Environ. Geochem. Health 2014, 36, 735–753. [Google Scholar] [CrossRef]
  46. Dai, S.; Ren, D.; Ma, S. The cause of endemic fluorosis in western Guizhou Province, Southwest China. Fuel 2004, 83, 2095–2098. [Google Scholar] [CrossRef]
  47. Guo, J.; Yao, D.; Chen, P.; Chen, J.; Shi, F. Distribution, enrichment and modes of occurrence of arsenic in Chinese coals. Minerals 2017, 7, 114. [Google Scholar] [CrossRef] [Green Version]
  48. Zheng, L.; Liu, G.; Chou, C.L. The distribution, occurrence and environmental effect of mercury in Chinese coals. Sci. Total Environ. 2007, 384, 374–383. [Google Scholar] [CrossRef]
  49. Shi, J.; Huang, W.; Chen, P.; Tang, S.; Chen, X. Concentration and distribution of cadmium in coals of China. Minerals 2018, 8, 48. [Google Scholar] [CrossRef] [Green Version]
  50. Fang, T.; Liu, G.; Zhou, C.; Sun, R.; Chen, J.; Wu, D. Lead in Chinese coals: Distribution, modes of occurrence, and environmental effects. Environ. Geochem. Health 2014, 36, 563–581. [Google Scholar] [CrossRef]
  51. Chen, J.; Chen, P.; Yao, D.; Huang, W.; Tang, S.; Wang, K.; Liu, W.; Hu, Y.; Zhang, B.; Sha, J. Abundance, distribution, and modes of occurrence of uranium in Chinese coals. Minerals 2017, 7, 239. [Google Scholar] [CrossRef] [Green Version]
  52. Dai, S.; Ren, D.; Zhou, Y.; Chou, C.-L.; Wang, X.; Zhao, L.; Zhu, X. Mineralogy and geochemistry of a superhigh-organic-sulfur coal, Yanshan Coalfield, Yunnan, China: Evidence for a volcanic ash component and influence by submarine exhalation. Chem. Geol. 2008, 255, 182–194. [Google Scholar] [CrossRef]
  53. Dai, S.; Tian, L.; Chou, C.-L.; Zhou, Y.; Zhang, M.; Zhao, L.; Wang, J.; Yang, Z.; Cao, H.; Ren, D. Mineralogical and compositional characteristics of Late Permian coals from an area of high lung cancer rate in Xuan Wei, Yunnan, China: Occurrence and origin of quartz and chamosite. Int. J. Coal Geol. 2008, 76, 318–327. [Google Scholar] [CrossRef]
  54. Tian, L. Coal Combustion Emissions and Lung Cancer in Xuan Wei, China. Ph.D. Thesis, University of California, Berkeley, CA, USA, 2005. [Google Scholar]
  55. Sofia, D.; Gioiella, F.; Lotrecchiano, N.; Giuliano, A. Cost-benefit analysis to support decarbonization scenario for 2030: A case study in Italy. Energy Policy 2020, 137, 111137. [Google Scholar] [CrossRef]
  56. Wilson, M.A.; Hoehn, J.P. Valuing environmental goods and services using benefit transfer: The state-of-the art and science. Ecol. Econ. 2006, 60, 335–342. [Google Scholar] [CrossRef]
  57. Brouwer, R. Environmental value transfer: State of the art and future prospects. Ecol. Econ. 2000, 32, 137–152. [Google Scholar] [CrossRef]
  58. Bergstrom, J.C.; Taylor, L.O. Using meta-analysis for benefits transfer: Theory and practice. Ecol. Econ. 2006, 60, 351–360. [Google Scholar] [CrossRef] [Green Version]
  59. Johnston, R.J.; Rosenberger, R.S. Methods, trends and controversies in contemporary benefit transfer. J. Econ. Surv. 2010, 24, 479–510. [Google Scholar] [CrossRef]
  60. National Health Commission of China (NHCC); Center for Health Statistics and Information. An Analysis Report of National Health Services Survey in China; Peking Union Medical College Press: Beijing, China, 2015. [Google Scholar]
  61. National Health Commission of China (NHCC). China Public Health Yearbook; Peking Union Medical College Press: Beijing, China, 2018. [Google Scholar]
  62. Sichuan Health Information Center (SHIC). Sichuan Public Health Yearbook; Southwest Jiaotong University Press: Chengdu, China, 2014. [Google Scholar]
  63. Ministry of Emergency Management of China (MEMC). China’s Work Safety Yearbook; China Coal Industry Publishing House: Beijing, China, 2016. [Google Scholar]
  64. Department of Ecology and Environment of Sichuan Province (DEES). Sichuan Ecological Environment Bulletin. Available online: http://sthjt.sc.gov.cn/sthjt/c104157/2019/6/5/9e75e136aa914a0e8103401e07cbc6b0/files/52509a94d9344e41b85fc874ef212c13.pdf (accessed on 5 January 2020).
  65. Department of Ecology and Environment of Guizhou Province (DEEG). Guizhou Ecological Environment Bulletin. Available online: http://sthj.guizhou.gov.cn/sjzx_70548/hjzlsjzx/hjzkgb/201906/t20190605_16643135.html (accessed on 5 January 2020).
  66. Department of Ecology and Environment of Yunnan Province (DEEY). Yunnan Ecological Environment Bulletin. Available online: http://sthjt.yn.gov.cn/hjzl/hjzkgb/201906/t20190604_190327.html (accessed on 5 January 2020).
  67. Liu, H.; Zeng, Z.H. A statistical analysis of coalmine accidents in 2018, China. Inn. Mong. Coal Econ. 2019, 278, 92–93, (Chinese Journal with English Abstract). [Google Scholar]
  68. The Government of the People’s Republic of China. On the revision of the “The Work-related Injury Insurance Regulations”. Available online: http://www.gov.cn/flfg/2010-12/24/content_1772226.htm (accessed on 12 February 2020).
  69. Yang, J.H.; Wang, S.S. An analysis of the incidence of pneumoconiosis in Guizhou province in 2014. China J. Prev. Med. 2016, 50, 454–455, (Chinese Journal with English Abstract). [Google Scholar]
  70. He, F.; Yang, J.; Xing, Y.; Zhang, Y.C.; Kang, S.J. Distribution of pneumoconiosis in Yunnan during 1996–2007. Occup. Health. 2008, 24, 2517–2518, (Chinese Journal with English Abstract). [Google Scholar] [CrossRef]
  71. Yang, L.; Zhang, Z. Analysis of pneumoconiosis diagnosis information of Sichuan Center for Disease Control and Prevention from 2012 to 2018. J. Prev. Med. Inf. 2019, 35, 1213–1217, (Chinese Journal with English Abstract). [Google Scholar]
  72. Wang, D.; Zhang, M.; Zheng, Y.D. Study of estimation method for incidence of new cases of coal workers’ pneumoconiosis in China. Chin. J. Ind. Hyg. Occup. Dis. 2013, 31, 24–29, (Chinese Journal with English Abstract). [Google Scholar]
  73. Wu, X.J. The Pneumoconiosis: Prevention is much Important than Treatment. Available online: http://paper.people.com.cn/zgnyb/html/2018-12/24/content_1900850.htm (accessed on 18 February 2020).
  74. Institute for Health Metrics and Evaluation. Available online: http://www.healthdata.org/data-visualization/gbd-compare (accessed on 28 February 2020).
  75. Current situation analysis and industry development trend of China sewage treatment market in 2017. Available online: https://www.chyxx.com/industry/201708/548311.html (accessed on 6 January 2020).
  76. Song, X.F.; Pu, H.M.; Ma, Y. Water-Eating Coal—Coal Power Base Development and Water Resources Research; China Environmental Science Press: Beijing, China, 2012. [Google Scholar]
  77. Ministry of Water Resources of China (MWRC). China Water and Soil Conservation Bulletin. Available online: http://www.mwr.gov.cn/sj/tjgb/zgstbcgb/201908/t20190820_1353674.html (accessed on 15 February 2020).
  78. Mao, Y.S.; Sheng, H.; Yang, F.Q. The True Cost of Coal; China Coal Industry Publishing House: Beijing, China, 2008. [Google Scholar]
  79. Ye, M.L.; Wang, Y.Y.; Wang, R.H. Research on disease burden of pneumoconiosis patients in Chongqing City. Modern Prev. Med. 2011, 38, 840–842, (Chinese journal with English Abstract). [Google Scholar]
  80. Guo, H.C.; Zhang, A.G. Study on compensation standardizations of resettlement in coal mining subsidence area. China Coal 2016, 42, 26–29, (Chinese Journal with English Abstract). [Google Scholar]
  81. Meng, X.J. Study on Accounting Framework System and Standardization of Forest Ecosystem Value. Ph.D. Thesis, Chinese Academy of Forestry, Beijing, China, 2011. [Google Scholar]
  82. Liu, X.; Guo, Y.; Xu, H.; Zhang, J.P. Assessment of forest ecosystem service function value in Guizhou. Guizhou Agr. Sci. 2014, 42, 60–65, (Chinese Journal with English Abstract). [Google Scholar]
  83. Zhao, H.F. The Value of Forest Ecosystem Services Accounting and Analysis in Sichuan, China. Ph.D. Thesis, Beijing Forestry University, Beijing, China, 2014. [Google Scholar]
  84. Pan, H.; Liu, X.Y. Economic value assessment of the forest ecosystem services function in Yunnan Province. Ecol. Econ. 2018, 34, 201–206, (Chinese Journal with English Abstract). [Google Scholar]
  85. Xu, Y.Q.; Yu, L.; Zhou, B.T.; Shi, Y.; Xu, Y. Temporal-spatial dynamic pattern of grassland ecosystem service value under the background of climate change in the future in China. Ecol. Environ. Sci. 2017, 26, 1649–1658, (Chinese Journal with English Abstract). [Google Scholar]
  86. Liu, P.; Yang, X.J.; Chen, J.; Xu, D.Y.; Yuan, P. Surveillance results of coal-burning-borne endemic fluorosis in Sichuan Province from 2011–2015. J. Prev. Med. Inf. 2018, 34, 70–74, (Chinese Journal with English Abstract). [Google Scholar]
  87. Gao, J.; Li, D.S.; An, D.; Liang, Y.; Zhang, R.Z.; Ye, H.B.; Yao, D.C.; Zhang, B.Y.; Zhang, N.H. Analysis of control and treatment effect on coal-burning endemic fluorosis in Guizhou Province from 2010 to 2014. J. Guiyang Med. Coll. 2015, 40, 1178–1183, (Chinese Journal with English Abstract). [Google Scholar] [CrossRef]
  88. Ye, F.; Wang, A.W.; Yang, C.G.; Peng, H.B.; Ma, X.W.; Zhou, Z.Z.; Sun, J.F. Summary of the surveillance of endemic coal-burning fluorosis in Zhaoyang District, Yunnan, in 2002 and 2003. Chin. J. Endem. 2005, 24, 561–563, (Chinese Journal with English Abstract). [Google Scholar]
  89. Zang, X.F. Effect Research and Benefit Analysis on Water Improvement of Defluoridation to Control Endemic Fluorosis in Jiangsu Province. Master’s Thesis, Southeast University, Nanjing, China, 2007. [Google Scholar]
  90. Li, J.H.; Tang, R.; Yin, G.Q.; Li, Y.; He, X.Z.; Wei, F.S.; Qing, L. An investigation on incidence of lung cancer in Fuyuan County, Yunnan Province. China Cancer 2011, 13, 286–289. [Google Scholar]
  91. Huang, J.; Wang, Y.; Wang, Y.X. Engineering application discussion on the method of calculating the amount of coal-fired CO2 emissions. North China Electr. Power 2016, 434, 48–53, (Chinese Journal with English Abstract). [Google Scholar]
  92. National Research Council. The Hidden Costs of Energy: Unpriced Consequences of Energy Production; National Academies Press: Washington, DC, USA, 2009. [Google Scholar]
  93. Yu, D.D. Economic burden of drinking water related endemic arsenic poisoning. Master’s Thesis, Harbin Medical University, Harbin, China, 2012. [Google Scholar]
  94. Liu, X.; Liu, L.; Zou, X.N.; Ma, X.Y.; Ning, B.F.; Ning, Y.F.; Wan, X. Epidemiological Features of Lung Cancer Mortality between 1990 and 2016 in Xuanwei County, Yunnan Province. Acta Acad. Med. Sin. 2019, 41, 338–343. [Google Scholar] [CrossRef]
  95. He, M.; Wang, X.R.; Han, L. Air pollutant emission inventory and characteristics from stationary sources in Sichuan Province. Acta Sci. Circumst. 2013, 33, 3127–3137, (Chinese Journal with English Abstract). [Google Scholar]
  96. Fan, J.L.; Sun, J.; Zhao, R. Carbon emission and carbon flow chart for whole life cycle of China coal industry. Coal Econ. Res. 2017, 37, 34–37, (Chinese Journal with English Abstract). [Google Scholar]
  97. Tan, Z.L.; Shan, F. Research on spatiotemporal regularity of coal mine safety accidents in China during last decade. China Coal 2017, 43, 102–107, (Chinese Journal with English Abstract). [Google Scholar]
  98. Wu, M.M.; Zhong, Y. Statistics analysis of our country’s coal mine fatal accidents from 2012 to 2013. Coal Tech. 2014, 33, 296–299, (Chinese Journal with English Abstract). [Google Scholar] [CrossRef]
  99. Zhao, C.; Luo, K. Household consumption of coal and related sulfur, arsenic, fluorine and mercury emissions in China. Energy Policy 2018, 112, 221–232. [Google Scholar] [CrossRef]
  100. Yang, Y.; Xiao, Y.; Voncken, J.H.L.; Wilson, N. Thermal treatment and vitrification of boiler ash from a municipal solid waste incinerator. J. Hazard. Mater. 2008, 154, 871–879. [Google Scholar] [CrossRef]
  101. Metz, B. Carbon Dioxide Capture and Storage: Special Report of the Intergovernmental Panel on Climate Change; Cambridge University Press: Cambridge, UK, 2005. [Google Scholar]
  102. Liu, Q. Shanghai Waigaoqiao No.3 power generation Co., LTD. World Environ. 2013, 70–71. (In Chinese) [Google Scholar]
  103. Feng, W.Z. Energy-conserving technology of ultra-super critical 1000 MW generator in Waigaoqiao, Shanghai. Eng. Res. Util. 2011, 152, 42–47. (In Chinese) [Google Scholar]
  104. Chang, S.; Zhuo, J.; Meng, S.; Qin, S.; Yao, Q. Clean coal technologies in China: Current status and future perspectives. Engineering 2016, 2, 447–459, (Chinese Journal with English Abstract). [Google Scholar] [CrossRef]
Figure 1. The major coal bases in China (Modified from Dai et al. [44]). 1—Shendong; 2—Northern Shaanxi; 3—Eastern Ningxia; 4—Huanglong; 5—Northern Shanxi; 6—Central Shanxi; 7—Eastern Shanxi; 8—Central Hebei; 9—Southwestern Shandong; 10—Henan; 11—Lianghuai; 12—Northeast China; 13—Yungui.
Energies 13 04002 g001
Figure 2. The external costs of coal production in SW China.
Energies 13 04002 g002
Figure 3. (A) The external cost structure for the full life cycle of coal in SW China; (B) the externality structure of coal mining; (C) the externality structure of coal transportation; (D) the externality structure of coal combustion.
Energies 13 04002 g003
Figure 4. Proportion of the externalities structure of the life cycle of coal in SW China in 2018.
Energies 13 04002 g004
Table 1. Coal production and consumption in southwestern China from 2010 to 2017.
YearSichuan /104 TonGuizhou /104 TonYunnan /104 Ton
ProductionConsumptionProductionConsumptionProductionConsumption
20109247.9311520.4015954.0215601.025875.864920.86
20119377.4711454.3411177.4712084.976239.155339.53
20129470.7011872.2018107.0514048.966275.755546.57
20137574.9011658.6018517.7813650.746829.465099.27
20147662.8011045.3918508.2913117.602611.394502.65
20156406.469288.9017204.9912833.493319.574245.48
20166164.798869.4916850.6413642.752822.044287.91
20174798.517855.8816343.8013409.764674.984088.13
Source: Statistical Bureau of Sichuan (2018), Statistical Bureau of Guizhou (2018), and Statistical Bureau of Yunnan (2018) [34,35,36]. Reproduced from China Statistics Press: 2018.
Table 2. The accounting indices of the external costs of the life cycle of coal.
Life CycleAccounting ItemsDamage LossAccounting Index
Underground miningHuman casualtiesaccidentscosts of death compensation and medical treatment
Air pollutionpneumoconiosis or black lungcosts of treatment of black lung, and salary losses of the patients and family members
MTR miningAir pollutionpneumoconiosis or black lungcosts of treatment of black lung, and salary losses of the patients and family members
Water pollutionenvironmental pollutioncosts of wastewater treatment
Solid waste pollutiongangues storagecosts of solid waste storage and land function loss
Aquatic ecosystemswater resources destruction and soil erosioncosts of water sources loss and soil erosion controlling
Industrial and residential landland subsidence and residents’ relocationcosts of residents’ relocation and land restoration
Forestforest destructioncosts of forest tree loss, wood consumption, and ecological service value
Grasslandgrassland destructioncosts of grassland ecological service value
TransportationAir pollutiondust pollutioncosts of coal dust pollution
Human casualtiesaccidentscosts of death compensation and medical treatment
CombustionAir pollutionendemic diseases and lung cancercosts of treatment of endemic diseases
Air pollutionhuman welfare losscosts of human welfare loss
Air pollutionfarmland destruction and crops failurecosts of ecological restoration of farmland and crops losses
Climate changegreenhouse gas emissionscosts of loss of greenhouse gas emissions
Table 3. Data and external costs of coal production in SW China in 2018.
ItemImpactData SourceExternal Costs (2018 USD)
Coal miningAccident deathsIn 2018, there were 42, 17, and 13 coal miners killed in Sichuan, Guizhou, and Yunnan, respectively [67].42 persons × 20 × USD 4745/person + 17 persons × 20 × USD 4513/person + 13 persons × 20 × USD 4784/person = USD 6.8 × 10⁶
The per unit death compensation is 20 times the per capita disposable income of urban residents [68].
In 2018, the per capita disposable income of urban residents in Sichuan, Guizhou, and Yunnan was USD 4745, USD 4513, and USD 4784, respectively [34,35,36].
PneumoconiosisCoal miner pneumoconiosis (CMP)—37.7 persons with a median value for coal production in one million tons [72].In 2018, CMP patients in Sichuan: 37.7 × 48 = 1810 persons, Death 1810 × 22% = 398 persons; in Guizhou: 37.7 × 163.4 = 6160 persons, Death 6160 × 22% = 1355 persons; in Yunnan: 37.7 × 47 = 1772 persons, Death 1772 × 22% = 390 persons.
Sichuan: 1412 persons × USD 3444/person + 1412 persons × 0.47 year × (USD 8063.7/year + USD 8381.6/year) + 1412 persons × 1.7 year × USD 8063.7/year + 398 persons × 13.32 year × USD 8063.7/year = USD 77.9 × 10⁶;
Guizhou: 4805 persons × USD 3444/person + 4805 persons × 0.47 year × (USD 8279.4/year + USD 8989.1/year) + 4805 persons × 1.7 year ×
USD 8279.4/year + 1355 persons × 13.32 year × USD 8279.4/year = USD 272.6 × 10⁶;
Yunnan: 1382 persons × USD 3444/person + 1382 persons × 0.47 year × (USD 7271.4/year + USD 10,500/year) + 1382 persons × 1.7 year ×
USD 7271.4/year + 390 persons × 13.32 year × USD 7271.4/year = USD 71.2 × 10⁶
In 2018, the annual coal production was about 48, 163.4, and 47 million tons in Sichuan [34], Guizhou [35], and Yunnan [36], respectively.
The mortality rate is about 22% for CMP [73].
About 171 days (0.47 years) is the average time of a hospital stay for each CMP patient [79].
The average time a CMP patient lost the capacity to work was 1.7 years [23].
The total working years lost for all fatalities from CMP is averaging about 13.32 years per person [79].
The per capita cost of treatment for CMP is USD 3444 [62].
The average wages per patient and attendant per year are USD 8063.7 and USD 8381.6 in Sichuan, USD 8279.4 and USD 8989.1 in Guizhou, and USD 7271.4 and USD 10,500 in Yunnan [34,35,36].
WastewaterThe total wastewater discharged in 2018 was about 507.9, 174, and 206.1 million tons in Sichuan, Guizhou, and Yunnan, respectively [34,35,36].(507.9 + 174 + 206.1) × 8.7% × 106×¥4/m3/7 = USD 44.1 × 10⁶
Coal production and processing discharged about 8.7% of the total industrial wastewater [75].
The cost of wastewater treatment per m3 is about 4 yuan [78].
GangueThe ratio of gangue to coal during coal extraction is about 13% using current technology.(48 + 163.4 + 47) × 106 t × 13% × USD 3.57/t = USD 120 × 106
The shadow price of gangue was USD 3.57/t [20].
Contaminate underground waterAbout 2.54 m3 of underground water will become contaminated for every one ton of coal production [76].
Diversion cost of the unit price of water is USD 1.11/m3 [20].
(48 + 163.4 + 47) × 106 t × 2.54m3 × USD 1.11/m3 = USD 728.5 × 10⁶
Water and soil erosionThe area of soil erosion caused by one ton of coal production is 2.45 m2, and the cost per unit of water and soil conservation is USD 1557.1/ha [26].(48 + 163.4 + 47) × 106 t × 2.45m2/104 × USD 1557.1/ha = USD 98.6 × 10⁶
Land subsidenceA subsidence area of 36 ha was formed for every 1 million tons of coal production; per unit cost of land restoration is about USD 8571.4/ha [25].(48 + 163.4 + 47) × 36 ha × USD 8571.4/ha = USD 79.7 × 10⁶
Residents’ relocationAbout 100 people will need to relocate for every 1 million tons coal produced [78].(48 + 163.4 + 47) × 100 persons × USD 4857.1/person = USD 125.5 × 10⁶
Residents who must relocate are given USD 4857.1 per person [80].
Forest destructionExtraction of 1 million tons of coal will cause a mined-out area that covers about 20 ha [78]; the mined-out area influence coefficient is 2.6 [21]; the forest coverage rate is about 53% [64,65,66].(48 + 163.4 + 47) × 20 ha × 2.6 × 53% = 7133.8 ha
The prices for timber and economic forests are USD 17,571.4/ha and USD 27,428.6/ha with an arithmetic mean value of USD 22,571.4/ha [81,82,83,84].7133.8 ha × USD 22,571.4/ha + 0.02m3/t × (48 + 163.4 + 47) × 106 t × USD 97.1/m3 + 7133.8 ha × 150 t/ha × USD 142.9/t = USD 815.7 × 10⁶
Wood consumption is about 0.02 m3 for every ton of coal production [21].
The oxygen released per unit area of forest is 150 t/ha [21].
The per unit price of one forest tree is USD 97.1/m3 [81] and of oxygen produced is valued at USD 142.9/t [84].
Grassland destructionThe grassland coverage rate in Sichuan, Guizhou, and Yunnan is 22.63%, 0.41%, and 0.38% [64,65,66].(48 × 22.63% + 163.4 × 0.41% + 47 × 0.38%) × 20 ha × 2.6 × USD 828.6/ha = USD 0.5 × 10⁶
Per unit value of grassland ecosystem services is about USD 828.6/ha [85].
Coal transportationAccident deathsAbout 56 and 315 people were killed by railroad and highway accidents in 2018 in SW China.(56 + 315) persons × 20 × USD 4681/person = USD 34.7 × 10⁶
Dust pollutionCoal in SW China is largely transported by railway (75%) and highway (25%) [25].Railway: 75% × (34.3 × 10⁶t + 26.1 × 106t×41.1 × 106t) = 76.13 × 10⁶t
Highway: 25% × (34.3 × 10⁶t + 26.1 × 106t×41.1 × 106t) = 25.37 × 10⁶t
Dust pollution cost: (76.13 × 106t × 0.8% + 25.37 × 106t × 1% + 3.53kg/t × (76.13 + 25.37) × 106t/1000) × USD 214.3/t = USD 261.7 × 10⁶
In 2018, there were 34.3, 26.1, and 41.1 million tons of coal transported in Sichuan [34], Guizhou [35], and Yunnan [36], respectively.
Loading and unloading one ton of coal will produce about 3.53 kg of dust [25].
The pollution coefficient of coal dust is 0.8% and 1% for railway and highway transportation, respectively, and per unit of external cost of dust is USD 214.3/t [26].
Coal CombustionSkeletal fluorosisNearly 1.8 million (0.17, 1.08, and 0.57 million in Sichuan, Guizhou, and Yunnan, respectively) skeletal fluorosis patients had been identified by the end of 2013 [61].Sichuan: 170,000 persons × USD 214.3/person + 170,000 persons × 0.27 year × USD 8063.7/year + 170,000 persons×48.5% × 10 years × USD 8063.7/year = USD 6.7 × 10⁹;
Guizhou: 1,080,000 persons × USD 214.3/person + 1,080,000 persons × 0.27 year × USD 8279.4/year + 1,080,000 persons × 39.5% × 10 years × USD 8279.4/year = USD 35.8 × 10⁹;
Yunnan: 570,000 persons × USD 214.3/person + 570,000 persons × 0.27 year × USD 7271.4/year + 570,000 persons × 35.6 % × 10 years × USD 7271.4/year = USD 15.0 × 10⁹
The median of skeletal fluorosis with moderate and severe illness is about 48.5% in Sichuan [86], 39.5% in Guizhou [87], and 35.6% in Yunnan [88].
The patients had an average hospital stay of 10 days with an additional 10 years of lost work [89].
Endemic arsenismEndemic arsenism was only reported in Guizhou in SW China with 2848 patients identified [61].1424 persons × USD 164.3/person + 1424 persons × 0.033
year × (USD 8279.4/year + USD 8989.1/year) = USD 1.0 × 10⁶
The heart and skin diseases caused by endemic arsenism will cost about USD 164.3/person [61,90] with an average hospital stay of 12 days/person [61].
Lung cancerThe incidences of lung cancer in Xuanwei and Fuyuan for men and women were 482.78/100,000 and 387.98/100,000 [90].Patients in Yunnan: (81.9 + 43.77) × 482.78 + (73.27 + 39.61) × 387.98= 104,466 persons;
Patients in Guizhou: 2848 × 50% = 1424 persons
About 50% of all endemic arsenism patients are vulnerable to lung cancer in Guizhou.Guizhou: 1424 persons × USD 3470.6/person + 1424 persons × 0.04 year × (USD 8279.4/year + USD 8989.1/year) + 1424 persons × 1
year × USD 8279.4/year = USD 17.7 × 10⁶;
Yunnan: 10,4375 persons × USD 3470.6/person + 10,4375 persons × 0.04
year × (USD 7271.4/year + USD 10,500/year) + 10,4375 persons × 1
year × USD 7271.4/year + 91 persons × 0.39 year × USD 7271.4/
year = USD 1.2 × 10⁹
The per capita cost of treatment for lung cancer is about USD 3470.6, and per capita length of a hospital stay is about 14.74 days [62].
Patients lost their work for about 1 year with working years lost per patient at 0.39 years [23].
PollutantsThe emissions of SO2, NOX, and PM10 as air pollutants have a cost of about 1618 USD/t, 1833 USD/t, and 1126 USD/t, respectively [25].1618 USD/t × (487,200 + 687,500 + 384,400)t + 1833 USD/t × (451,000 + 359,669 + 268,834)t + 1126 USD/t × (272,000 + 196,800 + 224,154)t = USD 5.3×10⁹
In 2018, the total volume of these emissions was 487,200 t, 451,000 t, and 272,000 t in Sichuan [64], 687,500 t, 359,669 t, and 196,800 t in Guizhou [65], as well as 384,400 t, 268,834 t, and 224,154 t in Yunnan [66], respectively.
Global warmingAbout 7–8 m3 CH4 is emitted for every one ton of coal production [25], In SW China in 2018, there were 1.94 billion m3 CH4 emitted, which is equivalent to 29.1 million t CO2e.USD 30/ton × (29.1 × 10⁶ t + 194.9 × 10⁶ t) = USD 6.7 × 10⁹
About 2.494 t of CO2 was emitted for every one ton of standard coal combustion in China’s coal-fired power plants [91], total emissions of CO2 were 194.9 million tons.
The value of damages was estimated at about USD 30/ton of CO2 equivalent (CO2e) [92].
The exchange rate of RMB to US dollar is about 1:7 in 2018.
Table 4. The external costs of the coal life cycle in SW China in 2018.
Life CycleAccounting ItemsAccounting Results (2018 USD)Costs of Different Stages (2018 USD)
Underground miningAccidents6,764,0602,441,085,639
Pneumoconiosis or black lung421,649,703
MTR mining
Wastewater44,146,286
Gangue119,923,440
Underground water destruction728,532,960
Soil erosion98,576,887
Land subsidence and residents Relocation205,242,055
Forest destroy815,745,656
Grassland destroy504,592
TransportationAccidents34,733,020296,400,820
Dust pollution261,667,800
CombustionSkeletal fluorosis57,503,938,46370,725,958,295
Endemic arsenism and lung cancer1,214,400,829
Pollutants5,281,619,003
Global warming6,726,000,000
Total 73,463,444,75473,463,444,754

