Article

Life Cycle Assessment of Tall Onshore Hybrid Steel Wind Turbine Towers

by
Michaela Gkantou
1,*,
Carlos Rebelo
2 and
Charalampos Baniotopoulos
3
1
Department of Civil Engineering, Liverpool John Moores University, Liverpool L3 3AF, UK
2
ISISE, Department of Civil Engineering, University of Coimbra, 3030-788 Coimbra, Portugal
3
Department of Civil Engineering, University of Birmingham, Birmingham B15 2TT, UK
*
Author to whom correspondence should be addressed.
Energies 2020, 13(15), 3950; https://doi.org/10.3390/en13153950
Submission received: 6 July 2020 / Revised: 20 July 2020 / Accepted: 24 July 2020 / Published: 1 August 2020
(This article belongs to the Special Issue Advances in Wind Energy Structures)

Abstract

:
Increasing needs for taller wind turbines with bigger capacities, intended for places with high wind velocities or at higher altitudes, have led to new technologies in the wind energy industry. A recently introduced structural system for onshore wind turbine towers is the hybrid steel tower. Comprehension of the environmental response of this hybrid steel structural system is warranted. Even though life cycle assessments (LCAs) for conventional wind turbine tubular towers exist, the environmental performance of this new hybrid structure has not been reported. The present paper examines the LCA of 185 m tall hybrid towers. Considerations made for the LCA procedure are meticulously described, including particular attention at the erection and transportation stage. The highest environmental impacts arise during the manufacturing stage followed by the erection stage. The tower is the component with the largest carbon emissions and energy requirements. The obtained LCA footprints of hybrid towers are also compared to the literature data on conventional towers, resulting in similar environmental impacts.

Graphical Abstract

1. Introduction

With increasing CO2 emissions, there is an urgent demand for environmental awareness and sustainable design and construction. A significant reduction of the carbon emissions can be achieved with the use of renewable energy sources, such as solar radiation, movement of water, geothermal and wind energy [1]. Since the early 1980s, many wind parks have been constructed, making a remarkable contribution to a growth in the renewable energy generation across the world. In 2016, it was reported that 341,320 wind turbines were installed across the world and globally more than 637,000,000 tonnes of carbon emissions were averted [2]. In Europe, there were annual installations of +10 GW of wind energy capacity since 2009, while in just the first half of 2019, 4.9 GW of new wind energy capacity was introduced in European Union (EU) [3]. Further to onshore and offshore wind parks, small scale horizontal [4,5] and vertical wind axis turbines [6] are now also being installed in private properties. It is believed that combining repowering of wind farms with developing new ones will enable reaching EU targets. As stated in Wind Europe’s Central Scenario, by 2030, 323 GW of cumulative wind energy capacity would be installed in Europe that would correspond to 30% of the EU’s energy demands [3].
In order to come up with the present energy demands, there is ongoing research on optimising the wind energy structural systems, the aeroelastic and mechanical performance, and thus the energy production. Research on wind energy systems is multidisciplinary and necessitates the collaboration and interaction of structural, electrical and mechanical engineering in order to fully understand the mechanics with the aim to maximise the energy generation and, at the same time, prevent any type of failures. Examples from recently researched topics include the structural robustness and the connections of towers [7,8], the seismic assessment of onshore and offshore systems [9,10,11], the minimisation of electrical failures of turbines via condition monitoring and maintenance [12,13], and the optimisation of the environmental and economic performance [14,15,16], to name a few.
At the same time, needs for taller wind turbines with bigger capacities, intended for places with high wind velocities or at higher altitudes, have led to new technologies in the wind energy industry. A recently reported new structural system for onshore wind turbine towers is the hybrid tower, which was investigated within the scope of a European research programme, named SHOWTIME (“Steel Hybrid Onshore Wind Towers Installed with Minimal Effort”). This tower combines efficiently steel lattice and tubular parts, thus allowing for taller hub heights and hence better exploitation of the wind energy at higher altitudes. The project examined structural configurations, successfully adhering to safety and durability design checks, while allowing for economically and environmentally sustainable solutions. Jovašević et al. [17,18] performed a structural optimisation, examining a range of bracing systems, a number of connections and various dimensions of columns, thereby resulting in a series of optimised hybrid configurations. For the optimised geometries, an aeroelastic analysis was carried out [19] and the structural performance of the wind turbine towers under normal and extreme operating conditions, ensuring adequate structural robustness, was investigated. Focusing on the critical transition piece, which aims to transfer the dynamic and wind loads from the tubular to the lattice part and subsequently to the foundation, a rigorous numerical study considering fatigue loading conditions was carried out [20]. Given that these types of towers allow for hub heights over 180 m, an innovative erection procedure, minimising time and effort was also suggested [21]. As these tall hybrid towers are a new structural system, with different erection process from the widely used tubular towers, comprehension of their environmental performance is missing and deemed essential. To examine the environmental performance of a system, life cycle assessment (LCA) is commonly adopted.

Life Cycle Assessment of Wind Turbine Towers

Life cycle assessment is a meticulous holistic technique for the evaluation and analysis of potential environmental impacts of a system throughout its life, starting from raw material production to the end-of-life. LCA comprises a conceptual framework that is also used by companies aiming for sustainable supply chain management and product development. It is a prolonged scientific procedure that necessitates deep understanding of the influencing parameters and the realisation of comprehensive computations. To facilitate its execution, a number of databases, software and tools are currently available. One such software will be used herein, as will be discussed in Section 2. According to ISO 14040-44 [22,23], life cycle assessment consists of the following four stages:
(a)
Definition of the analysis’ goal and scope, where the methodology, assumptions and limitations are established.
(b)
Inventory analysis, where the system’s inputs and outputs are assembled.
(c)
Impact assessment, where various indicators such as global warming, energy requirements etc. are determined.
(d)
Interpretation, where the system’s environmental impact is estimated and discussed.
LCA can be carried out in order to assess the eco-friendly performance of renewable energy systems [24] and thus has been applied to study the life cycle performance of wind turbine towers around the world. Collated research of LCA studies on onshore wind turbine towers are shown in Table 1, where the structural material of the tower (i.e., steel, concrete, composite), the hub height in m, the wind turbine size in MW, the assumed installation location, the adopted software and the main drawn conclusions are presented. Herein, focus is primarily placed on onshore wind turbines, while research on offshore wind turbine towers [25] or small-scale wind turbines [26] are out of the scope of this study and are not included in the table.
For most of the examined research studies, a lifetime of 20 years has been considered. The results of the LCA of the wind turbine towers are usually assessed by determining (a) the global warming potential (GWP), in which the emissions of greenhouse gases are evaluated; (b) the abiotic depletion (AD), which is one of the most prevalent impact categories of LCA and includes the depletion of non-renewable resources; and (c) the energy payback time (EPT), which shows the duration the wind energy system has to operate in order to produce the amount of energy that was necessitated throughout its entire life. The results are commonly provided in percentage charts and grouped either per life stage or per structural component, therefore allowing to draw conclusions on the most critical part or process.
Garrett and Rønde [27] studied the LCA of an onshore wind plant leading to the conclusion that the energy it produces for the society is 22 to 30 times more than the energy it consumes. The calculated energy payback indexes found for onshore wind turbine towers were generally lower than 1 year, while in some cases only 1.3 months [28]. The biggest environmental impacts have been related to the manufacturing stage [29,30,31], whilst the lowest contribution belongs to the operation phase [32]. Martínez et al. [33] discussed the contributions of the copper and fiberglass of the Rotor-Nacelle-Assembly (RNA), whereas Razdan and Garrett [34] suggested the use of iron, steel, aluminium and concrete as primary contributors to environmental impacts. The component which affects most importantly the environment was reported to be the foundation [35], whereas other studies estimated the steel tower and the nacelle as the components with highest LCA footprints [36]. The effect of the size of the wind turbine was investigated by Crawford [37] who reported no significant variation in the energy yield between small and large wind turbines, while on the other hand Smoucha et al. [38] stated that the installation of higher-rated over lower-rated turbines allows for greater environmental benefits. In order to enhance the environmental performance, Xu et al. [39] suggested optimisation of the structural design and raw materials application, whilst Schreiber et al. [40] recommended replacement of material components in order to control the environmental impacts. Tremeac and Meunier [41] emphasised maximising recycling during decommissioning and Bonou et al. [42] proposed comprehensive examination of end-of-life treatment technologies and recycling technologies for composite materials. Demir and Taskin [43] stated that wind turbines with high hub heights (i.e., installed in optimum wind speed regions) can lead to lower environmental impacts. In addition, even though steel towers have been reported to comprise large contributions of the total carbon emissions [44], the fact that steel can be reused and recycled [45] suggests that it can be the preferred solution for towers with increased hub heights and larger rotor blades [46].
As can be observed in Table 1, past studies have mainly dealt with the environmental effects of towers with hub height up to 100 m, while there are few reported studies on hub heights up to 150 m, leaving environmental impacts of taller structures still unexplored. On this direction, the present study will examine even taller (185 m) steel towers. Moreover, focus has been previously placed upon common forms of tubular towers, while any research results on hybrid towers has not been reported. Aiming to address this knowledge gap, this paper presents a comprehensive LCA targeting in a better understanding of the environmental performance of the recently introduced tall onshore hybrid steel wind turbine towers. The methodology implemented for this study is presented in Section 2. The results are discussed in Section 3 and the main conclusions are summarised in Section 4.

2. Materials and Methods

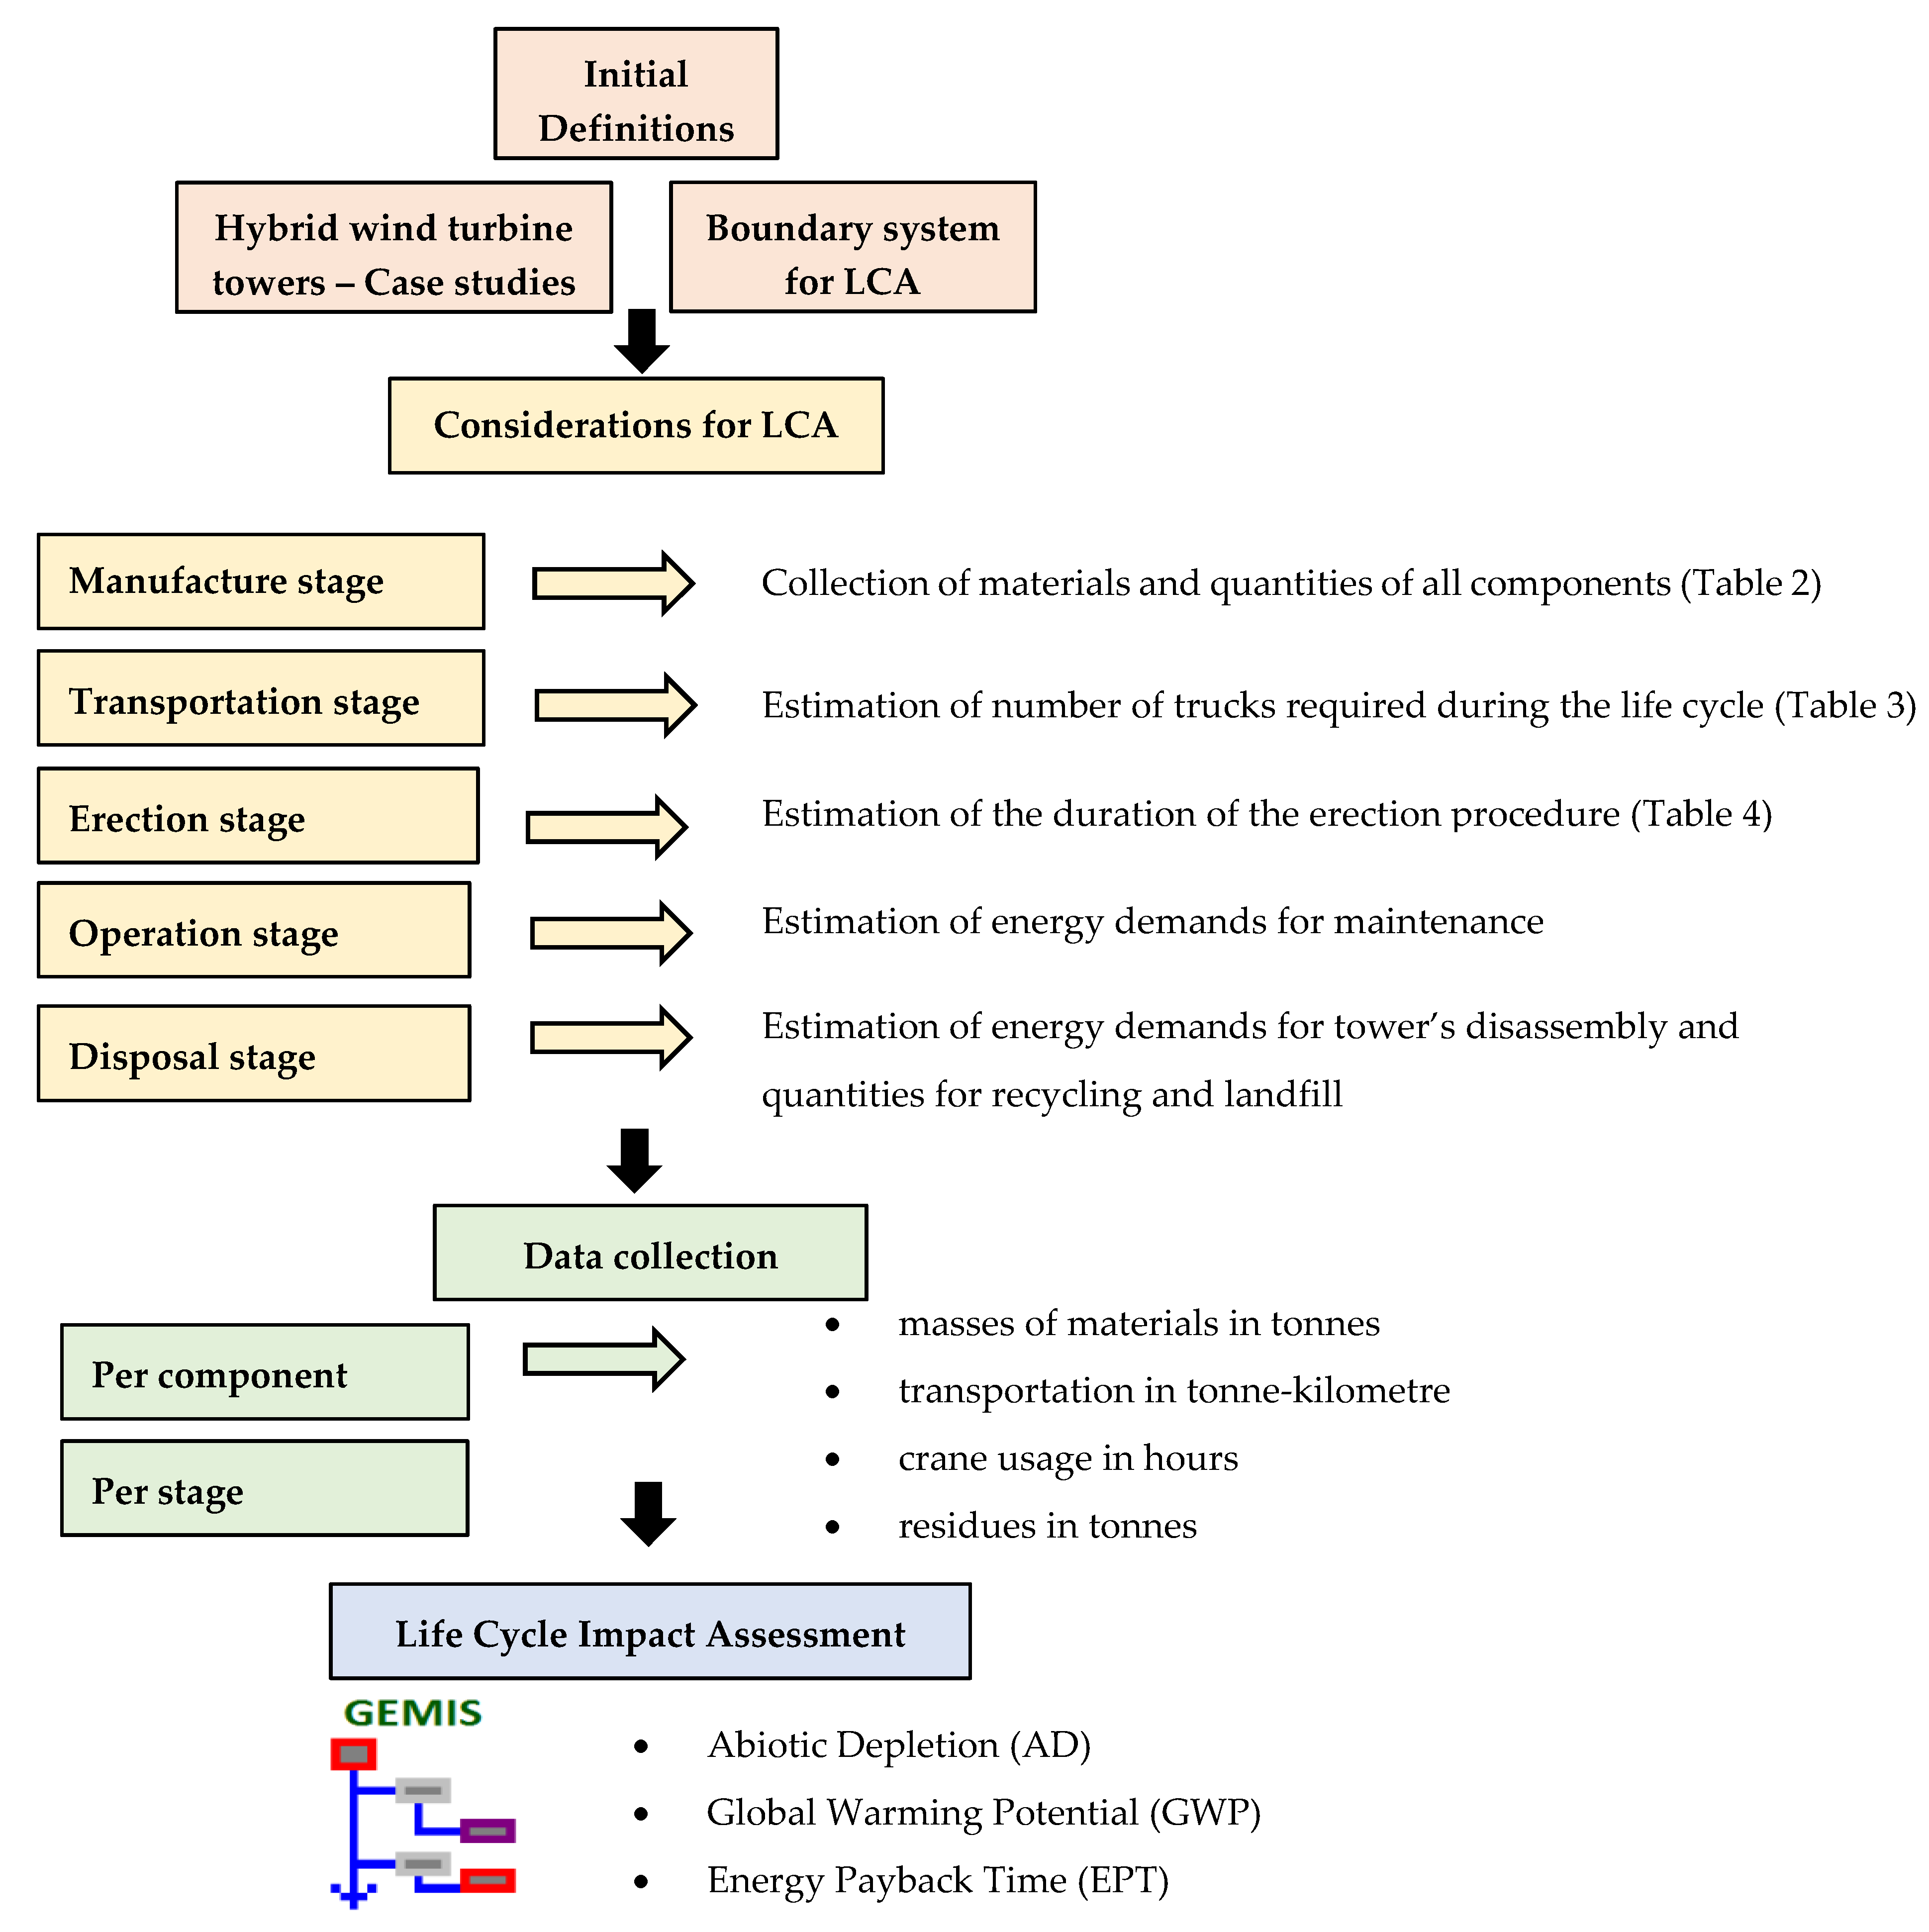
2.1. Flowchart of Methodology
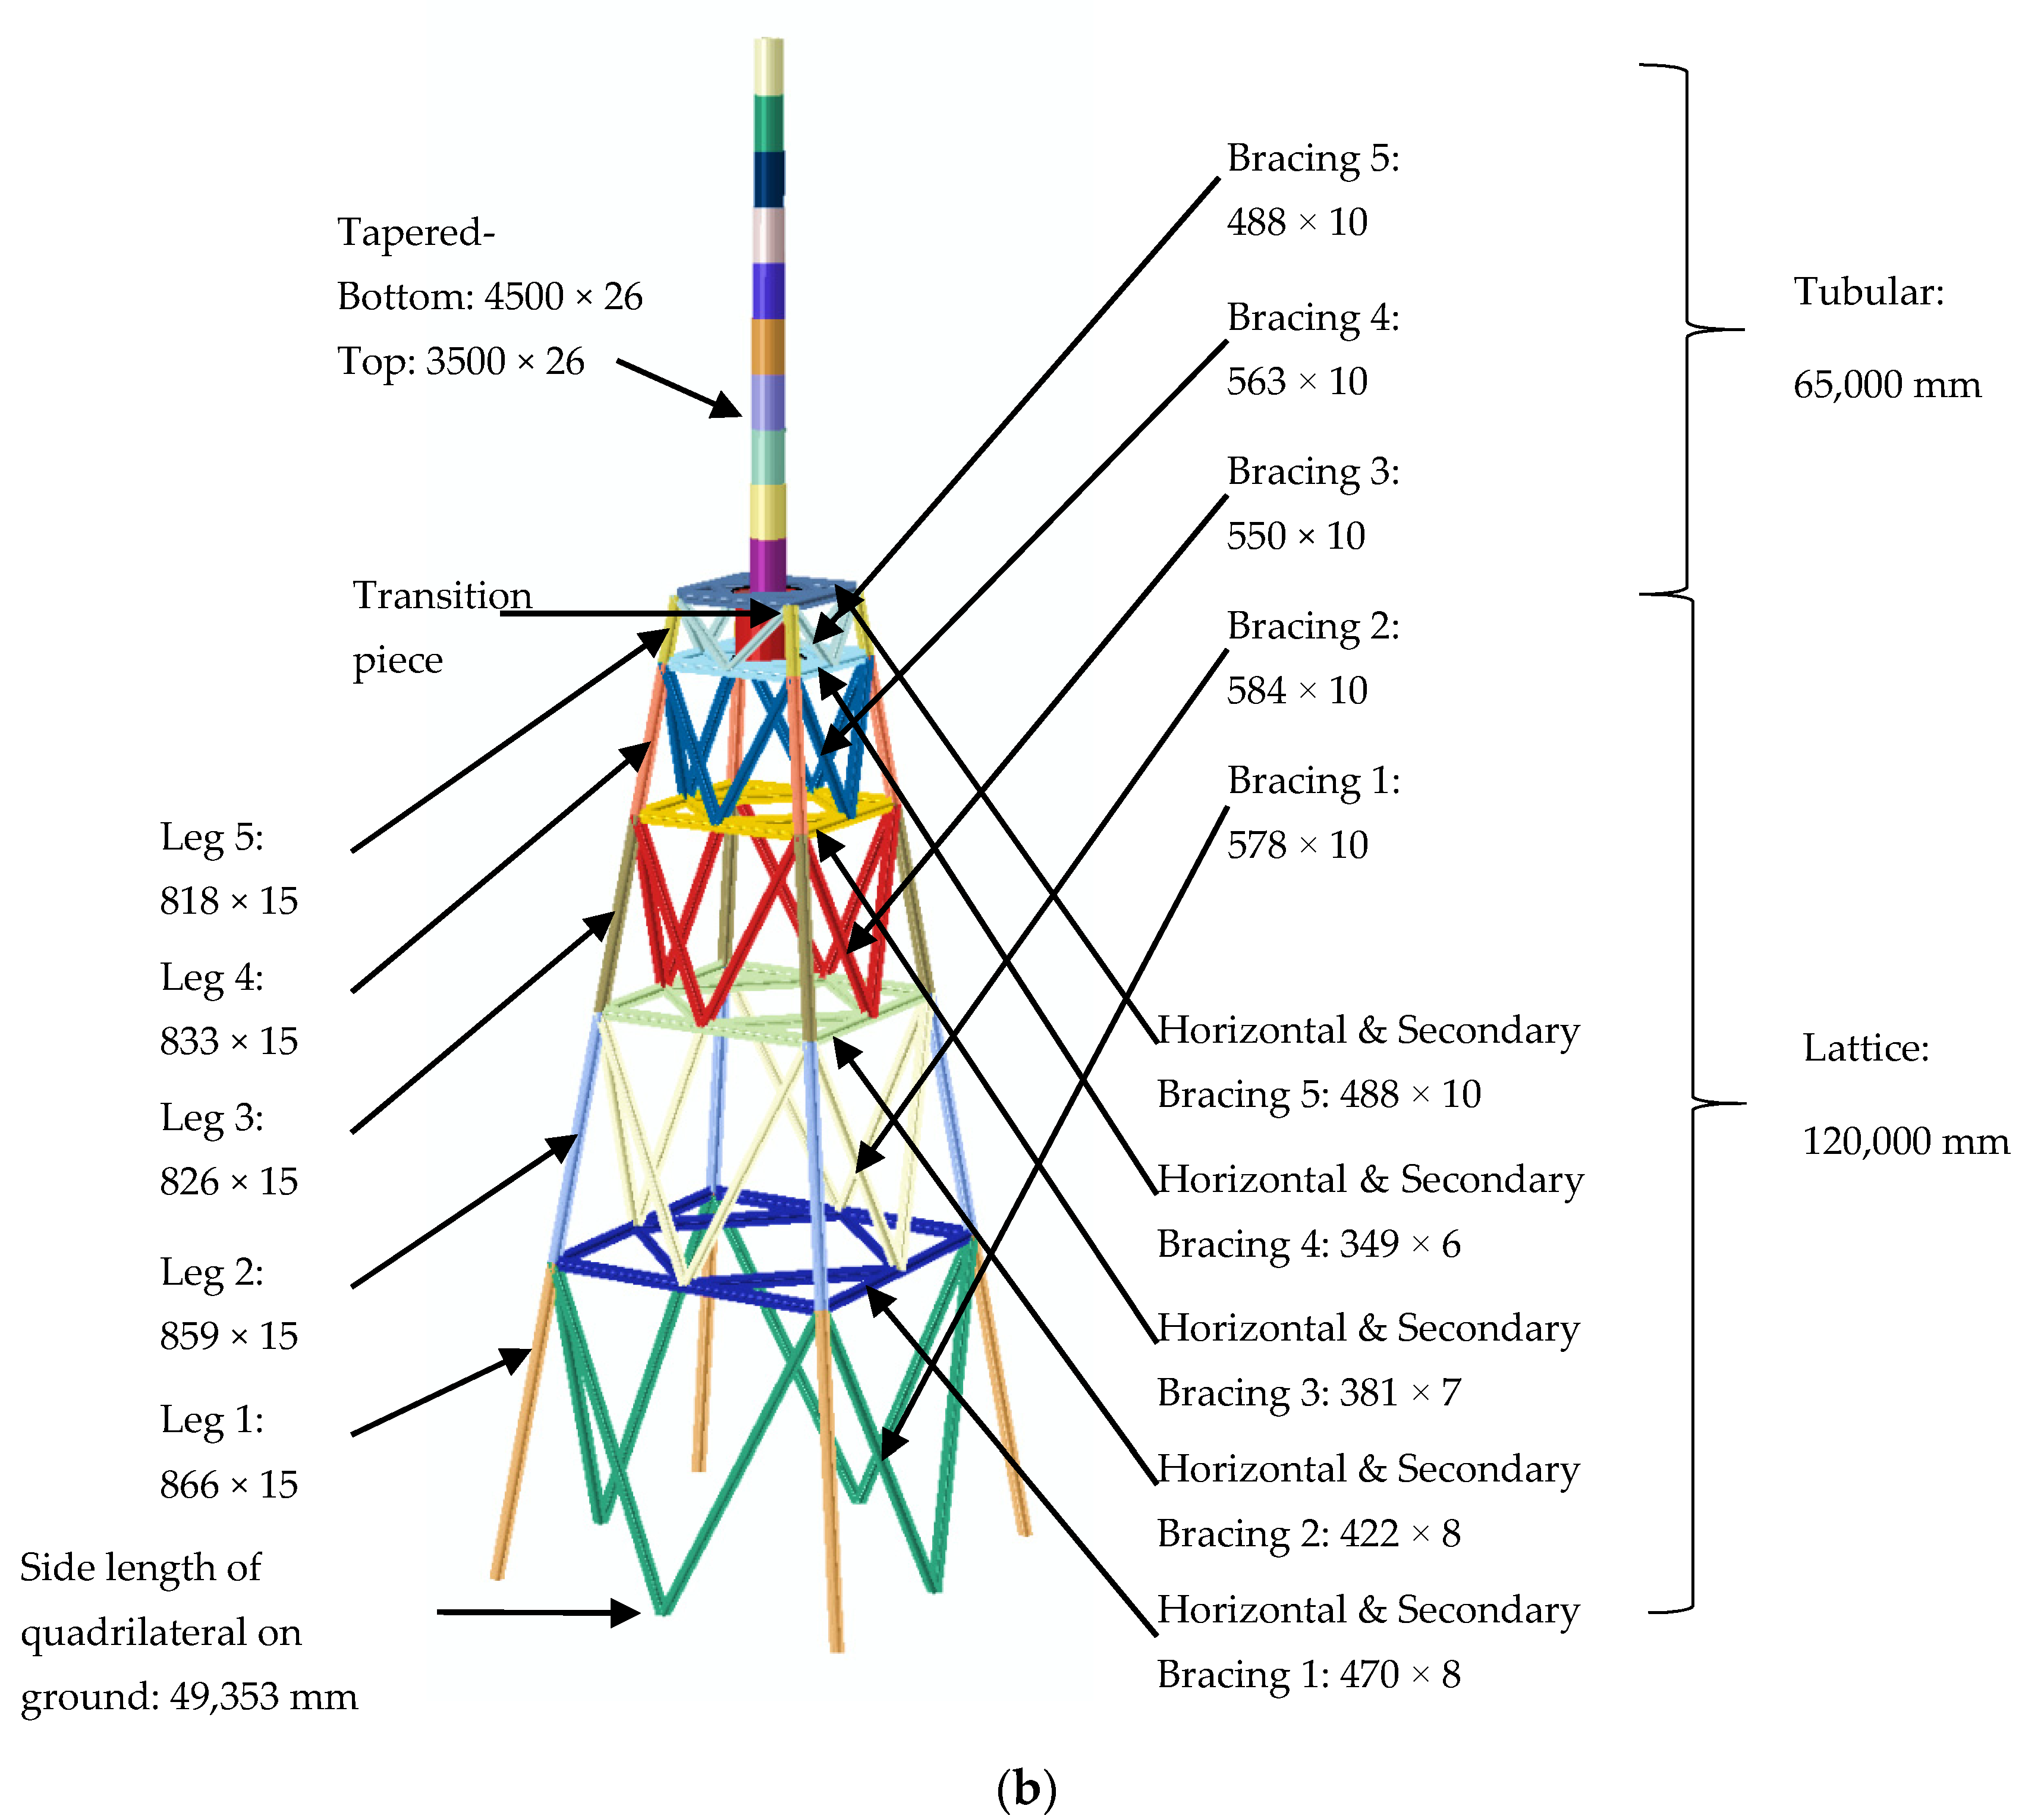
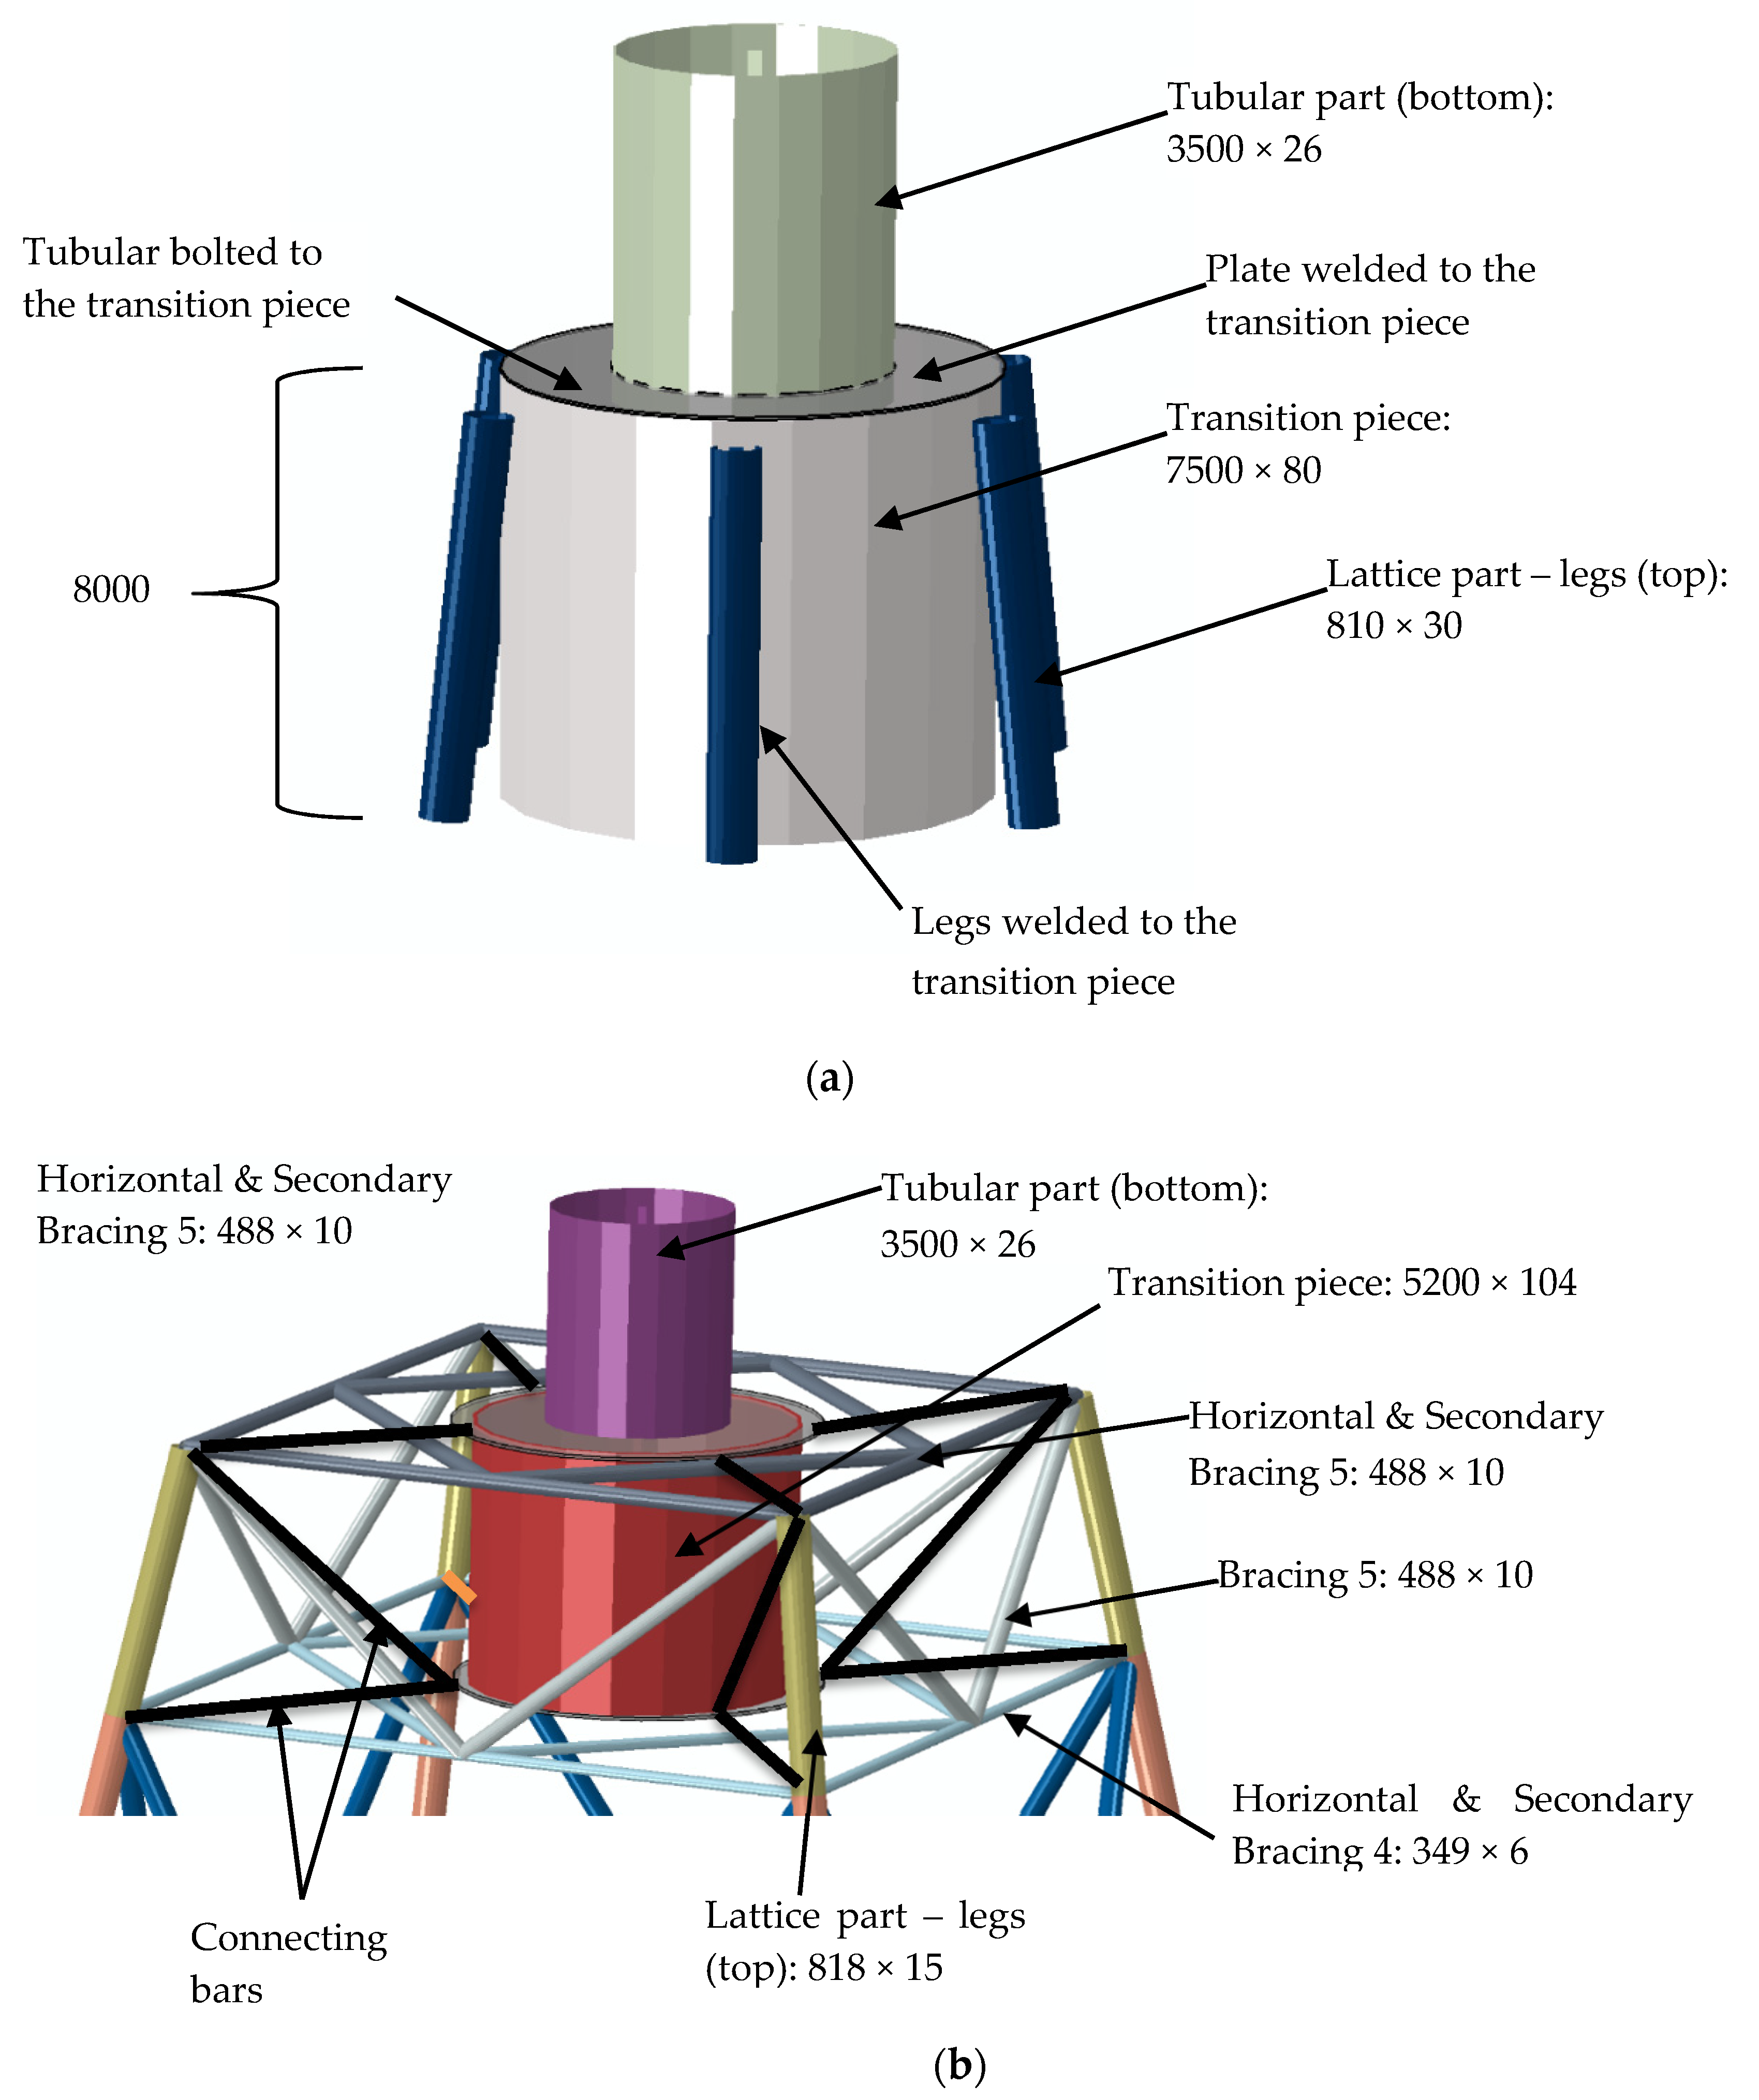
The methodology adopted for this research is shown in Figure 1 and discussed in the following sections. In particular, initial definitions including the establishment of the case studies are discussed in Section 2.2. The system boundary for the LCA is provided in Section 2.3. Considerations relevant to each of the life cycle stage are discussed in Section 2.4, while the collected data are presented in tabulated form in Section 2.5.

2.2. Case Studies

The case studies considered for this study form part of SHOWTIME research programme [17,18,19,20,21]. As part of this programme, different hybrid towers were studied. In order to ensure structural and economical efficiency, but also feasibility of the manufacturing and erection process, two optimised hybrid towers have been suggested [17,18,19,20,21]. The latter are shown in Figure 2 and will be the focus of research in this study.
Both considered hybrid towers consist of a 120 m bottom part which comprises a lattice structure and a 65 m top part which comprises a tubular structure. The lattice part is made of S355 (i.e., yield strength of steel equal to 355 N/mm2) cold-formed hollow sections, where in Figure 2, the first number stands for the cross-sectional diameter and the second for the cross-sectional thickness. The tubular part is tapered with 26 mm plate thickness and the diameter ranges from 4500 mm at the base to 3500 mm at the top. In line with [17], a NREL 5 MW wind turbine [47] is assumed for both towers. As shown in Figure 2, one of the two towers is supported by a 6-legged structure and in this case the configuration has been optimised based on the mass and the number of connections of the structure. As described in detail in [17], a parametric optimisation including towers with various bracing configurations and height to base ratios was carried out. An iterative process coupling aeroelastic and finite element simulations was performed, thus enabling the verification of design checks. The configurations that ensured adequate structural capacity combined with lower structural mass were considered as the optimal solutions. For the 4-legged structure, the cross-sections were chosen via an optimisation process verifying the structural efficiency and robustness. As part of the preliminary design, the total number of bolted connections required for each tower have been approximated, leading to a larger number of bolts for the 4-legged structure, owing to the more complex bracing configuration. Note that the tower connections have not been presented in detail herein, whilst additional information on their design, detailing and geometry can be found at [17,18,19,20,21].
A critical part for the structural design is the transition zone that has to sustain significant lateral loads and thus has to be carefully examined [20], so as to be adequately robust, but not overdesigned, as the latter could have an effect on the tower’s environmental performance. Two distinct solutions for the two towers were considered and are illustrated in Figure 3 for reference. For the 6-legged tower, the columns of the bottom lattice part are welded to the body of the transition piece, while a plate at the upper part of the conical transition shell is used for the connection of the transition piece to the lower plate of the tubular part. For the 4-legged tower, the transition piece consists of a cylinder with two rigid plates on bottom and top and has been structurally designed as a product, completely independent of the lattice part and least dependent of the tubular part.

2.3. System Boundary and Functional Unit

In the first phases of a LCA, a boundary system, which is defined as a set of criteria specifying which processes are part of the analysis, needs to be determined. The boundary system adopted in the present study is shown in Figure 4. Within this study, all life stages from the manufacture to the disposal, namely (a) Manufacture, (b) Transportation, (c) Erection, (d) Operation, (e) Disposal, are rigorously examined. In line with [22,23], the lifetime is set to 20 years. The wind turbine location is considered to be in Portugal. The connection to the electrical grid has not been considered, as it is out of scope of the current paper. The functional unit is considered the structure of a wind tower, with a height of 185 m, designed for a service life of 20 years and supporting a wind turbine of 5.0 MW.

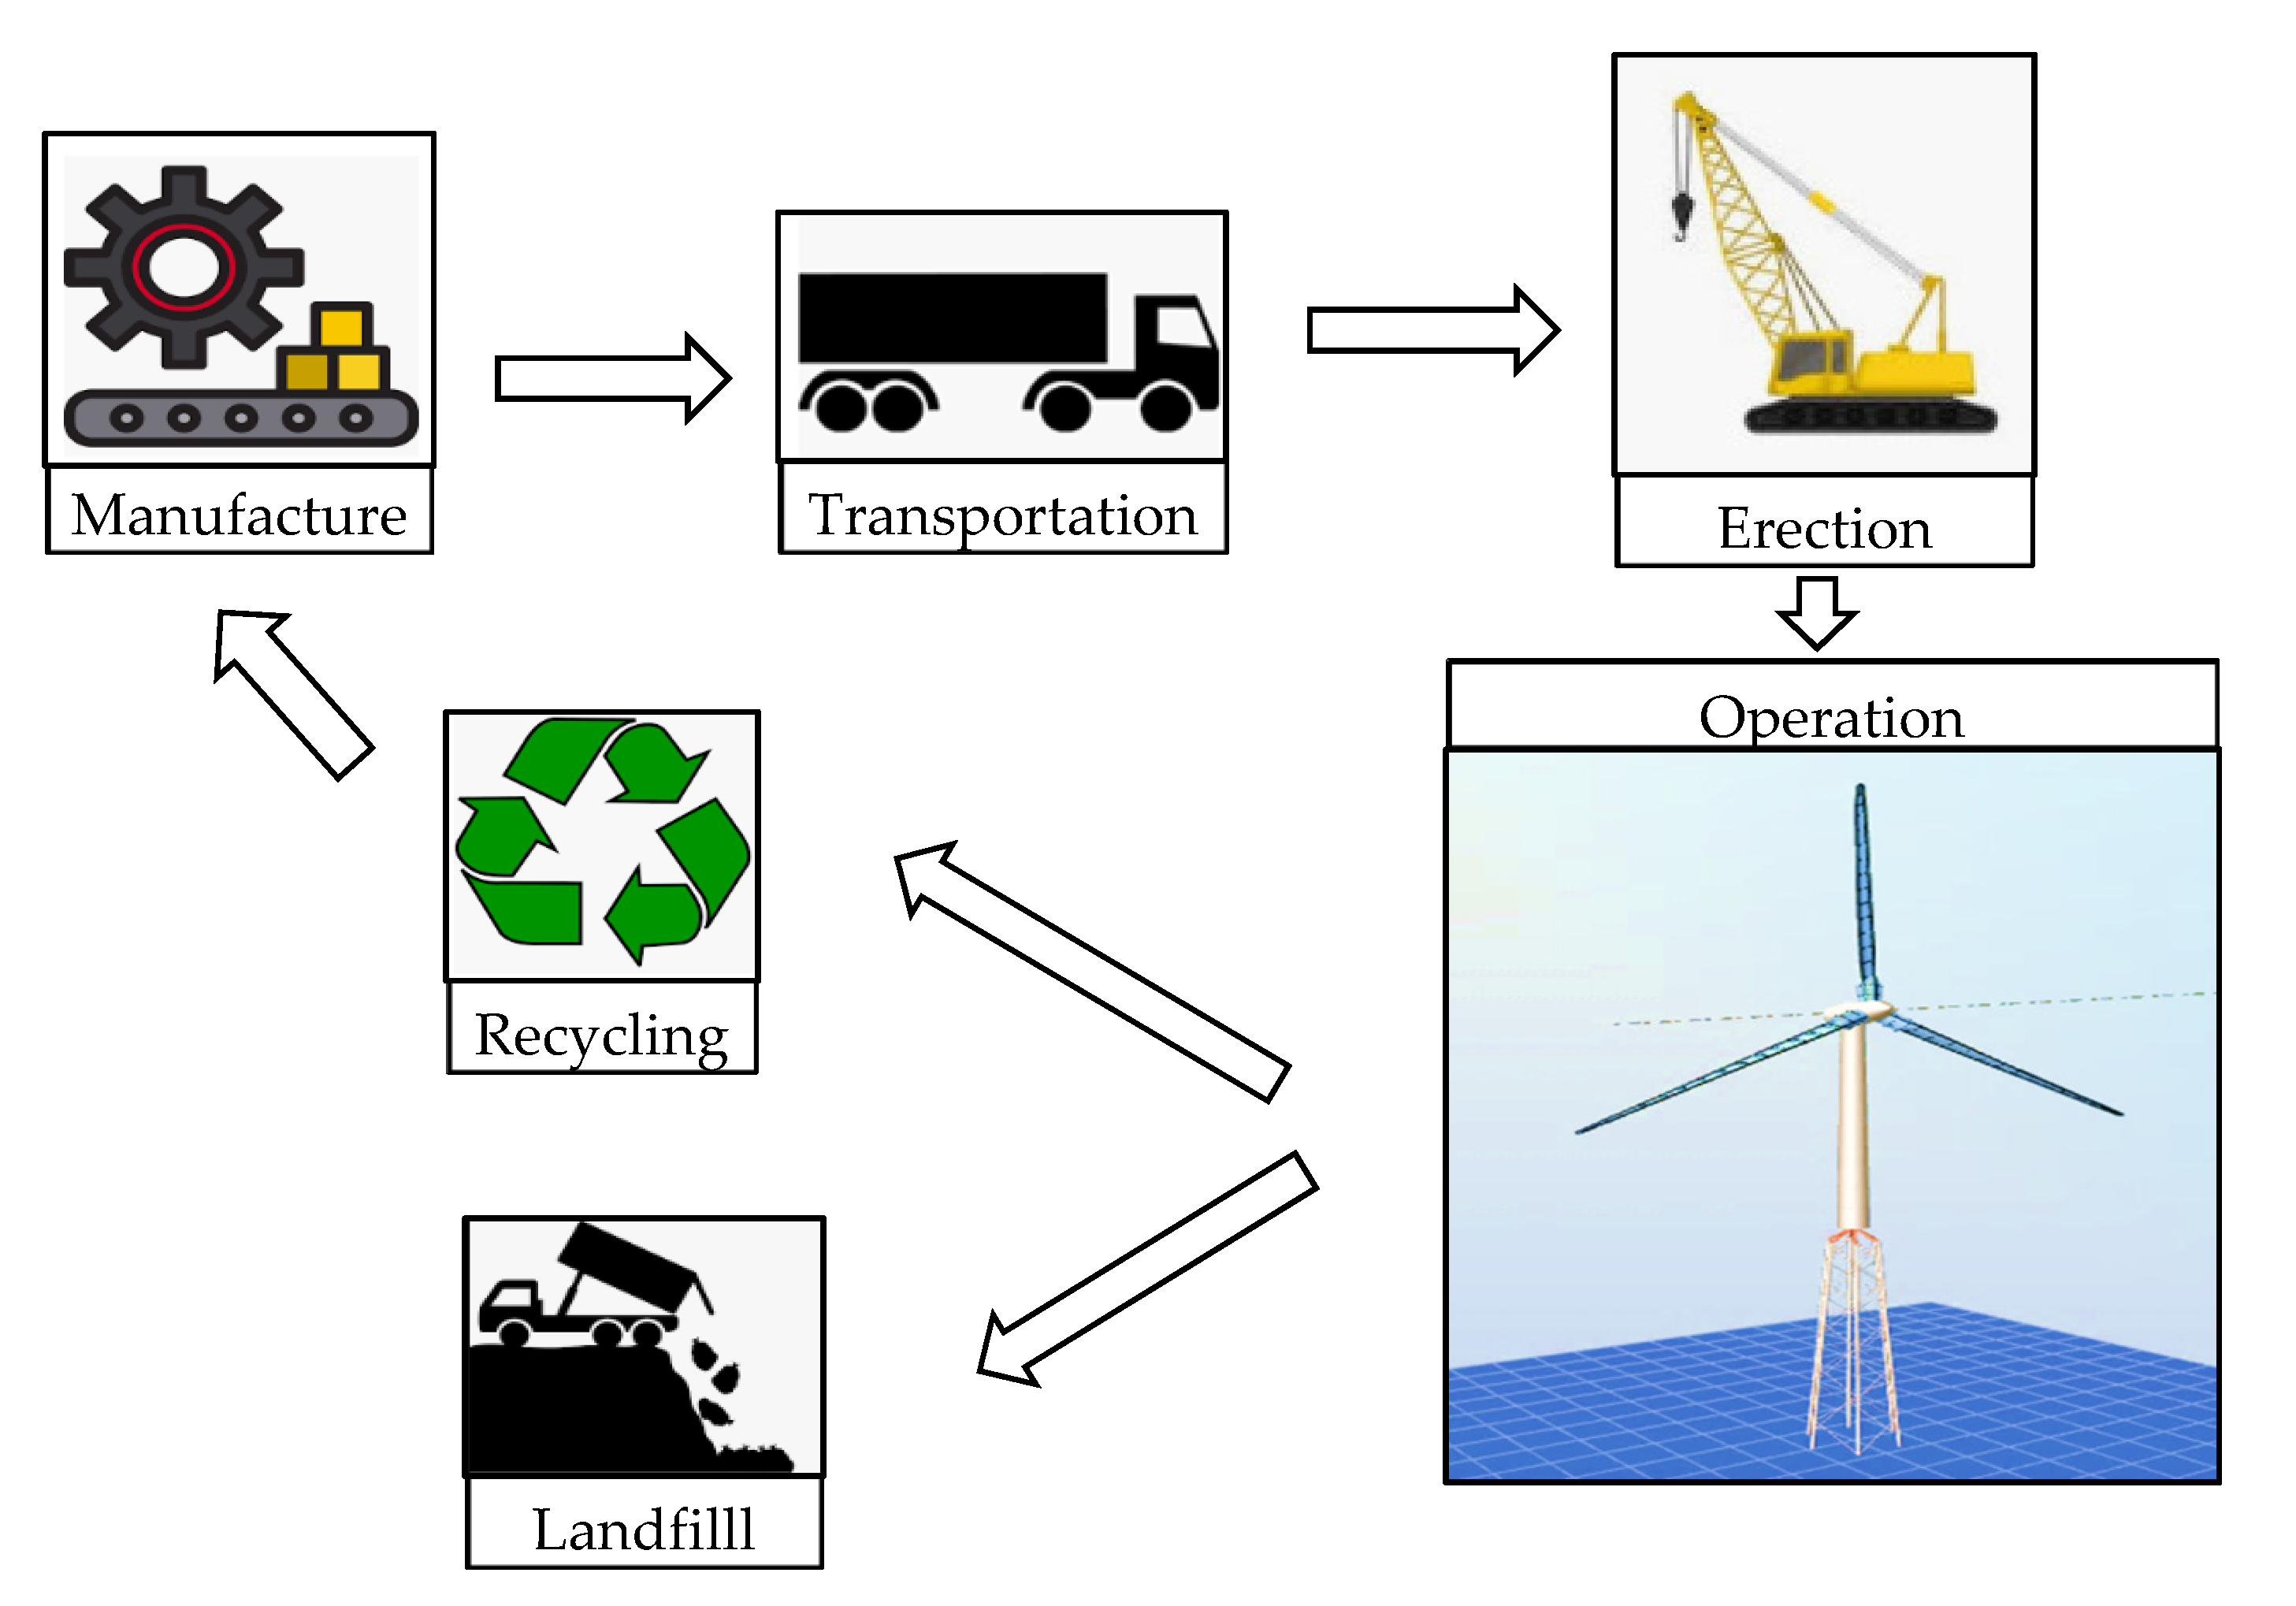
2.4. Life Cycle Stages

2.4.1. Manufacture Stage

In the first life cycle stage i.e., manufacture, the materials of all the components comprising the hybrid wind turbine towers are collected. The manufacture of the raw materials together with the energy integrated for their production are scrutinised for all involved materials. Table 2 summarises the main components and the constituent materials of the wind turbine tower. The composition of the materials used in wind turbine elements is based on a technical information sheet reported by US Department of Energy by Princeton Energy Resources International [48].
The mass distribution of the structure for the different components are presented in Figure 5, showing that the largest share corresponds to the concrete foundation. This is related to the height of the structure that requires a foundation of large dimensions in order to resist the acting overturning moment. The mass distribution among the tower’s components, i.e., lattice part, tubular part, transition piece and connections, is also presented. The biggest mass percentage comes from the lattice tower, which also covers a larger height compared to that of the tubular part, while the transition piece comprises a non-negligible mass contribution. This percentage is lower for the 4-legged which has been designed for optimised structural performance and minimisation of the structural steel weight.

2.4.2. Transportation Stage

Upon the components’ manufacture, the next stage is their transportation to the location of the construction site. For an accurate estimation of the environmental impacts of this stage, the total number of trucks during the examined life cycle is estimated. The following three types of transportation, as shown in Table 3, are considered: (a) 15 ton trucks for general use, (b) special trucks for transfer of the Rotor-Nacelle-Assembly (RNA), of the tubular part and of the main body of crawler crane and (c) 10 m3 capacity concrete mixers. The tower components are assumed to be prefabricated on the factory, wherever possible, in particular, the tubular segments are fully manufactured in factory and transported in pieces using special trucks to the construction site, where they are assembled together using bolted connections. Special trucks are also needed for the RNA and the crawler crane’s body transfer. Other materials and equipment are transferred by 15 ton trucks for general use, except for the concrete that arrives on site in mixers. The total number of trucks required are listed in Table 3. A distance of 100 km is assumed from the manufacture to the construction site, while at this stage, further to the energy production at the transportation process, the environmental impact of the emissions during the fuel’s production is also taken into account. The estimation is based on Portuguese industry, was derived in collaboration with [49] and refers to both examined hybrid towers.

2.4.3. Erection Stage

The next stage includes the erection of the tower and involves the site preparation and the use of a mobile crane and dedicated lifting mechanism. A detailed explanation of the suggested erection process for the examined hybrid wind turbine towers is provided in [21]. For both hybrid towers of this study, the lifting process is divided in four steps, as shown in Table 4, along with a brief description of each step. The required number of cranes and 10 personnel, are also considered at each step, thus allowing the time estimation of the whole process, which is an important parameter for this stage of the LCA. For both the 6-legged and 4-legged case studies, the 120 m lattice tower can be separated into six units. At the first step, the units of the lattice structure are assembled on site close to the erection point, while foundation works are carried out. Based on the number of bolted connections to be assembled, it is estimated that 10 persons along with 1 × 150 ton crane will be able to assemble the units in a duration of 6 weeks. Upon completion of the foundation works, unit 1 of the lattice is mounted and fixed to the foundation. Subsequently, the tower is built by alternatively assembling a lattice and a tubular unit, so that the tubular tower is assembled on the inner part of the lattice structure and ready to be lifted upwards. With similar assumptions and an additional 1 × 750 ton crawler crane, 2 weeks are required for the second step of the erection process. The tubular part is then lifted in position with the use of jacks and a strand carousel within a week. The last step comprises the installation of the RNA at the top of the tower and has similar duration to that of conventional tubular tower and equal to 1 week. A total of 10 weeks is therefore estimated for the erection process and is considered for the LCA. The considerations are according to the current working conditions in Portugal and for the assumed lifting process [21,49].

2.4.4. Operation Stage

Following the erection of the wind turbine towers, the next stage is the operation, during which the maintenance of bolted connections is considered to be realised twice a year by specialised personnel. As this study mainly focuses on the tower’s LCA, details related to the turbine maintenance have been excluded from the analysis. Furthermore, note that according to [46], it was considered that a 5 MW turbine would have 2000 operational hours, resulting in an annual generation of 10 GWh.

2.4.5. Disposal Stage

In the final disposal stage, the period of disassembly is approximated as half of the erection duration (i.e., 5 weeks), during which the usage of trucks and transport (for transfer to the landfill) is considered. Recycling of the products is assumed in a closed loop approach, implying that the material properties of the recycled products are equivalent to those of the virgin ones. Epoxy, fiberglass and plastic are assumed to be 100% incinerated; steel, cast iron and copper are assumed to be 90% recycled; and concrete is assumed to be 100% landfill, in line with the assumptions considered in [31]. Finally, the surface treatment in the tower, the paint used in the tower and the RNA and the grid losses are disregarded from the analysis. The non-recyclable components are assumed to be landfilled 100 km away from the site.

2.5. Life Cycle Inventory (LCI)

At this stage, the maximum possible level of accuracy and detail has been guaranteed. For the LCA realisation, the GEMIS software (Global Emission Model for Integrated Systems) [50] is applied. GEMIS is an open source database and material flow analysis tool. Among various application fields, GEMIS has been successfully used in the past to investigate the environmental performance of wind turbine towers [31]. The software currently employs a set of 1239 products (i.e., inputs and outputs of processes), 12119 processes (i.e., procedures for energy or material transformation) and 149 scenarios (i.e., collection of processes) including figures from over 50 countries, whilst supplementary details can be inserted into the software. Note that conversion factors with indicated source reference suggested and verified by GEMIS have been adopted. All collated data imported into GEMIS, (a) masses of materials measured in tonnes (ton), (b) type of transportation along with relevant distances measured in tonne-kilometre (tkm), (c) residues measured in tonnes (ton), and (d) crane usage in hours (h), are listed in Table 5. The values shown in Table 5 have been evaluated on the basis of the considerations stated in Section 2.4 and for the geometries discussed in Section 2.2.

3. Results and Discussion

3.1. Life Cycle Indicators

In order to evaluate the environmental impacts of these newly introduced hybrid towers and in line with past investigations for wind turbine towers [31], focus is placed on the following three environmental impacts: (a) AD measured in GWh, (b) GWP factor measured in tonnes CO2 equivalent (CO2-eq), (c) EPT measured in months. Upon LCA performance in GEMIS software, the carbon emissions and the energy requirements are exported. The summary of the results, as obtained from GEMIS output data after the LCA analysis was completed, are shown in Table 6. The calculated EPT is a bit over 6 months for both 4-legged and 6-legged towers, similar or in some cases lower to those of lower height towers [35]. The results of AD and GWP are analysed in the following section, presented in terms of percentage contributions.

3.2. Impact Assessment

The detailed LCA footprints in absolute values are presented in Table 7, while aiming to better comprehend the environmental performance, the percentage contribution per life cycle stage and per component are given in Figure 6 and Figure 7, respectively. The figures are formed based on the data reported in Table 7.
In Figure 6, the percentage contribution to the global warming potential and the abiotic depletion of each life cycle stage is visualised. In line with past studies [30,44], the biggest share belongs to the manufacture stage (~80%). The stage with the second highest LCA footprint for both hybrid towers is the erection stage (7.1%, 7.6% for GWP and 9.8%, 10.4% for AD), largely owing to the long duration of the erection process. Lowest contributions to CO2-eq emissions and to AD are reported for the transport, the operation and the disposal stage. Comparing Figure 6a,b, it can be seen that the 4-legged tower led to a little lower contribution for the manufacture stage (82.4% vs. 84.7% for GWP and 77.3% vs. 80.1% for AD) and can be related to the smallest structural steel weight. On the contrary, the 4-legged tower resulted in a little higher LCA footprint for the operation stage (3.4% vs. 2.1% for GWP and 4.8% vs. 3.0% for AD) that is related to the larger number of bolts that have to regularly be maintained. Overall, the results between the 6-legged and the 4-legged hybrid structure are comparable.
As far as the share among the components is concerned, Figure 7 shows that the tower is the component with the largest carbon emissions and energy requirements (~50%). This could be related to long time usage of cranes required for the tower’s assembly. It should be noted that the erection stage has been approximated for this study and its duration is expected to decrease as the lifting process gets established and further applied. Given that concrete is not as recyclable as steel, the component that carries the next biggest share is the foundation (23.7%, 25.8% for GWP and 17.8%, 19.3% to AD). Comparing Figure 7a,b, it can be seen that the impact of the tower component is lower for the 4-legged tower, which is related to its smaller amount of structural steel (see Table 5), while again the results from both towers appear similar.
The results obtained herein for the 185 m tall hybrid towers are compared with those of conventional towers from past studies in Figure 8 and Table 8. In Figure 8, the AD, GWP and EPT results are compared with those of [45], where analogous considerations have been adopted for the LCA of 150 m tubular towers with 5 MW wind turbines, thus allowing a fair comparison with the results herein, as well as with those of [31], where similar LCA procedure via GEMIS software has been adopted for 105 m towers. Both AD and EPT are quite similar to the ones of the steel tubular towers. In particular, the EPT of the currently studied hybrid towers was found to be 6.09 and 6.48 months for the 4-legged and the 6-legged tower respectively, while EPT of the conventional steel tubular towers was in the range of 3.63 to 7.80 months. The AD was found equal to 3.03–5.47 GWh and 5.07–5.40 GWh for conventional and hybrid towers respectively. The GWP was higher for the hybrid towers compared to conventional steel towers (1164–1620 tonnes CO2-eq for conventional towers and 1924–2065 tonnes CO2-eq for hybrid towers). Given the increase in required structural material, the corresponding increase in the carbon emissions of 185 m towers appears reasonable. The same conclusions with regards to GWP and EPT figures are drawn from Table 8, where additional literature data have been summarised. Note that for comparison purposes, the GWP has been converted from tonnes CO2-eq to g CO2-eq/kWh in Table 8. In past studies, GWP has been reported in the range of 6 to 23.77 g CO2-eq/kWh and the EPT 4.8 to 22 months. Overall, comparing to the globally popular steel tubular towers, the hybrid towers lead to similar environmental effects, while at the same time, allowing the rotor to produce higher amounts of energy at higher altitudes. This confirms the eco-friendly performance of the hybrid towers and encourages further their applications.

4. Conclusions

The current need for developing taller and more robust wind turbines with larger energy generation capacities leads to a corresponding increase in the energy required for their production. It is hence deemed essential to investigate the effect of the latter on the environmental performance of the whole system. A comprehensive literature review demonstrated a gap on the LCA of tall wind turbine towers with hybrid structural system. A rigorous research on the life cycle assessment of onshore 185 m hybrid wind turbine towers led to the following main conclusions:
(1)
For the transportation stage of a 20 year life cycle of a hybrid tower, it was estimated that there would be required 90 concrete mixers, 65 normal 15 ton trucks and 16 special trucks.
(2)
With the current technology available in Portugal, the erection process of the hybrid wind turbine is estimated to last 10 weeks.
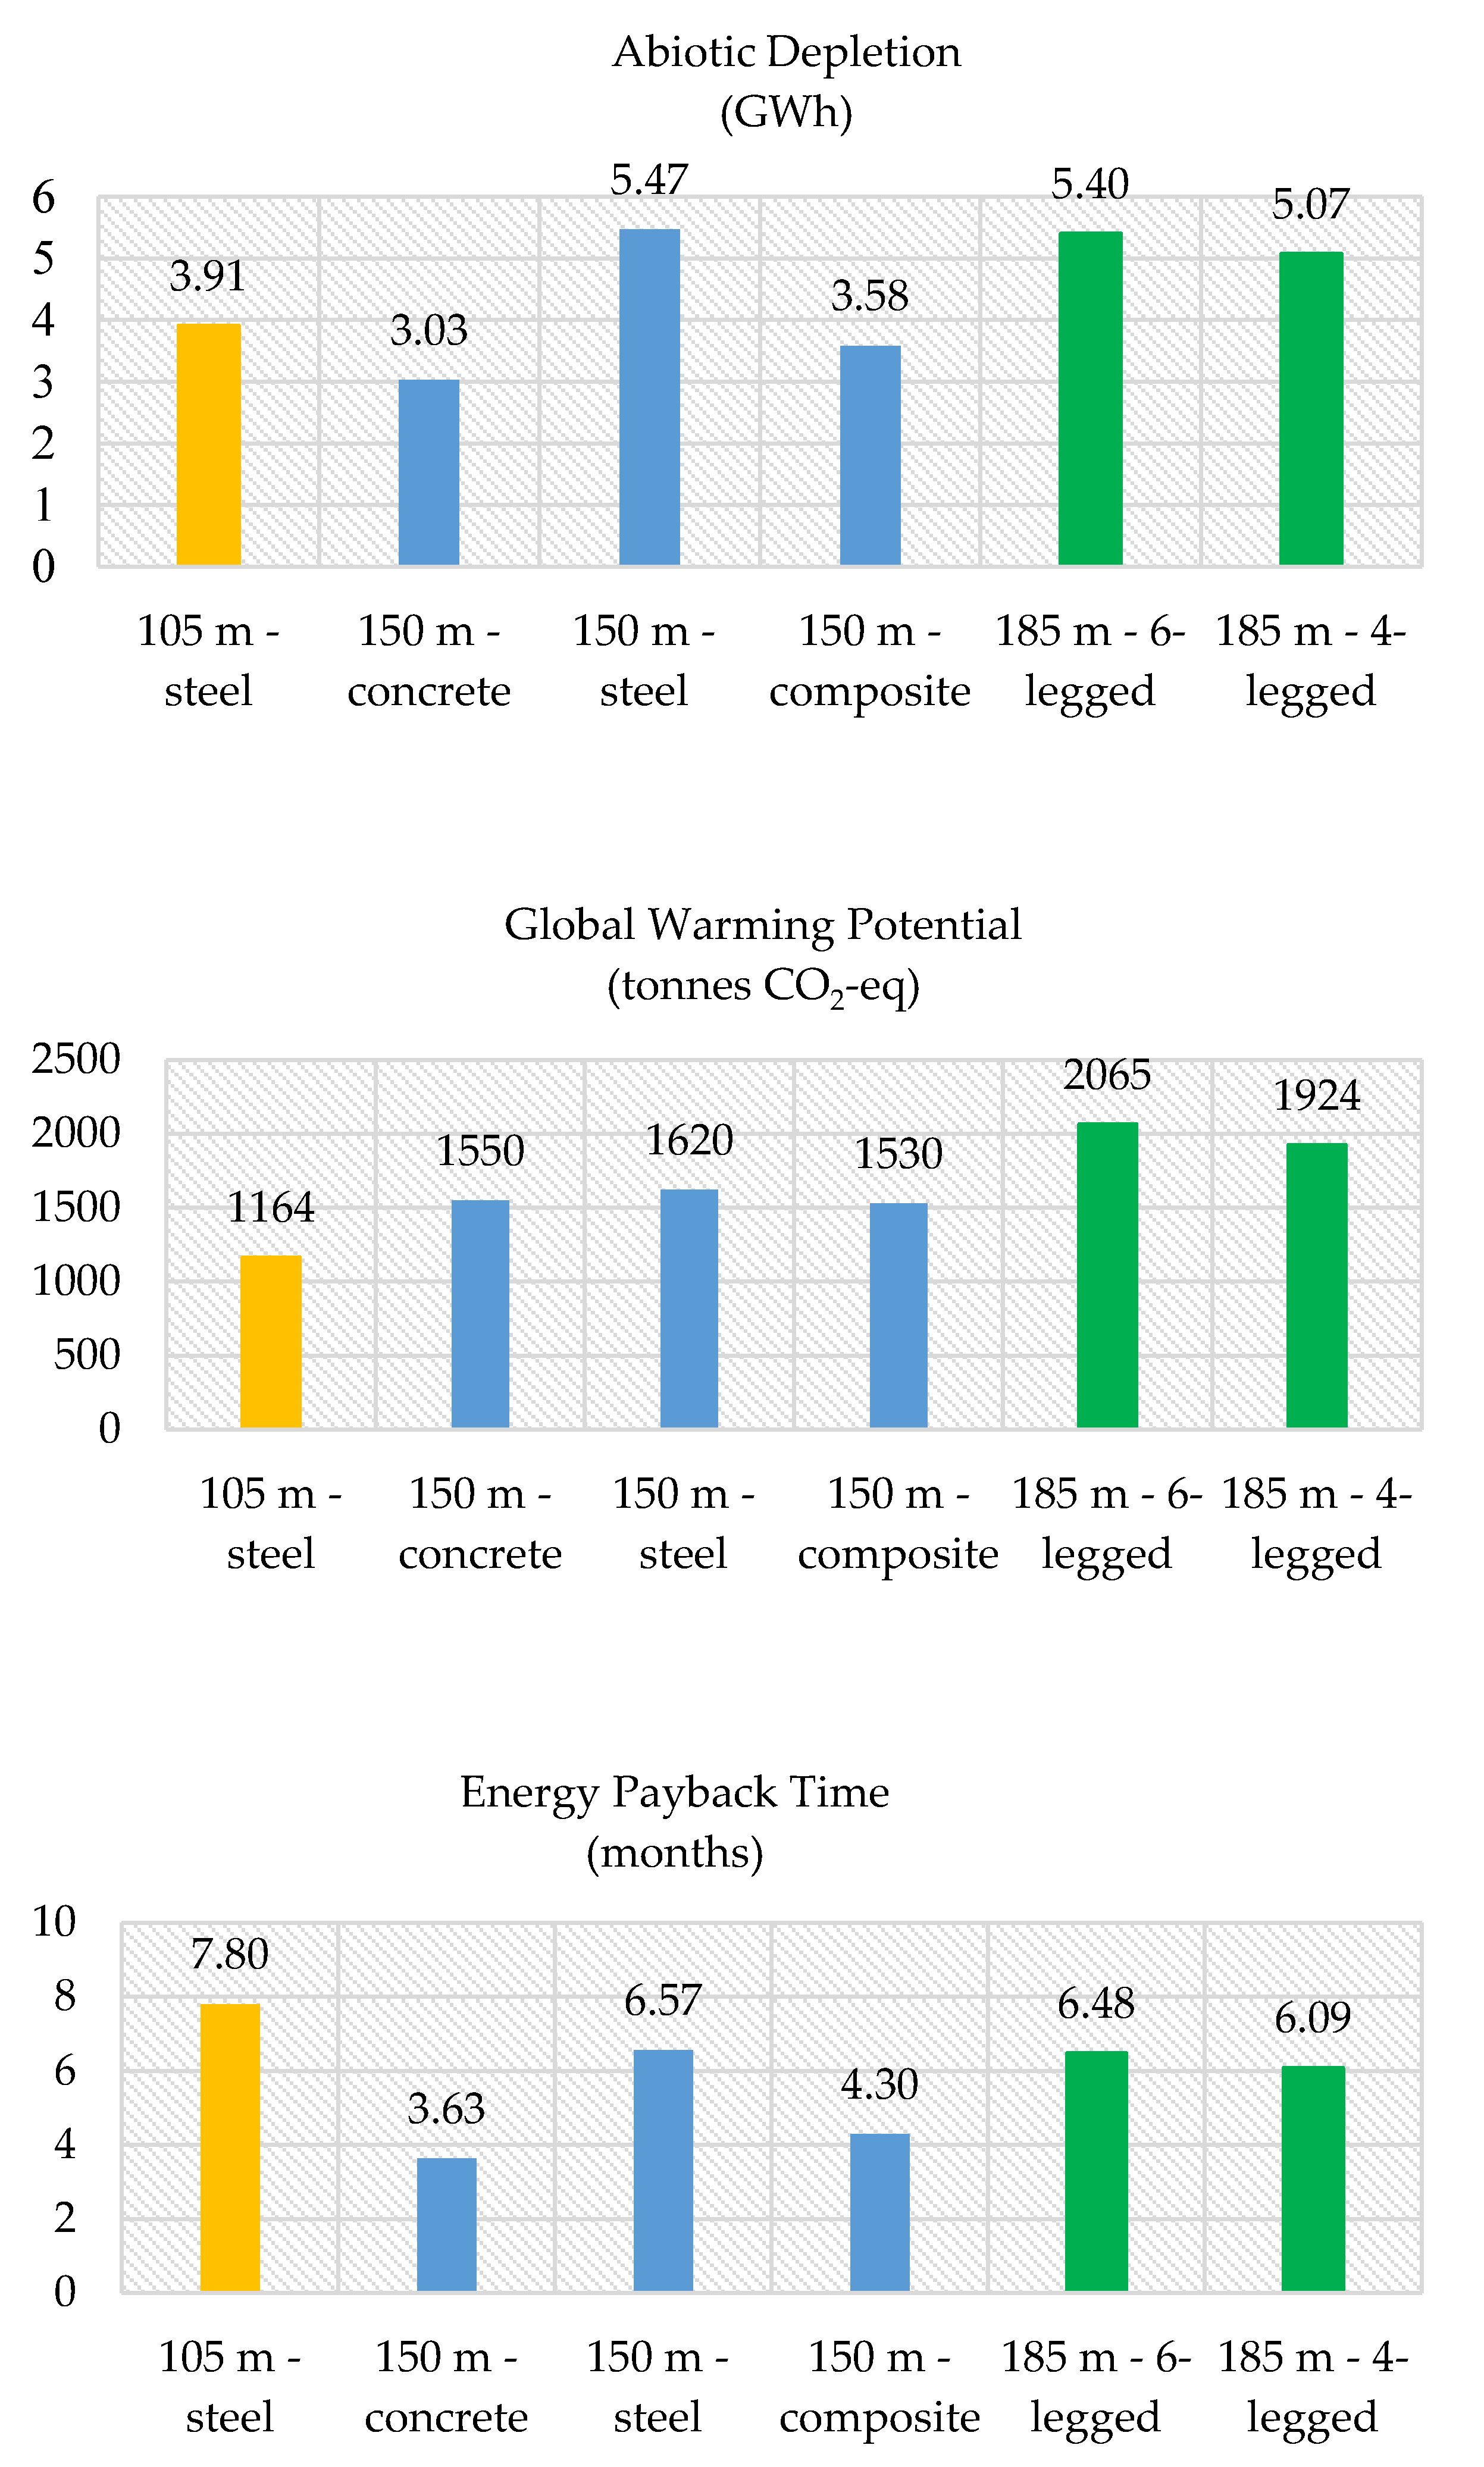
(3)
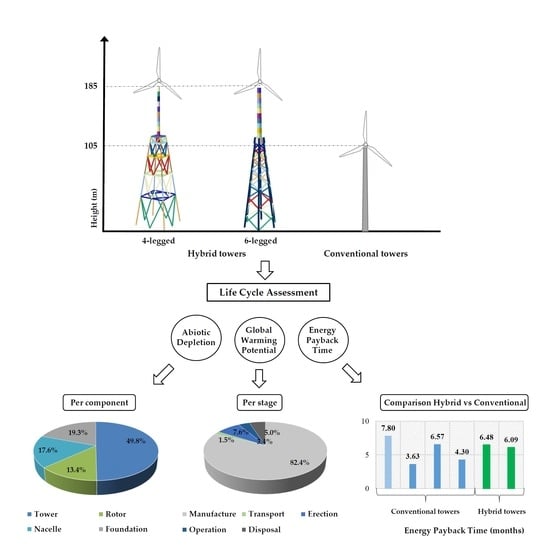
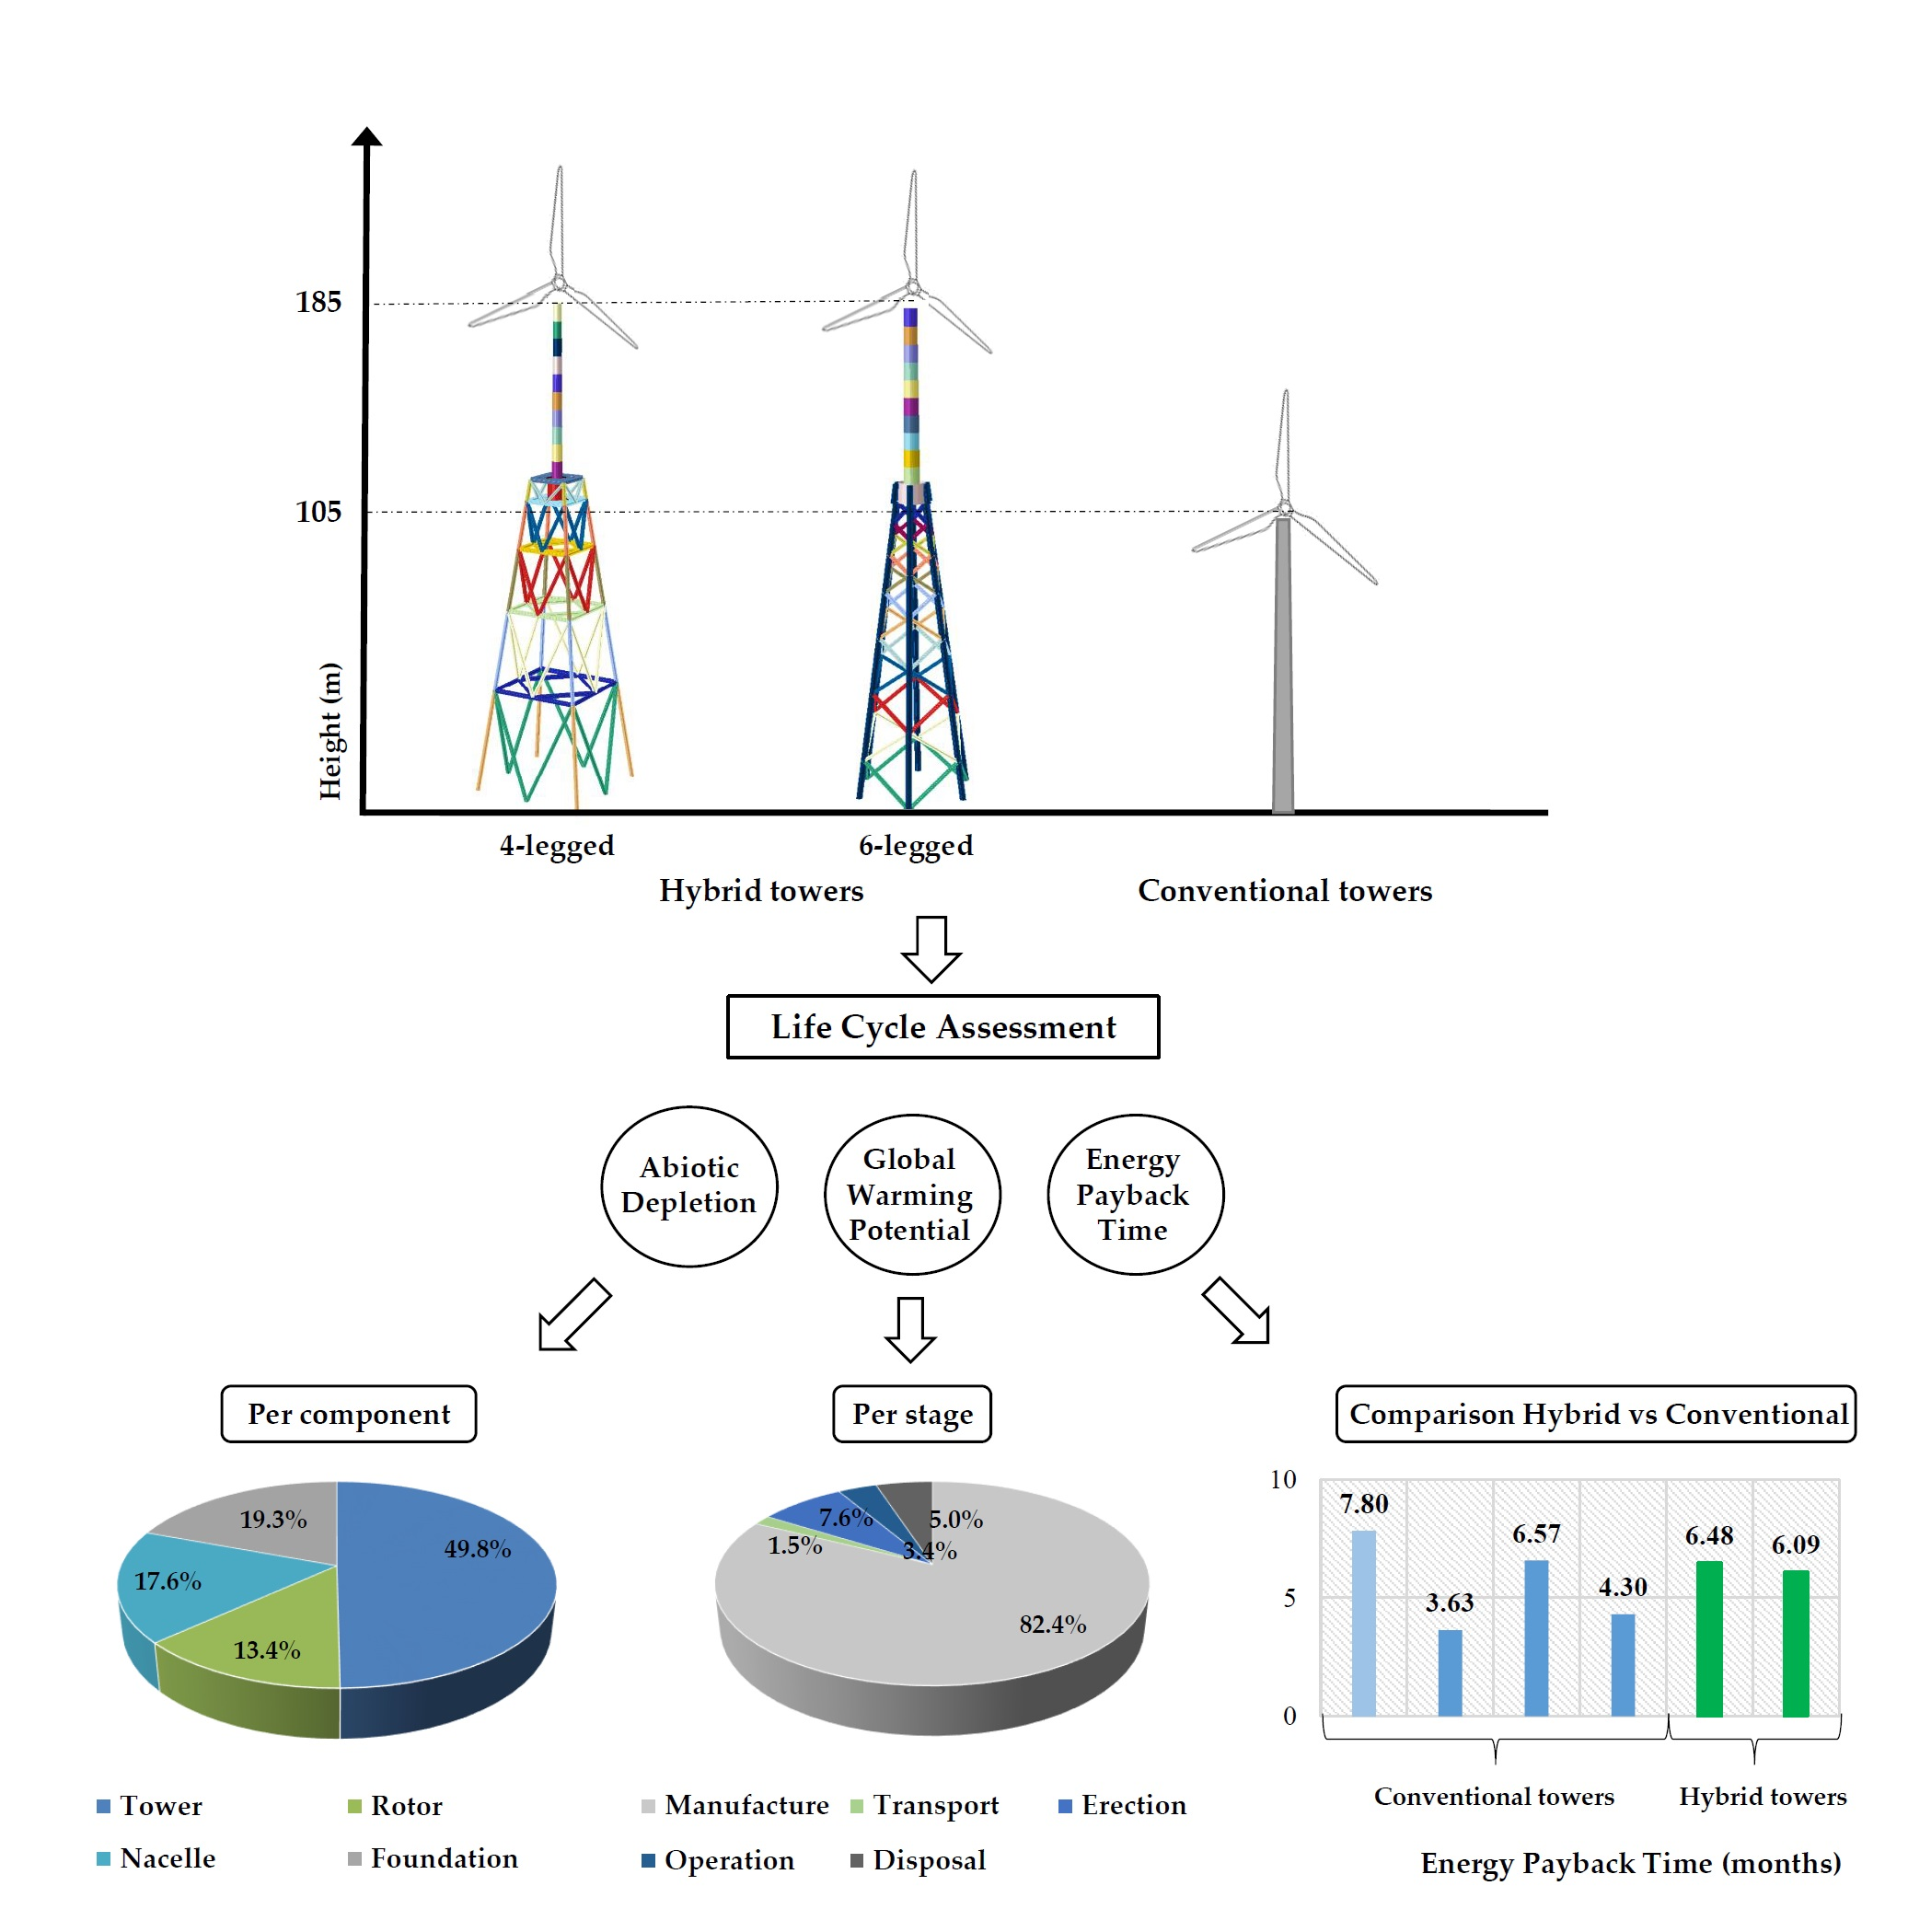
LCA of two different hybrid towers, one 4-legged and one 6-legged, was evaluated by means of GEMIS software. The results between the two towers were similar with energy payback time ~6 months and CO2-eq ~10 g CO2-eq/kWh.
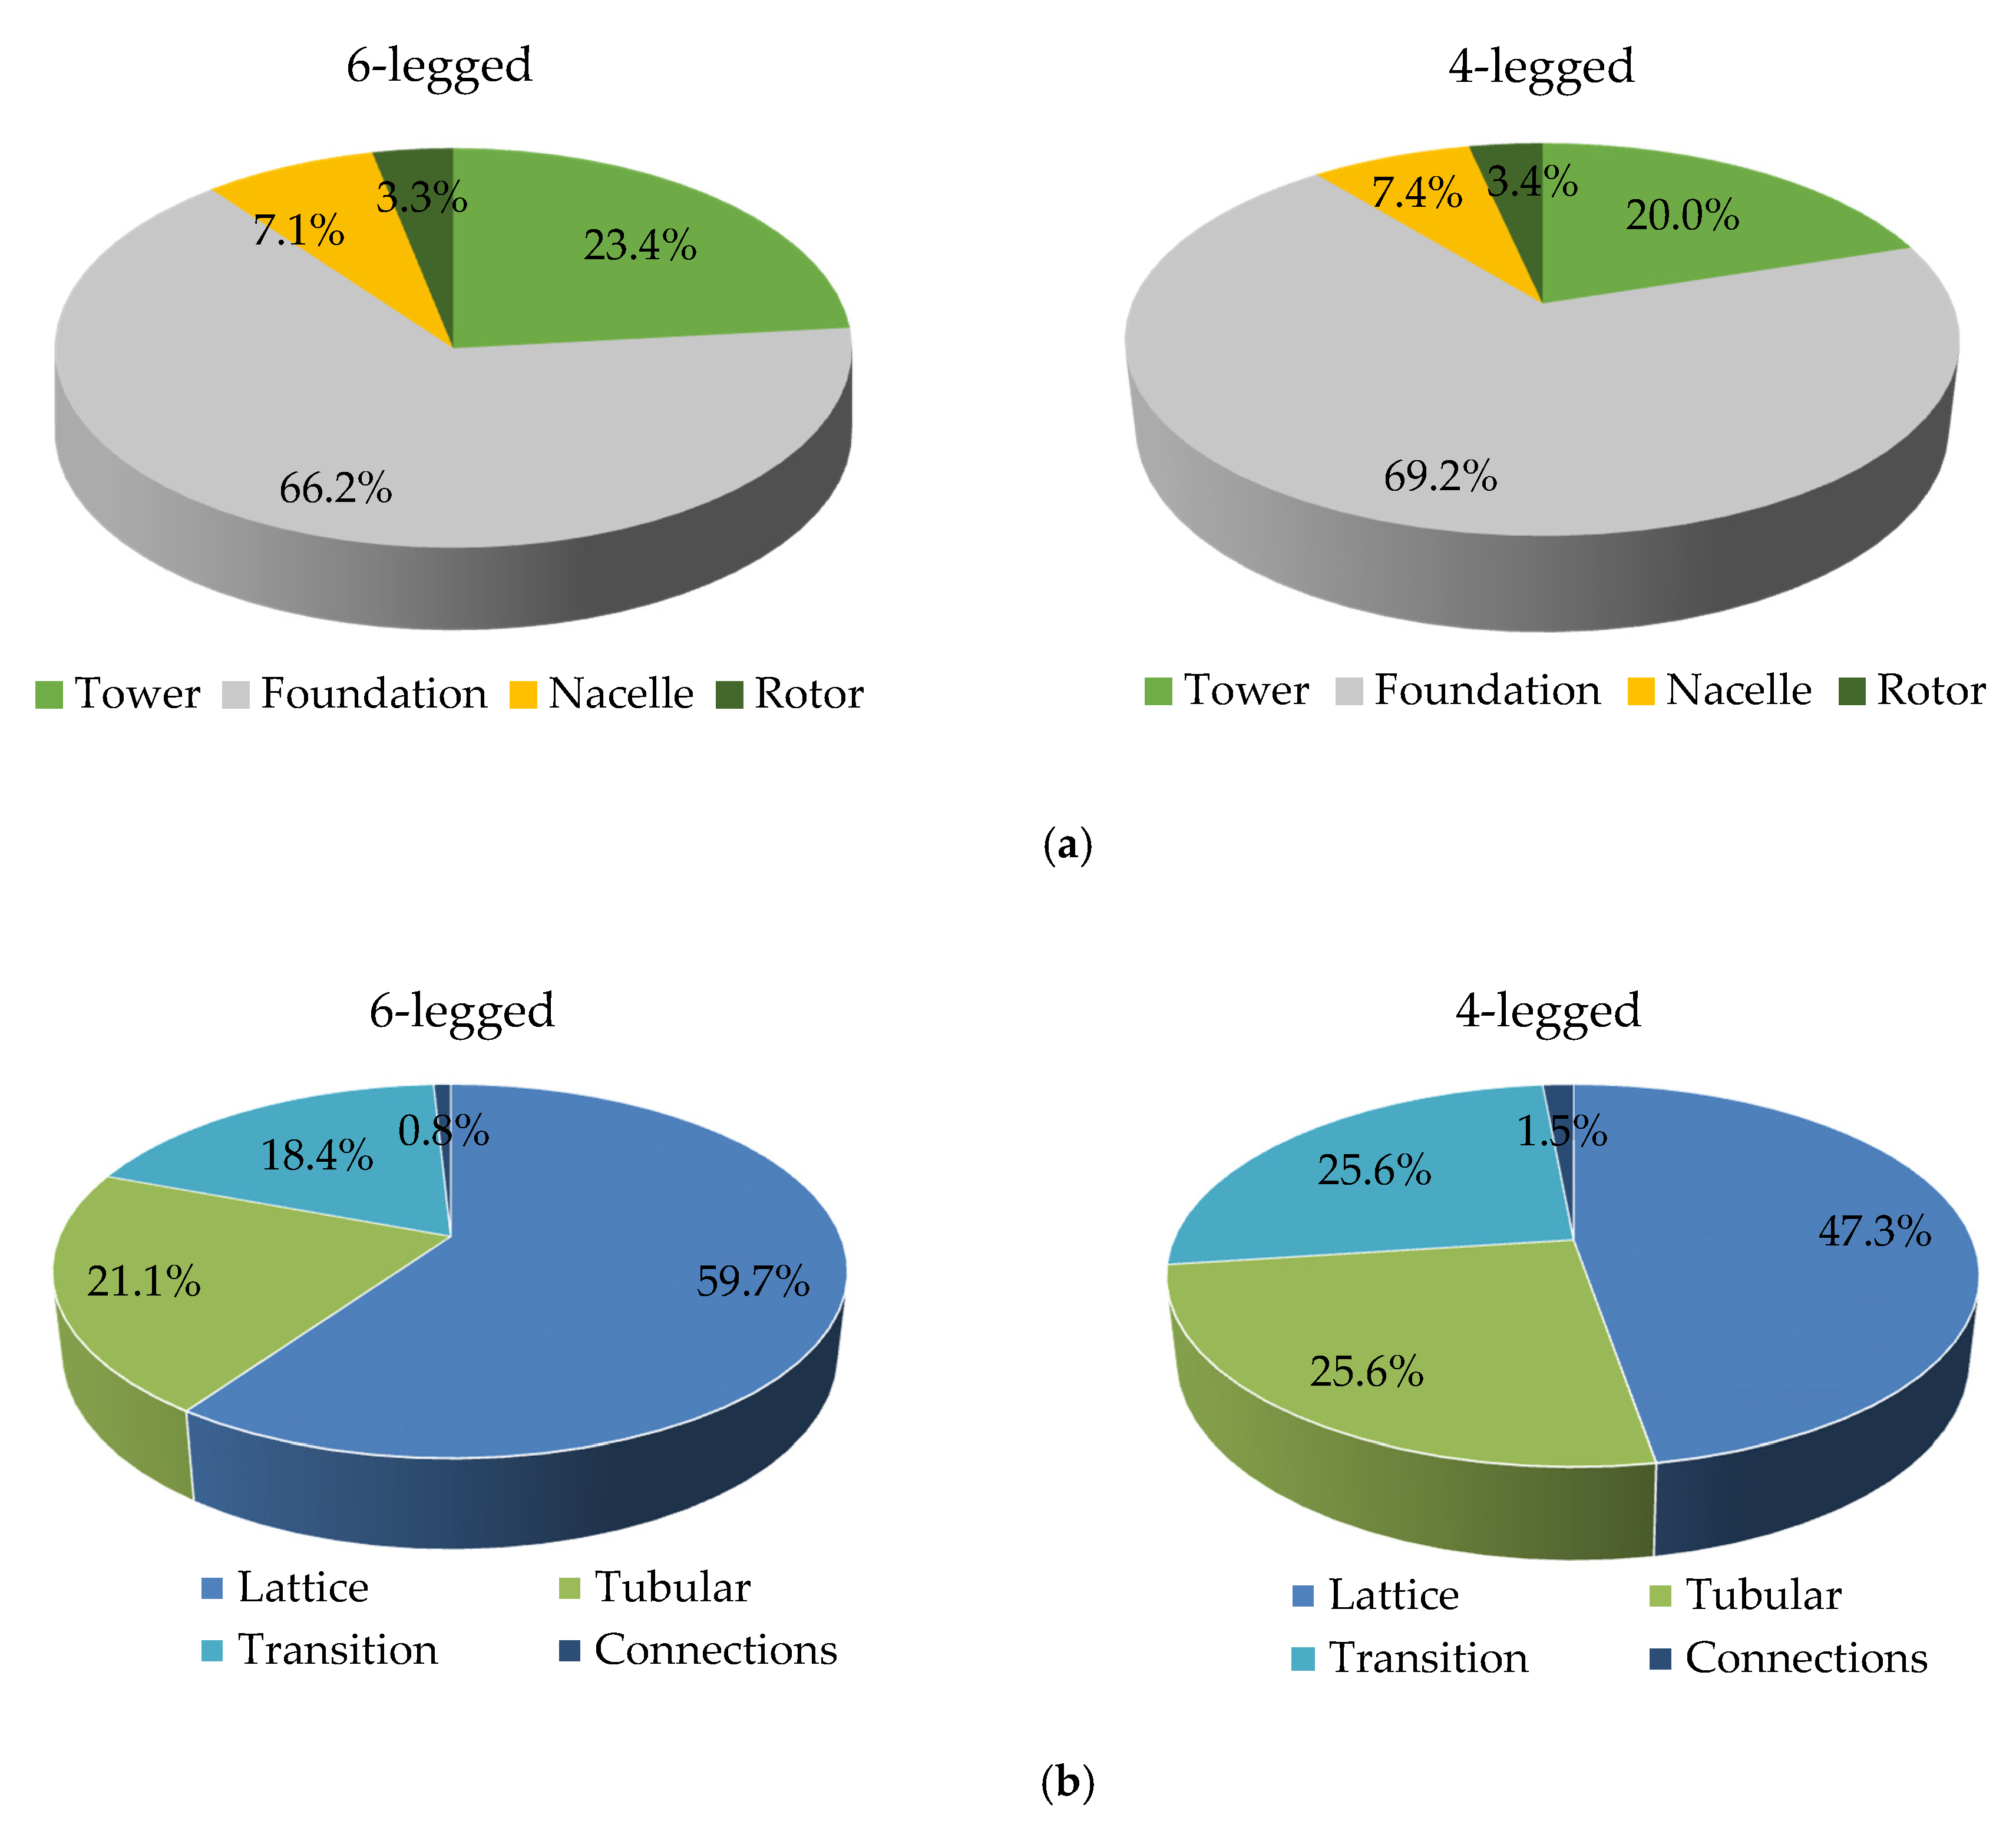
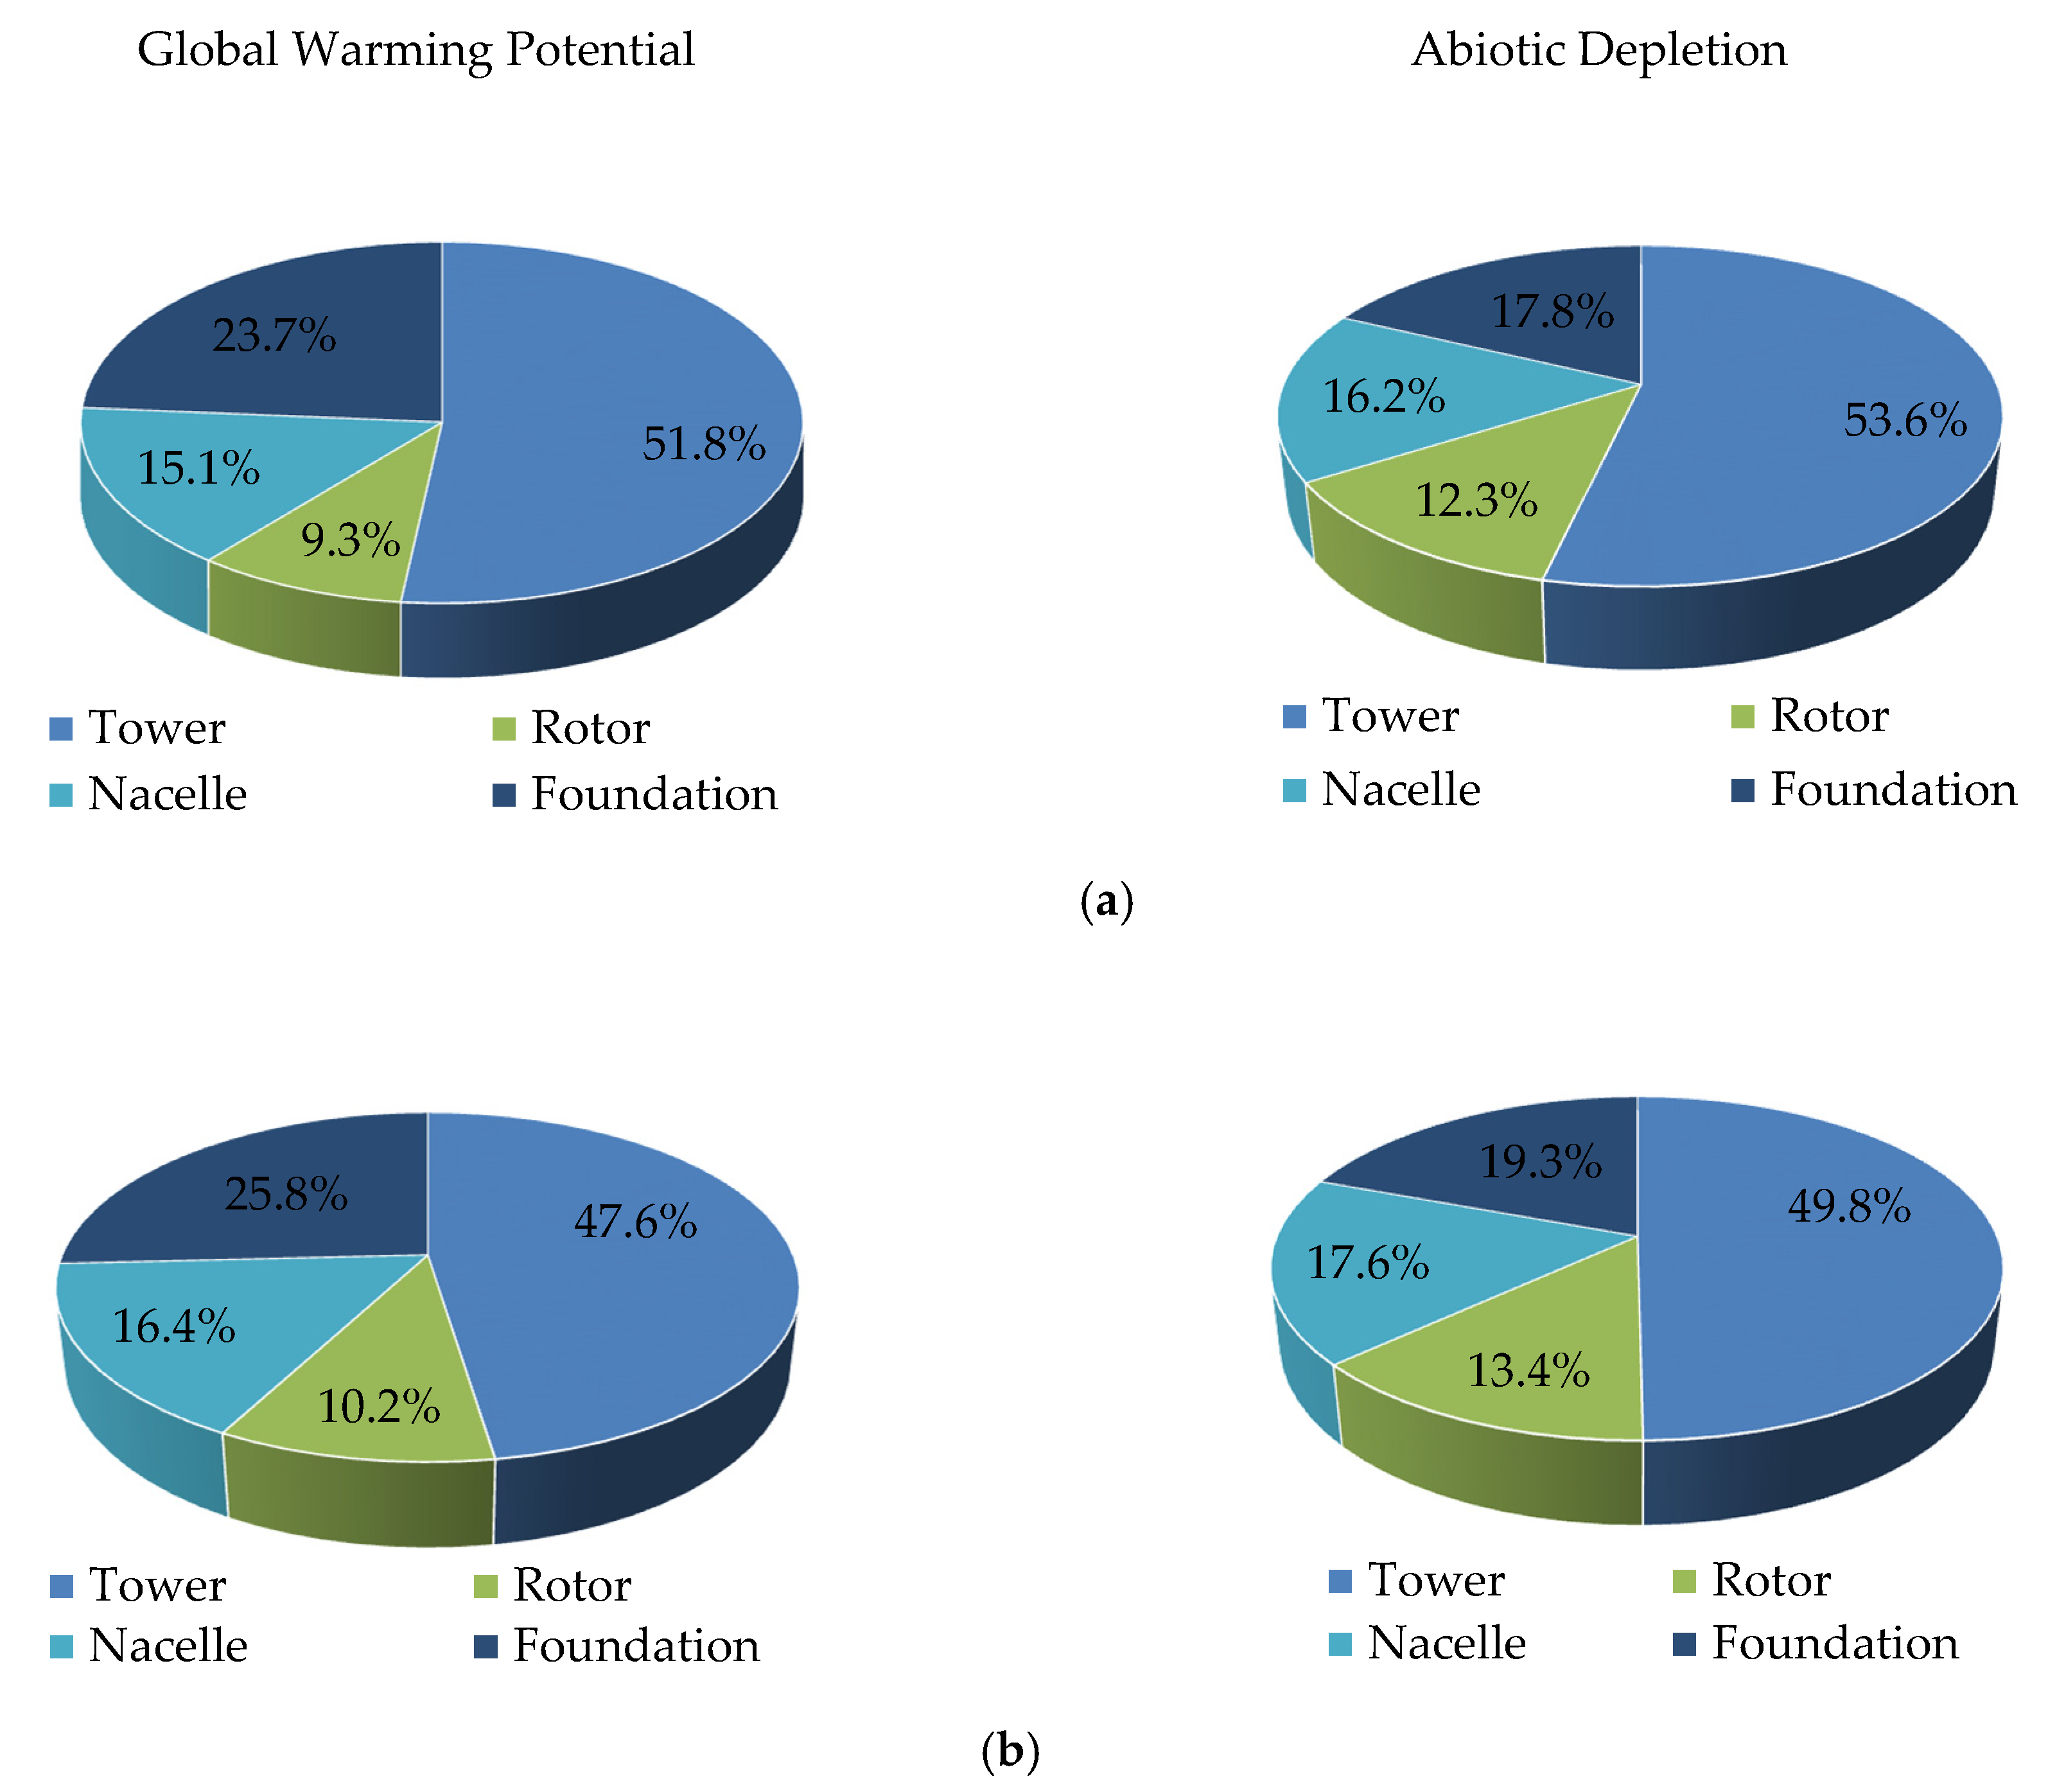
(4)
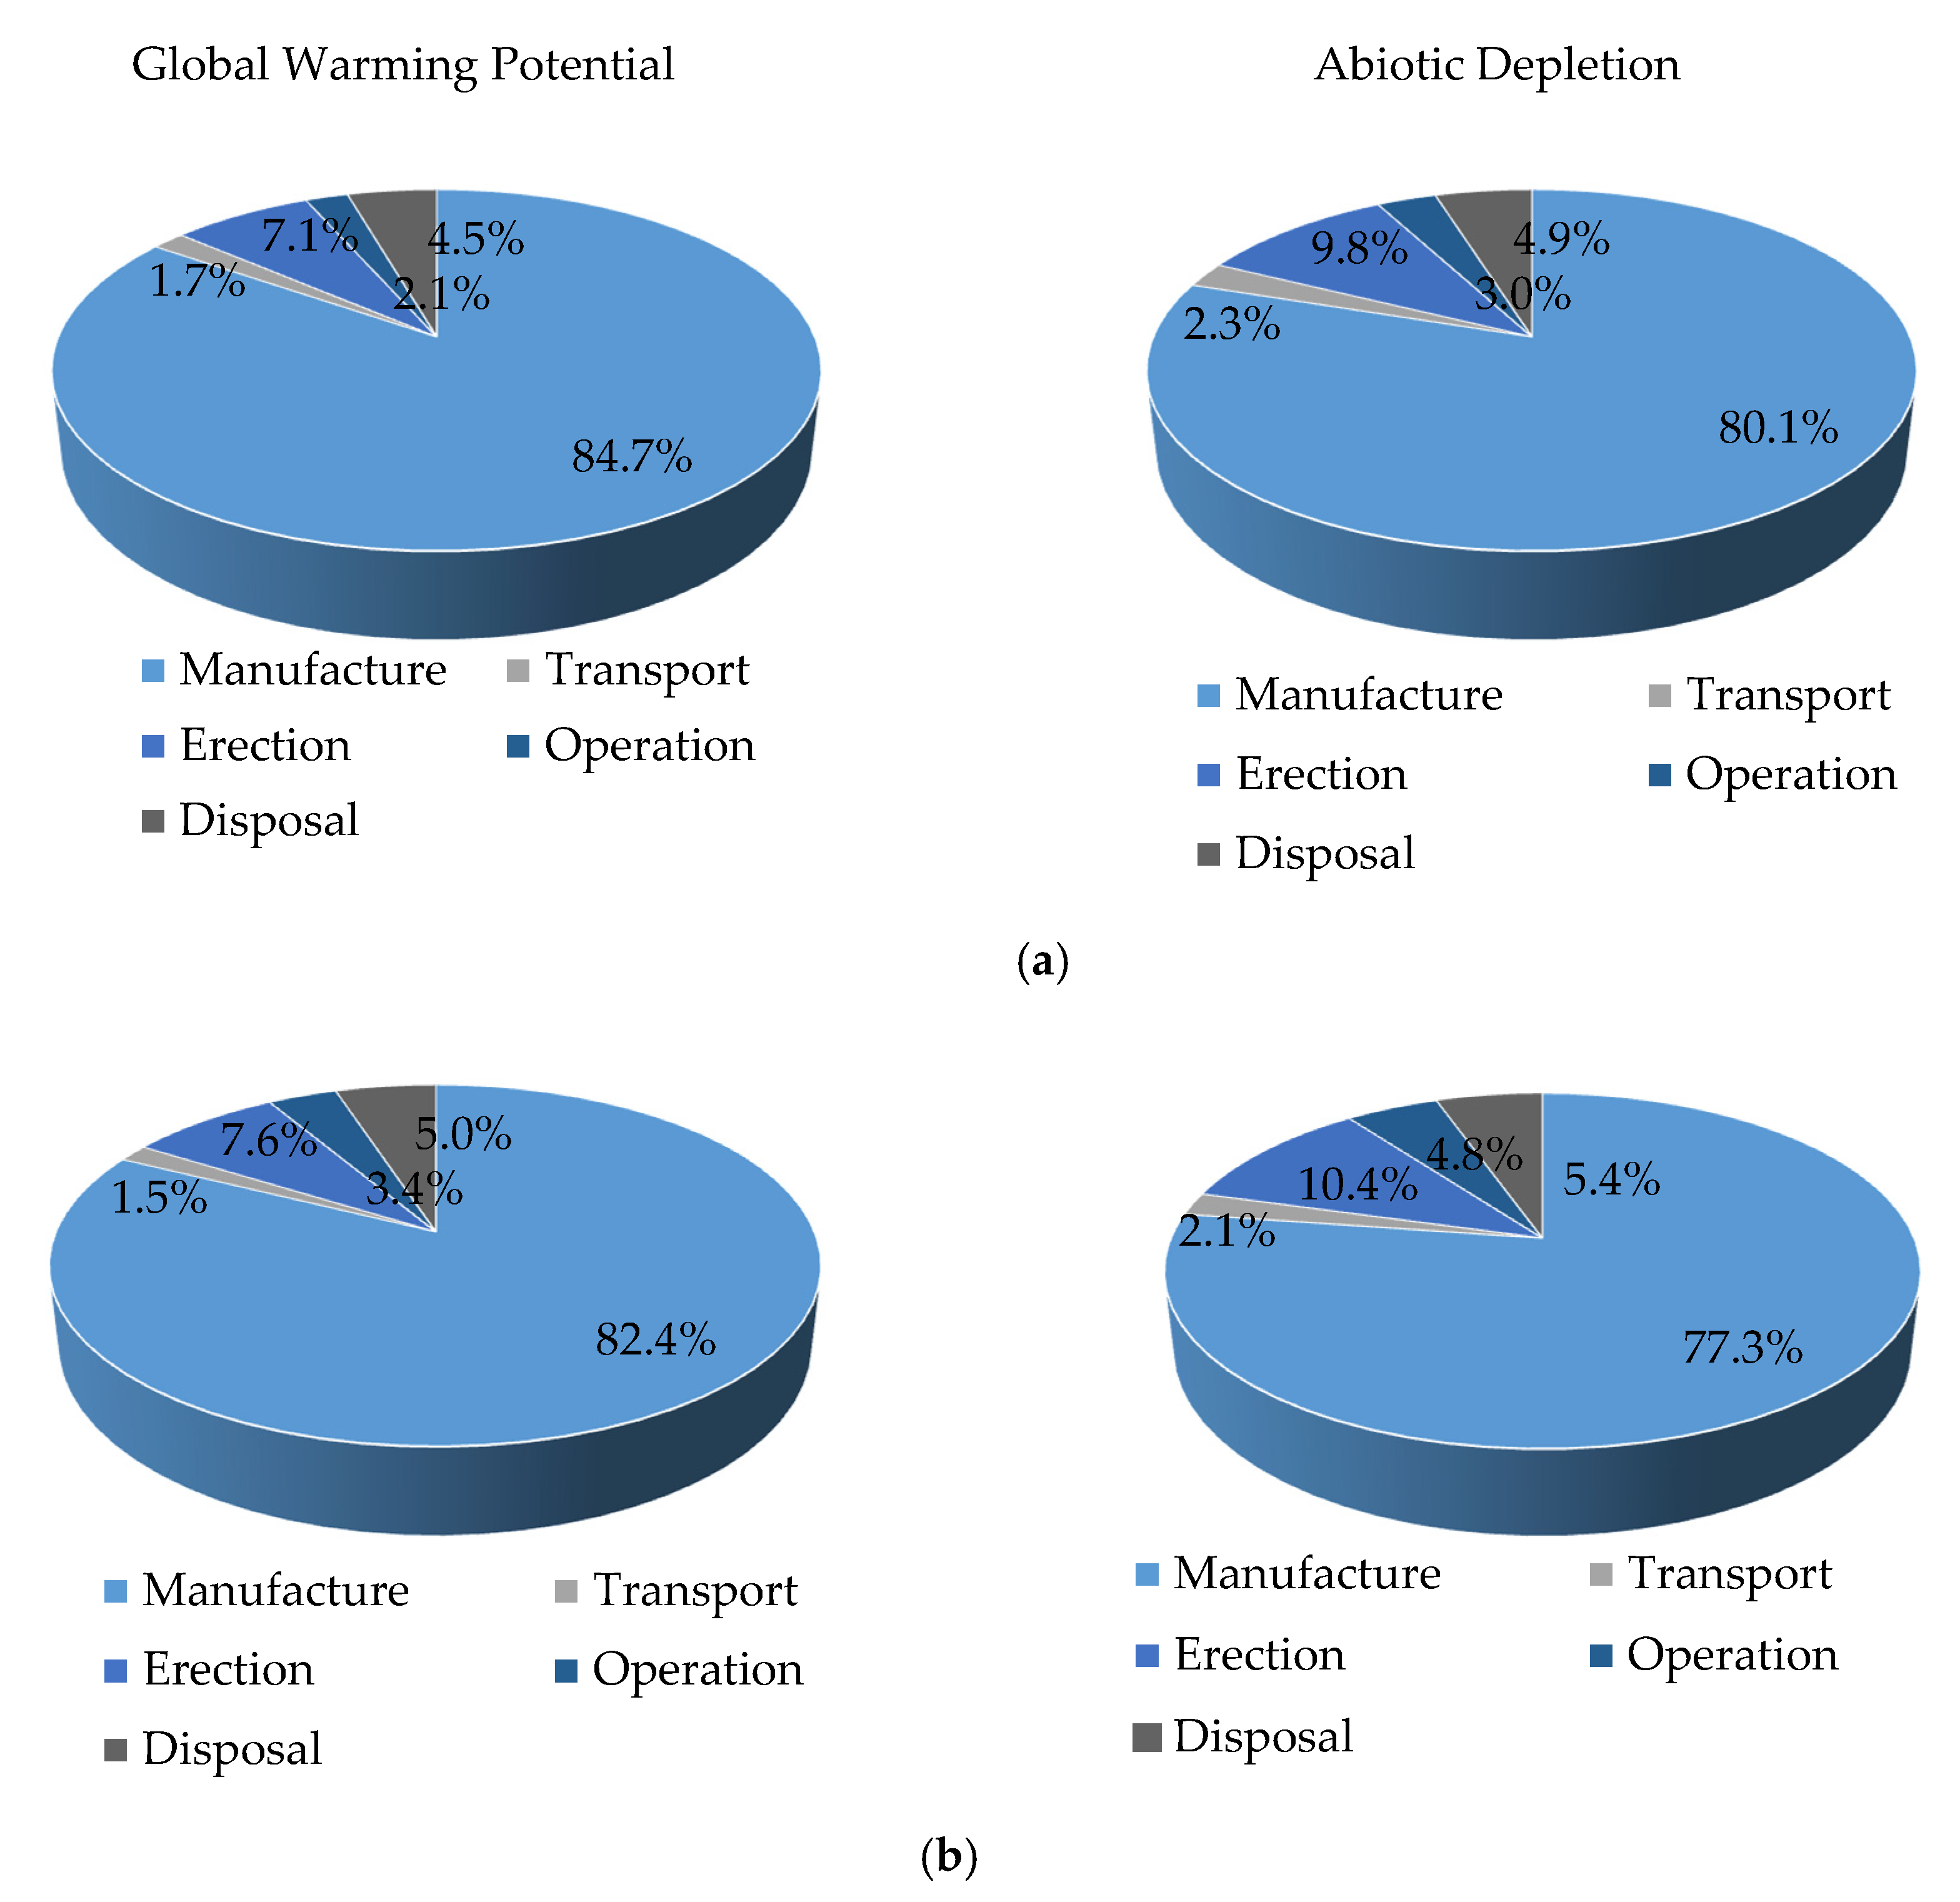
The component with most significant LCA footprints is the tower (~50%) followed by the foundation (~20%), whilst the stage with the highest environmental impact is the manufacture (~80%) followed by the erection (~10%).
(5)
The LCA footprints related to the tower and the erection stage can be further reduced, as the erection process of the hybrid towers gets more established in the industry.
(6)
The LCA results of the 185 m hybrid towers were compared to that of conventional towers, resulting in similar carbon footprints and energy payback times.
The present research study, which was the first to be reported for hybrid towers, demonstrated that the hybrid wind turbine structure can be an advantageous solution, allowing the exploitation of increased wind velocities at larger heights, without sacrificing their eco-friendly performance. The results included herein could be utilised to further optimise the life cycle performance and potentially the structural and environmental efficiency of very tall hybrid wind turbine towers. Further research is recommended to investigate the LCA footprints of different structural configurations of hybrid wind towers and parks and to conduct life cycle cost analysis. Finally, the two solutions for the hybrid configuration and the transition piece presented herein are expected to act as a guide for future structural engineering designs of hybrid towers.

Author Contributions

Conceptualization, M.G., C.R. and C.B; Methodology, M.G.; Software, M.G.; Investigation, M.G.; Resources, C.R. and C.B.; Writing-Original Draft Preparation, M.G.; Writing-Review & Editing, C.R and C.B.; Funding Acquisition, C.R and C.B. All authors have read and agreed to the published version of the manuscript.

Funding

This research was funded by Research Fund for Coal and Steel (RFCS) with grant agreement RFSR-CT-2015-00021.

Acknowledgments

The advice of Matos Silva, the technical director of Martifer Metallic Constructions for the development of Table 3 and Table 4 is gratefully acknowledged.

Conflicts of Interest

The authors declare no conflict of interest.

References

  1. Panwar, N.L.; Kaushik, S.C.; Kothari, S. Role of renewable energy sources in environmental protection: A review. Renew. Sustain. Energy Rev. 2011, 15, 1513–1524. [Google Scholar] [CrossRef]
  2. Global Wind Energy Council (GWEC). Wind in Numbers. Available online: http://gwec.net/ (accessed on 6 July 2020).
  3. Wind in Europe. European Statistical Data Support. Available online: https://windeurope.org/ (accessed on 6 July 2020).
  4. Ahmed, N.A.; Cameron, M. The challenges and possible solutions of horizontal axis wind turbines as a clean energy solution for the future. Renew. Sustain. Energy Rev. 2014, 38, 439–460. [Google Scholar] [CrossRef]
  5. Saad, M.M.M.; Mohd, S.B.; Zulkafli, M.F. Power generation of small wind turbine: Under high-speed operation. Sustain. Energy Technol. 2018, 26, 1–5. [Google Scholar] [CrossRef]
  6. Hand, B.; Cashman, A. A review on the historical development of the lift-type vertical axis wind turbine: From onshore to offshore floating application. Sustain. Energy Technol. 2020, 38, 100646. [Google Scholar] [CrossRef]
  7. Tziavos, N.I.; Hemida, H.; Metje, N.; Baniotopoulos, C. Non-linear finite element analysis of grouted connections for offshore monopile wind turbines. Ocean Eng. 2019, 171, 633–645. [Google Scholar] [CrossRef] [Green Version]
  8. Hu, Y.; Yang, J.; Baniotopoulos, C. Repowering Steel Tubular Wind Turbine Towers Enhancing them by Internal Stiffening Rings. Energies 2020, 13, 1538. [Google Scholar] [CrossRef] [Green Version]
  9. Martinez-Vazquez, P.; Gkantou, M.; Baniotopoulos, C. Strength and ductility demands on wind turbine towers due to earthquake and wind load. Proc. Inst. Civ. Eng.-Struct. Build. 2019, 172, 556–563. [Google Scholar] [CrossRef]
  10. Konstandakopoulou, D.; Papagiannopoulos, G.A.; Pnevmatikos, N.; Hatzigeorgiou, G.D. Seismic Hazard Assessment of Offshore Platforms. Int. J. Civ. Environ. Eng. 2019, 13, 272–276. [Google Scholar] [CrossRef]
  11. Konstandakopoulou, F.; Konstantinidou, M.; Pnevmatikos, N.; Hatzigeorgiou, G.D. Safety and performance of offshore platforms subjected to repeated earthquakes. Infrastructures 2020, 5, 38. [Google Scholar] [CrossRef] [Green Version]
  12. Moeini, R.; Tricoli, P.; Hemida, H.; Baniotopoulos, C. Increasing the reliability of wind turbines using condition monitoring of semiconductor devices: A review. IET Renew. Power Gener. 2017, 12, 182–189. [Google Scholar] [CrossRef]
  13. Franko, J.; Du, S.; Kallweit, S.; Duelberg, E.; Engemann, H. Design of a Multi-Robot System for Wind Turbine Maintenance. Energies 2020, 13, 2552. [Google Scholar] [CrossRef]
  14. Lagaros, N.D.; Karlaftis, M.G.; Paida, M.K. Stochastic life-cycle cost analysis of wind parks. Reliab. Eng. Syst. Saf. 2015, 144, 117–127. [Google Scholar] [CrossRef]
  15. Karpat, F. A virtual tool for minimum cost design of a wind turbine tower with ring stiffeners. Energies 2013, 6, 3822–3840. [Google Scholar] [CrossRef] [Green Version]
  16. Lerch, M.; De-Prada-Gil, M.; Molins, C.; Benveniste, G. Sensitivity analysis on the levelized cost of energy for floating offshore wind farms. Sustain. Energy Technol. 2018, 30, 77–90. [Google Scholar] [CrossRef]
  17. Jovašević, S.; Mohammadi, M.R.S.; Rebelo, C.; Pavlović, M.; Veljković, M. New Lattice-Tubular Tower for Onshore WEC–Part 1: Structural Optimization. Procedia Eng. 2017, 199, 3236–3241. [Google Scholar] [CrossRef]
  18. Jovasevic, S.; Correia, J.; Pavlovic, M.; Dantas, R.; Rebelo, C.; Veljkovic, M.; de Jesus, A.M. Alternative steel lattice structures for wind energy converters. Int. J. Struct. Integr. 2019. [Google Scholar] [CrossRef]
  19. Gkantou, M.; Martinez-Vazquez, P.; Baniotopoulos, C. On the structural response of a tall hybrid onshore wind turbine tower. Procedia Eng. 2017, 199, 3200–3205. [Google Scholar] [CrossRef]
  20. Farhan, M.; Mohammadi, M.R.S.; Correia, J.A.; Rebelo, C. Transition piece design for an onshore hybrid wind turbine with multiaxial fatigue life estimation. Wind Eng. 2018, 42, 286–303. [Google Scholar] [CrossRef]
  21. Mohammadi, M.R.S.; Richter, C.; Pak, D.; Rebelo, C.; Feldmann, M. Steel hybrid onshore wind towers installed with minimal effort: Development of lifting process. Wind Eng. 2018, 42, 335–352. [Google Scholar] [CrossRef]
  22. ISO 14040. Environmental Management-Life Cycle Assessment-Principles and Framework; International Organization for Standardization: Geneva, Switzerland, 2006. [Google Scholar]
  23. ISO 14044. Environmental Management-Life Cycle Assessment-Requirements and Guidelines; International Organization for Standardization: Geneva, Switzerland, 2006. [Google Scholar]
  24. Góralczyk, M. Life-cycle assessment in the renewable energy sector. Appl. Energy 2003, 75, 205–211. [Google Scholar] [CrossRef]
  25. Arvesen, A.; Hertwich, E.G. Assessing the life cycle environmental impacts of wind power: A review of present knowledge and research needs. Renew. Sustain. Energy Rev. 2012, 16, 5994–6006. [Google Scholar] [CrossRef] [Green Version]
  26. Fleck, B.; Huot, M. Comparative life-cycle assessment of a small wind turbine for residential off-grid use. Renew. Energy 2009, 34, 2688–2696. [Google Scholar] [CrossRef]
  27. Garrett, P.; Rønde, K. Life cycle assessment of wind power: Comprehensive results from a state-of-the-art approach. Int. J. Life Cycle Assess. 2013, 18, 37–48. [Google Scholar] [CrossRef]
  28. Lee, Y.M.; Tzeng, Y.E. Development and life-cycle inventory analysis of wind energy in Taiwan. J. Energy Eng. 2008, 134, 53–57. [Google Scholar] [CrossRef]
  29. Schleisner, L. Life cycle assessment of a wind farm and related externalities. Renew. Energy 2000, 20, 279–288. [Google Scholar] [CrossRef]
  30. Ardente, F.; Beccali, M.; Cellura, M.; Brano, V.L. Energy performances and life cycle assessment of an Italian wind farm. Renew. Sustain. Energy Rev. 2008, 12, 200–217. [Google Scholar] [CrossRef]
  31. Guezuraga, B.; Zauner, R.; Pölz, W. Life cycle assessment of two different 2 MW class wind turbines. Renew. Energy 2012, 37, 37–44. [Google Scholar] [CrossRef]
  32. Chipindula, J.; Botlaguduru, V.; Du, H.; Kommalapati, R.; Huque, Z. Life cycle environmental impact of onshore and offshore wind farms in Texas. Sustainability 2018, 10, 2022. [Google Scholar] [CrossRef] [Green Version]
  33. Martínez, E.; Sanz, F.; Pellegrini, S.; Jiménez, E.; Blanco, J. Life-cycle assessment of a 2-MW rated power wind turbine: CML method. Int. J. Life Cycle Assess. 2009, 14, 52. [Google Scholar] [CrossRef]
  34. Razdan, P.; Garrett, P. Life Cycle Assessment of Electricity Production from an Onshore V110-2.0 MW Wind Plant; Vestas Wind Systems: Aarhus, Denmark, 2015. [Google Scholar]
  35. Yang, J.; Chang, Y.; Zhang, L.; Hao, Y.; Yan, Q.; Wang, C. The life-cycle energy and environmental emissions of a typical offshore wind farm in China. J. Clean. Prod. 2018, 180, 316–324. [Google Scholar] [CrossRef]
  36. Vargas, A.V.; Zenón, E.; Oswald, U.; Islas, J.M.; Güereca, L.P.; Manzini, F.L. Life cycle assessment: A case study of two wind turbines used in Mexico. Appl. Therm. Eng. 2015, 75, 1210–1216. [Google Scholar] [CrossRef]
  37. Crawford, R.H. Life cycle energy and greenhouse emissions analysis of wind turbines and the effect of size on energy yield. Renew. Sustain. Energy Rev. 2009, 13, 2653–2660. [Google Scholar] [CrossRef]
  38. Smoucha, E.A.; Fitzpatrick, K.; Buckingham, S.; Knox, O.G. Life cycle analysis of the embodied carbon emissions from 14 wind turbines with rated powers between 50KW and 3.4 MW. J. Fund. Renew. Energy Appl. 2016, 6, 1000211. [Google Scholar] [CrossRef]
  39. Xu, L.; Pang, M.; Zhang, L.; Poganietz, W.R.; Marathe, S.D. Life cycle assessment of onshore wind power systems in China. Resour. Conserv. Recycl. 2018, 132, 361–368. [Google Scholar] [CrossRef]
  40. Schreiber, A.; Marx, J.; Zapp, P. Comparative life cycle assessment of electricity generation by different wind turbine types. J. Clean. Prod. 2019, 233, 561–572. [Google Scholar] [CrossRef]
  41. Tremeac, B.; Meunier, F. Life cycle analysis of 4.5 MW and 250W wind turbines. Renew. Sustain. Energy Rev. 2009, 13, 2104–2110. [Google Scholar] [CrossRef]
  42. Bonou, A.; Laurent, A.; Olsen, S.I. Life cycle assessment of onshore and offshore wind energy-from theory to application. Appl. Energy 2016, 180, 327–337. [Google Scholar] [CrossRef] [Green Version]
  43. Demir, N.; Taşkın, A. Life cycle assessment of wind turbines in Pınarbaşı-Kayseri. J. Clean. Prod. 2013, 54, 253–263. [Google Scholar] [CrossRef]
  44. Oebels, K.B.; Pacca, S. Life cycle assessment of an onshore wind farm located at the northeastern coast of Brazil. Renew. Energy 2013, 53, 60–70. [Google Scholar] [CrossRef]
  45. Gervásio, H.; Rebelo, C.; Moura, A.; Veljkovic, M.; da Silva, L.S. Comparative life cycle assessment of tubular wind towers and foundations–Part 2: Life cycle analysis. Eng. Struct. 2014, 74, 292–299. [Google Scholar] [CrossRef]
  46. Martínez, E.; Sanz, F.; Pellegrini, S.; Jiménez, E.; Blanco, J. Life cycle assessment of a multi-megawatt wind turbine. Renew. Energy 2009, 34, 667–673. [Google Scholar] [CrossRef]
  47. Jonkman, J.; Butterfield, S.; Musial, W.; Scott, G. Definition of a 5-MW Reference Wind Turbine for Offshore System Development; No. NREL/TP-500-38060; National Renewable Energy Lab. (NREL): Golden, CO, USA, 2009. [Google Scholar]
  48. Ancona, D.; McVeigh, J. Wind turbine-materials and manufacturing fact sheet. In Princeton Energy Resources International for the Office of Industrial Technologies; LLC: Washington, DC, USA, 2001. [Google Scholar]
  49. Martifer. Available online: https://www.martifer.pt/en (accessed on 6 July 2020).
  50. GEMIS. Global Emission Model for Integrated Systems; Version 5.0; Öko-Institut: Freiburg, Germany, 2019; Available online: http://iinas.org/gemis.html (accessed on 6 July 2020).
Figure 1. Flowchart of adopted methodology.
Energies 13 03950 g001
Figure 2. Case studies considered for LCA (dimensions in mm). (a) A 6-legged tower, (b) A 4-legged tower.
Energies 13 03950 g002aEnergies 13 03950 g002b
Figure 3. Transition piece (dimensions in mm). (a) A 6-legged tower, (b) A 4-legged tower.
Energies 13 03950 g003
Figure 4. System boundary for LCA of hybrid steel wind turbine towers.
Energies 13 03950 g004
Figure 5. Mass distribution of the towers studied. (a) mass distribution, (b) tower mass distribution.
Energies 13 03950 g005
Figure 6. Contribution of each life cycle stage. (a) 6-legged, (b) 4-legged.
Energies 13 03950 g006
Figure 7. Contribution of each component. (a) 6-legged, (b) 4-legged.
Energies 13 03950 g007
Figure 8. Comparison of hybrid 185 m towers with 105 m tower from [31] and 150 m towers from [45].
Energies 13 03950 g008
Table 1. Past studies on LCA of onshore wind turbine towers.
PublicationTower Type Height (m)Size (MW)LocationSoftwareMain Conclusions
Garrett and Rønde [27]steel tube-2.0DenmarkGabiThe wind plant produces energy to society 22 to 30 times more than what it consumes
Lee and Tzeng [28]steel tube45, 46, 600.66, 0.60, 1.75Taiwan-Outstanding EPT (1.3 months) compared to literature data (6–8 months)
Schleisner [29]steel tube40.50.5Denmark-Material production and manufacturing procedure have the largest contributions to the total emissions
Ardente et al. [30]steel tube550.66Italy-Largest impact due to manufacturing of wind turbines and building works
Guezuraga et al. [31]steel tube105, 651.8, 2.0AustriaGEMISLargest contribution of energy requirement during the manufacturing phase
Chipindula et al. [32]steel tube901, 2, 2.3US, TexasSimaProThe installation and operation stages contributed very little to the total emissions
Martínez et al. [33]steel tube702.0-SimaPro Copper in the nacelle and fiberglass in the rotor are some of the components with high contributions
Razdan and Garrett [34]steel tube802.0-Gabi 7 dfx The use of iron, steel, aluminium and concrete are the primary contributors to environmental impacts
Yang et al. [35]steel tube90, 1003.6, 5.0China-LCA footprints were dominated by wind turbine manufacturing and materials for the foundation
Vargas et al. [36]steel tube-2.0MexicoSimaPro Major environmental impacts due to tower and nacelle
Crawford [37]steel tube60, 800.85, 3.0Australia-No significant variation in the energy yield between small and large wind turbines
Smoucha et al. [38]steel tube-0.05÷3.4UK-Installation of higher-rated over lower-rated turbines allows for greater environmental benefits
Xu et al. [39]Steel tube700.75, 1.5ChinaGabi 6Optimising the structural design and raw materials application can improve environmental performance
Schreiber et al. [40]steel tube843GermanyGabiReplacement of material components can affect the impacts
Tremeac and Meunier [41]concrete1244.50, 0.25FranceSimaProImportant to minimise components transportation and maximise recycling during decommissioning
Bonou et al. [42]steel tube92.52.3, 3.2North America SimaProEPT was less than year, whilst end-of-life treatments can enhance the LCA performance
Demir and Taskin [43]steel tube50, 80, 1002.05, 3.2PakistanGabi 4Wind turbines with high hub heights (i.e., installed in optimum wind speed regions) decreased environmental impacts
Oebels and Pacca [44]concrete, steel tube801.423Germany
Denmark China
-Steel tower had the largest contribution (over 50%) to total carbon emissions
Gervásio et al. [45]concrete, steel, composite80, 100, 1502.0, 3.6, 5.0EuropeGabi Reuse of materials in steel towers improves the environmental performance
Martínez et al. [46]steel tube702.0-SimaProOwing its recycling properties, steel is suggested for towers with increased hub heights and larger rotor blades
Table 2. Components and materials of a wind turbine tower.
ComponentMaterials
TowerLattice part: steel
Tubular part: steel
Transition piece: steel
Connections: steel
RotorHub: cast iron, glass fibre, epoxy
Blades: glass fibre and epoxy (95%), steel (5%)
NacelleGearbox: steel (98%), aluminium (1%), copper (1%)
Generator: steel (65%), copper (35%)
Frame, Machinery, Shell: steel (85%), aluminium (9%), copper (4%), glass reinforced plastic (3%)
FoundationConcrete
Steel reinforcement bars
Table 3. Estimated number of trucks for 20 year life cycle.
ComponentNumber of TrucksType of Truck
Lattice part of tower3315 ton15 ton truck
Energies 13 03950 i001
Tubular part of tower3special
Transition piece315 ton
Bolts115 ton
Concrete90concrete mixer
Reinforcement bars815 tonSpecial truck
Energies 13 03950 i002
Rotor4special
Nacelle4special
Equipment for RNA515 ton
Crawler crane - body5special
Crawler crane1515 tonConcrete mixer
Energies 13 03950 i003
Total number of trucks (per type)90concrete mixer
6515 ton
16special
Total number of trucks (all types)171--
Table 4. Description of the erection process—time estimation.
DescriptionDurationCranePersonnel
Step 1: Assembling the lattice part
Divide the lattice part to units 1–5 and assemble them on site, close to the erection point.6 weeks1 × 150 ton crane10 persons
Step 2: Building the lattice tower and the tubular part
Assemble in turn the lattice and the tubular part, with the following order
unit 1 of lattice & unit 1 of tubular
unit 2 of lattice & unit 2 of tubular
unit 3 of lattice & unit 3 of tubular
unit 4 of lattice & unit 5 of lattice
2 weeks1 × 150 ton crane
1 × 750 ton crawler crane
10 persons
Step 3: Lifting the tubular part
Install strand jacks and unit 6 of the lattice part.
Install strand carousel and lift the tubular part.
1 week1 × 150 ton crane
1 × 750 ton crawler crane
10 persons
Step 4: RNA installation
Install the nacelle and the rotor with blades.1 week1 × 150 ton crane
1 × 750 ton crawler crane
10 persons
Total estimated time needed for erection: 10 weeks
Table 5. Data collection—LCI.
ComponentStageDescriptionUnit6-Legged4-Legged
Quantities
TowerManufacturelattice part (steel) ton469.45305.91
TowerManufacturetubular part (steel)ton165.63165.63
TowerManufacturetransition piece (steel)ton144.81165.64
TowerManufacture connectionston6.539.47
RotorManufactureglass fibre & epoxy ton53.2253.22
RotorManufacturecast ironton56.7856.78
NacelleManufacturesteel ton197.60197.60
NacelleManufacturealuminiumton8.008.00
NacelleManufacturecopper ton32.0032.00
NacelleManufactureglass reinforce plastic ton2.402.40
FoundationManufactureconcrete ton2160.002160.00
FoundationManufactureSteel reinforcement barston69.3069.30
TowerTransporttrucktkm108,641.5664,370.53
RotorTransporttrucktkm11,000.0011,000.00
NacelleTransporttrucktkm31,500.0024,000.00
FoundationTransporttrucktkm222,930.00222,930.00
TowerErectioncraneh105.60105.60
RotorErectioncraneh7.927.92
NacelleErectioncraneh7.927.92
FoundationErectioncraneh10.5610.56
TowerOperationtrucktkm652.66946.96
TowerDisposallandfillton117.9695.58
RotorDisposallandfillton8.528.52
RotorDisposalincineratorton26.6126.61
NacelleDisposallandfillton35.6435.64
NacelleDisposalincineratorton1.201.20
FoundationDisposallandfillton2170.402170.40
TowerDisposaltransport totkm2359.251911.54
RotorDisposaltransport totkm170.34170.34
RotorDisposaltransport totkm532.20532.20
NacelleDisposaltransport totkm712.80712.80
NacelleDisposaltransport totkm24.0024.00
FoundationDisposaltransport totkm43,407.9043,407.90
Table 6. Summary of results.
LCA ResultsUnit6-Legged4-Legged
ADGWh5.535.11
GWPtonnes CO2-eq2065.151923.95
EPTmonths6.486.09
Table 7. LCA results per component and per stage.
Case Study6-Legged4-Legged
ComponentAD
(GWh)
GWP
(tonnes CO2-eq)
AD
(GWh)
GWP
(tonnes CO2-eq)
Tower2.971072.292.55905.51
Rotor0.68193.420.68193.42
Nacelle0.90312.550.90312.55
Foundation0.99490.900.99490.90
Stage
Manufacture4.421748.254.011585.66
Transport0.1234.500.1129.72
Erection0.54145.630.54145.63
Operation0.1644.190.2566.28
Disposal0.2792.580.2896.65
Table 8. Comparison with the literature data.
ReferenceTower Height (m)Turbine Size (MW)GWP
(g CO2-eq/kWh)
EPT (months)
Garrett and Rønde [27]80289
Martínez et al. [33]7026.584.8
Tremeac and Meunier [41]1244.515.86.96
Bonou et al. [42]99.52.366.2
Demir and Taskin [43]803.0223.7722.5
Hybrid towers [herein]18559.62, 10.336.09, 6.48

