Article

U.S. Greenhouse Gas Emission Bottlenecks: Prioritization of Targets for Climate Liability

by
Alexis S. Pascaris
1 and
Joshua M. Pearce
1,2,*
1
Environmental & Energy Policy, Michigan Technological University, Houghton, MI 4993, USA
2
Department of Material Science & Engineering and Department of Electrical & Computer Engineering, Michigan Technological University, Houghton, MI 49931, USA
*
Author to whom correspondence should be addressed.
Energies 2020, 13(15), 3932; https://doi.org/10.3390/en13153932
Submission received: 18 June 2020 / Revised: 16 July 2020 / Accepted: 30 July 2020 / Published: 1 August 2020
(This article belongs to the Special Issue Climate Policy and Negative Emissions Technologies)

Abstract

:
Due to market failures that allow uncompensated negative externalities from burning fossil fuels, there has been a growing call for climate change-related litigation targeting polluting companies. To determine the most intensive carbon dioxide (CO2)-emitting facilities in order prioritize liability for climate lawsuits, and risk mitigation strategies for identified companies as well as their insurers and investors, two methods are compared: (1) the conventional point-source method and (2) the proposed bottleneck method, which considers all emissions that a facility enables rather than only what it emits. Results indicate that the top ten CO2 emission bottlenecks in the U.S. are predominantly oil (47%) and natural gas (44%) pipelines. Compared to traditional point-source emissions methods, this study has demonstrated that a comprehensive bottleneck calculation is more effective. By employing an all-inclusive approach to calculating a polluting entity’s CO2 emissions, legal actions may be more accurately focused on major polluters, and these companies may preemptively mitigate their pollution to curb vulnerability to litigation and risk. The bottleneck methodology reveals the discrete link in the chain of the fossil-fuel lifecycle that is responsible for the largest amount of emissions, enabling informed climate change mitigation and risk management efforts.

1. Introduction

Global greenhouse gas (GHG) emissions and global atmospheric carbon dioxide (CO2) concentration continue to increase because of fossil fuel combustion despite repeated warnings about the resultant “dangerous” climate change from climate scientists [1,2]. Anthropogenic global climate destabilization is scientifically established with a 95% confidence [3] as are the detrimental repercussions on our environment, social, and economic systems [4,5]. The impacts of anthropogenic climate change include, but are not limited to: (i) increased temperatures and the resultant heat waves, which cause thousands of human deaths [6,7,8], (ii) increased rate of crop failures [9,10], which worsens the existing socially-constructed global hunger and starvation [11,12,13], (iii) electric grid failures and power outages [14,15], (iv) droughts [16,17,18], (v) increased fire severity and frequency [19,20,21], and (vi) sea level rise and the resultant submersion of low-lying coastal and shoreline erosion [22,23], saltwater intrusion [23,24], storm damage to coast lines and exacerbated flood risks [25,26,27,28].
The negative externalities of burning fossil fuels represent a market failure that has seen a growing call to be rectified using litigation in part because of the political interference from the companies that profit from polluting [29,30,31,32,33,34,35,36,37,38,39,40,41]. Emissions liability is a business risk [31,32,36,39,40]. Most work in this area focuses on quantifying the harm done by polluters in order to compensate the people, businesses [35], or governments [34,38,41] that have been or will be harmed in the future [29,30,33,37]. Authors argue that the victims that are losing the most due to climate change should be put in top priority for compensation [34]. Similarly, targets for litigation are chosen based on who did the wrong or benefited from it. For example, Farber [37] has shown that both Americans’ ancestors and those currently living in U.S. are responsible for past GHG emissions resulting in climate change due to the current profit they enjoy from having developed with uncontrolled emissions. However, what is less clear is how climate related litigation should be strategically advanced if the goal of the litigation is to prevent future harm by shutting down current GHG emitters rather than simply compensating existing victims.
How should environmental organizations and others trying to protect people and the planet decide who are the most critical polluters to target for climate-related lawsuits? For example, an enormous amount of attention and effort has been focused on stopping the Keystone XL Pipeline [42,43,44,45], but would the magnitude of the emissions associated with this pipeline warrant the effort- or should lawsuits be focused elsewhere? In order to answer these questions quantitatively, this article presents an open and transparent methodology for prioritizing climate lawsuits based on an individual facility’s ability to act as a bottleneck for GHG emissions.

2. Materials and Methods

In order to make this method reproducible while still being reliable, only publically-available data was used. This included data from two U.S. Government Databases: (i) Environmental Protection Agency (EPA) Facility Level Information on GHG Tool (FLIGHT) [46], and (ii) Energy Information Administration (EIA) Coal Data Browser [47] and Liquids Pipeline Projects Database [48], and supplemental data regarding oil pipelines from Enbridge’s Energy Infrastructure Assets Report [49]. To determine the most intensive carbon-emitting facilities in order to prioritize liability for climate lawsuits two methods were used and compared: (1) the conventional point source method and (2) the proposed bottleneck method:

2.1. Methodology for Computing Point-Source CO2 Emissions

(1)
GHG emitters were catalogued as one of eight sub-classes divided both by fossil fuel source (coal, oil—petroleum and natural gas) and lifecycle entity (extraction, transport, end use/product sale) as shown in Table 1.
(2)
The FLIGHT database [46] was filtered to isolate fuel type and to identify entities producing the highest level of CO2 emissions, delimiting the data to the ten largest facilities per sub-class. Of the eight sub-classes, point-source data for six sub-classes were explicitly available through the FLIGHT tool. Coal extraction and oil transport point-source emissions data are not provided. The values for these processes are dwarfed by the emissions from burning the fossil fuels and are thus considered negligible and not included here.
(3)
Checked top emitting facilities on their public website, identified headquarter location, and confirmed magnitude of enterprise.

2.2. Methodology for Computing CO2 Emission Bottlenecks

(1)
GHG emitters were catalogued as one of eight sub-classes divided both by fossil fuel source (coal, oil-petroleum and natural gas) and lifecycle entity (extraction, transport, end use/product sale) as shown in Table 1.
(2)
The FLIGHT database [46] was filtered to isolate fuel type and to identify entities producing the highest level of CO2 emissions, delimiting the data to the 10 largest facilities per sub-class. In order to explicitly report resource throughput for each facility for calculation of bottleneck potential:
(a)
Coal extraction data were derived from the EIA Coal Data Browser [47].
(b)
Oil and natural gas wells annual production values were derived from the GHG Summary Report provided for each top-emitting facility through the FLIGHT tool [46].
(c)
Oil pipeline and refinery capacity data were derived from the Liquids Pipeline Projects Database provided by EIA [49], Enbridge’s Energy Infrastructure Assets Report [49], and each facility’s corporate website.
(d)
Natural gas pipeline capacity and power plant data were derived from the GHG Summary Report provided for each top-emitting facility through the FLIGHT tool [46].
(3)
The EPA GHG Equivalencies Calculator was used to calculate bottleneck emissions per facility, deriving potential annual CO2 emissions based on conversion from resource capacity. Considering that the resource capacity of power plant facilities (coal and natural gas) inherently reflect its emitting capacity, bottleneck emissions are assumed to be equivalent to point-source emissions for these two end-uses.
(a)
Point-source CO2 emission data per facility is provided directly by the FLIGHT tool [46].
(4)
Top emitting facilities were confirmed using information on their public website, identified headquarter location, and confirmed magnitude of enterprise.
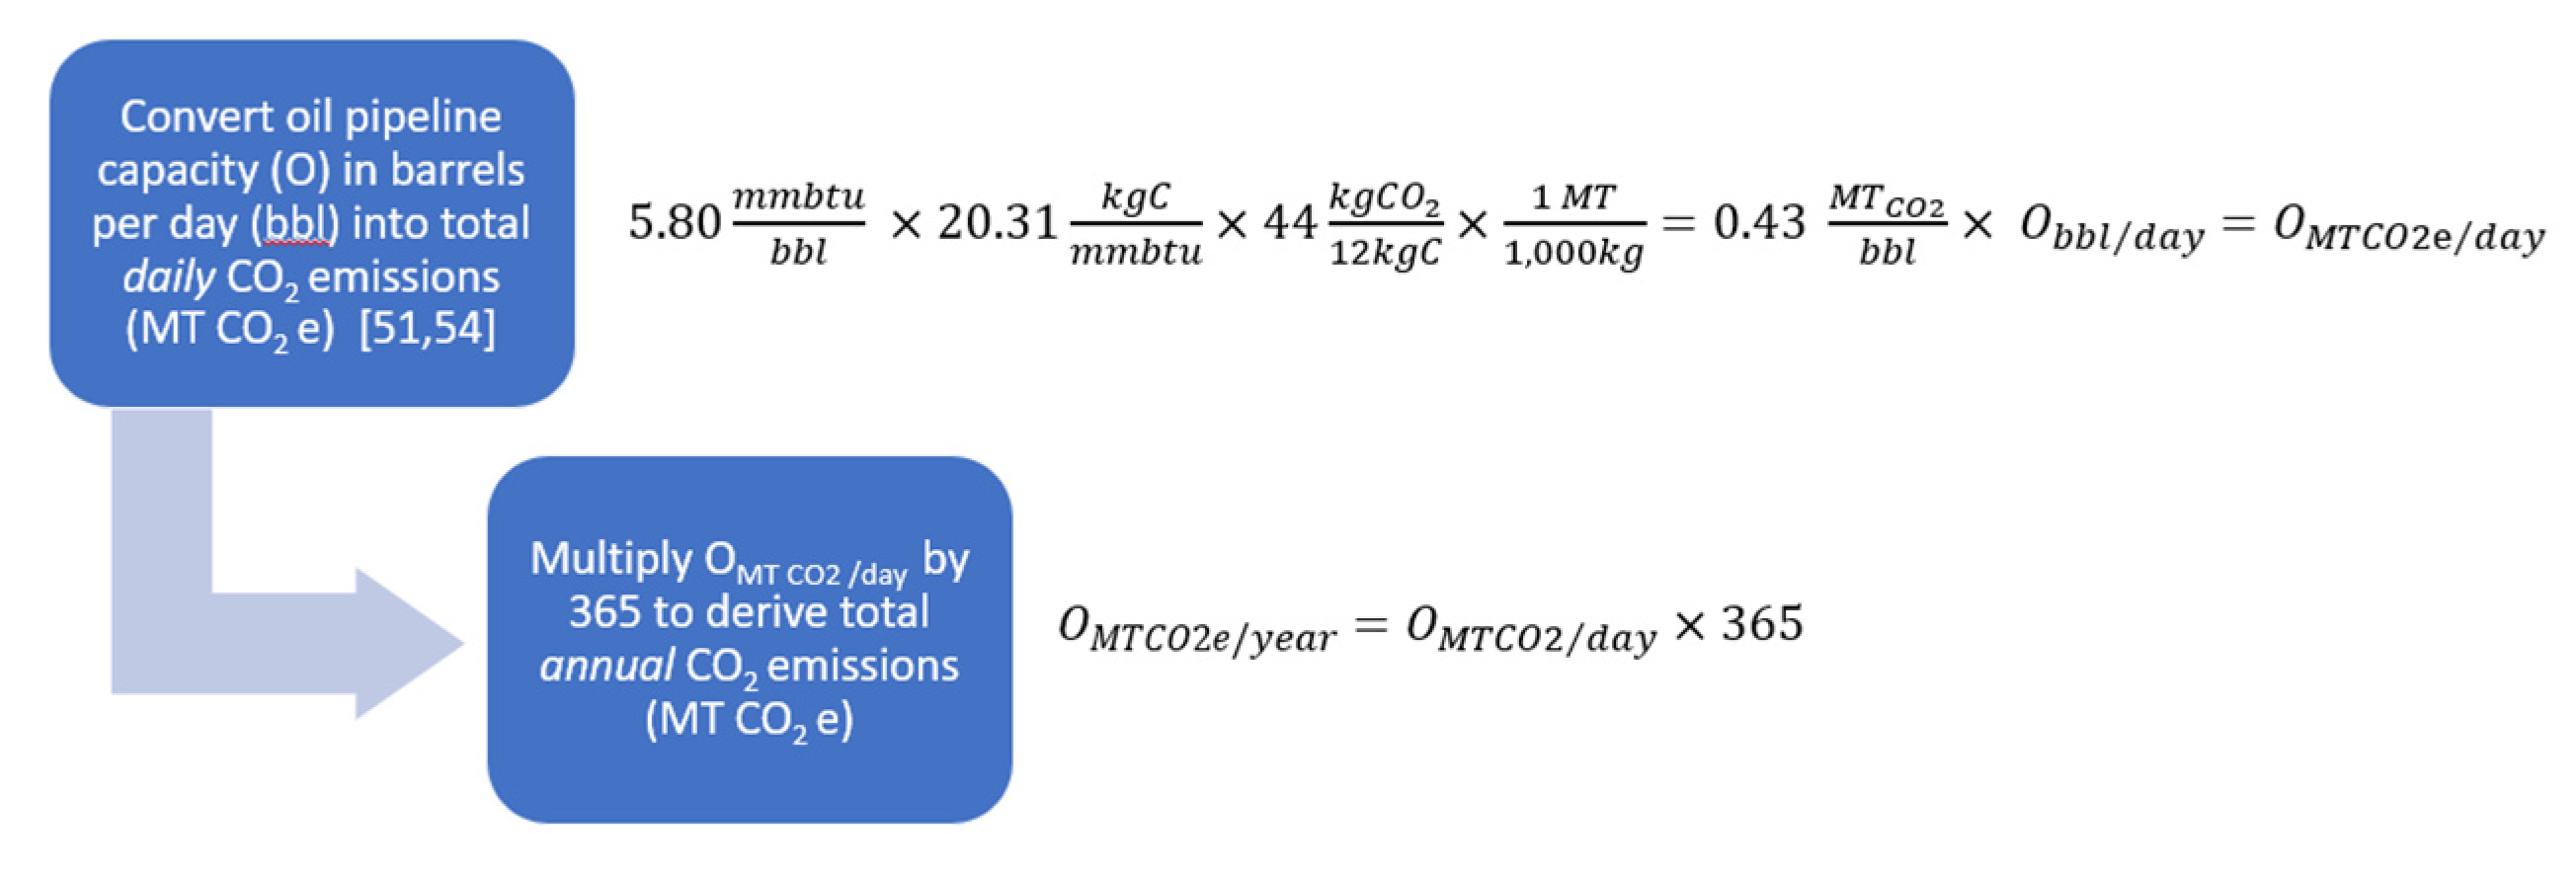
Figure 1, Figure 2 and Figure 3 explain the steps that were used to convert each facility’s resource capacity to potential emissions to determine the magnitude of the bottleneck for coal, oil and natural gas, respectively [50,51,52,53]. The full explanation and equations can be found in Appendix A.1: Methods [50,51,52,53].
It should be pointed out that the EPA GHG Equivalencies Calculator warns that due to rounding, calculations performed using the above equations may not return exact results.

3. Results

3.1. Point-Source Carbon Emissions

Discrete point-source emissions data for six of the eight sub-classes were provided by EPA’s FLIGHT tool [46]. Coal extraction and oil pipeline point-source emissions data were not provided and were thus ignored as is common in conventional studies of fossil fuel emissions.
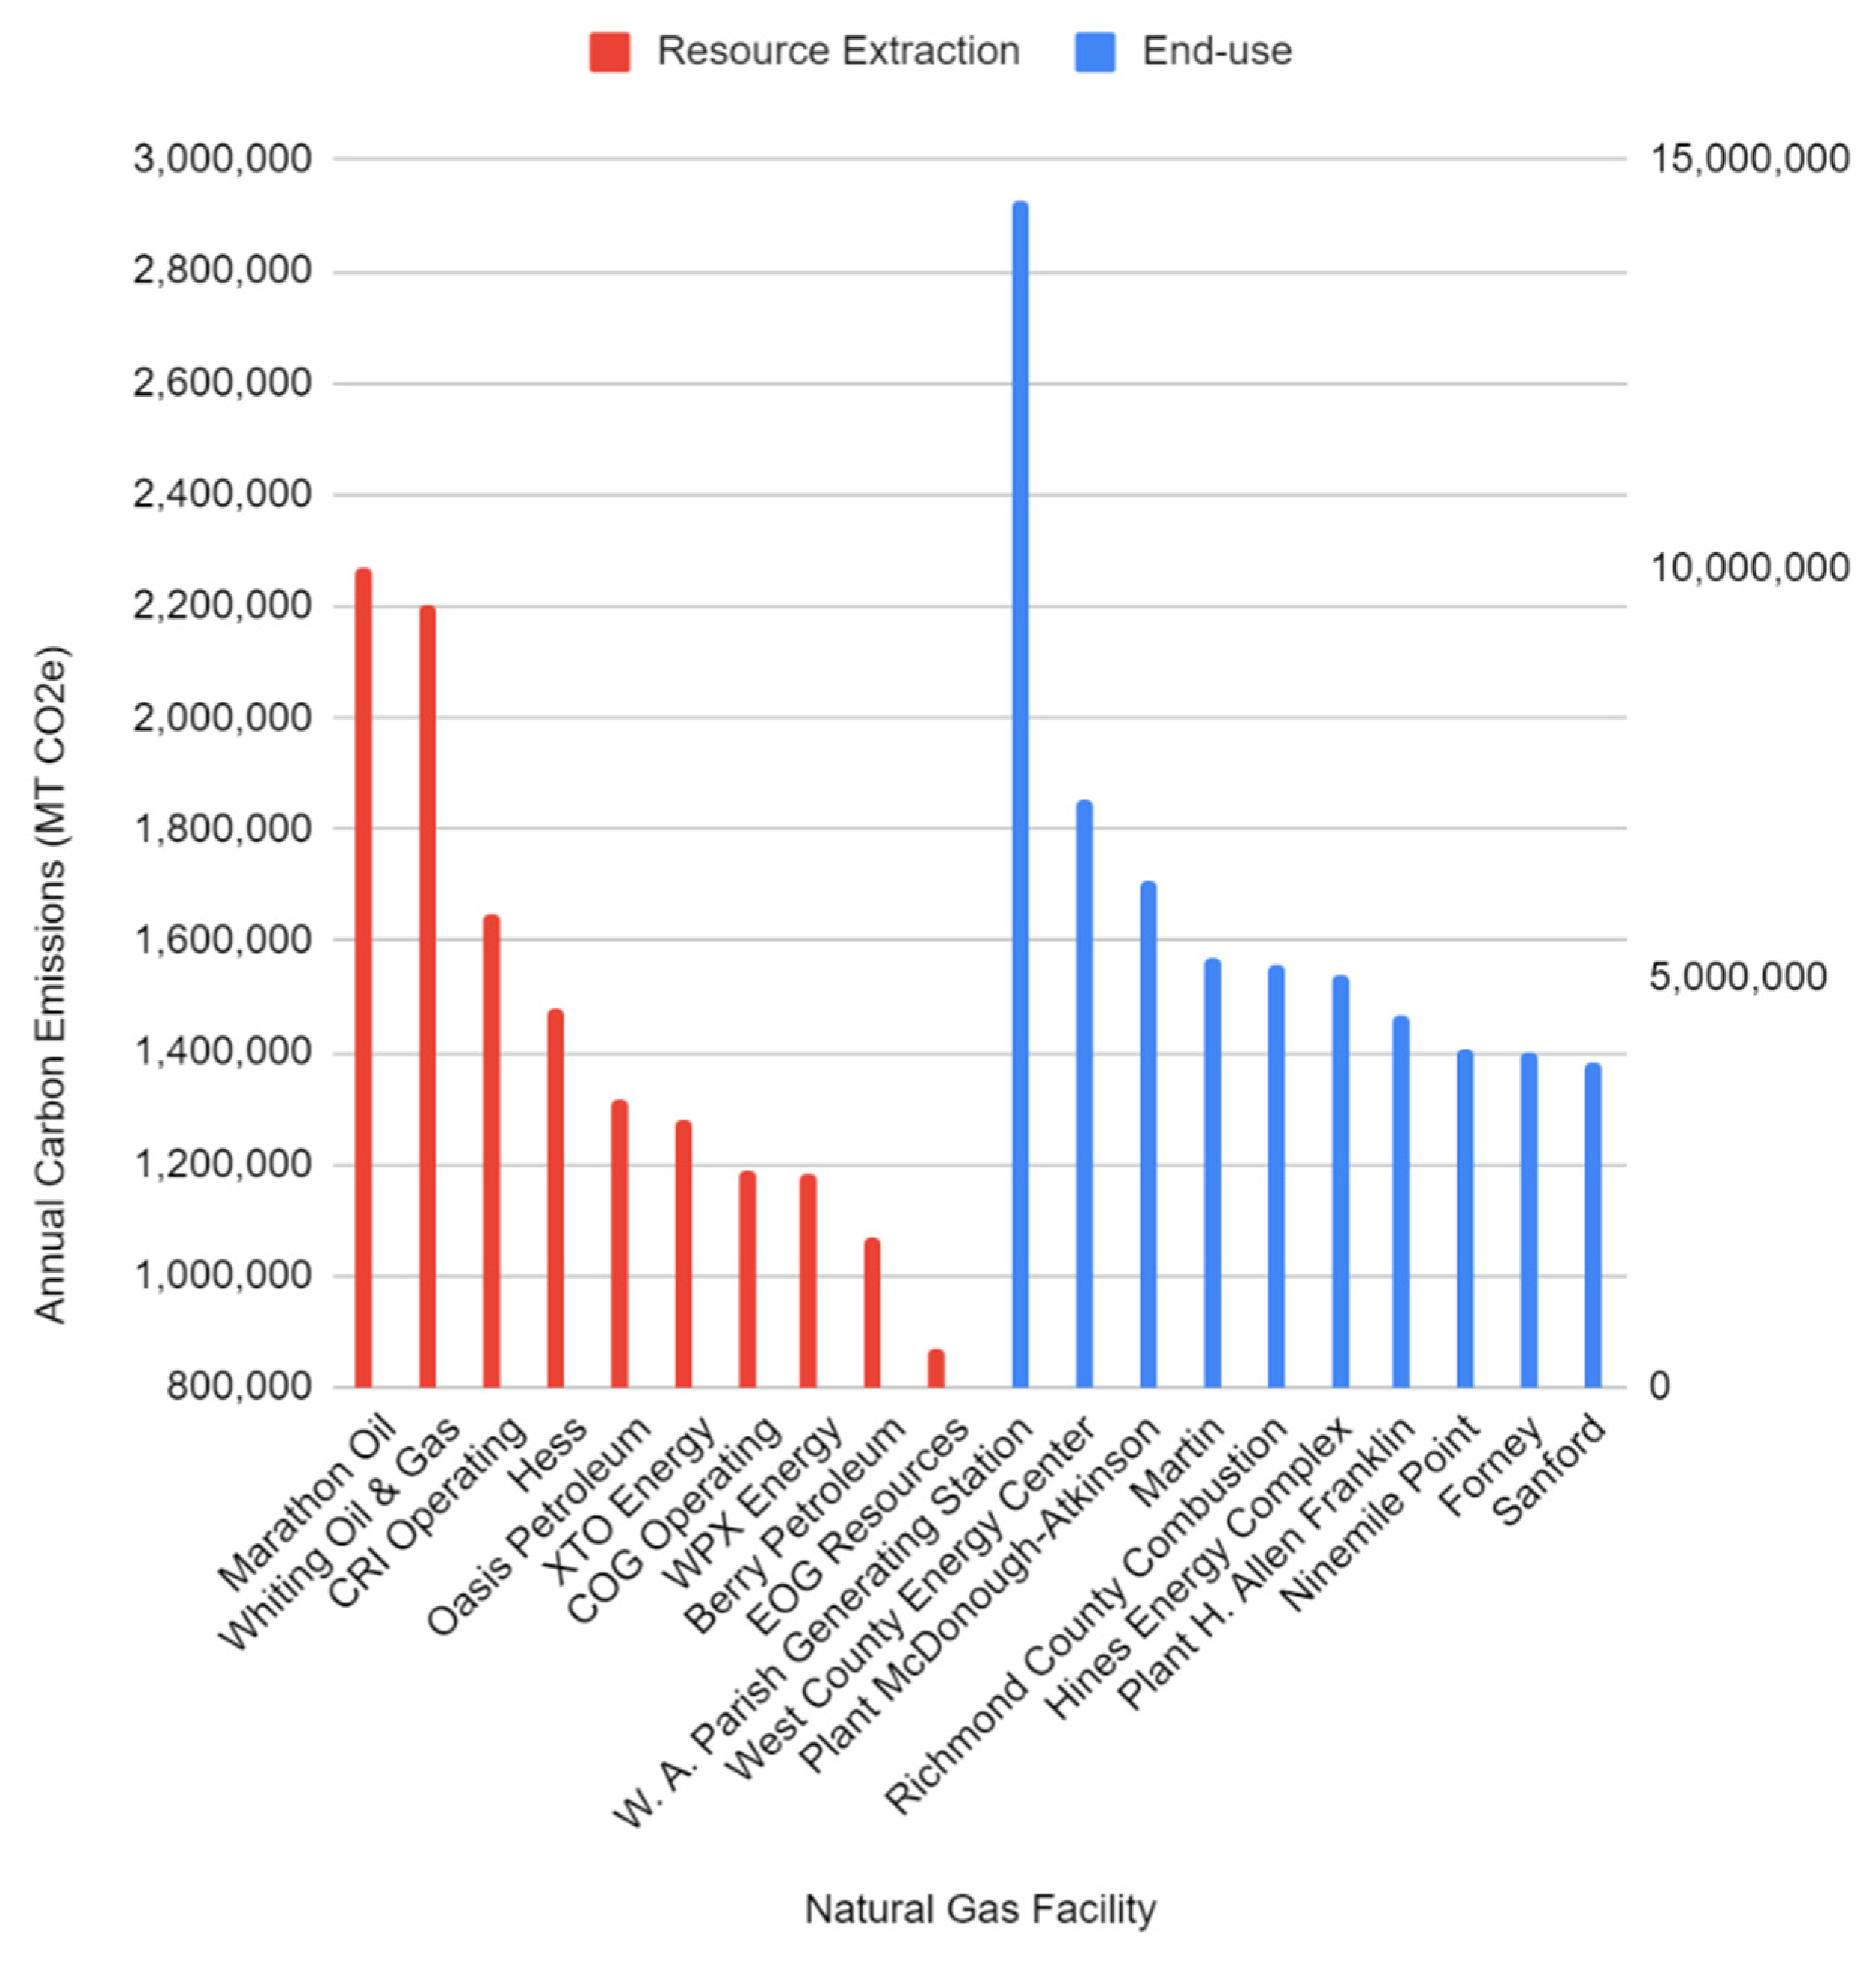
Assessing an entity’s pollution liability based solely on point-source emissions is inadequate as it does not take into account the ability of that entity to enable further emissions beyond those which originate on-site. Attempting to strategically reduce CO2 emissions, this study argues that a comprehensive calculation of an entity’s entire bottleneck capacity, or resource throughput, is obligatory to reflect its true magnitude. To demonstrate the distinguishing importance between point-source and bottleneck calculations, all point-source data are provided in Figure 4, Figure 5, Figure 6, Figure 7, Figure 8 and Figure 9 (The numerical values are shown in Tables for all chart-based Figures in Appendix A.2) for comparison against the bottleneck emissions.
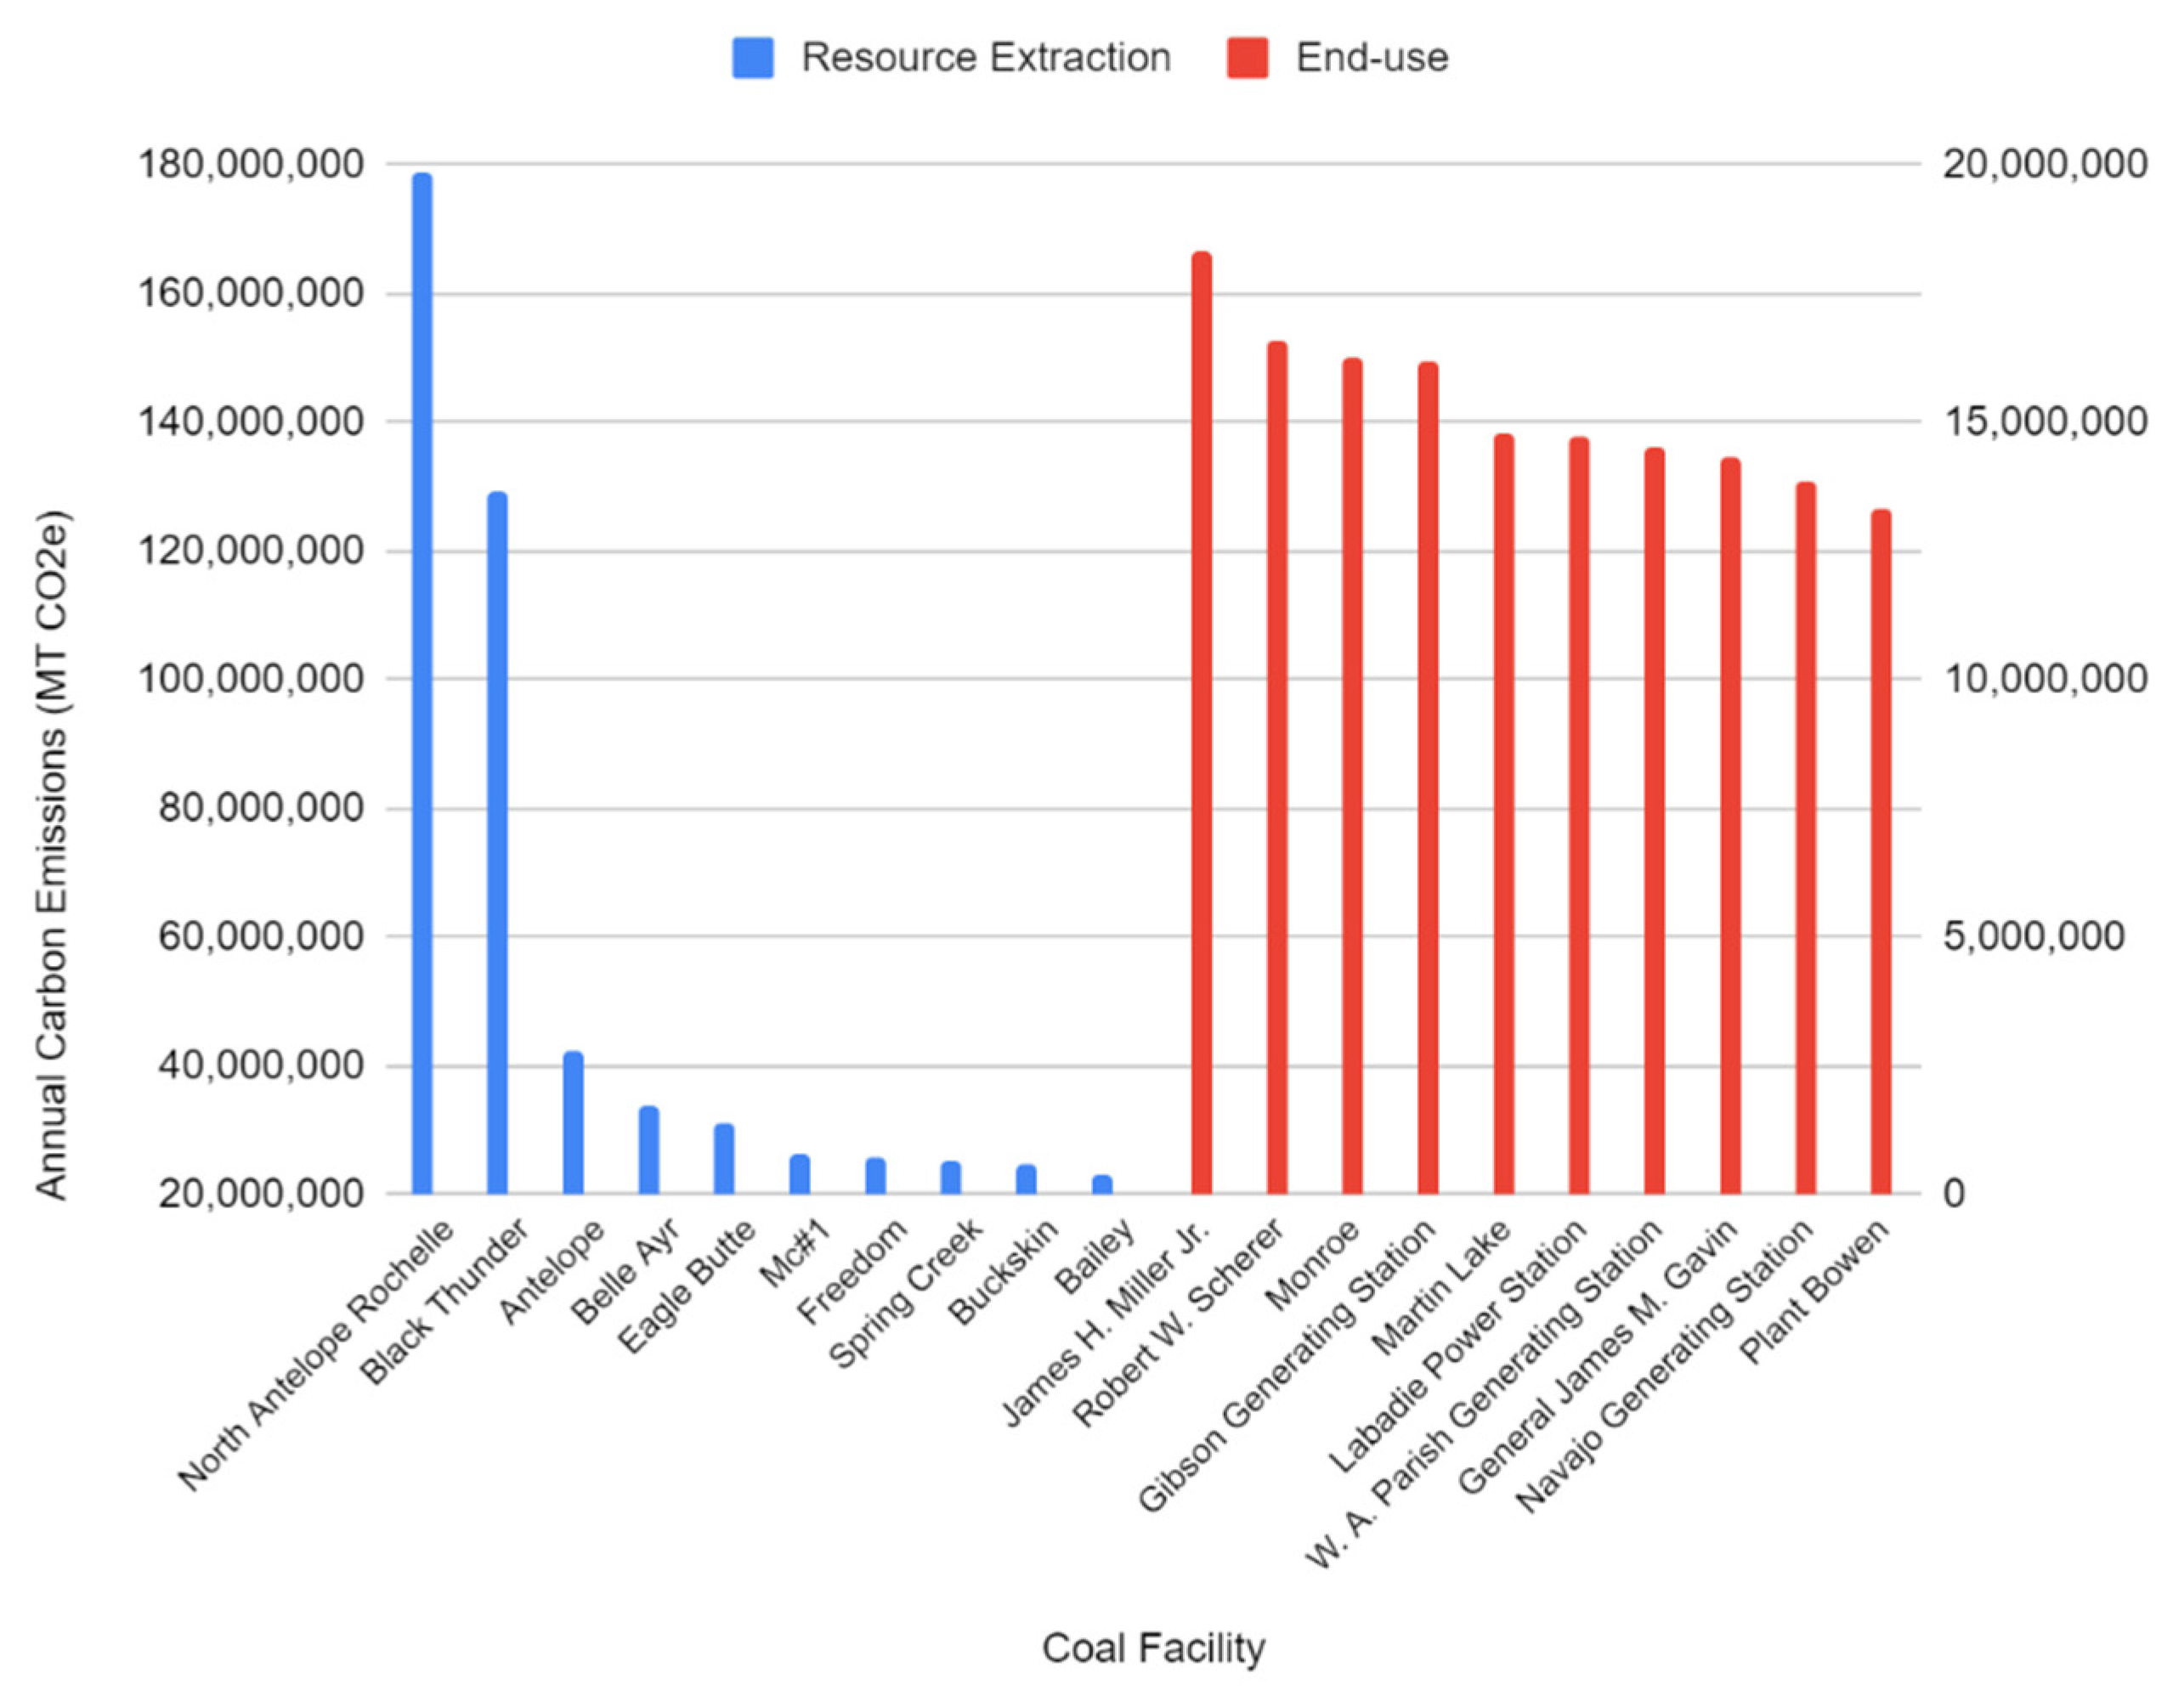
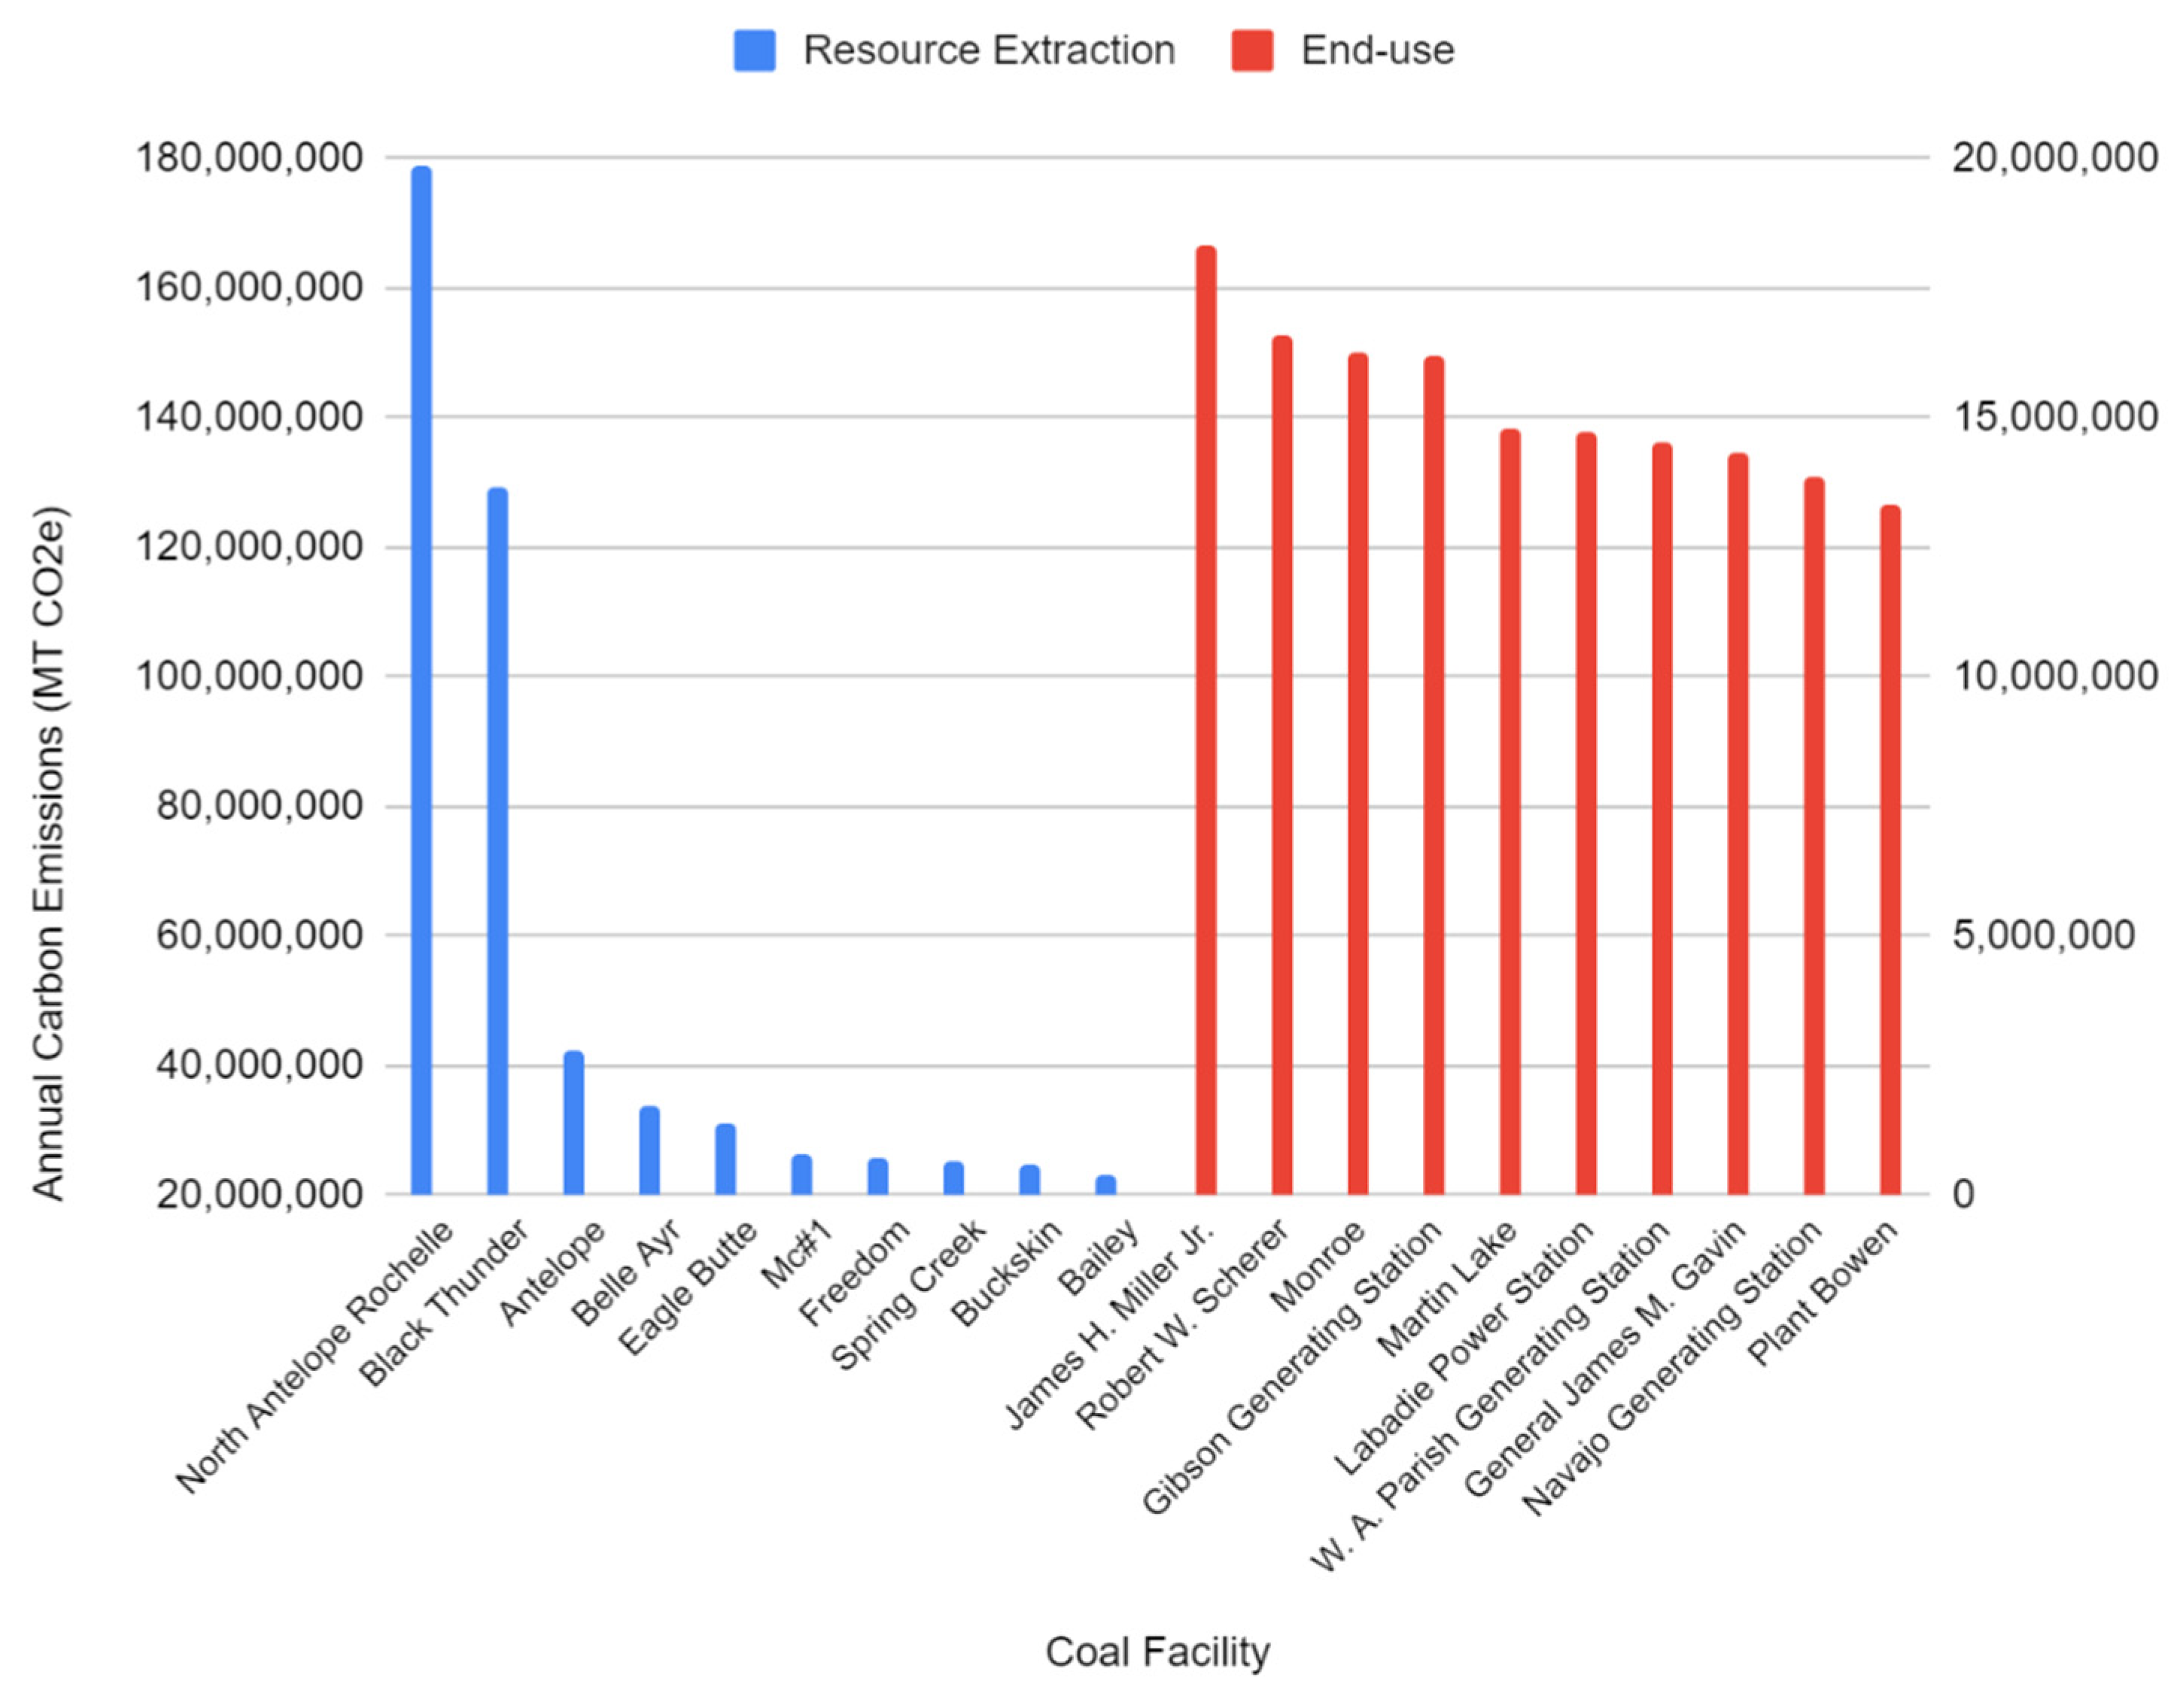
The highest emitting coal extraction facility (North Antelope Rochelle Mine) directly and indirectly produces approximately 9.8 times more MT CO2e per year than the leading coal-fired power plant (James H. Miller Jr.). When comparing between resource extraction and end-use sectors, 78% of the total coal industry emissions can be attributed to bottlenecks in coal mining. The bottleneck calculations for coal extraction facilities are based on the assumption that all of the coal mined from a facility will eventually be combusted for end-use. Thus, the annual pounds of coal produced per year by each coal extraction facility was directly converted into MT CO2e per year to reflect the fact that the extraction of coal is the fundamental activity that eventually leads to coal combustion and CO2 emissions. The end-use calculations (for both coal and natural gas) are directly provided by the EPA database [46] and solely reflect the point-source pollution emitted at the power plant location, which is considered equivalent to a facility’s bottleneck capacity. In comparison, the former calculation is inclusive of all downstream emissions, whereas the latter is a discrete determination of annual MT CO2e emitted by a single activity.
For coal industry calculations, transportation between extraction and end-use is not included. This activity was deliberately omitted to eschew the lack of distinct and transparent data sources. Coal shipping information is provided by the EIA Coal Data Browser [47] and Liquids Pipeline Projects Database [48] yet it is presented in such a way that does not lend itself to definitive calculation of transportation dynamics and CO2 emissions. The origin of coal is made anonymous, and the final destinations of the product exceed more than ten facilities per origin, which effectively complicates the ability to follow the resource from its extraction to its end-use with clarity and confidence. Consequently, the complexity of the coal transportation system, characterized by numerous railway routes and ambiguous data, has precluded its incorporation into this study although the many routes redundant transportation routes and modes indicate it is unlikely to represent a bottleneck.
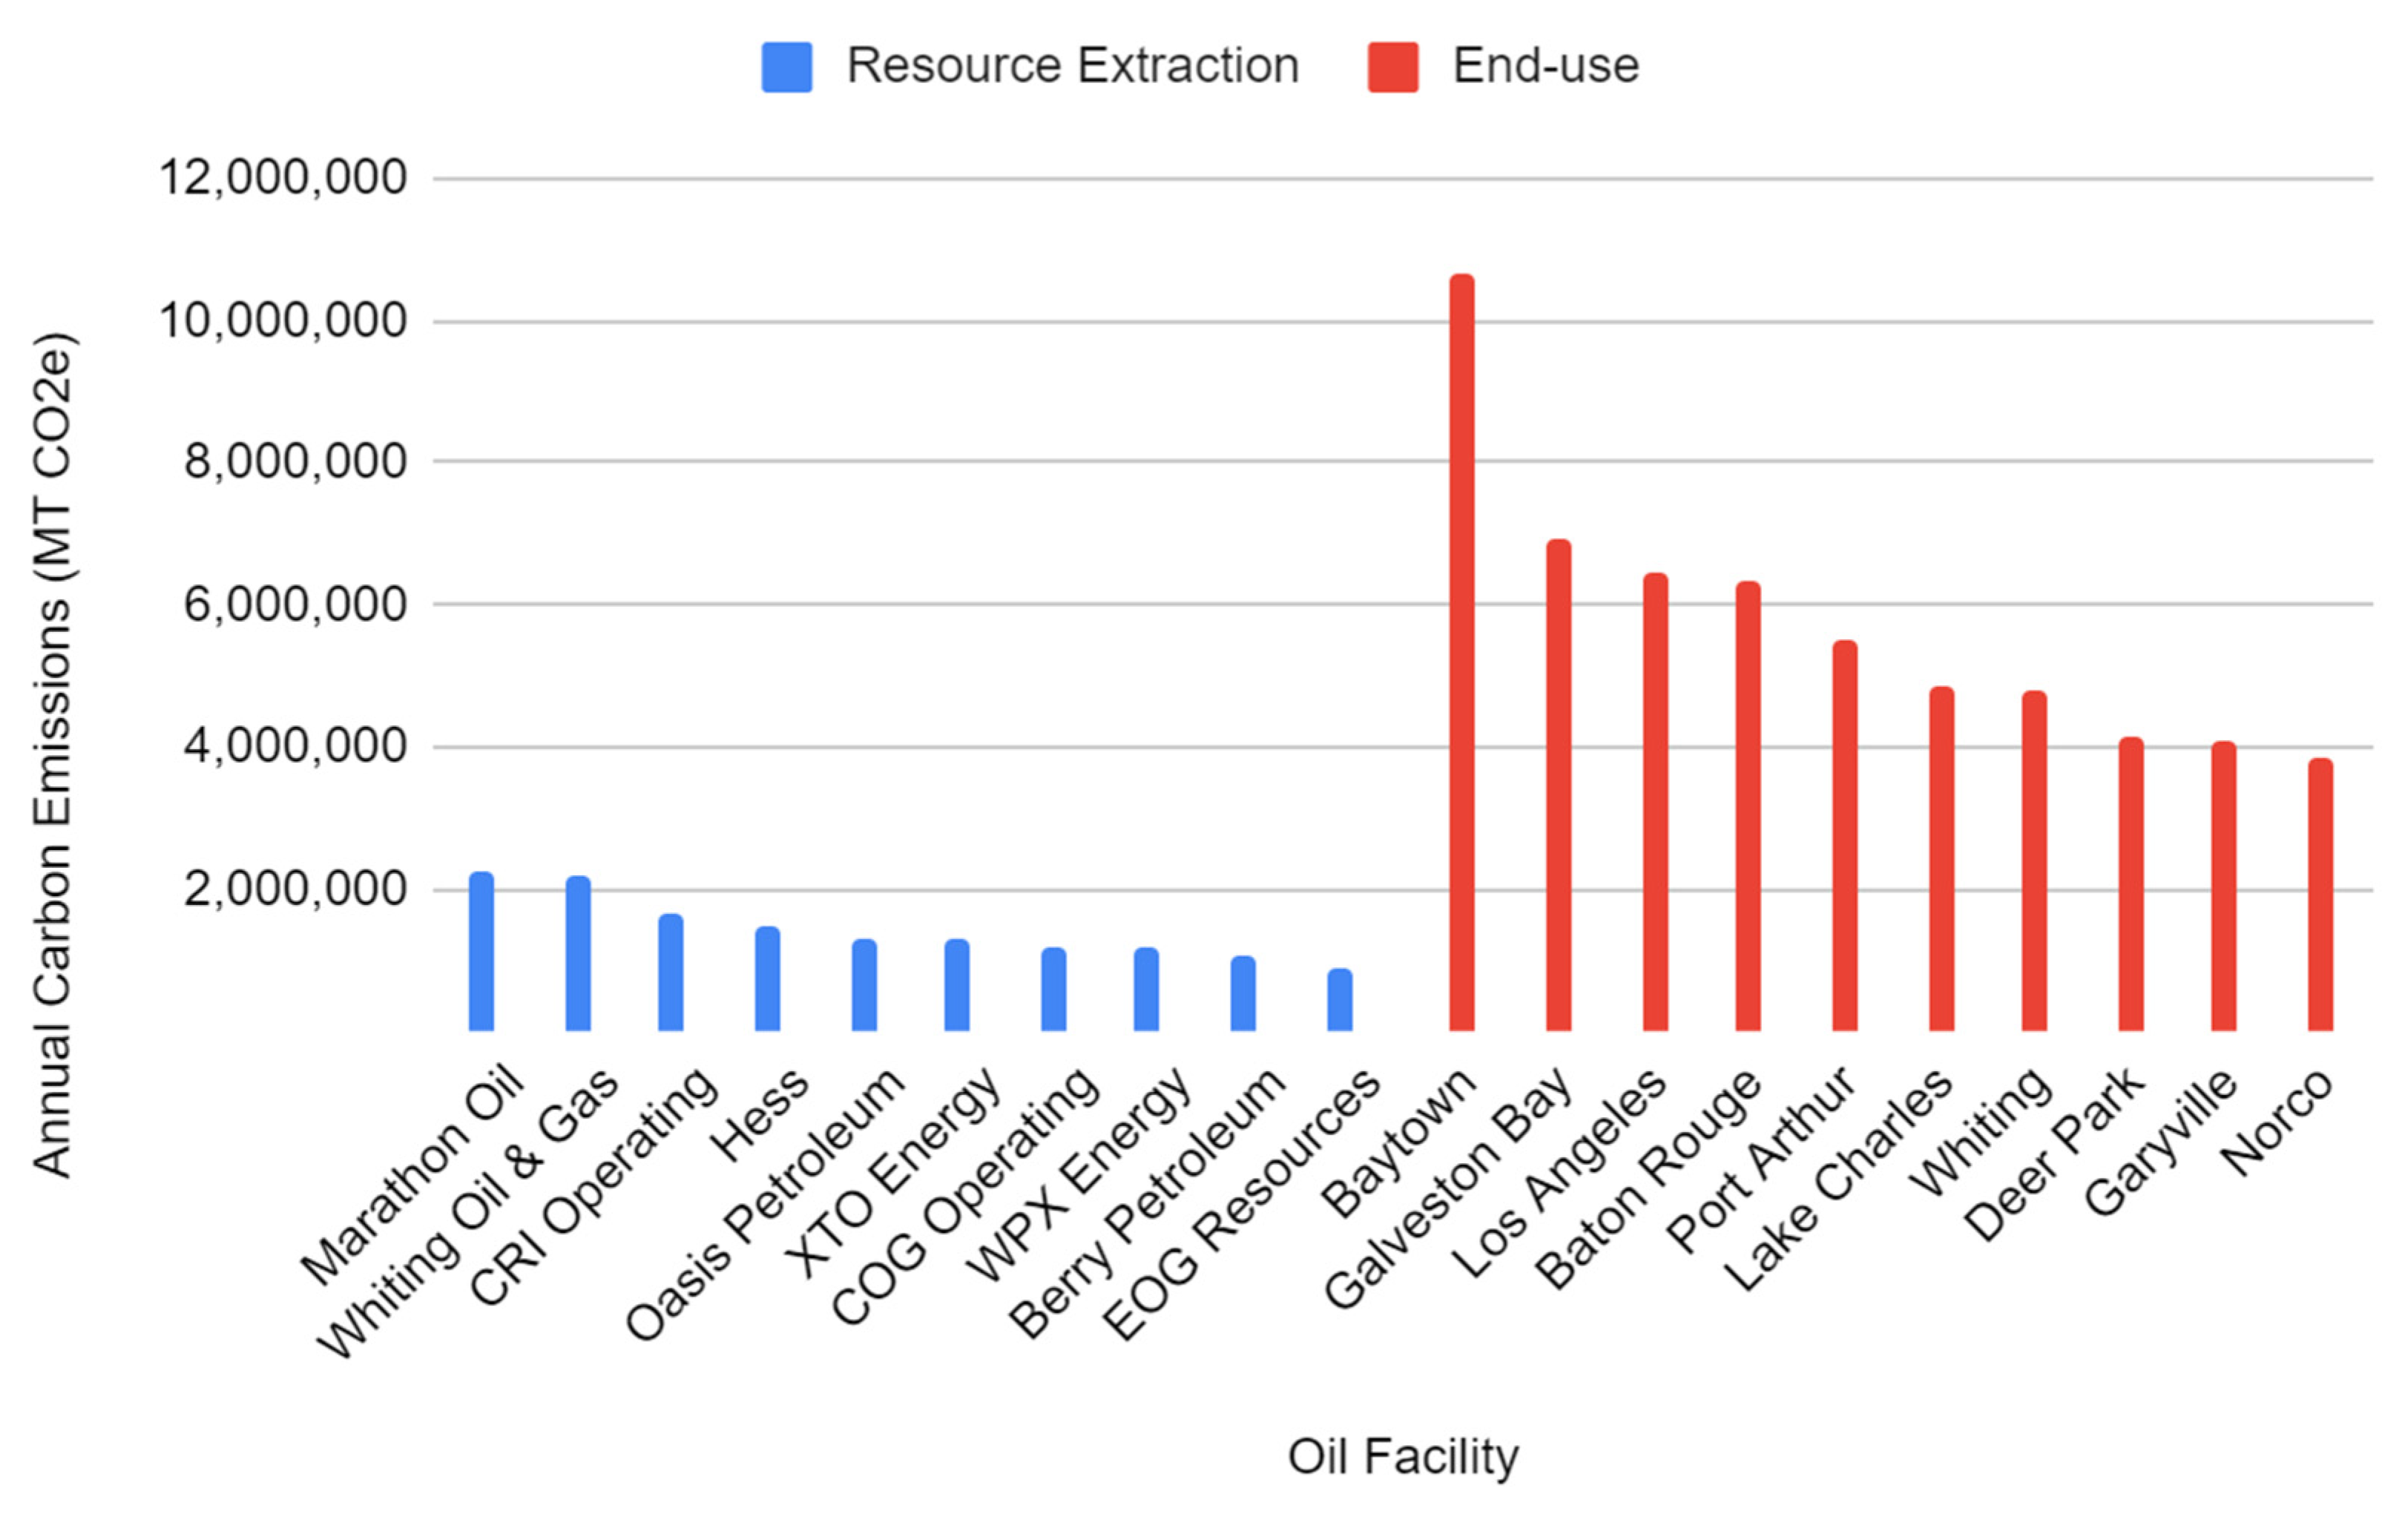
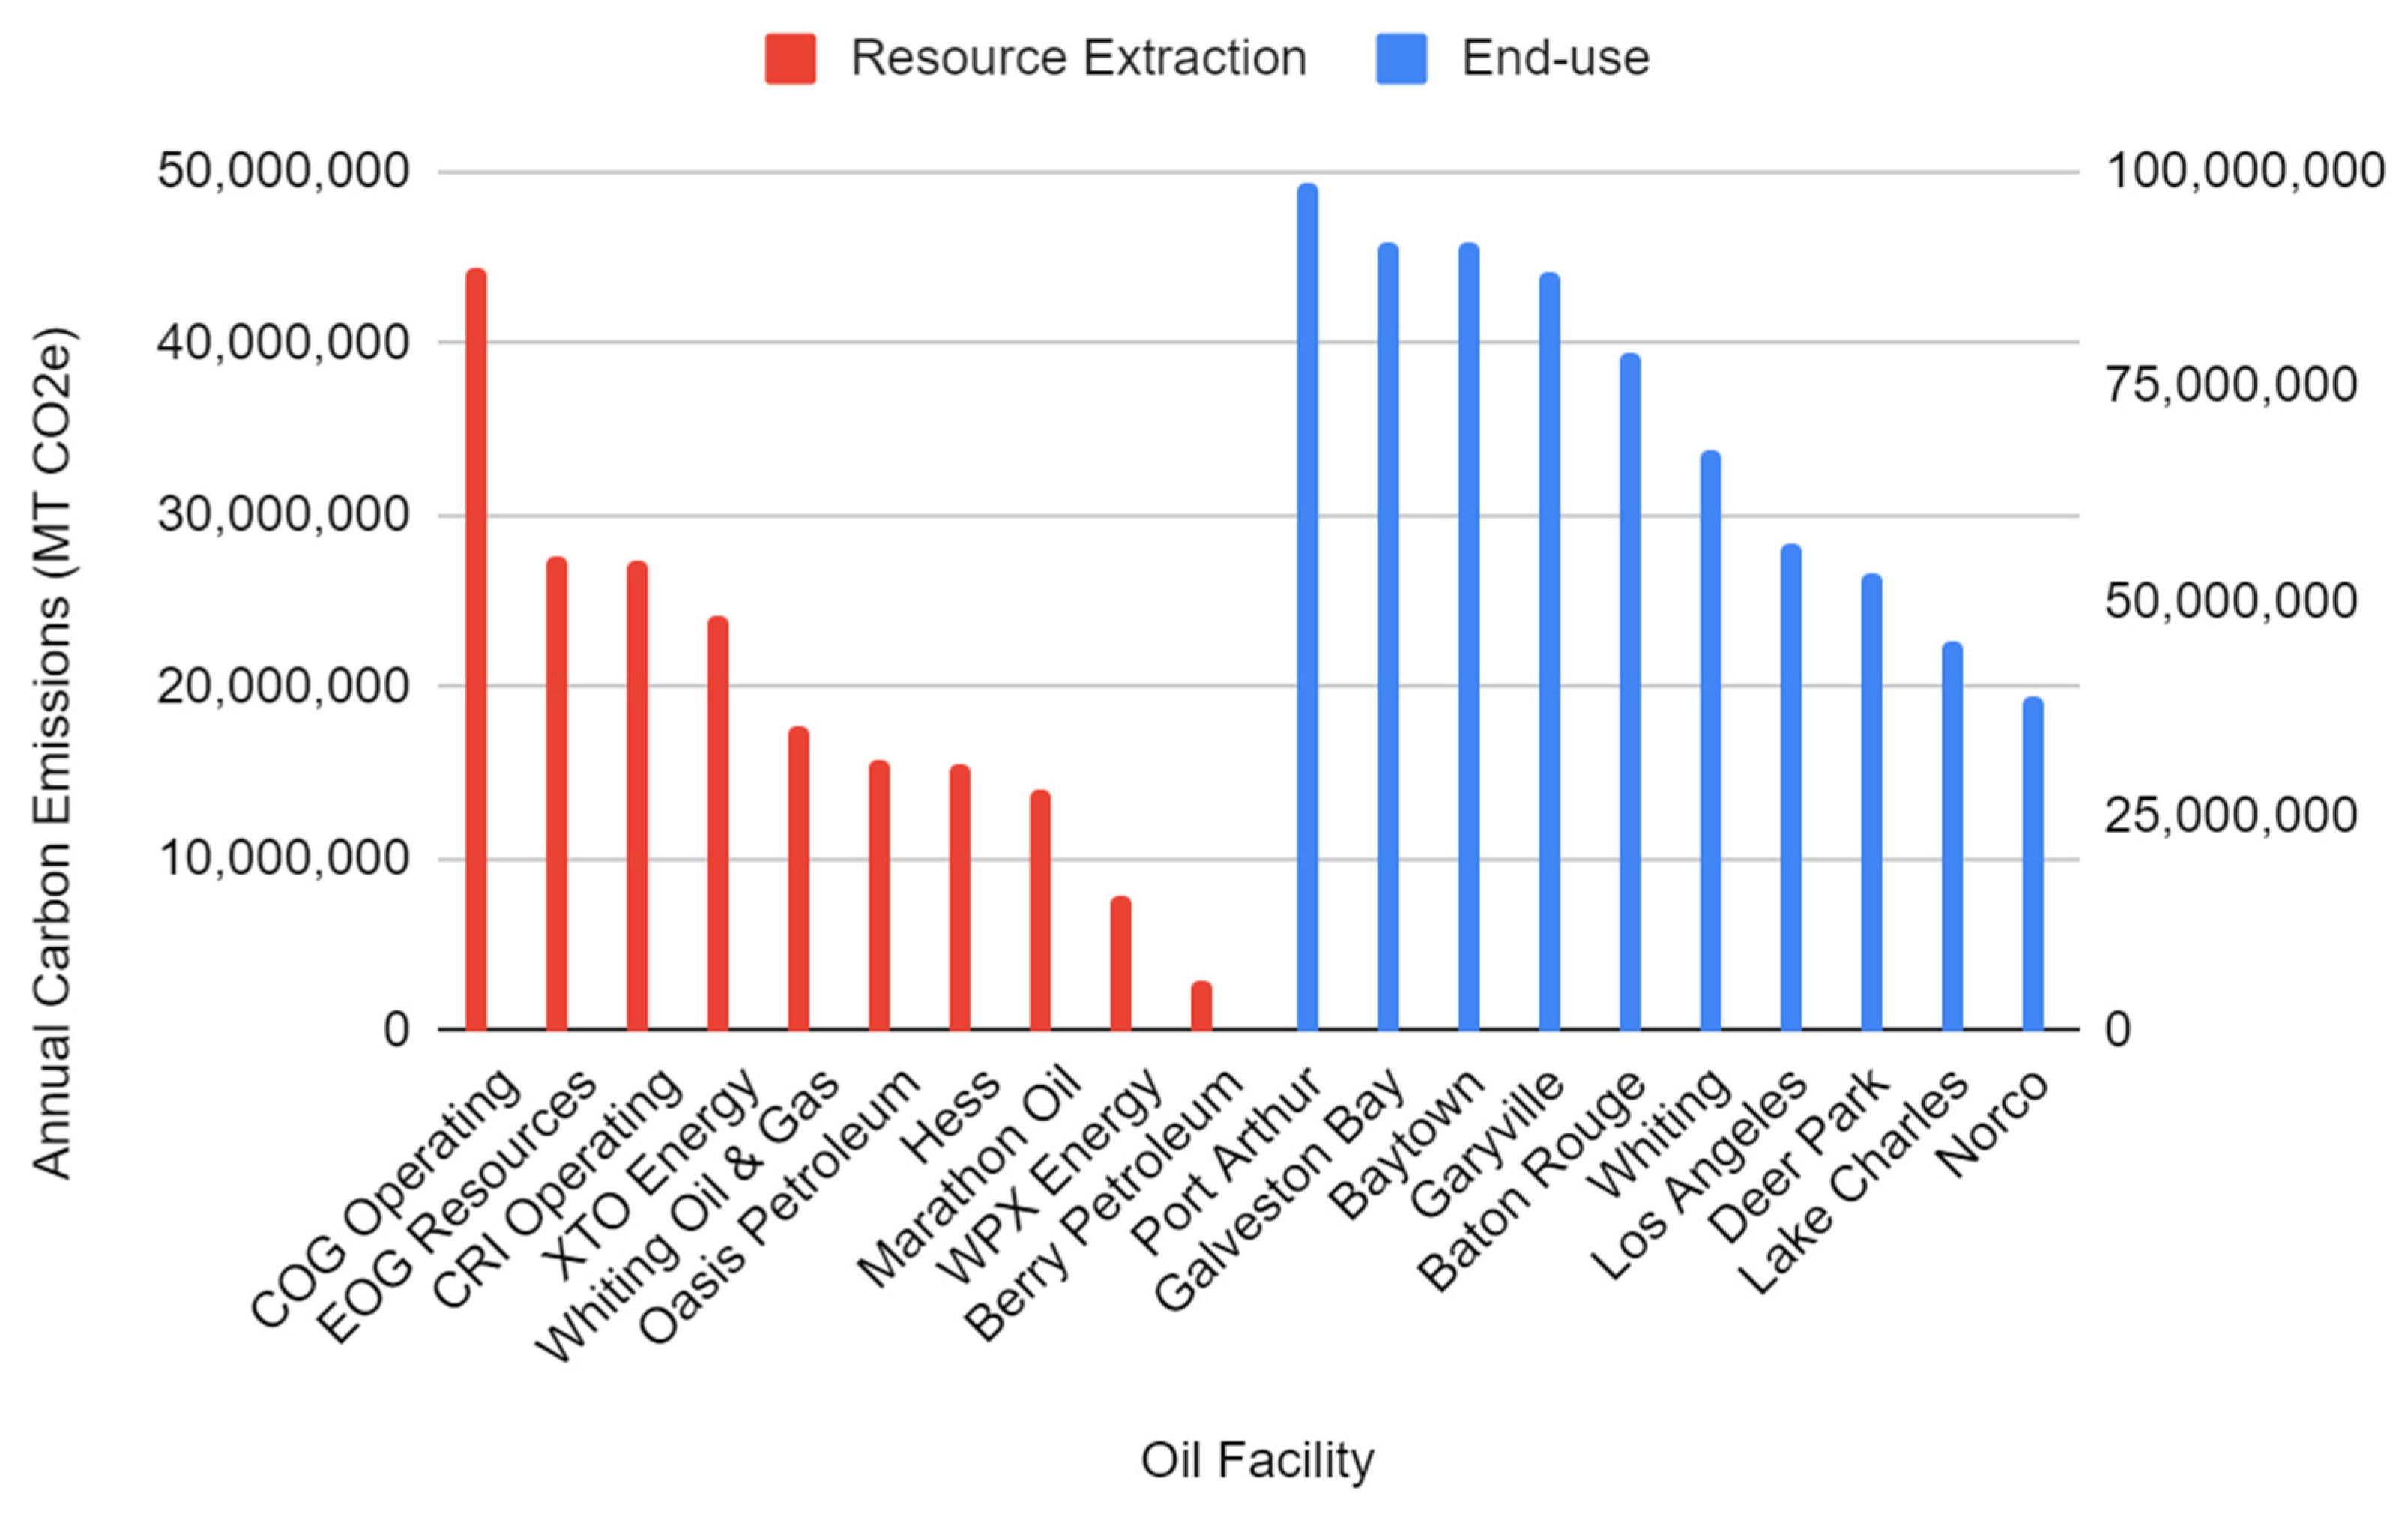
Comparing point-source emissions with bottleneck calculations for oil, it is evident that consideration of an entity’s capacity to act as an emissions bottleneck considerably changes the legal landscape. For example, oil extraction annually produces 14,505,900 MT CO2e point-source emissions, whereas annual bottleneck emissions total 198,162,321 MT CO2e–clearly demonstrating that point-source calculations only represent a trivial amount (7% in the case of oil extraction) of the true capacity of an entity to directly and indirectly generate GHG emissions.
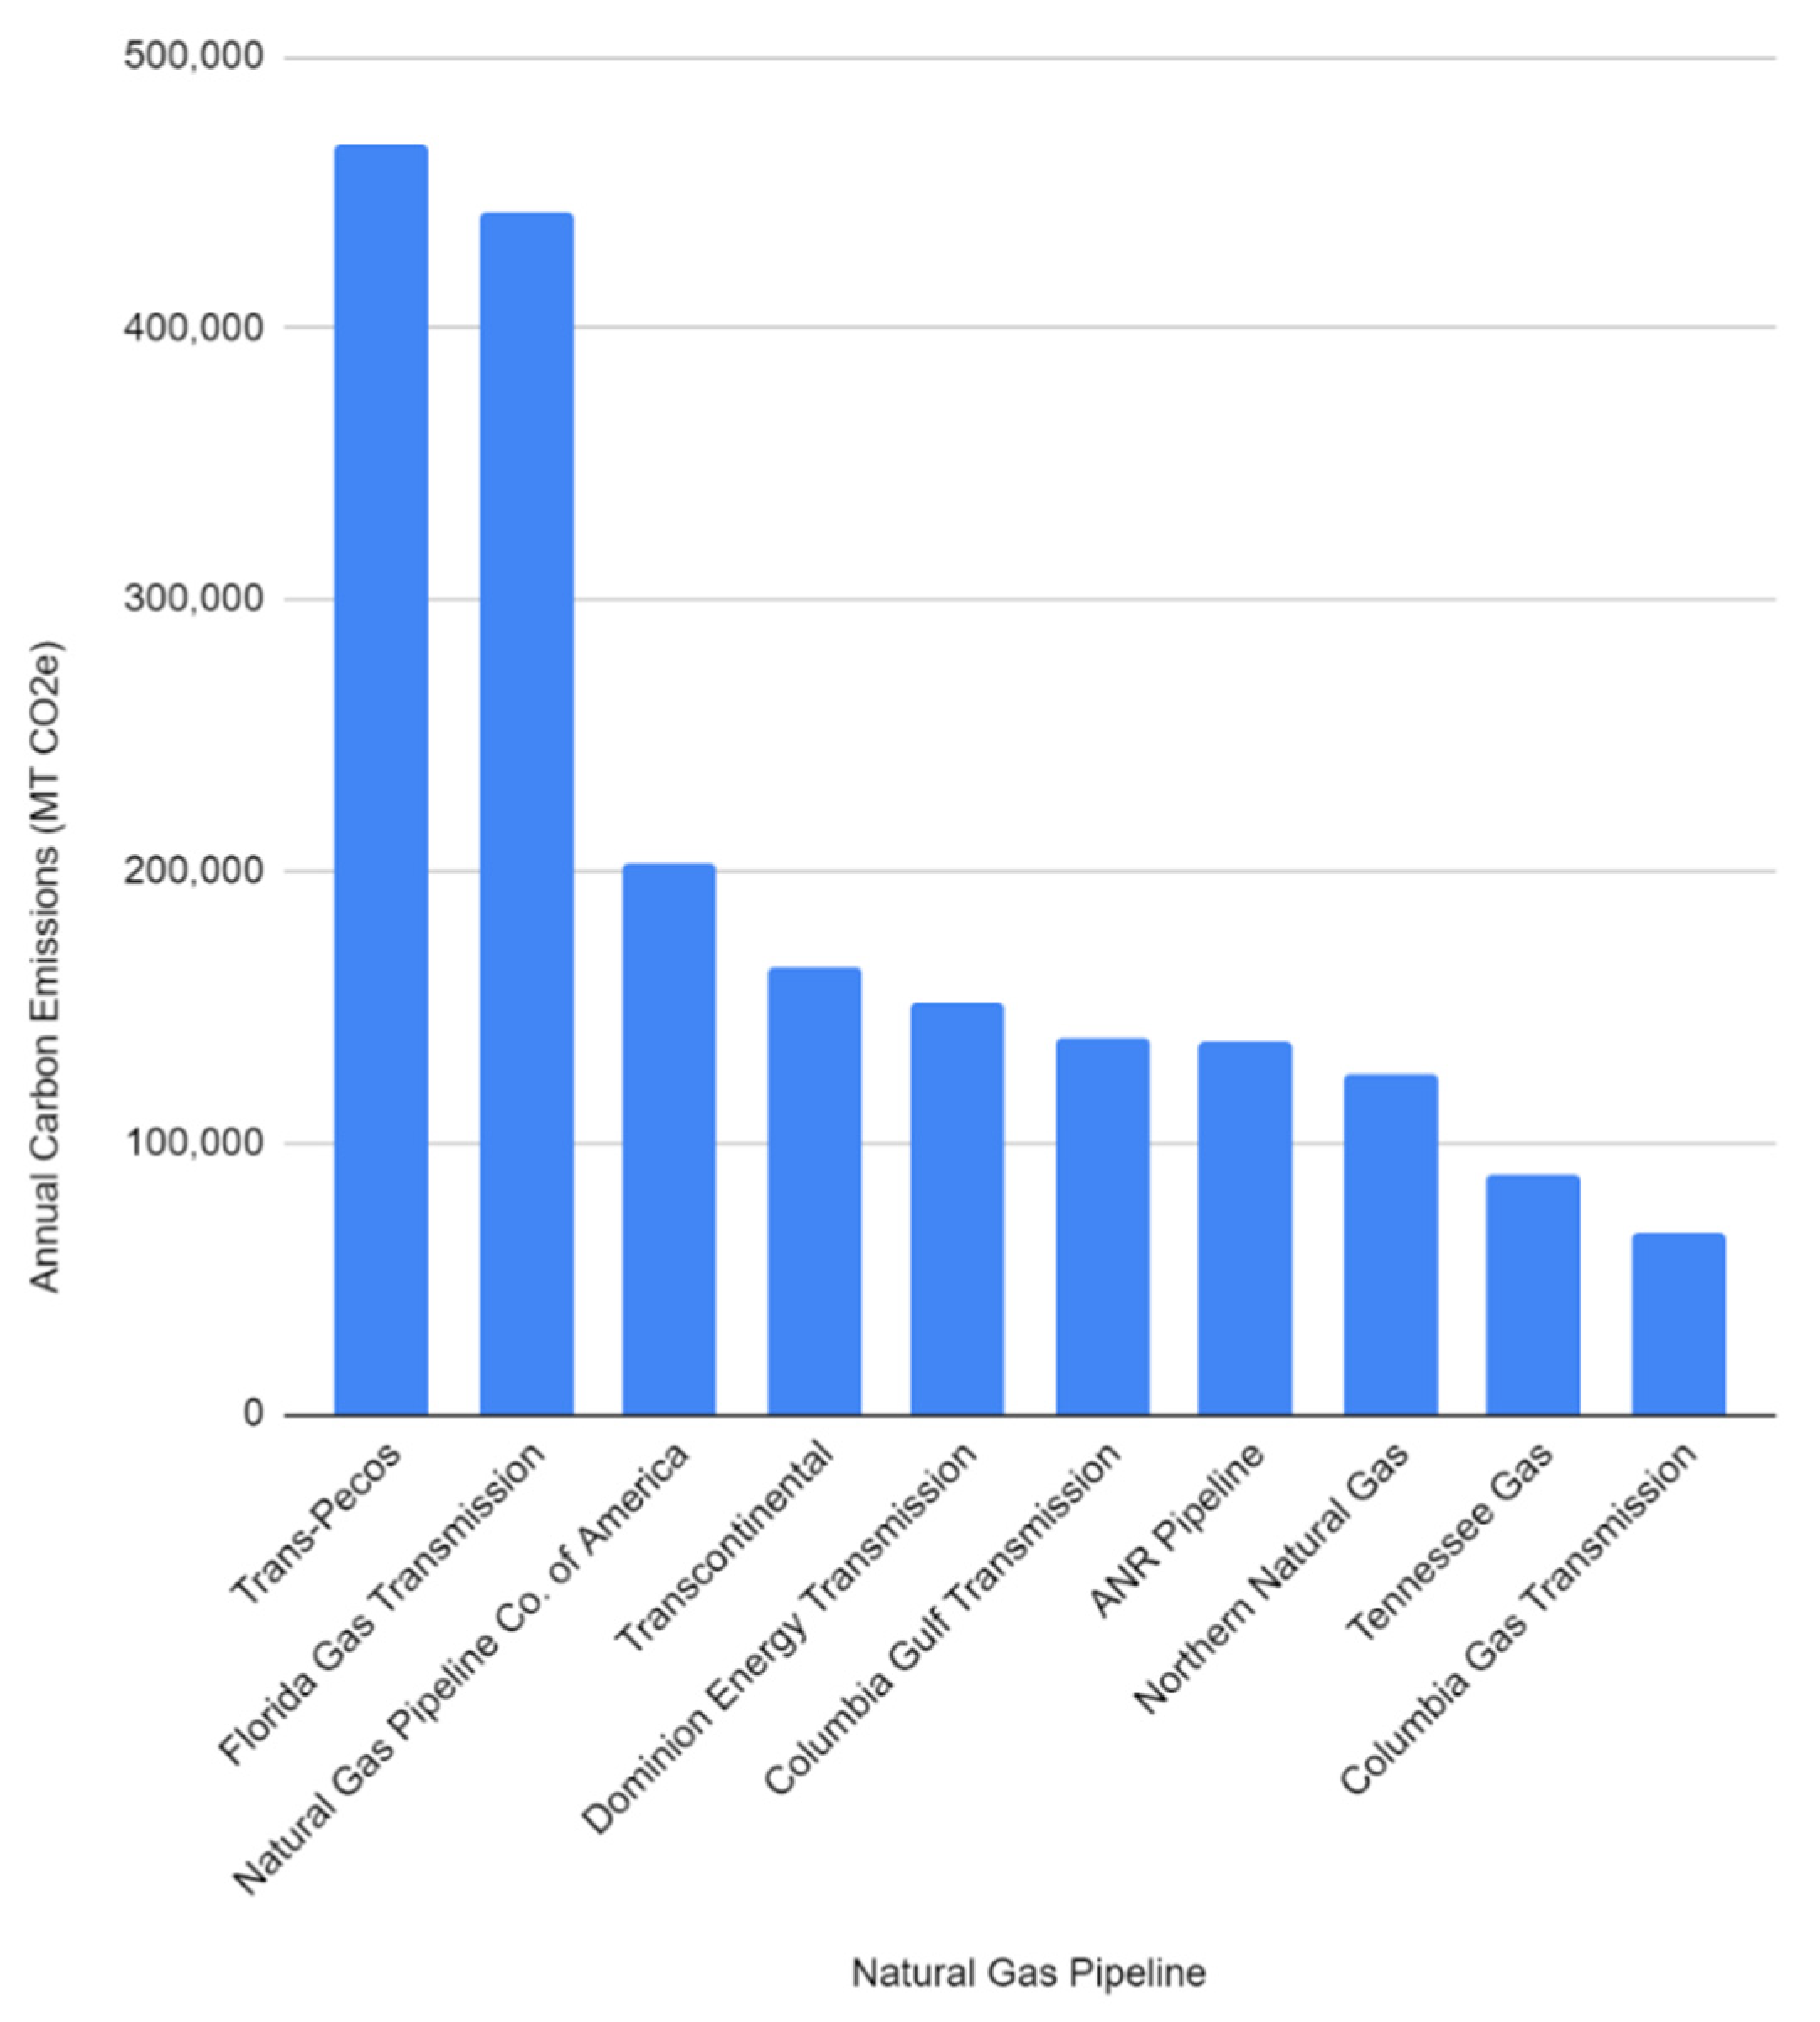
Traditionally, point-source emissions calculations are used for the purpose of establishing legal liability. To further demonstrate the inadequacy of point-source emissions calculations to establish true pollution liability, a comparison between natural gas transportation values is warranted. Annually, natural gas onshore transmission results in 1,986,594 MT CO2e as point-source emissions, and 1,287,506,052 MT CO2e as bottleneck emissions: demonstrating that this bottleneck calculation accounts for 35 times more emissions than does the simple point-source method. This major discrepancy in emissions diverts attention away from natural gas pipelines as responsible polluting entities, foregoing the opportunity to hold these actors accountable for their true contribution to atmospheric GHG concentration if bottleneck potential is overlooked.
Overall, burning natural gas results in the fewest CO2 emissions when compared to burning petroleum or coal products to generate an equivalent amount of energy [54]. However, natural gas is mainly composed of methane (CH4), a significantly more potent greenhouse gas whose comparative ability to trap radiation is 25 times greater than CO2 [55]. While CO2 emissions are the focus of this study, natural gas production is considered the largest anthropogenic source of CH4 and a source of other harmful atmospheric pollutants [54,56]. Figure 7 indicates that the end-use of natural gas at power plants generates 78% of point-source CO2 emissions of the entire industry (60, 060, 762 MT CO2 e). This finding draws negative attention to the end-use of the product, yet in the United Sates, natural gas is often retrieved using a precarious process known as hydraulic fracturing in which water, sand, and chemicals are forced down wells at high pressure [57]. The resulting environmental decimation [54,58] and impact on drinking water resources [59,60] of this high-risk endeavor permits the extraction of natural gas to be considered an enormous threat to human health, similarly to CO2 emissions.
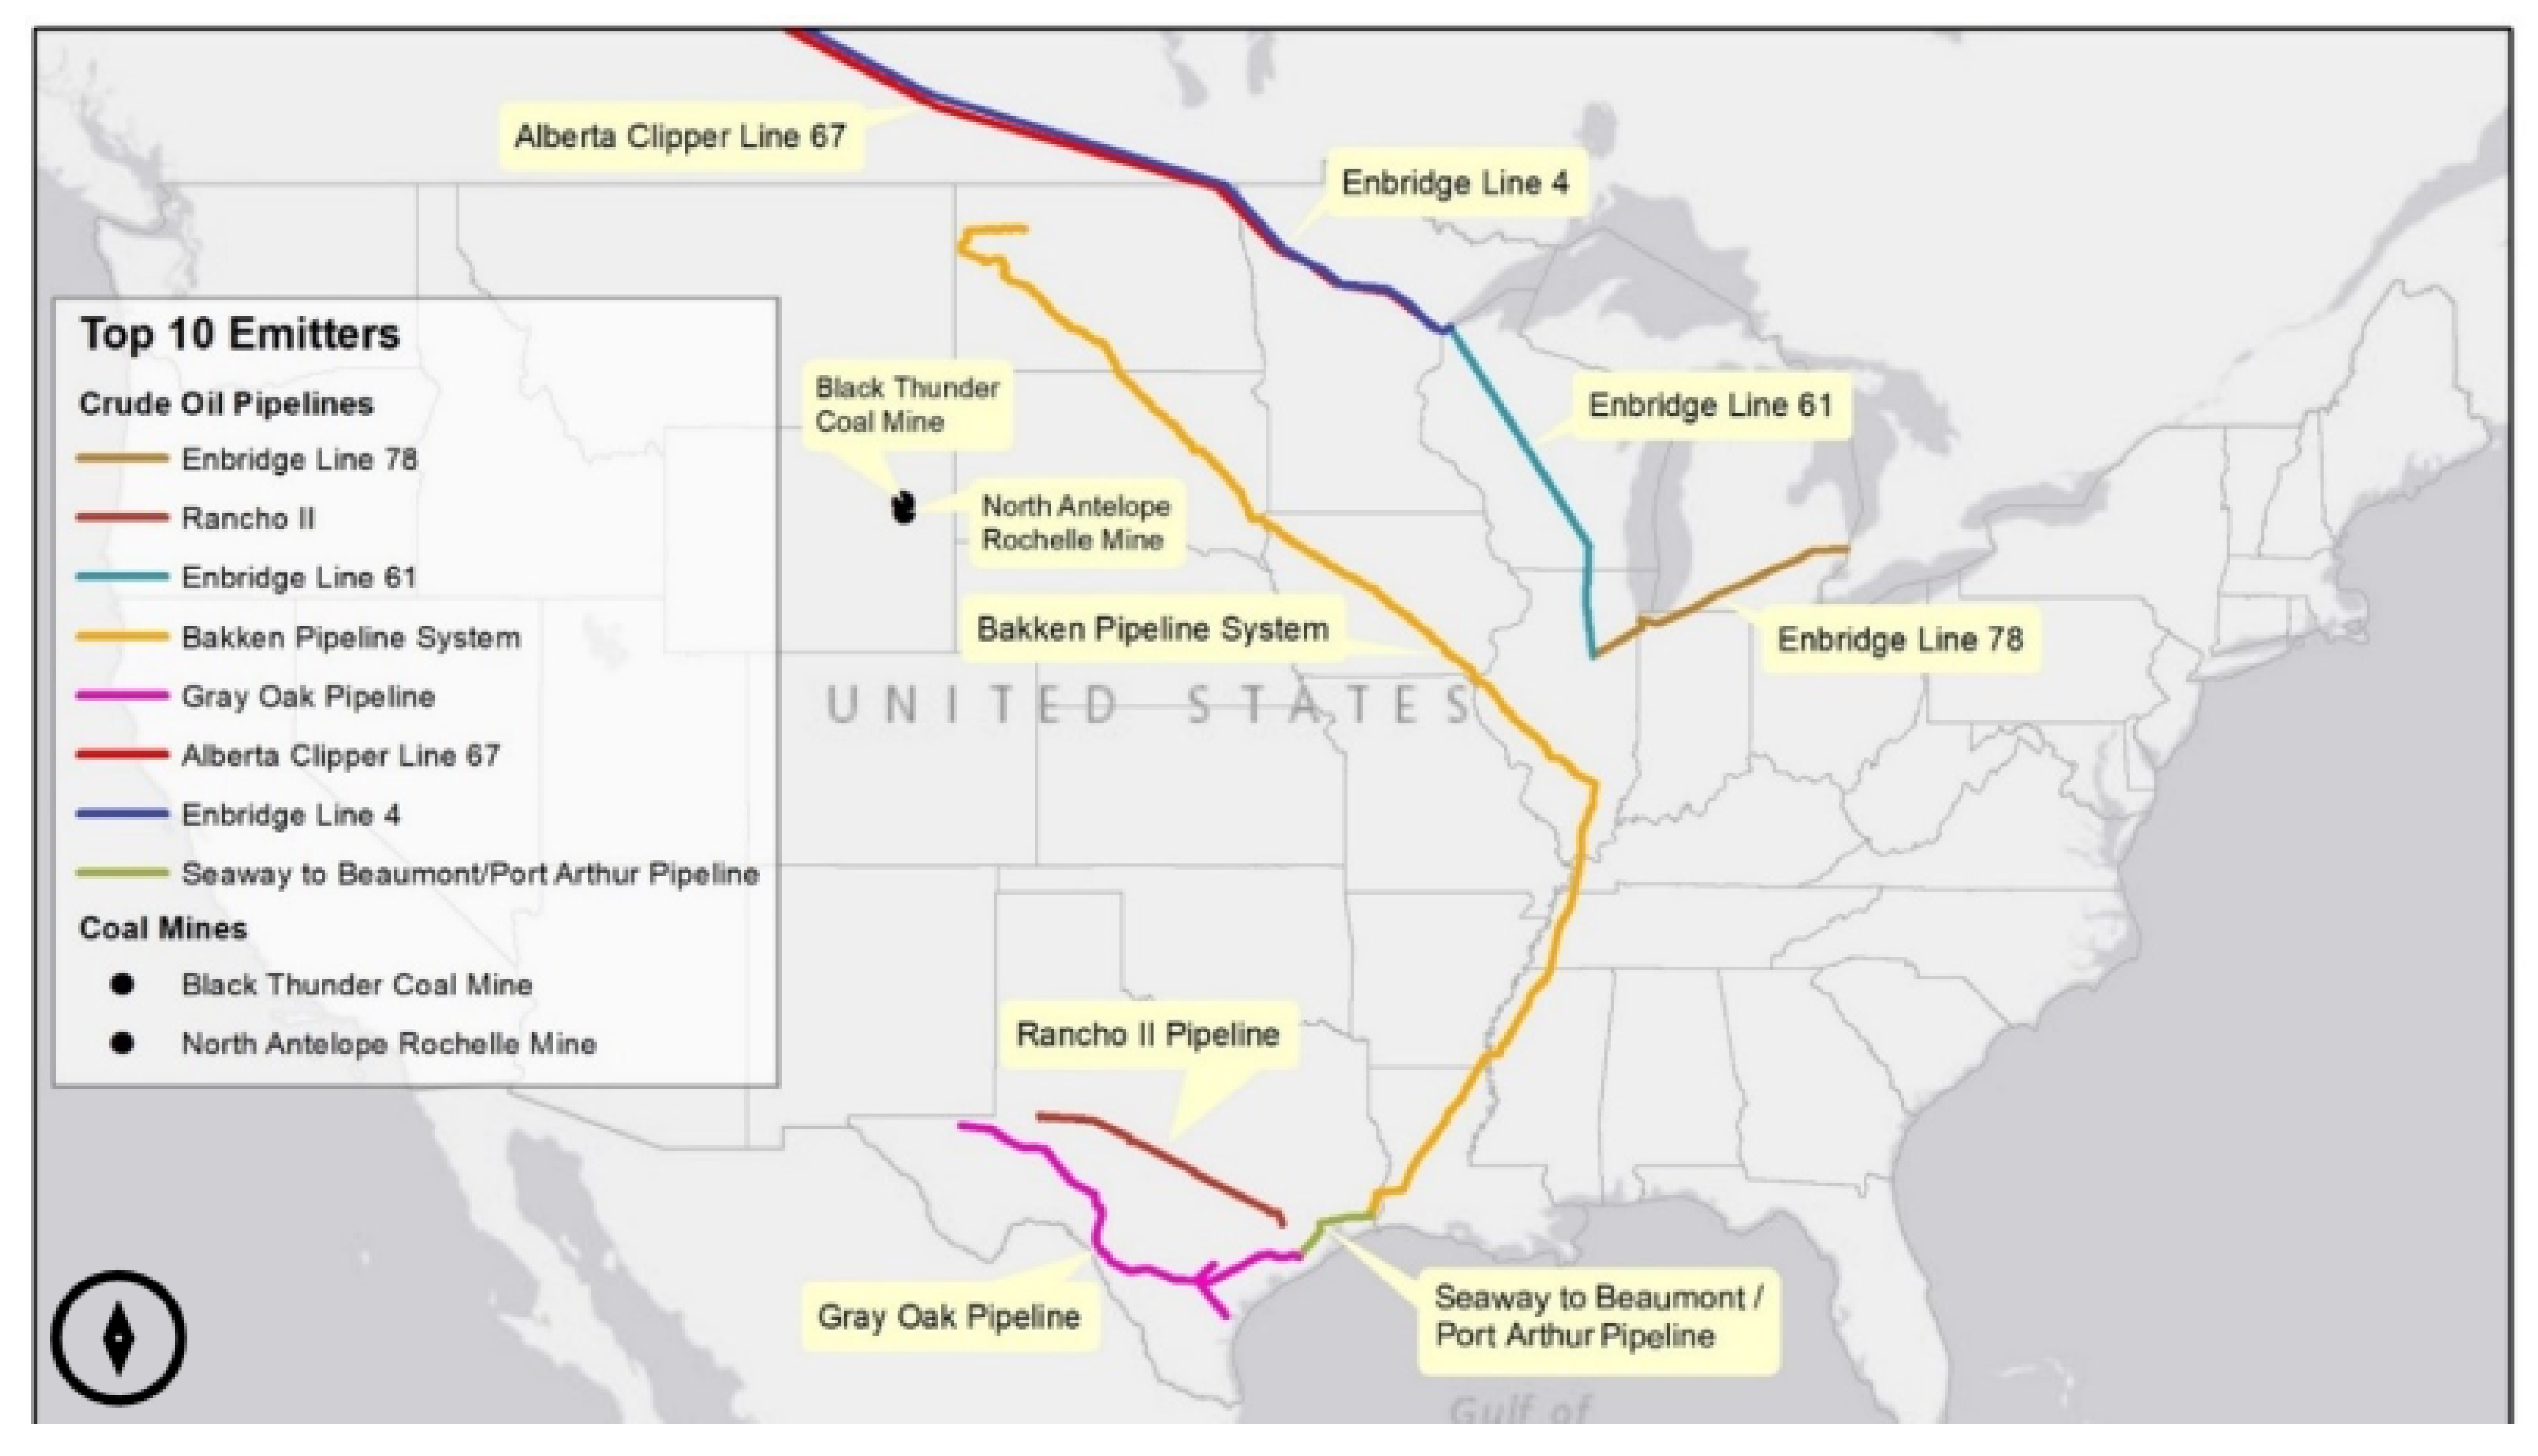
Finally, the overall top ten carbon dioxide emission points sources for all fossil fuels is quantified in Figure 9 and mapped in Figure 10. Mapping is important in this context as it provides information about legal jurisdiction for climate related lawsuits.
According to point-source emissions calculations provided by the EPA, oil transportation entities occupy eight out of ten positions on the overall top ten CO2 emitters across all fossil-fuel industries list (Figure 9) and the remaining two entities are coal mines. There is a notable disparity between the top 10 point-source and bottlenecks emitters, further illustrating the justified rationale for relying upon bottleneck capacity rather than point-source emissions to establish accurate legal liability for polluting entities. The top three CO2 emissions bottlenecks (natural gas pipelines) do not rank at all on the list of top ten point-source emitters, demonstrating that a comprehensive emissions calculation is better able to capture polluting entities that otherwise may have been overlooked using traditional methods.

3.2. CO2 Emission Bottlenecks

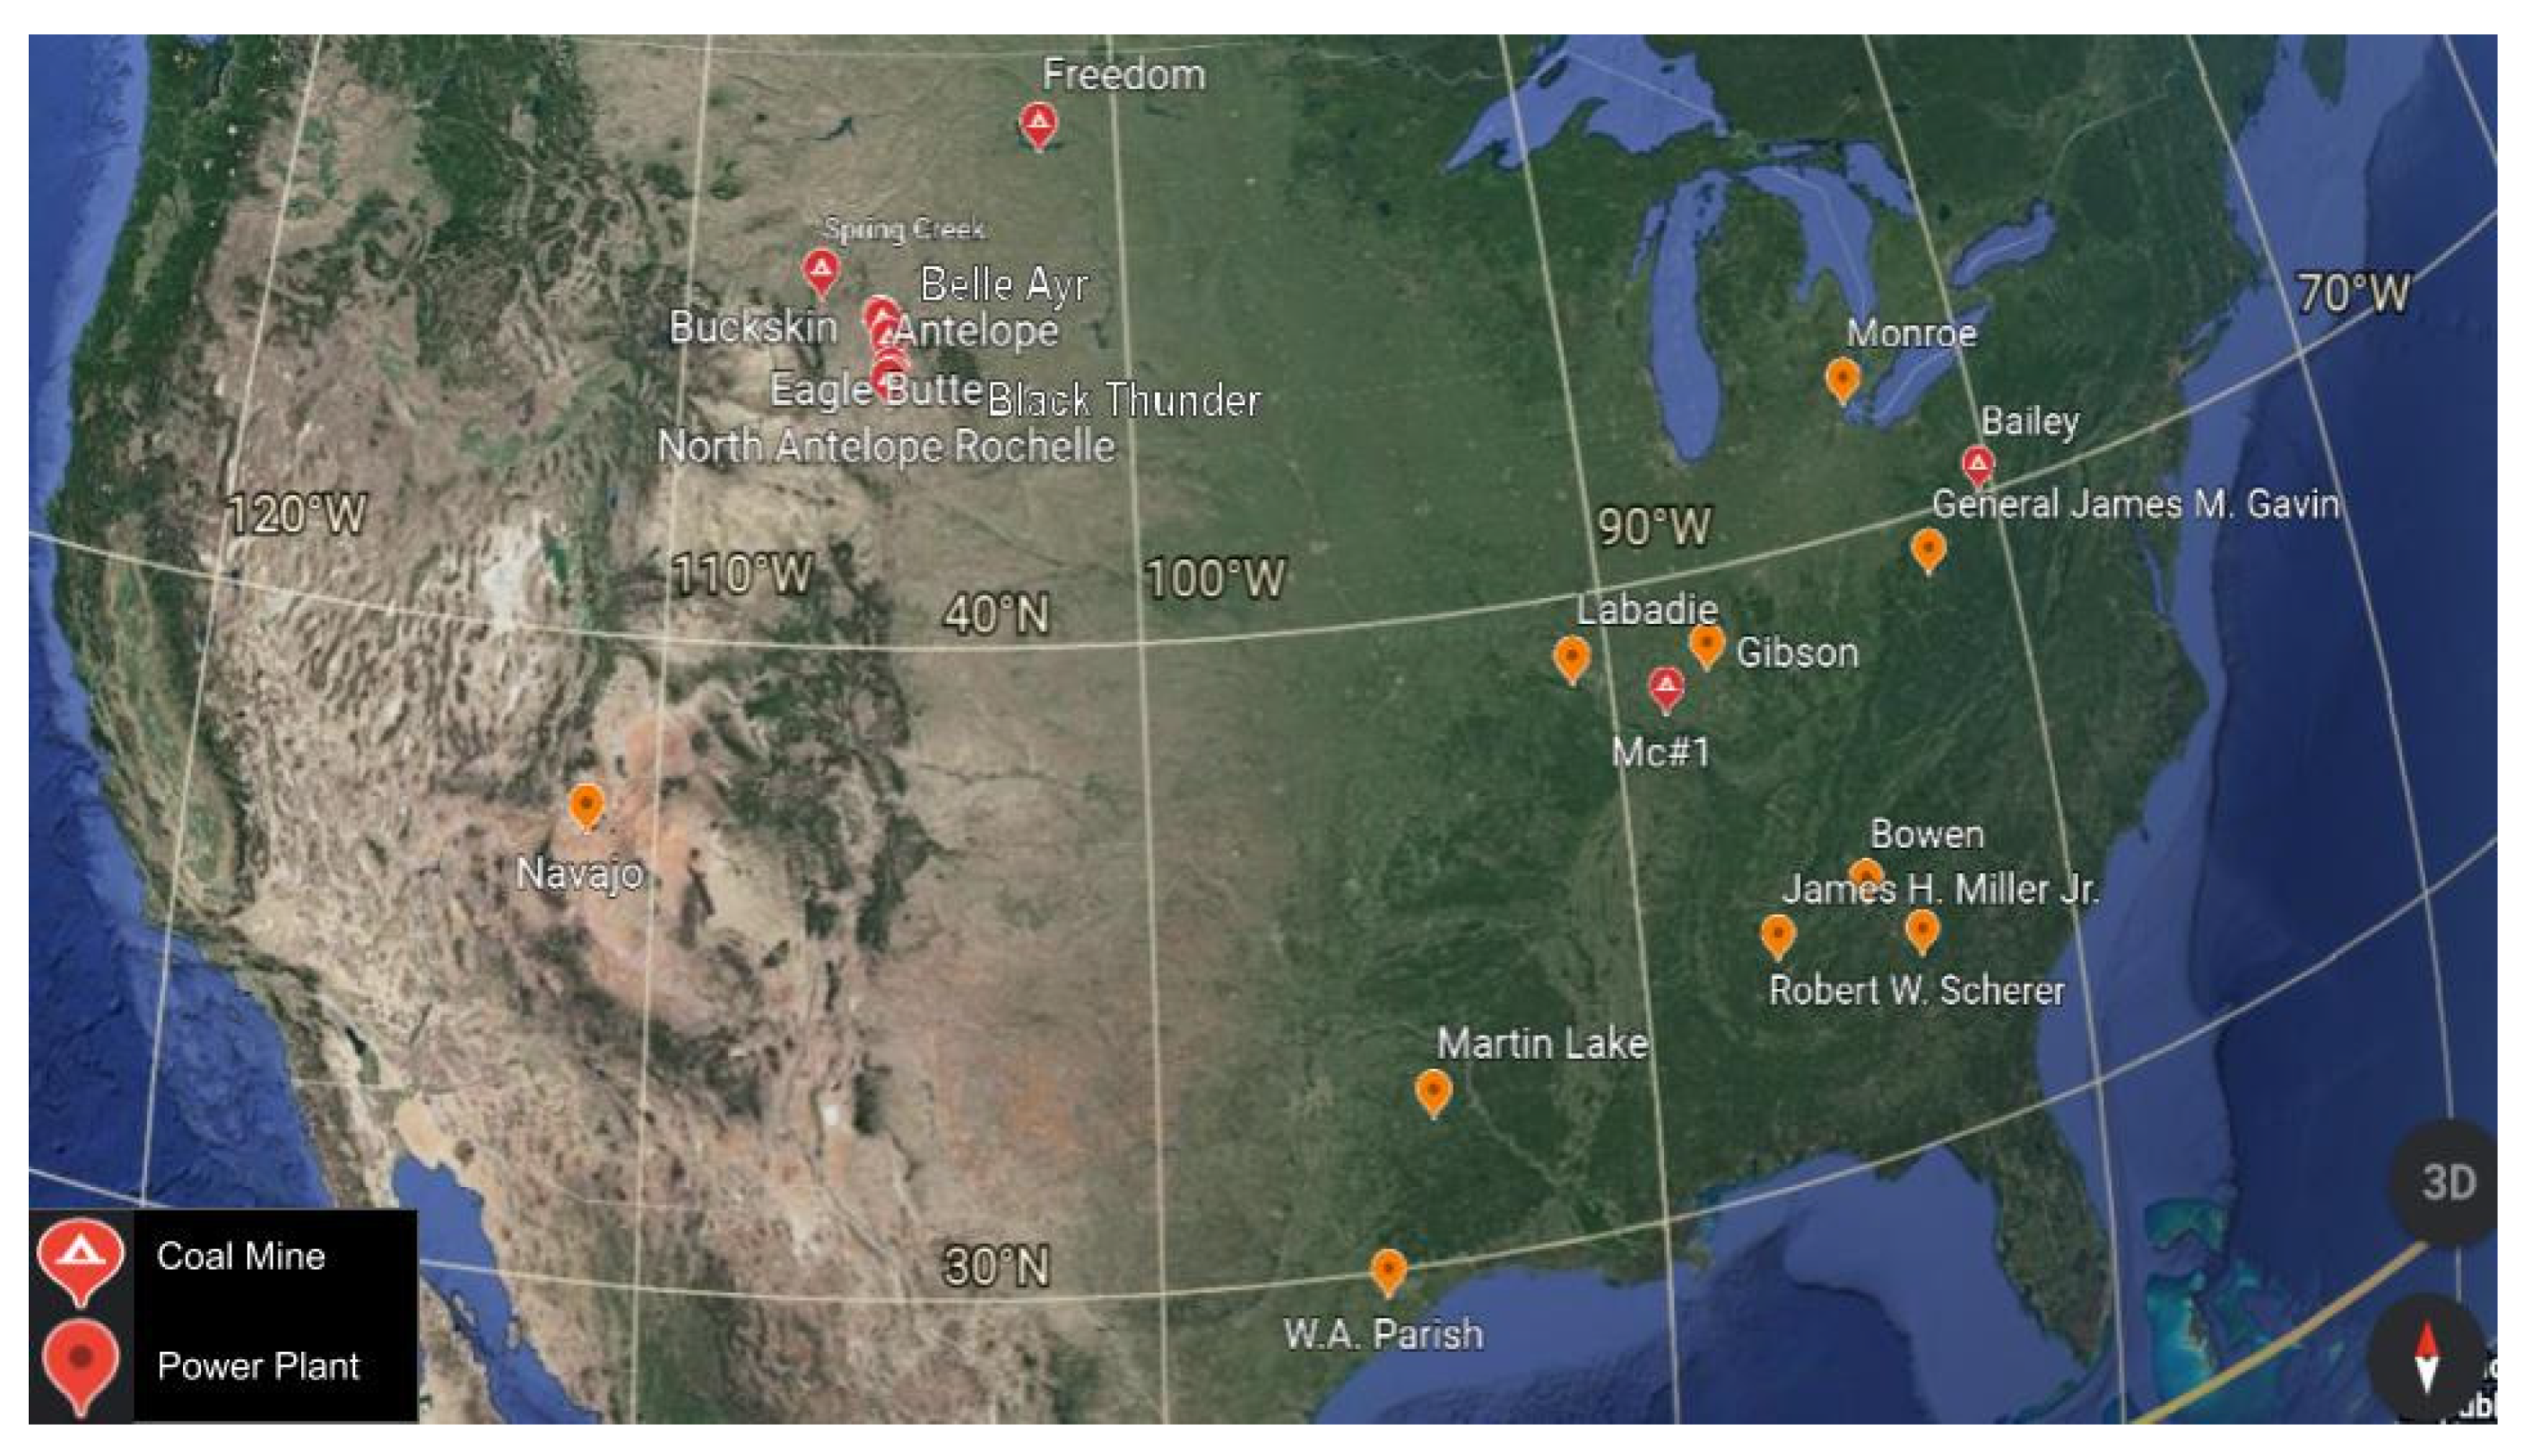
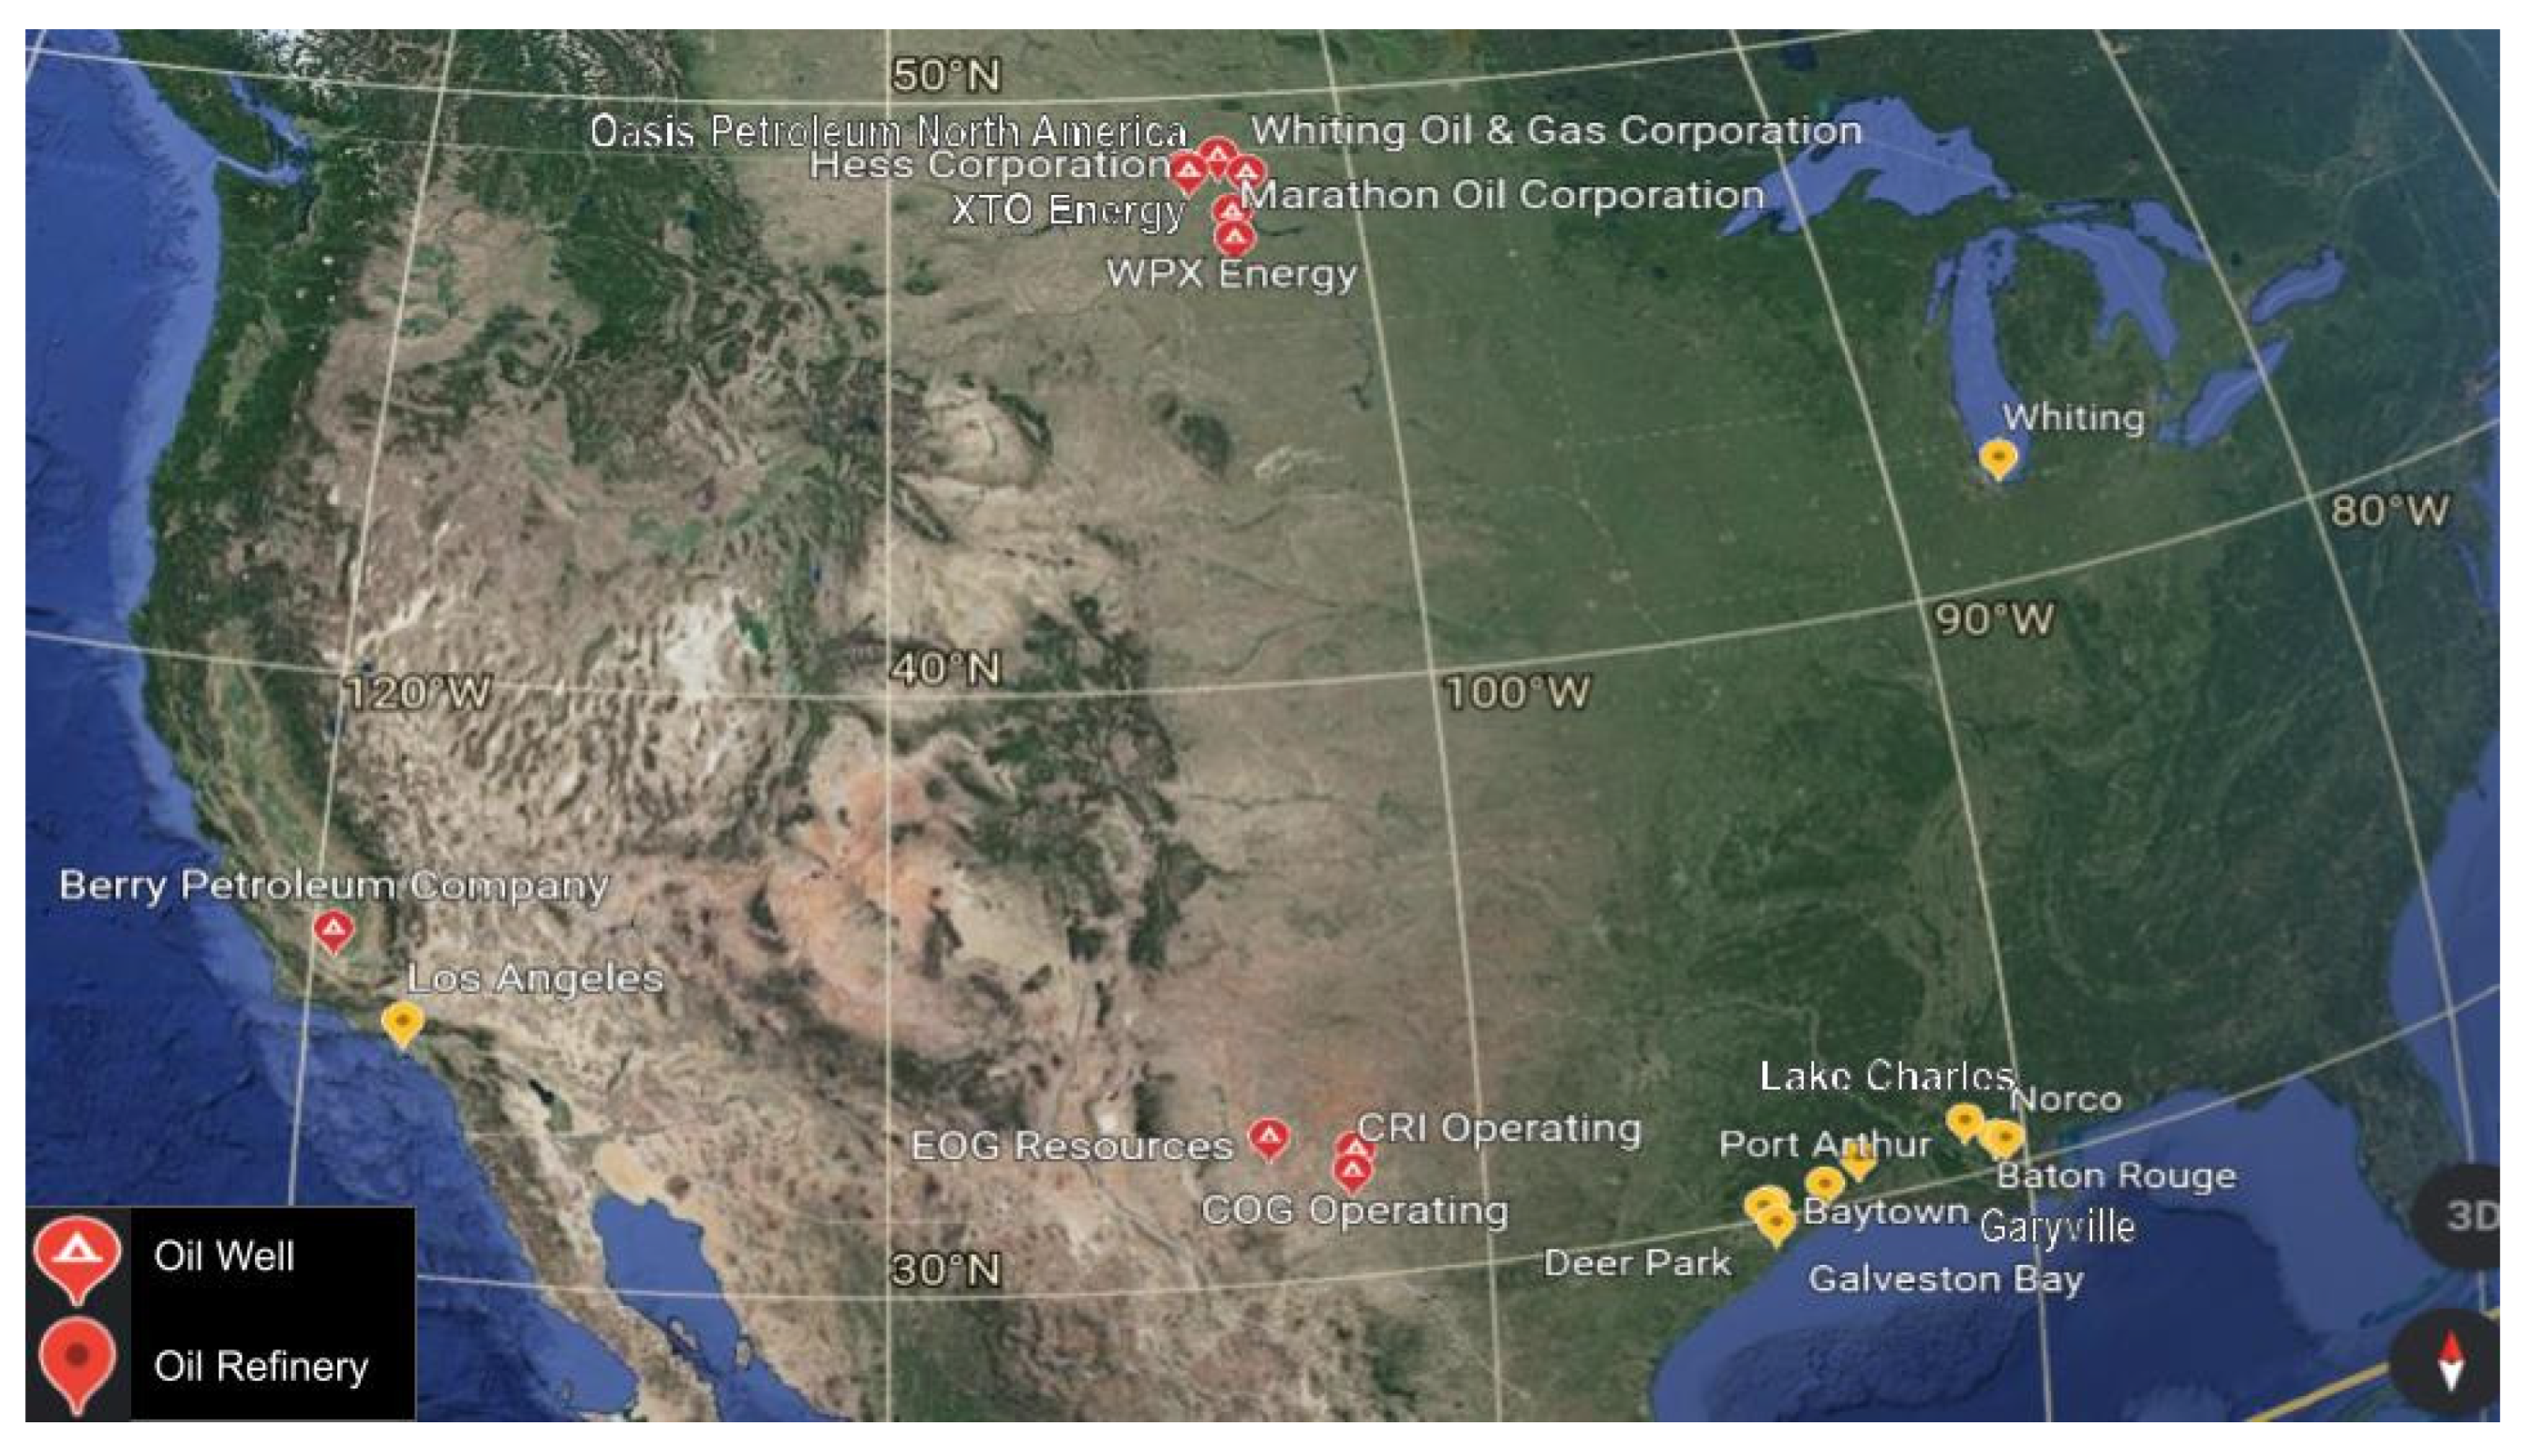
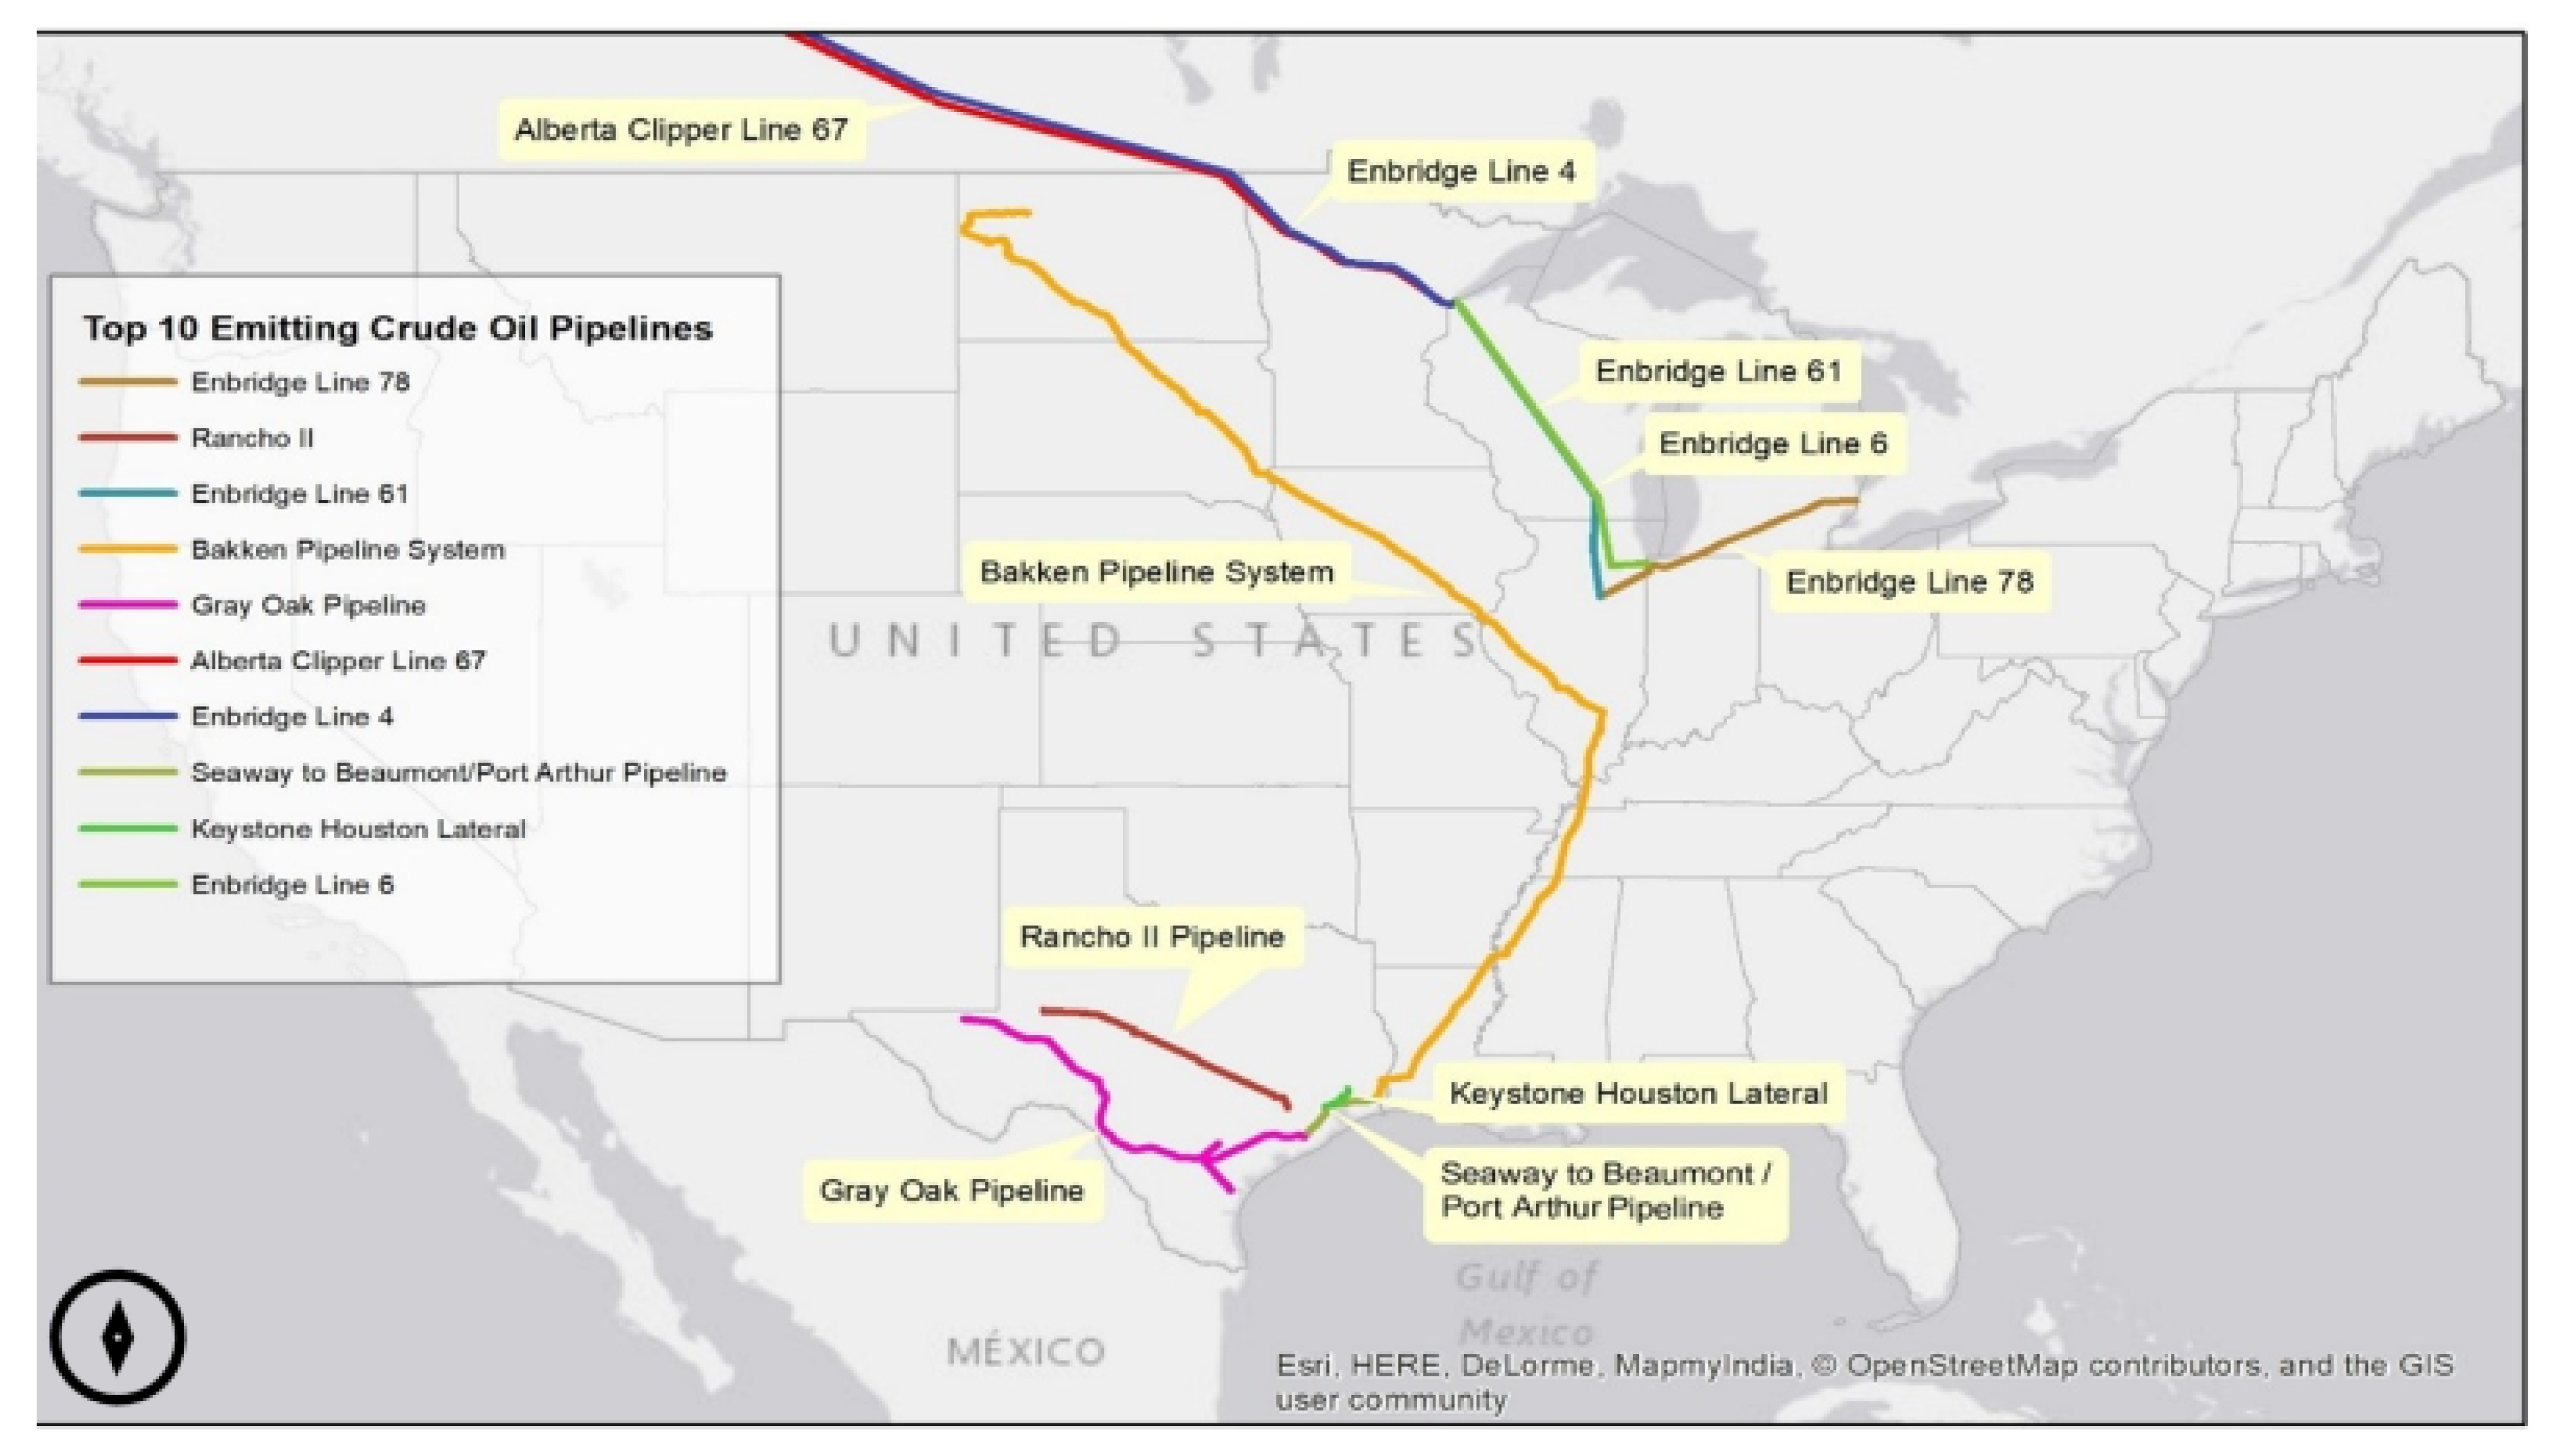
The comprehensive calculation of bottleneck emissions includes all potential emissions for a given resource extraction, transportation or end use. Embedding all down-stream emissions within the calculation for resource extraction, for example, is justified as all subsequent emissions can be attributed to the initial acquisition of the resource through this bottleneck. The common methodology employed by the U.S. EPA and other environmental organizations is to evaluate an activity’s point-source emissions. Relatively simplistic point-source calculations miss the total potential emissions as they ignore the responsibility for the enabled emissions. By calculating an entity’s entire resource throughput, it is possible to evaluate the magnitude of its role as a bottleneck for CO2 emissions. The objective of this work is to identify which entities of the fossil-fuel industry act as CO2 emission bottlenecks and are thus the most likely to be targeted for GHG emissions lawsuits. The top CO2 bottlenecks are shown for coal in Figure 11 and mapped in Figure 12. Similarly, the bottleneck results for oil are shown in Figure 13, Figure 14, Figure 15 and Figure 16.
Using the bottleneck calculation logic previously discussed, a direct conversion from fuel capacity to potential emissions was calculated for all three of the oil industry sub-classes. This approach considers an oil well, pipeline or refinery’s capacity to represent the eventual CO2 emissions associated with the quantity of fuel being handled by each facility.
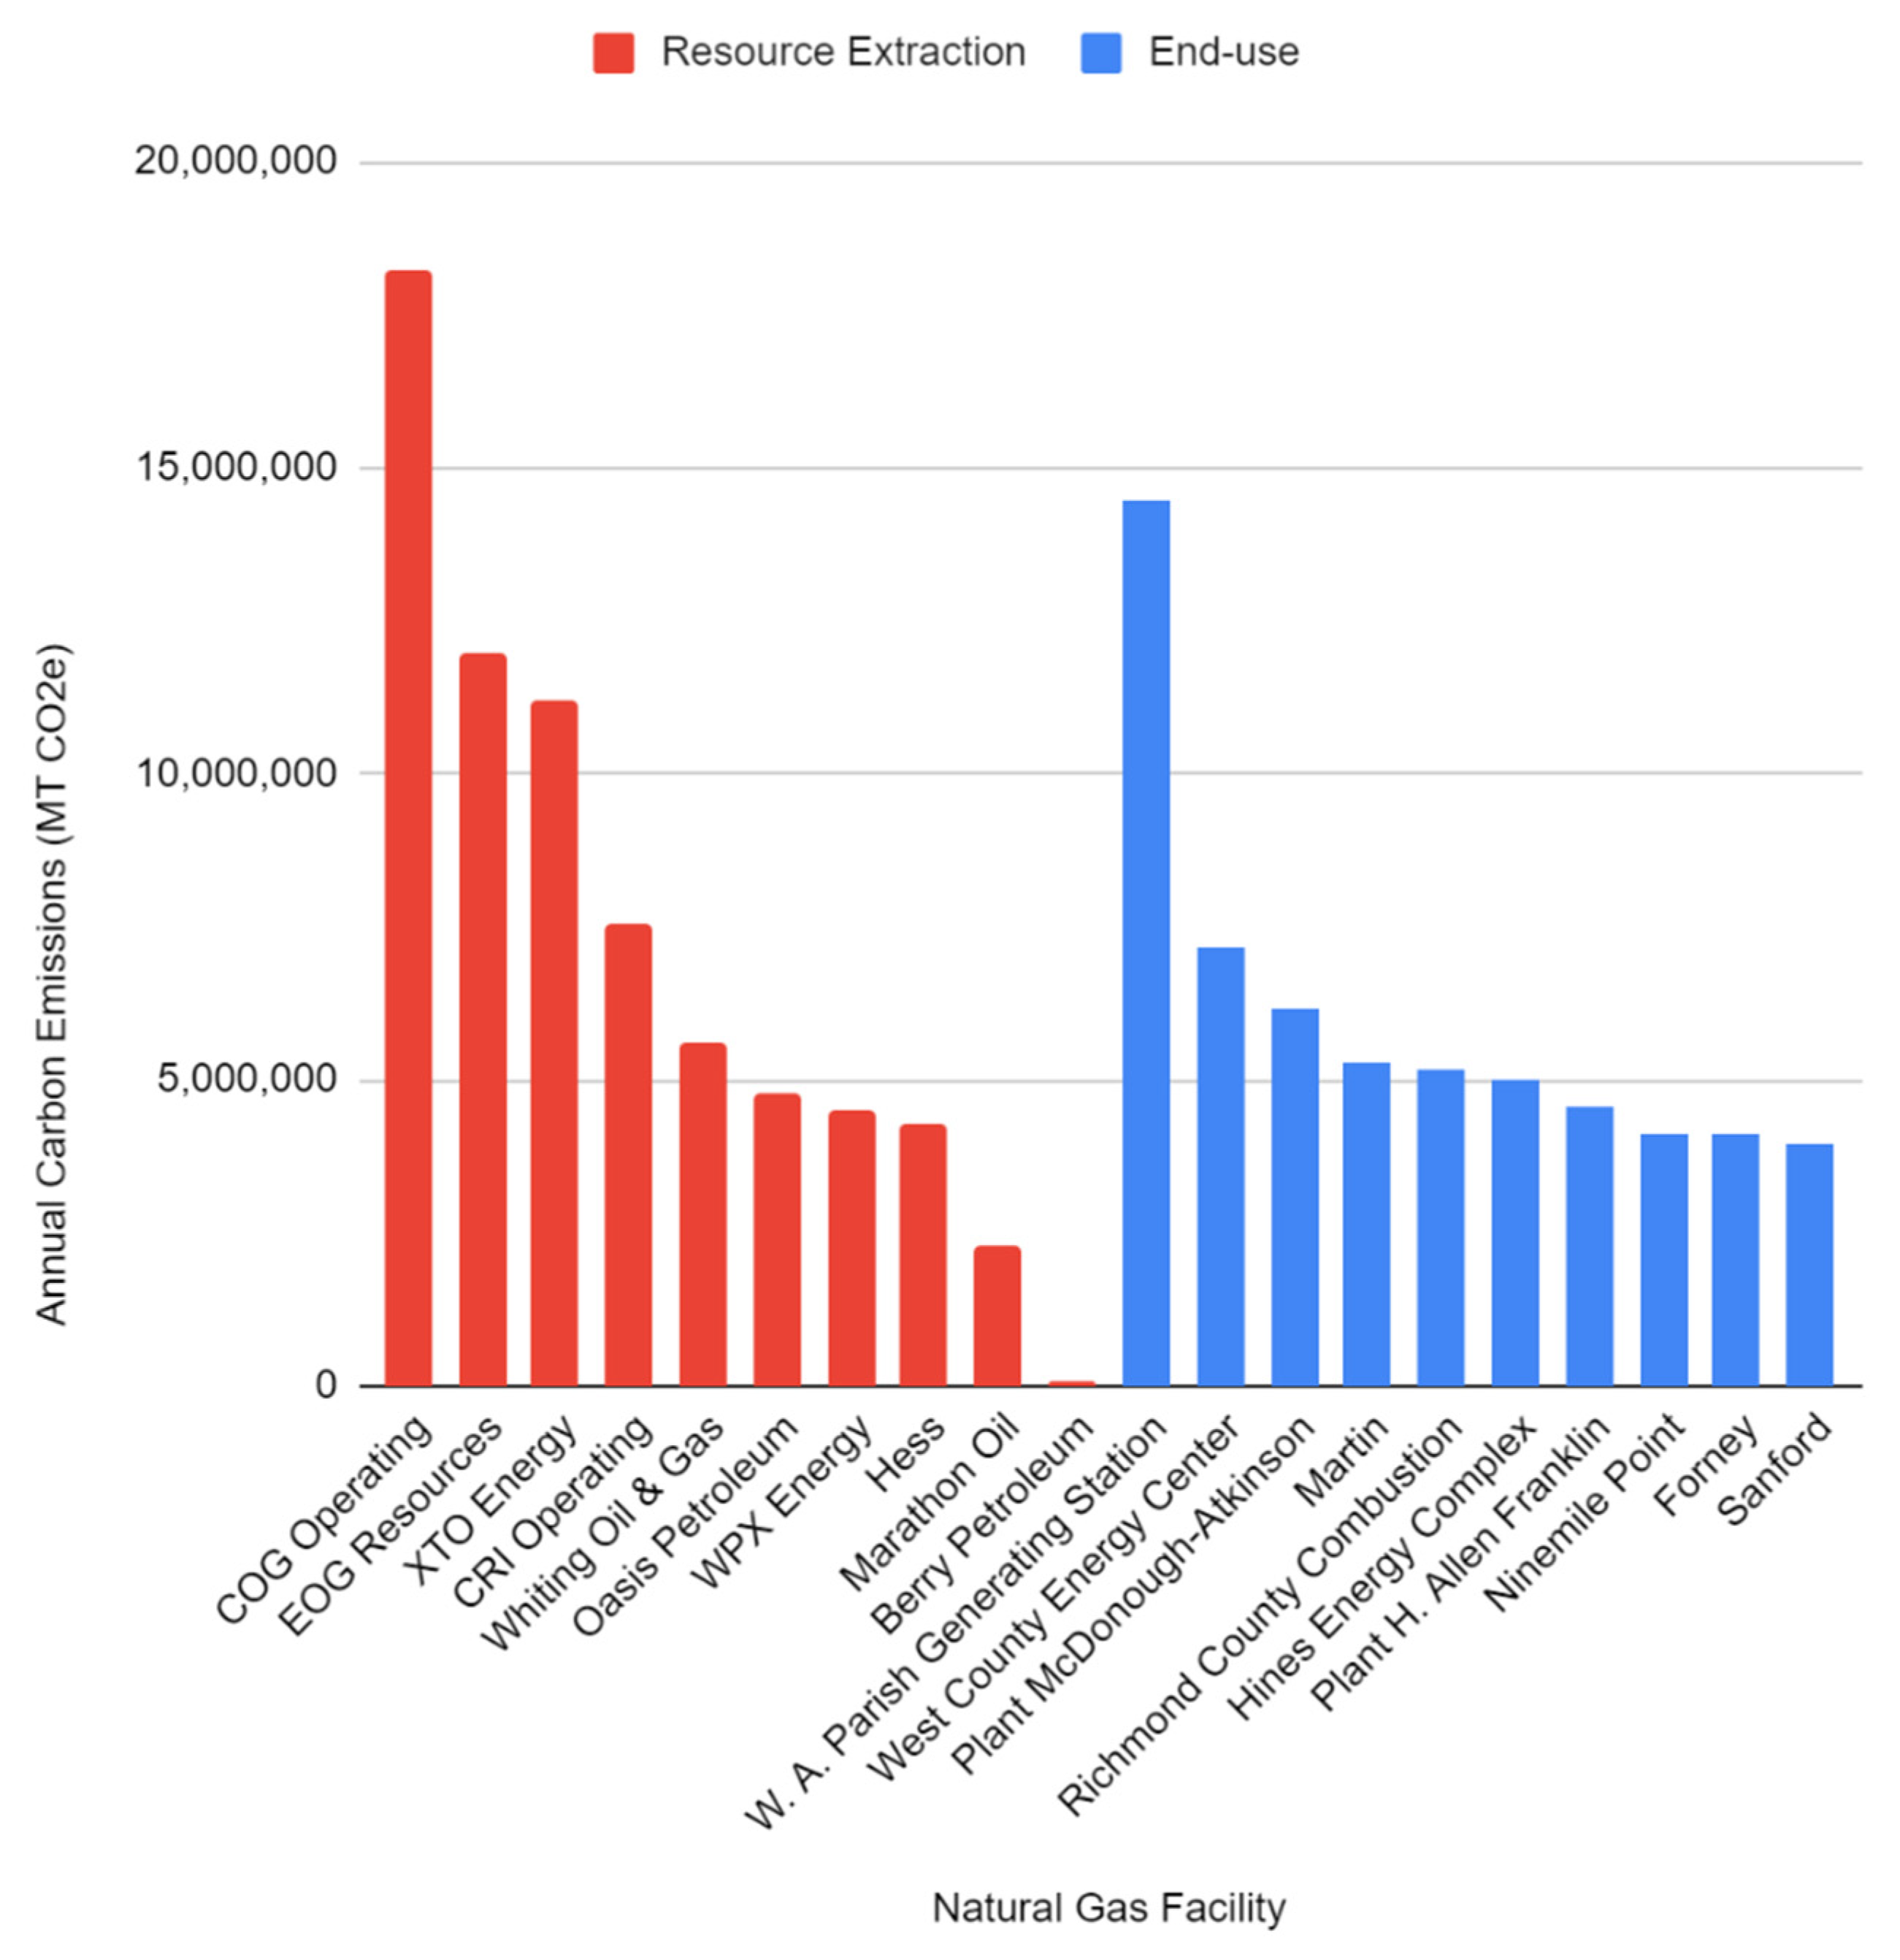
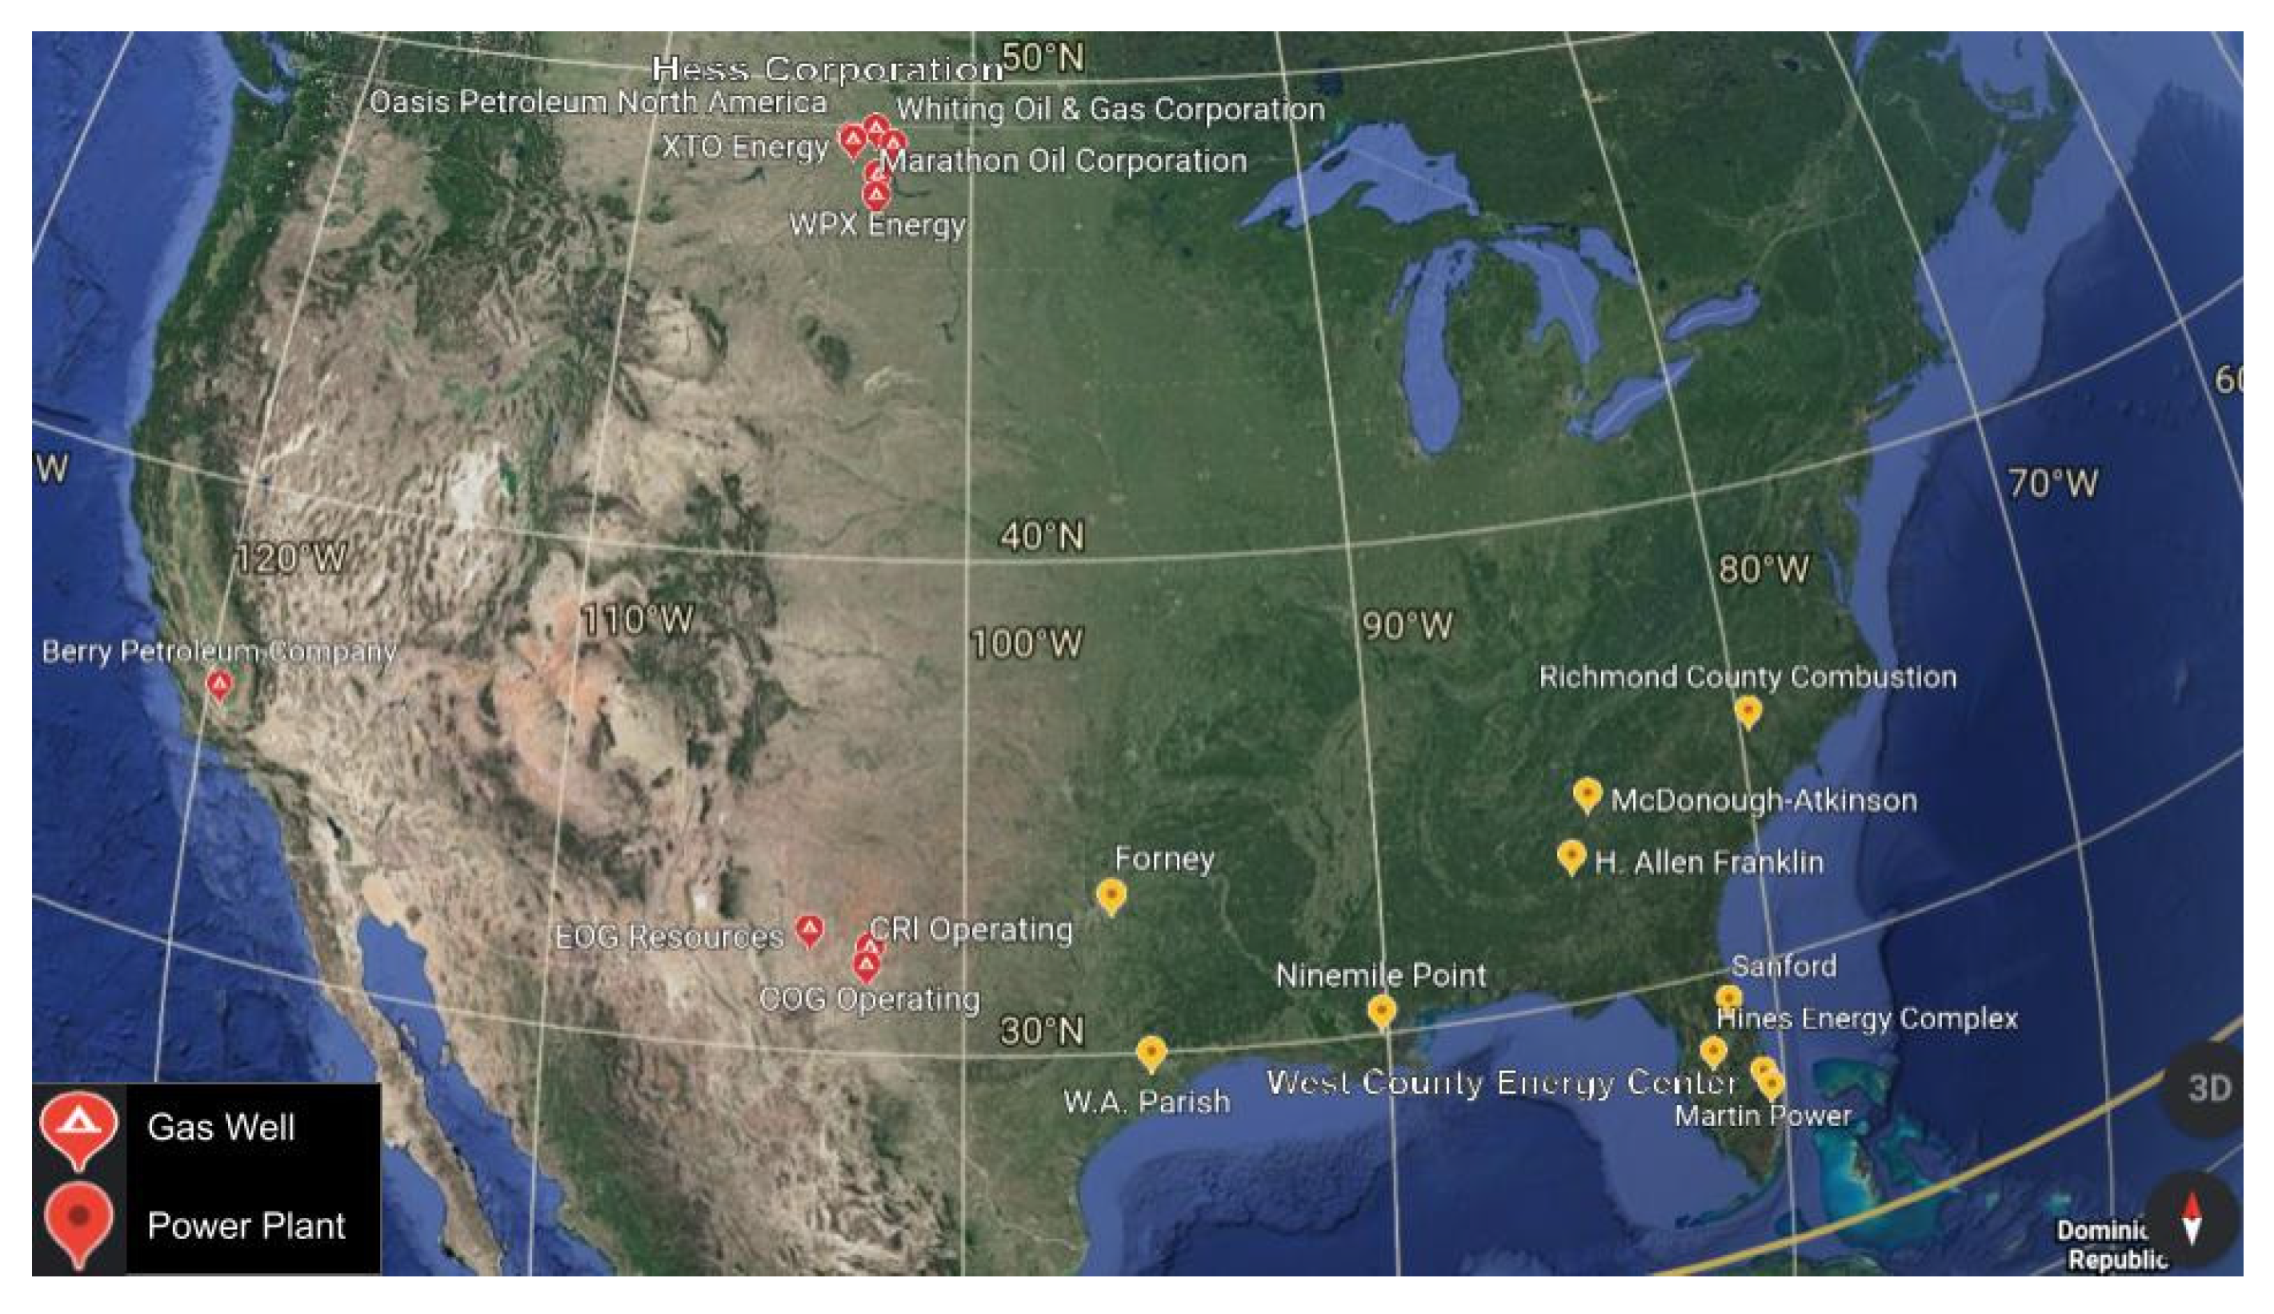
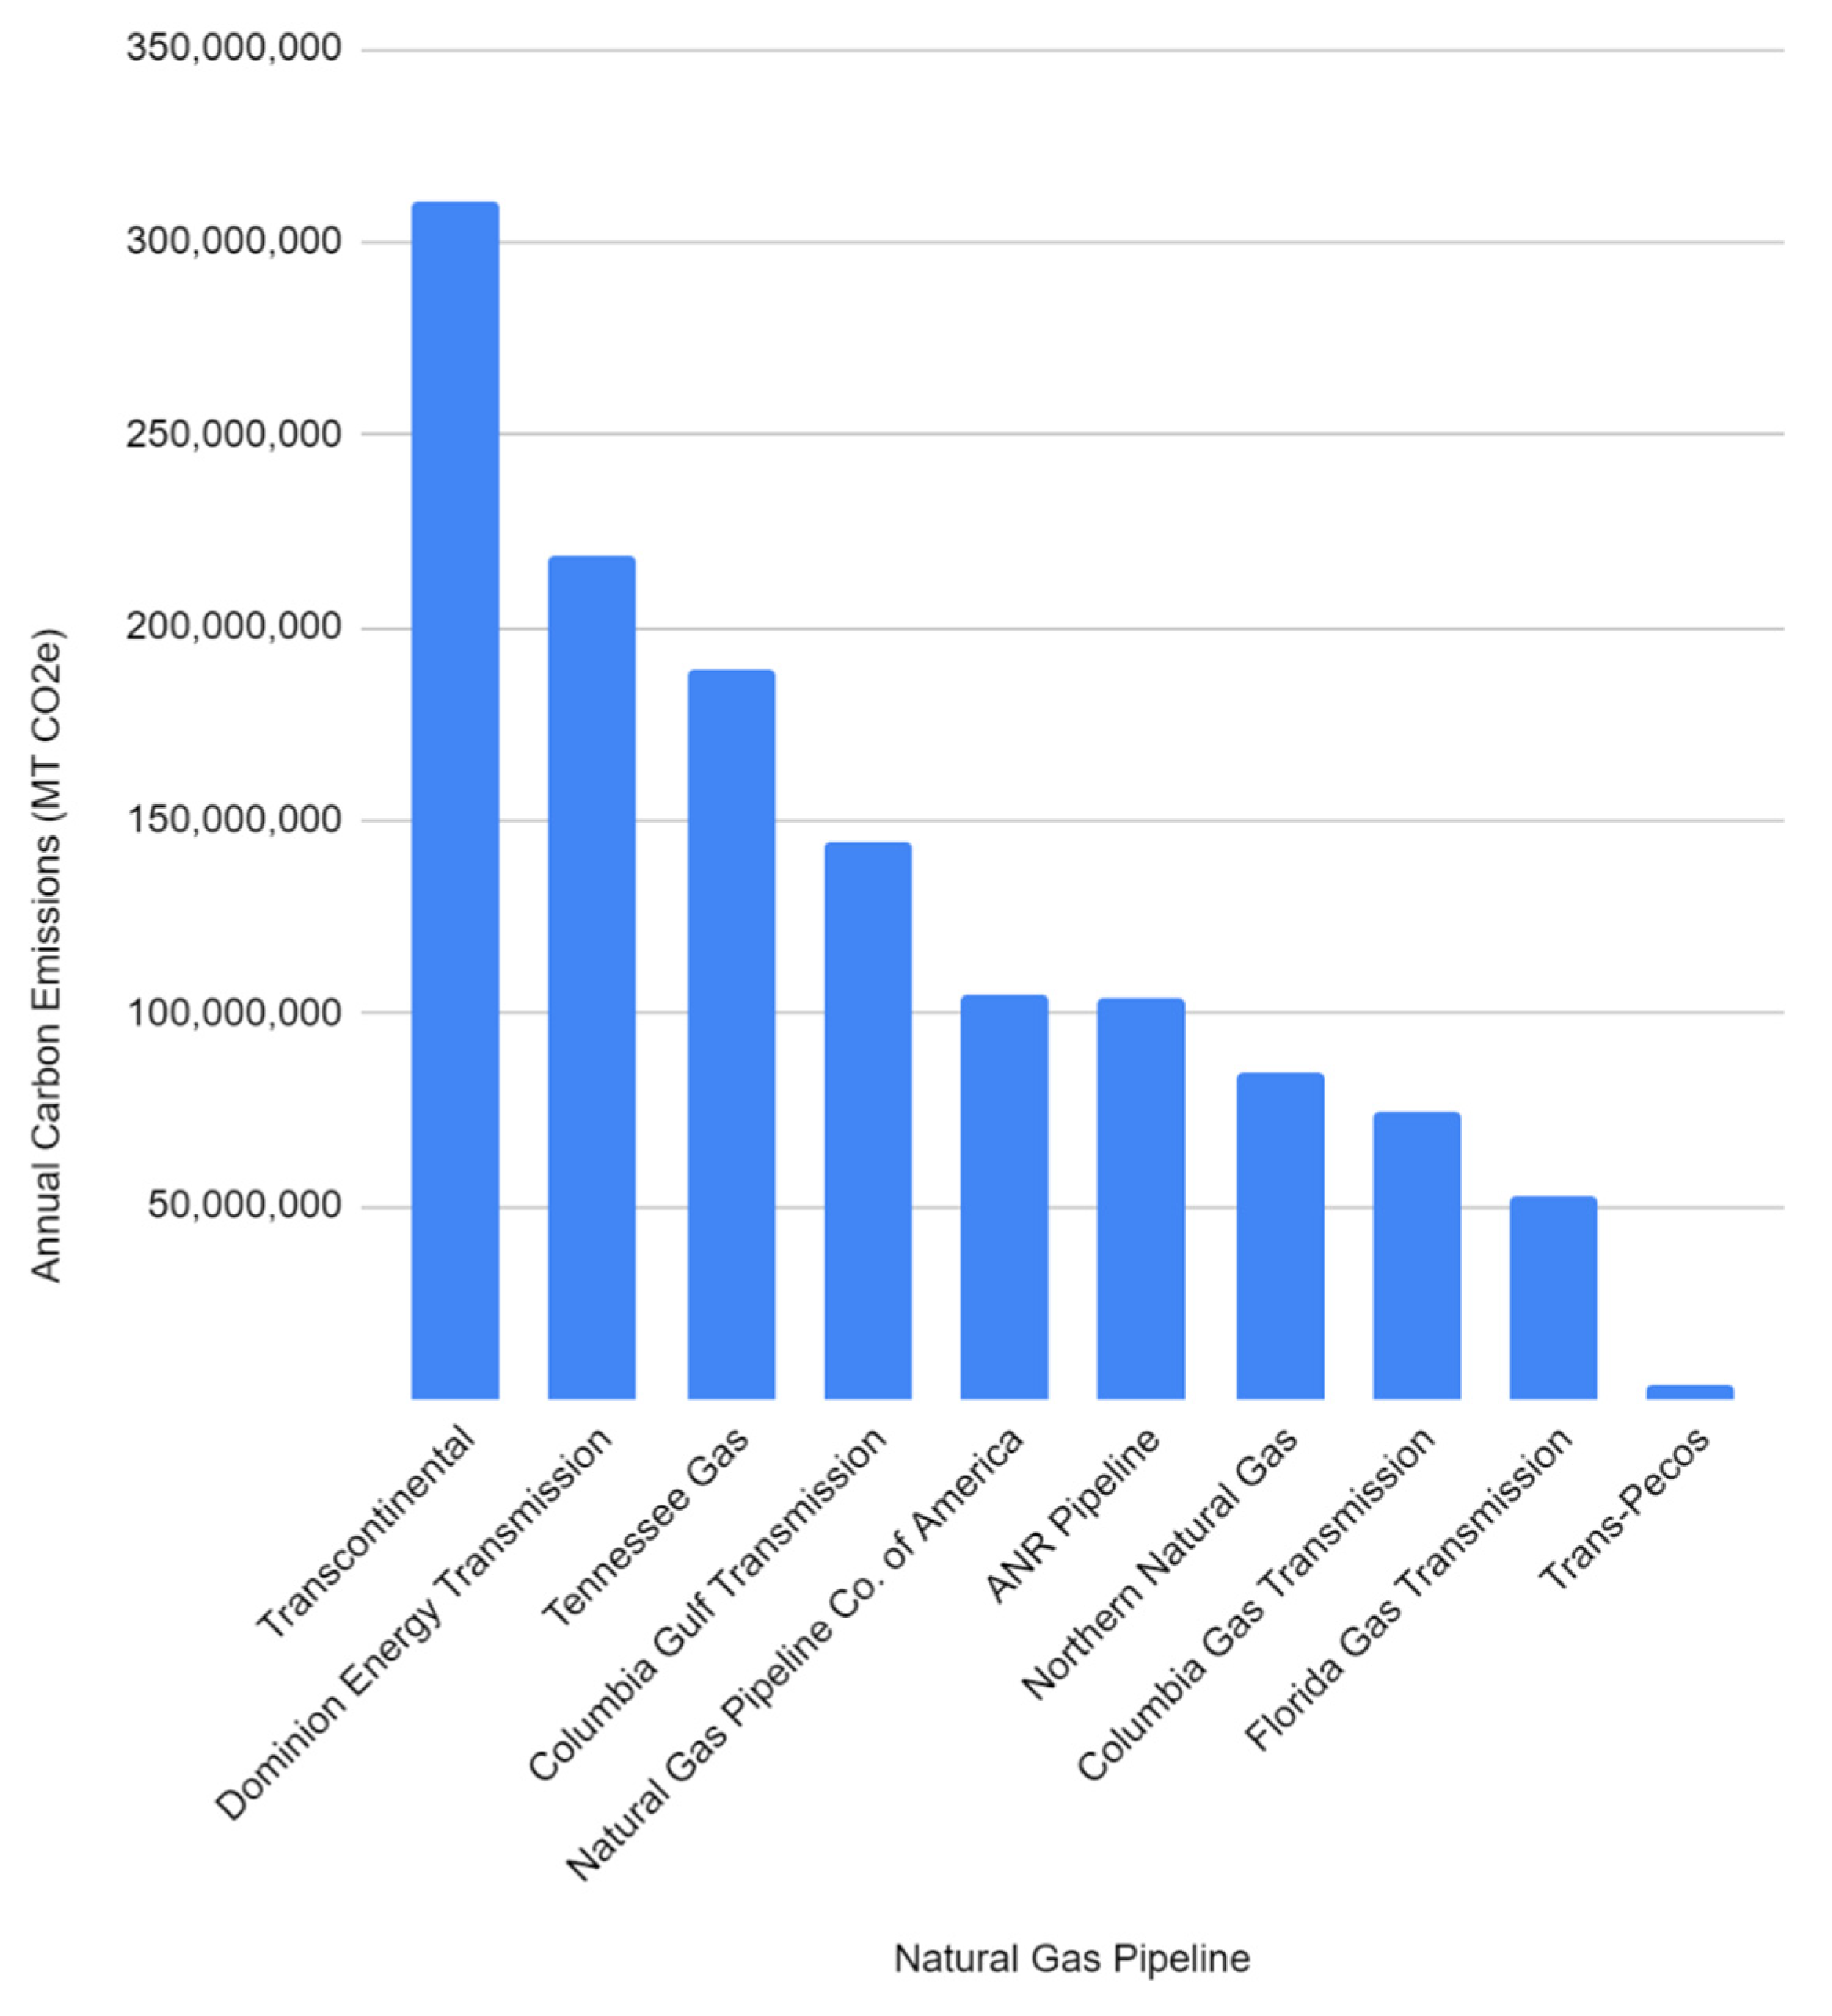
The bottlenecks for natural gas are shown in Figure 17, Figure 18, Figure 19 and Figure 20.
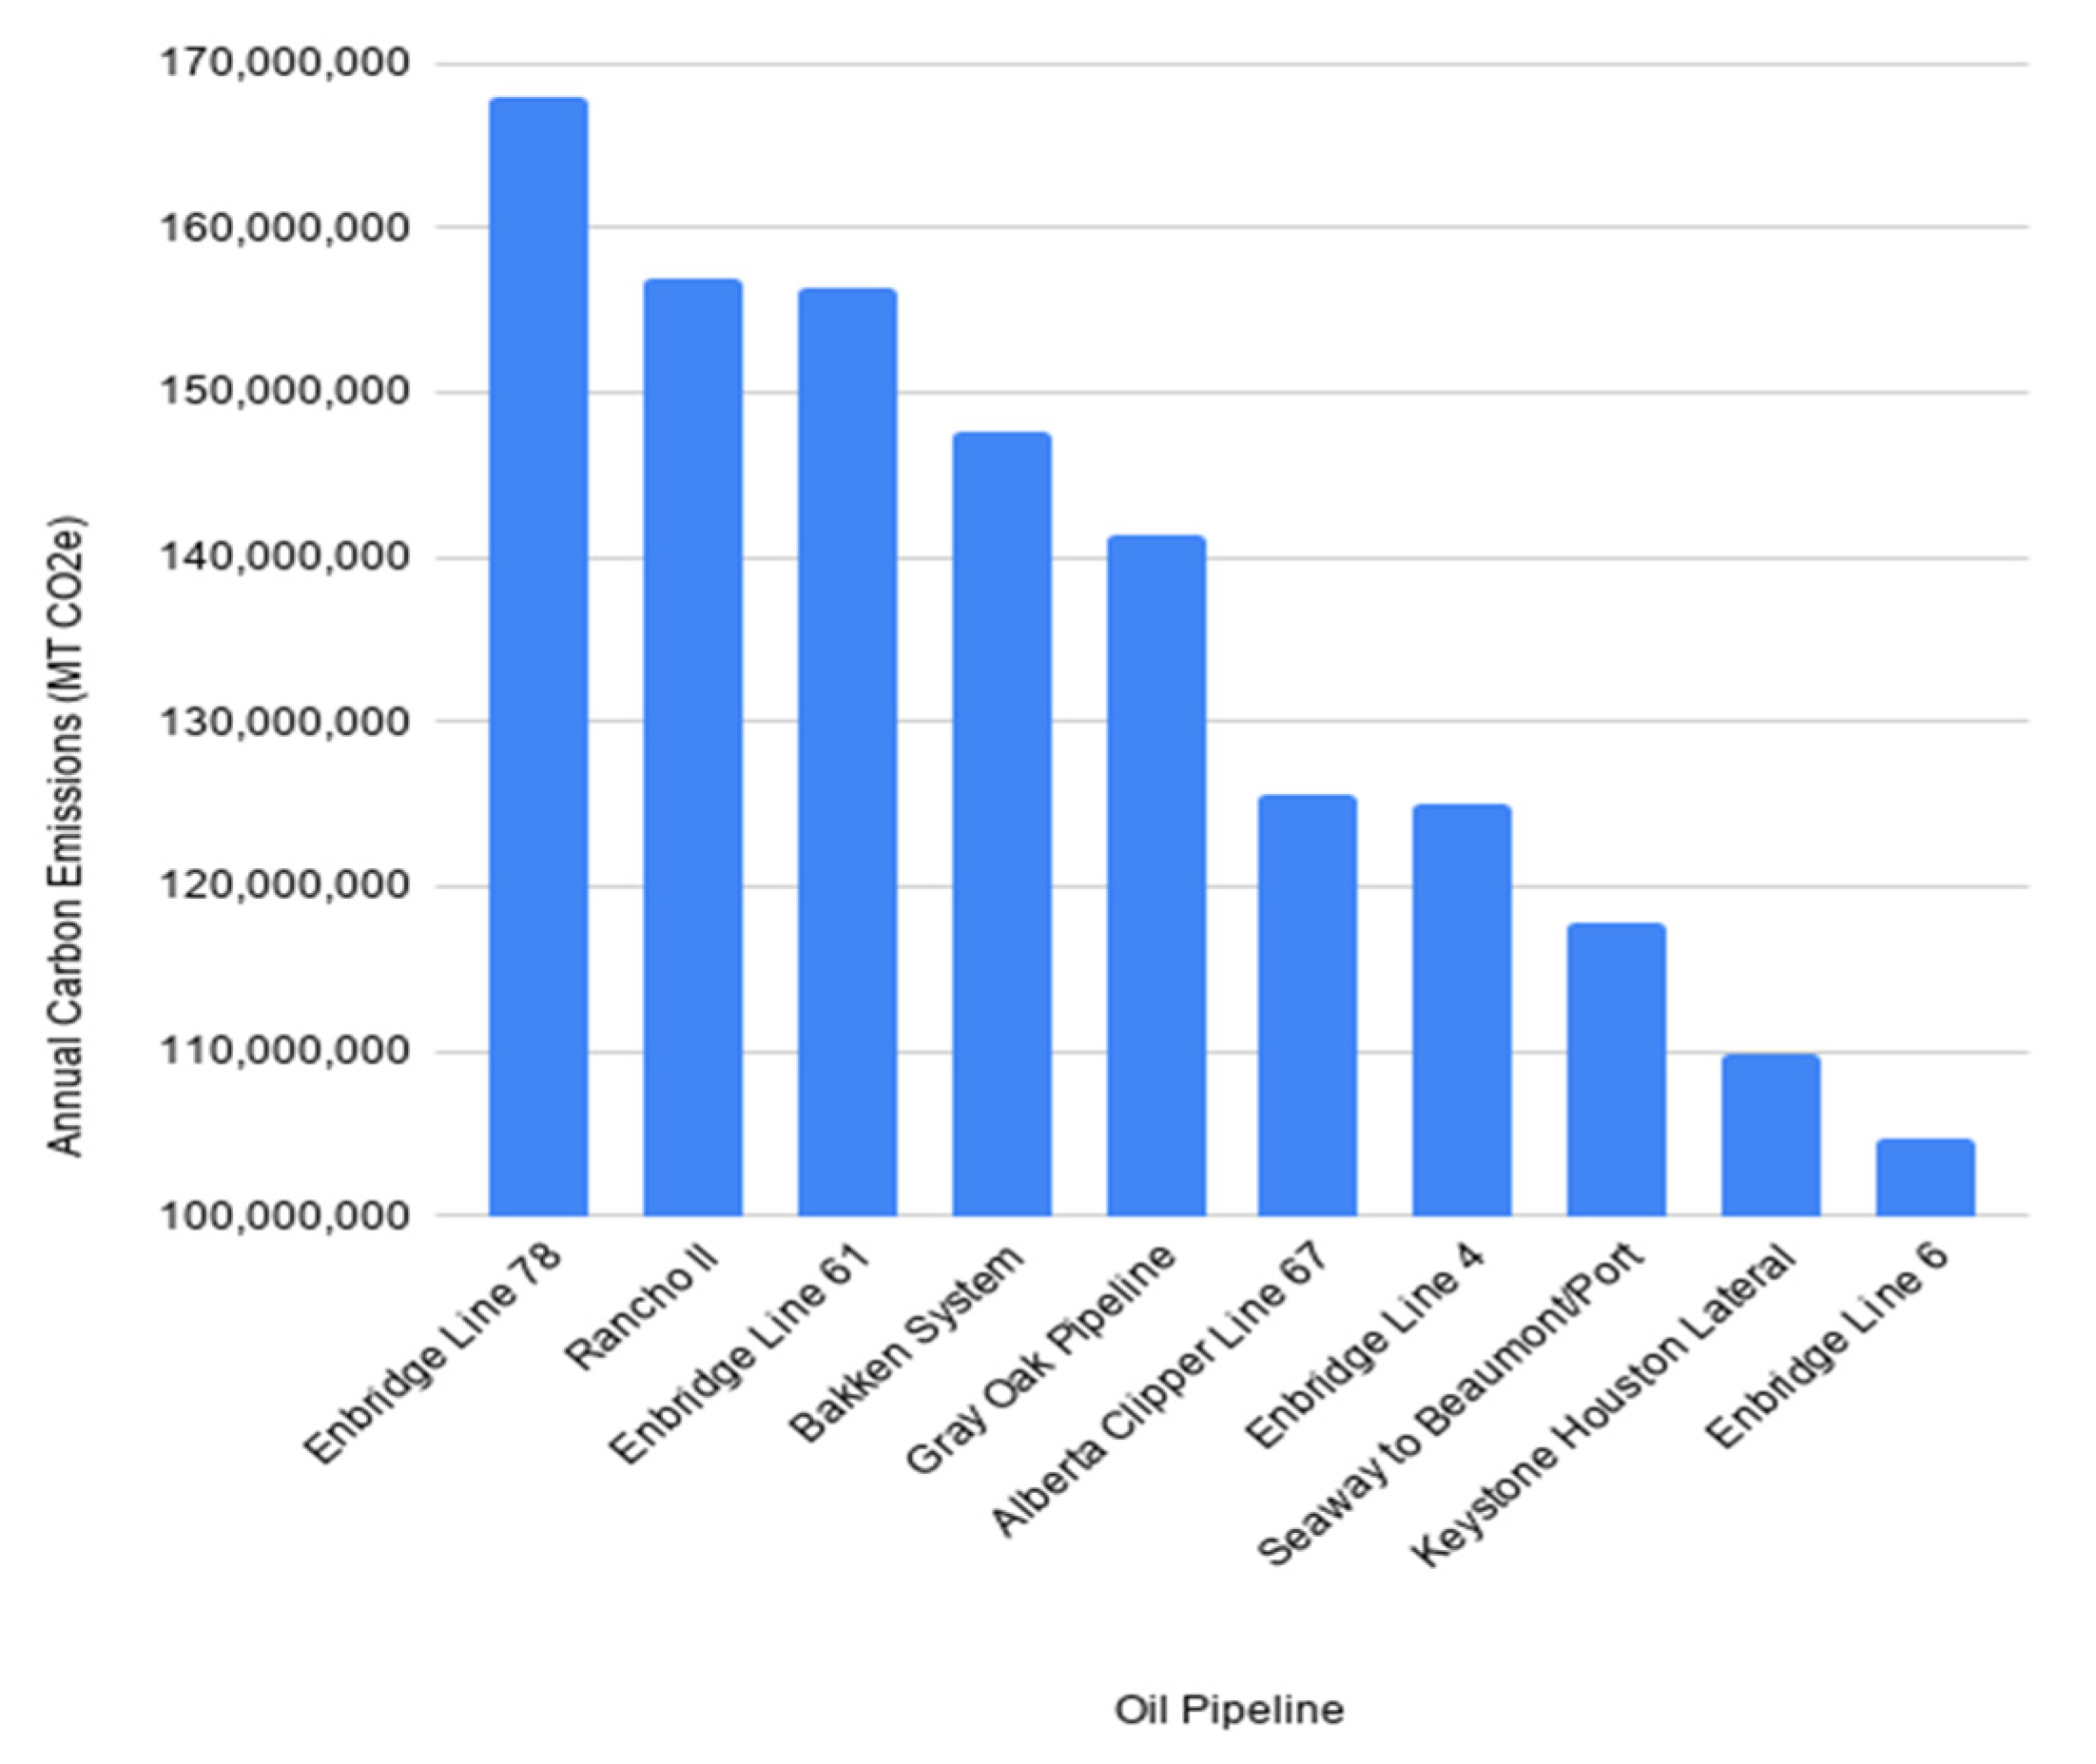
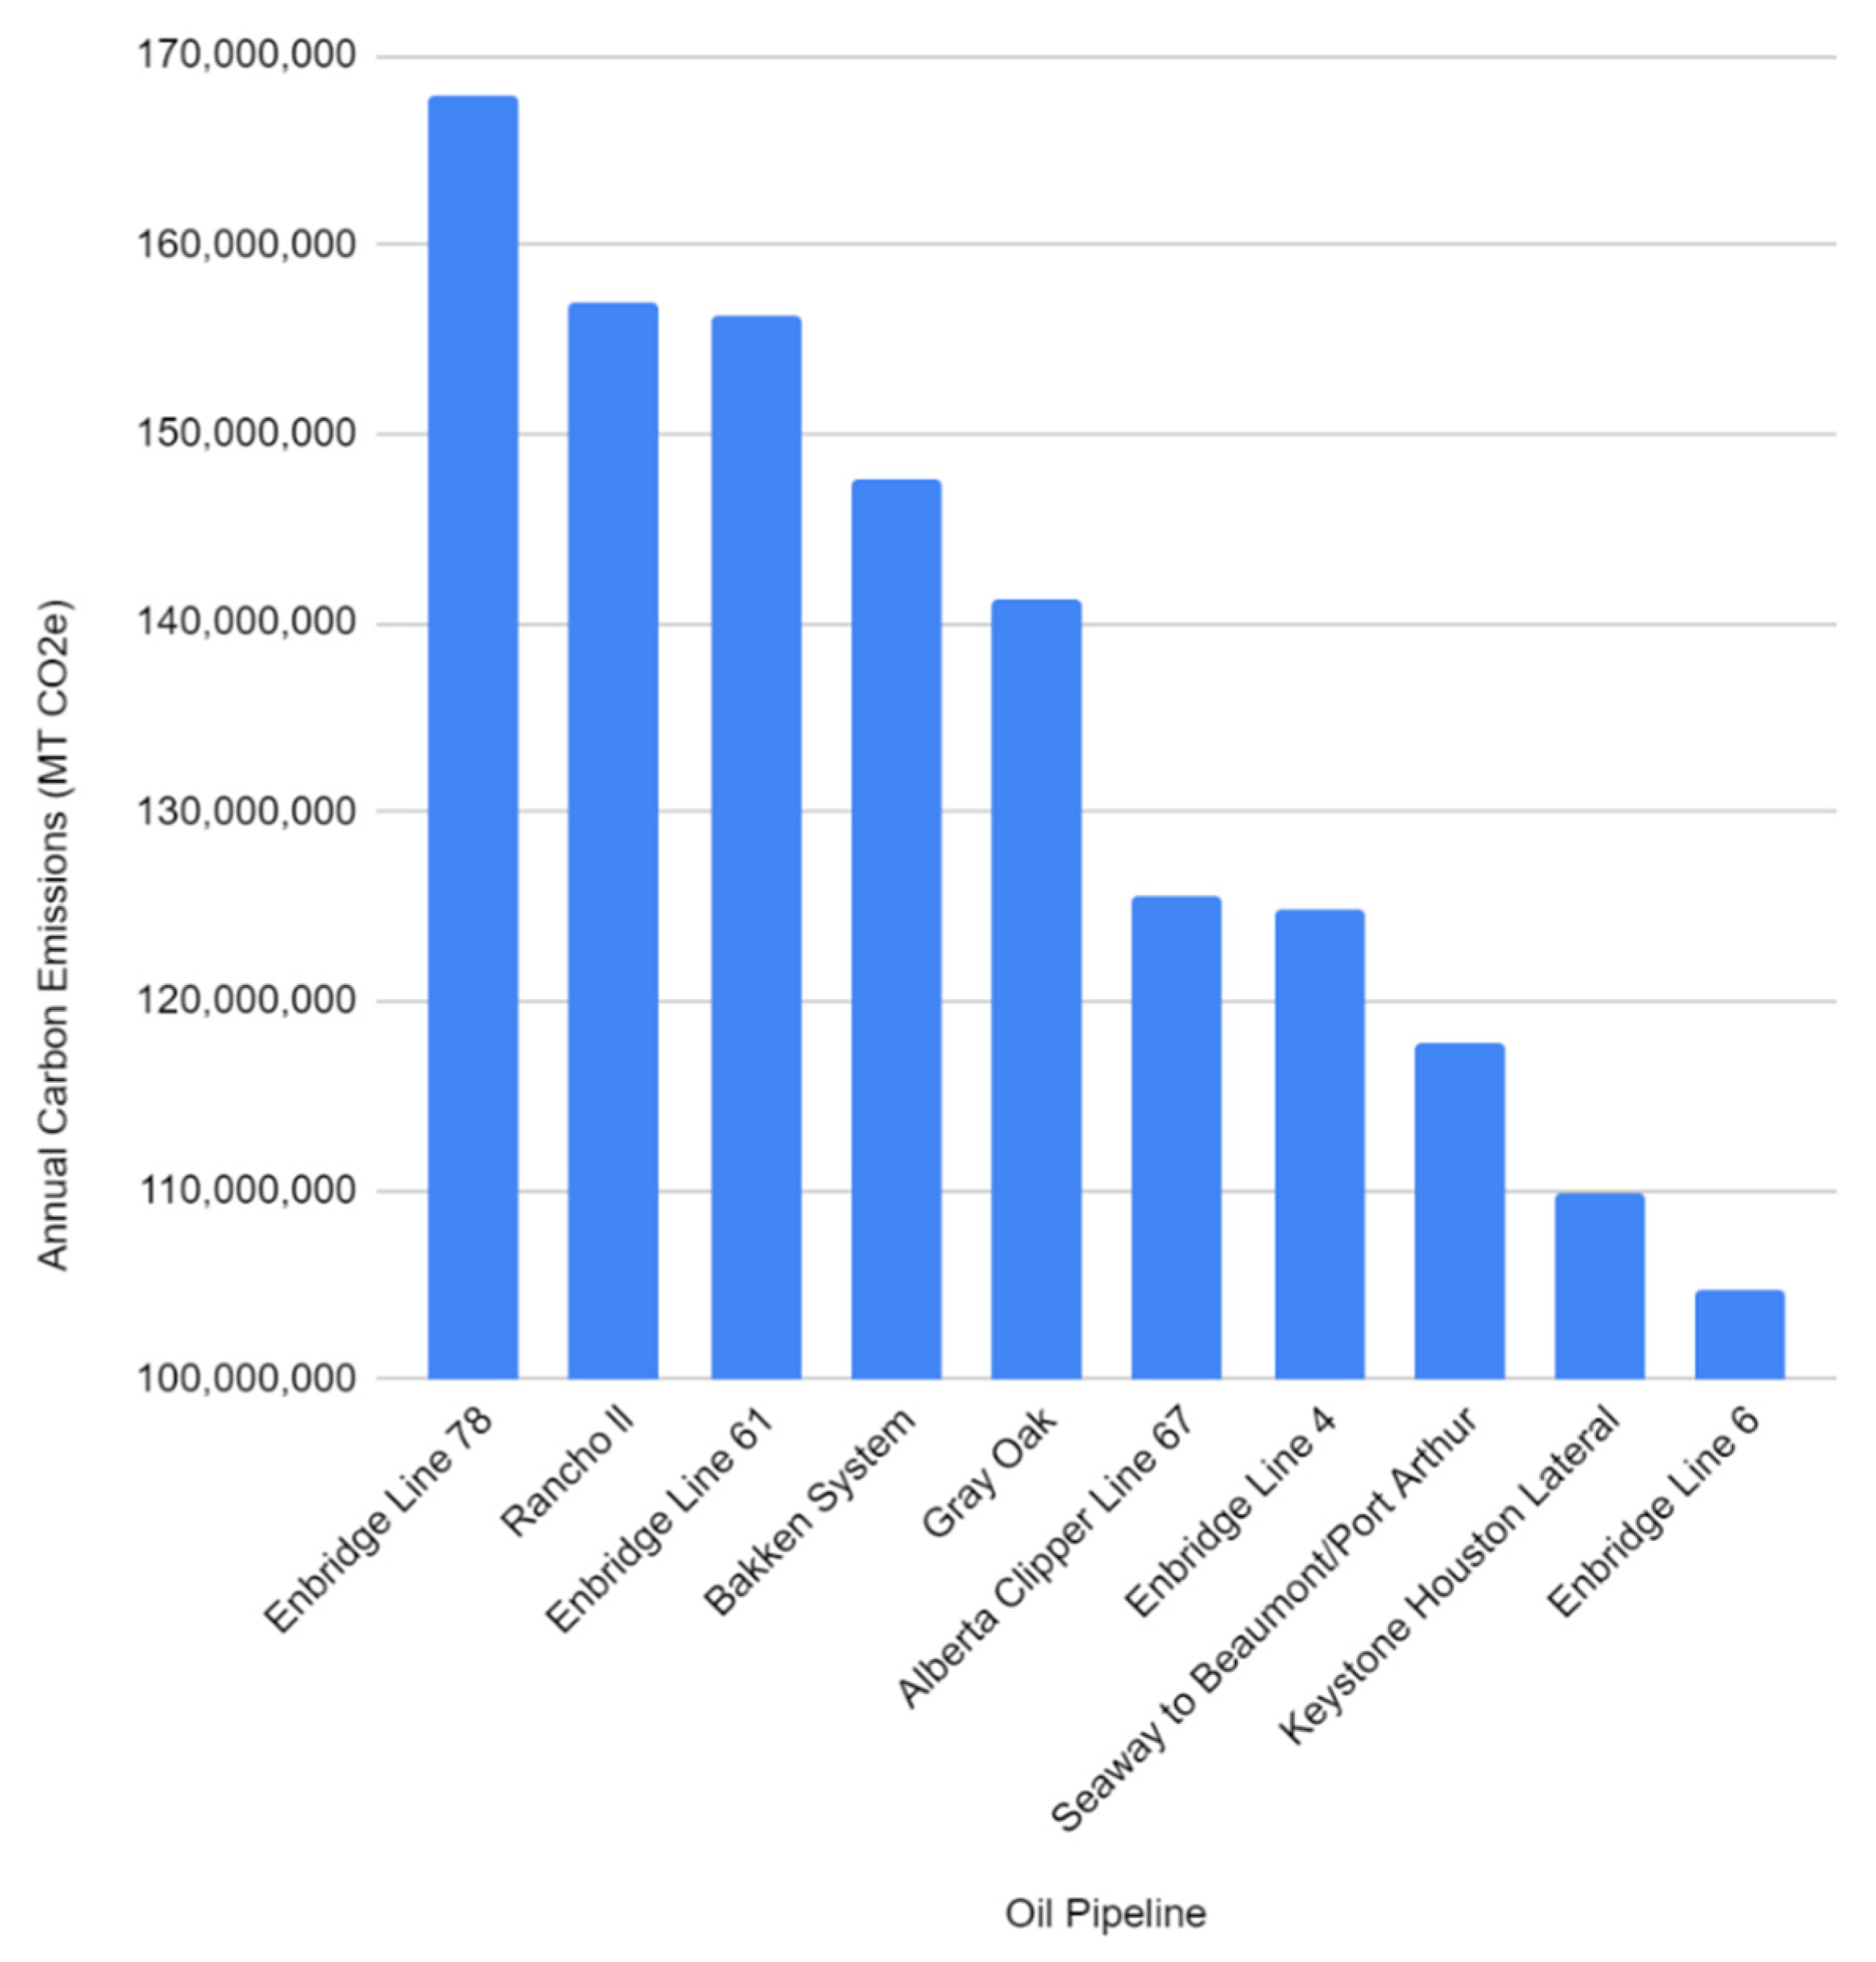
Figure 15 indicates that oil transportation is a substantial bottleneck for CO2 emissions- being responsible for 58% of the oil industry’s total bottleneck emissions. The oil distribution infrastructure in the U.S. operates at such a magnitude that it enables large amounts of fuel to move from inception to termination, directly and indirectly resulting in extensive CO2 emissions (1,242,898,050 MT CO2 e annually).
When comparing all three major processes within this sector, the transportation of oil incidentally enables the highest concentration of CO2 emissions per year, followed by end-use & refining, and lastly oil extraction.
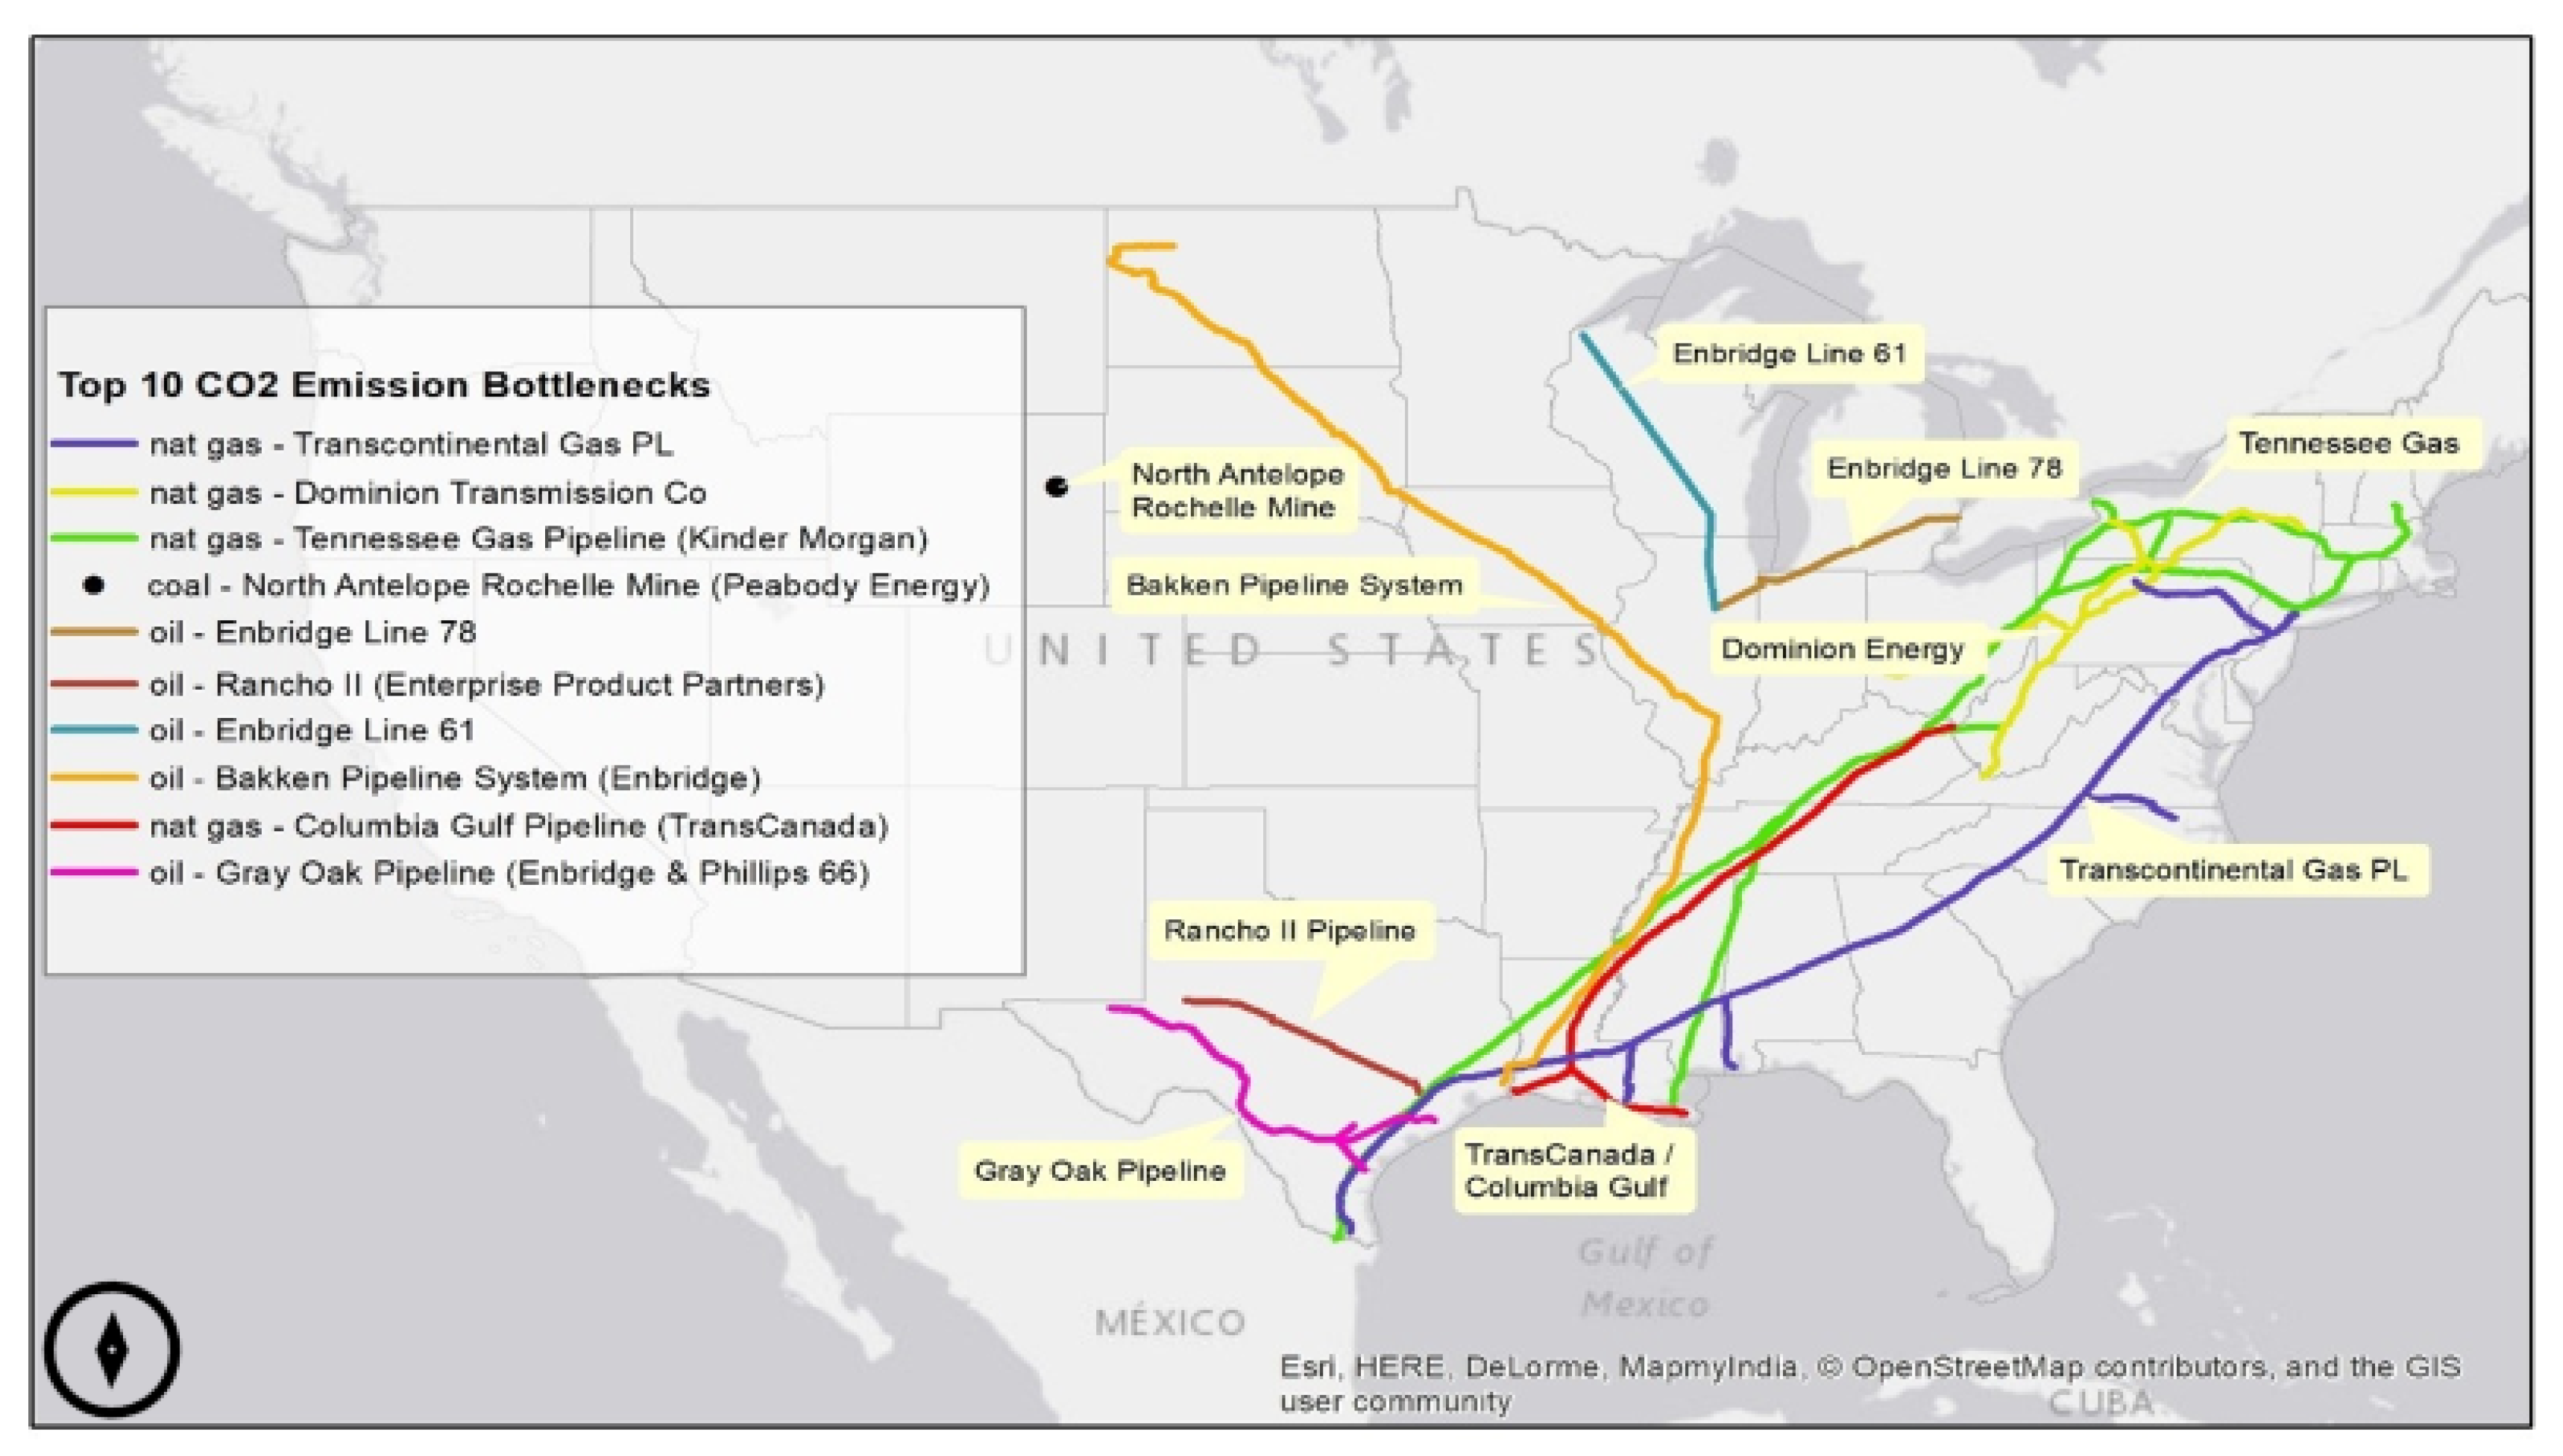
The overall results for the bottleneck calculations are shown in Figure 21 and mapped in Figure 22. Natural gas industry capacity data were retrieved from the EPA’s FLIGHT Tool [46] & GHG Summary Reports [46]. The well extraction of both natural gas and oil often occur concurrently as a joint venture by one facility, obtaining a product that is known as associated natural gas which occurs within deposits of crude oil [54]. Thus, all top ten natural gas extraction facilities are simultaneously listed in the top ten oil extraction facilities because of their large dual-objective operations.
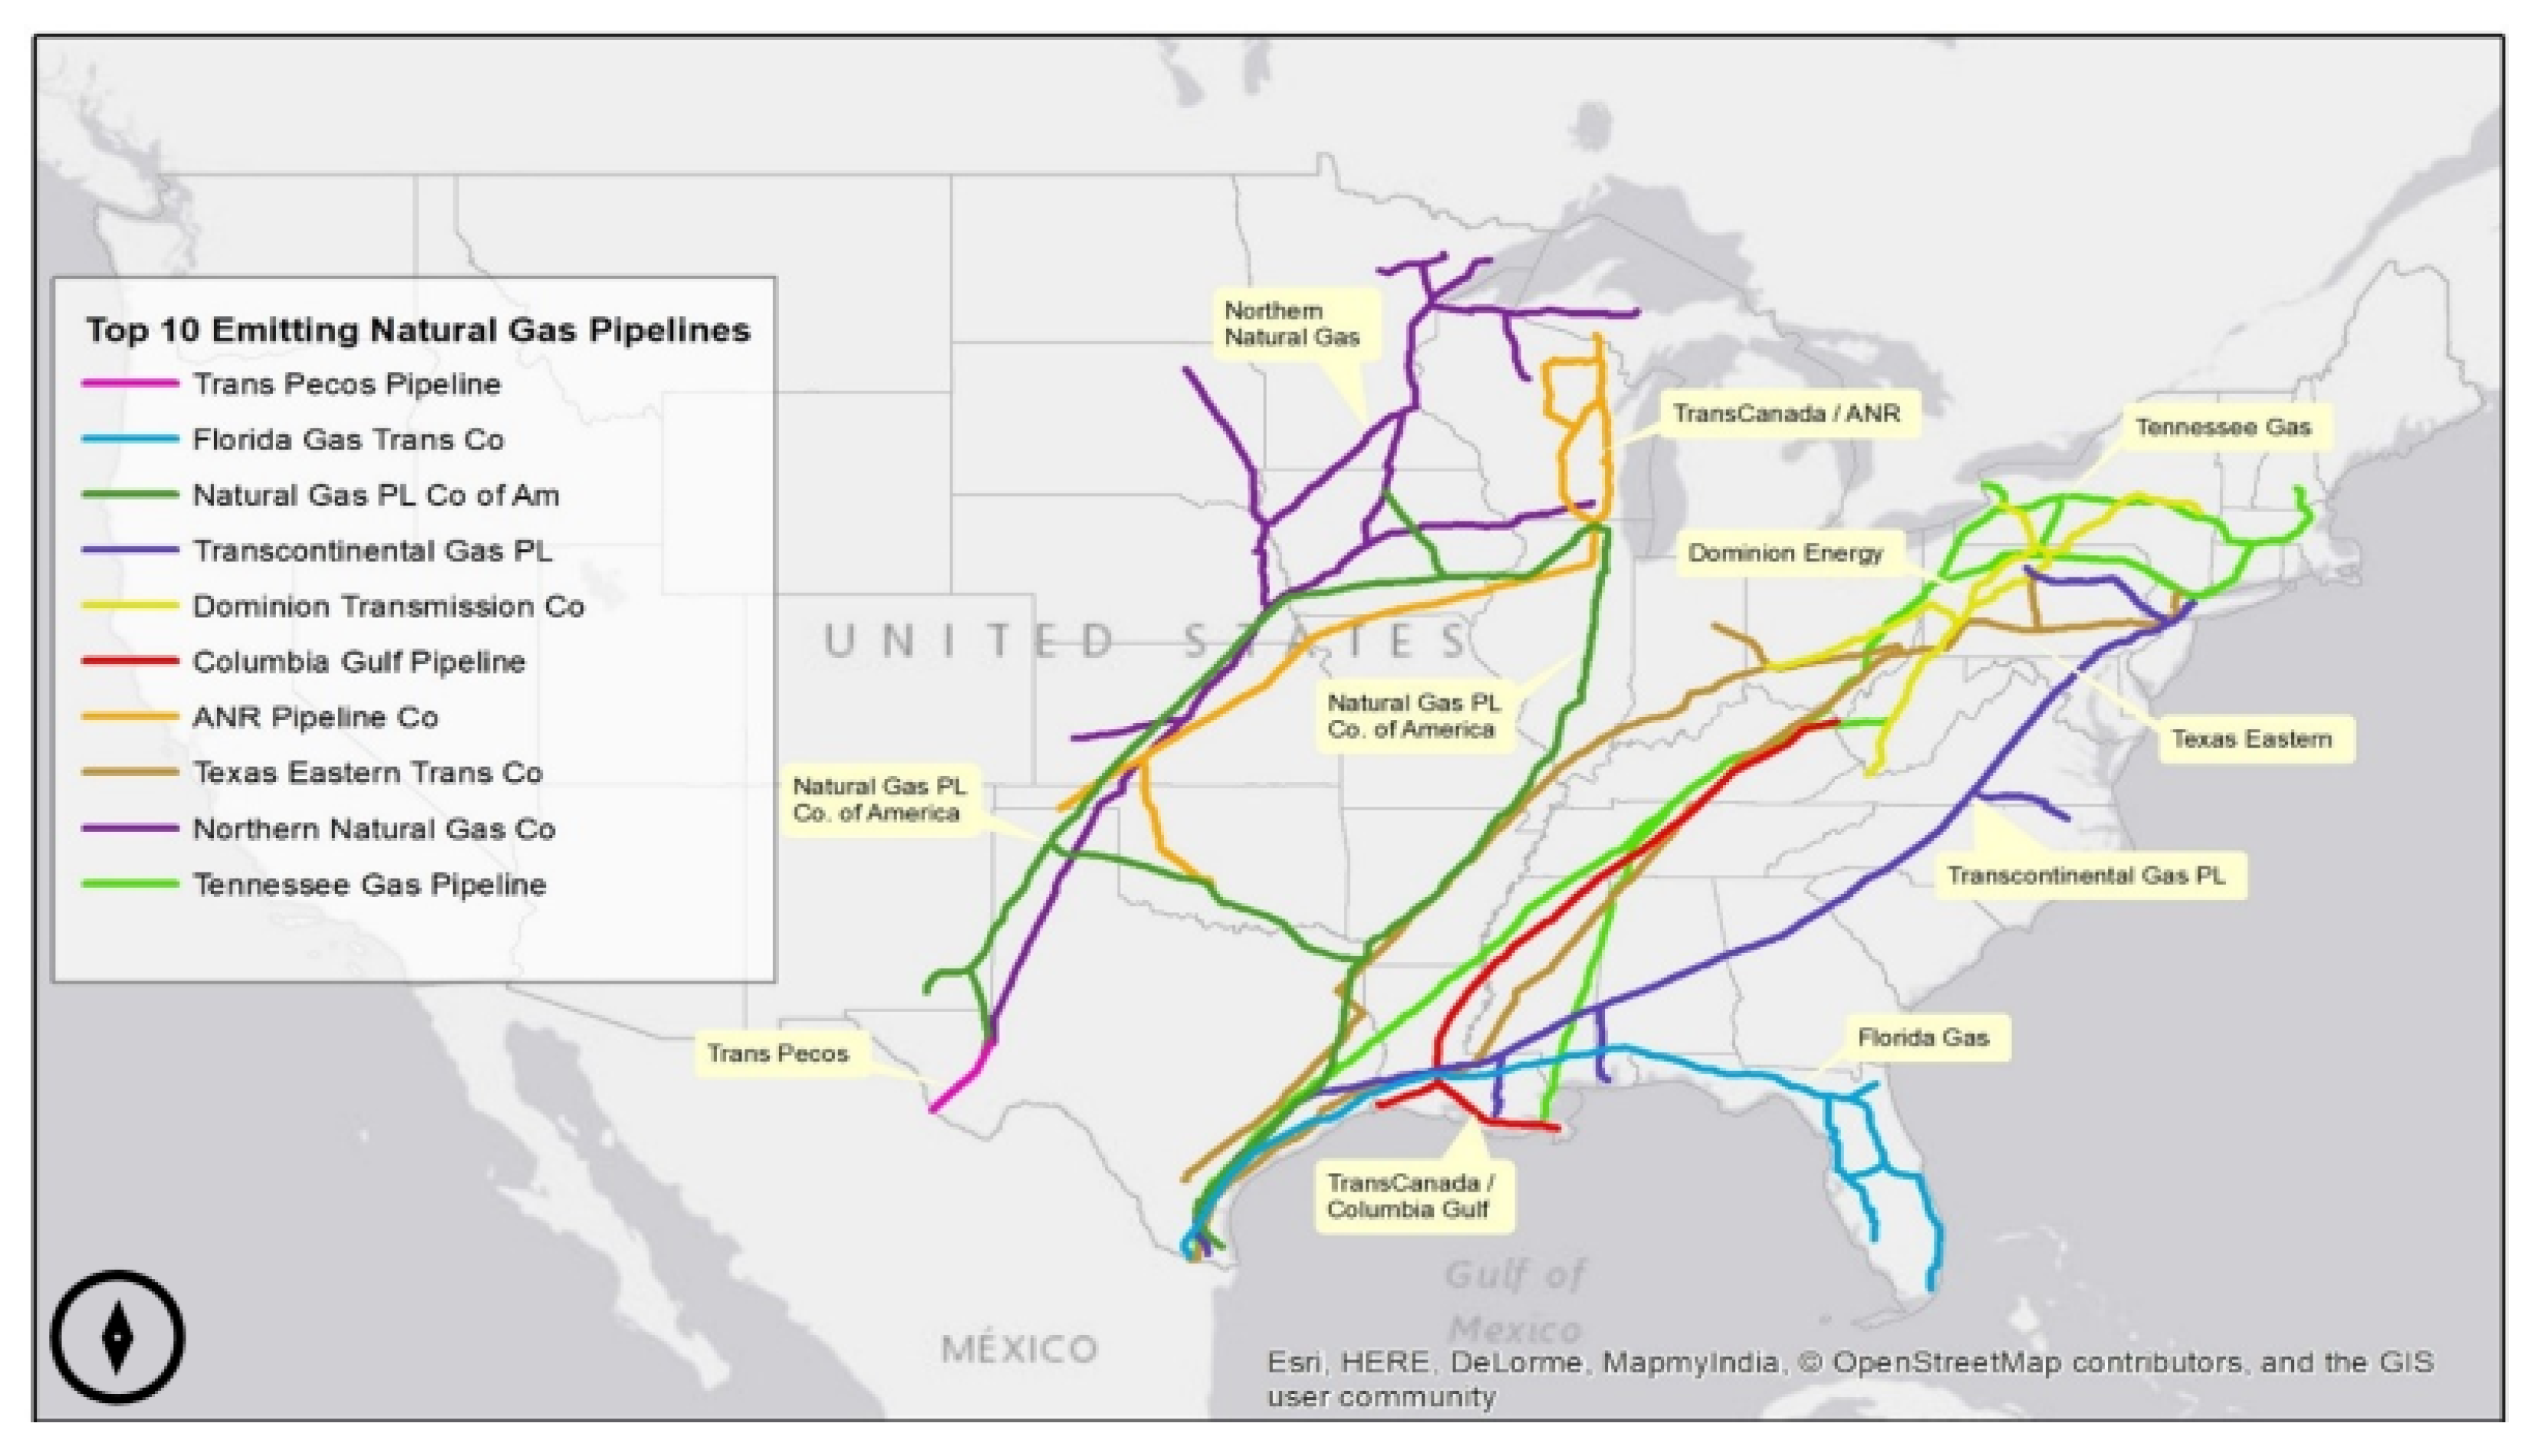
In comparison to both coal and oil industry activities, natural gas transmission ranks highest in terms of bottleneck capacity. When considering the entire natural gas industry, onshore transmission accounts for 91% of all CO2 bottleneck emissions (Figure 17 and Figure 19). Figure 20 illustrates the expanse of natural gas pipeline network, displaying the immensity of the interstate system that subsequently enables large quantities of fossil-fuels to disseminate across the American landscape, resulting in eventual CO2 emissions. In fact, the leading natural gas bottleneck (Transcontinental Pipeline) delivers natural gas over a 10,000-mile transmission system, spanning from south Texas to New York City. According to Williams, the owner & operator of Transcontinental Pipeline, they handle 30% of the natural gas in the United States, 15% of which is transported through the Transcontinental system [61] representing a major CO2 emission bottleneck.
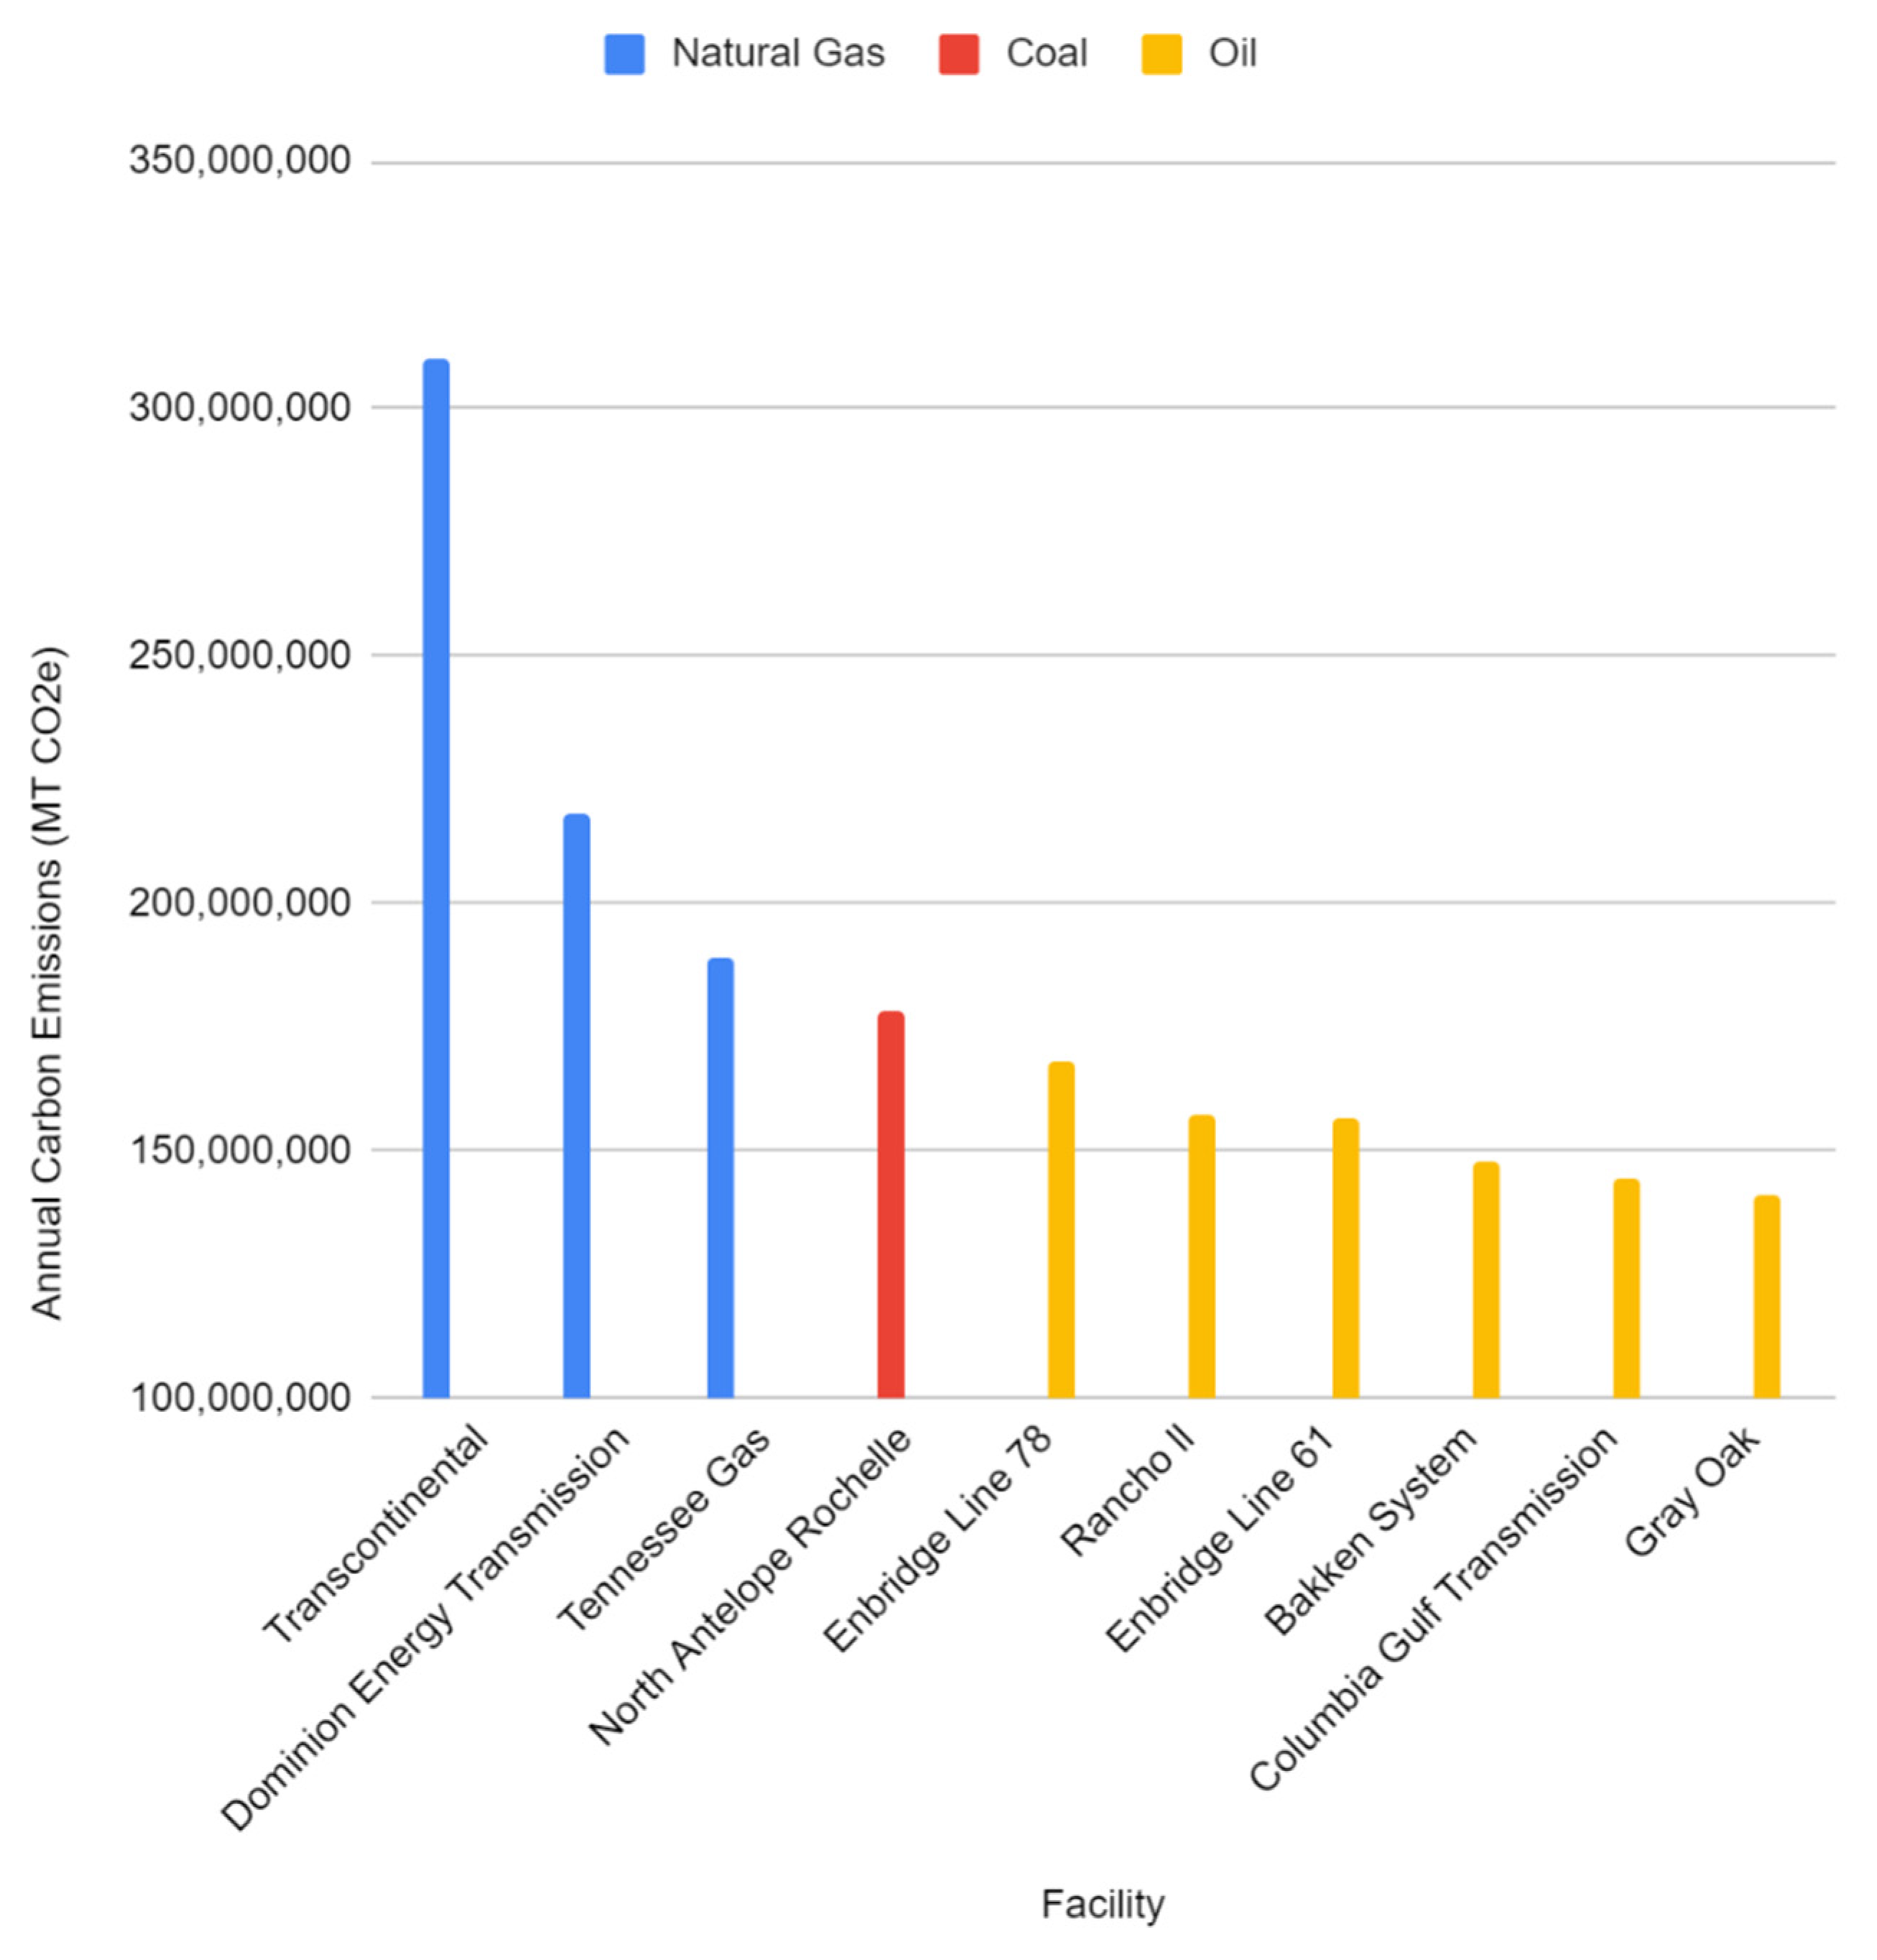
Based on the methodology employed in this study, the results reveal that the top 10 CO2 emission bottlenecks are predominantly constituted by oil and natural gas pipelines (Figure 21). Natural gas transmission accounts for 44% of the CO2 emissions produced solely by these top ten entities, while oil pipelines enable 47%, and a single coal mine contributes 9%. This finding suggests that the extensive capacity of the American pipeline system is particularly responsible for allowing the wide distribution of fossil-fuels, which consequently results in mass quantities of harmful CO2 emissions to be generated.

4. Discussion

A comparison of the results summarized in Figure 9 (conventional point) and Figure 21 (bottleneck) CO2 sources shows that oil and natural gas pipelines are far more important that simple point-source emissions calculations would indicate. It also shifts the emissions liability from bottlenecks towards the east coast from the Midwest (from simplistic point-sources). The results showed that the prominent CO2 emission bottlenecks are the transportation of both oil and natural gas, illuminating prime targets to focus environmental efforts against. While the extraction of oil is geographically concentrated in both North Dakota and Texas, the pipeline network is extensive and transcends both interstate and national boundaries, further complicating legal efforts. Seven out of eight of the oil pipelines responsible for facilitating the largest amount of CO2 emissions are operated by Enbridge Inc., a multinational Canadian energy distribution company. Overall, Enbridge Inc. is accountable for contributing 74% of the entire oil industry’s carbon emissions, making this company a likely prioritization for climate-related lawsuits. This may indicate that Enbridge is under particular risk for GHG emissions-related liability and thus warrant higher climate liability insurance premiums than other companies in the same sector. Considerable future work is necessary to calculate what these liabilities are to quantify the climate liability insurance premiums and the concomitant increase in the cost of natural gas and oil. As a whole, fossil-fuel related companies identified in Figure 9 and Figure 21 have several areas of risk management which will be discussed below. They have increased risks due to legal liability and they also represent prime targets for eco-terrorism. These effects would tend to increase insurance costs. Finally, they are under risk of either regulatory or technical obsolescence.

4.1. Natural Gas & Oil Transportation as CO2 Emission Bottlenecks-The Challenge of Liability

The companies and nations accountable for considerably contributing to the concentration of GHG’s in the atmosphere are potentially increasingly liable for the resulting change in climate and harmful effects of pollution [4,5,6,7,8,9,10,11,12,13,14,15,16,17,18,19,20,21,22,23,24,25,26,27,28]. Polluting industries are thus financially vulnerable due to potential liability for increasing risks [62] and litigation [63], regulatory compliance costs [64], and the direct and physical effects of climate change on their operations [65]. Schwarze has argued to strategically address the dangers of climate change, the resulting economic damages must be redistributed using social and regulatory mechanisms, including corrective justice measures to transfer the costs of climate change onto companies responsible for contribution to its impacts [66]. To divert the externality costs of pollution from victims, a possible approach is to apply tort law, as its basic goal is to reduce the societal costs of human activities and to compensate those who are unduly harmed [67].
Climate liability is an effective way to increase industry knowledge about the size and probability of economic damages resulting from their conduct, and to establish institutions such as insurance to minimize potential costs associated with charges against major polluting entities [66]. In pursuit of ensuring that polluting industries rectify the harm they have caused to the environment, there are a handful of potential methods of assigning liability for climate change-related harms. The polluter-pays principle is an immediate way to account for damages [66] and has been shown to maximize liability as the polluters are held directly responsible for their emissions [40,68]. Claims based on negligent conduct associated with GHG emissions, failure to address the dangers of climate change through alteration of business practices, nuisance claims based on the hazardous impacts of emissions, and environmental liability statutes such as the Comprehensive Environmental Response, Compensation, and Liability Act [69] are all common approaches to holding polluting industries accountable for their contribution to atmospheric GHG concentration and the resulting climate impacts [66]. Ultimately, any attempt to address climate change related damages has inherent challenges and remains a convoluted endeavor in the United States and the broader global community. It is postulated that the option for victims to seek compensation for climate-related harm has the potential to discourage hazardous conduct of polluting industries, as pressures from victims for severe mitigation efforts is weakened in response to the availability of retroactive compensation [33]. Compensation, however, can serve numerous functions beyond payment for an injury, including the generation of a stimulus for change in business practices, and the assignment of responsibility for harm to specific polluting actors [33]. Consequently, major polluting companies face considerable exposure to compensation claims, litigation, and regulatory risk, as well as reputation damage if they fail to adopt proactive measures to reduce their GHG emissions [70].

4.2. Insurance as Risk-Management for Fossil-Fuel Pipelines

Establishing risk-management schemes for both fossil fuel companies and their insurers could preemptively mitigate their exposure to liability charges discussed above, with insurers supporting businesses’ development of liability-risk strategies and encouraging behavior that accounts for the dangers of their conduct [65]. This proactive risk-management approach to insurance is the preferred scenario for all parties, as policyholders protect themselves against liability to an extent while inevitably becoming more cognizant of the magnitude of the risk associated with their operation. For pipelines transporting hazardous material, a risk management program is mandatory [71]. This preemptive condition to acquiring insurance coverage for pipeline operators reassures the insurance company that the operator has considered potential incidents and has developed a pre-planned response [71].
Of the varying classes of insurance that are relevant to pipelines, liability insurance is arguably the most critical [71]. Beyond insurance for property damage, business interruption, and construction, liability insurance can insure against damage caused by pipeline malfunction including leakage, explosion, fire, pollution, and casualties [71]. However, insurance does not safeguard against all causes of damage, but only accounts for specific perils [71], demonstrating that even a major natural gas or oil pipeline operator is vulnerable to liability charges beyond the scope of their insurance policy, namely the emission of GHGs. Further, the content of a pipeline considerably effects the level of risk to be insured, with hydrocarbon liquids and gases having the highest hazard and polluting potential [71]. Thus, it can be expected that pipeline operators identified in this study as having the highest emissions bottleneck potential such as Williams or Enbridge Inc. most critically need to consider liability insurance risks and the limitations of mere coverage, making stronger the demand for preemptive risk-management strategies and alteration of conduct. Major oil pipeline operators like Enbridge Inc. are at the mercy of environmental, commercial, and product liability charges [65], vulnerable to claims from victims who allege negligence, injury, or property damage as the fault of the insured polluter. Because estimating the impacts associated with pipeline incidents and GHG emissions from the oil industry is not an exact science, there is frequent underestimates of the consequences and inadequate coverage [65]. Insurers insure many of the primary carbon-intensive industries and it is anticipated that the brunt of the cost of climate change impacts will be incurred by these insured businesses [72]. Insuring against catastrophic events is challenging due to the high risk for underwriters, expenses of handling a large number of claims, and difficulty in assessing future harm [71], thus there are concerns that private company insurance may be insufficient to deal with large-scale GHG emission impacts such as climate change.
Ultimately, the insurance industry’s response to climate change is of compelling importance as societies seek mitigative and adaptive solutions that include liabilities for insurers and their policyholders [66]. With regard to the mega-polluting actors of the fossil fuel industry, insurance coverage might prove vital to survive. Perhaps more than any other institution, the insurance industry has the capacity to make contributions to preemptive pollution mitigation through demanding risk-management strategies and tightening the terms and conditions of coverage [65], forcibly altering the conduct of major polluting actors. While ex post action directed at holding polluting industries accountable for GHG emissions is crucial, the value of the preemptive effect of ex ante action can effectively prevent and abate future CO2 emissions.

4.3. Insurance and Investment Risks of the Major Pollution Bottlenecks: Oil and Gas Pipelines

The results of this study have shown oil pipelines may now present a substantial investment risk in part because of potentially increased insurance risks. These risks stem primarily from emission related liabilities. Compensation for non-market damages to natural resources explicitly exists in U.S. law (CERCLA), and these compensation schemes provide insight into potential pathways for future victims seeking compensation for GHG emissions-based damages. Specifically, there are different types of potential GHG lawsuits: (i) interstate claims, (ii) claims between private parties and the states, (iii) claims between private persons and industry, (iv) claims between states and industry, (v) claims between nations, and (vi) class action lawsuits [40]. In Connecticut v. American Electric Power Co. several states and environmental groups filed a significant climate change-related public nuisance lawsuit [73]. The plaintiff’s alleged that coal-fired power plant’s operation is a considerable public nuisance, and rather than seeking compensation in terms of monetary relief the states sought a mandated cut of emissions of a specified percentage for each following year [65,73]. Although the court dismissed this case as nonjusticiable under the political question doctrine [65], it illustrates the potential risks to not only lawsuits seeking compensation, but also those that could change a company’s ability to function in a particular way.
There are several other specific risks involved with oil pipelines. First, there is a risk of sunk costs. There is a significant transition underway in the automobile market to electric vehicles—which makes oil pipelines particularly exposed as compared to the other technologies [74,75,76,77]. The Electric Vehicle Regional Market Penetration tool developed by Noori & Tatari [76] forecast that by 2030, electric vehicle market shares are predicted to account for 30% of new automobile sales. This electric vehicle market penetration is expected to impact both energy consumption and CO2 emissions, and in the presence of continued technological innovation and supportive policies, has the potential to substitute nearly 1 million tons of gasoline with 3.2 billion kWh electricity and reduce 0.6 million tons of CO2 emissions by 2030 [77]. In addition, with the reduction in cost of renewable energy sources (wind [78] and solar [79]) reducing the cost of electricity below those of fossil fuels [80], this indicates further economic pressure favoring electric cars. There are very few oil-burning power plants as they are uncompetitive with NG or renewables, which places the future demand of oil in question [81,82]. Finally, 4% of the world’s fossil resources are used in plastic production [83], but this can also be reduced as recycling can be expanded when there is a financial incentive for consumers to recycle (without it the global plastic recycling rate is about 9% [84]). The new concept of distributed recycling with additive manufacturing (DRAM) has been shown to be economically advantageous for consumers to use their plastic waste to make high value products thus offsetting additional virgin plastic production [85,86,87]. Even if all of the current market drivers do not materialize to reduce oil use there has been substantial discussion about regulating carbon dioxide emissions, all of which would be expected to reduce oil demand and raise the costs of using it as a fuel [88,89].
Lastly, there are physical risks to pipelines themselves. The insurance risks related to natural disasters (historical leaks and the cost of environmental disasters) are already contained within insurance rates. Climate change, however, is increasing natural disasters [90,91] and would be expected to increase insurance rates for pipelines. Pipelines are well known targets both in times of war and from terrorists [92,93]. As negative consequences of climate change mount and pipelines are identified by ecoterrorists as being the primary target, there may be a wave of attacks strategically targeted against pipelines [94,95]. Future work is needed to quantify this risk as well as determine what increases in insurance rates would be expected. Oil pipelines are particularly vulnerable in this respect because of their physical exposure. For example, a drunk hunter accidently caused 150,000 gallons of oil to spill (one of the worst in the Trans-Alaska Pipeline) simply by shooting one bullet into the pipeline [96]. All of these factors must be carefully reviewed by long-term investors into oil and gas pipelines as the risks may far outweigh any potential returns.

4.4. Future Work

In addition to the applications outlined above there is future work to be completed on this approach by integrating a full life cycle analysis (LCA) [97], with updated values for current industry practices in each of the fossil fuel sectors. LCAs for renewable energy sources, are far more numerous in the literature because the emissions from fossil fuel plants are dominated by the combustion of the fuel itself. LCA are needed for targeting the full potential emissions over a given infrastructure’s lifetime (e.g., would it be better from an emissions standpoint in the long term to target a new pipeline than a pipeline that may have higher capacity but was nearing its end of life?). In addition, future work could evaluate the different assessment methods encompassing direct emissions (on-site as is generally done using the point source method and compared here as for a single coal-fired power plant) [98], indirect (up-stream as in emissions from leaking natural gas pipelines and natural gas fields [99,100]) and induced (down-stream as in automobile emissions from processed oil [101]. These LCA-based results being incorporated into the methodology demonstrated here would expected to have some impact on the prioritization of lawsuits and other techniques meant to decarbonize the electric industry, however, as the emissions are dominated by the combustion the general trends found from this analysis provide a much more thorough strategic guidance than using point sources alone.

5. Conclusions

This paper has presented a comprehensive bottleneck calculation of CO2 emissions in comparison to traditional point-source methods in order to effectively prioritize targets for climate liability. Results indicate that the top ten CO2 emission bottlenecks in the U.S. are predominantly oil and natural gas pipelines, with oil pipelines accounting for 47% and natural gas transmission accounting for 44% of the CO2 emissions produced solely by these top ten entities. Compared to traditional point-source emissions methodology, this study has demonstrated that a comprehensive bottleneck calculation is far more effective at accounting for the true liability of a polluting entity. By employing an all-inclusive approach to calculating a polluting entity’s CO2 emissions, legal actions may be more accurately focused on major polluters, and these companies may preemptively mitigate their pollution to curb vulnerability to litigation and risk. The bottleneck methodology presented here reveals the discrete link in the chain of the fossil-fuel lifecycle that is responsible for the largest amount of emissions, enabling informed climate change mitigation efforts and a considerable reduction in CO2 emissions. This study has identified the largest sources of corporate carbon dioxide bottlenecks, but further research should establish an appropriate insurance rates for fossil fuel companies to mitigate the risks of climate-related liability.

Author Contributions

Conceptualization, J.M.P. methodology, A.S.P. and J.M.P.; software, A.S.P.; validation, A.S.P. and J.M.P.; formal analysis, A.S.P. and J.M.P.; investigation, A.S.P. and J.M.P.; resources, J.M.P.; data curation, A.S.P.; writing—original draft preparation, A.S.P. and J.M.P.; writing—review and editing, A.S.P. and J.M.P.; visualization, A.S.P.; supervision, A.S.P. and J.M.P.; funding acquisition, A.S.P. and J.M.P. All authors have read and agreed to the published version of the manuscript.

Funding

This research was funded by the Witte Endowment.

Conflicts of Interest

The authors declare no conflict of interest.

Appendix A

Appendix A.1. Methodology and Equations Employed to Calculate Total Annual CO2 Emissions in Metric Tons of Carbon Dioxide Equivalent (MT CO2 e)

The mass (mcoal) of coal produced per year from U.S. short tons (US t) is converted into pounds (lb) by:
m c o a l ( l b ) = m c o a l   ( U S   t ) × 2000 l b s U S   t
is converted into total annual CO2 emissions in metric tons of carbon dioxide equivalent (MT CO2 e) by [50,51,52,53]:
m C O 2 ( M T ) m c o a l ( l b ) = 20.92 m m b t u m c o a l   ( M T c o a l ) × 26.08   ( k g C ) m m b t u × 44 k g C O 2 12 k g C × 1   M T c o a l 2204.6   l b   c o a l × 1   M T 1000 k g = 9.08 × 10 4 M T   C O 2 l b   c o a l
To convert oil pipeline capacity (O) in barrels per day (bbl) into total daily and annual CO2 emissions (MT CO2 e) [50,53]:
5.80 m m b t u b b l × 20.31 k g C m m b t u × 44 k g C O 2 12 k g C × 1   M T 1000 k g = 0.43   M T C O 2 b b l × O b b l / d a y = O M T C O 2 / d a y
The OMT CO2/day is multiplied by 365 days to obtain the MT CO2 e per year:
O M T C O 2 / y e a r = O M T C O 2 / d a y × 365
To convert natural gas pipeline capacity (N) in thousand standard cubic feet (Mcf) to annual CO2 emissions (MT CO2 e) [51,52,53]:
N M c f × 0.0053   M T   C O 2 t h e r m × 10.37   t h e r m s M c f = 0.0549   M T   C O 2 M c f × N M c f = N M T   C O 2 e

Appendix A.2. Tables of Emission Results

Table A1. Top CO2 Emission Point-Sources of the Coal Industry for Resource Extraction and End-use.
Type of EntityFacilityAnnual CO2 Emissions (MT CO2 e)
Resource ExtractionNorth Antelope Rochelle Mine (Peabody Energy)178,541,482
Black Thunder Mine (Arch Coal Inc.)129,180,444
Antelope Coal Mine (Cloud Peak Energy)42,050,826
Belle Ayr Mine (Blackjewel LLC)33,536,807
Eagle Butte Mine (Blackjewel LLC)30,973,326
Mc#1 Mine (Mach Mining LLC)26,261,087
Freedom Mine (Coteau Properties Co.)25,756,896
Spring Creek Coal Mine (Navajo Transitional Energy Co.)25,002,788
Buckskin Mine (Kiewit Corp.)24,531,779
Bailey Mine (CONSOL Energy Inc.)23,127,468
Total538,962,903
End Use/Product SaleJames H. Miller Jr.18,285,159
Robert W. Scherer Power Plant16,564,369
Monroe Power Plant16,269,093
Gibson Generating Station16,194,973
Martin Lake Power Plant14,757,909
Labadie Power Station (Union Electric Co.)14,730,396
W. A. Parish Generating Station14,491,668
General James M. Gavin Power Plant14,346,615
Navajo Generating Station13,846,974
Plant Bowen (Georgia Power Co.)13,312,712
Total152,799,868
Industry Total691,762,771
Table A2. Top CO2 Emission Point-Sources of the Oil Industry for Resource Extraction, Transport, and End-use.
Type of EntityFacilityAnnual CO2 Emissions (MT CO2 e)
Resource ExtractionMarathon Oil Corporation (Williston Basin)2,272,114
Whiting Oil & Gas Corporation (Williston Basin)2,202,496
CRI Operating LLC (Williston Basin)1,649,523
Hess Corporation (Williston Basin)1,477,609
Oasis Petroleum North America LLC1,313,727
XTO Energy Inc. (Permian Basin) (ExxonMobil)1,278,247
COG Operating LLC1,188,830
WPX Energy Permian LLC1,185,694
Berry Petroleum Company1,069,414
EOG Resources Inc. (Permian Basin)868,246
Total14,505,900
TransportEnbridge Line 78167,936,500
Rancho II Pipeline (Enterprise Product Partners)156,950,000
Enbridge Line 61156,322,200
Bakken Pipeline System (Enbridge)147,544,000
Gray Oak Pipeline (Enbridge, Phillips 66)141,255,000
Alberta Clipper Line 67 (Enbridge)125,560,000
Enbridge Line 4124,932,200
Seaway to Beaumont/Port Arthur Pipeline (Enbridge, Enterprise Product Partners)117,712,500
Keystone Houston Lateral (TransCanada)109,865,000
Enbridge Line 6104,685,650
Total1,242,898,050
End Use/Product SaleBaytown Refinery (Exxonmobil)10,666,655
Galveston Bay Refinery (Marathon)6,923,112
Los Angeles Refinery (Marathon)6,425,775
Baton Rouge Refinery (Exxonmobil)6,344,880
Port Arthur Refinery (Motiva Enterprises LLC)5,487,670
Lake Charles Refinery (Phillips 66)4,862,156
Whiting Refinery (BP)4,781,505
Deer Park Refinery (Shell Oil Co. & Pemex)4,154,899
Garyville Refinery (Marathon)4,074,113
Norco Refinery (Shell Oil Co.)3,821,971
Total57,542,736
Industry Total1,314,946,686
Table A3. Top CO2 Emission Point-Sources of the Natural Gas Industry for Resource Extraction, Transport, and End-use.
Type of EntityFacilityAnnual CO2 Emissions (MT CO2 e)
Resource ExtractionMarathon Oil Corporation (Williston Basin)2,272,114
Whiting Oil & Gas Corporation (Williston Basin)2,202,496
CRI Operating LLC (Williston Basin)1,649,523
Hess Corporation (Williston Basin)1,477,609
Oasis Petroleum North America LLC1,313,727
XTO Energy Inc. (Permian Basin) (ExxonMobil)1,278,247
COG Operating LLC1,188,830
WPX Energy Permian LLC1,185,694
Berry Petroleum Company1,069,414
EOG Resources Inc. (Permian Basin)868,246
Total14,505,900
TransportTrans-Pecos Pipeline LLC467,726
Florida Gas Transmission Co. LLC (Kinder Morgan)442,644
Natural Gas Pipeline Co. of America LLC (Kinder Morgan)202,912
Transcontinental Gas Pipeline (Williams)164,701
Dominion Energy Transmission152,154
Columbia Gulf Transmission (TransCanada)137,980
ANR Pipeline (TransCanada)137,831
Northern Natural Gas (Berkshire Hathaway)125,122
Tennessee Gas Pipeline Co. LLC (Kinder Morgan)88,832
Columbia Gas Transmission (TransCanada)66,692
Total1,986,594
End Use/Product SaleW. A. Parish Generating Station14,491,668
West County Energy Center7,167,296
Plant McDonough-Atkinson6,180,554
Martin Power Plant5,265,279
Richmond County Combustion Turbine Plant5,177,764
Hines Energy Complex5,026,094
Plant H. Allen Franklin4,553,304
Ninemile Point Power Plant4,118,889
Forney Power Plant4,098,711
Sanford Power Plant3,981,203
Total60,060,762
Industry Total76,553,256
Table A4. Overall Top 10 CO2 Emission Point-Sources Across All Fossil-Fuel Industries in U.S.
FacilityAnnual CO2 Emissions (MT CO2 e)
North Antelope Rochelle Coal Mine (Peabody Energy Corporation)178,541,482
Enbridge Line 78167,936,500
Rancho ll Pipeline (Enterprise Product Partners)156,950,000
Enbridge Line 61156,322,200
Bakken Pipeline System (Enbridge)147,544,000
Gray Oak Pipeline (Enbridge, Phillips 66)141,255,000
Black Thunder Coal Mine (Arch Coal Inc.)129,180,444
Alberta Clipper Line 67 (Enbridge)125,560,000
Enbridge Line 4124,932,200
Seaway to Beaumont/Port Arthur Pipeline (Enbridge, Enterprise Products)117,712,500
Total1,445,934,326
Table A5. Top CO2 Bottlenecks of the Coal Industry for Resource Extraction and End-use.
Type of EntityFacilityAnnual CO2 Emissions (MT CO2 e)
Resource ExtractionNorth Antelope Rochelle Mine (Peabody Energy)178,541,482
Black Thunder Mine (Arch Coal Inc.)129,180,444
Antelope Coal Mine (Cloud Peak Energy)42,050,826
Belle Ayr Mine (Blackjewel LLC)33,536,807
Eagle Butte Mine (Blackjewel LLC)30,973,326
Mc#1 Mine (Mach Mining LLC)26,261,087
Freedom Mine (Coteau Properties Co.)25,756,896
Spring Creek Coal Mine (Navajo Transitional Energy Co.)25,002,788
Buckskin Mine (Kiewit Corp.)24,531,779
Bailey Mine (CONSOL Energy Inc.)23,127,468
Total538,962,903
End Use/Product SaleJames H. Miller Jr.18,285,159
Robert W. Scherer Power Plant16,564,369
Monroe Power Plant16,269,093
Gibson Generating Station16,194,973
Martin Lake Power Plant14,757,909
Labadie Power Station (Union Electric Co.)14,730,396
W. A. Parish Generating Station14,491,668
General James M. Gavin Power Plant14,346,615
Navajo Generating Station13,846,974
Plant Bowen (Georgia Power Co.)13,312,712
Total152,799,868
Industry Total691,762,771
Table A6. Top CO2 Bottlenecks of the Oil Industry for Resource Extraction, Transport, and End-use.
Type of EntityFacilityAnnual CO2 Emissions (MT CO2 e)
Resource ExtractionCOG Operating LLC44,467,031
EOG Resources Inc. (Permian Basin)27,756,075
CRI Operating LLC27,425,089
XTO Energy Inc. (Permian Basin) (ExxonMobil)24,262,919
Whiting Oil & Gas Corporation (Williston Basin)17,741,877
Oasis Petroleum North America LLC15,703,569
Hess Corporation (Williston Basin)15,642,390
Marathon Oil Corporation (Williston Basin)14,154,904
WPX Energy Permian LLC7,935,799
Berry Petroleum Company3,072,666
Total198,162,321
TransportEnbridge Line 78167,936,500
Rancho II Pipeline (Enterprise Product Partners)156,950,000
Enbridge Line 61156,322,200
Bakken Pipeline System (Enbridge)147,544,000
Gray Oak Pipeline (Enbridge, Phillips 66)141,255,000
Alberta Clipper Line 67 (Enbridge)125,560,000
Enbridge Line 4124,932,200
Seaway to Beaumont/Port Arthur Pipeline (Enbridge, Enterprise Product Partners)117,712,500
Keystone Houston Lateral (TransCanada)109,865,000
Enbridge Line 6104,685,650
Total1,242,898,050
End Use/Product SalePort Arthur Refinery (Motiva Enterprises LLC)98,878,500
Galveston Bay Refinery (Marathon)91,815,750
Baytown Refinery (ExxonMobil)91,658,800
Garyville Refinery (Marathon)88,519,800
Baton Rouge Refinery (ExxonMobil)78,867,375
Whiting Refinery (BP)67,488,500
Los Angeles Refinery (Marathon)56,972,850
Deer Park Refinery (Shell Oil Co. & Pemex)53,363,000
Lake Charles Refinery (Phillips 66)45,515,500
Norco Refinery (Shell Oil Co.)39,237,500
Total712,317,575
Industry Total2,153,377,946
Table A7. Top CO2 Bottlenecks of the Natural Gas Industry for Resource Extraction, Transport, and End-use.
Type of EntityFacilityAnnual CO2 Emissions (MT CO2 e)
Resource ExtractionCOG Operating LLC18,210,636
EOG Resources Inc. (Permian Basin)12,000,231
XTO Energy Inc. (Permian Basin) (ExxonMobil)11,219,906
CRI Operating LLC (Williston Basin)7,549,824
Whiting Oil & Gas Corporation (Williston Basin)5,596,600
Oasis Petroleum North America LLC4,811,806
WPX Energy Permian LLC4,517,306
Hess Corporation (Williston Basin)4,312,664
Marathon Oil Corporation (Williston Basin)2,308,790
Berry Petroleum Company79,204
Total70,606,969
TransportTranscontinental Gas Pipeline (Williams)310,261,456
Dominion Energy Transmission218,402,016
Tennessee Gas Pipeline Co. LLC (Kinder Morgan)189,107,413
Columbia Gulf Transmission (TransCanada)144,409,674
Natural Gas Pipeline Co. of America LLC (Kinder Morgan)104,712,239
ANR Pipeline (TransCanada)104,099,910
Northern Natural Gas (Berkshire Hathaway)84,778,381
Columbia Gas Transmission (TransCanada)74,956,511
Florida Gas Transmission Co. LLC (Kinder Morgan)52,743,007
Trans-Pecos Pipeline LLC4,035,443
Total1,287,506,052
End Use/Product SaleW. A. Parish Generating Station14,491,668
West County Energy Center7,167,296
Plant McDonough-Atkinson6,180,554
Martin Power Plant5,265,279
Richmond County Combustion Turbine Plant5,177,764
Hines Energy Complex5,026,094
Plant H. Allen Franklin4,553,304
Ninemile Point Power Plant4,118,889
Forney Power Plant4,098,711
Sanford Power Plant3,981,203
Total60,060,762
Industry Total1,418,173,782
Table A8. Overall Top 10 CO2 Emission Bottlenecks Across All Fossil-Fuel Industries.
FacilityAnnual CO2 Emissions (MT CO2 e)
Transcontinental Gas Pipeline (Williams)310,261,456
Dominion Energy Transmission218,402,016
Tennessee Gas Pipeline Co. LLC (Kinder Morgan)189,107,413
North Antelope Rochelle Mine (Peabody Energy)178,541,482
Enbridge Line 78167,936,500
Rancho ll Pipeline (Enterprise Product Partners)156,950,000
Enbridge Line 61156,322,200
Bakken Pipeline System (Enbridge)147,544,000
Columbia Gulf Transmission (TransCanada)144,409,674
Gray Oak Pipeline (Enbridge & Phillips 66)141,255,000
Total1,967,679,741

References

  1. Hansen, J.; Kharecha, P.; Sato, M.; Masson-Delmotte, V.; Ackerman, F.; Beerling, D.J.; Hearty, P.J.; Hoegh-Guldberg, O.; Hsu, S.-L.; Parmesan, C.; et al. Assessing Dangerous Climate Change: Required Reduction of Carbon Emissions to Protect Young People, Future Generations and Nature. PLoS ONE 2013, 8, e81648. [Google Scholar] [CrossRef] [Green Version]
  2. Ripple, W.J.; Wolf, C.; Newsome, T.M.; Galetti, M.; Alamgir, M.; Crist, E.; Mahmoud, M.I.; Laurance, W.F. World Scientists’ Warning to Humanity: A Second Notice. BioScience 2017, 67, 1026–1028. [Google Scholar] [CrossRef]
  3. Pachauri, R.K.; Allen, M.R.; Barros, V.R.; Broome, J.; Cramer, W.; Christ, R.; Church, J.A.; Clarke, L.; Dahe, Q.; Dasgupta, P.; et al. Climate Change 2014: Synthesis Report. Contribution of Working Groups I, II and III to the Fifth Assessment Report of the Intergovernmental Panel on Climate Change; Pachauri, R., Meyer, L., Eds.; IPCC: Geneva, Switzerland, 2014; p. 151. ISBN 978/92/9169/143/2. [Google Scholar]
  4. Moss, R.H.; Edmonds, J.A.; Hibbard, K.A.; Manning, M.R.; Rose, S.K.; Van Vuuren, D.; Carter, T.R.; Emori, S.; Kainuma, M.; Kram, T.; et al. The next generation of scenarios for climate change research and assessment. Nature 2010, 463, 747–756. [Google Scholar] [CrossRef]
  5. Stern, N. The Economics of Climate Change: The Stern Review; Cambridge University Press: Cambridge, UK, 2007; ISBN 978/0/521/70080/1. [Google Scholar]
  6. Dhainaut, J.F.; Claessens, Y.-E.; Ginsburg, C.; Riou, B. Unprecedented heat-related deaths during the 2003 heat wave in Paris: Consequences on emergency departments. Crit. Care 2003, 8, 1. [Google Scholar] [CrossRef] [Green Version]
  7. Poumadere, M.; Mays, C.; Le Mer, S.; Blong, R. The 2003 Heat Wave in France: Dangerous Climate Change Here and Now. Risk Anal. 2005, 25, 1483–1494. [Google Scholar] [CrossRef]
  8. Fouillet, A.; Rey, G.; Laurent, F.; Pavillon, G.; Bellec, S.; Guihenneuc-Jouyaux, C.; Clavel, J.; Jougla, E.; Hémon, D.; Ghihenneuc-Jouyaux, C. Excess mortality related to the August 2003 heat wave in France. Int. Arch. Occup. Environ. Health 2006, 80, 16–24. [Google Scholar] [CrossRef] [PubMed] [Green Version]
  9. D’Amato, G.; Cecchi, L. Effects of climate change on environmental factors in respiratory allergic diseases. Clin. Exp. Allergy 2008, 38, 1264–1274. [Google Scholar] [CrossRef] [PubMed]
  10. Gislason, A.; Gorsky, G. (Eds.) Proceedings of the Joint ICES/CIESM Workshop to Compare Zooplankton Ecology and Methodologies between the Mediterranean and the North Atlantic (WKZEM); ICES, International Council for the Exploration of the Sea: Copenhagen, Denmark, 2010. [Google Scholar]
  11. Parry, M.; Rosenzweig, C.; Iglesias, A.; Livermore, M.; Fischer, G. Effects of climate change on global food production under SRES emissions and socio-economic scenarios. Glob. Environ. Chang. 2004, 14, 53–67. [Google Scholar] [CrossRef]
  12. Parry, M.; Rosenzweig, C.; Livermore, M. Climate change, global food supply and risk of hunger. Philos. Trans. R. Soc. B Boil. Sci. 2005, 360, 2125–2138. [Google Scholar] [CrossRef] [PubMed] [Green Version]
  13. Schmidhuber, J.; Tubiello, F.N. Global food security under climate change. Proc. Natl. Acad. Sci. USA 2007, 104, 19703–19708. [Google Scholar] [CrossRef] [PubMed] [Green Version]
  14. Vine, E. Adaptation of California’s electricity sector to climate change. Clim. Chang. 2011, 111, 75–99. [Google Scholar]
  15. Val, D.V.; Yurchenko, D.; Nogal, M.; O’Connor, A. Chapter Seven—Climate Change-Related Risks and Adaptation of Interdependent Infrastructure Systems. In Climate Adaptation Engineering; Bastidas-Arteaga, E., Stewar, M.G., Eds.; Butterworth-Heinemann: Oxford, UK, 2019; pp. 207–242. ISBN 978/0/12/816782/3. [Google Scholar]
  16. Dai, A. Drought under global warming: A review. Wiley Interdiscip. Rev. Clim. Chang. 2010, 2, 45–65. [Google Scholar] [CrossRef] [Green Version]
  17. Diffenbaugh, N.S.; Swain, D.L.; Touma, D. Anthropogenic warming has increased drought risk in California. Proc. Natl. Acad. Sci. USA 2015, 112, 3931–3936. [Google Scholar] [CrossRef] [PubMed] [Green Version]
  18. Mann, M.E.; Gleick, P.H. Climate change and California drought in the 21st century. Proc. Natl. Acad. Sci. USA 2015, 112, 3858–3859. [Google Scholar] [CrossRef] [Green Version]
  19. Dale, V.H.; Joyce, L.A.; Mcnulty, S.; Neilson, R.P.; Ayres, M.P.; Flannigan, M.D.; Hanson, P.J.; Irland, L.C.; Lugo, A.E.; Peterson, C.J.; et al. Climate Change and Forest Disturbances. BioScience 2001, 51, 723. [Google Scholar] [CrossRef] [Green Version]
  20. Amiro, B.; Stocks, B.J.; Alexander, M.; Flannigan, M.D.; Wotton, M. Fire, climate change, carbon and fuel management in the Canadian boreal forest. Int. J. Wildland Fire 2001, 10, 405. [Google Scholar] [CrossRef]
  21. Flannigan, M.; Stocks, B.; Turetsky, M.; Wotton, M. Impacts of climate change on fire activity and fire management in the circumboreal forest. Glob. Chang. Boil. 2009, 15, 549–560. [Google Scholar] [CrossRef]
  22. Moorhead, K.K.; Brinson, M.M. Response of Wetlands to Rising Sea Level in the Lower Coastal Plain of North Carolina. Ecol. Appl. 1995, 5, 261–271. [Google Scholar] [CrossRef]
  23. Frihy, O.E. The Nile delta-Alexandria coast: Vulnerability to sea-level rise, consequences and adaptation. Mitig. Adapt. Strat. Glob. Chang. 2003, 8, 115–138. [Google Scholar] [CrossRef]
  24. Bobba, A.G. Numerical modelling of salt-water intrusion due to human activities and sea-level change in the Godavari Delta, India. Hydrol. Sci. J. 2002, 47 (Suppl. S1), S67–S80. [Google Scholar] [CrossRef] [Green Version]
  25. Nicholls, R.J.; Hoozemans, F.; Marchand, M. Increasing flood risk and wetland losses due to global sea-level rise: Regional and global analyses. Glob. Environ. Chang. 1999, 9, S69–S87. [Google Scholar] [CrossRef]
  26. DeSantis, L.R.G.; Bhotika, S.; Williams, K.; Putz, F.E. Sea-level rise and drought interactions accelerate forest decline on the Gulf Coast of Florida, USA. Glob. Chang. Boil. 2007, 13, 2349–2360. [Google Scholar] [CrossRef]
  27. Allen, C.D.; Macalady, A.K.; Chenchouni, H.; Bachelet, D.; McDowell, N.; Vennetier, M.; Kitzberger, T.; Rigling, A.; Breshears, D.D.; Hogg, E.H.; et al. A global overview of drought and heat-induced tree mortality reveals emerging climate change risks for forests. For. Ecol. Manag. 2010, 259, 660–684. [Google Scholar] [CrossRef] [Green Version]
  28. Carnicer, J.; Coll, M.; Ninyerola, M.; Pons, X.; Sánchez, G.; Penuelas, J. Widespread crown condition decline, food web disruption, and amplified tree mortality with increased climate change-type drought. Proc. Natl. Acad. Sci. USA 2011, 108, 1474–1478. [Google Scholar] [CrossRef] [PubMed] [Green Version]
  29. Grossman, D. Warming up to a not-so-radical idea: Tort-based climate change litigation. Columbia J. Environ. Law 2003, 1, 1–62. [Google Scholar]
  30. Allen, M. Liability for climate change. Nature 2003, 421, 891–892. [Google Scholar] [CrossRef]
  31. Healy, K.; Tapick, J. Climate Change: It’s Not Just a Policy Issue for Corporate Counsel—It’s a Legal Problem. Columia J. Environ. Law 2004, 89, 1–23. [Google Scholar]
  32. Hancock, E. Red Dawn, Blue Thunder, Purple Rain: Corporate Risk of Liability for Global Climate Change and the SEC Disclosure Dilemma. Georget. Environ. Law Rev. 2005, 17, 233–251. [Google Scholar]
  33. Farber, D.A. Basic Compensation for the Victims of Climate Change. Univ. Pa. Law Rev. 2007, 155, 1605–1656. [Google Scholar] [CrossRef] [Green Version]
  34. Kilinsky, J. International climate change liability: A myth or a reality. J. Transit. Law. Policy 2008, 18, 377. [Google Scholar]
  35. Farber, D.A. Tort Law in the Era of Climate Change, Katrina and 9/11: Exploring Liability for Extraordinary Risks. SSRN Electron. J. 2008, 43, 1075. [Google Scholar] [CrossRef] [Green Version]
  36. Farber, D.A. Apportioning Climate Change Costs. UCLA J. Environ. Law Policy 2008, 26, 21. [Google Scholar]
  37. Farber, D.A. The case for climate compensation justice for climate change victims in a complex world. Utah Law Rev. 2008, 2, 377–413. [Google Scholar]
  38. Preston, B.J. The influence of climate change litigation on governments and the private sector. Clim. Law 2011, 2, 485–513. [Google Scholar] [CrossRef]
  39. Williams, C.A. Disclosure of Information Concerning Climate Change: Liability Risks and Opportunities; Commonwealth Climate and Law Initiative: Oxford, UK, 2018. [Google Scholar]
  40. Heidari, N.; Pearce, J.M. A review of greenhouse gas emission liabilities as the value of renewable energy for mitigating lawsuits for climate change related damages. Renew. Sustain. Energy Rev. 2016, 55, 899–908. [Google Scholar] [CrossRef] [Green Version]
  41. Bang, A.; Holle, M.-L. Making Legal History: State Liability for Negligence in Climate Change; Social Science Research Network: Rochester, NY, USA, 2019. [Google Scholar]
  42. Lawlor, A.; Gravelle, T.B. Framing trans-border energy transportation: The case of Keystone XL. Environ. Polit. 2018, 27, 666–685. [Google Scholar] [CrossRef]
  43. Wood, T. The many voices of business: Framing the Keystone pipeline in US and Canadian news. Journalism 2017, 20, 292–312. [Google Scholar] [CrossRef]
  44. Diotalevi, R.N.; Burhoe, S. Native American Lands and the Keystone Pipeline Expansion: A Legal Analysis. Indig. Policy J. 2017, 27. [Google Scholar] [CrossRef] [Green Version]
  45. Zhang, Q. Legal Options to Stop the Revival of Keystone XL Pipeline. Environ. Claims J. 2019, 1–20. [Google Scholar] [CrossRef]
  46. U.S. EPA. Facility Level GHG Emissions Data 2018. Available online: http://ghgdata.epa.gov/ghgp/main.do (accessed on 19 February 2020).
  47. U.S. Energy Information Administration (EIA). Coal Data Browser 2018. Available online: https://www.eia.gov/coal/data/browser/ (accessed on 5 June 2020).
  48. U.S. Energy Information Administration (EIA). Liquids Pipeline Projects Database 2019. Available online: https://www.eia.gov/todayinenergy/detail.php?id=42356 (accessed on 5 June 2020).
  49. Enbridge’s Energy Infrastructure Assets Report. April 2020. Available online: https://www.enbridge.com/~/media/Enb/Documents/Factsheets/FS_EnergyInfrastructureAssets.pdf?la=en (accessed on 17 April 2020).
  50. U.S. Environmental Protection Agency (EPA). Greenhouse Gases Equivalencies Calculator—Calculations and References. Available online: https://www.epa.gov/energy/greenhouse-gases-equivalencies-calculator-calculations-and-references (accessed on 1 April 2020).
  51. U.S. Energy Information Administration (EIA). Monthly Energy Review (Rep.). 2020. Available online: https://www.eia.gov/totalenergy/data/monthly/pdf/mer.pdf (accessed on 5 June 2020).
  52. U.S. Environmental Protection Agency (EPA). PDF (Methodology and Data for Estimating CO2 Emissions from Fossil Fuel Combustion). 2019. Available online: https://www.epa.gov/sites/production/files/2019-04/documents/us-ghg-inventory-2019-annex-2-emissions-fossil-fuel-combustion.pdf (accessed on 5 June 2020).
  53. Intergovernmental Panel on Climate Change (IPCC). Guidelines for National Greenhouse Gas Inventories. 2006. Volume 2 (Energy). Available online: https://www.ipcc-nggip.iges.or.jp/public/2006gl/pdf/2_Volume2/V2_2_Ch2_Stationary_Combustion.pdf (accessed on 5 June 2020).
  54. U.S. Energy Information Administration (EIA). Independent Statistics and Analysis. 2019. Available online: https://www.eia.gov/energyexplained/natural-gas/natural-gas-and-the-environment.php (accessed on 28 April 2020).
  55. EPA’s Overview of Greenhouse Gases. 2020. Available online: https://www.epa.gov/ghgemissions/overview-greenhouse-gases (accessed on 28 April 2020).
  56. Jackson, R.B.; Down, A.; Phillips, N.G.; Ackley, R.; Cook, C.W.; Plata, D.L.; Zhao, K. Natural Gas Pipeline Leaks Across Washington, DC. Environ. Sci. Technol. 2014, 48, 2051–2058. [Google Scholar] [CrossRef]
  57. U.S. Energy Information Administration (EIA). Independent Statistics and Analysis. 2019. Available online: https://www.eia.gov/energyexplained/natural-gas/ (accessed on 28 April 2020).
  58. Kovats, S.; Depledge, M.; Haines, A.; Fleming, L.E.; Wilkinson, P.; Shonkoff, S.B.; Scovronick, N. The health implications of fracking. Lancet 2014, 383, 757–758. [Google Scholar] [CrossRef]
  59. EPA’s Study of Hydraulic Fracturing for Oil and Gas and Its Potential Impact on Drinking Water Resources. 2020. Available online: https://www.epa.gov/hfstudy (accessed on 28 April 2020).
  60. Gordalla, B.C.; Ewers, U.; Frimmel, F.H. Hydraulic fracturing: A toxicological threat for groundwater and drinking-water? Environ. Earth Sci. 2013, 70, 3875–3893. [Google Scholar] [CrossRef]
  61. Williams Companies. Transco Overview. Available online: https://www.williams.com/pipeline/transco/ (accessed on 19 May 2020).
  62. Schroeder, C.H. Corrective Justice and Liability for Increasing Risks. UCLA Law Rev. 1990, 37, 439–478. [Google Scholar]
  63. Lipanovich, A. Smoke before Oil: Modeling a Suit against the Auto and Oil Industry on the Tobacco Tort Litigation is Feasible. Gold. Gate Univ. Law Rev. 2005, 35, 429–489. [Google Scholar]
  64. Tietenberg, T.H. Economic Instruments for Environmental Regulation. Oxf. Rev. Econ. Policy 1990, 6, 17–33. [Google Scholar] [CrossRef]
  65. Ross, C.M.; Evan, M.; Hecht, S. Limiting Liability in the Greenhouse: Insurance Risk-Management Strategies in the Context of Global Climate Change. Stanf. Environ. Law J. 2007, 26, 252–317. [Google Scholar]
  66. Schwarze, R. Liability for Climate Change: The Benefits, the Costs, and the Transaction Costs. Univ. Pa. Law Rev. 2007, 155, 1947–1952. [Google Scholar]
  67. Lin, A.C. Beyond Tort: Compensating Victims of Environmental Toxic Injury. South. Calif. Law Rev. 2005, 78, 1439–1528. [Google Scholar]
  68. Heine, D.; Faure, M.G.; Dominioni, G. The Polluter-Pays Principle in Climate Change Law: An Economic Appraisal. Clim. Law 2020, 10, 94–115. [Google Scholar] [CrossRef]
  69. U.S. EPA. Superfund: CERCLA Overview. 2018. Available online: https://www.epa.gov/superfund/superfund-cercla-overview (accessed on 1 May 2020).
  70. Bennett & Wells; Baue, W. Global Warming Shareowner Resolution Filed at “Filthy Five” Electric Companies, SOCIALFUNDS; Supra Note 47, at 2. Available online: http://www.socialfunds.com/news/article.cgi/1008.html (accessed on 17 January 2003).
  71. Radevsky, R.; Scott, D. Pipeline Insurance—Technical Aspects of Underwriting and Claims. In Conference on Terrain and Geohazard Challenges Facing Onshore Oil and Gas Pipelines; Institution of Civil Engineers: London, UK, 2004. [Google Scholar]
  72. Allianz Group and WWF. Climate Change & the Financial Sector: An Agenda for Action (Rep.). June 2005. Available online: https://wwfeu.awsassets.panda.org/downloads/wwfallianzclimatechangereportjune2005.pdf (accessed on 1 July 2020).
  73. Pidot, J.R. Global Warming in the Courts: An Overview of Current Litigation and Common Legal Issues; Georgetown Environmental Law & Policy Institute: Washington DC, NJ, USA, 2006; Available online: https://ssrn.com/abstract=1695720 (accessed on 1 May 2020).
  74. Zhuge, C.; Wei, B.; Dong, C.; Shao, C.; Shan, Y. Exploring the future electric vehicle market and its impacts with an agent-based spatial integrated framework: A case study of Beijing, China. J. Clean. Prod. 2019, 221, 710–737. [Google Scholar] [CrossRef] [Green Version]
  75. Zhou, Y.; Wang, M.; Johnson, L.; Wang, H.; Hao, H. Plug-in electric vehicle market penetration and incentives: A global review. Mitig. Adapt. Strat. Glob. Chang. 2014, 20, 777–795. [Google Scholar] [CrossRef]
  76. Noori, M.; Tatari, O. Development of an agent-based model for regional market penetration projections of electric vehicles in the United States. Energy 2016, 96, 215–230. [Google Scholar] [CrossRef]
  77. Zhang, Q.; Ou, X.; Yan, X.; Zhang, X. Electric Vehicle Market Penetration and Impacts on Energy Consumption and CO2 Emission in the Future: Beijing Case. Energies 2017, 10, 228. [Google Scholar] [CrossRef] [Green Version]
  78. Beiter, P.; Musial, W.; Smith, A.; Kilcher, L.; Damiani, R.; Maness, M.; Sirnivas, S.; Stehly, T.; Gevorgian, V.; Mooney, M.; et al. A Spatial-Economic Cost-Reduction Pathway Analysis for U.S. Offshore Wind Energy Development from 2015–2030. Off. Sci. Tech. Inf. 2016. [Google Scholar] [CrossRef]
  79. Nemet, G.F. How Solar Energy Became Cheap: A Model for Low-Carbon Innovation; Routledge: Abingdon, UK, 2019. [Google Scholar]
  80. Solomon, T. Renewable Energy is Cheaper than Fossil Fuels. California Proves It. Indig. Policy J. 2019, 30. [Google Scholar]
  81. Kåberger, T. Progress of renewable electricity replacing fossil fuels. Glob. Energy Interconnect. 2018, 1, 48–52. [Google Scholar]
  82. British Petroleum (BP). Peak Oil Demand and Long-Run Oil Prices (Rep.). 2020. Available online: http://www.aspo.be/wpcontent/uploads/2019/03/bp_peak_oil_demand_2018.pdf (accessed on 15 June 2020).
  83. British Plastics Federation. Oil Consumption. 2019. Available online: https://www.bpf.co.uk/press/oil_consumption.aspx (accessed on 15 June 2020).
  84. Geyer, R.; Jambeck, J.R.; Law, K.L. Production, use, and fate of all plastics ever made. Sci. Adv. 2017, 3, e1700782. [Google Scholar] [CrossRef] [Green Version]
  85. Cruz Sanchez, F.A.; Boudaoud, H.; Camargo, M.; Pearce, J.M. Plastic recycling in additive manufacturing: A systematic literature review and opportunities for the circular economy. J. Clean. Prod. 2020, 264, 121602. [Google Scholar] [CrossRef]
  86. Dertinger, S.C.; Gallup, N.; Tanikella, N.G.; Grasso, M.; Vahid, S.; Foot, P.J.; Pearce, J.M. Technical pathways for distributed recycling of polymer composites for distributed manufacturing: Windshield wiper blades. Resour. Conserv. Recycl. 2020, 157, 104810. [Google Scholar] [CrossRef]
  87. Zhong, S.; Pearce, J.M. Tightening the loop on the circular economy: Coupled distributed recycling and manufacturing with recyclebot and RepRap 3-D printing. Resour. Conserv. Recycl. 2018, 128, 48–58. [Google Scholar] [CrossRef] [Green Version]
  88. Wood, G. Fossil Fuels in a Carbon-Constrained World. In The Palgrave Handbook of Managing Fossil Fuels and Energy Transitions; Wood, G., Baker., K.C., Eds.; Springer International Publishing: Cham, Switzerland, 2020; pp. 3–23. [Google Scholar]
  89. Hubacek, K.; Baiocchi, G. Fossil Fuel Assets May Turn Toxic. Joule 2018, 2, 1407–1409. [Google Scholar] [CrossRef]
  90. Intergovernmental Panel on Climate Change (IPCC). Managing the Risks of Extreme Events and Disasters to Advance Climate Change Adaptation. In Changes in Climate Extremes and their Impacts on the Natural Physical Environment; Cambridge University Press: Cambridge, UK, 2010; pp. 109–231. Available online: https://www.ipcc.ch/site/assets/uploads/2018/03/SREX-Chap3_FINAL-1.pdf (accessed on 15 June 2020).
  91. Banholzer, S.; Donner, S. The Impact of Climate Change on Natural Disasters, In Reducing Disaster: Early Warning Systems for Climate Change; Kossin, J., Ed.; Springer Science and Business Media LLC: Berlin/Heidelberg, Germany, 2014; pp. 21–49. [Google Scholar]
  92. Dancy, J.R.; Dancy, V.A. Terrorism and oil & gas pipeline infrastructure: Vulnerability and potential liability for cybersecurity attacks. Oil Gas Nat. Res. Energy J. 2017, 2, 579–620. [Google Scholar]
  93. Lia, B.; Kjok, A. Energy Supply as Terrorist Targets? Patterns of “Petroleum Terrorism”. In Oil in the Gulf: Obstacles to Democracy and Development; Taylor & Francis Group: Abingdon, UK, 2017; pp. 1968–1999. [Google Scholar]
  94. Loadenthal, M. Eco-Terrorism: An Incident-Driven History of Attack (1973–2010). J. Study Radical. 2017, 11, 1–34. [Google Scholar] [CrossRef]
  95. Da Silva, J.R. The Eco-Terrorist Wave 1970–2016. Ph.D. Thesis, Central European University, Budapest, Hungary, 2016. [Google Scholar]
  96. Verhovek, S.H. Pipeline Crews Tackle Huge Oil Spill Caused by Shooting. N. Y. Times 2001, 1, 11. [Google Scholar]
  97. Burnham, A.; Han, J.; Clark, C.E.; Wang, M.; Dunn, J.B.; Palou-Rivera, I. Life-Cycle Greenhouse Gas Emissions of Shale Gas, Natural Gas, Coal, and Petroleum. Environ. Sci. Technol. 2011, 46, 619–627. [Google Scholar] [CrossRef] [PubMed]
  98. Krackeler, T.; Schipper, L.; Sezgen, O. Carbon dioxide emissions in OECD service sectors: The critical role of electricity use. Energy Policy 1998, 26, 1137–1152. [Google Scholar] [CrossRef]
  99. Karion, A.; Sweeney, C.; Pétron, G.; Frost, G.; Hardesty, R.M.; Kofler, J.; Miller, B.; Newberger, T.; Wolter, S.; Banta, R.; et al. Methane emissions estimate from airborne measurements over a western United States natural gas field. Geophys. Res. Lett. 2013, 40, 4393–4397. [Google Scholar] [CrossRef]
  100. Hendrick, M.F.; Ackley, R.; Sanaie-Movahed, B.; Tang, X.; Phillips, N.G. Fugitive methane emissions from leak-prone natural gas distribution infrastructure in urban environments. Environ. Pollut. 2016, 213, 710–716. [Google Scholar] [CrossRef] [Green Version]
  101. MacLean, H.L.; Lave, L.B.; Lankey, R.; Joshi, S. A Life-Cycle Comparison of Alternative Automobile Fuels. J. Air Waste Manag. Assoc. 2000, 50, 1769–1779. [Google Scholar] [CrossRef] [Green Version]
Figure 1. Stepwise process used to calculate potential annual CO2 emissions (MT CO2 e) of a coal facility.
Energies 13 03932 g001
Figure 2. Stepwise process used to calculate potential annual CO2 emissions (MT CO2 e) of an oil facility.
Energies 13 03932 g002
Figure 3. Equation used to calculate potential annual CO2 emissions (MT CO2 e) of a natural gas facility.
Energies 13 03932 g003
Figure 4. Top CO2 Emission Point-Sources of the Coal Industry for Resource Extraction and End-use.
Energies 13 03932 g004
Figure 5. Top CO2 Emission Point-Sources of the Oil Industry for Resource Extraction and End-use.
Energies 13 03932 g005
Figure 6. Top CO2 Emission Point-Sources of the Oil Industry for Transport.
Energies 13 03932 g006
Figure 7. Top CO2 Emission Point-Sources of the Natural Gas Industry for Resource Extraction and End-use.
Energies 13 03932 g007
Figure 8. Top CO2 Emission Point-Sources of the Natural Gas Industry for Transport.
Energies 13 03932 g008
Figure 9. Overall Top 10 CO2 Emission Point-Sources Across All Fossil-Fuel Industries in U.S.
Energies 13 03932 g009
Figure 10. Map of Overall Top 10 CO2 Point-Source Emitters Across All Fossil-Fuel Industries in the United States (Generating using OpenStreetMap).
Energies 13 03932 g010
Figure 11. Top CO2 Bottlenecks of the Coal Industry for Resource Extraction and End-use.
Energies 13 03932 g011
Figure 12. Map of Top CO2 Emission Bottlenecks- Coal Extraction and Power Plants in the United States (Generating using Google Earth).
Energies 13 03932 g012
Figure 13. Top CO2 Bottlenecks of the Oil Industry for Resource Extraction and End-use.
Energies 13 03932 g013
Figure 14. Map of Top CO2 Emission Bottlenecks- Oil Extraction & Refining Facilities in the United States (Generating using Google Earth).
Energies 13 03932 g014
Figure 15. Top CO2 Bottlenecks of the Oil Industry for Transport.
Energies 13 03932 g015
Figure 16. Map of Top CO2 Emission Bottlenecks- Oil Pipelines in the United States (Generating using OpenStreetMap).
Energies 13 03932 g016
Figure 17. Top CO2 Bottlenecks of the Natural Gas Industry for Resource Extraction and End-use.
Energies 13 03932 g017
Figure 18. Map of Top 20 CO2 Emission Bottlenecks- Natural Gas Extraction Facilities & Power Plants in the United States (Generating using Google Earth).
Energies 13 03932 g018
Figure 19. Top CO2 Bottlenecks of the Natural Gas Industry for Transport.
Energies 13 03932 g019
Figure 20. Map of Top 10 CO2 Emission Bottlenecks- Natural Gas Pipelines in the United States (Generating using OpenStreetMap).
Energies 13 03932 g020
Figure 21. Overall Top 10 CO2 Emission Bottlenecks Across All Fossil-Fuel Industries.
Energies 13 03932 g021
Figure 22. Map of Overall Top 10 CO2 Emission Bottlenecks Across All Fossil-Fuel Industries in the United States (Generating using OpenStreetMap).
Energies 13 03932 g022
Table 1. The eight classes of GHG emitting entities evaluated.
Type of EntityFossil Fuel
CoalOilNatural Gas
Resource ExtractionUnderground and Strip MinesWellsWells/Pumping Stations
TransportN/A *Shipping/PipelinesShipping/Pipelines
End Use/Product SalePower PlantsProcessing/RefineriesPower Plants
* For coal industry calculations, transportation between extraction and end-use is not included due to lack of public access to data.