Combustion Analysis of a Diesel Engine during Warm up at Different Coolant and Lubricating Oil Temperatures

 , ,
, ,  , ,
, , 
Abstract
:
1. Introduction
2. Experimental Facility
2.1. Experimental Procedure
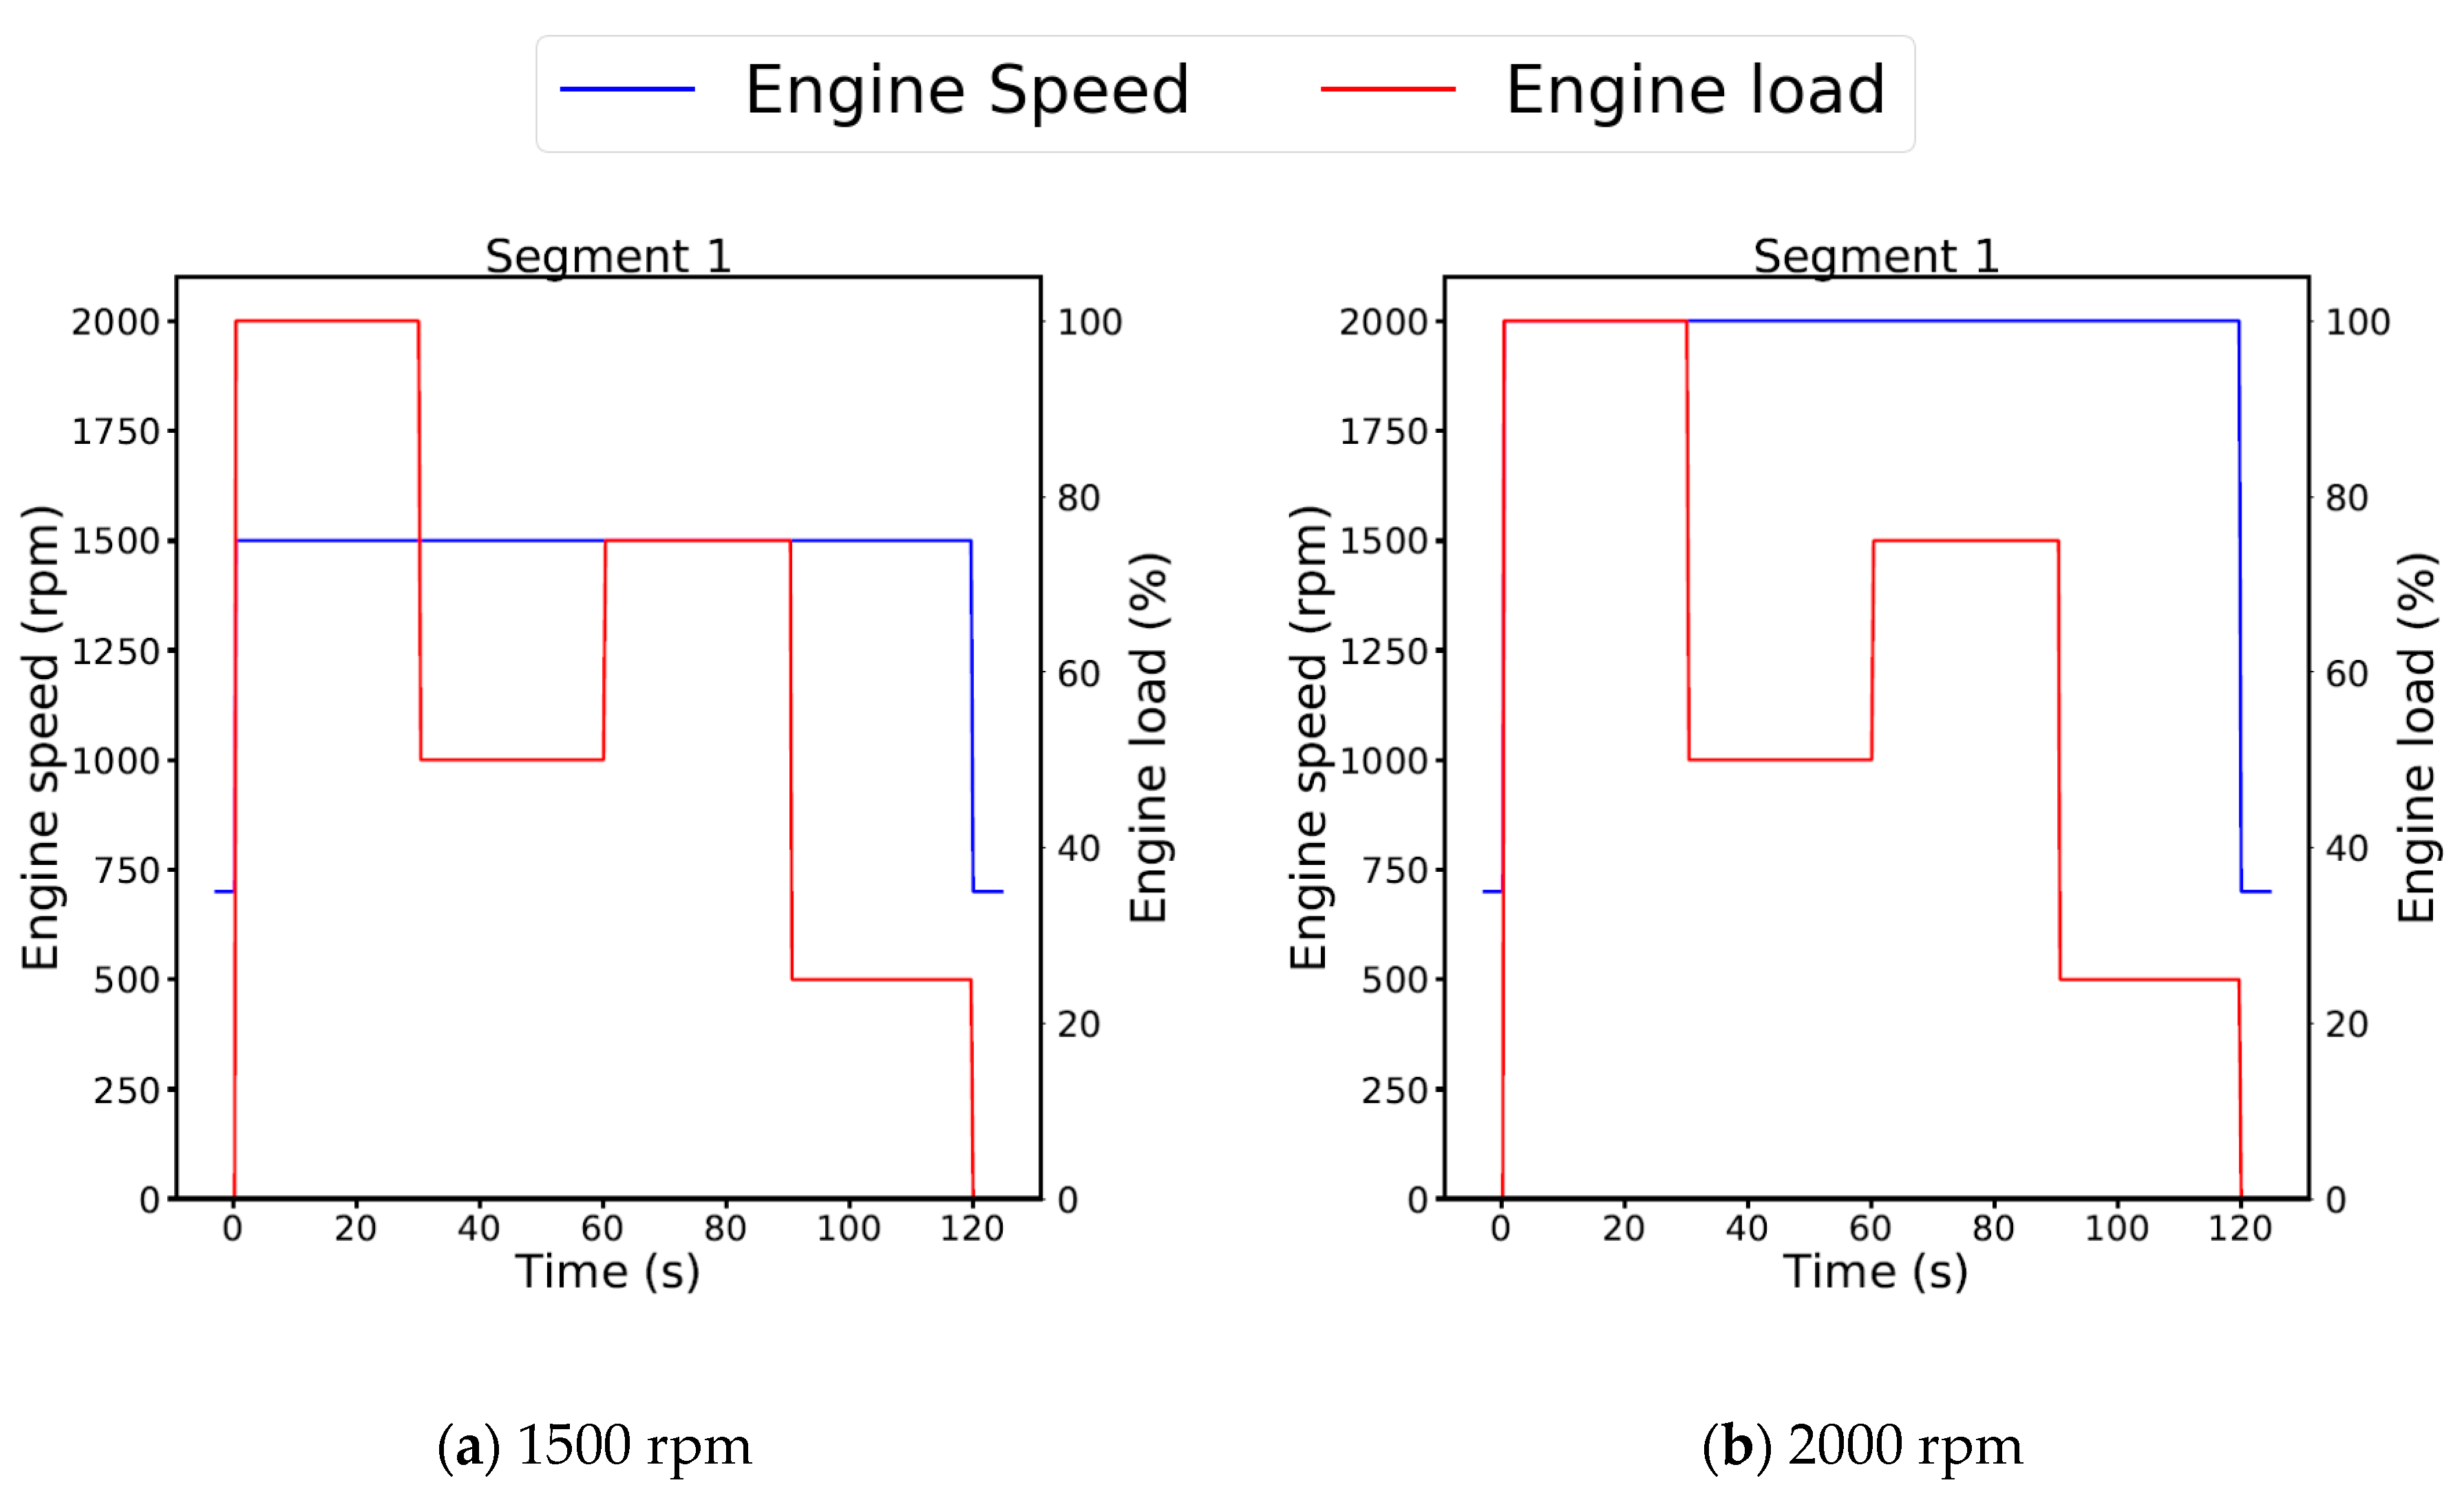
2.2. Experimental Drive Cycle
2.3. Experimental Methodology
3. Results and Discussion
3.1. Combustion Analysis
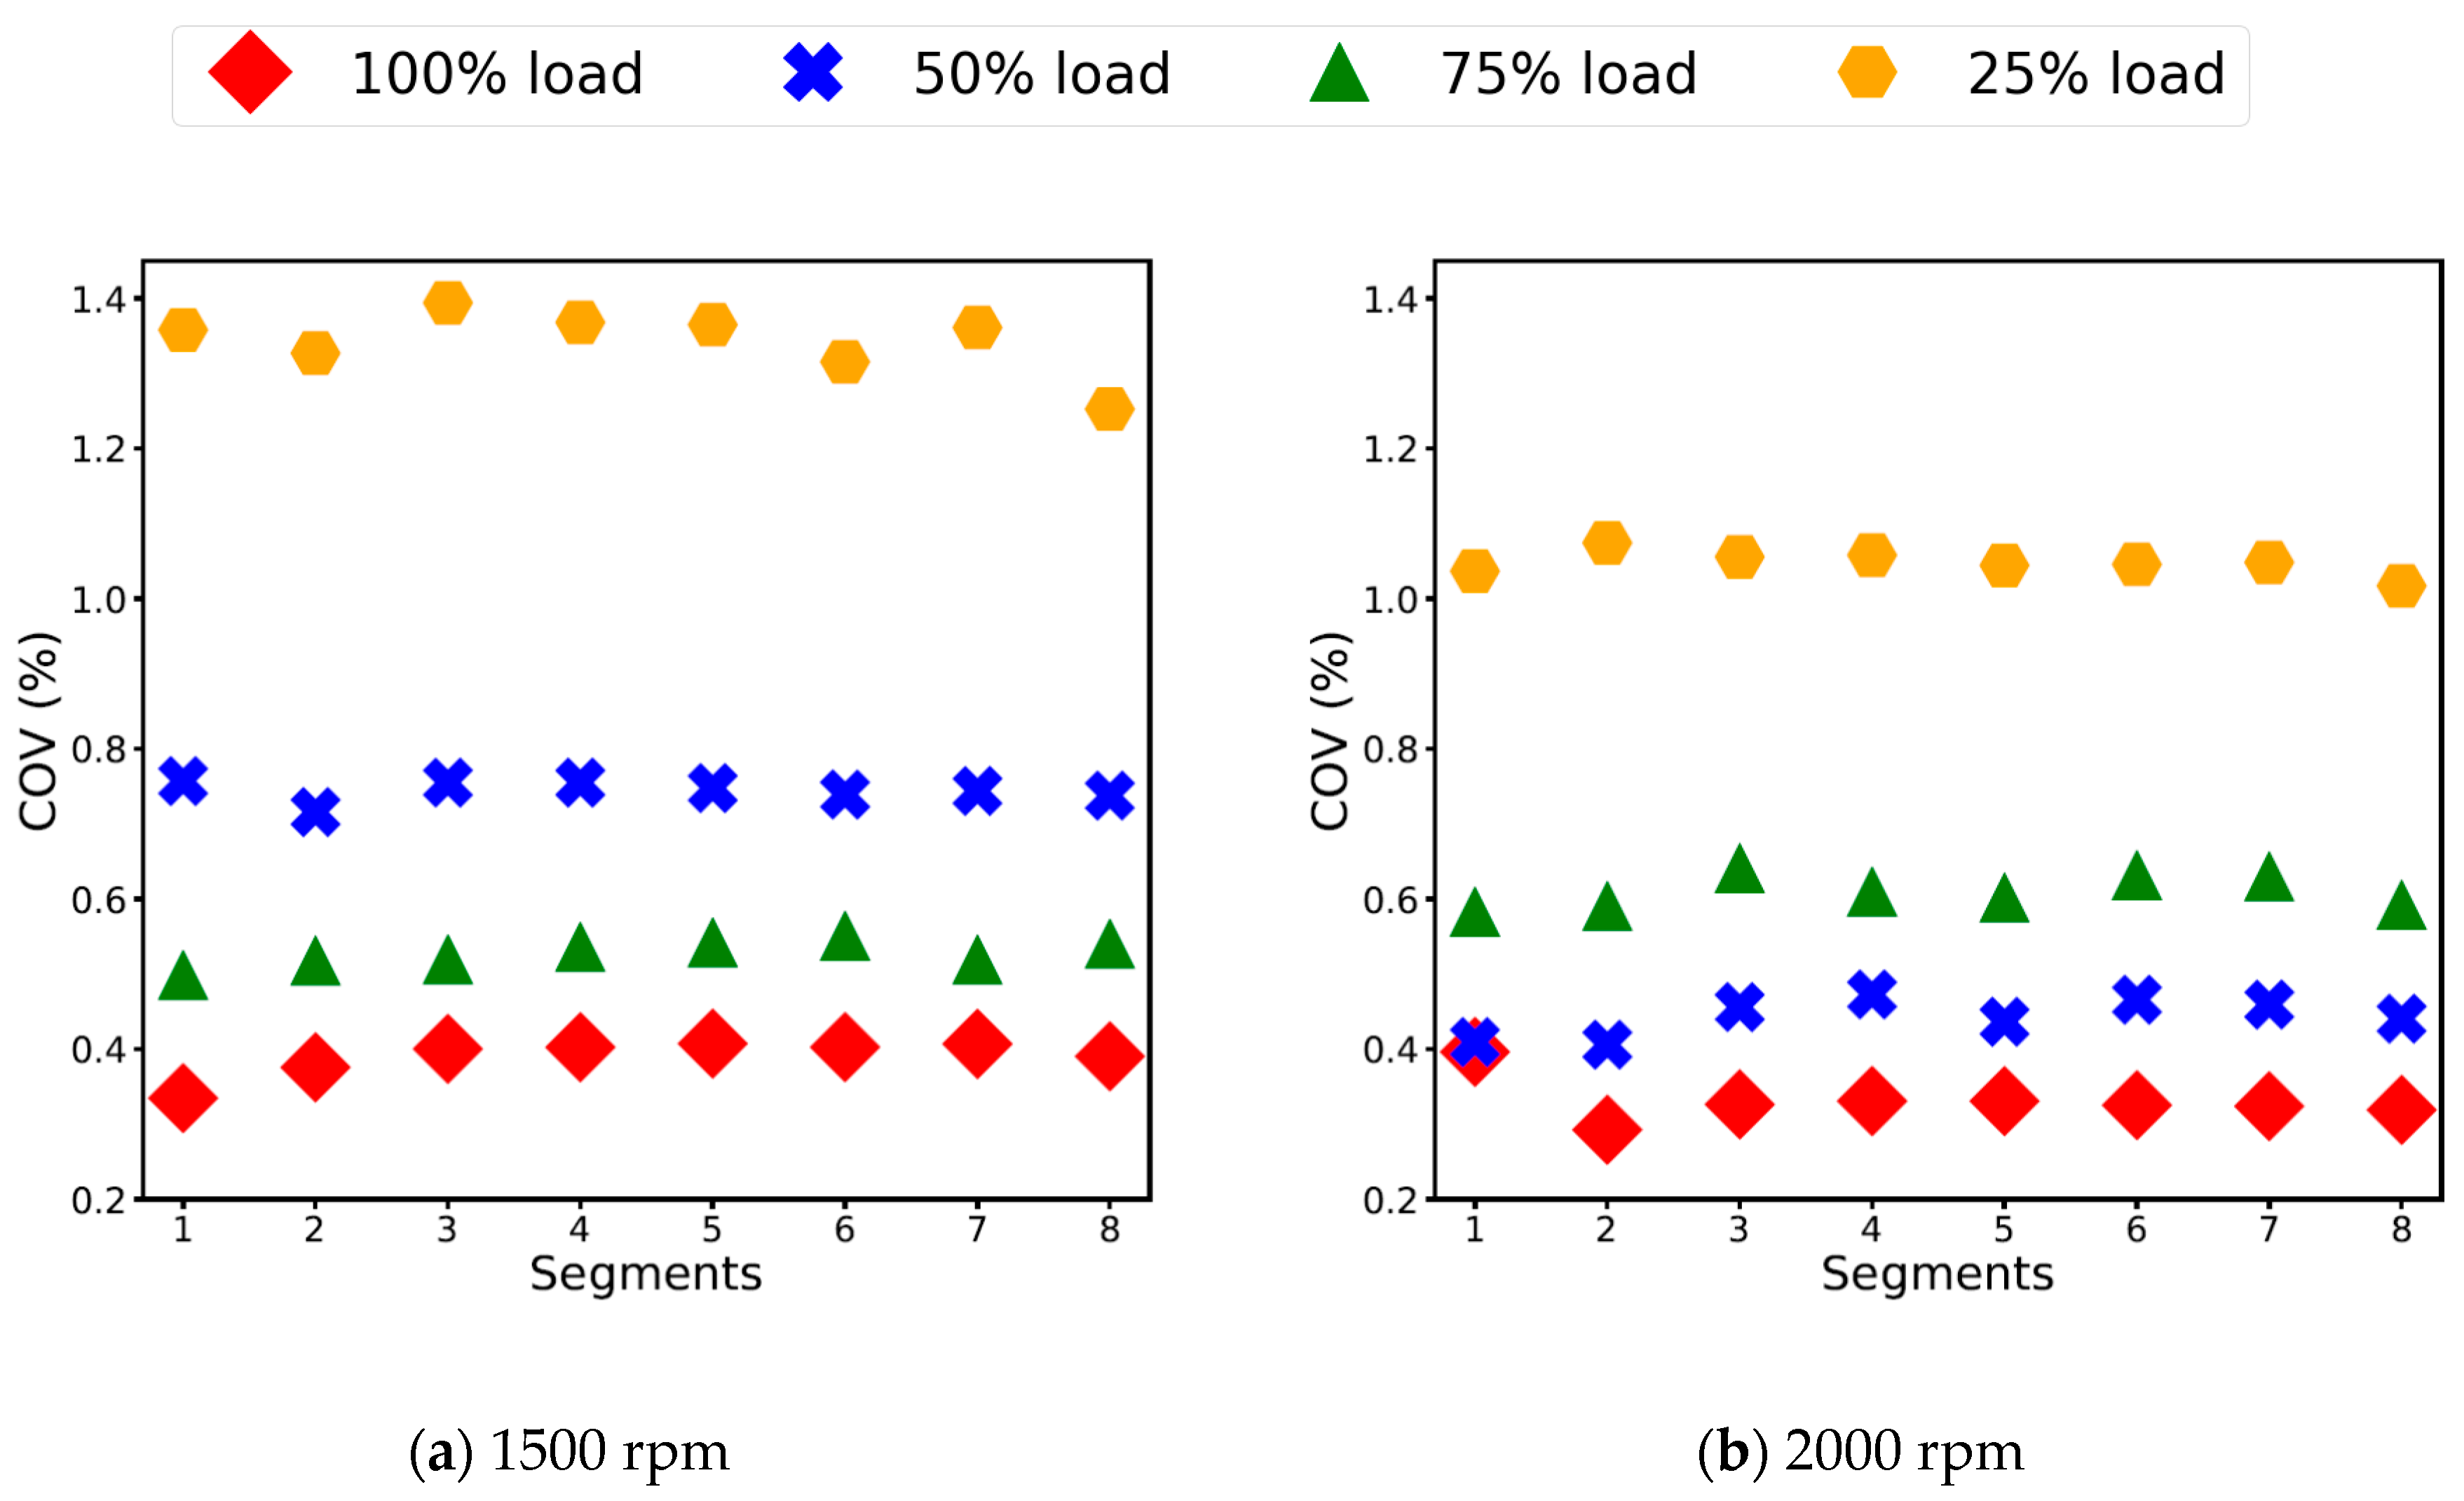
3.2. COV of the IMEP
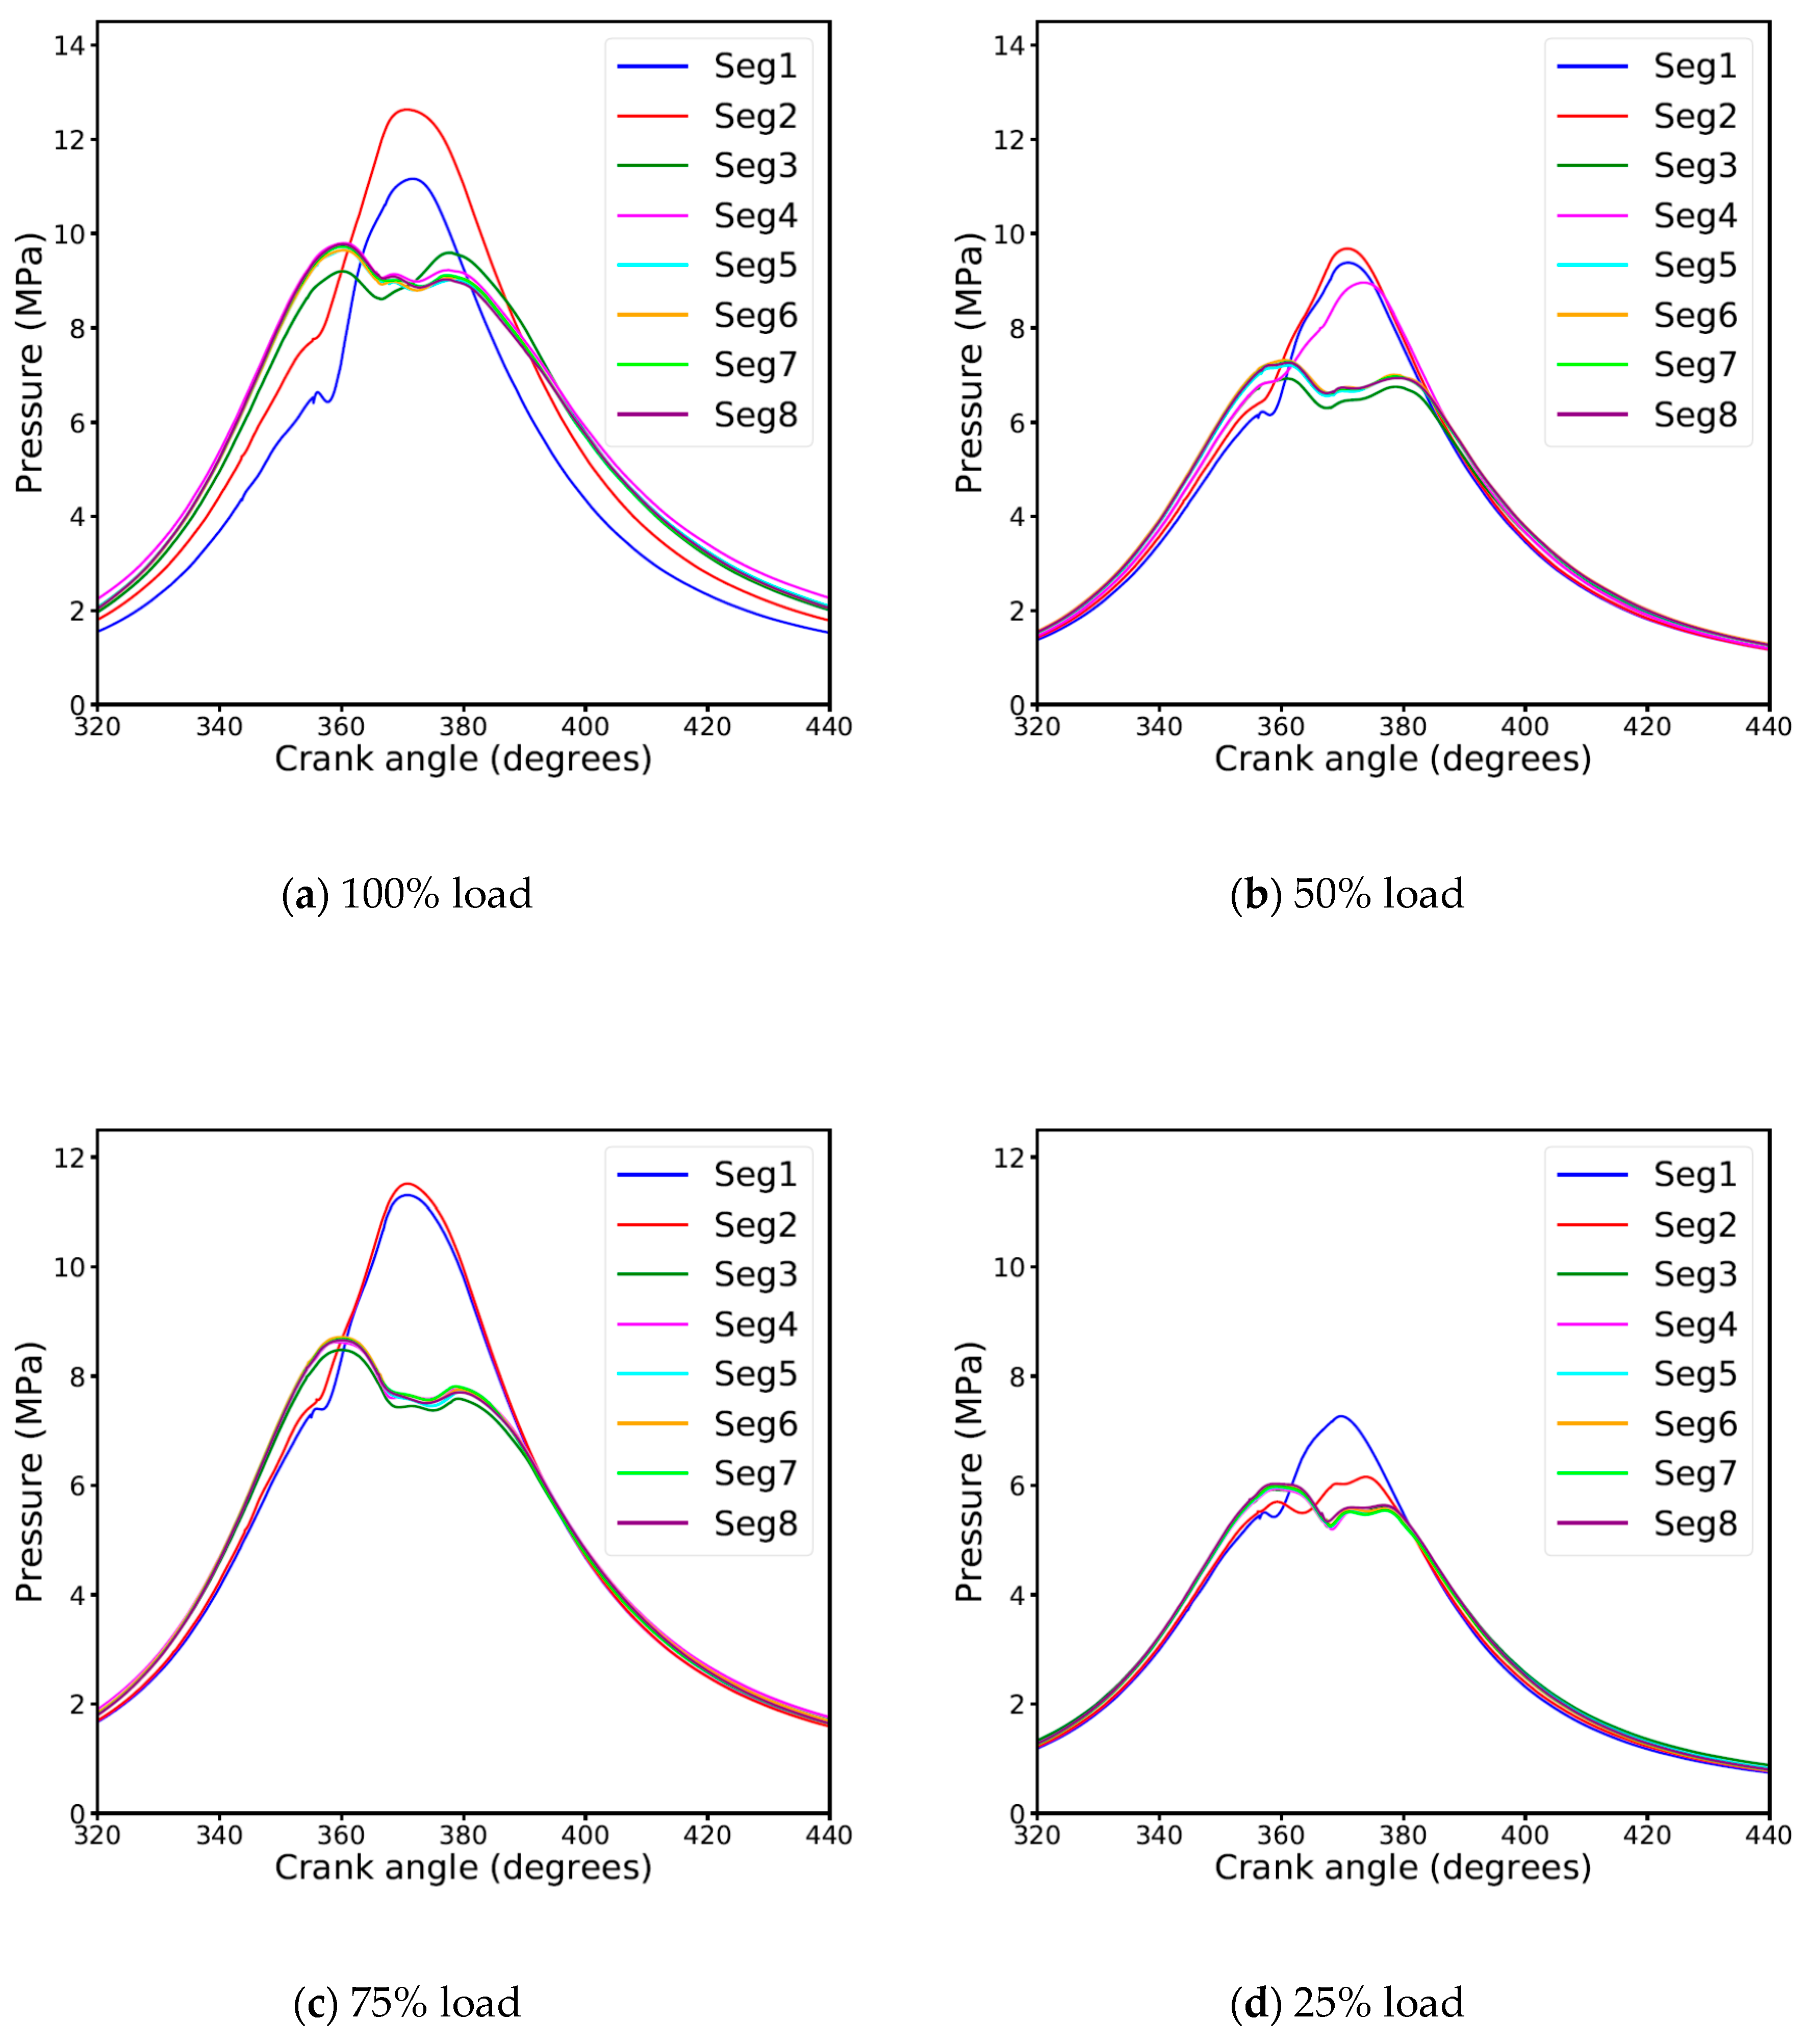
3.3. In-Cylinder Pressure Data
3.4. Mass Fraction Burned
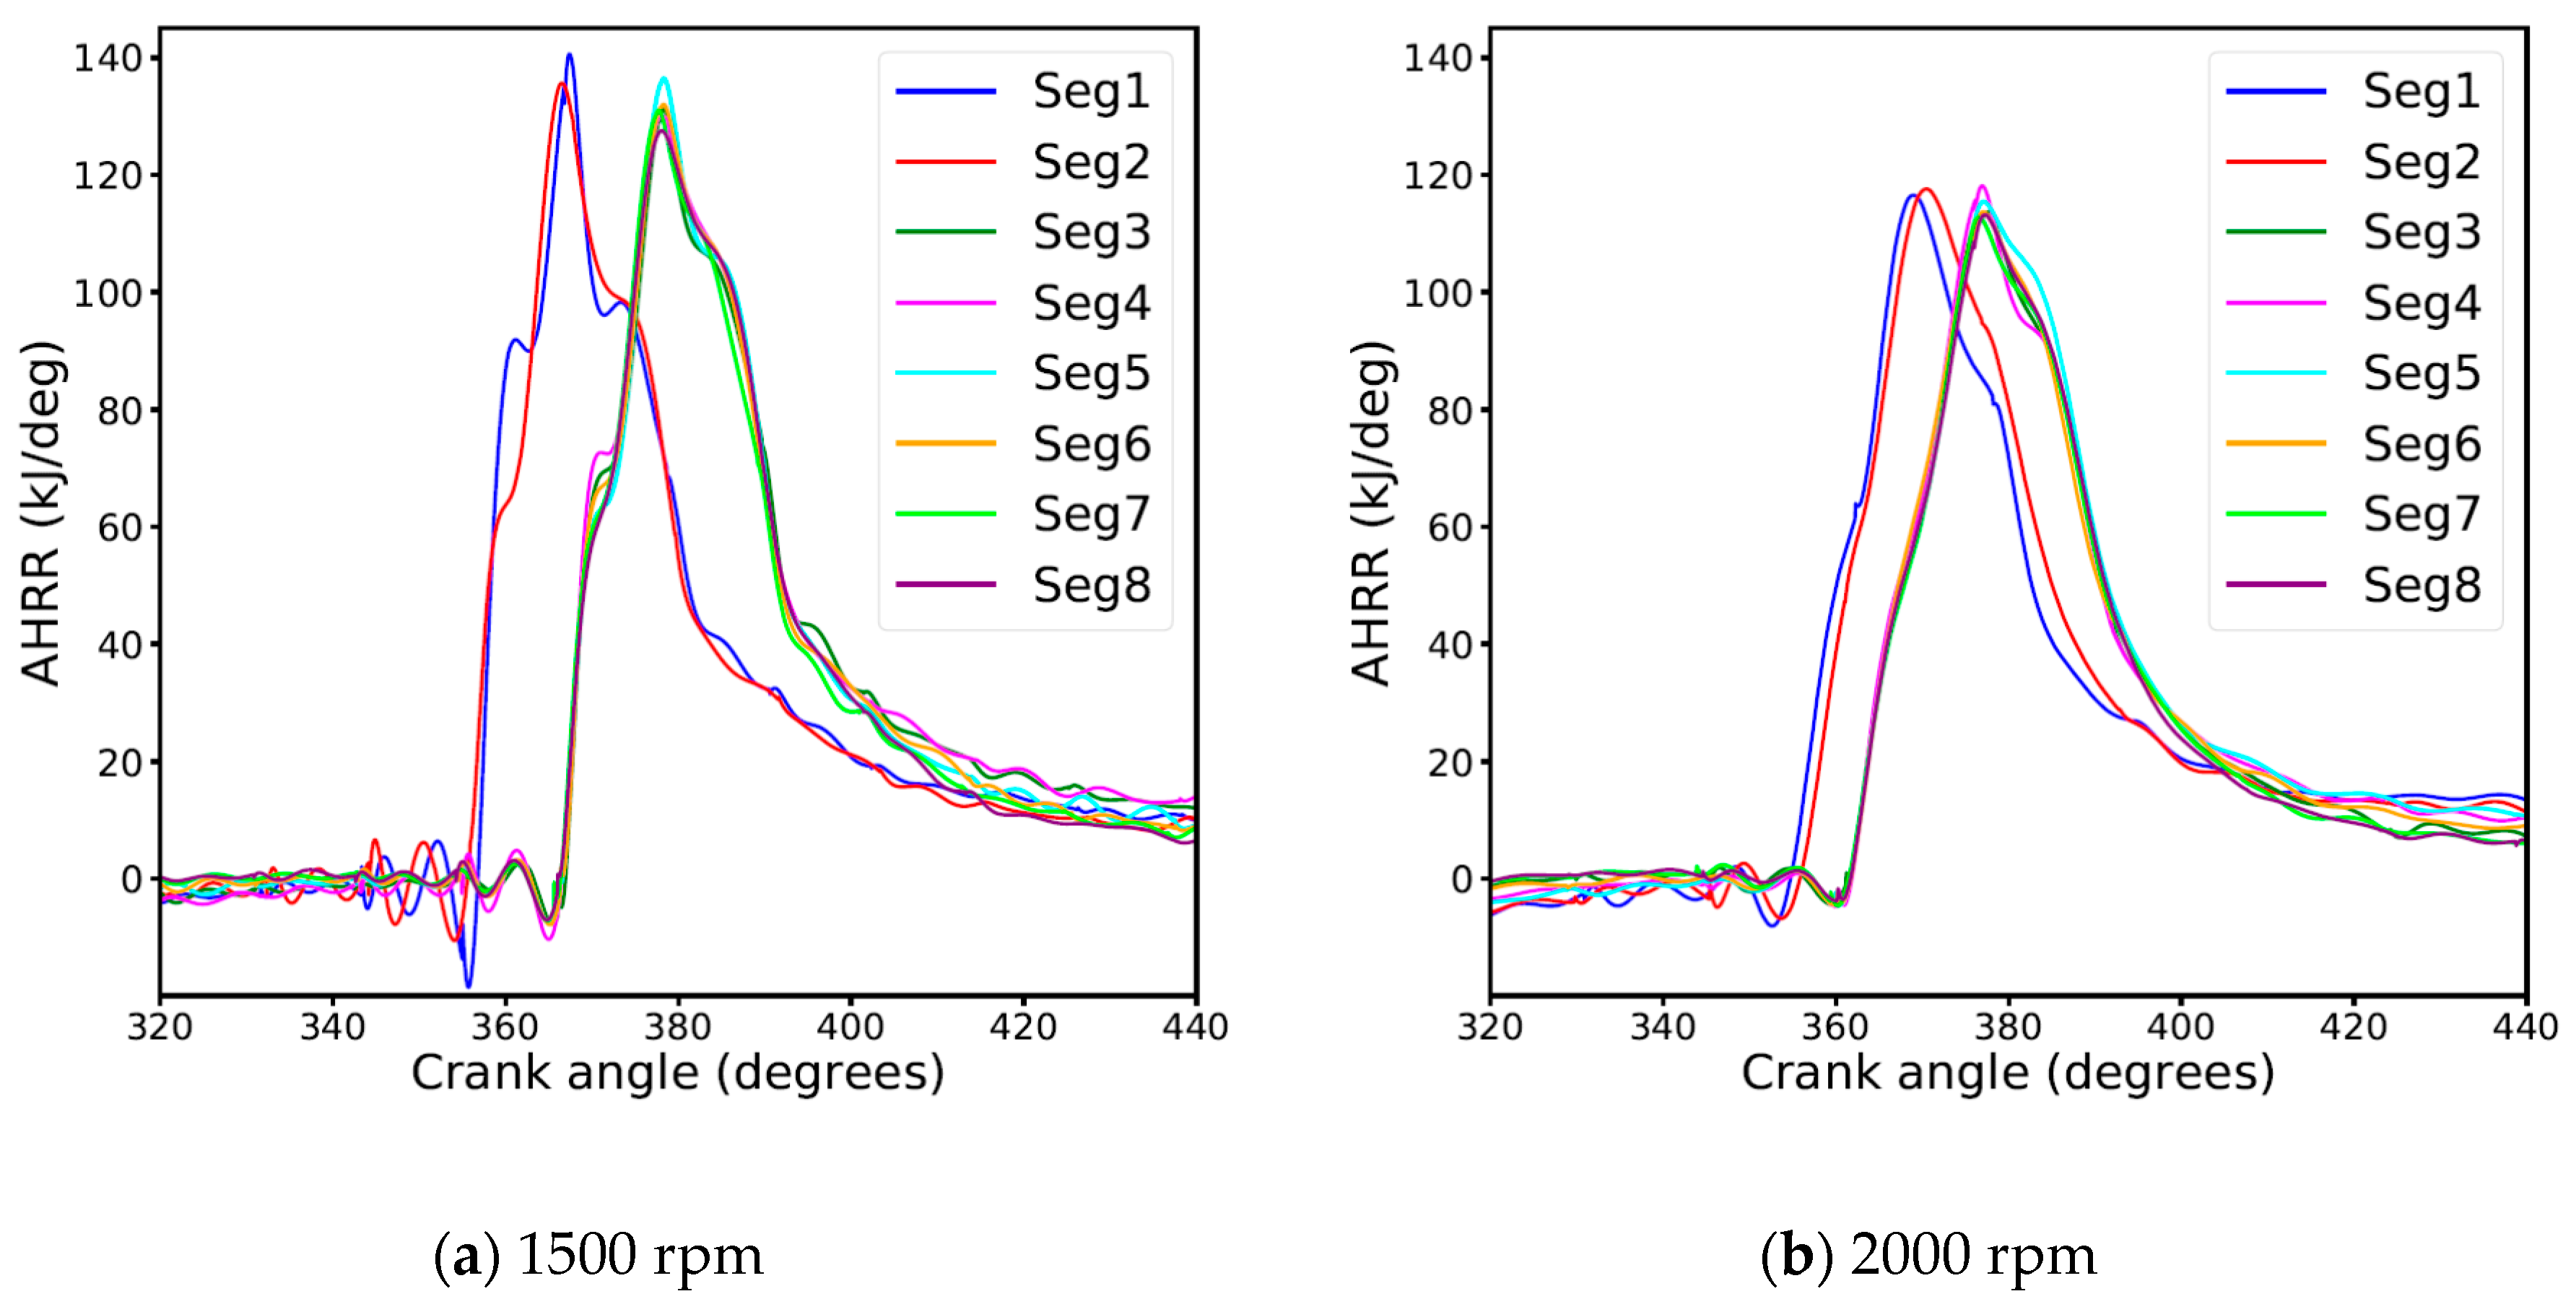
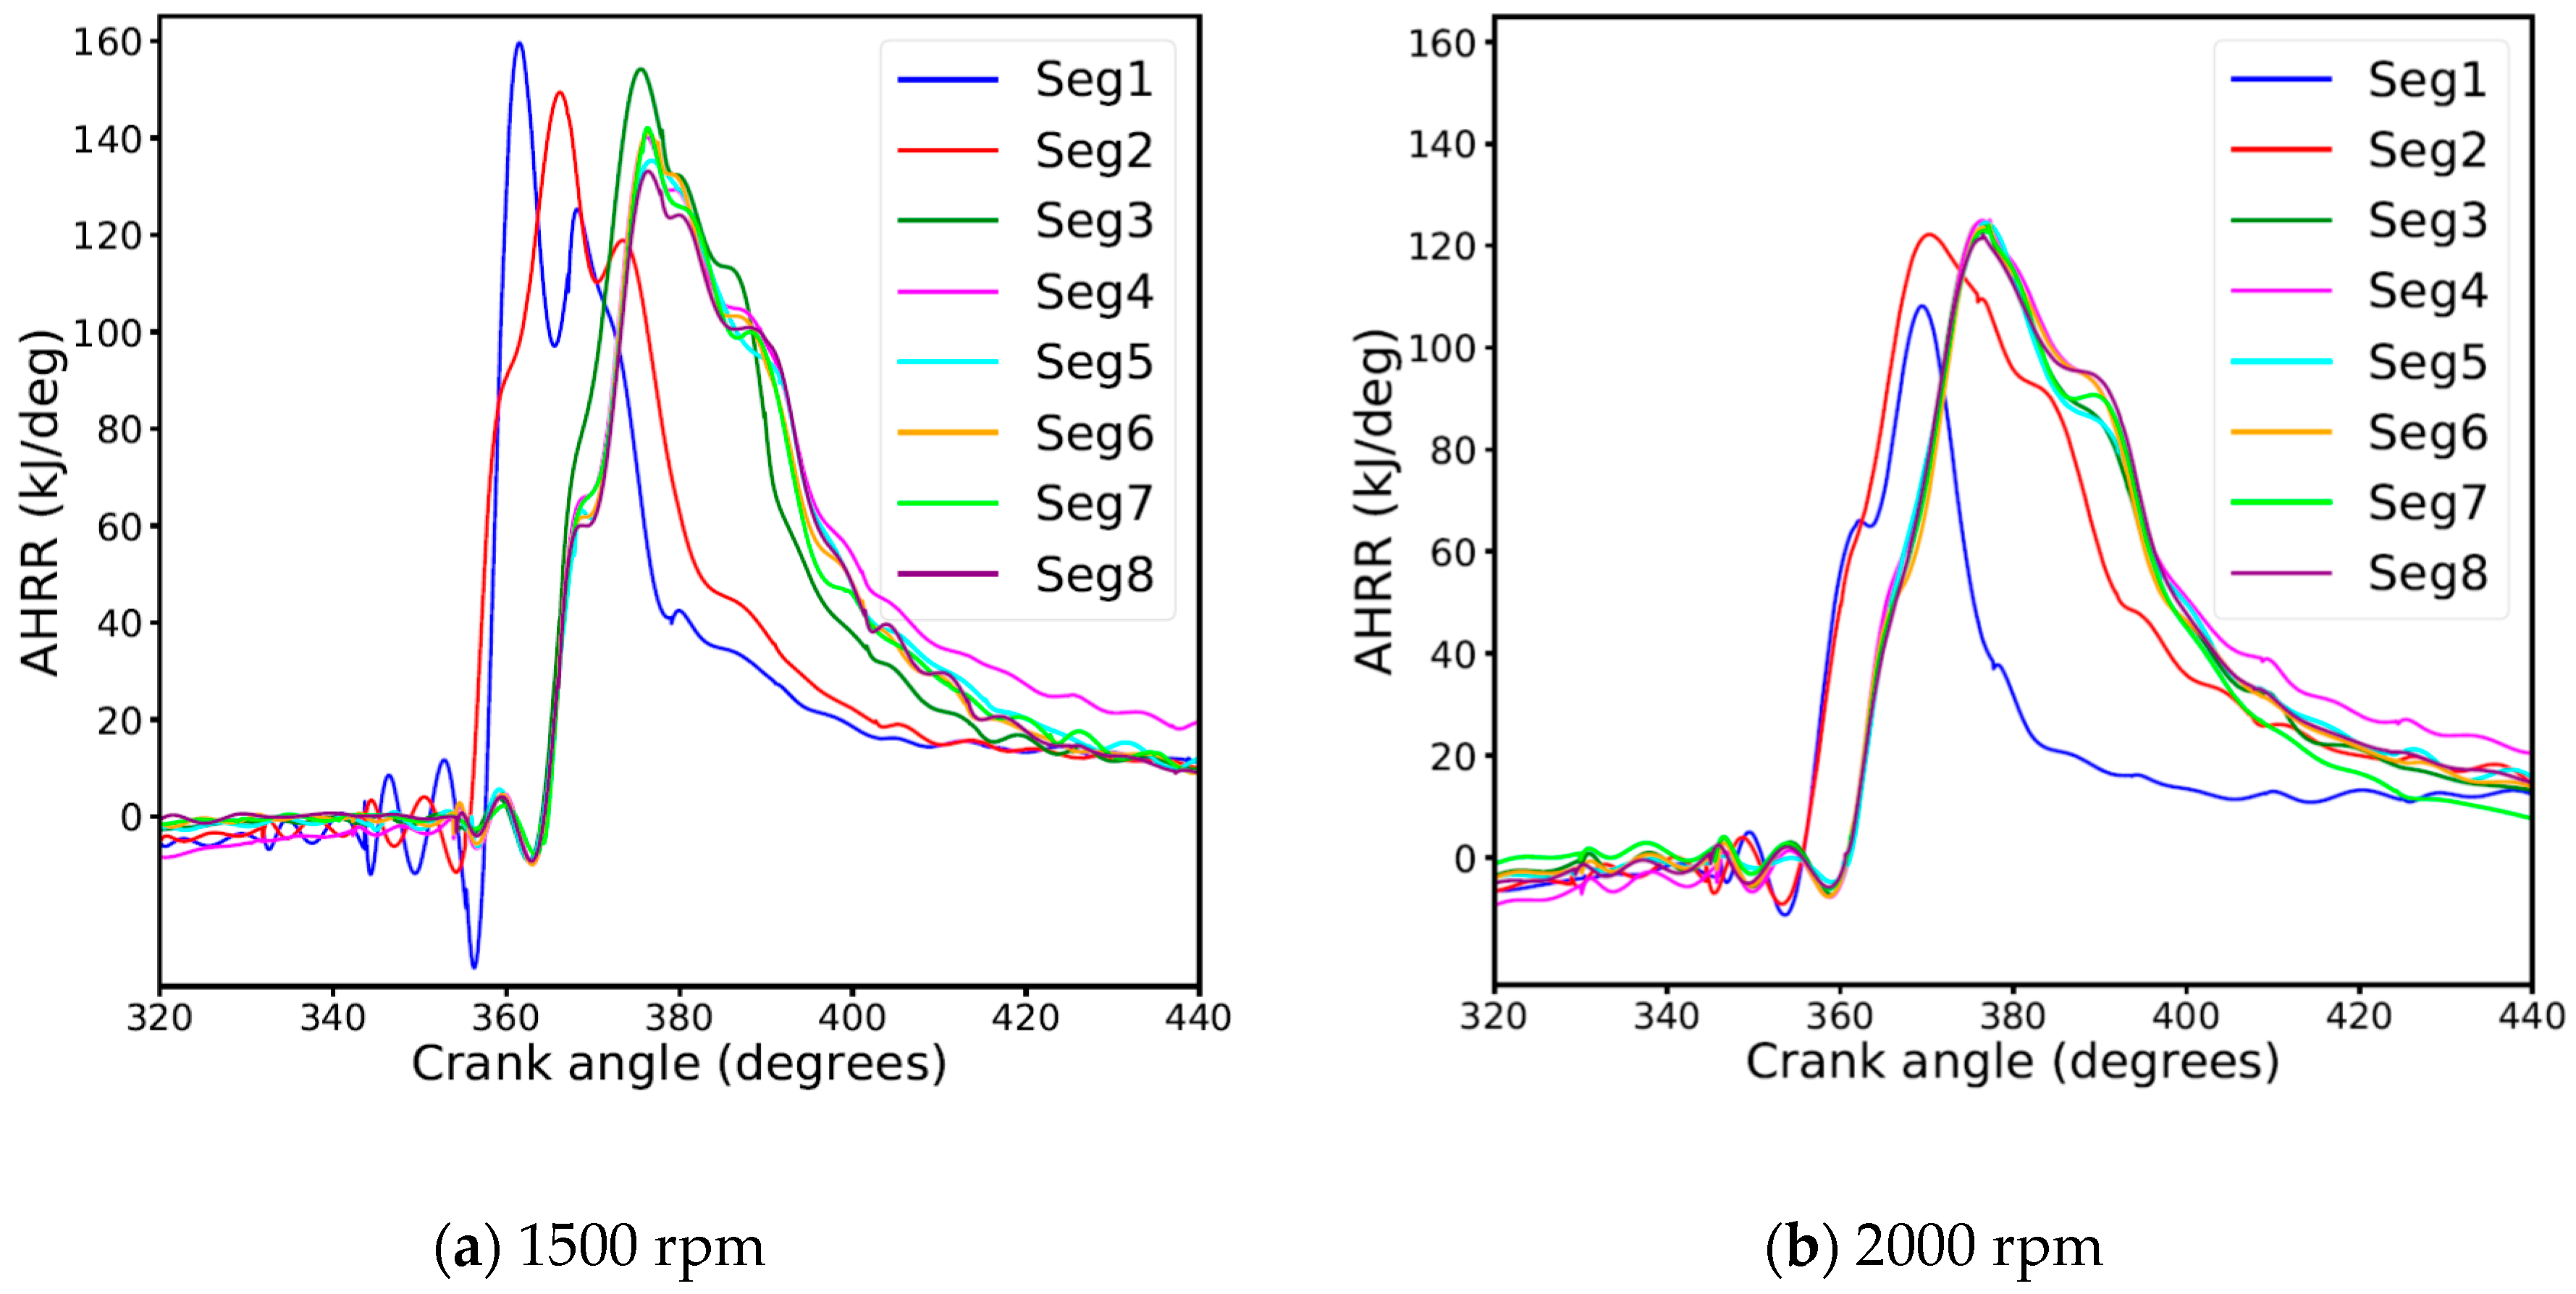
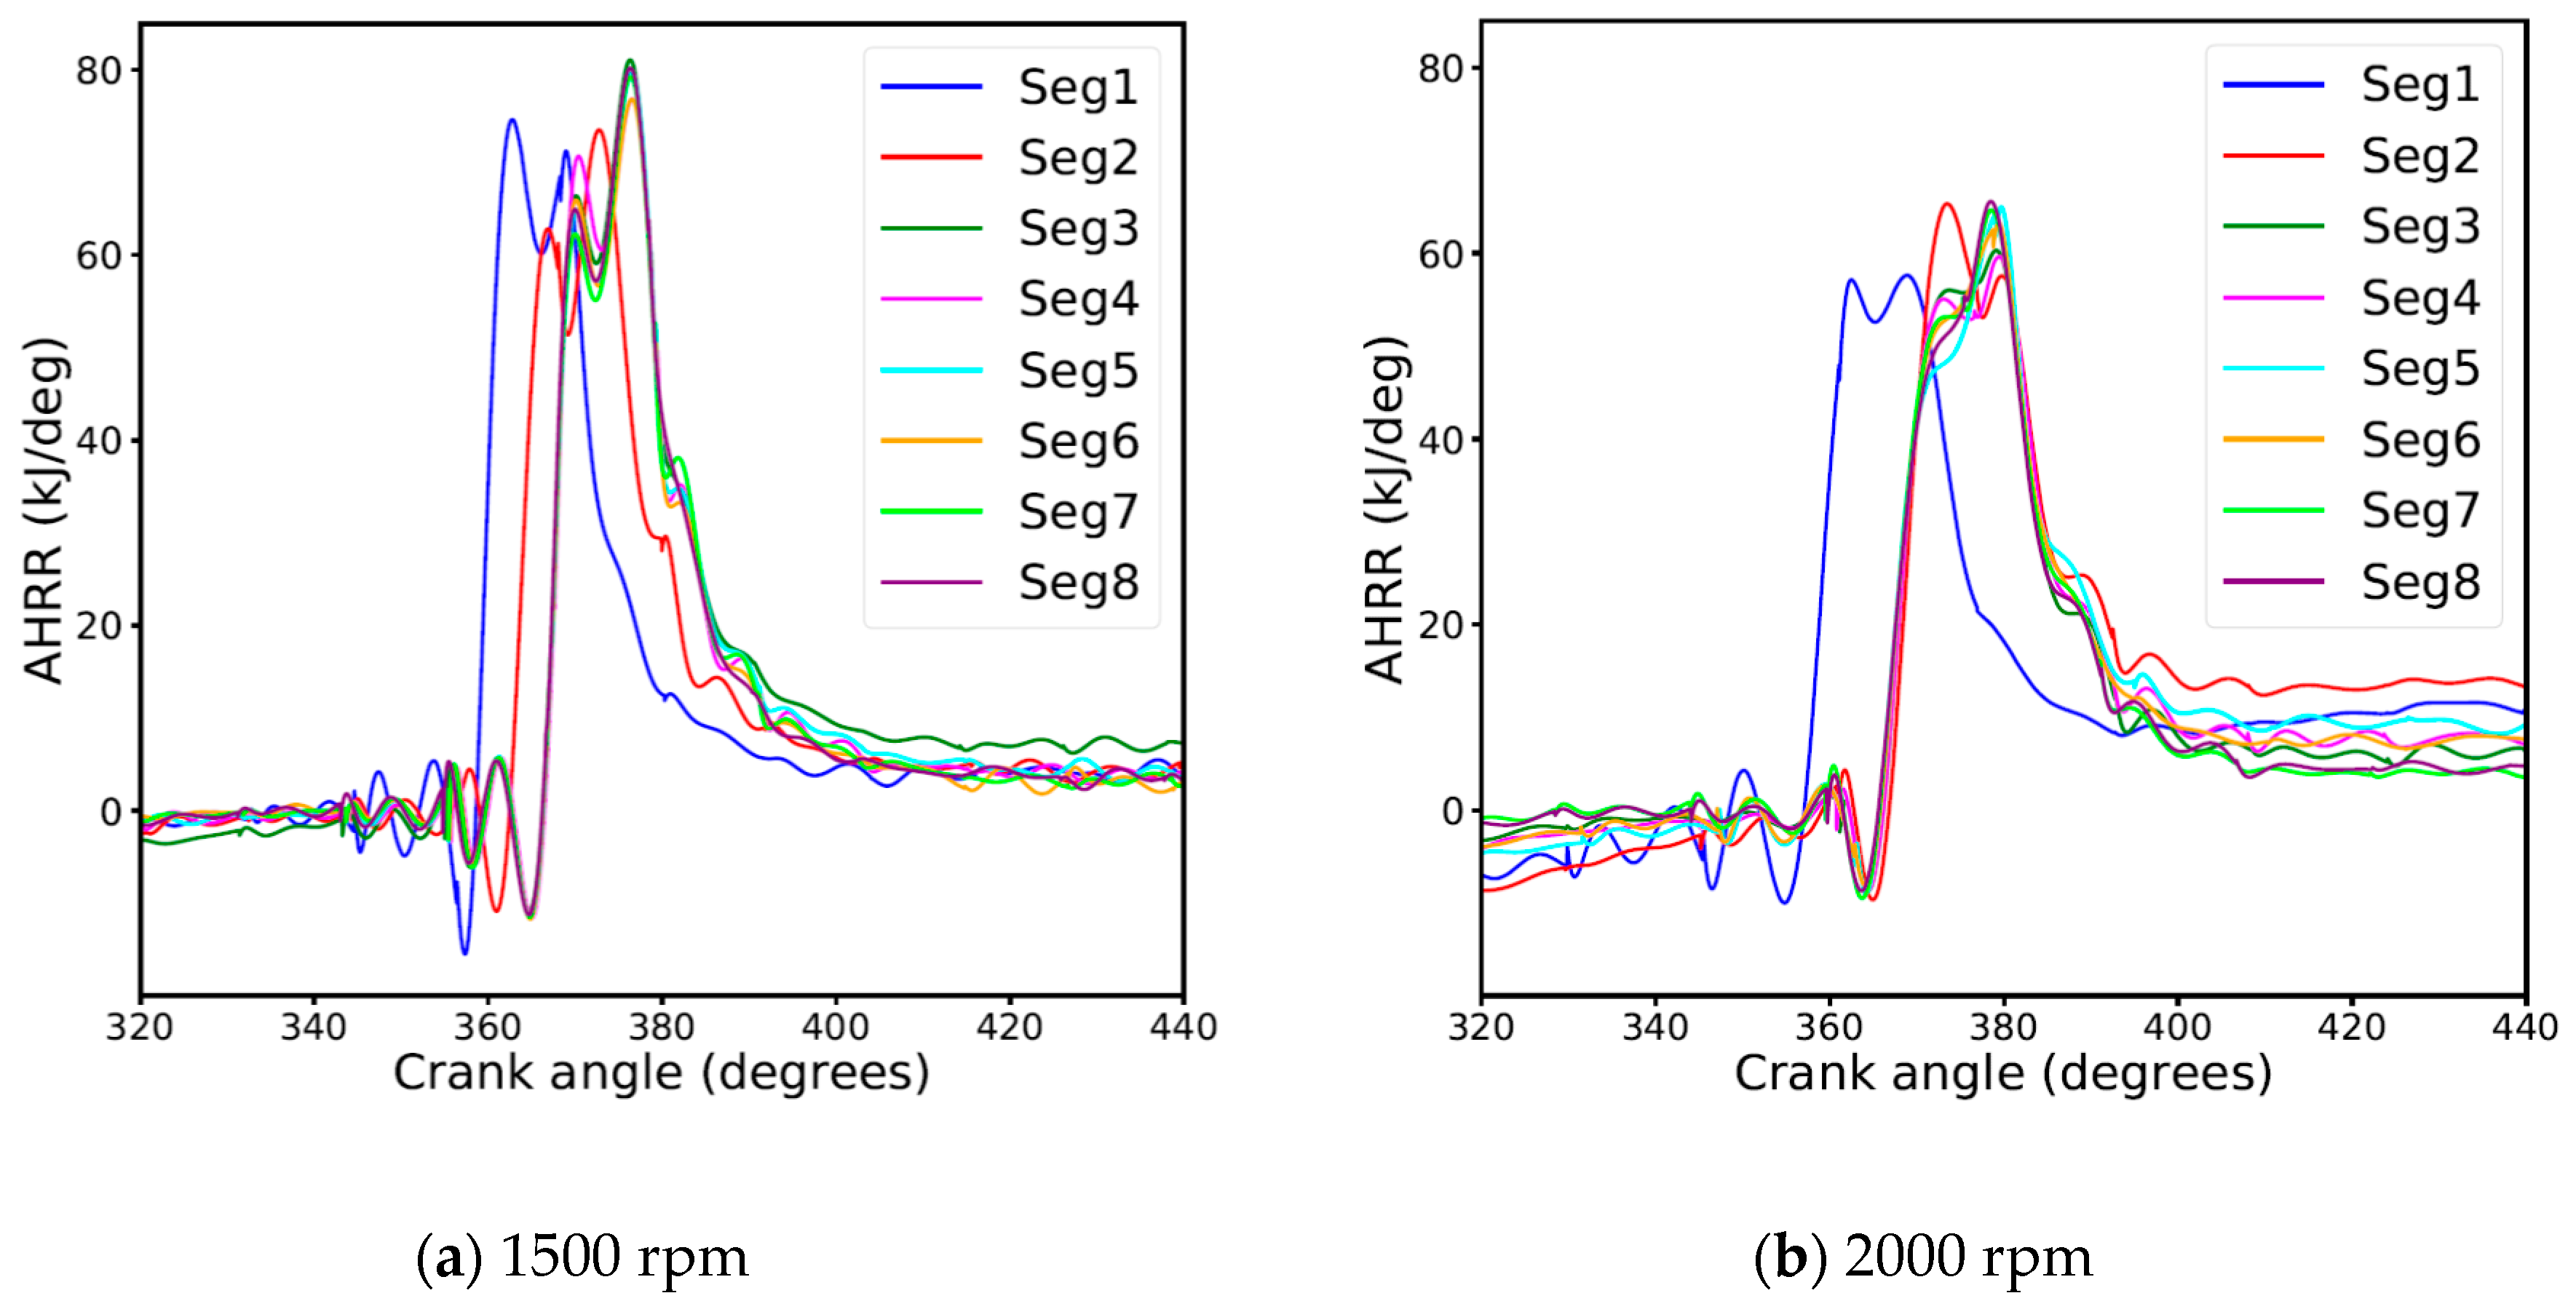
3.5. Apparent Heat Release Rate (AHRR)
3.6. Combustion Parameters
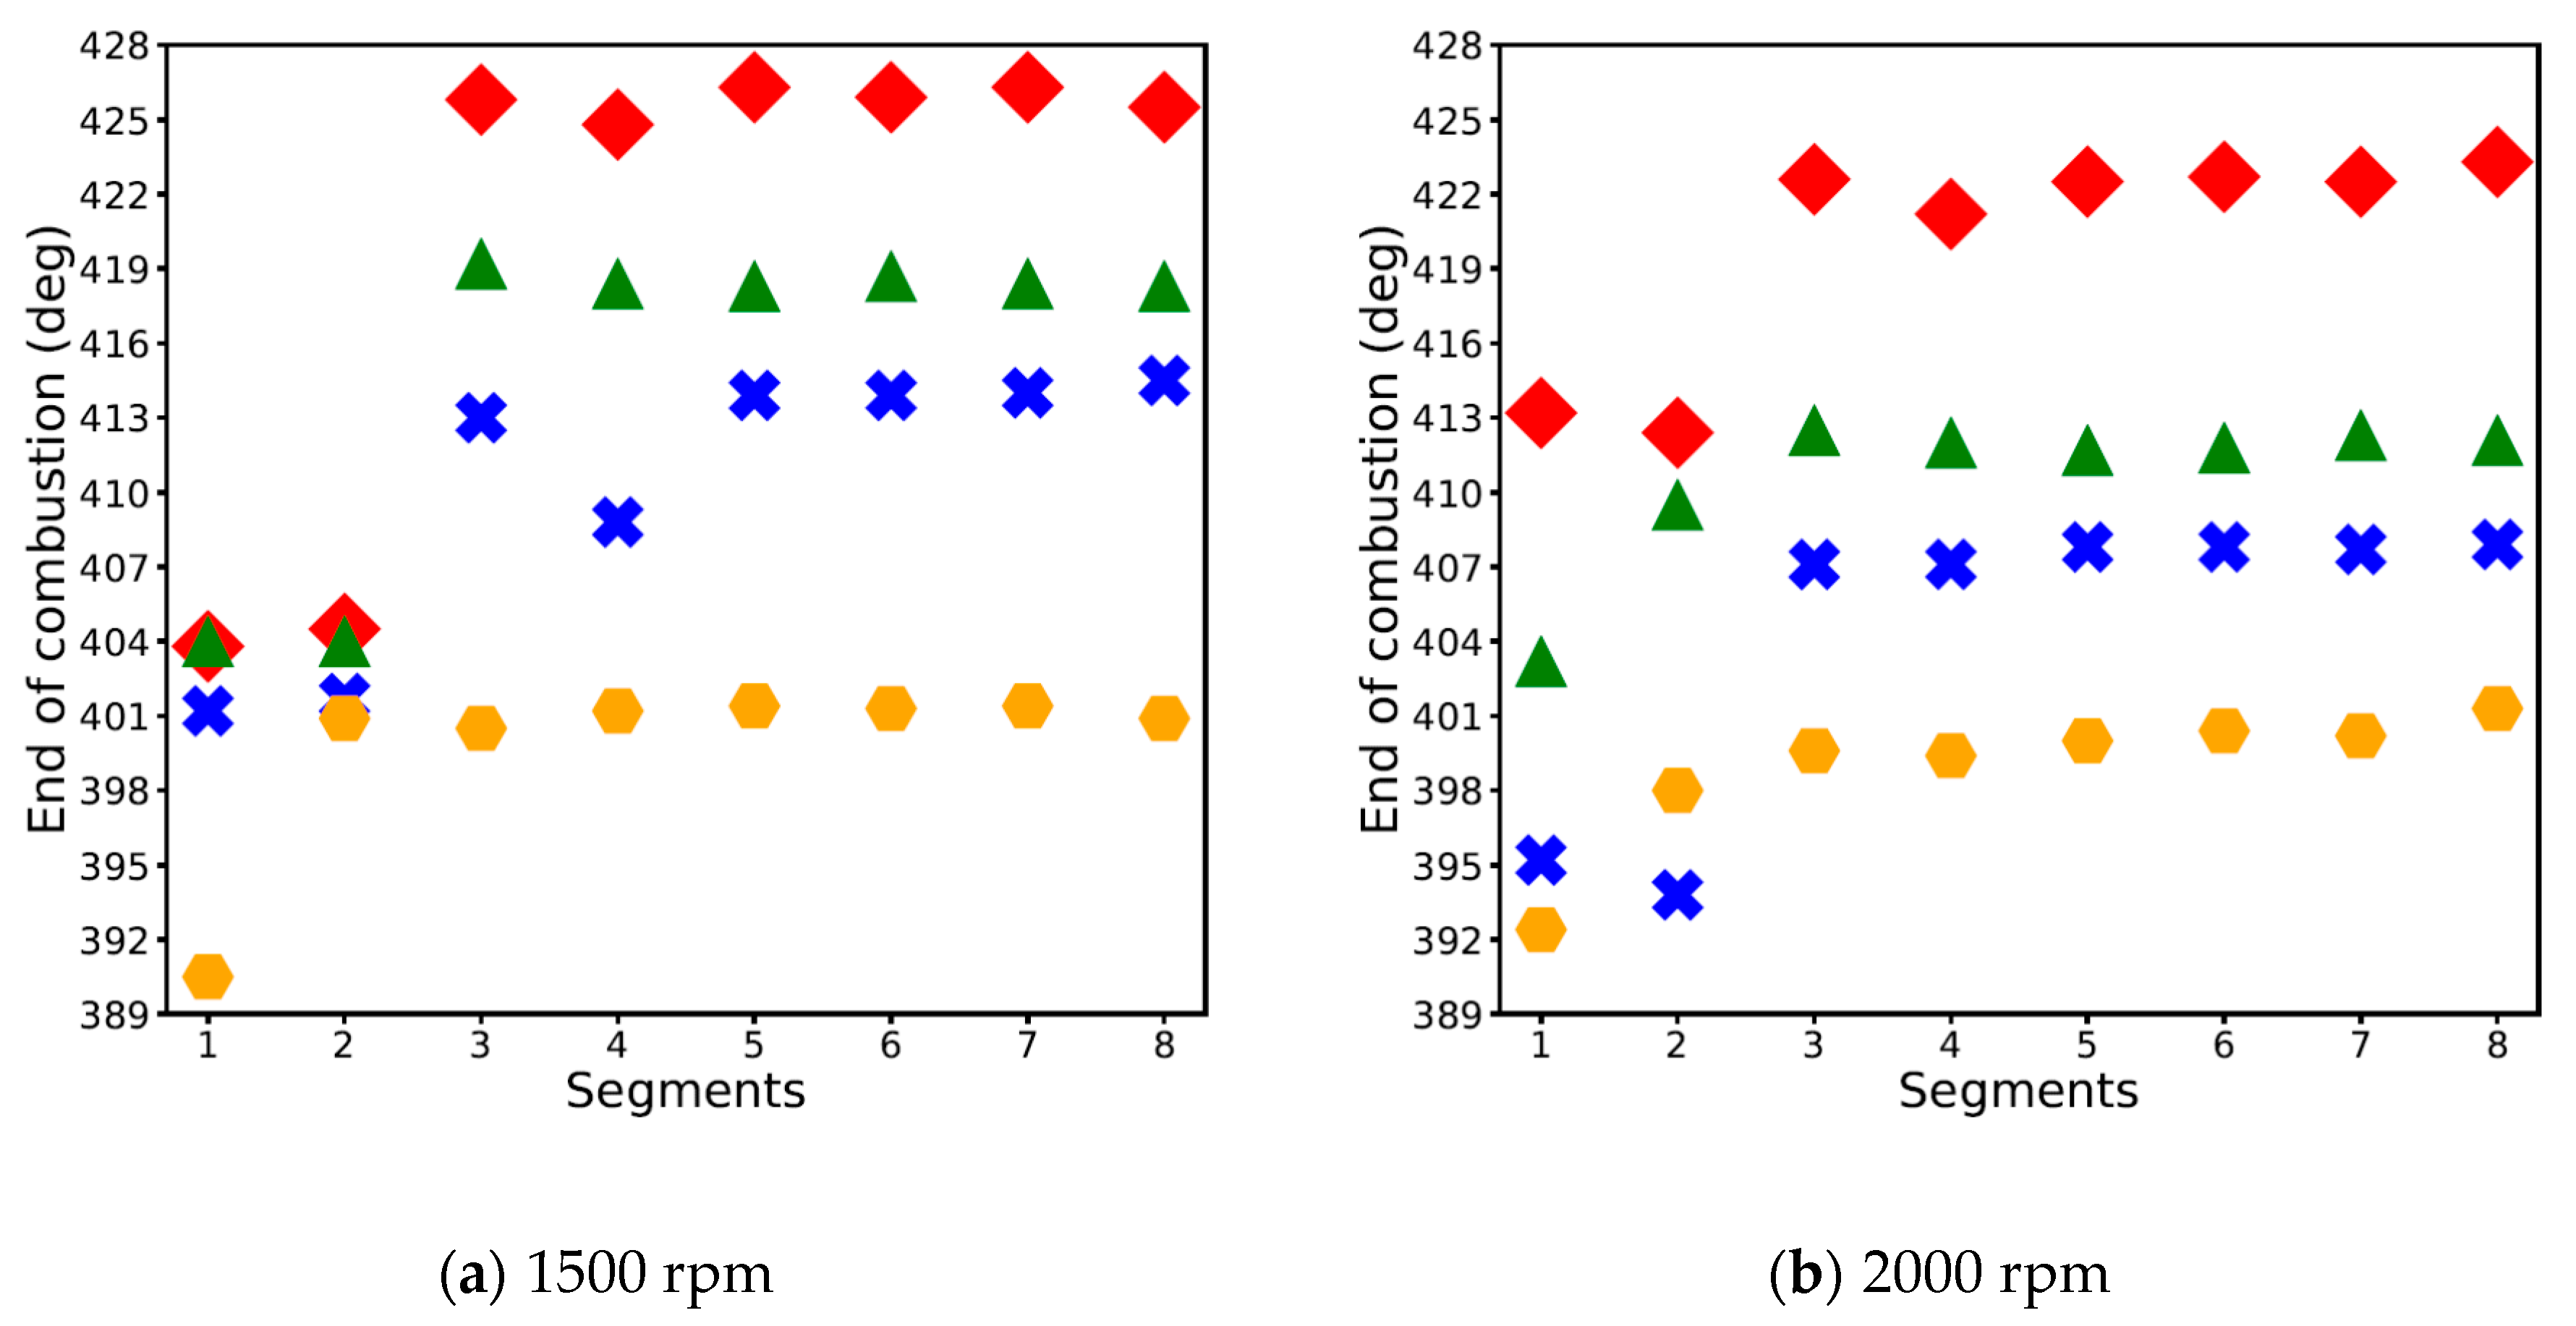
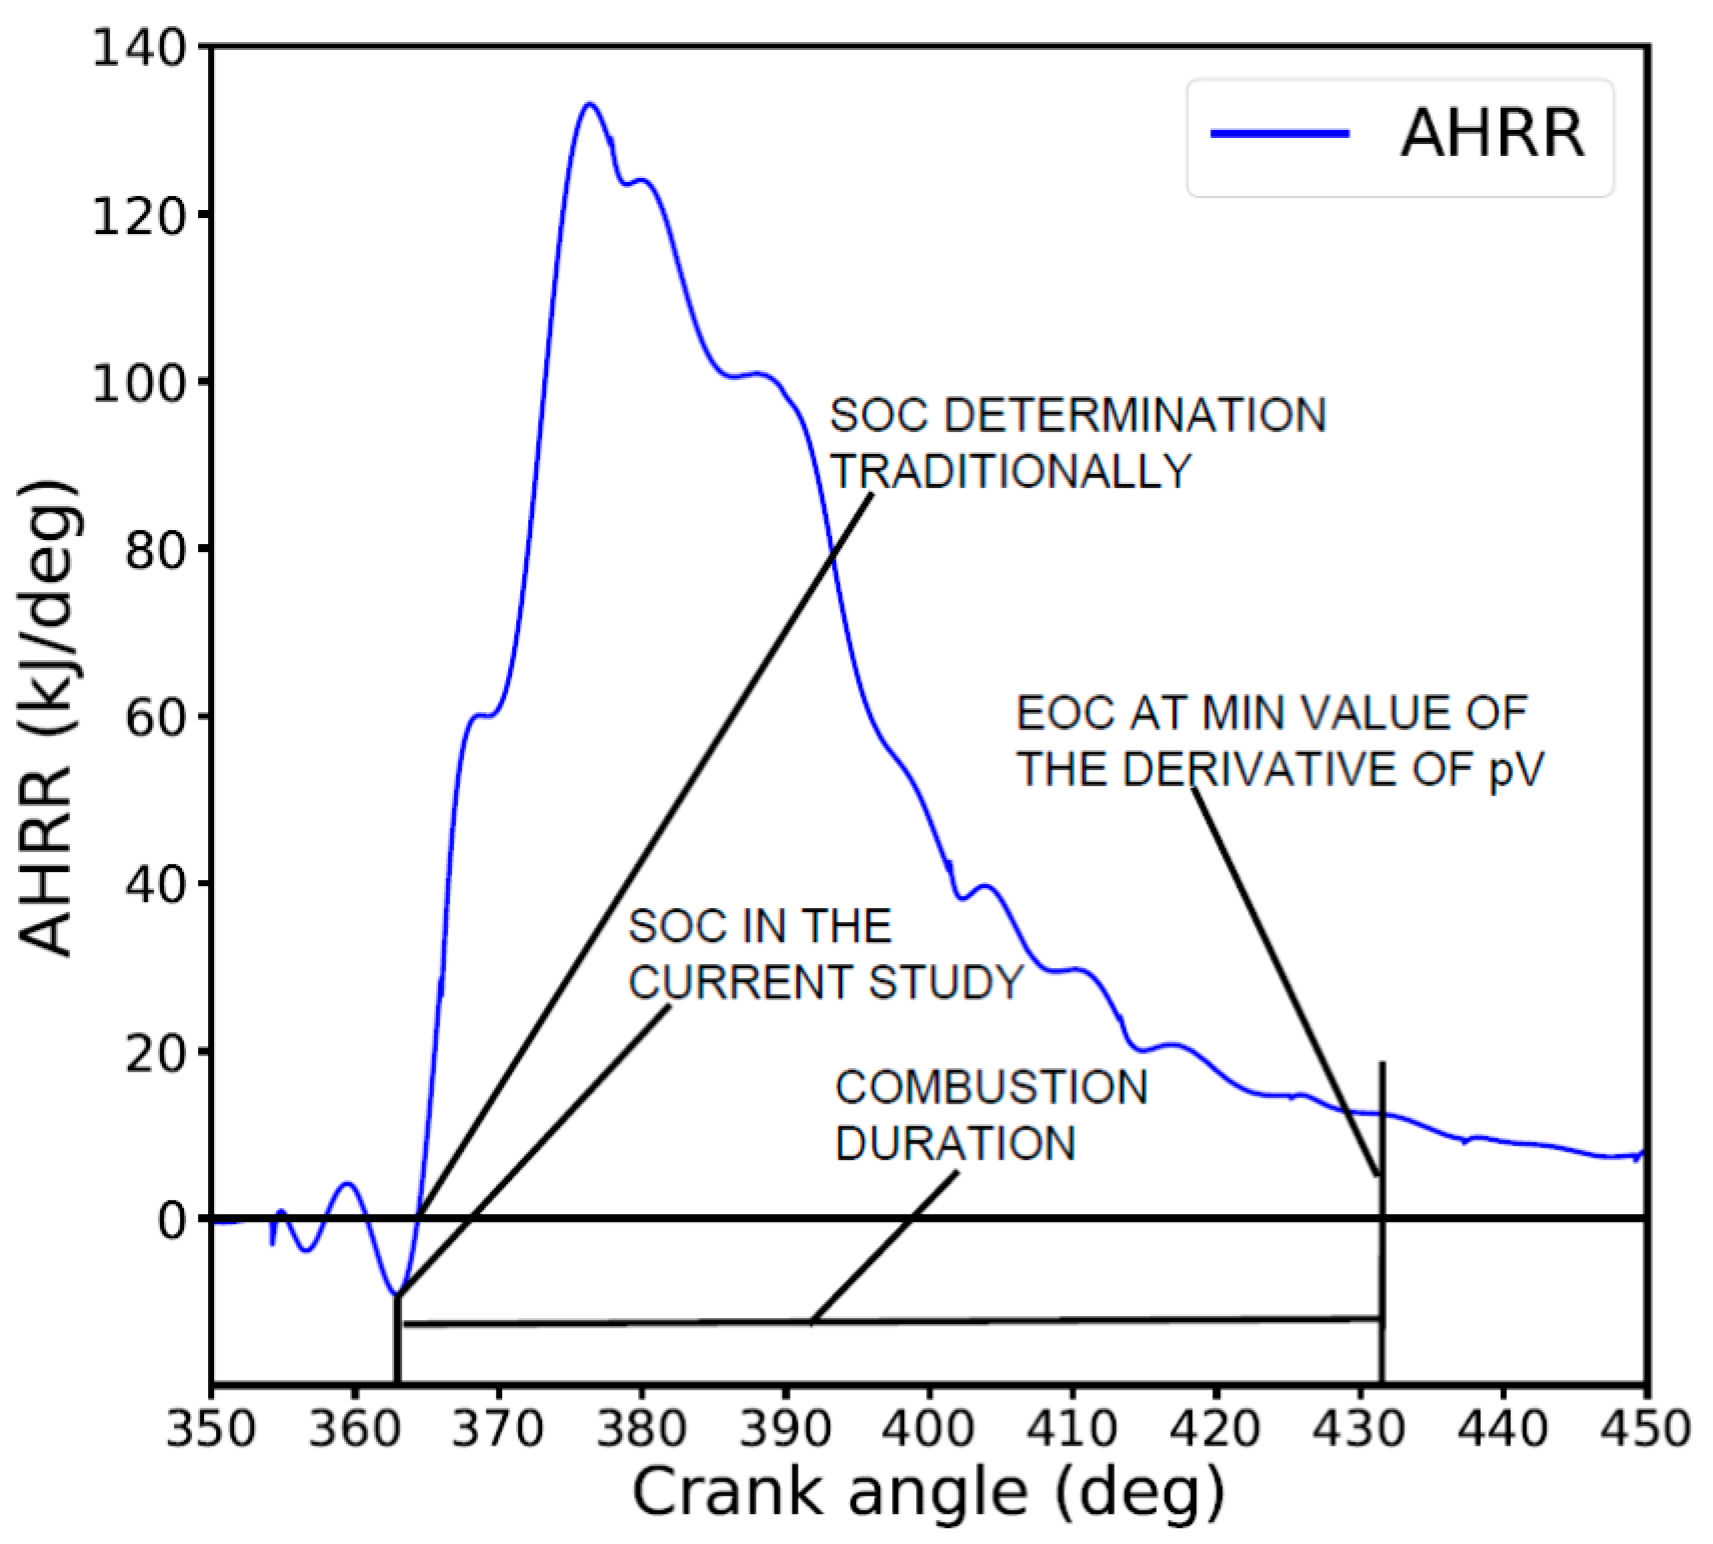
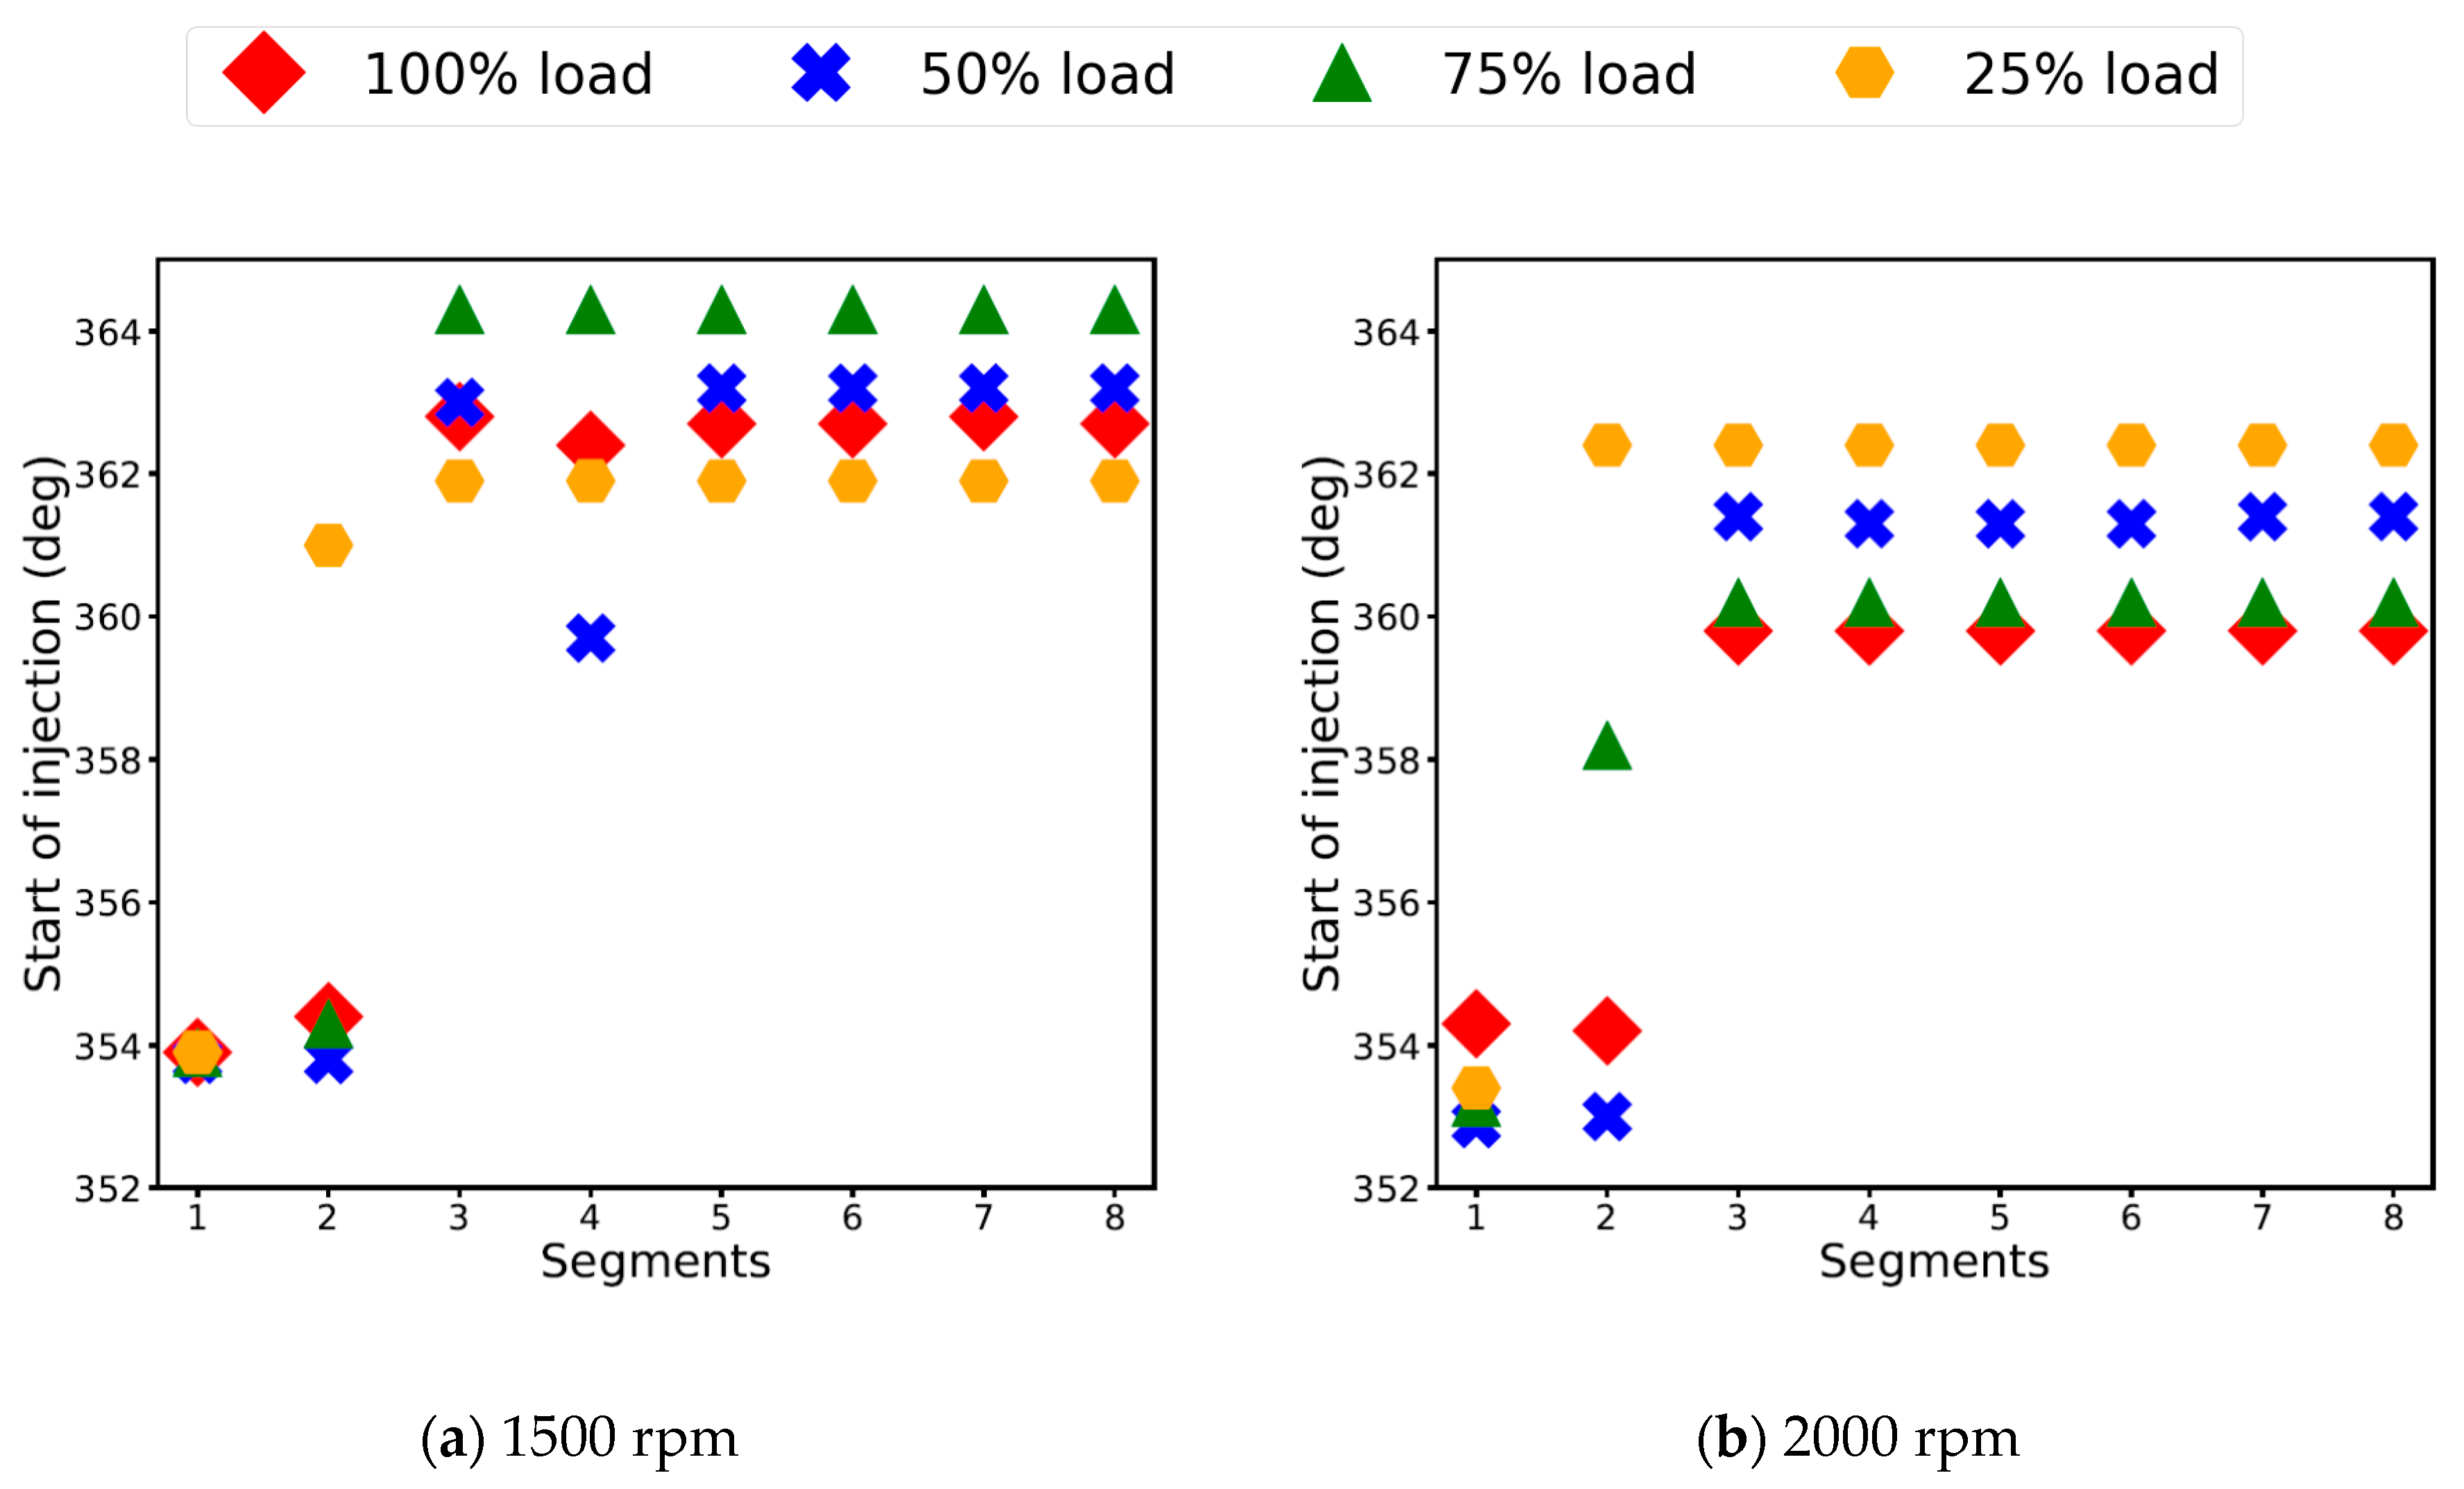
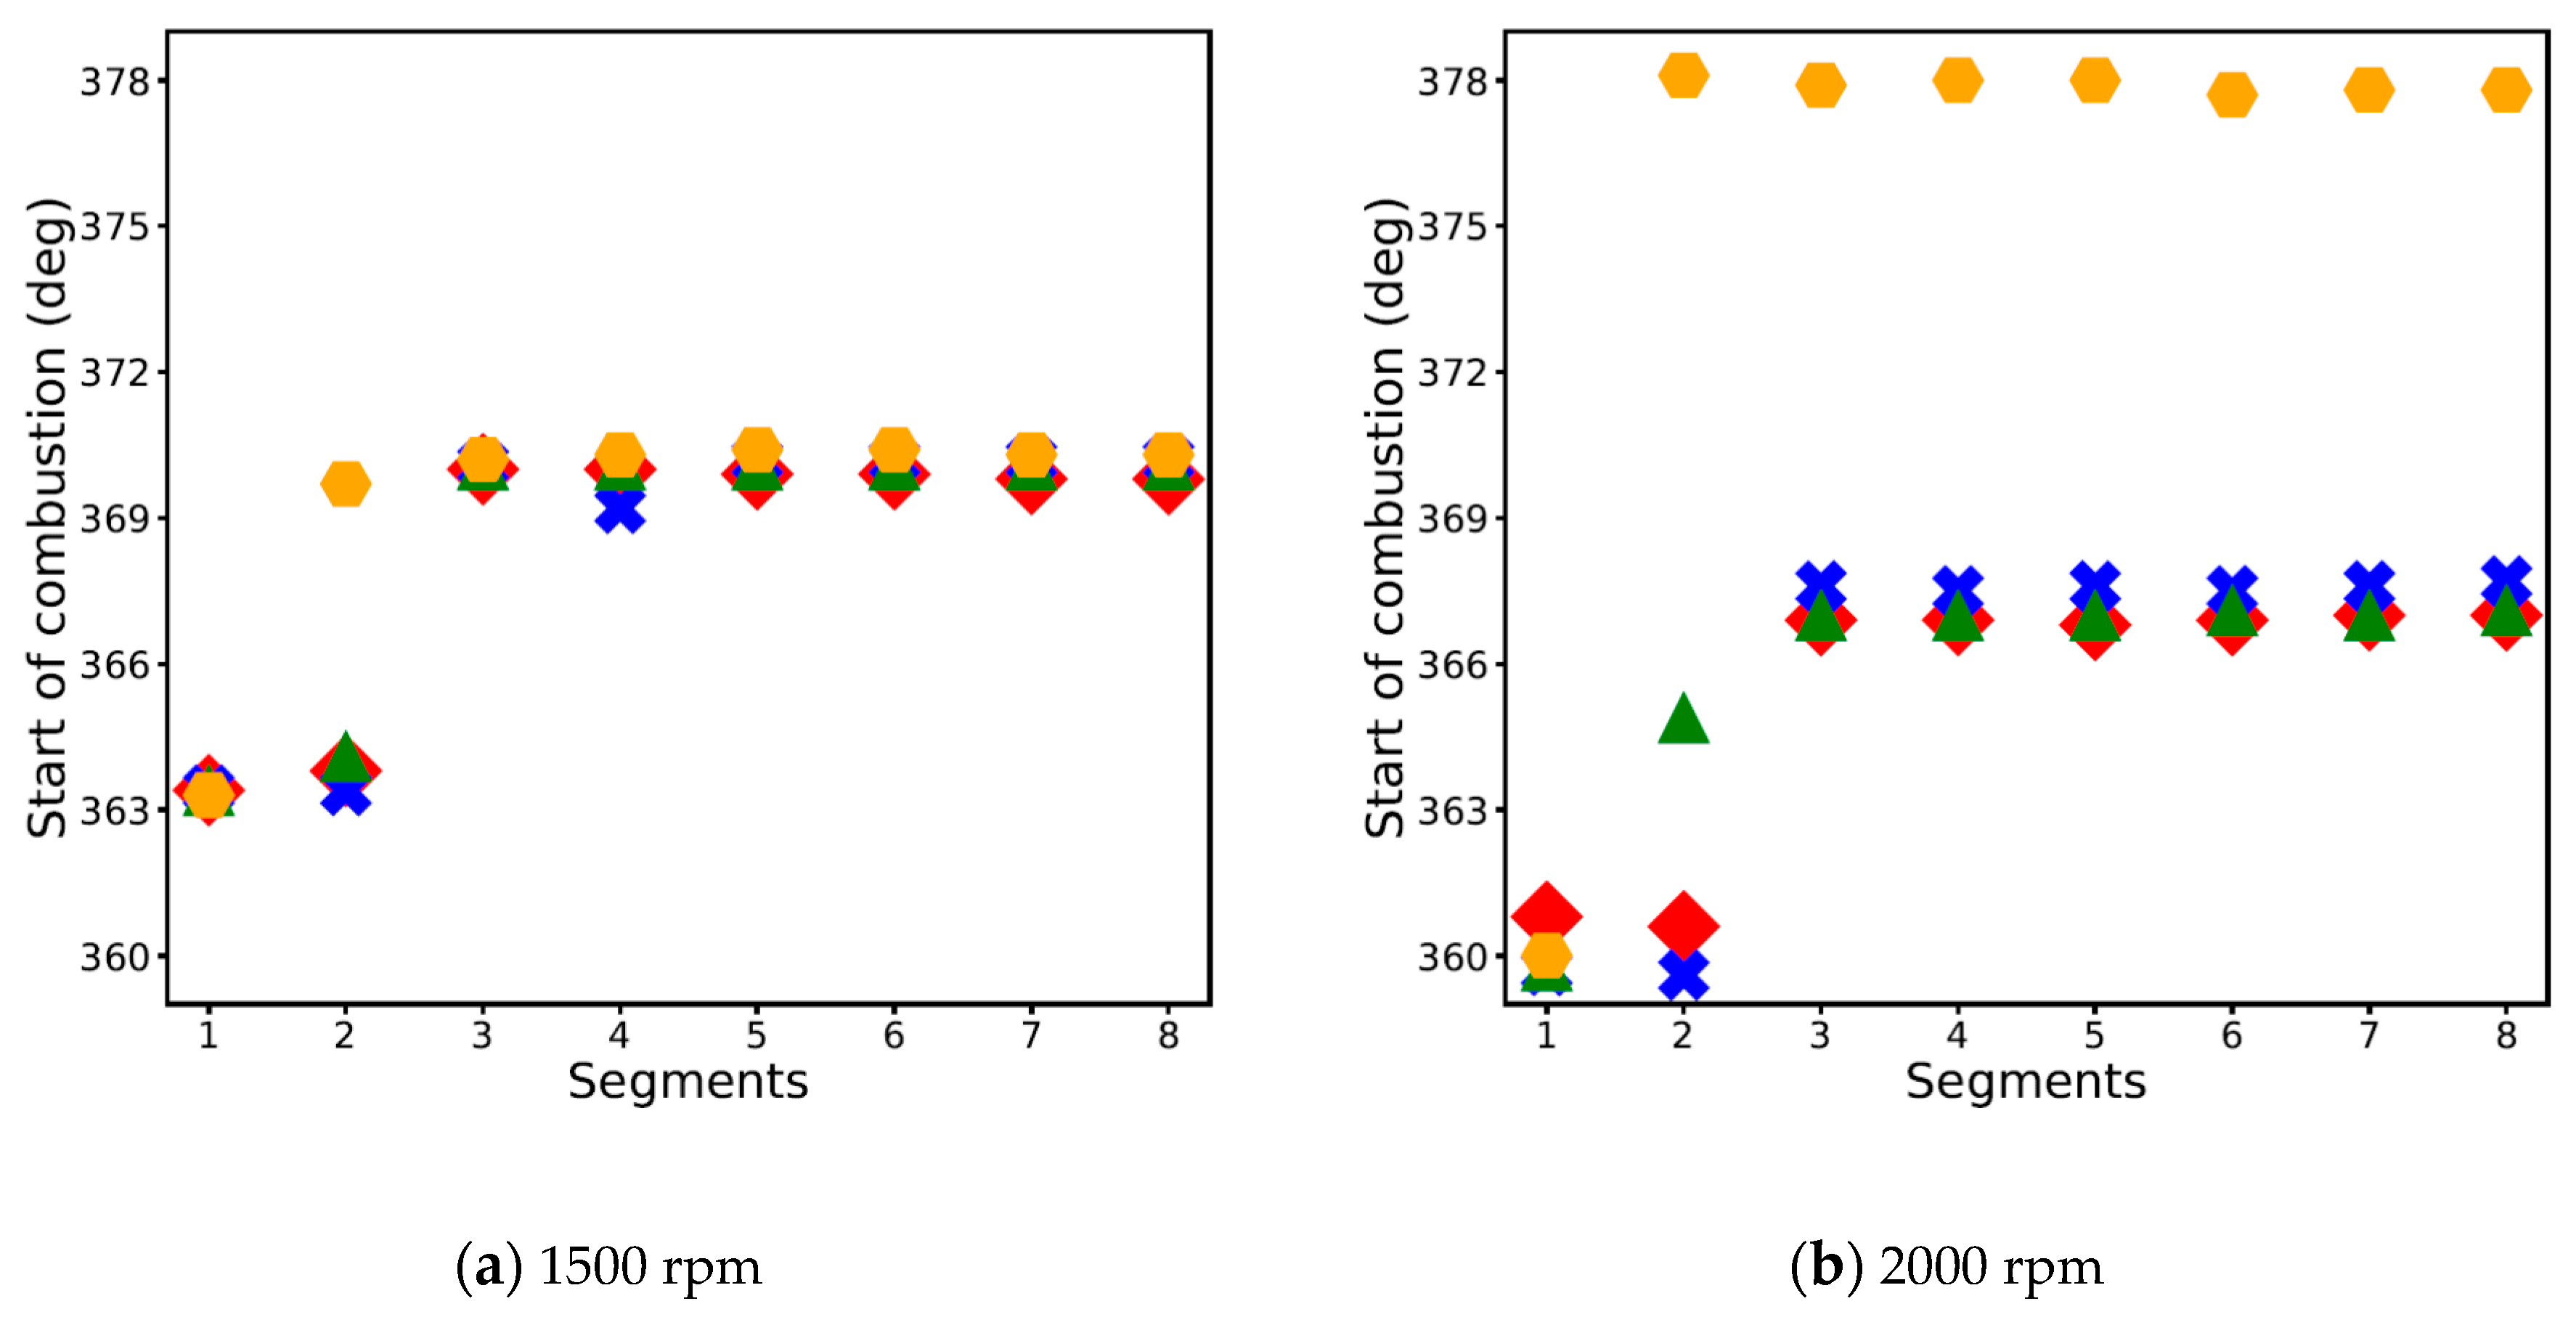
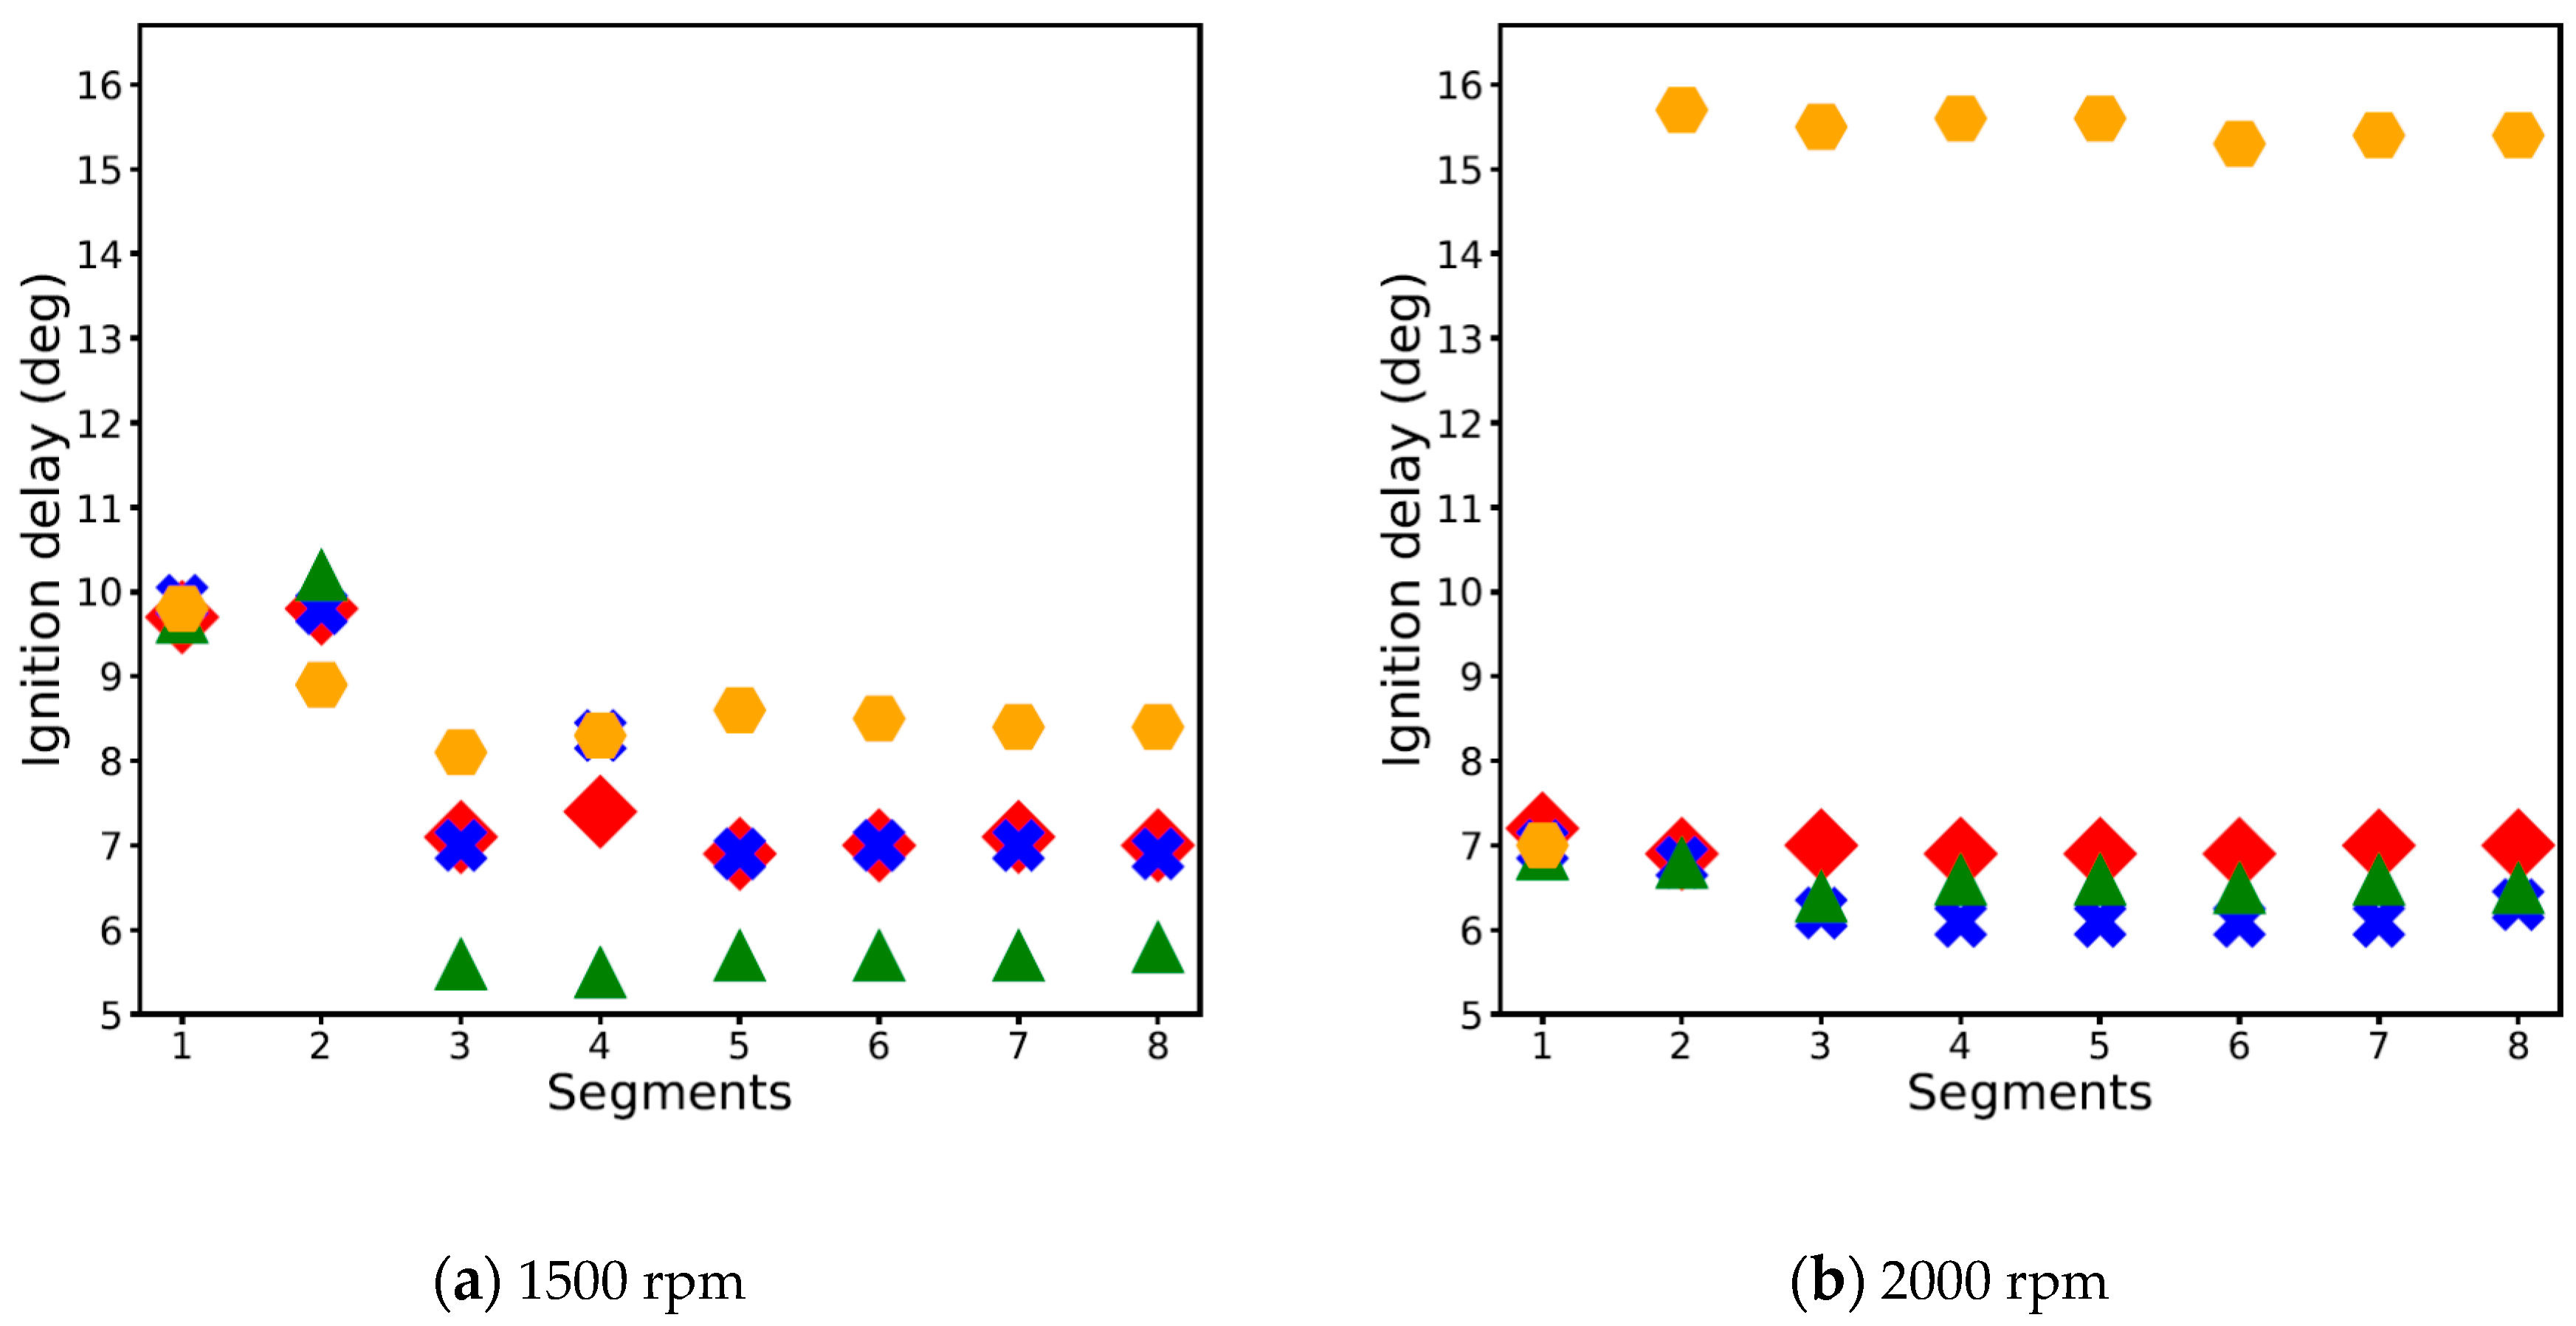
3.6.1. The SOI, SOC, Ignition Delay and EOC
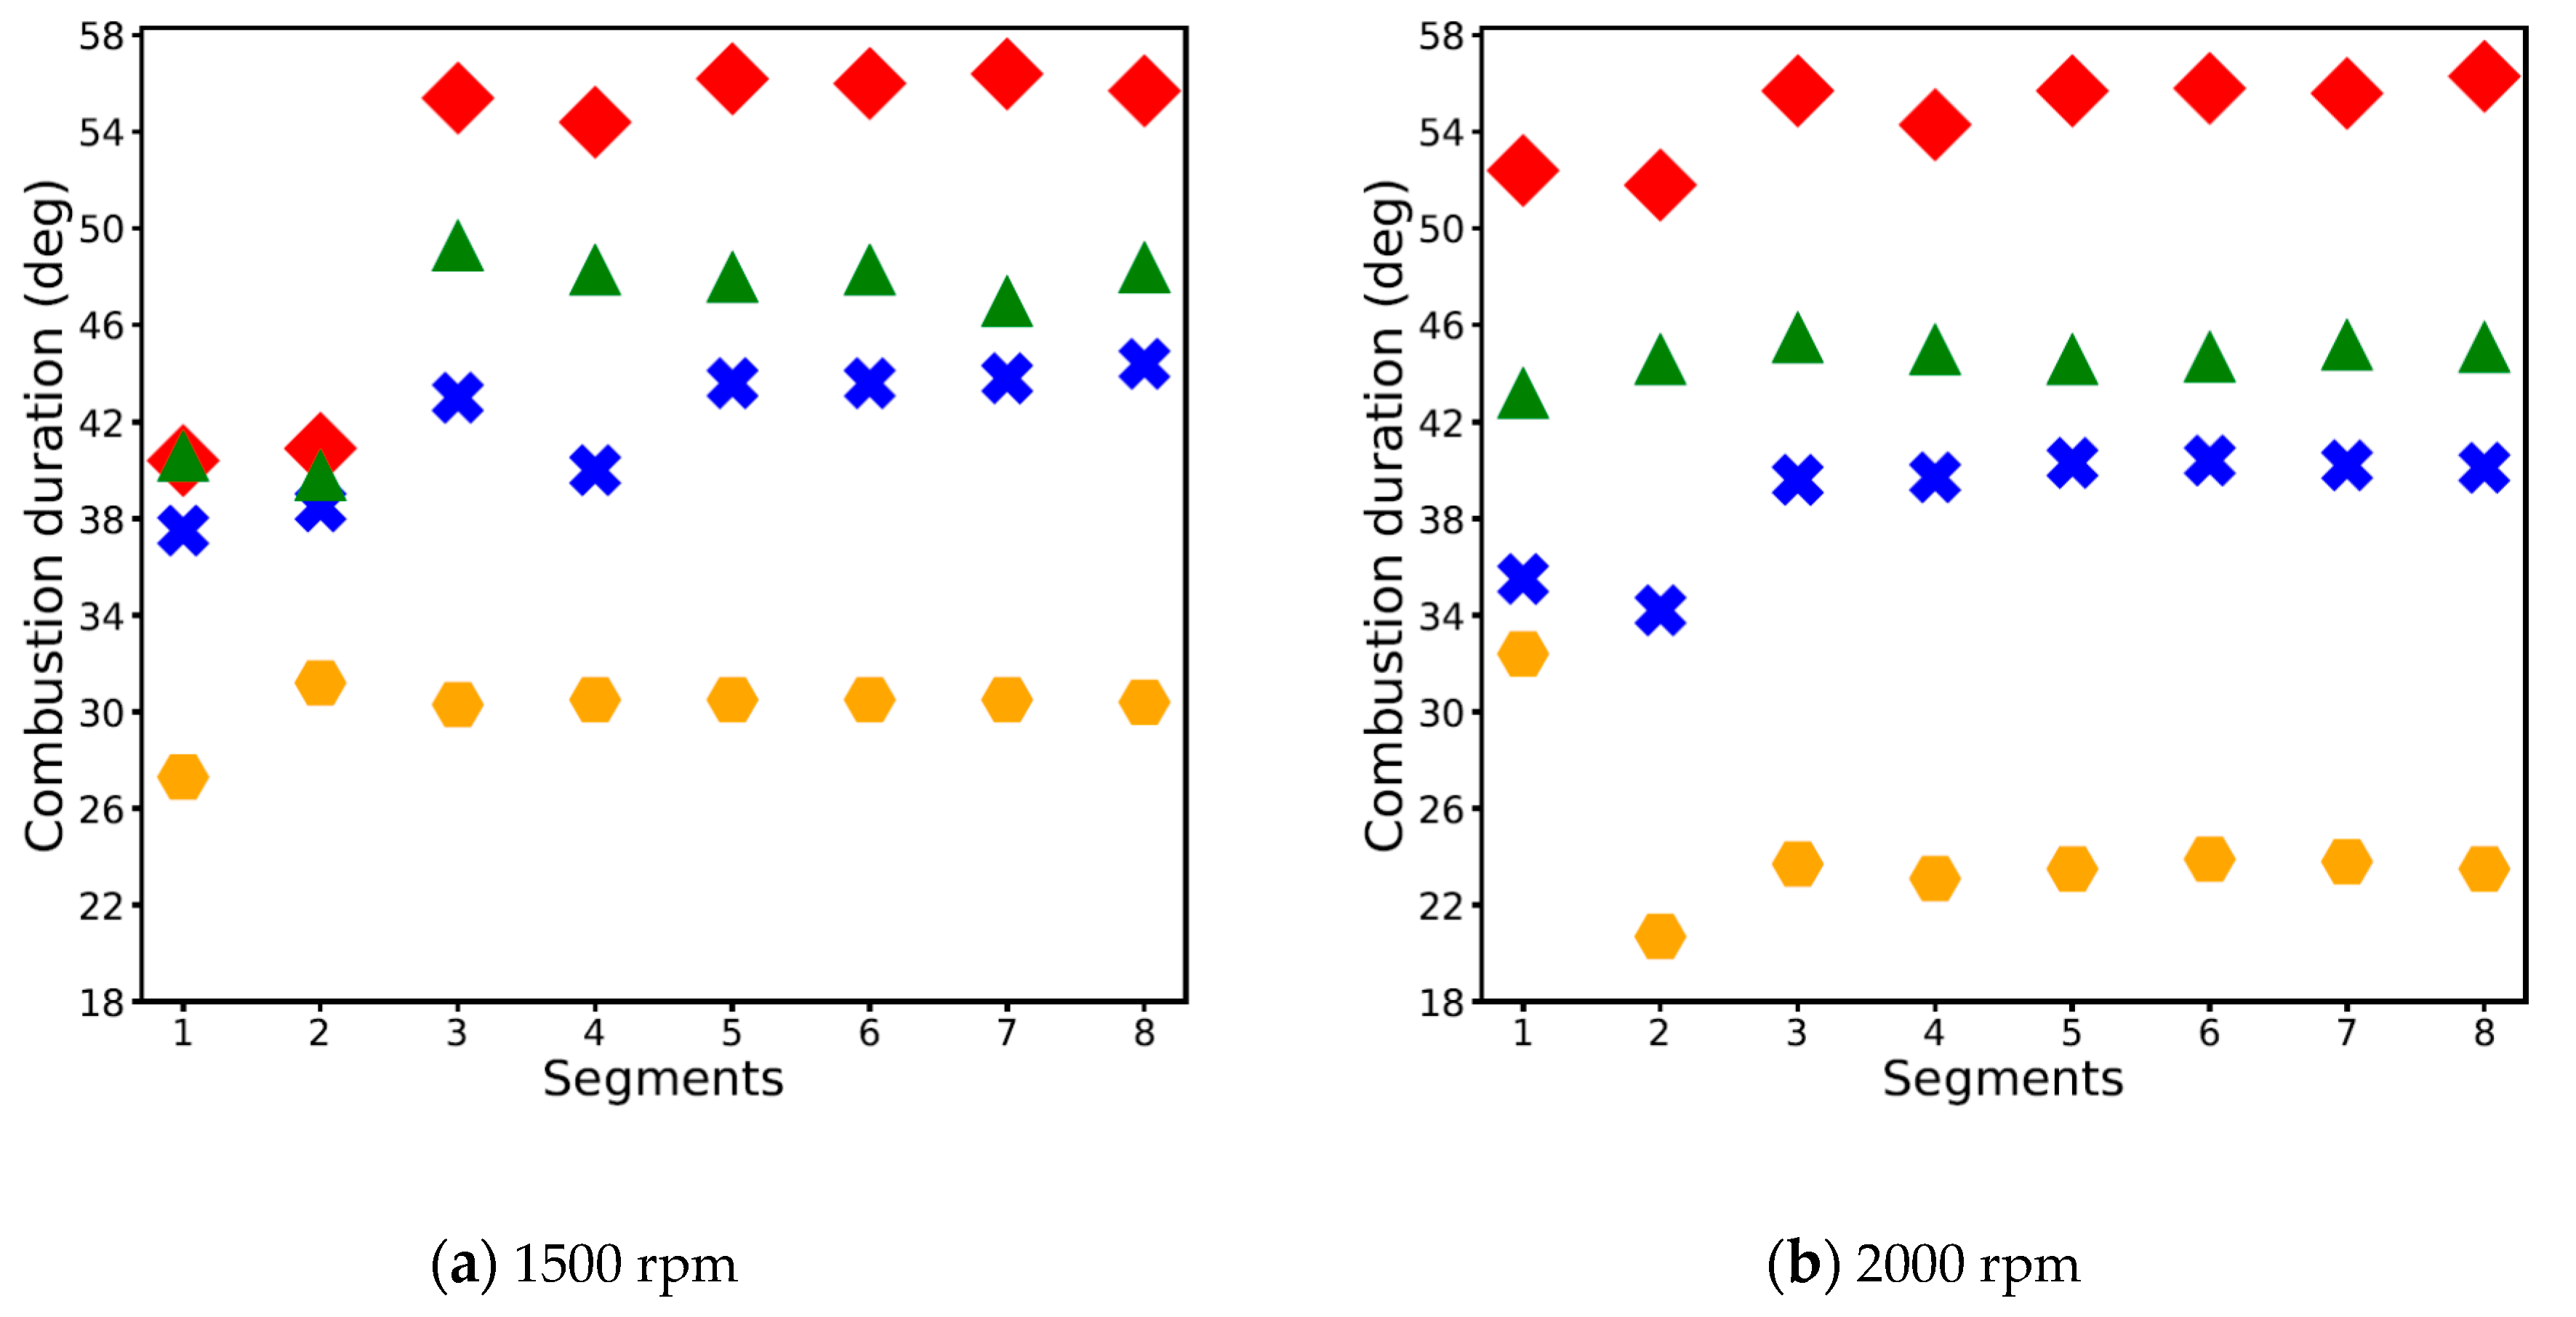
3.6.2. Combustion Duration
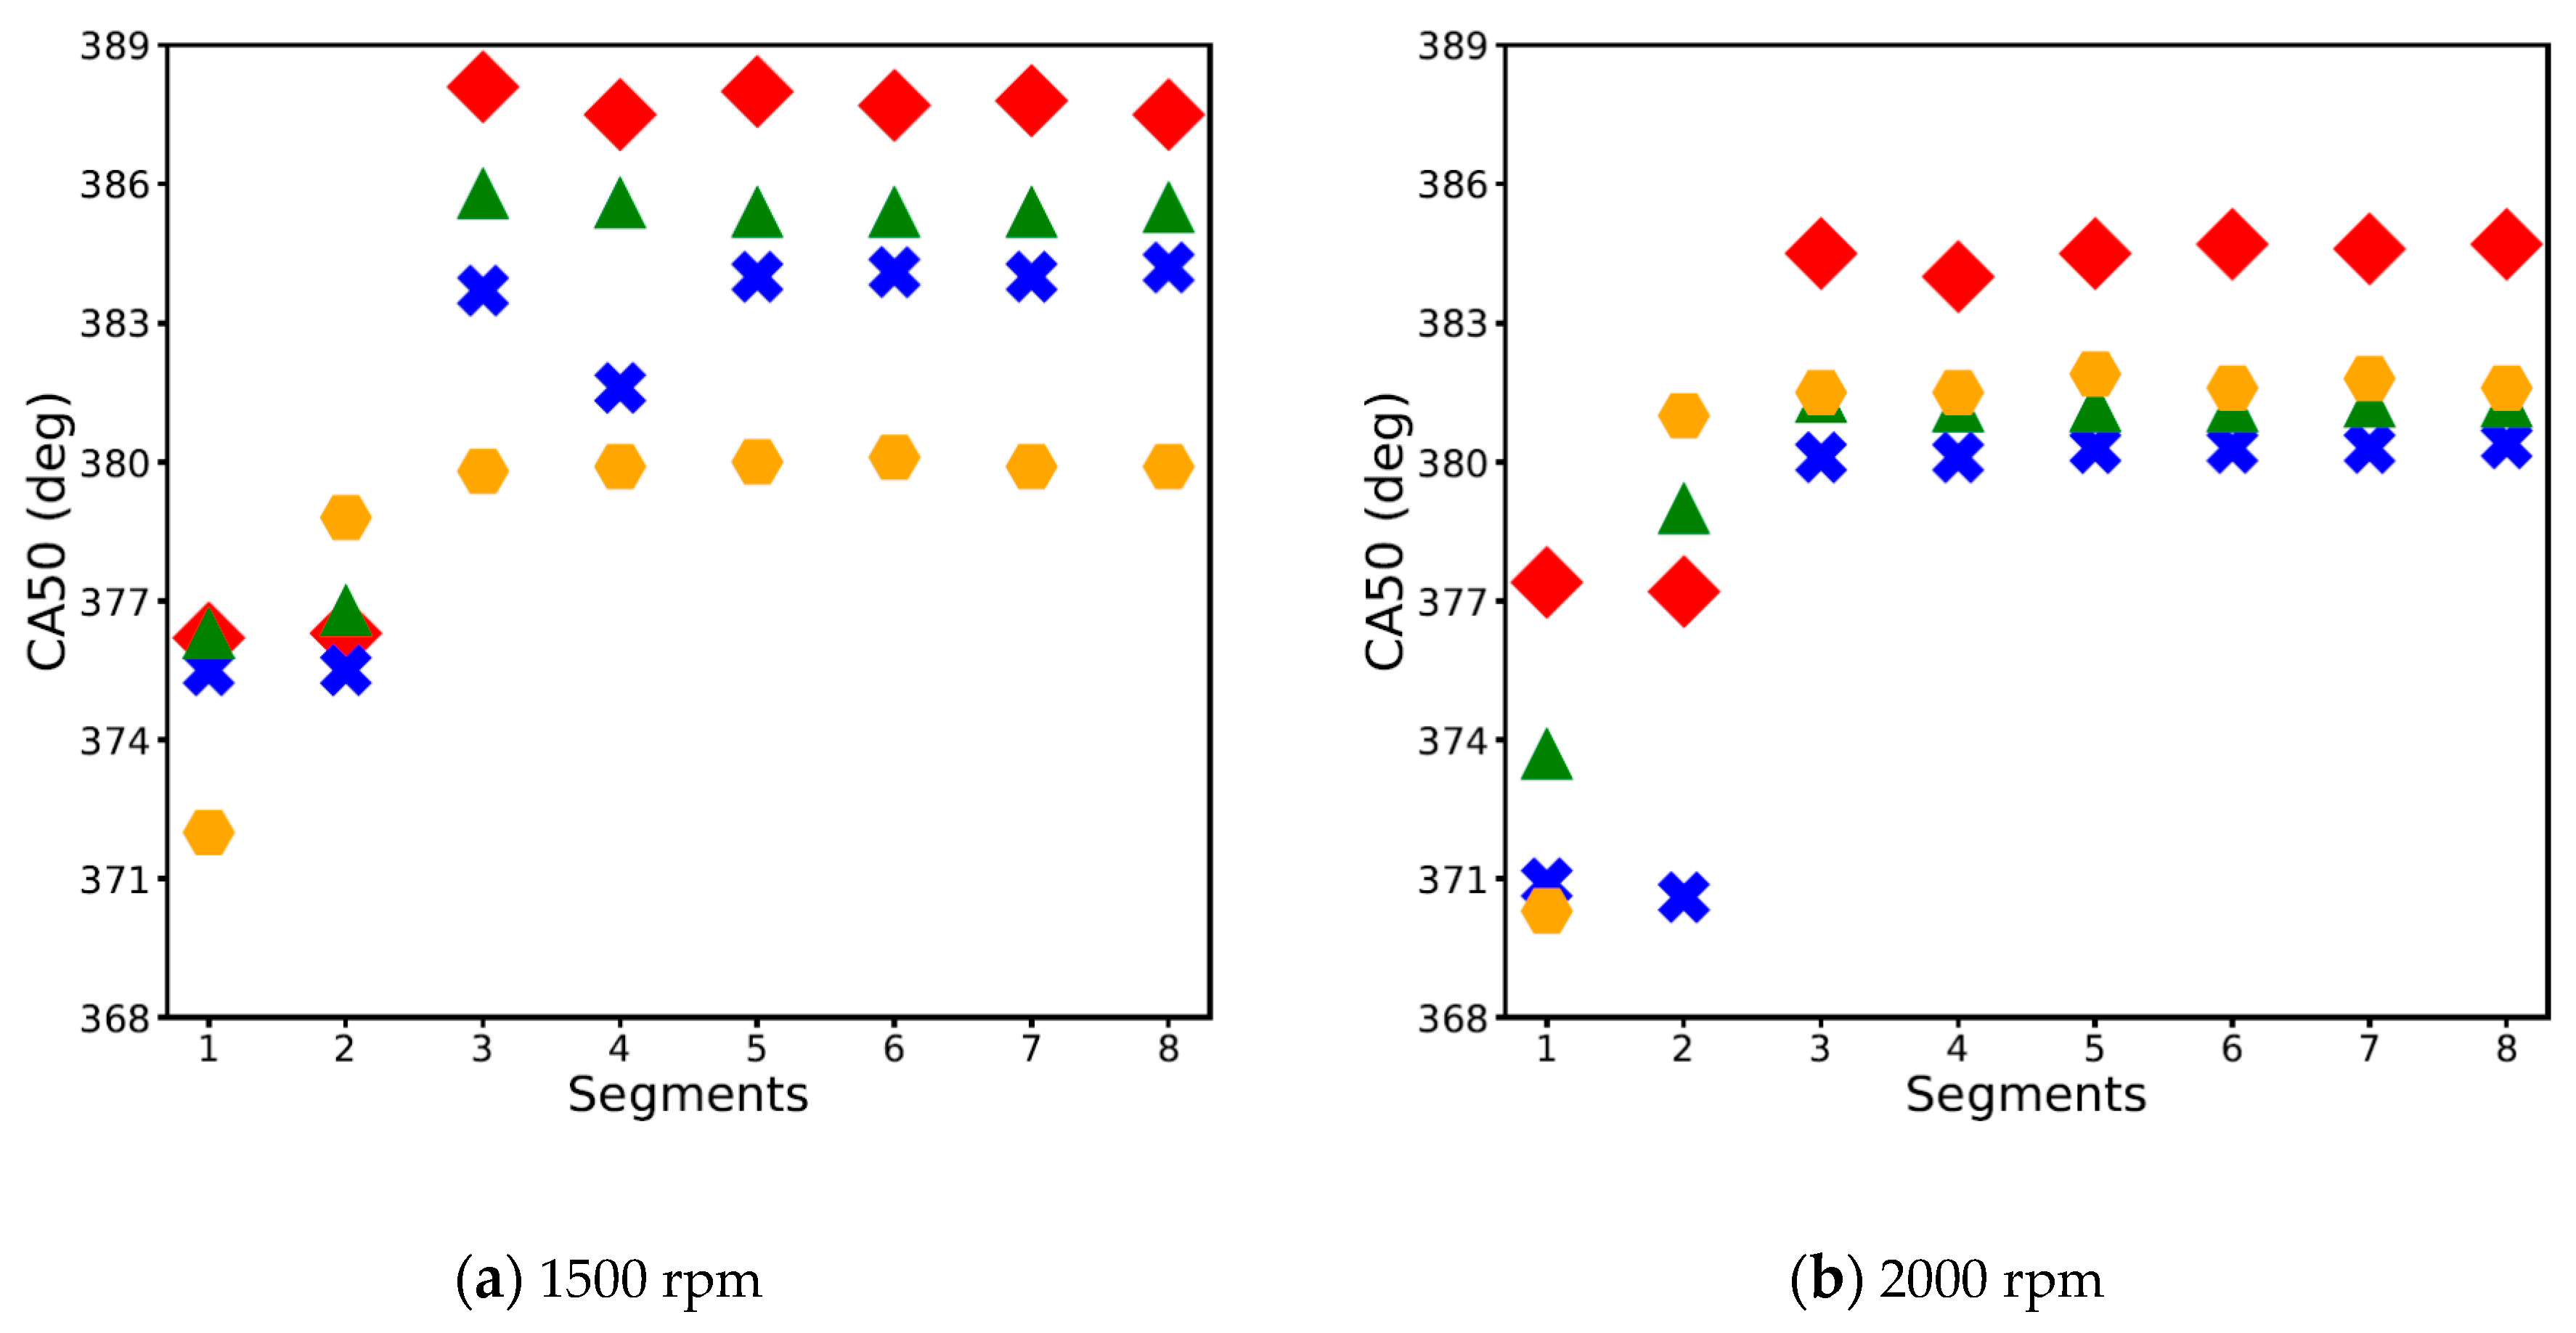
3.6.3. CA50
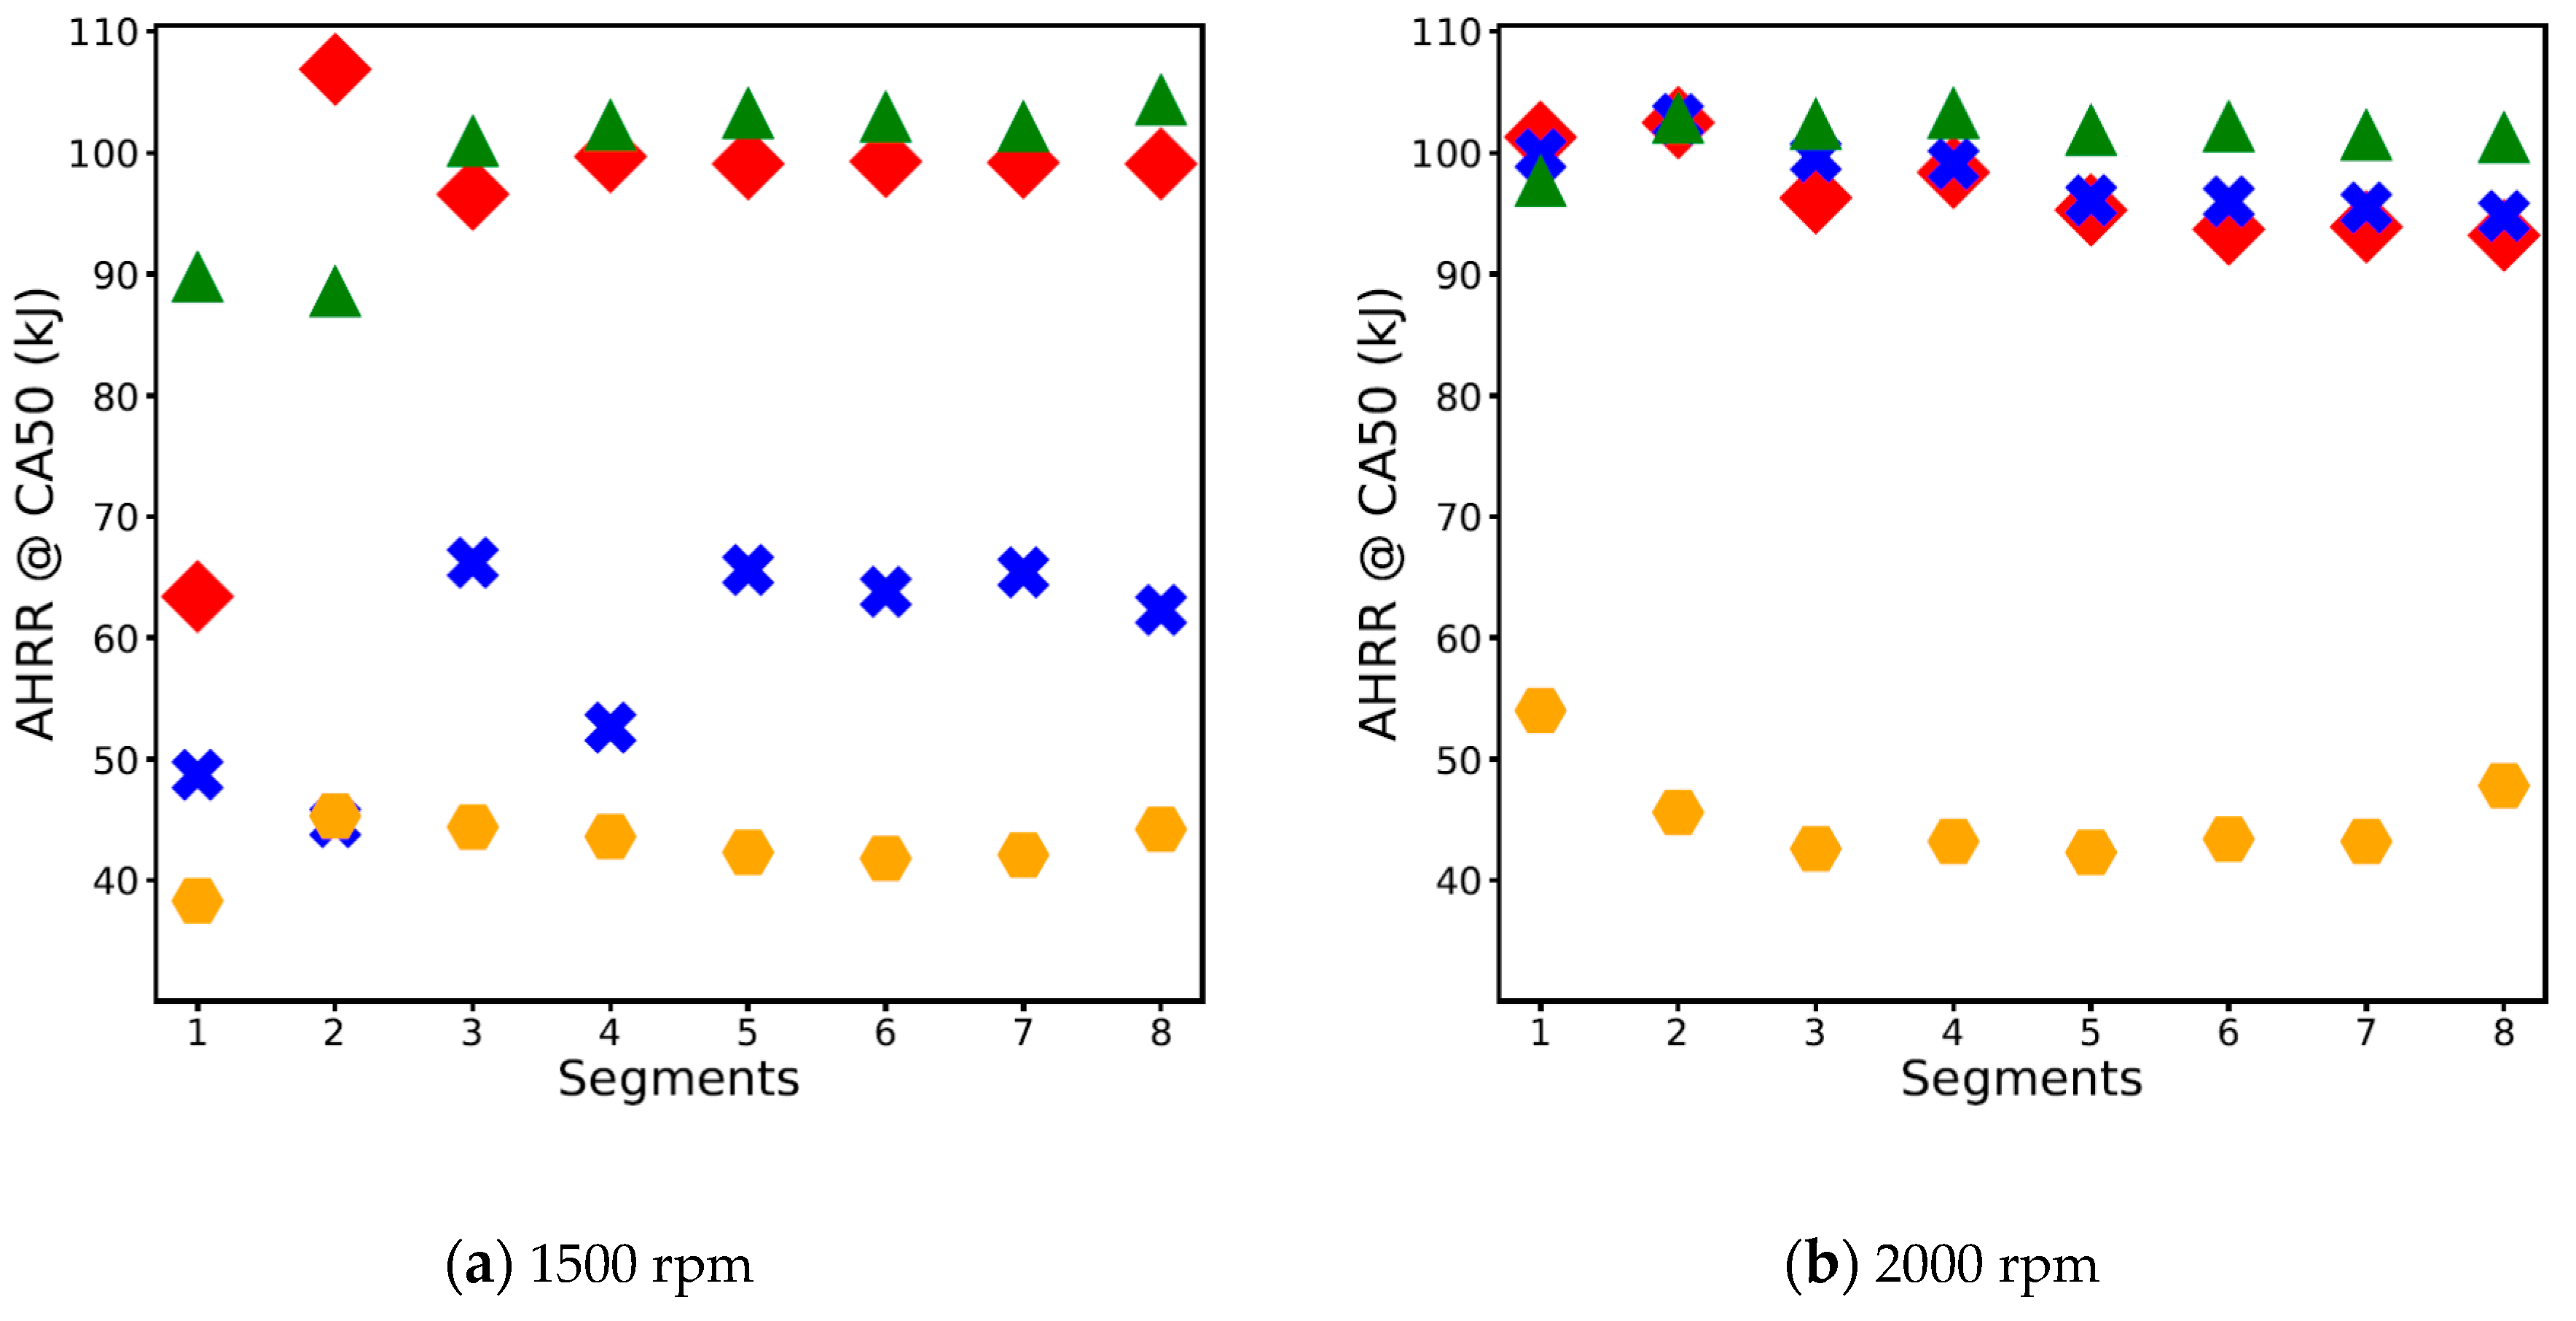
3.6.4. AHRR@CA50
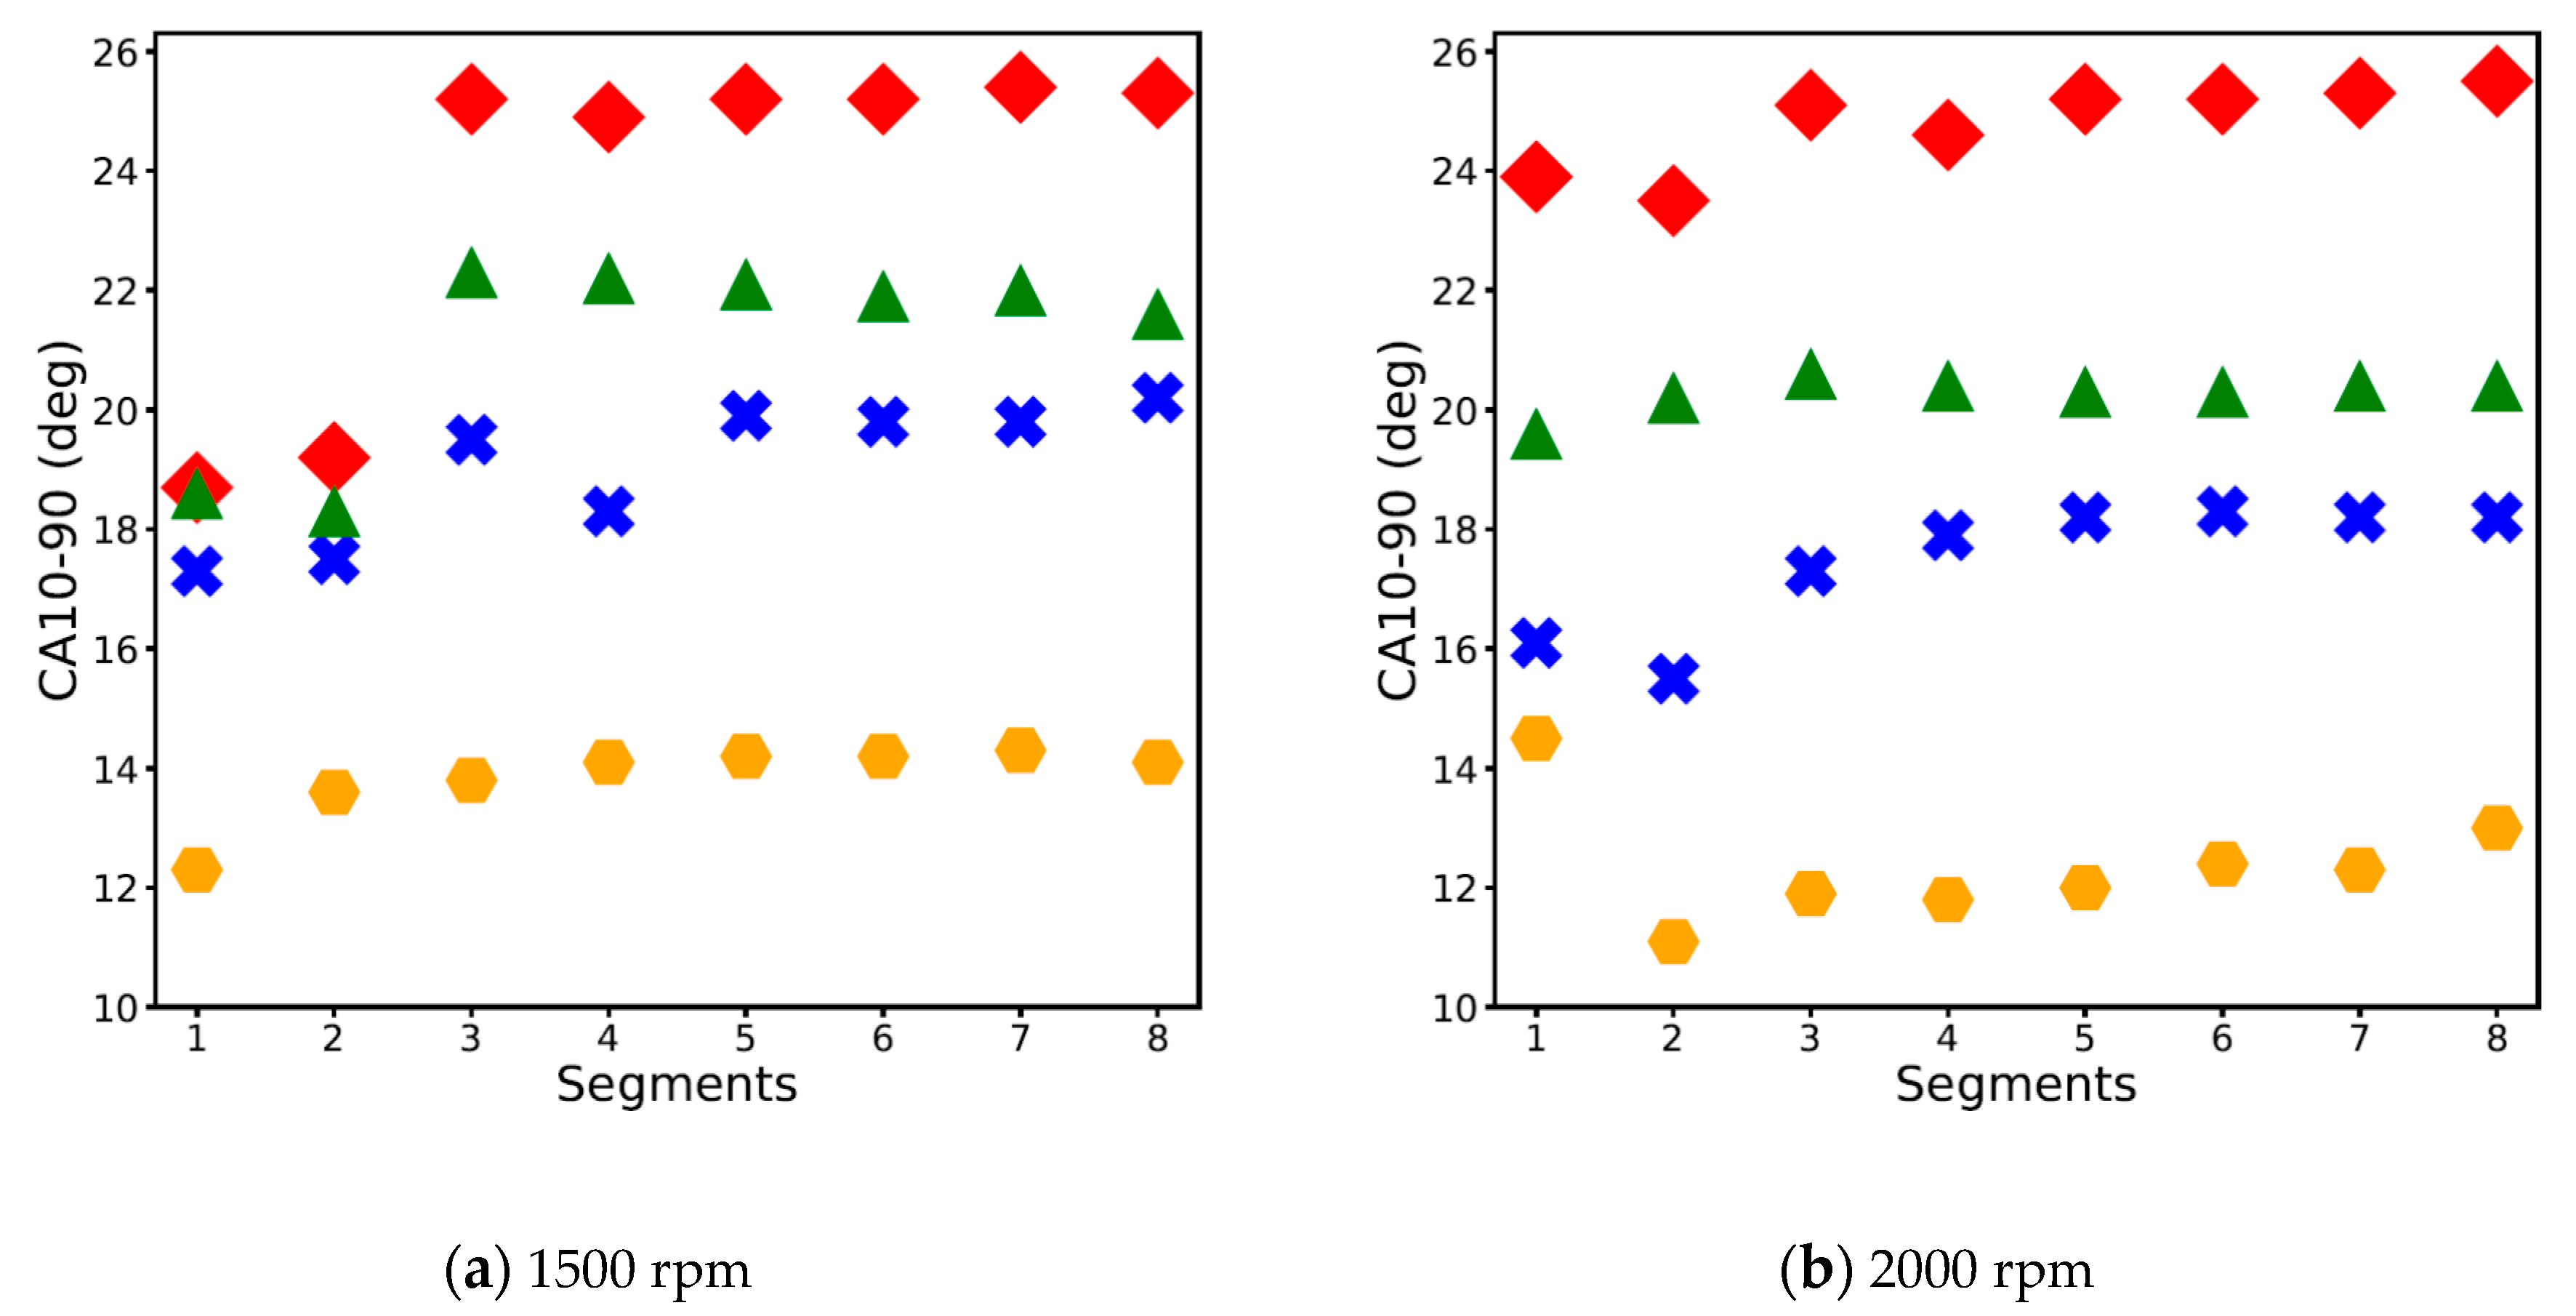
3.6.5. CA10–90
4. Conclusions
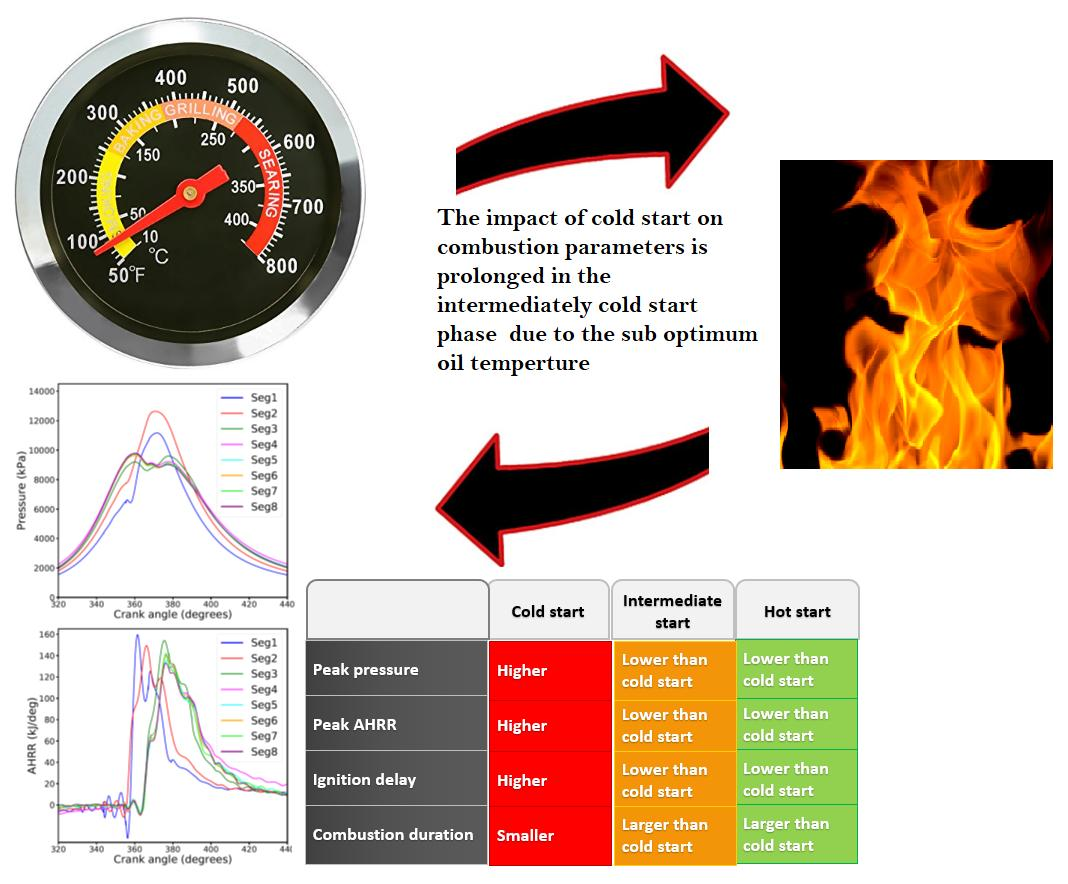
- An advanced injection strategy was followed during the engine cold start period in Stage 1 (Segments 1 and 2), which led to longer ignition delays, shorter combustion durations, higher peak in-cylinder pressure and temperature and higher peak AHRR, consequently leading to a faster warm up.
- The injection strategy was retarded in Stage 2, leading to shorter ignition delays, longer combustion durations, lower peak in-cylinder pressure and temperature and lower peak AHRR.
- A reduction of approximately 25% to 30% and 15% to 20% in the peak pressure and approximately 2% to 5% and ±1% in the peak AHRR was observed when the injection strategy was retarded in Segment 3.
- The combustion parameters were seemed to be more influenced by the injection strategy, rather than the different stages of engine warm up.
- The AHRR@CA50 decreased at 25% load at 2000 rpm due to lower temperatures achieved with retarded injection, and therefore, a decrease in the combustion duration was observed to prevent any potential stalling of the engine.
- The combustion parameters were more stable at 2000 rpm, rather than 1500 rpm, during all stages of engine run.
- The COV of the IMEP values at each load in each segment was approximately less than 1%.
Author Contributions
Funding
Acknowledgments
Conflicts of Interest
References
- Government of Australia. Fossil Fuels—Department of Environment and Energy; Government of Australia: Canberra, Australia, 2017. Available online: https://www.environment.gov.au/system/files/resources/7b9824b8-49cc-4c96-b5d6-f03911e9a01d/files/nggi-quarterly-update-dec-2017-revised.pdf (accessed on 10 February 2020).
- Heywood, J.B. Internal Combustion Engine Fundamentals, International ed.; Automotive Technology Series; McGraw-Hill Book Company: Singapore, 1988; ISBN 9-780070-286375. [Google Scholar]
- Palanisamy, M. Characteristics of Cold Start of a Diesel Engine Using Jp8 and Ulsd Fuels. Master’s Thesis, Wayne State University, Detroit, MI, USA, 2013. [Google Scholar]
- Rakopoulos, C.D.; Giakoumis, E.G. Diesel Engine Transient Operation: Principles of Operation and Simulation Analysis, 1st ed.; Springer: London, UK, 2009; ISBN 978-1-84882-375-4. [Google Scholar]
- Henein, N.A. Autoignition and Combustion in Diesel Engines under Cold Starting Conditions; Report Number ARO 25190.2-EG; Wayne State University Centre for automotive research: Detroit, MI, USA, 1997. [Google Scholar]
- Henein, N.A.; Zahdeh, A.R.; Yassine, M.K.; Bryzik, W. Diesel engine cold starting: Combustion instability. In SAE World Congress; SAE Technical Paper 920005; SAE: Warrendale, PA, USA, 1992. [Google Scholar]
- Stone, R. Introduction to Internal Combustion Engines; Palgrave Springer: London, UK, 1999; Volume 3, ISBN 978-0-333-55084-7. [Google Scholar]
- Giakoumis, E.G.; Rakopoulos, C.D.; Dimaratos, A.M.; Rakopoulos, D.C. Exhaust emissions of diesel engines operating under transient conditions with biodiesel fuel blends. Prog. Energy Combust. 2012, 38, 691–715. [Google Scholar]
- Liu, J.; Dumitrescu, C.E. Single and double Wiebe function combustion model for a heavy-duty diesel engine retrofitted to natural-gas spark-ignition. Appl. Energy 2019, 248, 95–103. [Google Scholar]
- Yeliana, Y.; Cooney, C.; Worm, J.; Michalek, D.; Naber, J. Wiebe function parameter determination for mass fraction burn calculation in an ethanol-gasoline fuelled SI engine. J. KONES 2008, 15, 567–574. [Google Scholar]
- Dhole, A.E.; Yarasu, R.B.; Lata, D.B. Investigations on the combustion duration and ignition delay period of a dual fuel diesel engine with hydrogen and producer gas as secondary fuels. Appl. Therm. Eng. 2016, 107, 524–532. [Google Scholar]
- Ponti, F.; Serra, G.; Siviero, C. A phenomenological combustion model for common rail multi-jet diesel engine. In Proceedings of the ASME 2004 Internal Combustion Engine Division Fall Technical Conference, Long Beach, CA, USA, 24–27 October 2004. [Google Scholar]
- Zhou, L.; Liu, Y.-F.; Wu, C.-B.; Sun, L.; Wang, L.; Zeng, K.; Huang, Z.-H. Effect of the diesel injection timing and the pilot quantity on the combustion characteristics and the fine-particle emissions in a micro-diesel pilot-ignited natural-gas engine. Proc. Inst. Mech. Eng. Part D J. Automob. Eng. 2013, 227, 1142–1152. [Google Scholar]
- European Union Commission Directive. Commission Directive 2012/46/EU Official Journal of the European Union. 2012. Available online: https://eur-lex.europa.eu/LexUriServ/LexUriServ.do?uri=OJ:L:2012:353:0080:0127:EN:PDF (accessed on 24 September 2019).
- Jarrier, J.C.; Champoussin, R.; Gentile, D.Y. Warm-up of a D.I. diesel engine: Experiment and modeling. In SAE World Congress; SAE Technical Paper 2000-01-0299; SAE: Warrendale, PA, USA, 2000. [Google Scholar]
- Giakoumis, E.G.; Dimaratos, A.M.; Rakopoulos, C.D. Experimental study of combustion noise radiation during transient turbocharged diesel engine operation. Energy 2011, 36, 4983–4995. [Google Scholar]
- Bodisco, T.; Brown, R.J. Inter-cycle variability of in-cylinder pressure parameters in an ethanol fumigated common rail diesel engine. Energy 2013, 52, 55–65. [Google Scholar]
- Brunt, M.F.; Pond, C.R. Evaluation of techniques for absolute cylinder pressure correction. In SAE World Congress; SAE Technical Paper 970036; SAE: Warrendale, PA, USA, 1997. [Google Scholar]
- Randolph, A.L. Methods of processing cylinder-pressure transducer signals to maximize data accuracy. In SAE World Congress; SAE Technical Paper 900170; SAE: Warrendale, PA, USA, 1999. [Google Scholar]
- Lodi, F.; Zare, A.; Arora, P.; Stevanovic, S.; Jafari, M.; Ristovski, Z.; Brown, R.J.; Bodisco, T. Engine Performance and Emissions Analysis in a Cold, Intermediate and Hot Start Diesel Engine. Appl. Sci. 2020, 10, 3839. [Google Scholar]
- Zare, A.; Bodisco, T.A.; Nabi, M.N.; Hossain, F.M.; Ristovski, Z.D.; Brown, R.J. A comparative investigation into cold-start and hot-start operation of diesel engine performance with oxygenated fuels during transient and steady-state operation. Fuel 2018, 228, 390–404. [Google Scholar]
- Srinivasan, K.K.; Krishnan, S.R.; Midkiff, K.C. Improving low load combustion, stability, and emissions in pilot-ignited natural gas engines. Proc. Inst. Mech. Eng. Part D J. Automob. Eng. 2006, 220, 229–239. [Google Scholar]
- Bulatović, Ž.; Knežević, D.; Milić, M. Practical research of the angle of thermodynamic losses when indicating pressure in the cylinder diesel engine. Sci. Tech. Rev. 2015, 65, 46–54. [Google Scholar]
- Pipitone, E.; Beccari, A.; Beccari, S. The experimental validation of a new thermodynamic method for TDC determination. In SAE World Congress; SAE Technical Paper 2007-01-0052; SAE: Warrendale, PA, USA, 2007. [Google Scholar]
- Lodi, F.; Jafari, M.; Brown, R.; Bodisco, T. Statistical Analysis of the Results Obtained by Thermodynamic Methods for the Determination of TDC Offset in an Internal Combustion Engine. In SAE World Congress; SAE Technical Paper 2020-01-1350; SAE: Warrendale, PA, USA, 2020. [Google Scholar]
- Lodi, F.; Bodisco, T.; Surawski, N.; Brown, R.; Yousef, Y. Modelling the effects of ethanol fumigation on engine performance and emissions in a six-cylinder, common rail diesel engine. In Proceedings of the 11th Asia-Pacific Conference on Combustion, ASPACC, Sydney, Australia, 10–14 December 2017; The Combustion Institute: Sydney, Australia, 2017. [Google Scholar]
- Bodisco, T.; Low Choy, S.; Brown, R.J. A Bayesian approach to the determination of ignition delay. Appl. Therm. Eng. 2013, 60, 79–87. [Google Scholar]
- Bodisco, T.; Tröndle, P.; Brown, R.J. Inter-cycle variability of ignition delay in an ethanol fumigated common rail diesel engine. Energy 2015, 84, 186–195. [Google Scholar]
- Hara, H.; Itoh, Y.; Henein, N.A.; Bryzik, W. Effect of cetane number with and without additive on cold startability and white smoke emissions in a diesel engine. In SAE World Congress; SAE Technical Paper 1999-01-1476; SAE: Warrendale, PA, USA, 1999. [Google Scholar]
- Mendera, K.Z.; Spyra, A.; Smereka, M. Mass fraction burned analysis. J. KONES Int. Combust. Eng. 2002, 3, 193–201. [Google Scholar]
- Aklouche, F.Z.; Loubar, K.B.A.; Awad, S.T.M. Experimental investigation of the equivalence ratio influence on combustion, performance and exhaust emissions of a dual fuel diesel engine operating on synthetic biogas fuel. Energy Convers. Manag. 2017, 152, 291–299. [Google Scholar]
- Yusri, I.M.; Mamat, R.; Akasyah, M.K.; Jamlos, M.F.; Yusop, A.F. Evaluation of engine combustion and exhaust emissions characteristics using diesel/butanol blended fuel. Appl. Therm. Eng. 2019, 156, 209–219. [Google Scholar]


| Model | Cummins ISBe220 31 |
|---|---|
| Cylinders | 6 in-line |
| Capacity | 5.9 l |
| Fuel injection | High pressure common rail |
| Compression ratio | 17.3:1 |
| Maximum power (kW) | 162 kW @ 2000 rpm |
| Maximum torque (Nm) | 820 Nm @ 1500 rpm |
| Aspiration | Turbocharged |
| Bore × stroke (mm × mm) | 102 × 120 |
| Connecting rod (mm) | 220 |
| Emissions standard | Euro III |
© 2020 by the authors. Licensee MDPI, Basel, Switzerland. This article is an open access article distributed under the terms and conditions of the Creative Commons Attribution (CC BY) license (http://creativecommons.org/licenses/by/4.0/).
Share and Cite
Lodi, F.; Zare, A.; Arora, P.; Stevanovic, S.; Jafari, M.; Ristovski, Z.; Brown, R.J.; Bodisco, T. Combustion Analysis of a Diesel Engine during Warm up at Different Coolant and Lubricating Oil Temperatures. Energies 2020, 13, 3931. https://doi.org/10.3390/en13153931
Lodi F, Zare A, Arora P, Stevanovic S, Jafari M, Ristovski Z, Brown RJ, Bodisco T. Combustion Analysis of a Diesel Engine during Warm up at Different Coolant and Lubricating Oil Temperatures. Energies. 2020; 13(15):3931. https://doi.org/10.3390/en13153931
Chicago/Turabian StyleLodi, Faisal, Ali Zare, Priyanka Arora, Svetlana Stevanovic, Mohammad Jafari, Zoran Ristovski, Richard J. Brown, and Timothy Bodisco. 2020. "Combustion Analysis of a Diesel Engine during Warm up at Different Coolant and Lubricating Oil Temperatures" Energies 13, no. 15: 3931. https://doi.org/10.3390/en13153931
APA StyleLodi, F., Zare, A., Arora, P., Stevanovic, S., Jafari, M., Ristovski, Z., Brown, R. J., & Bodisco, T. (2020). Combustion Analysis of a Diesel Engine during Warm up at Different Coolant and Lubricating Oil Temperatures. Energies, 13(15), 3931. https://doi.org/10.3390/en13153931