U.S. Greenhouse Gas Emission Bottlenecks: Prioritization of Targets for Climate Liability


Abstract
1. Introduction
2. Materials and Methods
2.1. Methodology for Computing Point-Source CO2 Emissions
- (1)
- GHG emitters were catalogued as one of eight sub-classes divided both by fossil fuel source (coal, oil—petroleum and natural gas) and lifecycle entity (extraction, transport, end use/product sale) as shown in Table 1.
- (2)
- The FLIGHT database [46] was filtered to isolate fuel type and to identify entities producing the highest level of CO2 emissions, delimiting the data to the ten largest facilities per sub-class. Of the eight sub-classes, point-source data for six sub-classes were explicitly available through the FLIGHT tool. Coal extraction and oil transport point-source emissions data are not provided. The values for these processes are dwarfed by the emissions from burning the fossil fuels and are thus considered negligible and not included here.
- (3)
- Checked top emitting facilities on their public website, identified headquarter location, and confirmed magnitude of enterprise.
2.2. Methodology for Computing CO2 Emission Bottlenecks
- (1)
- GHG emitters were catalogued as one of eight sub-classes divided both by fossil fuel source (coal, oil-petroleum and natural gas) and lifecycle entity (extraction, transport, end use/product sale) as shown in Table 1.
- (2)
- The FLIGHT database [46] was filtered to isolate fuel type and to identify entities producing the highest level of CO2 emissions, delimiting the data to the 10 largest facilities per sub-class. In order to explicitly report resource throughput for each facility for calculation of bottleneck potential:
- (a)
- Coal extraction data were derived from the EIA Coal Data Browser [47].
- (b)
- Oil and natural gas wells annual production values were derived from the GHG Summary Report provided for each top-emitting facility through the FLIGHT tool [46].
- (c)
- (d)
- Natural gas pipeline capacity and power plant data were derived from the GHG Summary Report provided for each top-emitting facility through the FLIGHT tool [46].
- (3)
- The EPA GHG Equivalencies Calculator was used to calculate bottleneck emissions per facility, deriving potential annual CO2 emissions based on conversion from resource capacity. Considering that the resource capacity of power plant facilities (coal and natural gas) inherently reflect its emitting capacity, bottleneck emissions are assumed to be equivalent to point-source emissions for these two end-uses.
- (a)
- Point-source CO2 emission data per facility is provided directly by the FLIGHT tool [46].
- (4)
- Top emitting facilities were confirmed using information on their public website, identified headquarter location, and confirmed magnitude of enterprise.
3. Results
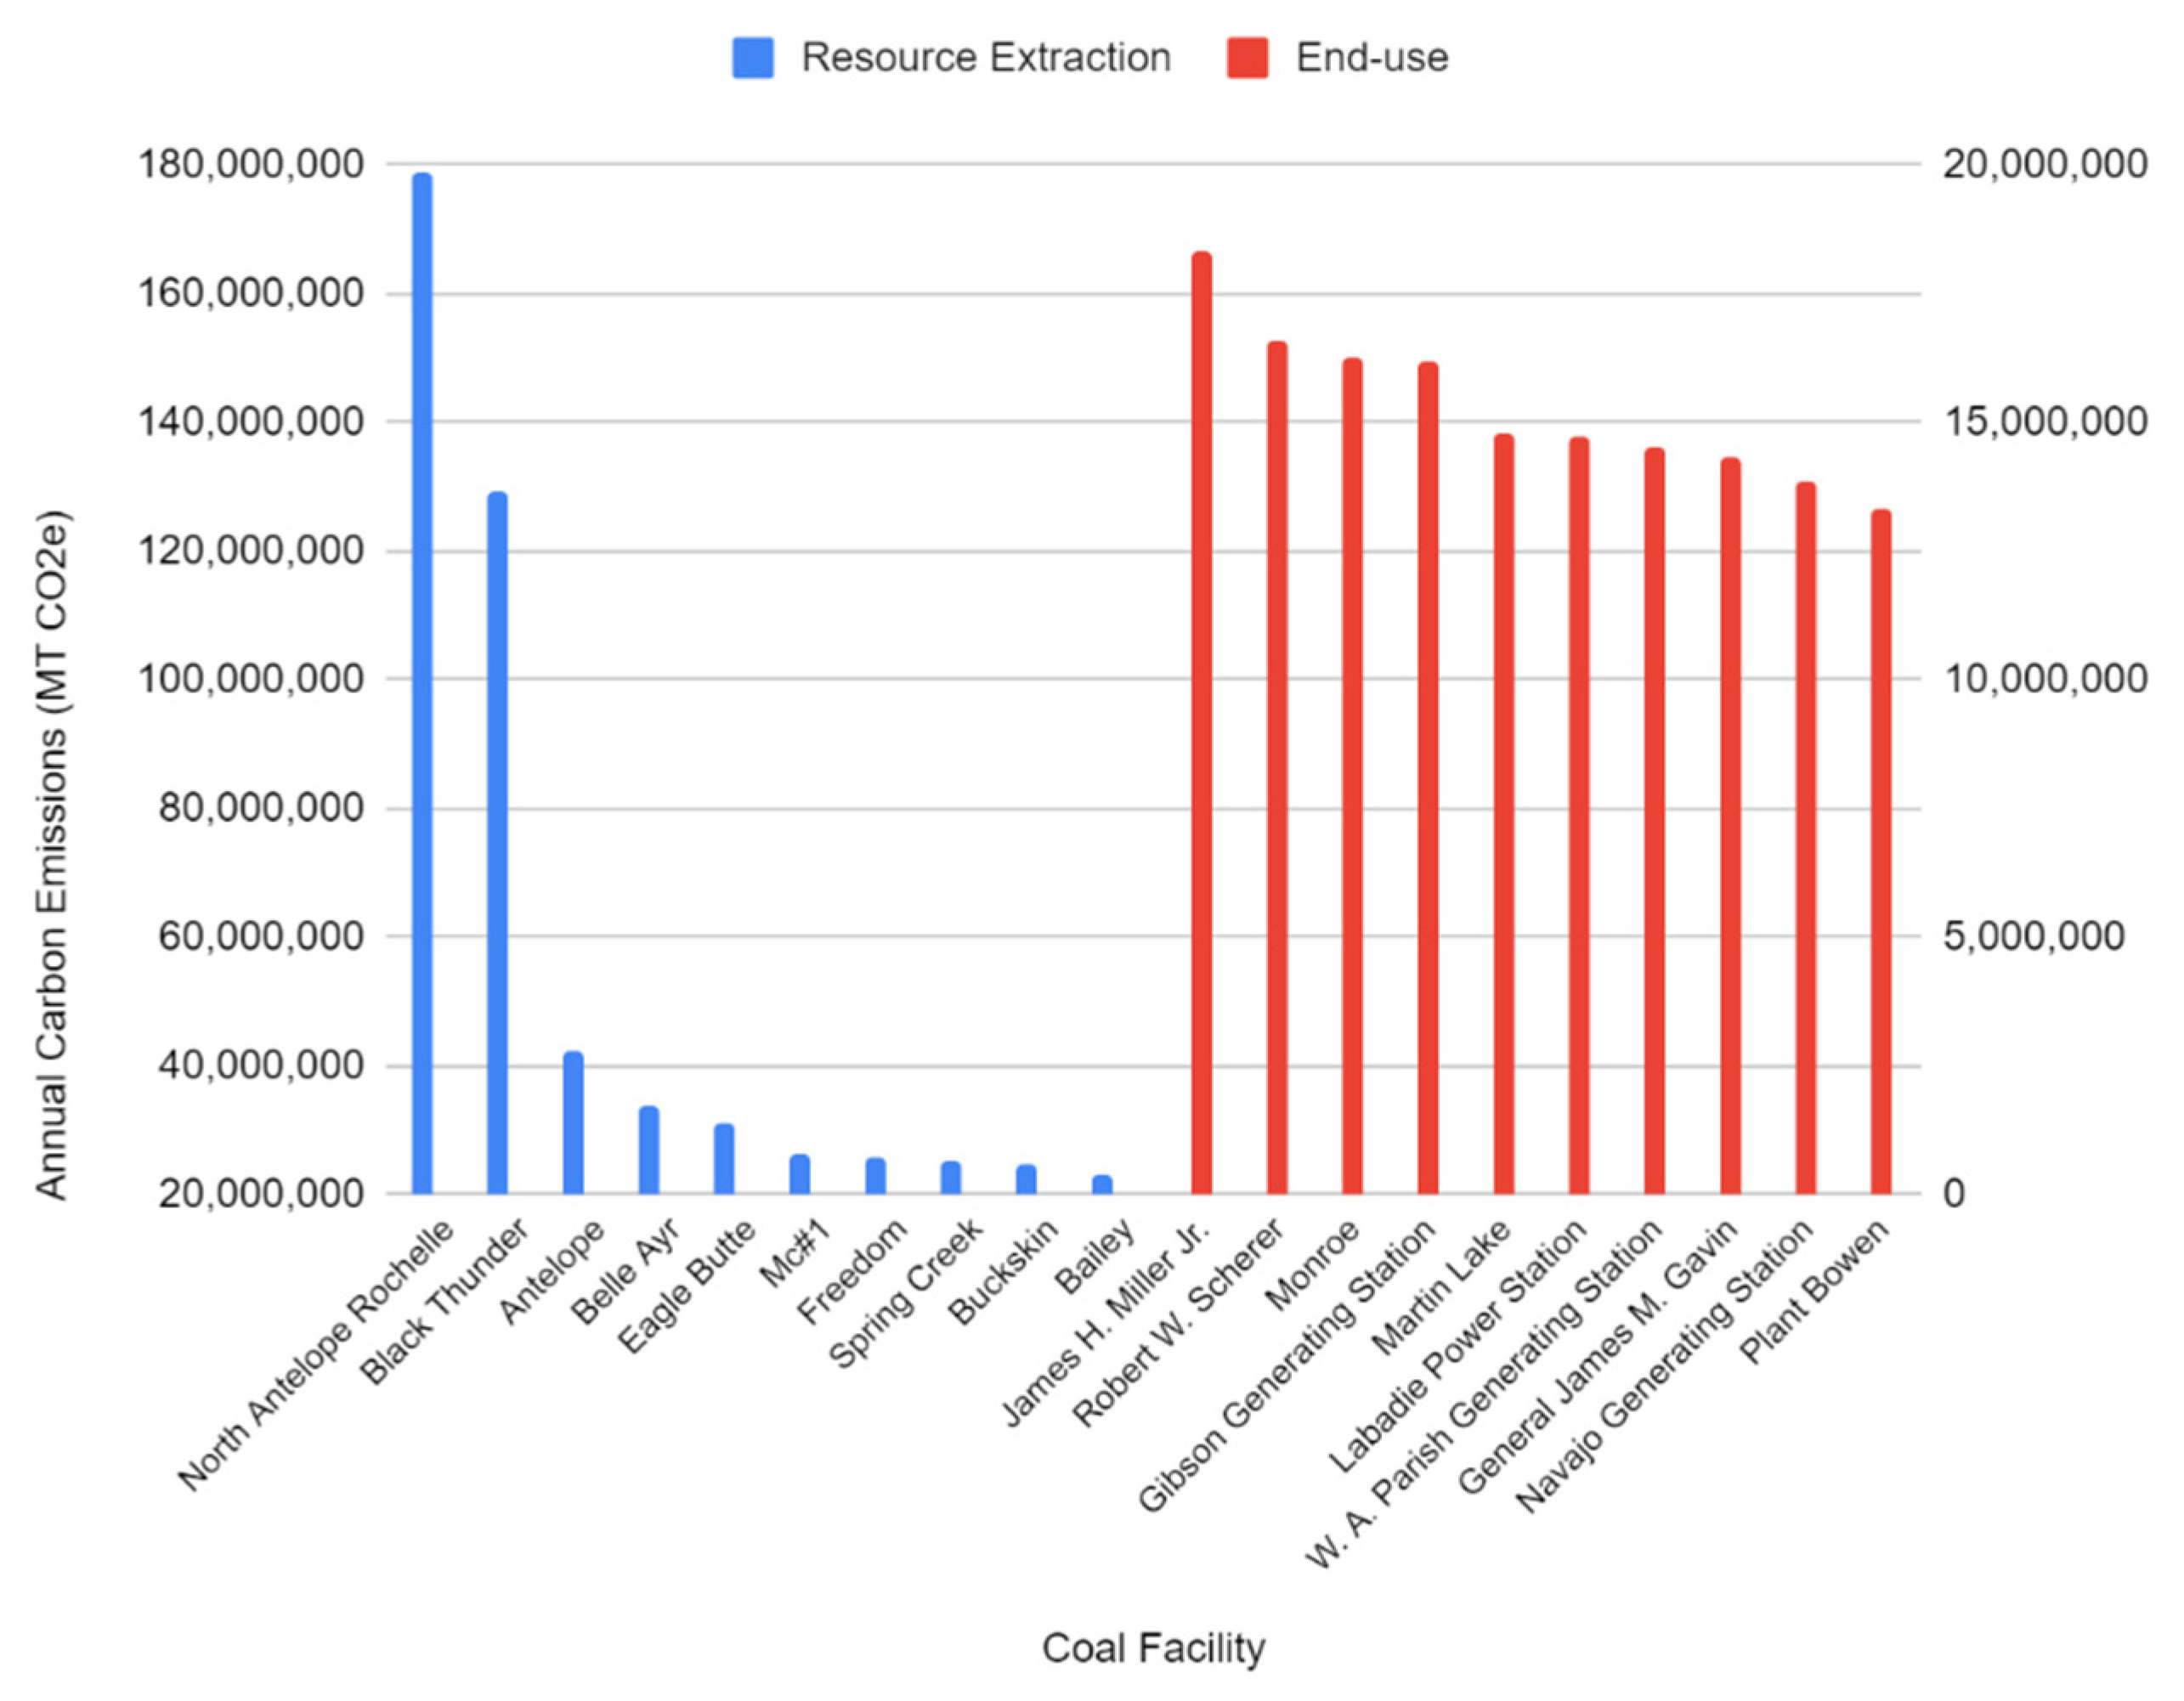
3.1. Point-Source Carbon Emissions
3.2. CO2 Emission Bottlenecks
4. Discussion
4.1. Natural Gas & Oil Transportation as CO2 Emission Bottlenecks-The Challenge of Liability
4.2. Insurance as Risk-Management for Fossil-Fuel Pipelines
4.3. Insurance and Investment Risks of the Major Pollution Bottlenecks: Oil and Gas Pipelines
4.4. Future Work
5. Conclusions
Author Contributions
Funding
Conflicts of Interest
Appendix A
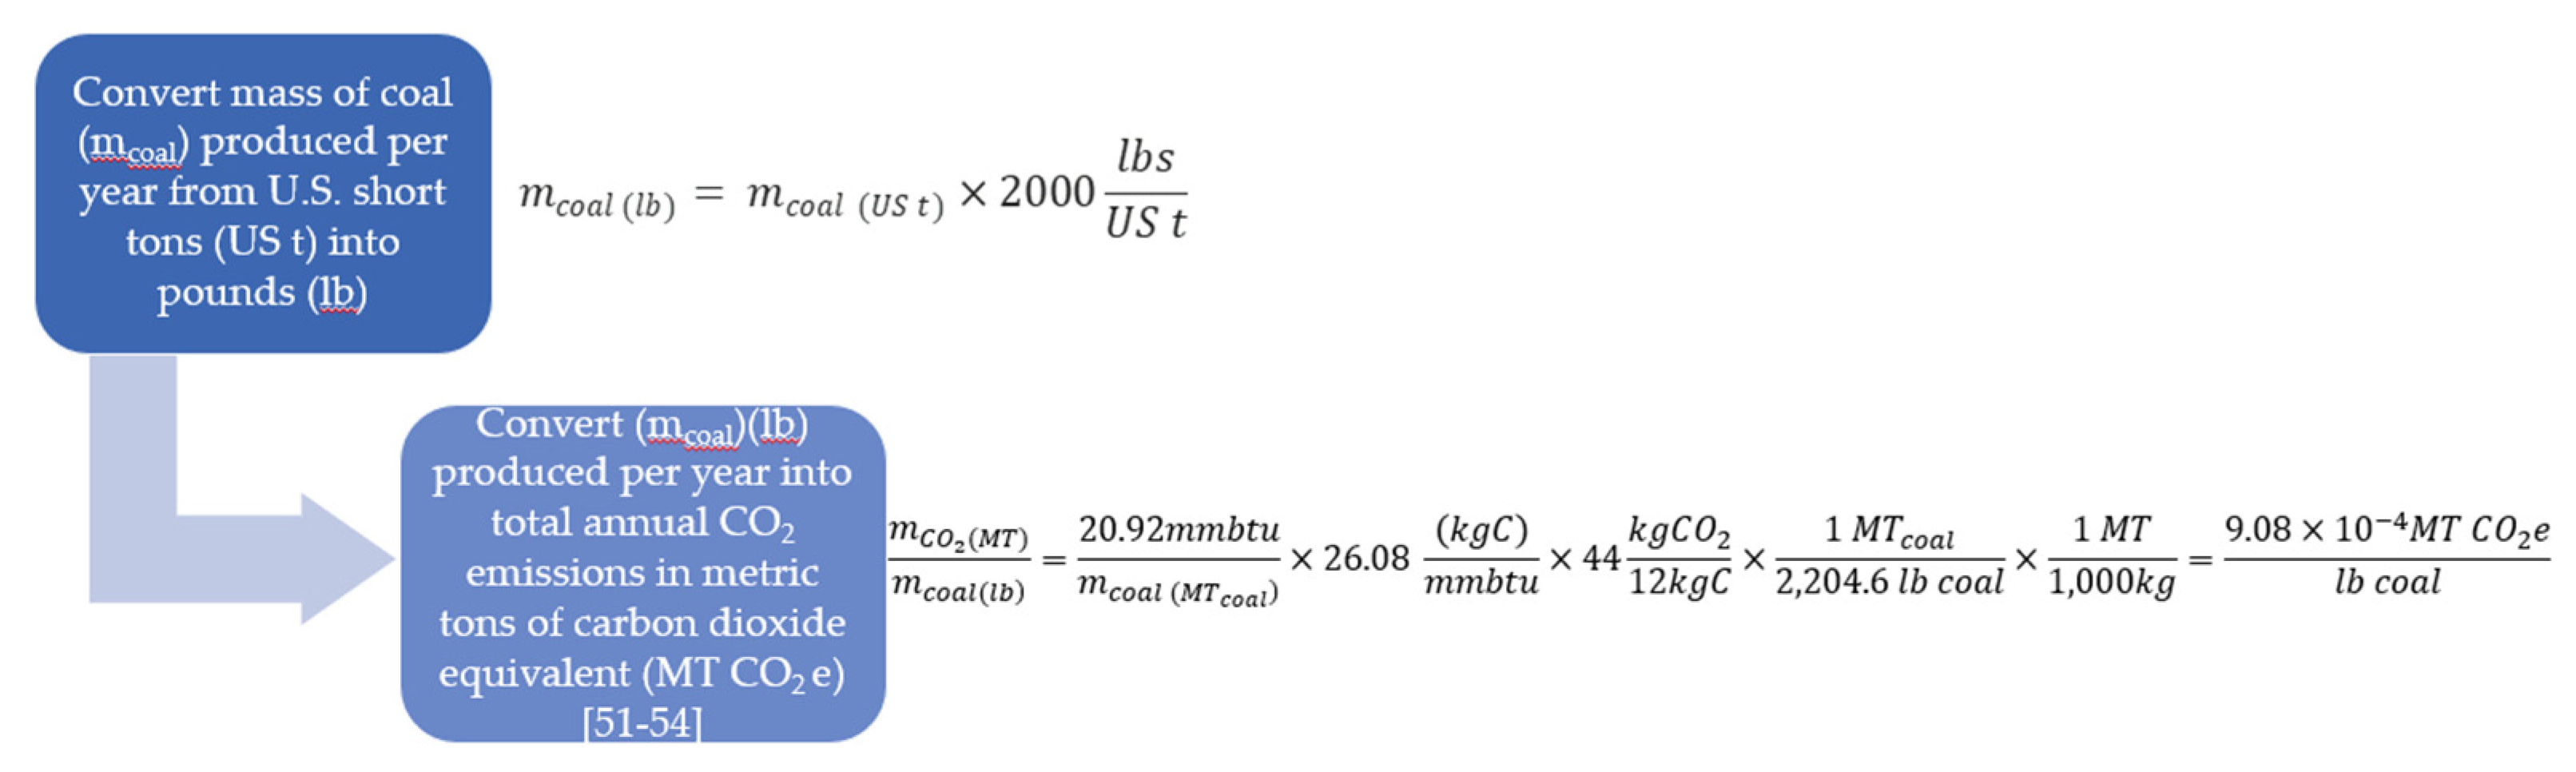
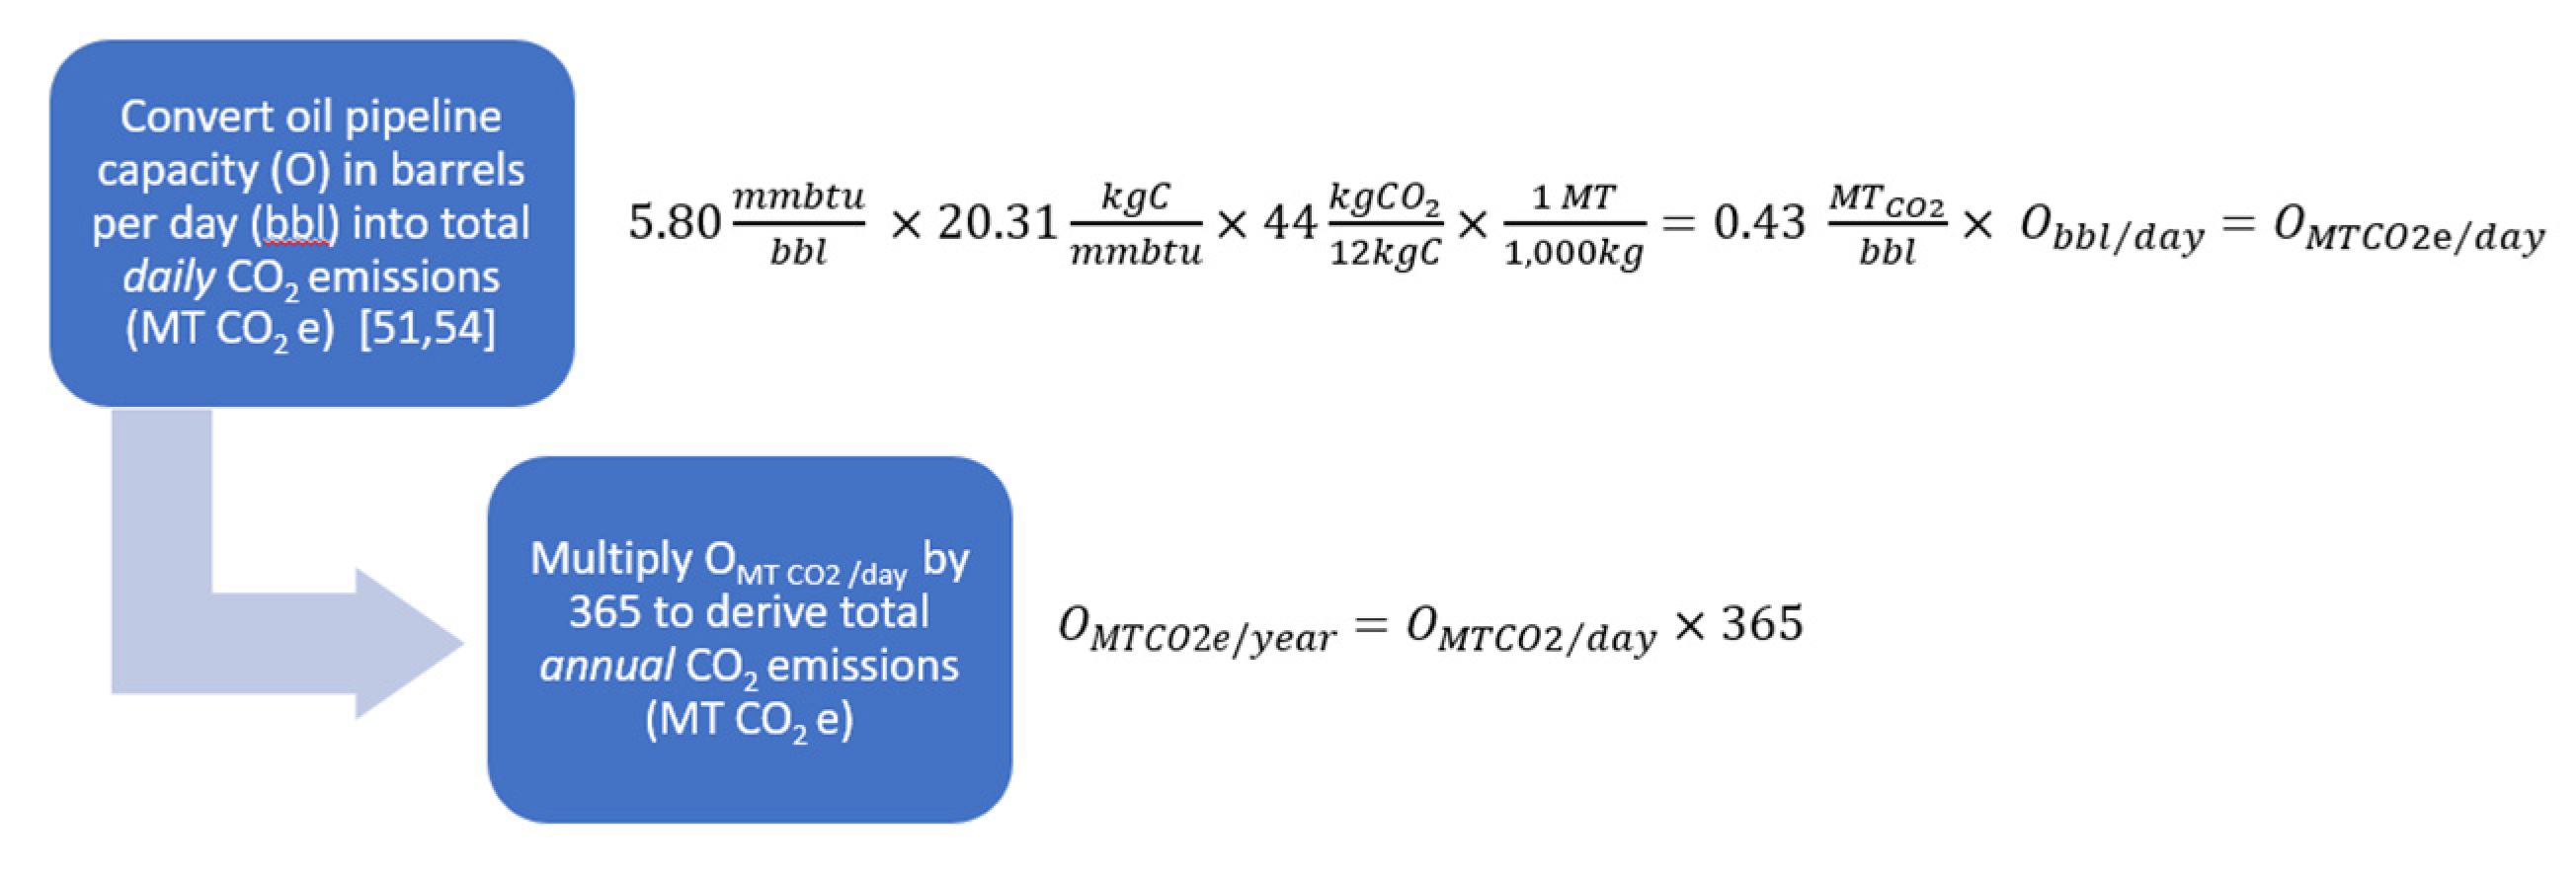
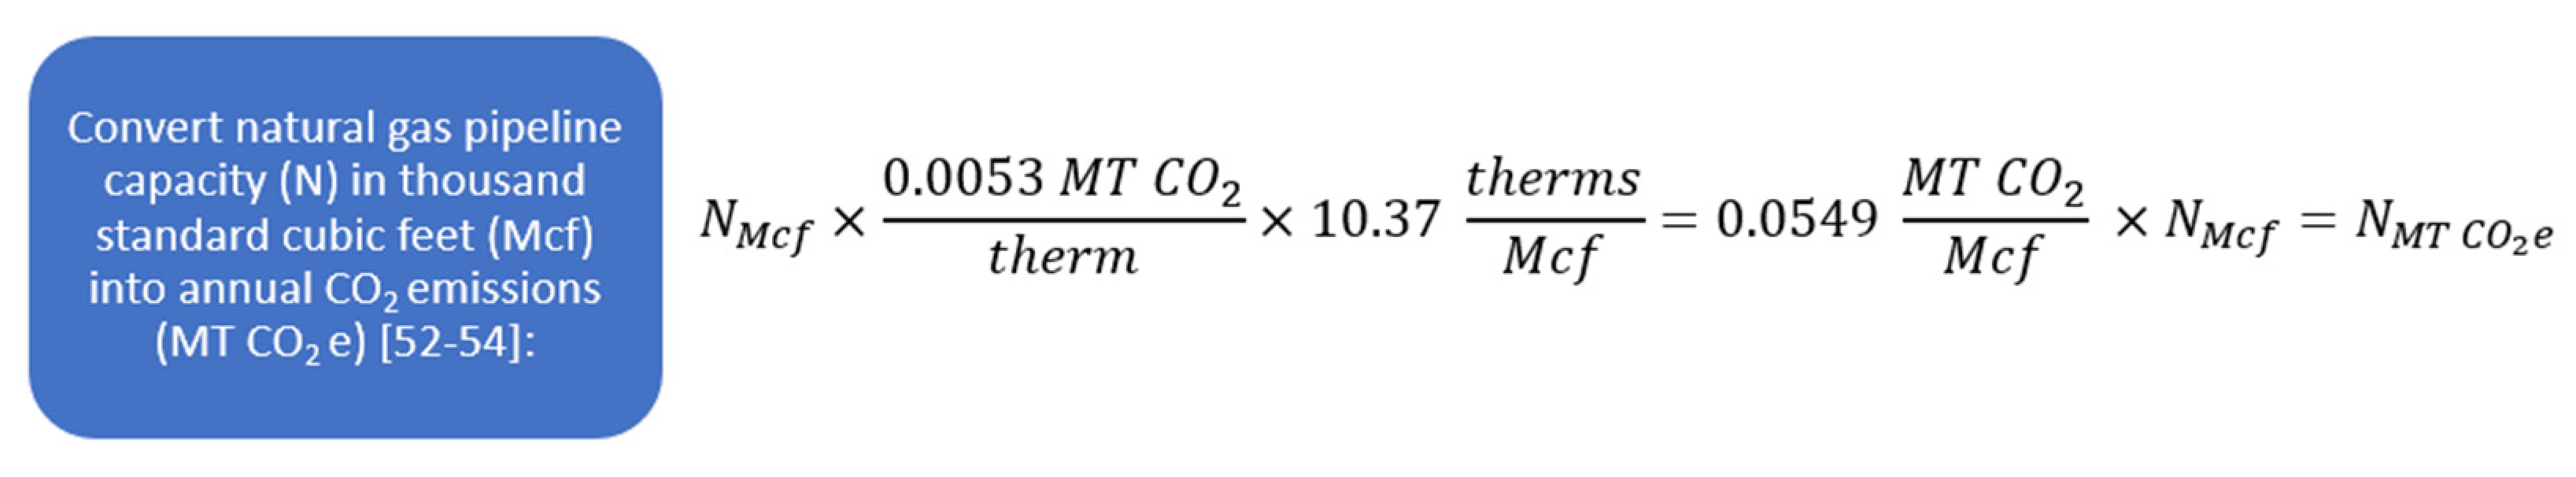
Appendix A.1. Methodology and Equations Employed to Calculate Total Annual CO2 Emissions in Metric Tons of Carbon Dioxide Equivalent (MT CO2 e)
Appendix A.2. Tables of Emission Results

| Type of Entity | Facility | Annual CO2 Emissions (MT CO2 e) |
|---|---|---|
| Resource Extraction | North Antelope Rochelle Mine (Peabody Energy) | 178,541,482 |
| Black Thunder Mine (Arch Coal Inc.) | 129,180,444 | |
| Antelope Coal Mine (Cloud Peak Energy) | 42,050,826 | |
| Belle Ayr Mine (Blackjewel LLC) | 33,536,807 | |
| Eagle Butte Mine (Blackjewel LLC) | 30,973,326 | |
| Mc#1 Mine (Mach Mining LLC) | 26,261,087 | |
| Freedom Mine (Coteau Properties Co.) | 25,756,896 | |
| Spring Creek Coal Mine (Navajo Transitional Energy Co.) | 25,002,788 | |
| Buckskin Mine (Kiewit Corp.) | 24,531,779 | |
| Bailey Mine (CONSOL Energy Inc.) | 23,127,468 | |
| Total | 538,962,903 | |
| End Use/Product Sale | James H. Miller Jr. | 18,285,159 |
| Robert W. Scherer Power Plant | 16,564,369 | |
| Monroe Power Plant | 16,269,093 | |
| Gibson Generating Station | 16,194,973 | |
| Martin Lake Power Plant | 14,757,909 | |
| Labadie Power Station (Union Electric Co.) | 14,730,396 | |
| W. A. Parish Generating Station | 14,491,668 | |
| General James M. Gavin Power Plant | 14,346,615 | |
| Navajo Generating Station | 13,846,974 | |
| Plant Bowen (Georgia Power Co.) | 13,312,712 | |
| Total | 152,799,868 | |
| Industry Total | 691,762,771 |
| Type of Entity | Facility | Annual CO2 Emissions (MT CO2 e) |
|---|---|---|
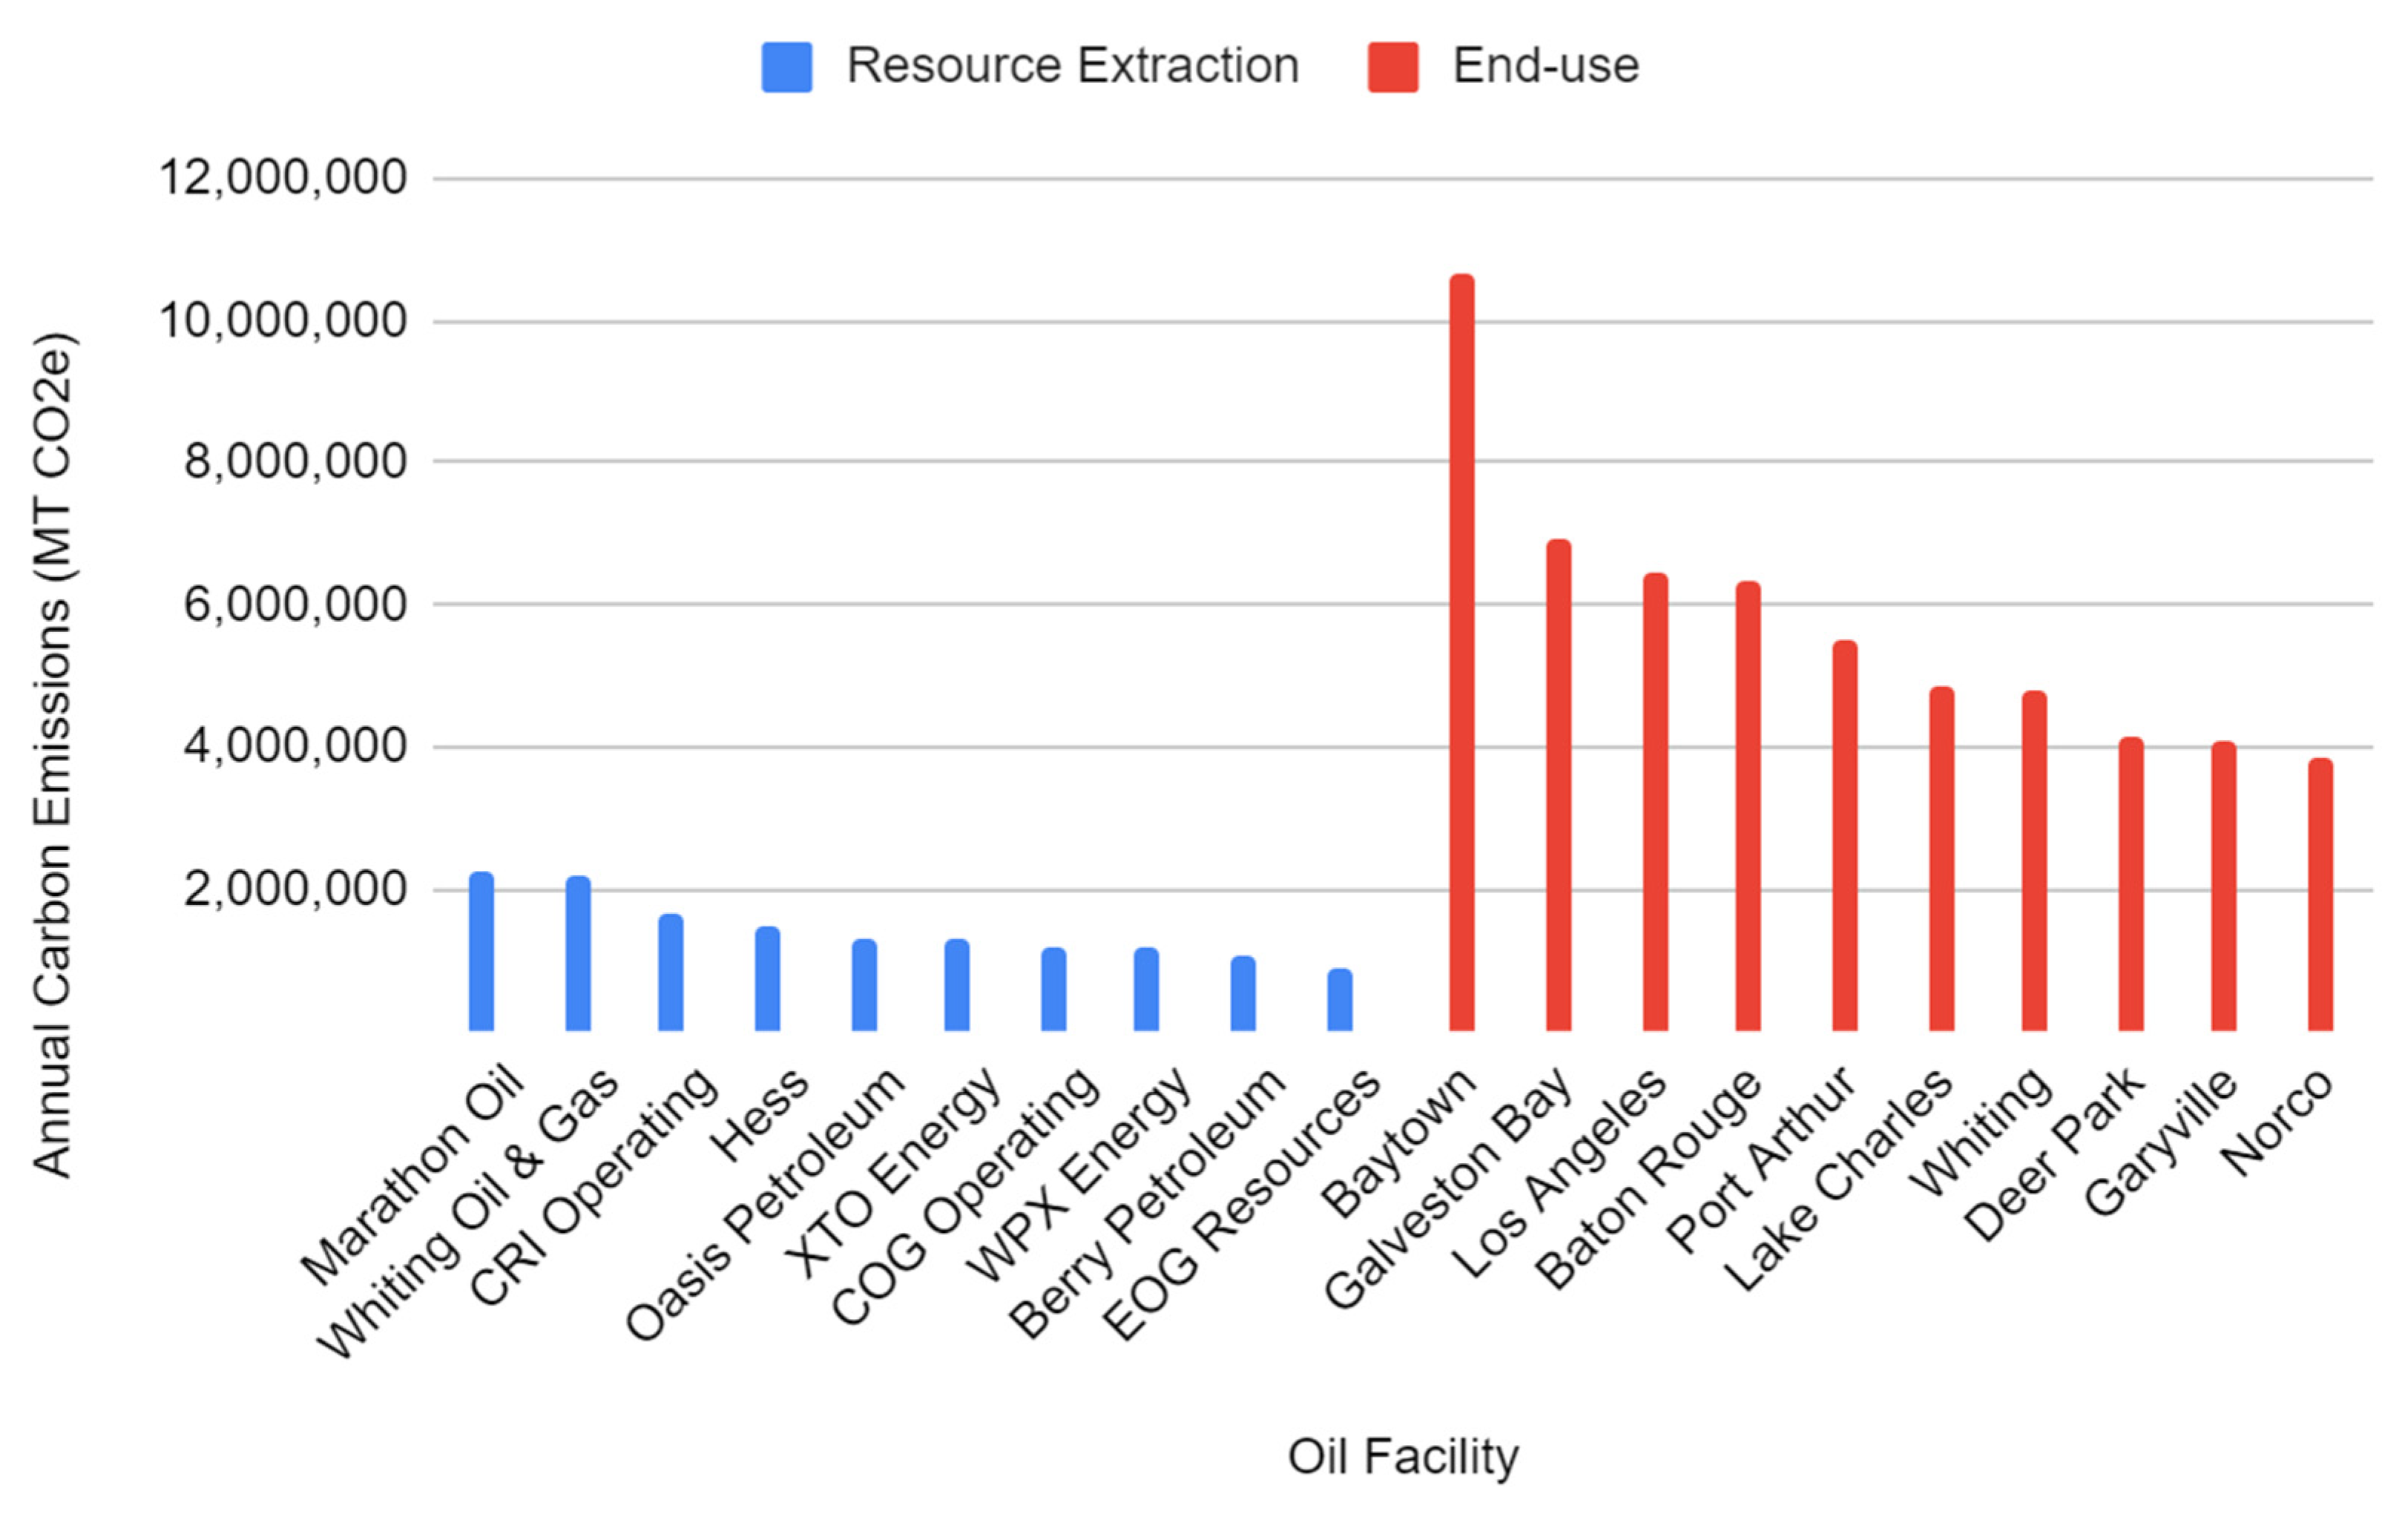
| Resource Extraction | Marathon Oil Corporation (Williston Basin) | 2,272,114 |
| Whiting Oil & Gas Corporation (Williston Basin) | 2,202,496 | |
| CRI Operating LLC (Williston Basin) | 1,649,523 | |
| Hess Corporation (Williston Basin) | 1,477,609 | |
| Oasis Petroleum North America LLC | 1,313,727 | |
| XTO Energy Inc. (Permian Basin) (ExxonMobil) | 1,278,247 | |
| COG Operating LLC | 1,188,830 | |
| WPX Energy Permian LLC | 1,185,694 | |
| Berry Petroleum Company | 1,069,414 | |
| EOG Resources Inc. (Permian Basin) | 868,246 | |
| Total | 14,505,900 | |
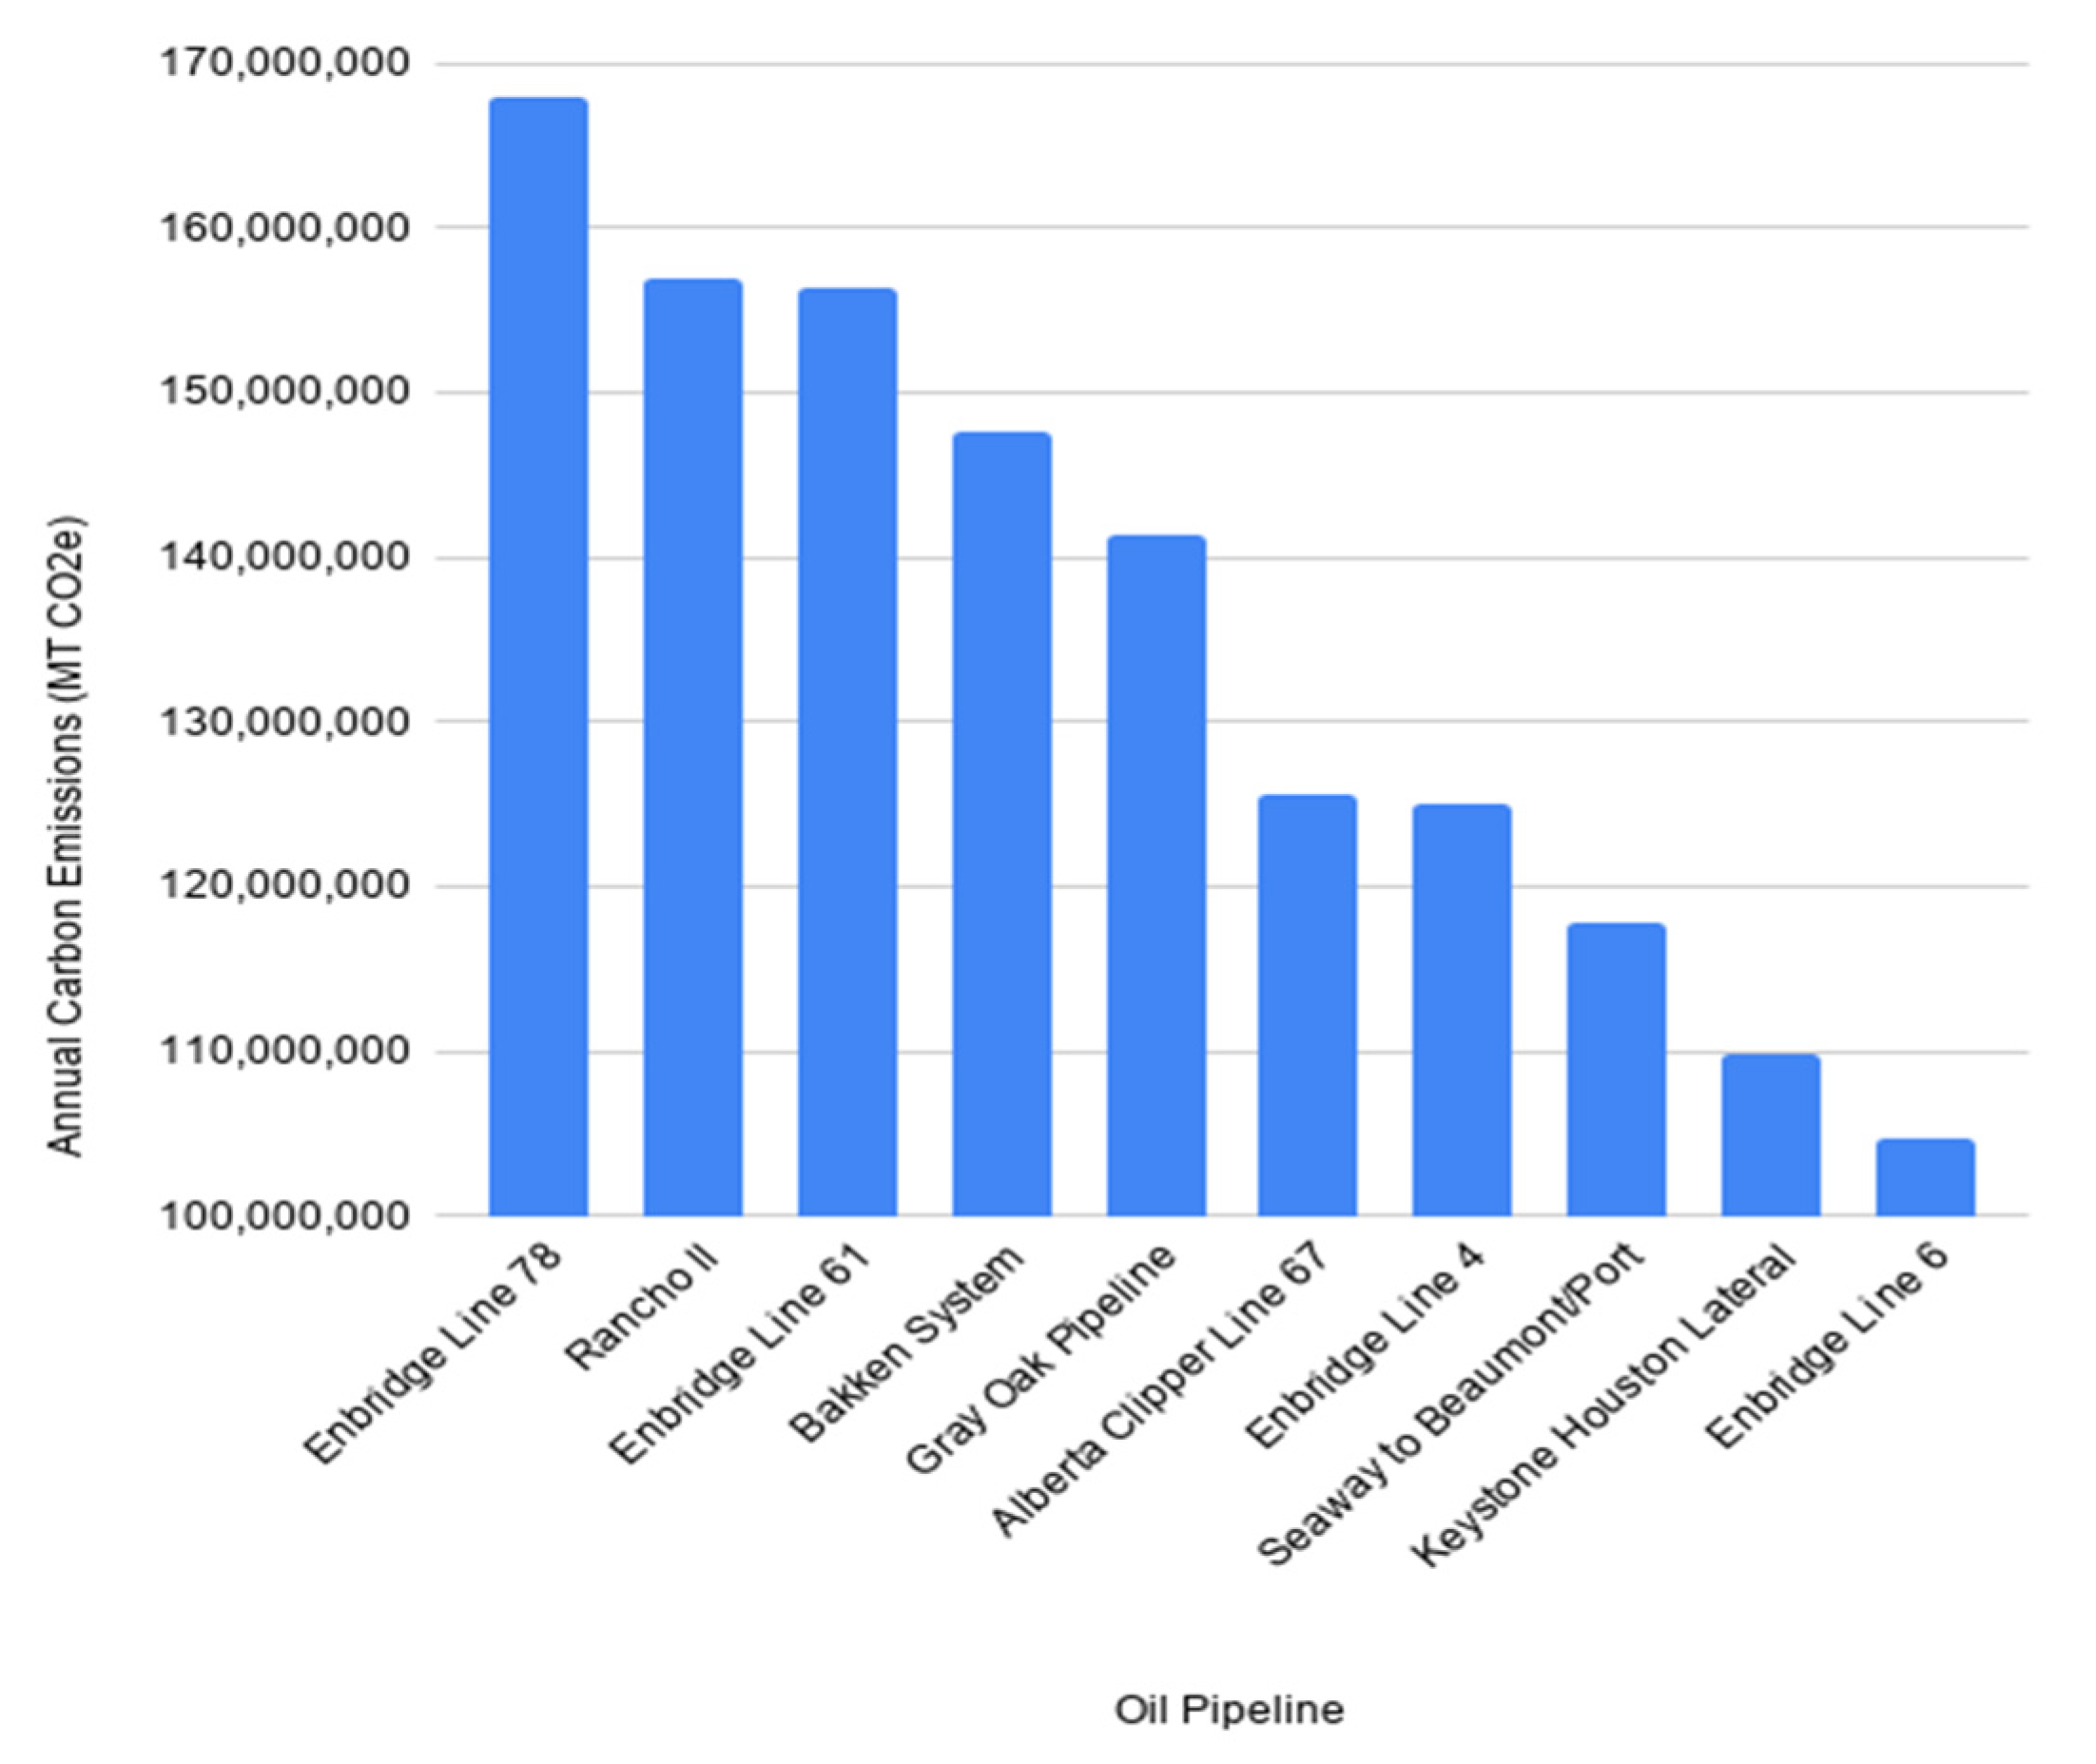
| Transport | Enbridge Line 78 | 167,936,500 |
| Rancho II Pipeline (Enterprise Product Partners) | 156,950,000 | |
| Enbridge Line 61 | 156,322,200 | |
| Bakken Pipeline System (Enbridge) | 147,544,000 | |
| Gray Oak Pipeline (Enbridge, Phillips 66) | 141,255,000 | |
| Alberta Clipper Line 67 (Enbridge) | 125,560,000 | |
| Enbridge Line 4 | 124,932,200 | |
| Seaway to Beaumont/Port Arthur Pipeline (Enbridge, Enterprise Product Partners) | 117,712,500 | |
| Keystone Houston Lateral (TransCanada) | 109,865,000 | |
| Enbridge Line 6 | 104,685,650 | |
| Total | 1,242,898,050 | |
| End Use/Product Sale | Baytown Refinery (Exxonmobil) | 10,666,655 |
| Galveston Bay Refinery (Marathon) | 6,923,112 | |
| Los Angeles Refinery (Marathon) | 6,425,775 | |
| Baton Rouge Refinery (Exxonmobil) | 6,344,880 | |
| Port Arthur Refinery (Motiva Enterprises LLC) | 5,487,670 | |
| Lake Charles Refinery (Phillips 66) | 4,862,156 | |
| Whiting Refinery (BP) | 4,781,505 | |
| Deer Park Refinery (Shell Oil Co. & Pemex) | 4,154,899 | |
| Garyville Refinery (Marathon) | 4,074,113 | |
| Norco Refinery (Shell Oil Co.) | 3,821,971 | |
| Total | 57,542,736 | |
| Industry Total | 1,314,946,686 |
| Type of Entity | Facility | Annual CO2 Emissions (MT CO2 e) |
|---|---|---|
| Resource Extraction | Marathon Oil Corporation (Williston Basin) | 2,272,114 |
| Whiting Oil & Gas Corporation (Williston Basin) | 2,202,496 | |
| CRI Operating LLC (Williston Basin) | 1,649,523 | |
| Hess Corporation (Williston Basin) | 1,477,609 | |
| Oasis Petroleum North America LLC | 1,313,727 | |
| XTO Energy Inc. (Permian Basin) (ExxonMobil) | 1,278,247 | |
| COG Operating LLC | 1,188,830 | |
| WPX Energy Permian LLC | 1,185,694 | |
| Berry Petroleum Company | 1,069,414 | |
| EOG Resources Inc. (Permian Basin) | 868,246 | |
| Total | 14,505,900 | |
| Transport | Trans-Pecos Pipeline LLC | 467,726 |
| Florida Gas Transmission Co. LLC (Kinder Morgan) | 442,644 | |
| Natural Gas Pipeline Co. of America LLC (Kinder Morgan) | 202,912 | |
| Transcontinental Gas Pipeline (Williams) | 164,701 | |
| Dominion Energy Transmission | 152,154 | |
| Columbia Gulf Transmission (TransCanada) | 137,980 | |
| ANR Pipeline (TransCanada) | 137,831 | |
| Northern Natural Gas (Berkshire Hathaway) | 125,122 | |
| Tennessee Gas Pipeline Co. LLC (Kinder Morgan) | 88,832 | |
| Columbia Gas Transmission (TransCanada) | 66,692 | |
| Total | 1,986,594 | |
| End Use/Product Sale | W. A. Parish Generating Station | 14,491,668 |
| West County Energy Center | 7,167,296 | |
| Plant McDonough-Atkinson | 6,180,554 | |
| Martin Power Plant | 5,265,279 | |
| Richmond County Combustion Turbine Plant | 5,177,764 | |
| Hines Energy Complex | 5,026,094 | |
| Plant H. Allen Franklin | 4,553,304 | |
| Ninemile Point Power Plant | 4,118,889 | |
| Forney Power Plant | 4,098,711 | |
| Sanford Power Plant | 3,981,203 | |
| Total | 60,060,762 | |
| Industry Total | 76,553,256 |
| Facility | Annual CO2 Emissions (MT CO2 e) |
|---|---|
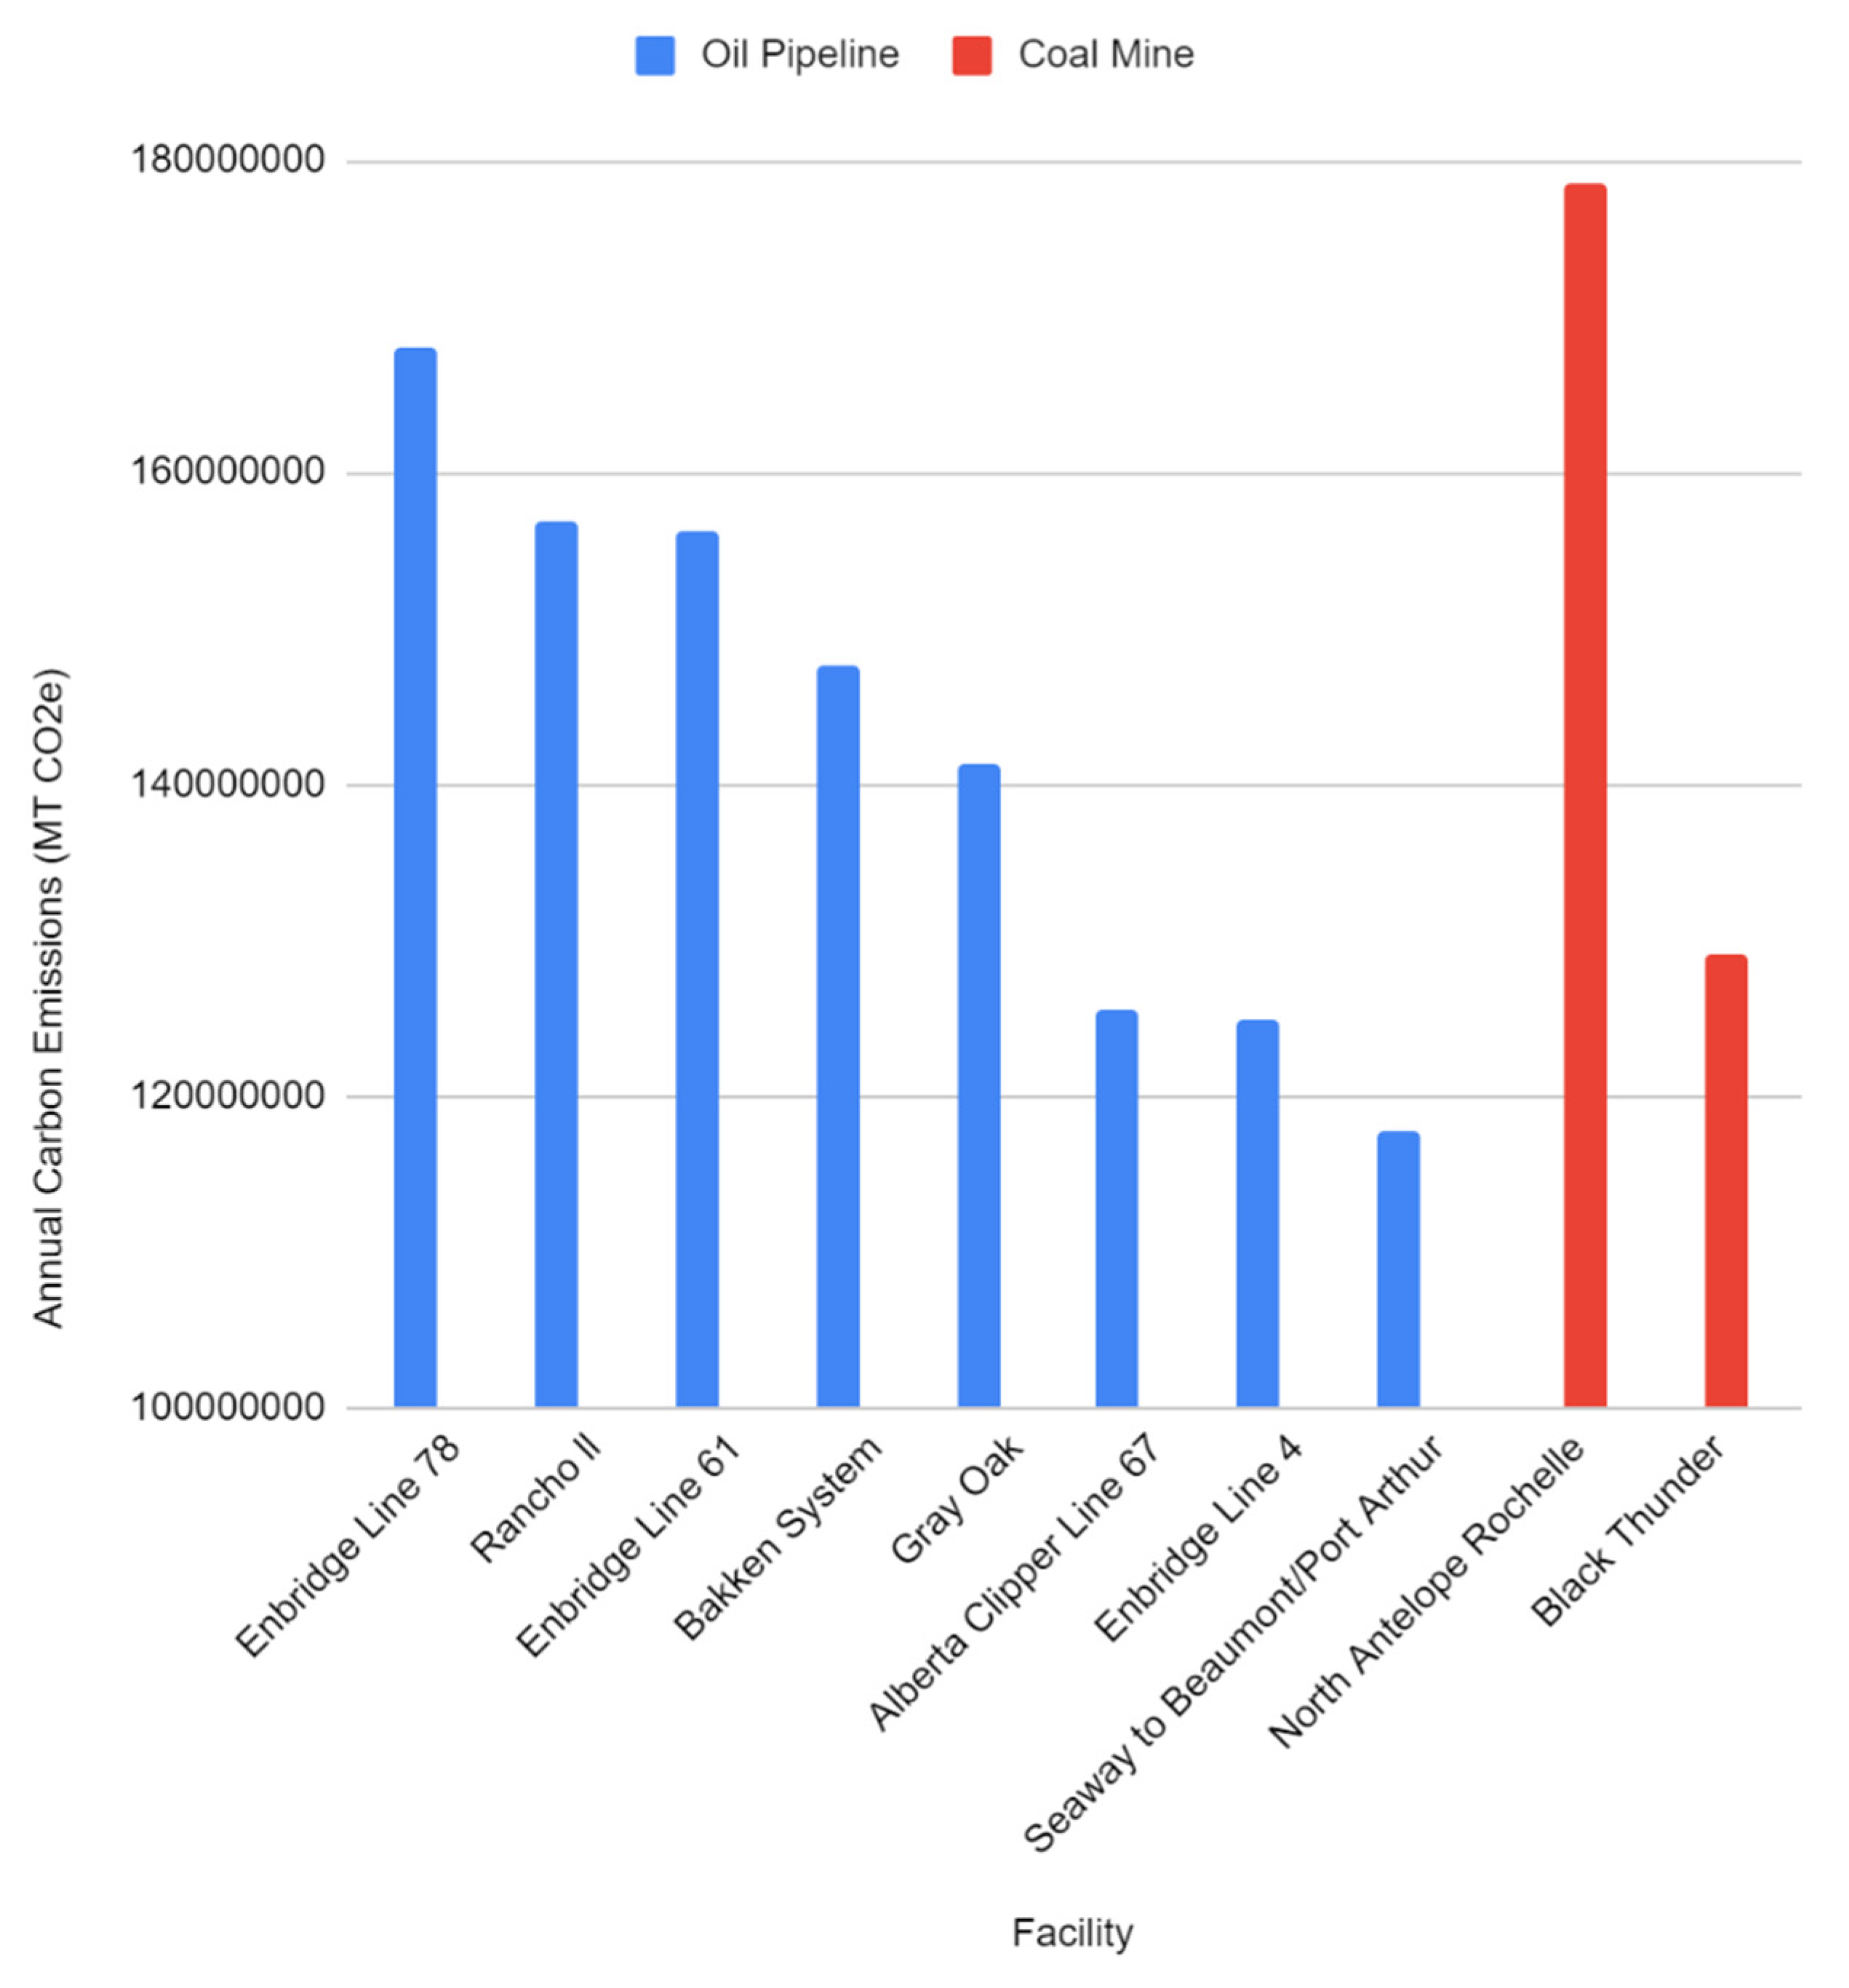
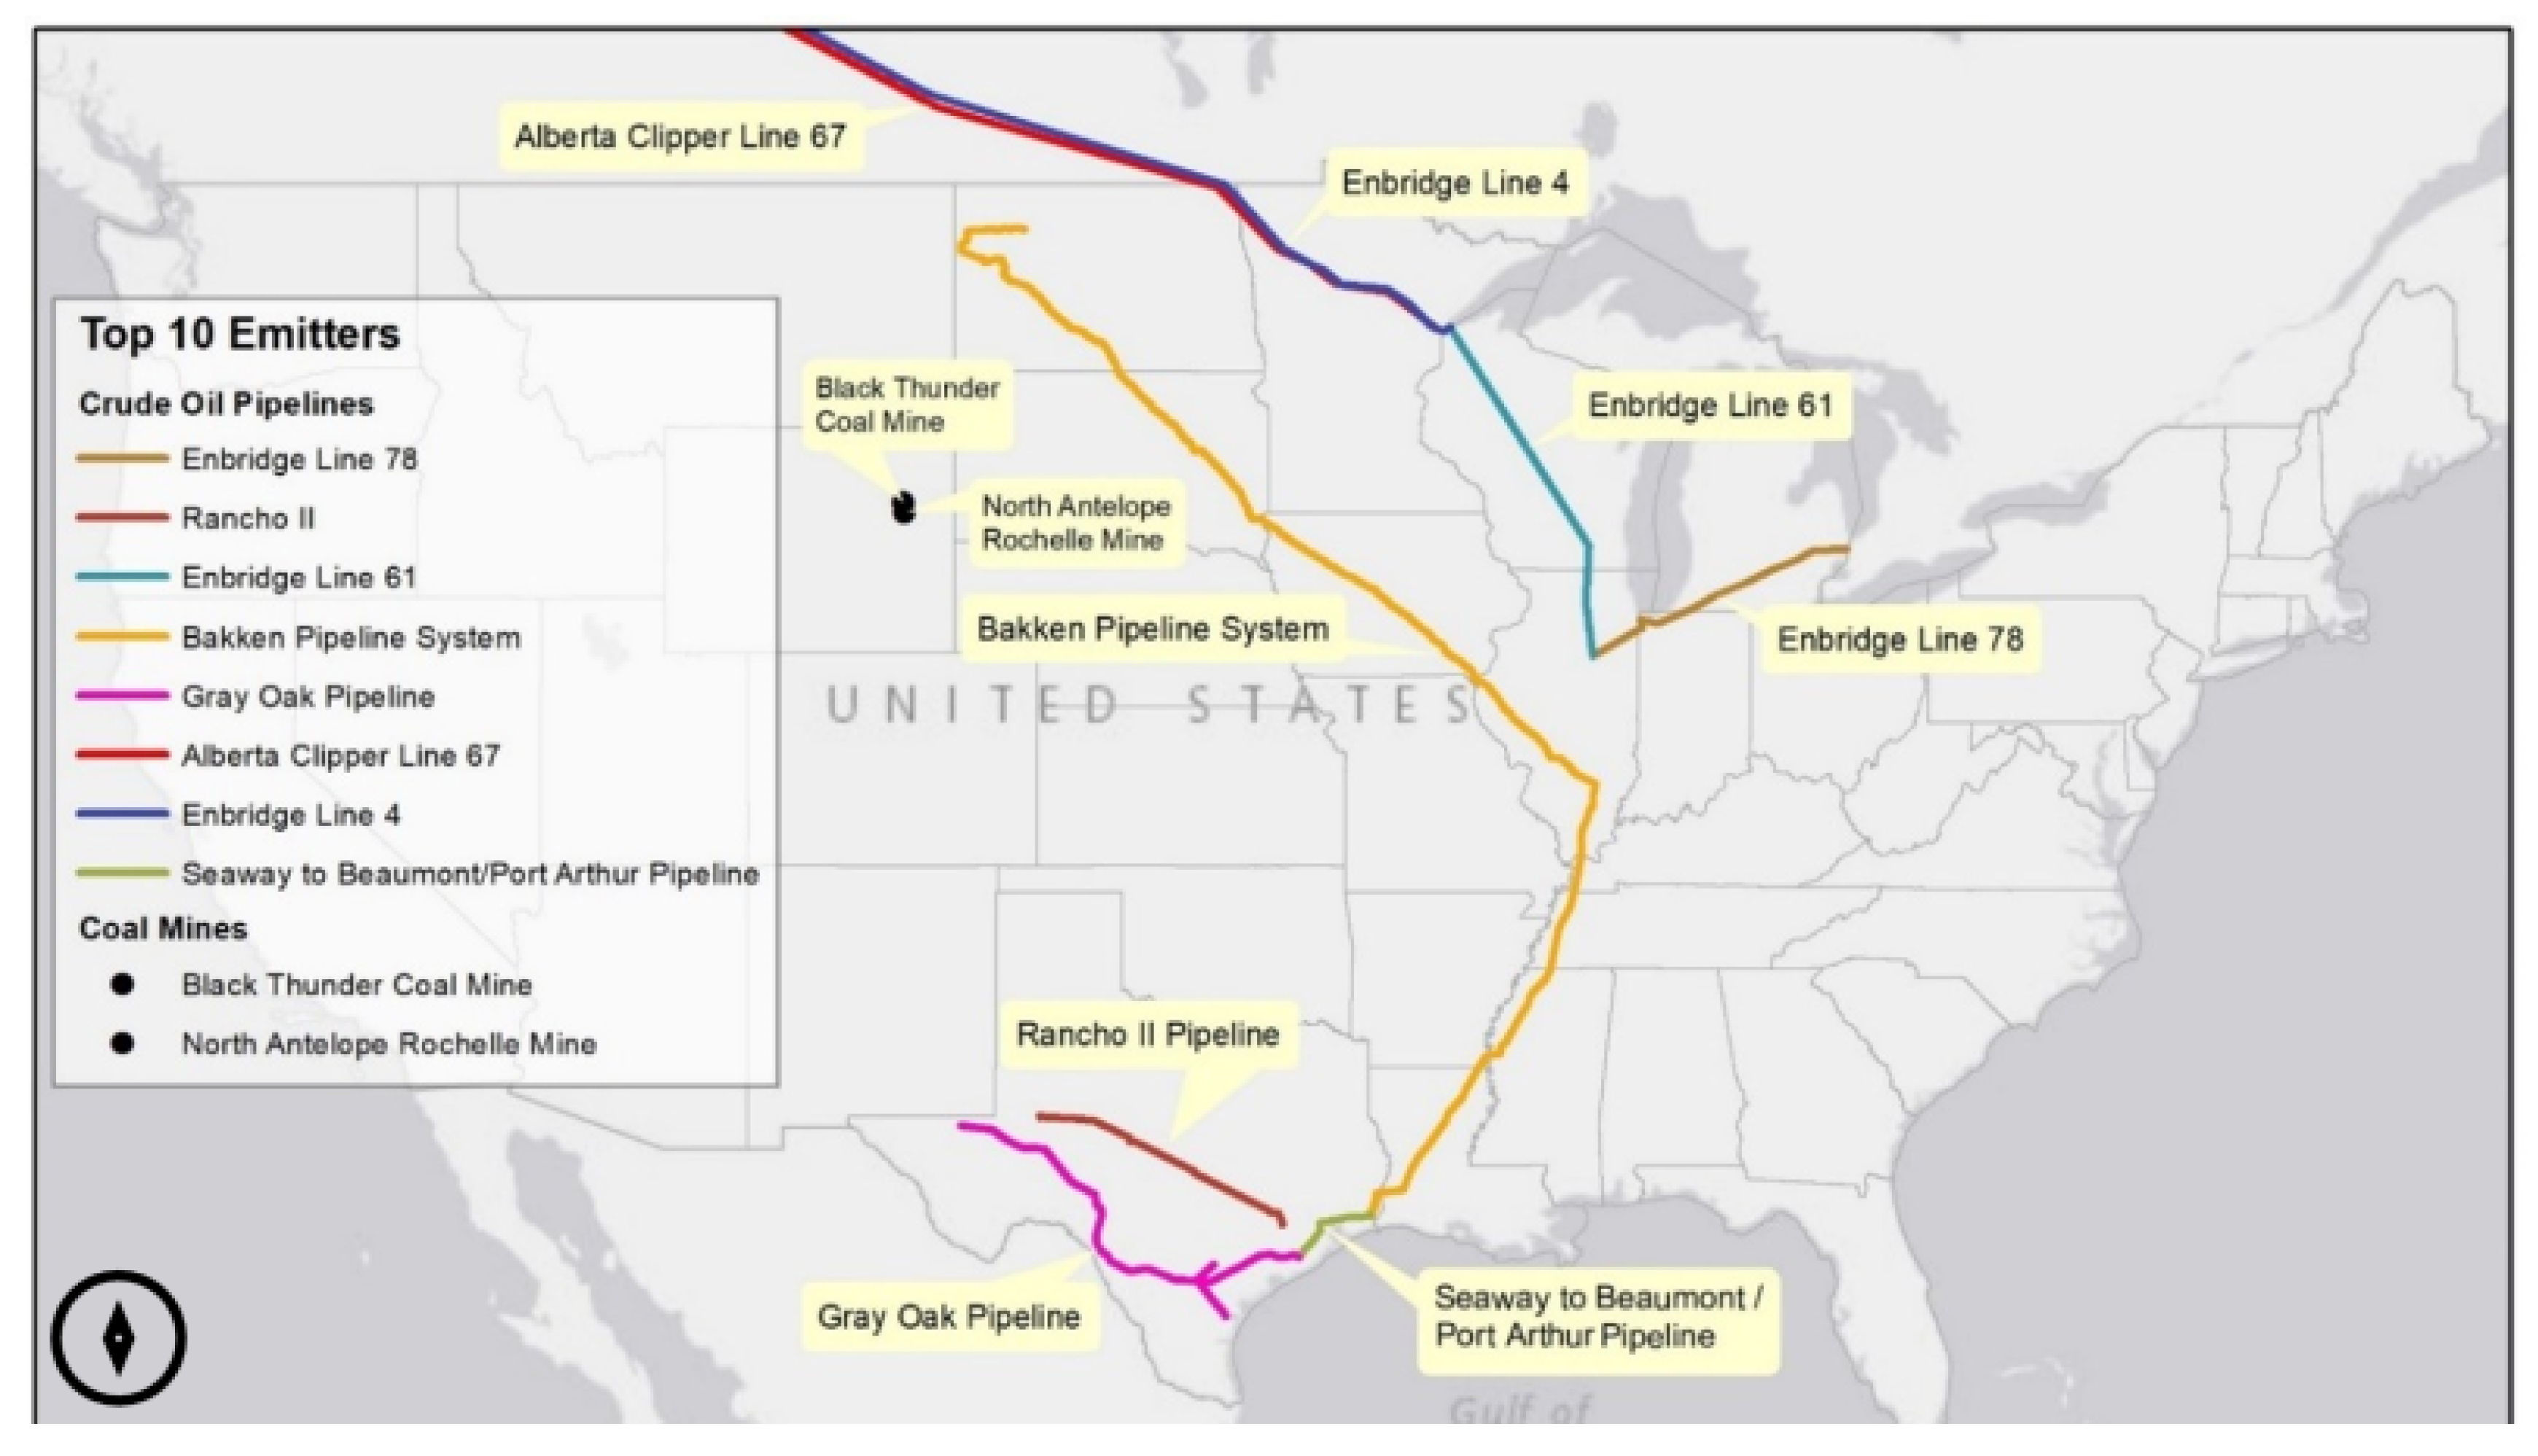
| North Antelope Rochelle Coal Mine (Peabody Energy Corporation) | 178,541,482 |
| Enbridge Line 78 | 167,936,500 |
| Rancho ll Pipeline (Enterprise Product Partners) | 156,950,000 |
| Enbridge Line 61 | 156,322,200 |
| Bakken Pipeline System (Enbridge) | 147,544,000 |
| Gray Oak Pipeline (Enbridge, Phillips 66) | 141,255,000 |
| Black Thunder Coal Mine (Arch Coal Inc.) | 129,180,444 |
| Alberta Clipper Line 67 (Enbridge) | 125,560,000 |
| Enbridge Line 4 | 124,932,200 |
| Seaway to Beaumont/Port Arthur Pipeline (Enbridge, Enterprise Products) | 117,712,500 |
| Total | 1,445,934,326 |
| Type of Entity | Facility | Annual CO2 Emissions (MT CO2 e) |
|---|---|---|
| Resource Extraction | North Antelope Rochelle Mine (Peabody Energy) | 178,541,482 |
| Black Thunder Mine (Arch Coal Inc.) | 129,180,444 | |
| Antelope Coal Mine (Cloud Peak Energy) | 42,050,826 | |
| Belle Ayr Mine (Blackjewel LLC) | 33,536,807 | |
| Eagle Butte Mine (Blackjewel LLC) | 30,973,326 | |
| Mc#1 Mine (Mach Mining LLC) | 26,261,087 | |
| Freedom Mine (Coteau Properties Co.) | 25,756,896 | |
| Spring Creek Coal Mine (Navajo Transitional Energy Co.) | 25,002,788 | |
| Buckskin Mine (Kiewit Corp.) | 24,531,779 | |
| Bailey Mine (CONSOL Energy Inc.) | 23,127,468 | |
| Total | 538,962,903 | |
| End Use/Product Sale | James H. Miller Jr. | 18,285,159 |
| Robert W. Scherer Power Plant | 16,564,369 | |
| Monroe Power Plant | 16,269,093 | |
| Gibson Generating Station | 16,194,973 | |
| Martin Lake Power Plant | 14,757,909 | |
| Labadie Power Station (Union Electric Co.) | 14,730,396 | |
| W. A. Parish Generating Station | 14,491,668 | |
| General James M. Gavin Power Plant | 14,346,615 | |
| Navajo Generating Station | 13,846,974 | |
| Plant Bowen (Georgia Power Co.) | 13,312,712 | |
| Total | 152,799,868 | |
| Industry Total | 691,762,771 |
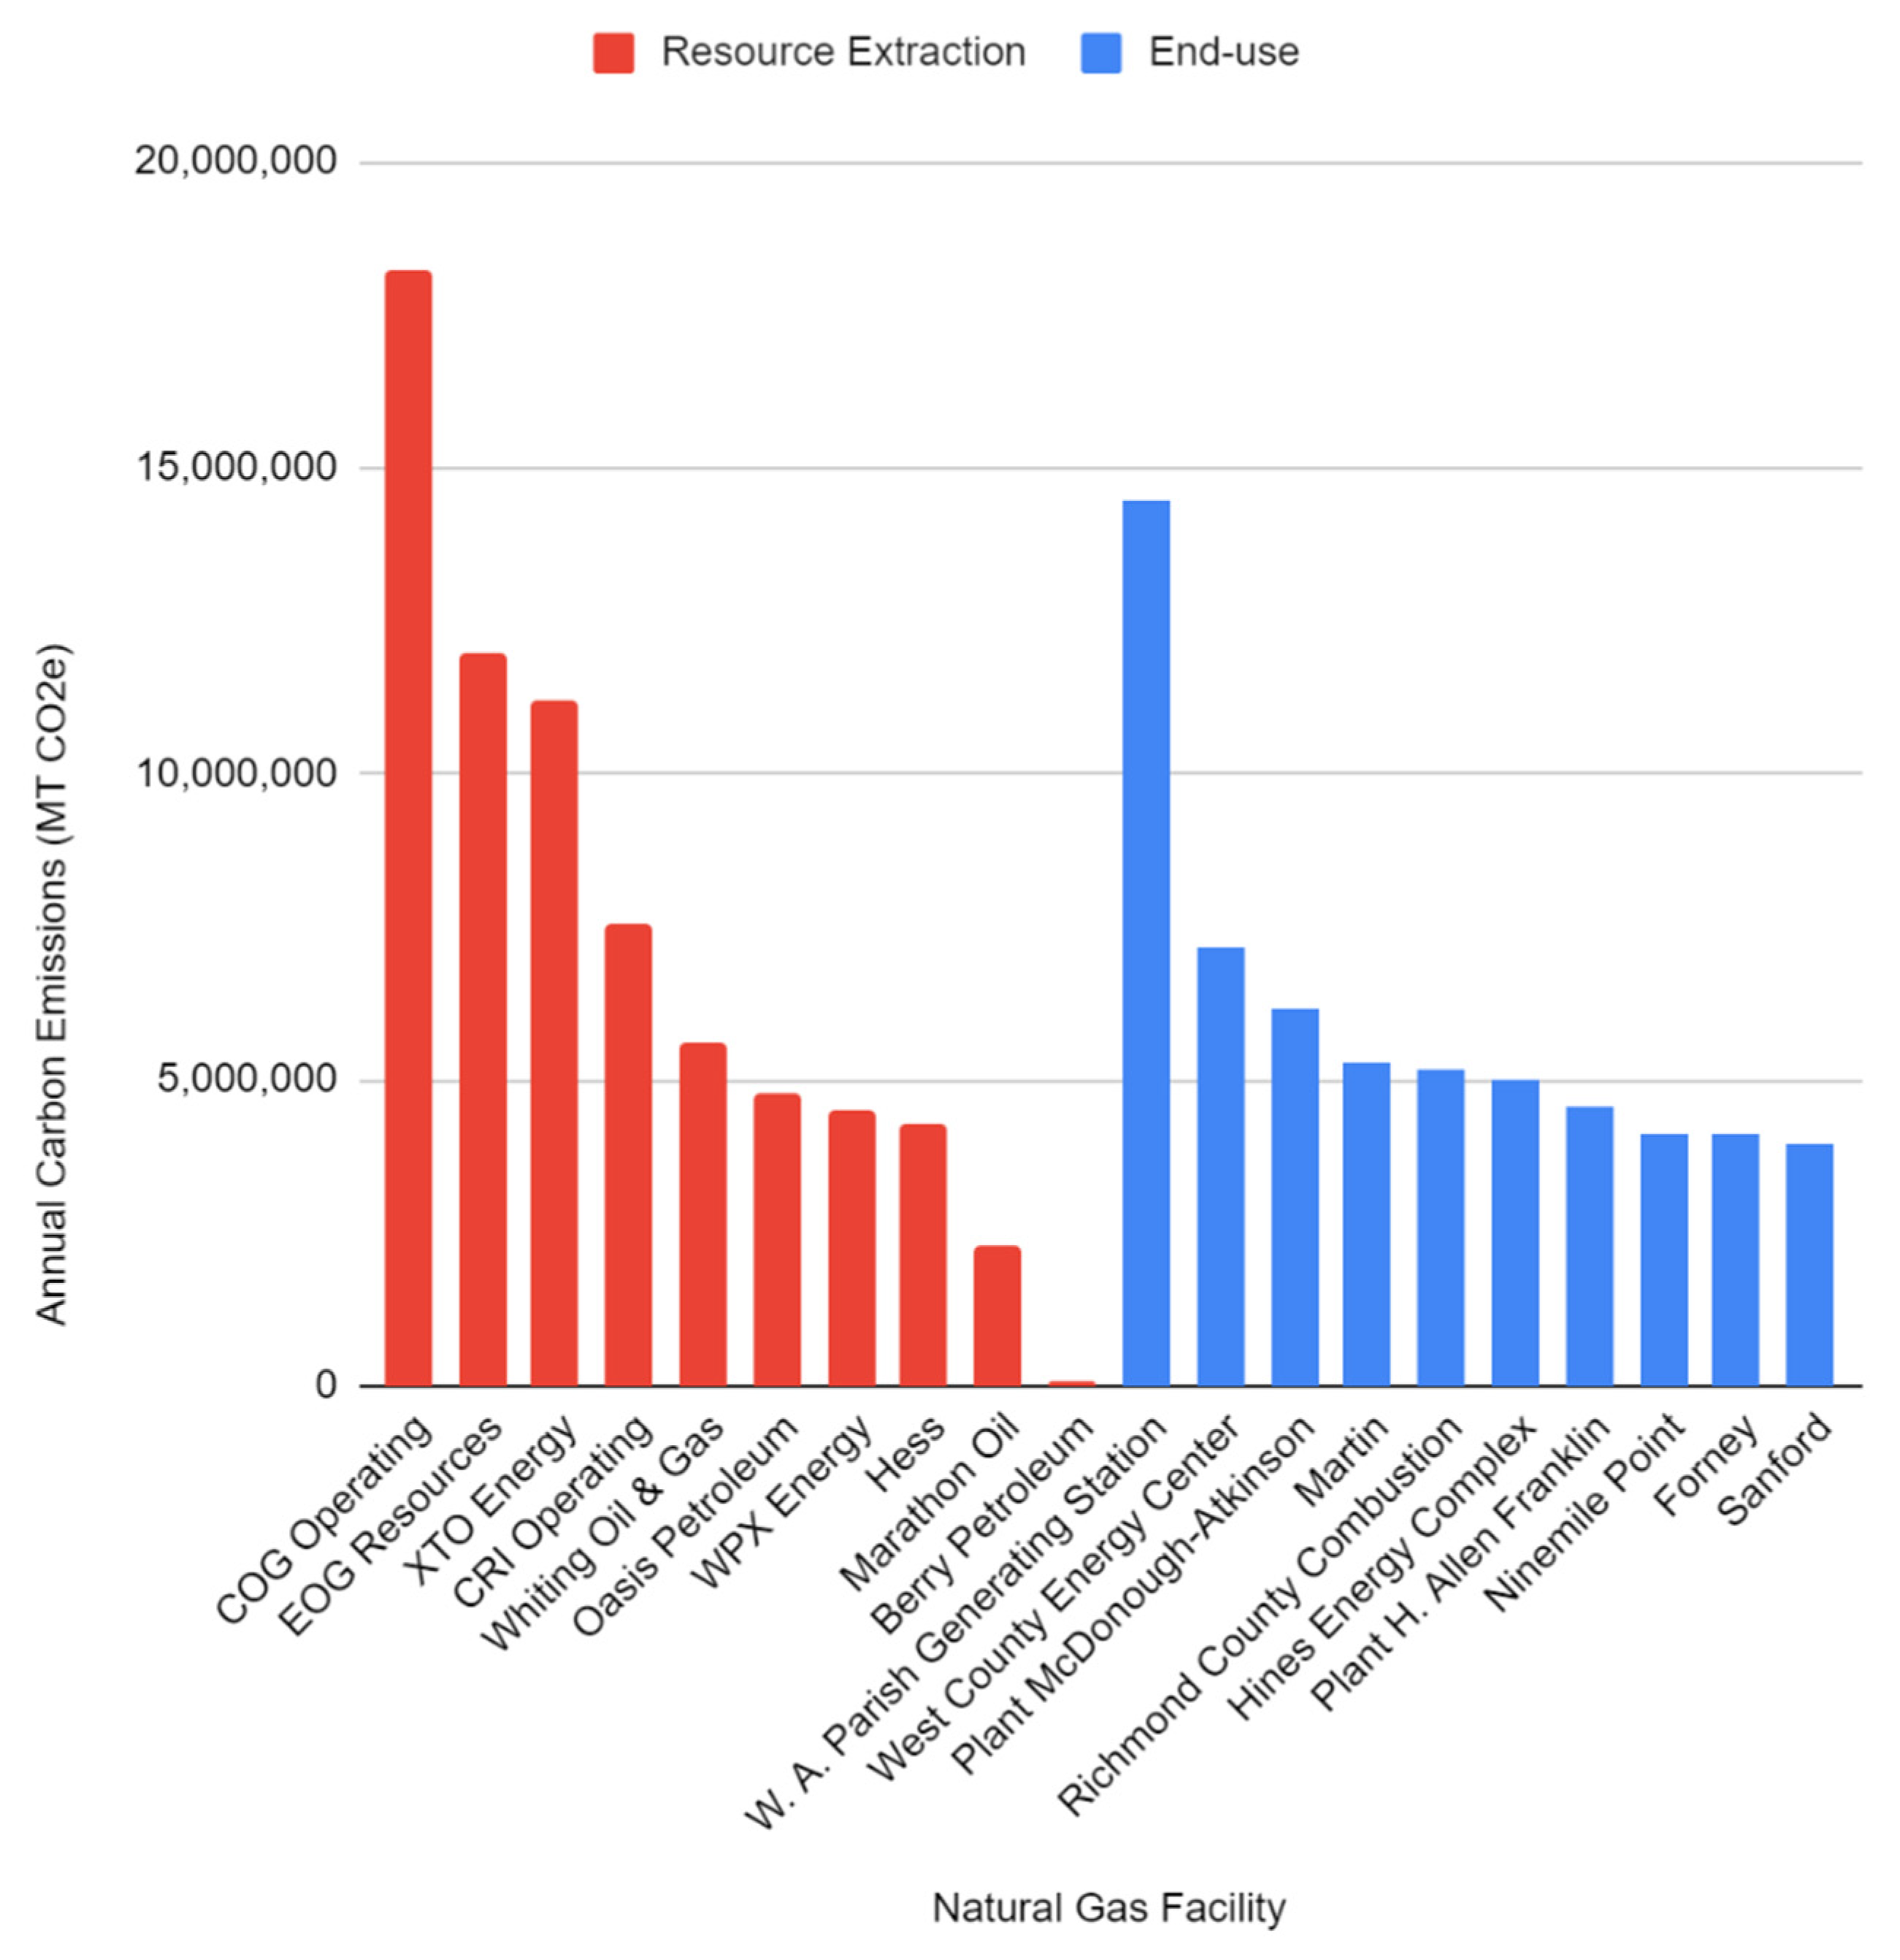
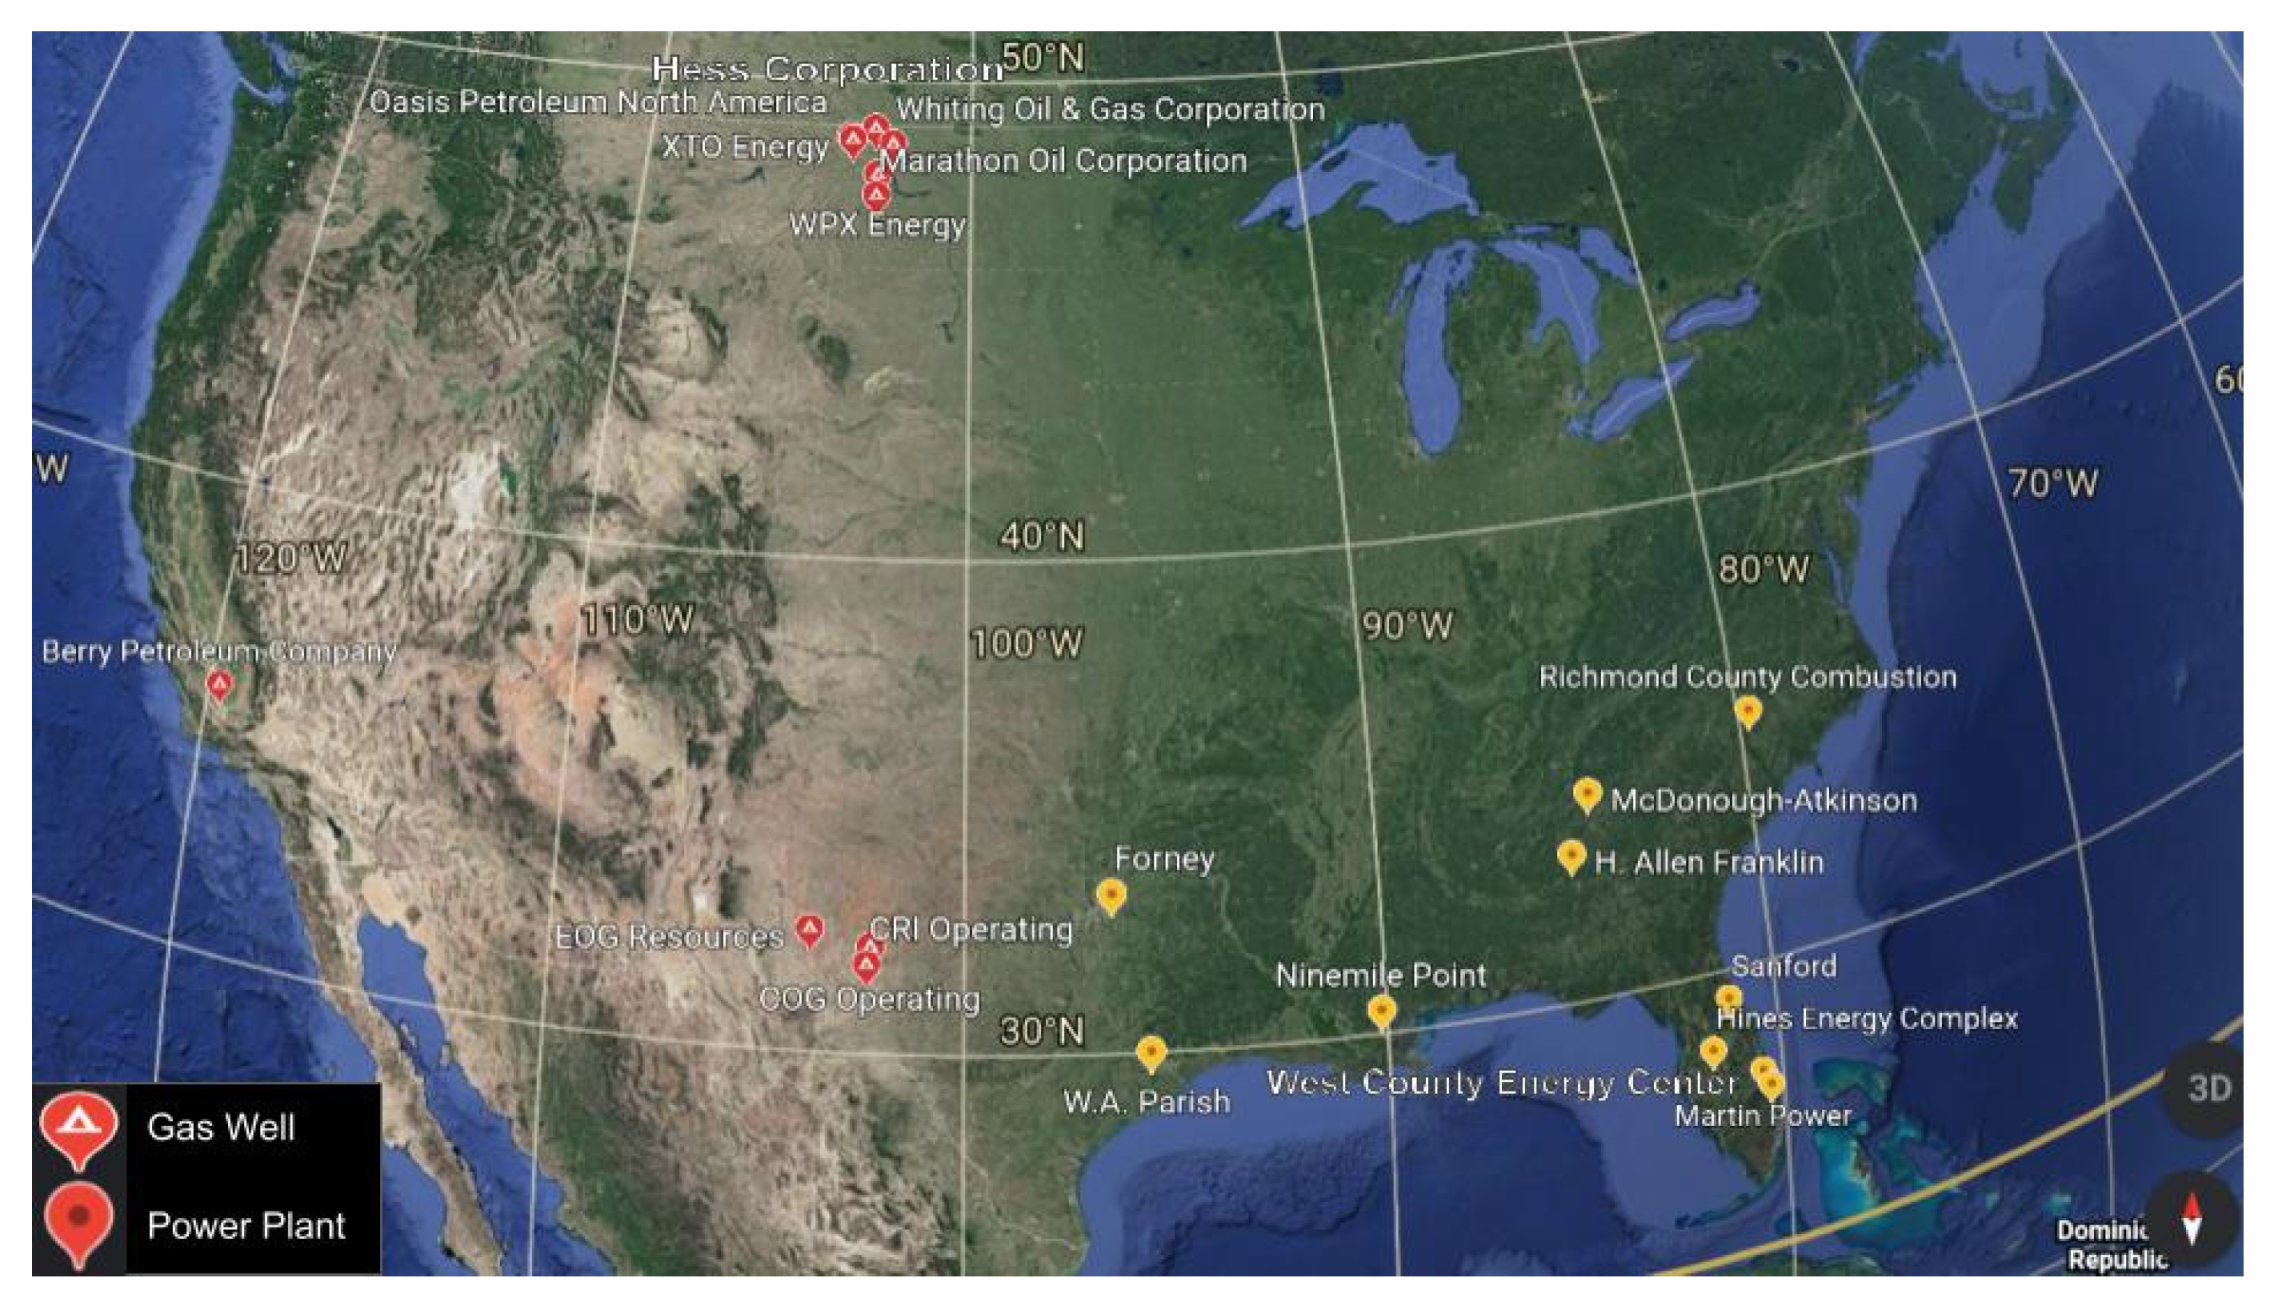
| Type of Entity | Facility | Annual CO2 Emissions (MT CO2 e) |
|---|---|---|
| Resource Extraction | COG Operating LLC | 44,467,031 |
| EOG Resources Inc. (Permian Basin) | 27,756,075 | |
| CRI Operating LLC | 27,425,089 | |
| XTO Energy Inc. (Permian Basin) (ExxonMobil) | 24,262,919 | |
| Whiting Oil & Gas Corporation (Williston Basin) | 17,741,877 | |
| Oasis Petroleum North America LLC | 15,703,569 | |
| Hess Corporation (Williston Basin) | 15,642,390 | |
| Marathon Oil Corporation (Williston Basin) | 14,154,904 | |
| WPX Energy Permian LLC | 7,935,799 | |
| Berry Petroleum Company | 3,072,666 | |
| Total | 198,162,321 | |
| Transport | Enbridge Line 78 | 167,936,500 |
| Rancho II Pipeline (Enterprise Product Partners) | 156,950,000 | |
| Enbridge Line 61 | 156,322,200 | |
| Bakken Pipeline System (Enbridge) | 147,544,000 | |
| Gray Oak Pipeline (Enbridge, Phillips 66) | 141,255,000 | |
| Alberta Clipper Line 67 (Enbridge) | 125,560,000 | |
| Enbridge Line 4 | 124,932,200 | |
| Seaway to Beaumont/Port Arthur Pipeline (Enbridge, Enterprise Product Partners) | 117,712,500 | |
| Keystone Houston Lateral (TransCanada) | 109,865,000 | |
| Enbridge Line 6 | 104,685,650 | |
| Total | 1,242,898,050 | |
| End Use/Product Sale | Port Arthur Refinery (Motiva Enterprises LLC) | 98,878,500 |
| Galveston Bay Refinery (Marathon) | 91,815,750 | |
| Baytown Refinery (ExxonMobil) | 91,658,800 | |
| Garyville Refinery (Marathon) | 88,519,800 | |
| Baton Rouge Refinery (ExxonMobil) | 78,867,375 | |
| Whiting Refinery (BP) | 67,488,500 | |
| Los Angeles Refinery (Marathon) | 56,972,850 | |
| Deer Park Refinery (Shell Oil Co. & Pemex) | 53,363,000 | |
| Lake Charles Refinery (Phillips 66) | 45,515,500 | |
| Norco Refinery (Shell Oil Co.) | 39,237,500 | |
| Total | 712,317,575 | |
| Industry Total | 2,153,377,946 |
| Type of Entity | Facility | Annual CO2 Emissions (MT CO2 e) |
|---|---|---|
| Resource Extraction | COG Operating LLC | 18,210,636 |
| EOG Resources Inc. (Permian Basin) | 12,000,231 | |
| XTO Energy Inc. (Permian Basin) (ExxonMobil) | 11,219,906 | |
| CRI Operating LLC (Williston Basin) | 7,549,824 | |
| Whiting Oil & Gas Corporation (Williston Basin) | 5,596,600 | |
| Oasis Petroleum North America LLC | 4,811,806 | |
| WPX Energy Permian LLC | 4,517,306 | |
| Hess Corporation (Williston Basin) | 4,312,664 | |
| Marathon Oil Corporation (Williston Basin) | 2,308,790 | |
| Berry Petroleum Company | 79,204 | |
| Total | 70,606,969 | |
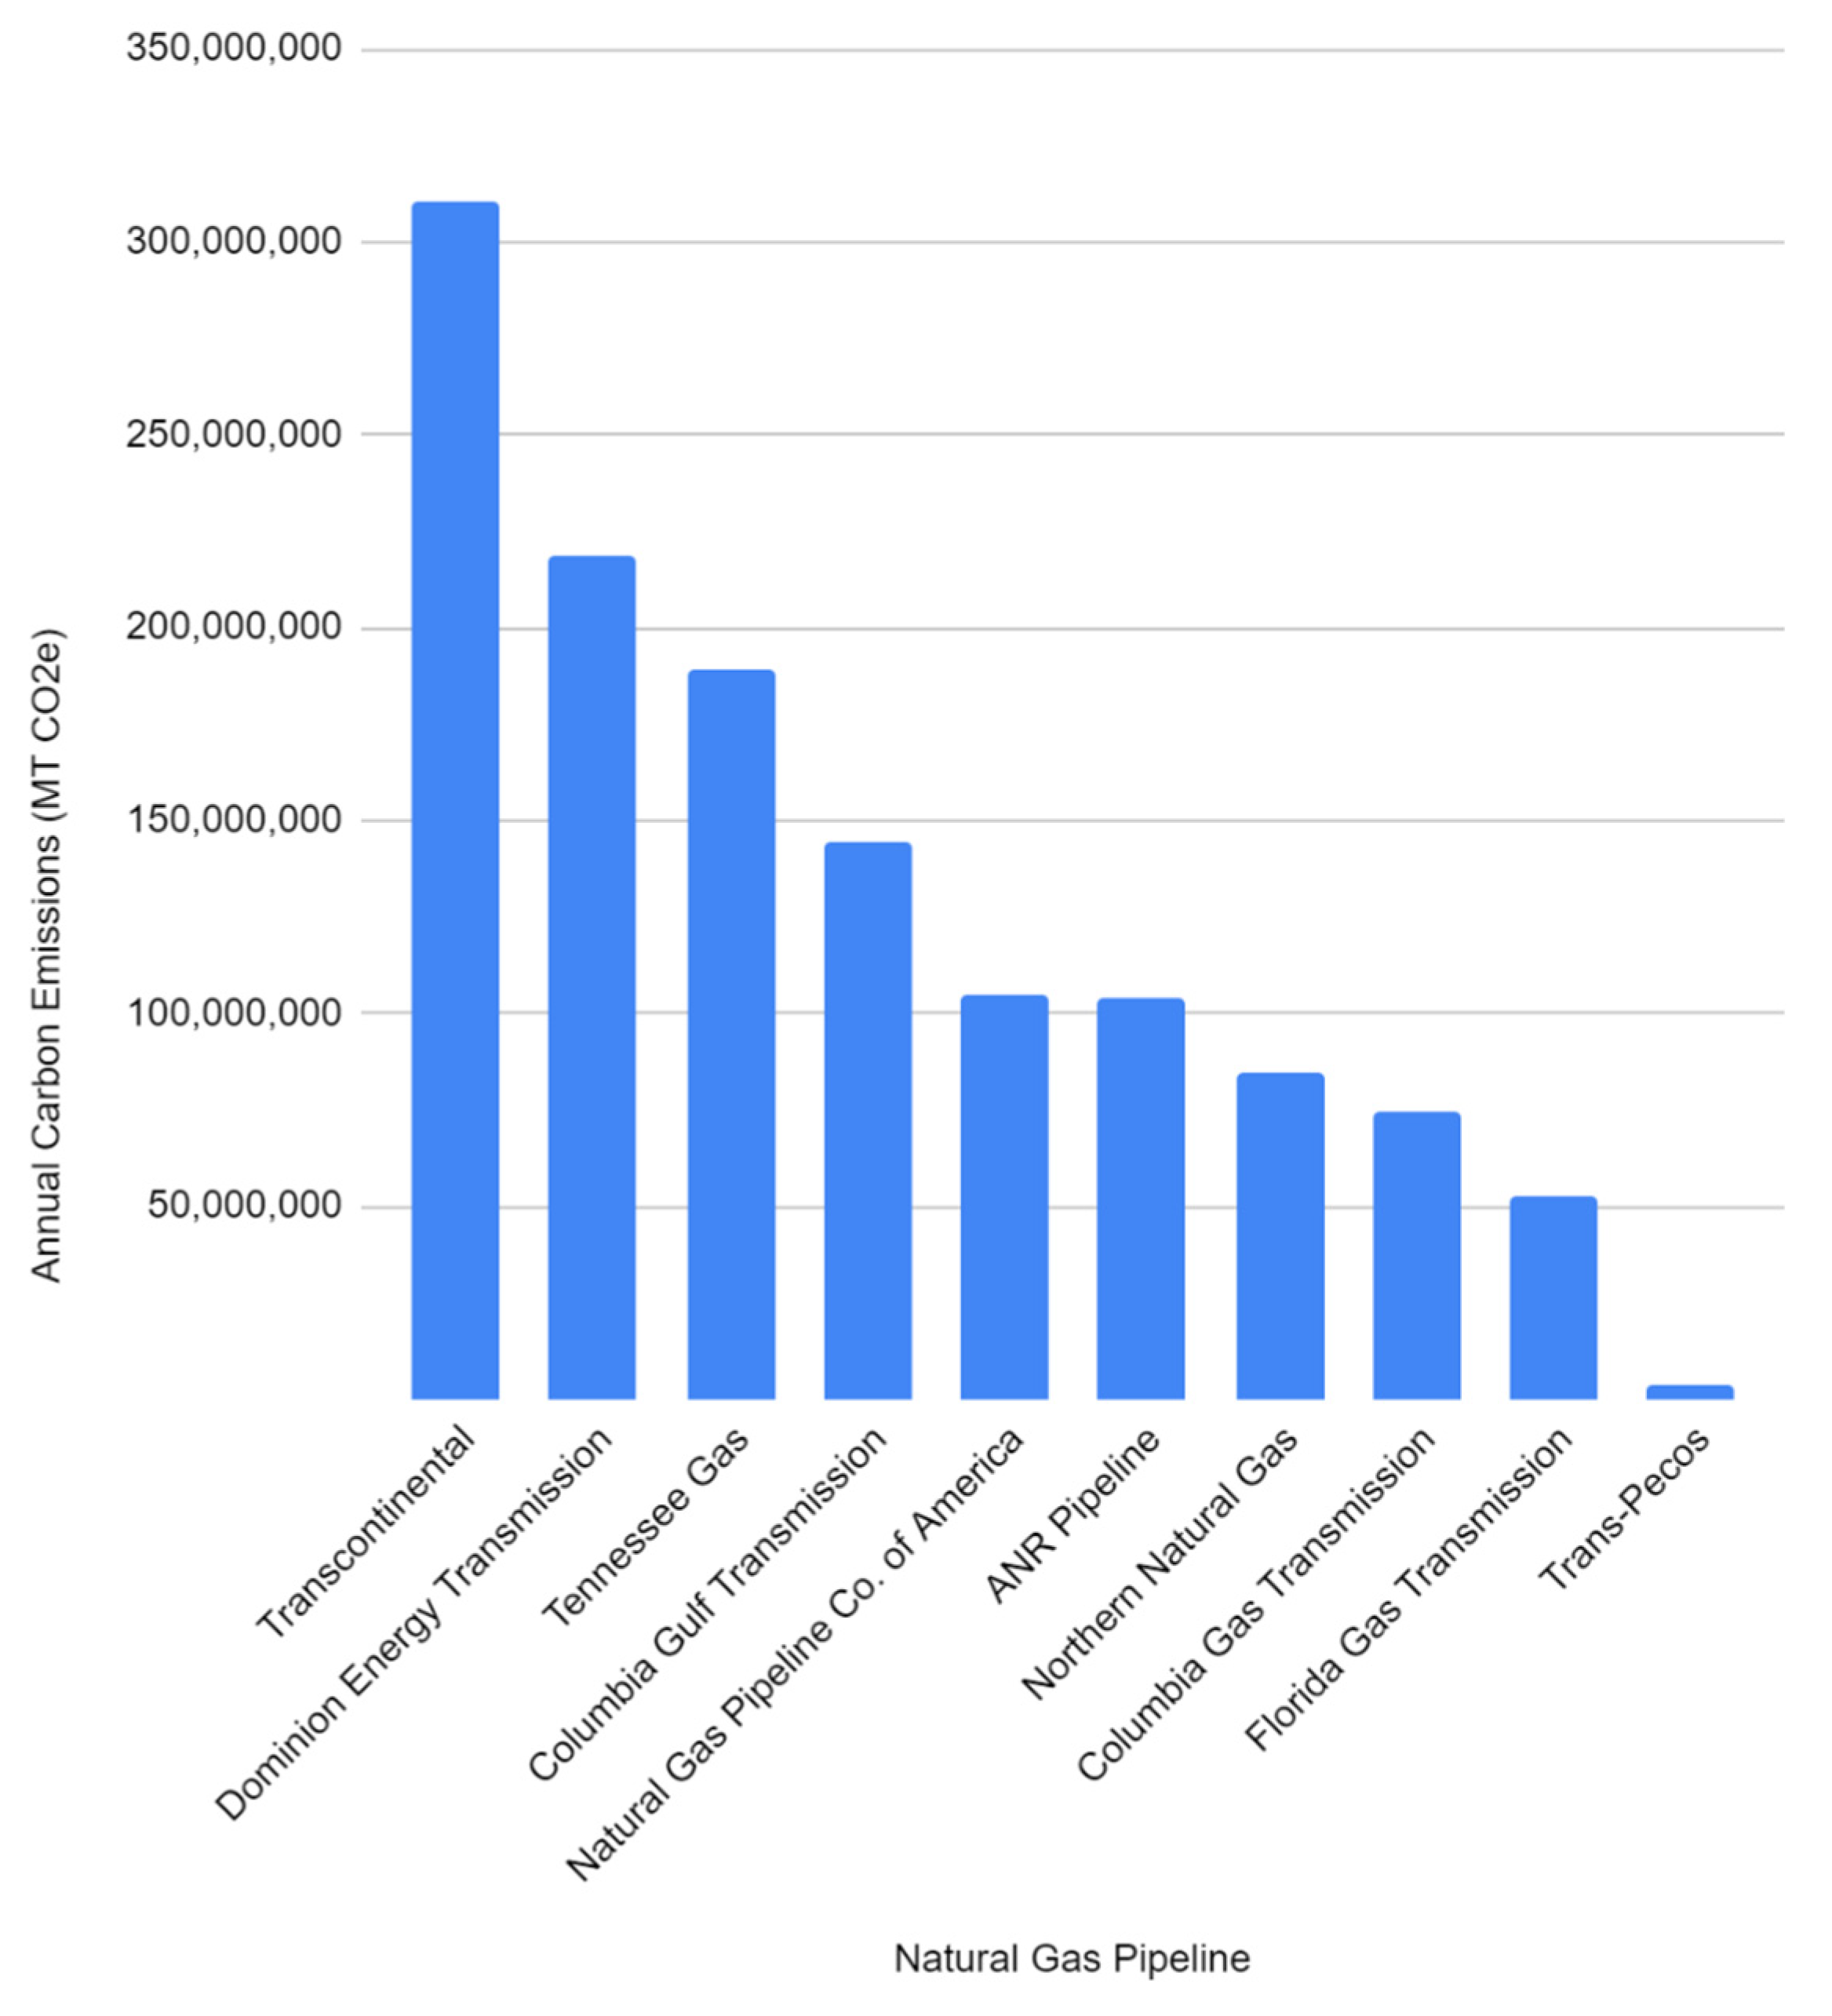
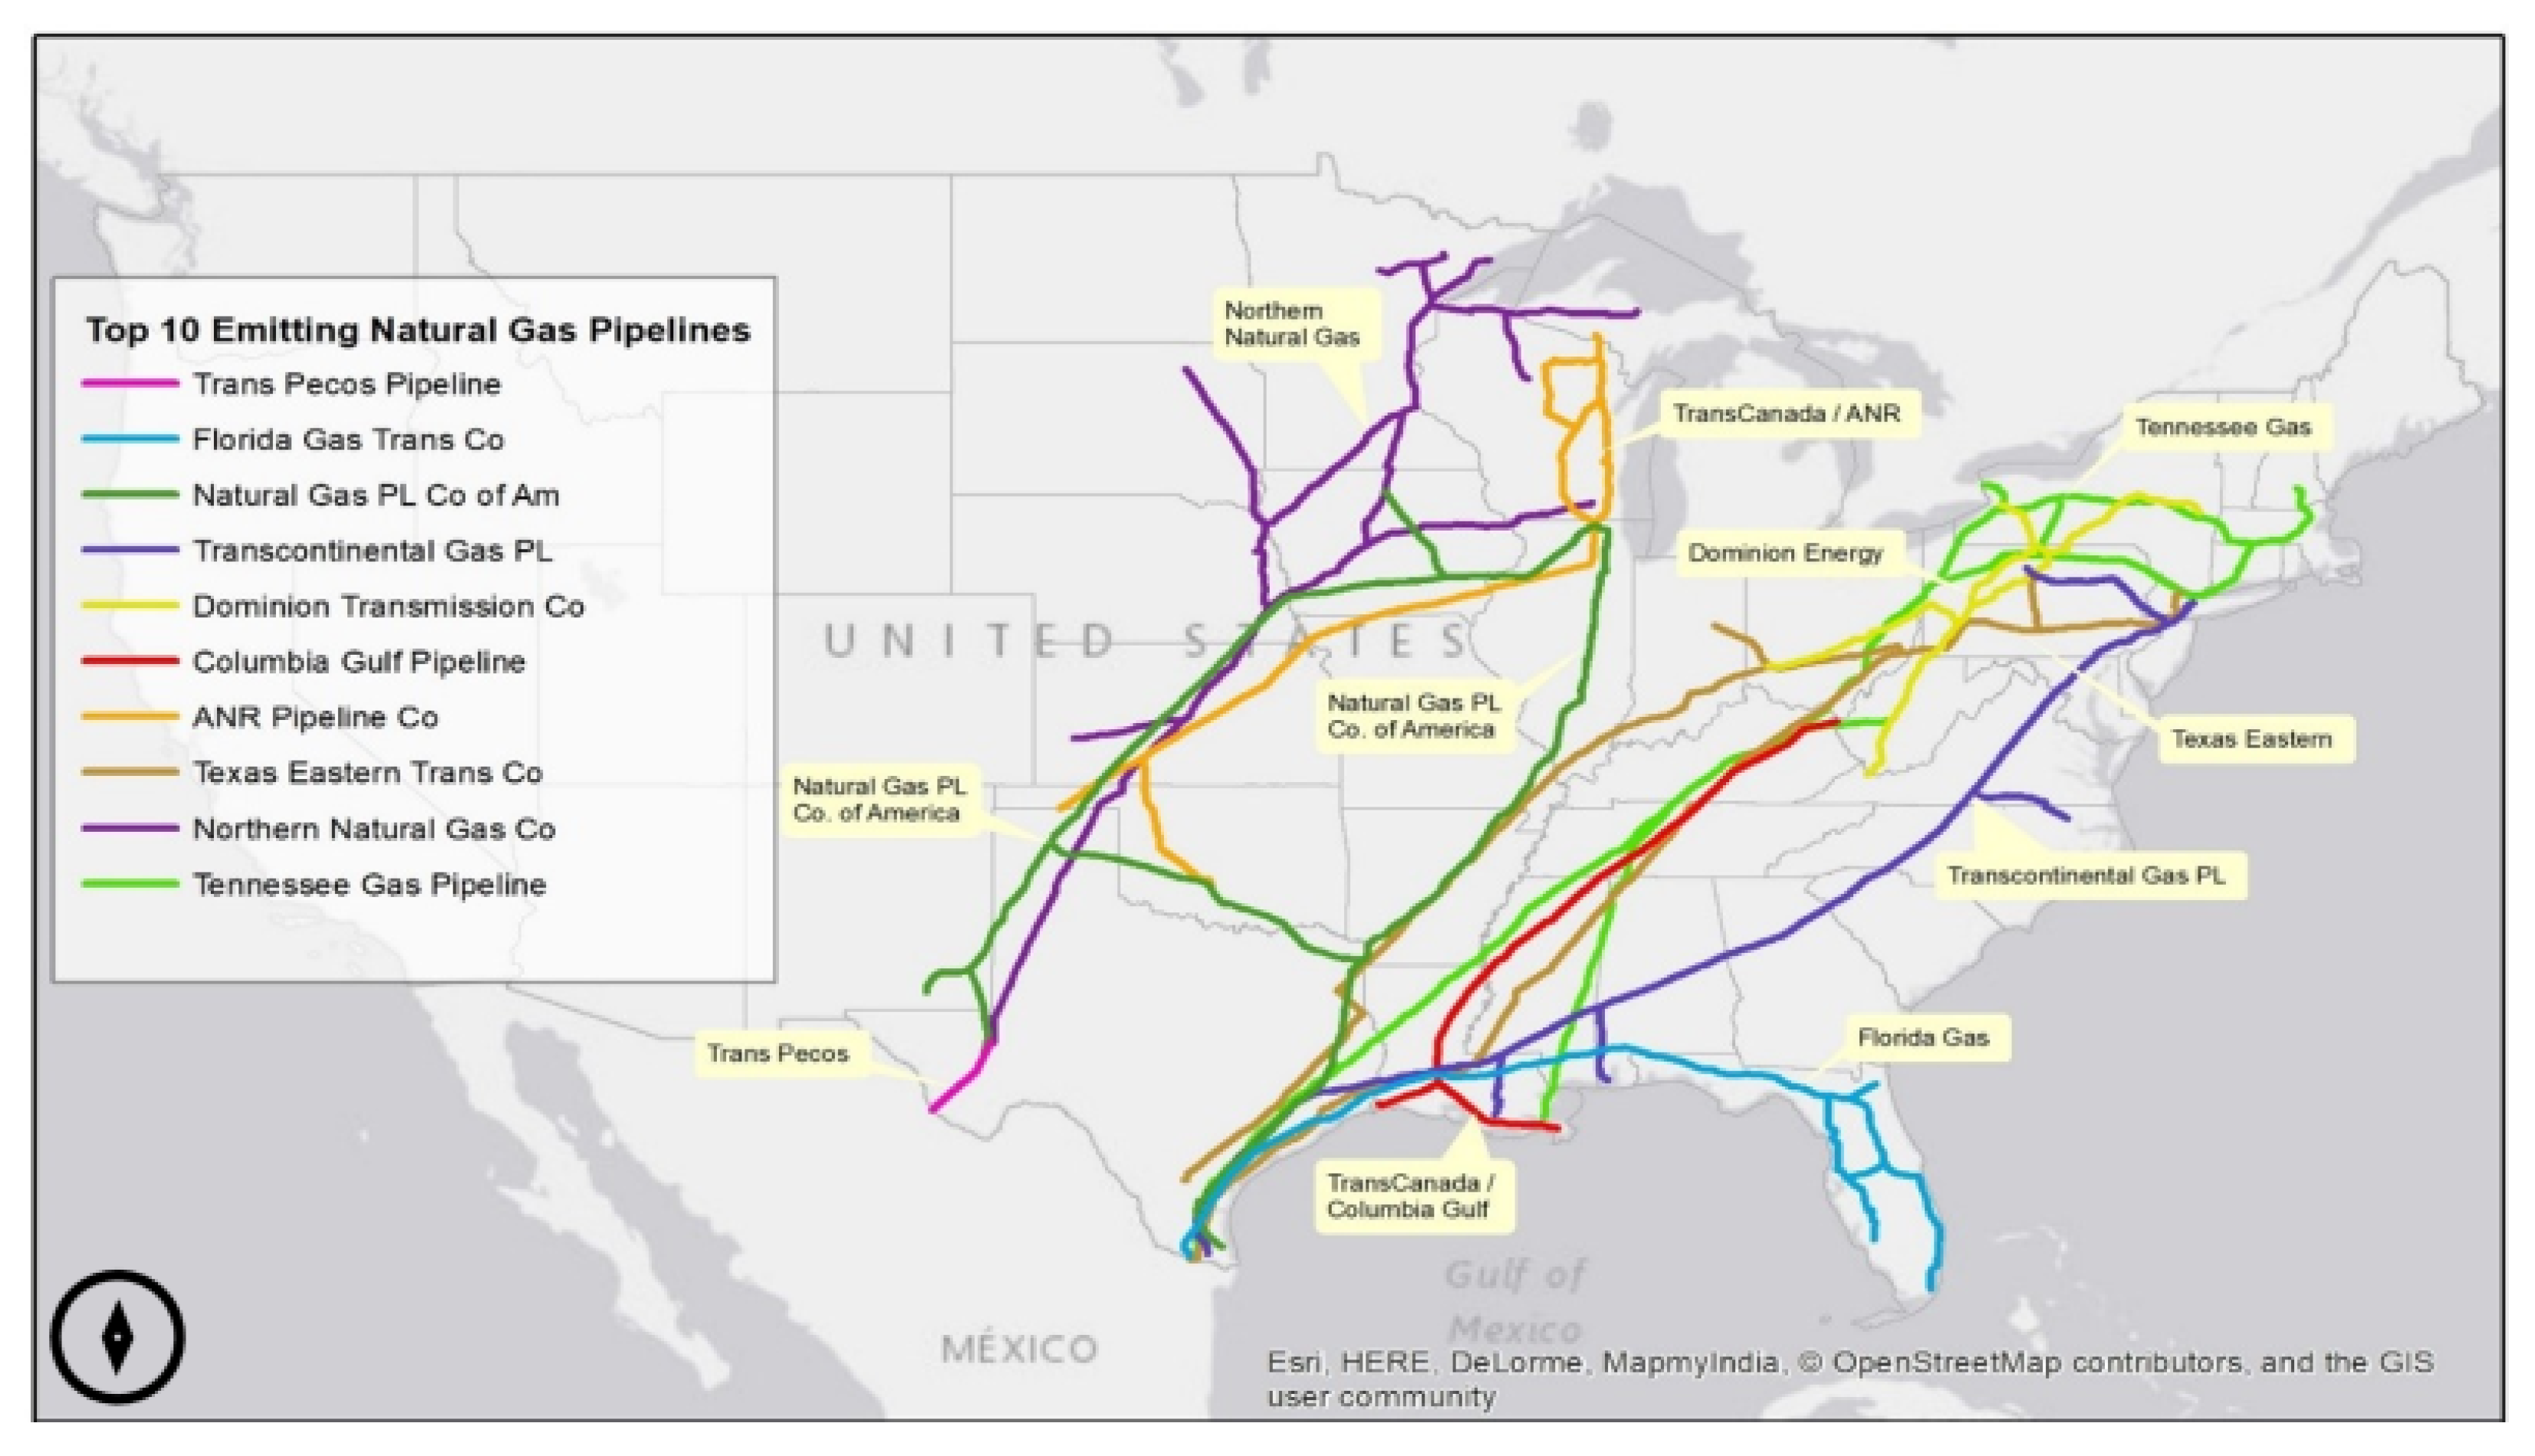
| Transport | Transcontinental Gas Pipeline (Williams) | 310,261,456 |
| Dominion Energy Transmission | 218,402,016 | |
| Tennessee Gas Pipeline Co. LLC (Kinder Morgan) | 189,107,413 | |
| Columbia Gulf Transmission (TransCanada) | 144,409,674 | |
| Natural Gas Pipeline Co. of America LLC (Kinder Morgan) | 104,712,239 | |
| ANR Pipeline (TransCanada) | 104,099,910 | |
| Northern Natural Gas (Berkshire Hathaway) | 84,778,381 | |
| Columbia Gas Transmission (TransCanada) | 74,956,511 | |
| Florida Gas Transmission Co. LLC (Kinder Morgan) | 52,743,007 | |
| Trans-Pecos Pipeline LLC | 4,035,443 | |
| Total | 1,287,506,052 | |
| End Use/Product Sale | W. A. Parish Generating Station | 14,491,668 |
| West County Energy Center | 7,167,296 | |
| Plant McDonough-Atkinson | 6,180,554 | |
| Martin Power Plant | 5,265,279 | |
| Richmond County Combustion Turbine Plant | 5,177,764 | |
| Hines Energy Complex | 5,026,094 | |
| Plant H. Allen Franklin | 4,553,304 | |
| Ninemile Point Power Plant | 4,118,889 | |
| Forney Power Plant | 4,098,711 | |
| Sanford Power Plant | 3,981,203 | |
| Total | 60,060,762 | |
| Industry Total | 1,418,173,782 |
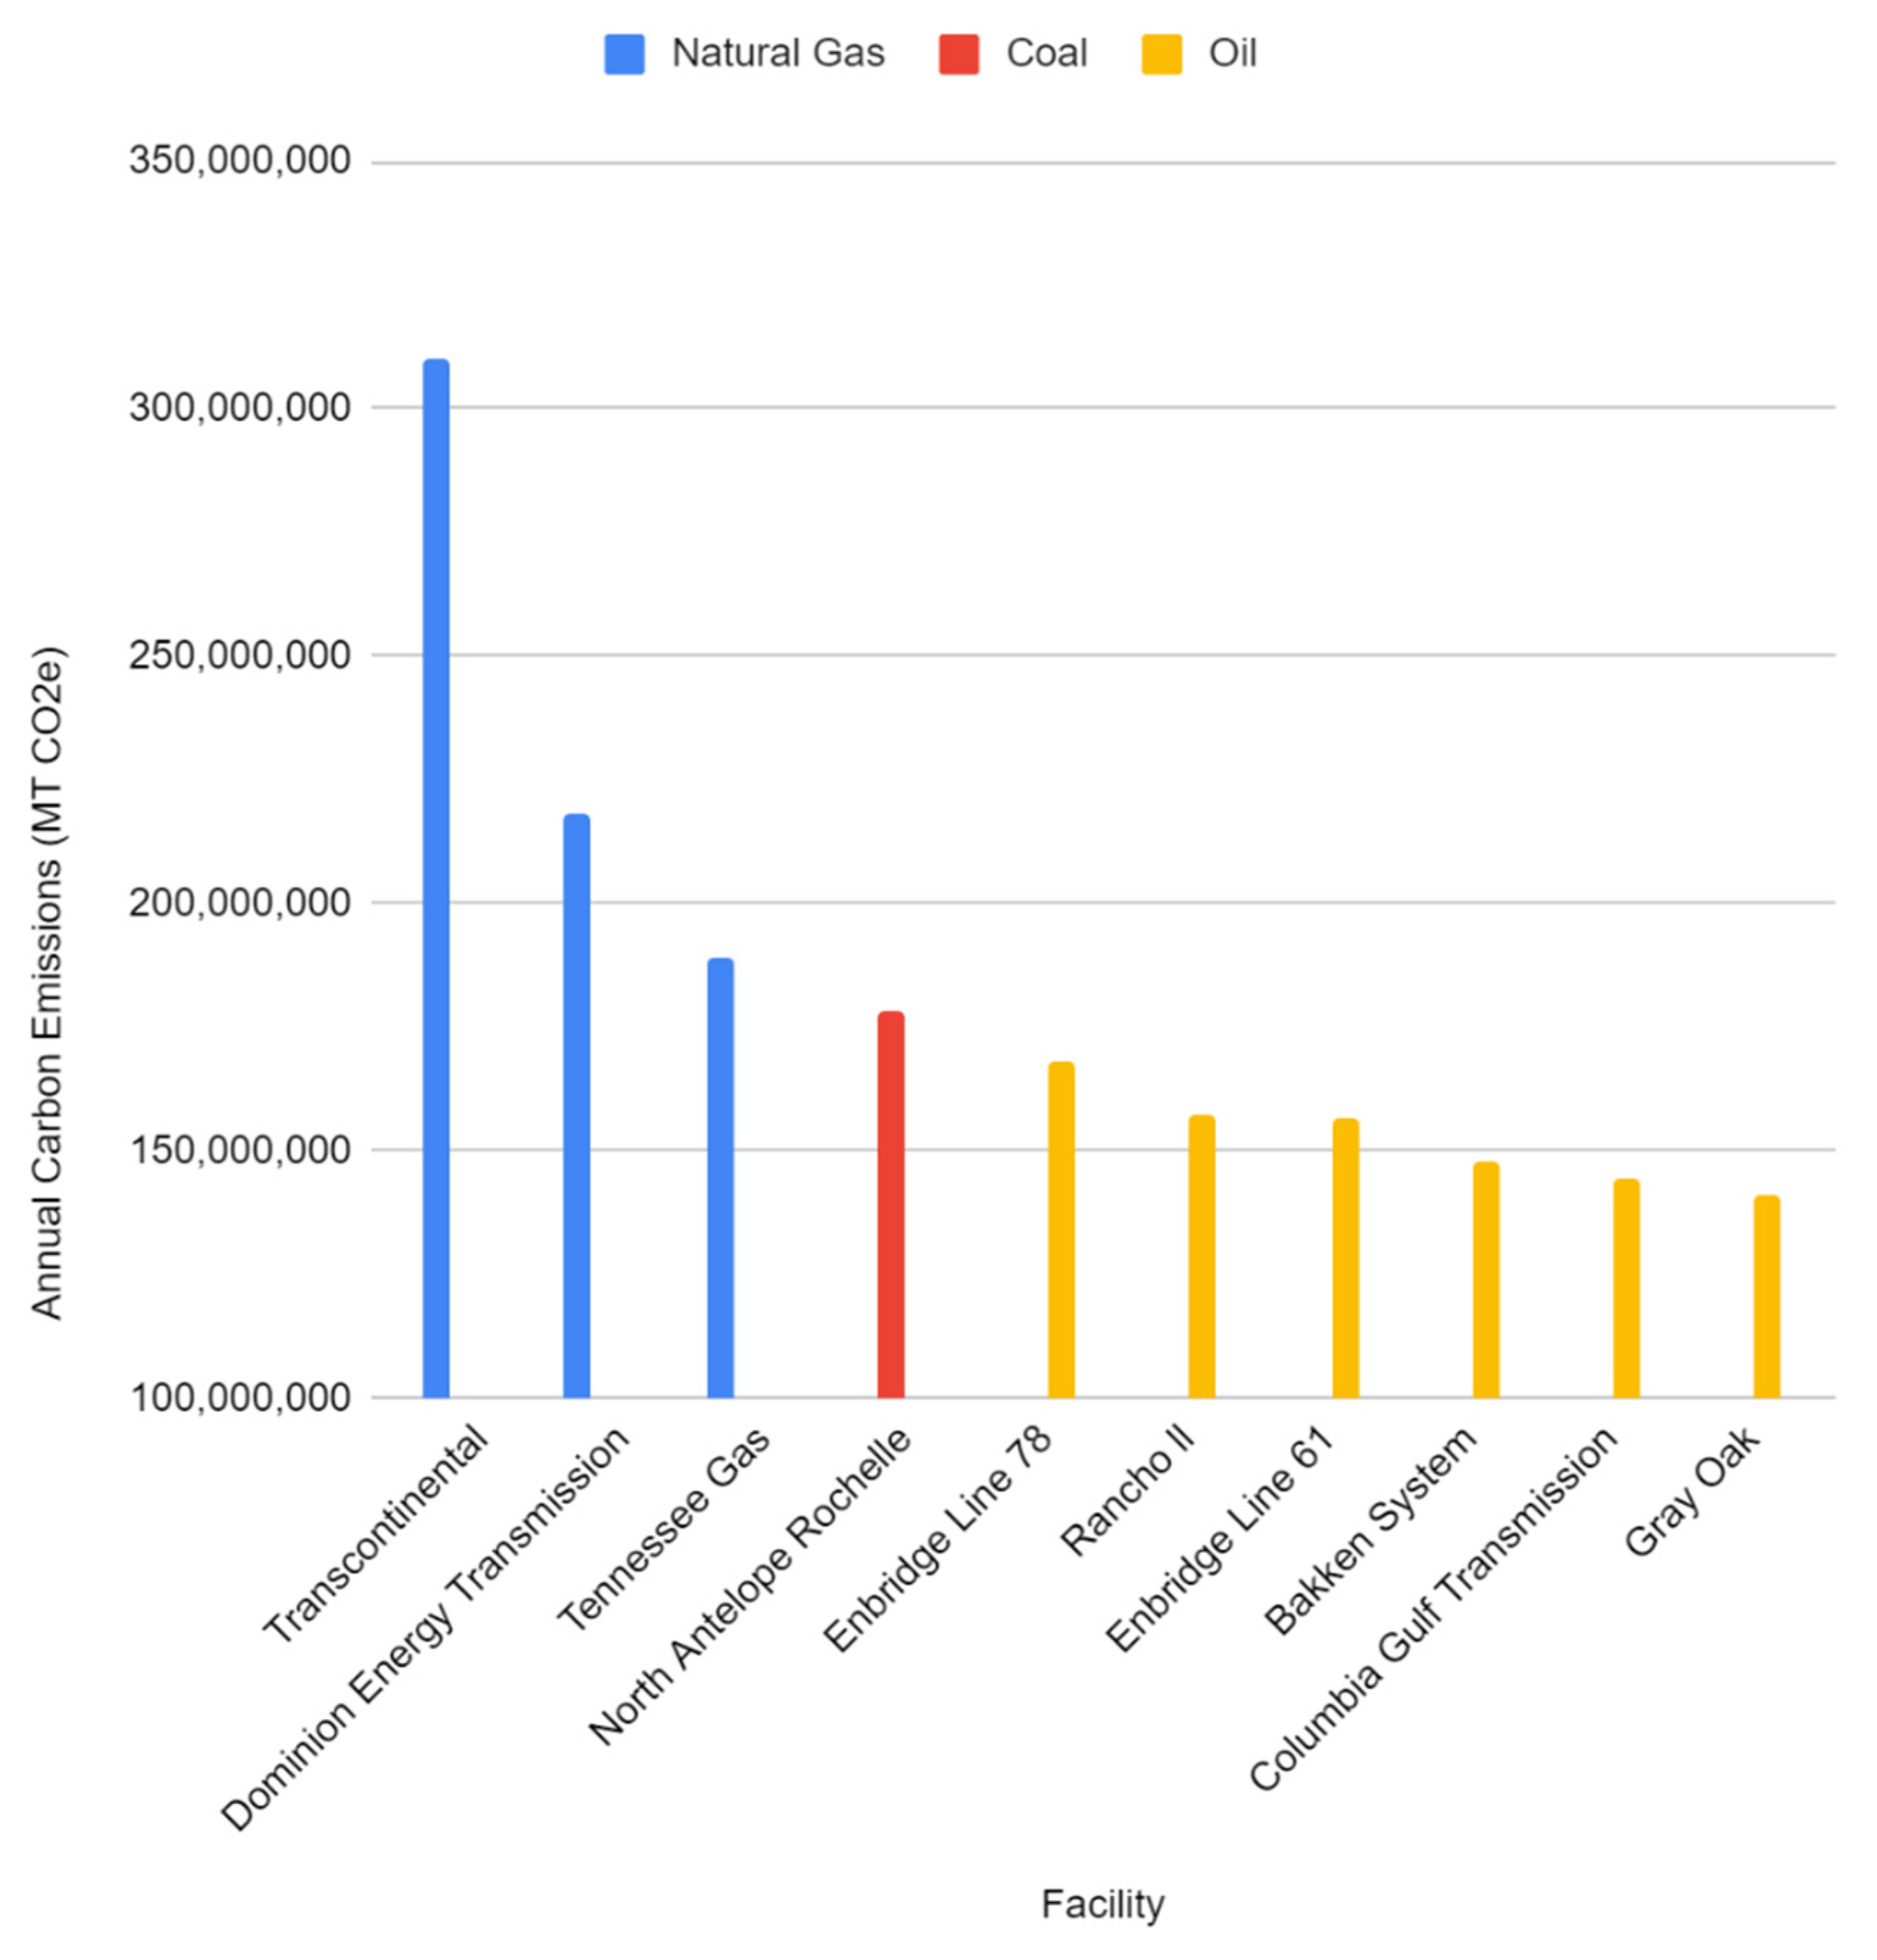
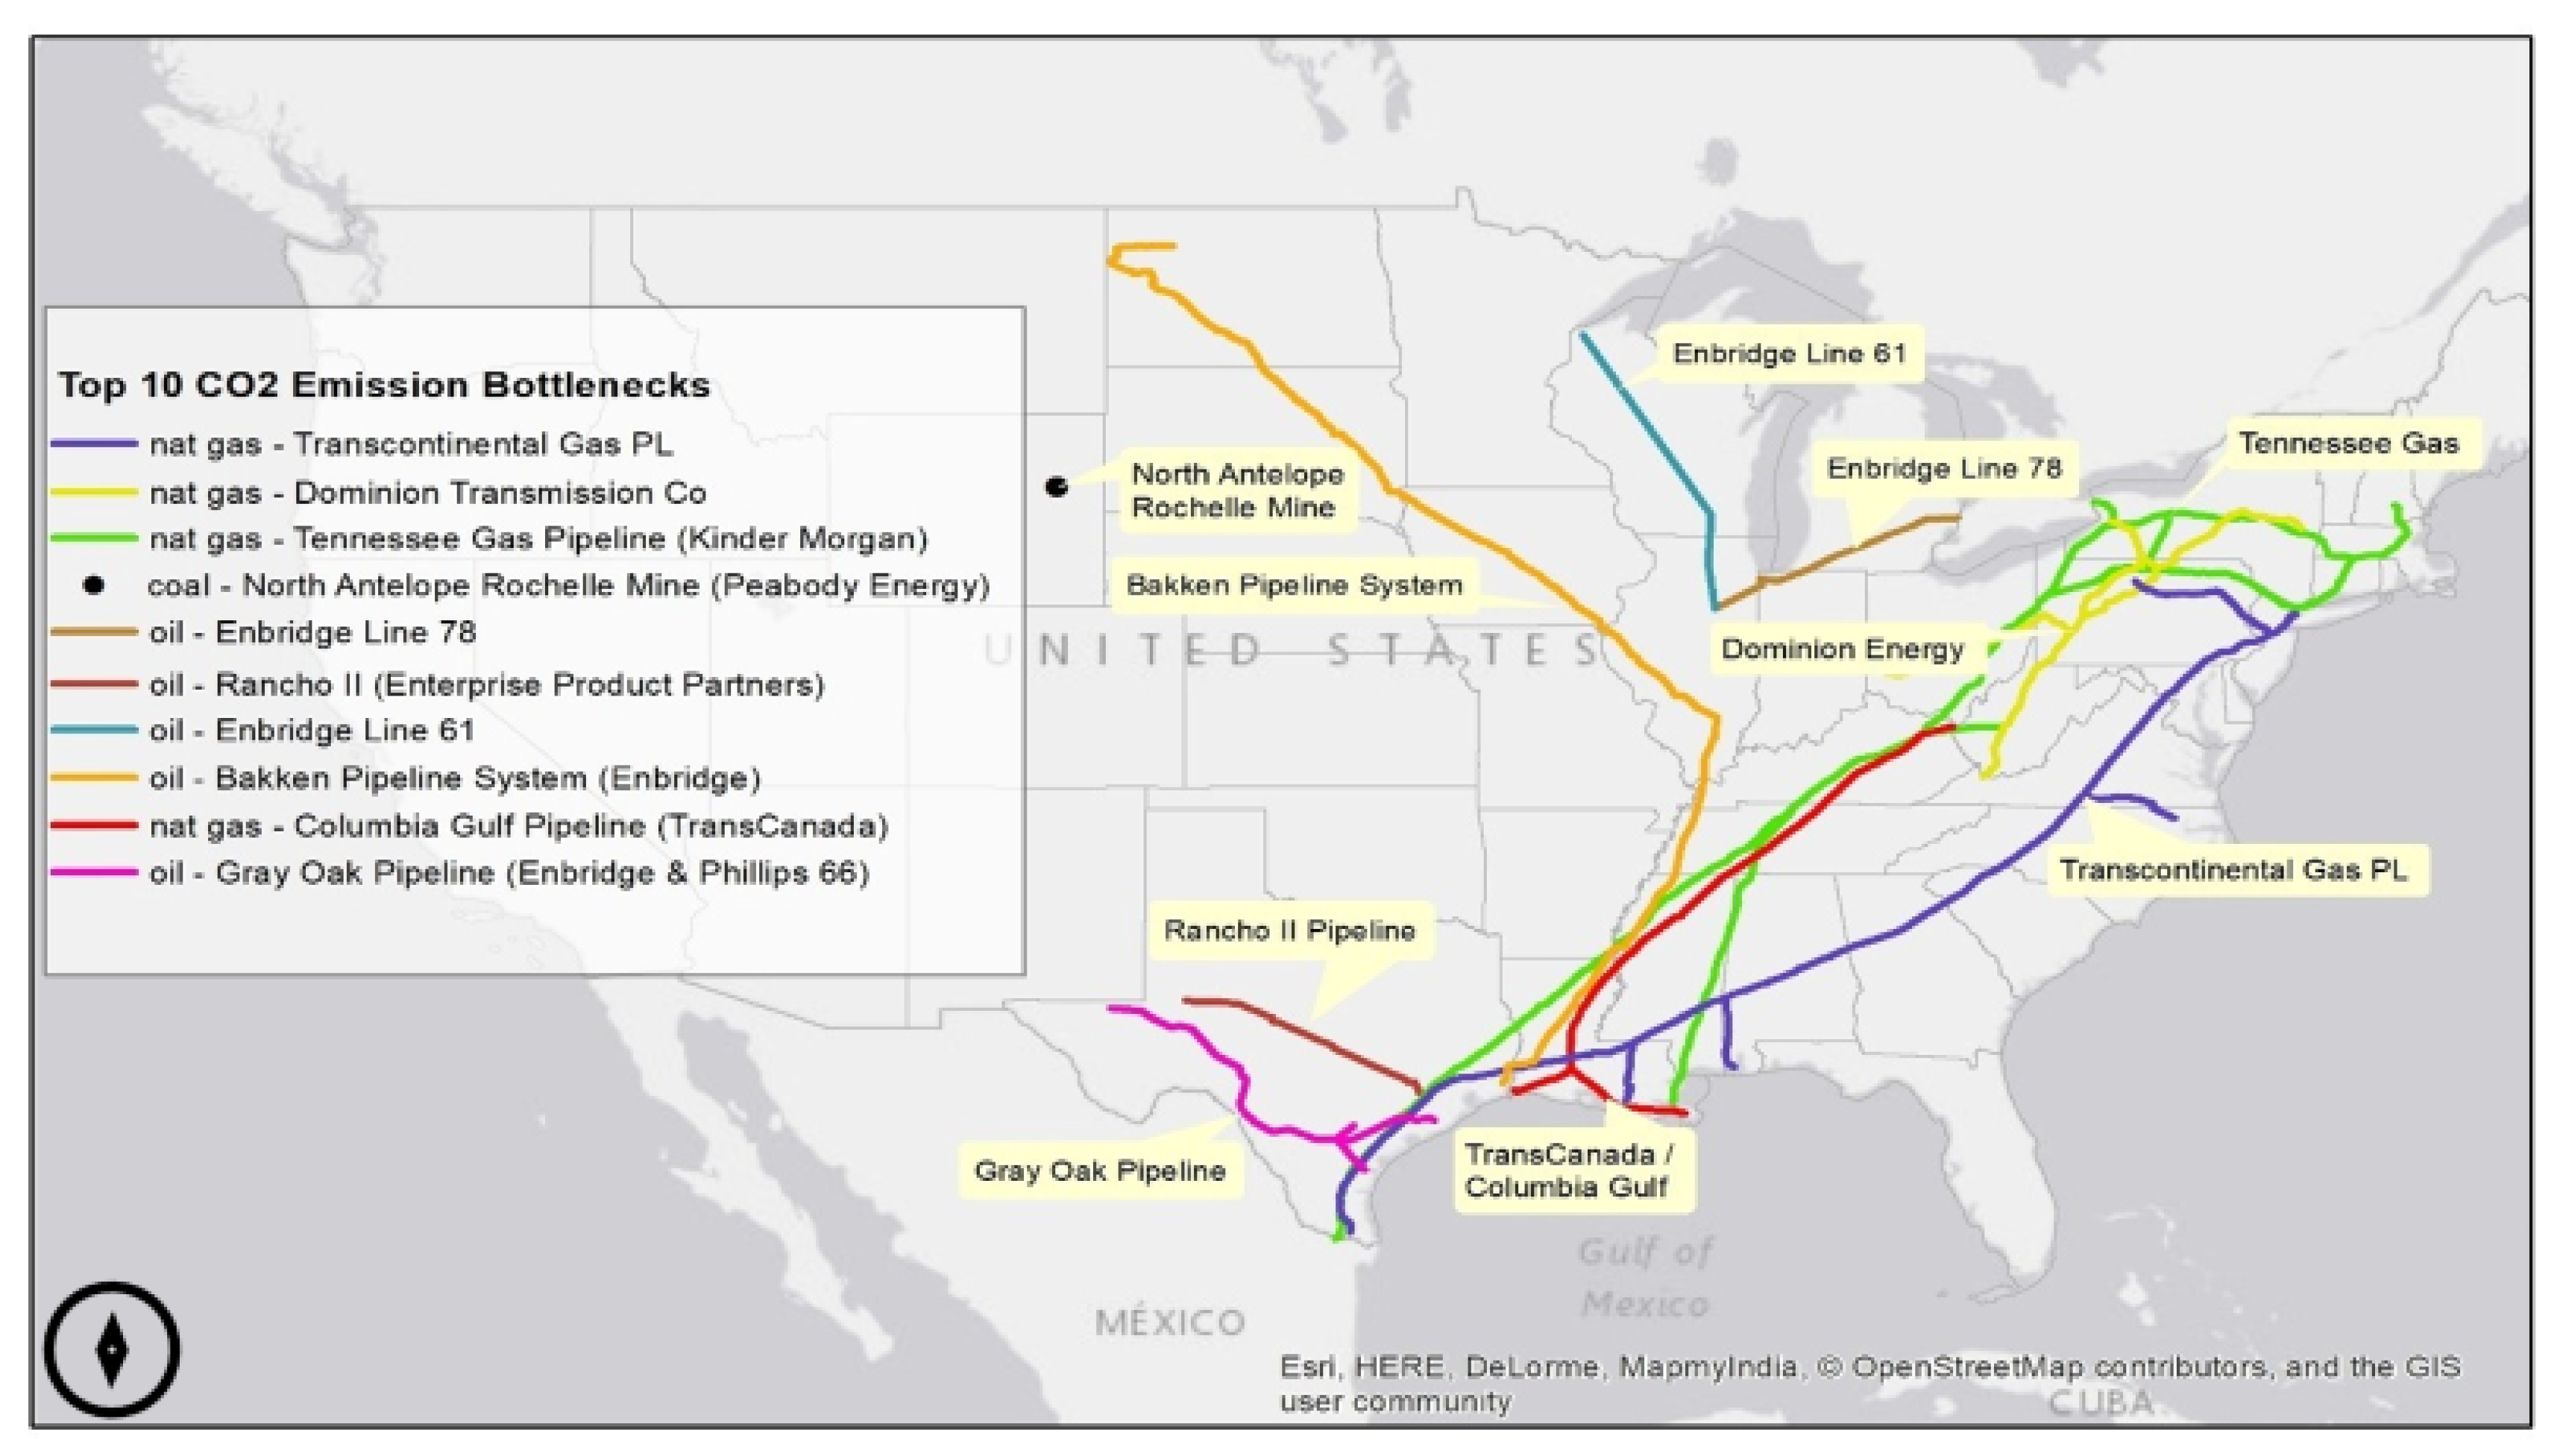
| Facility | Annual CO2 Emissions (MT CO2 e) |
|---|---|
| Transcontinental Gas Pipeline (Williams) | 310,261,456 |
| Dominion Energy Transmission | 218,402,016 |
| Tennessee Gas Pipeline Co. LLC (Kinder Morgan) | 189,107,413 |
| North Antelope Rochelle Mine (Peabody Energy) | 178,541,482 |
| Enbridge Line 78 | 167,936,500 |
| Rancho ll Pipeline (Enterprise Product Partners) | 156,950,000 |
| Enbridge Line 61 | 156,322,200 |
| Bakken Pipeline System (Enbridge) | 147,544,000 |
| Columbia Gulf Transmission (TransCanada) | 144,409,674 |
| Gray Oak Pipeline (Enbridge & Phillips 66) | 141,255,000 |
| Total | 1,967,679,741 |
References
- Hansen, J.; Kharecha, P.; Sato, M.; Masson-Delmotte, V.; Ackerman, F.; Beerling, D.J.; Hearty, P.J.; Hoegh-Guldberg, O.; Hsu, S.-L.; Parmesan, C.; et al. Assessing Dangerous Climate Change: Required Reduction of Carbon Emissions to Protect Young People, Future Generations and Nature. PLoS ONE 2013, 8, e81648. [Google Scholar] [CrossRef]
- Ripple, W.J.; Wolf, C.; Newsome, T.M.; Galetti, M.; Alamgir, M.; Crist, E.; Mahmoud, M.I.; Laurance, W.F. World Scientists’ Warning to Humanity: A Second Notice. BioScience 2017, 67, 1026–1028. [Google Scholar] [CrossRef]
- Pachauri, R.K.; Allen, M.R.; Barros, V.R.; Broome, J.; Cramer, W.; Christ, R.; Church, J.A.; Clarke, L.; Dahe, Q.; Dasgupta, P.; et al. Climate Change 2014: Synthesis Report. Contribution of Working Groups I, II and III to the Fifth Assessment Report of the Intergovernmental Panel on Climate Change; Pachauri, R., Meyer, L., Eds.; IPCC: Geneva, Switzerland, 2014; p. 151. ISBN 978/92/9169/143/2. [Google Scholar]
- Moss, R.H.; Edmonds, J.A.; Hibbard, K.A.; Manning, M.R.; Rose, S.K.; Van Vuuren, D.; Carter, T.R.; Emori, S.; Kainuma, M.; Kram, T.; et al. The next generation of scenarios for climate change research and assessment. Nature 2010, 463, 747–756. [Google Scholar] [CrossRef]
- Stern, N. The Economics of Climate Change: The Stern Review; Cambridge University Press: Cambridge, UK, 2007; ISBN 978/0/521/70080/1. [Google Scholar]
- Dhainaut, J.F.; Claessens, Y.-E.; Ginsburg, C.; Riou, B. Unprecedented heat-related deaths during the 2003 heat wave in Paris: Consequences on emergency departments. Crit. Care 2003, 8, 1. [Google Scholar] [CrossRef]
- Poumadere, M.; Mays, C.; Le Mer, S.; Blong, R. The 2003 Heat Wave in France: Dangerous Climate Change Here and Now. Risk Anal. 2005, 25, 1483–1494. [Google Scholar] [CrossRef]
- Fouillet, A.; Rey, G.; Laurent, F.; Pavillon, G.; Bellec, S.; Guihenneuc-Jouyaux, C.; Clavel, J.; Jougla, E.; Hémon, D.; Ghihenneuc-Jouyaux, C. Excess mortality related to the August 2003 heat wave in France. Int. Arch. Occup. Environ. Health 2006, 80, 16–24. [Google Scholar] [CrossRef] [PubMed]
- D’Amato, G.; Cecchi, L. Effects of climate change on environmental factors in respiratory allergic diseases. Clin. Exp. Allergy 2008, 38, 1264–1274. [Google Scholar] [CrossRef] [PubMed]
- Gislason, A.; Gorsky, G. (Eds.) Proceedings of the Joint ICES/CIESM Workshop to Compare Zooplankton Ecology and Methodologies between the Mediterranean and the North Atlantic (WKZEM); ICES, International Council for the Exploration of the Sea: Copenhagen, Denmark, 2010. [Google Scholar]
- Parry, M.; Rosenzweig, C.; Iglesias, A.; Livermore, M.; Fischer, G. Effects of climate change on global food production under SRES emissions and socio-economic scenarios. Glob. Environ. Chang. 2004, 14, 53–67. [Google Scholar] [CrossRef]
- Parry, M.; Rosenzweig, C.; Livermore, M. Climate change, global food supply and risk of hunger. Philos. Trans. R. Soc. B Boil. Sci. 2005, 360, 2125–2138. [Google Scholar] [CrossRef] [PubMed]
- Schmidhuber, J.; Tubiello, F.N. Global food security under climate change. Proc. Natl. Acad. Sci. USA 2007, 104, 19703–19708. [Google Scholar] [CrossRef] [PubMed]
- Vine, E. Adaptation of California’s electricity sector to climate change. Clim. Chang. 2011, 111, 75–99. [Google Scholar]
- Val, D.V.; Yurchenko, D.; Nogal, M.; O’Connor, A. Chapter Seven—Climate Change-Related Risks and Adaptation of Interdependent Infrastructure Systems. In Climate Adaptation Engineering; Bastidas-Arteaga, E., Stewar, M.G., Eds.; Butterworth-Heinemann: Oxford, UK, 2019; pp. 207–242. ISBN 978/0/12/816782/3. [Google Scholar]
- Dai, A. Drought under global warming: A review. Wiley Interdiscip. Rev. Clim. Chang. 2010, 2, 45–65. [Google Scholar] [CrossRef]
- Diffenbaugh, N.S.; Swain, D.L.; Touma, D. Anthropogenic warming has increased drought risk in California. Proc. Natl. Acad. Sci. USA 2015, 112, 3931–3936. [Google Scholar] [CrossRef] [PubMed]
- Mann, M.E.; Gleick, P.H. Climate change and California drought in the 21st century. Proc. Natl. Acad. Sci. USA 2015, 112, 3858–3859. [Google Scholar] [CrossRef]
- Dale, V.H.; Joyce, L.A.; Mcnulty, S.; Neilson, R.P.; Ayres, M.P.; Flannigan, M.D.; Hanson, P.J.; Irland, L.C.; Lugo, A.E.; Peterson, C.J.; et al. Climate Change and Forest Disturbances. BioScience 2001, 51, 723. [Google Scholar] [CrossRef]
- Amiro, B.; Stocks, B.J.; Alexander, M.; Flannigan, M.D.; Wotton, M. Fire, climate change, carbon and fuel management in the Canadian boreal forest. Int. J. Wildland Fire 2001, 10, 405. [Google Scholar] [CrossRef]
- Flannigan, M.; Stocks, B.; Turetsky, M.; Wotton, M. Impacts of climate change on fire activity and fire management in the circumboreal forest. Glob. Chang. Boil. 2009, 15, 549–560. [Google Scholar] [CrossRef]
- Moorhead, K.K.; Brinson, M.M. Response of Wetlands to Rising Sea Level in the Lower Coastal Plain of North Carolina. Ecol. Appl. 1995, 5, 261–271. [Google Scholar] [CrossRef]
- Frihy, O.E. The Nile delta-Alexandria coast: Vulnerability to sea-level rise, consequences and adaptation. Mitig. Adapt. Strat. Glob. Chang. 2003, 8, 115–138. [Google Scholar] [CrossRef]
- Bobba, A.G. Numerical modelling of salt-water intrusion due to human activities and sea-level change in the Godavari Delta, India. Hydrol. Sci. J. 2002, 47 (Suppl. S1), S67–S80. [Google Scholar] [CrossRef]
- Nicholls, R.J.; Hoozemans, F.; Marchand, M. Increasing flood risk and wetland losses due to global sea-level rise: Regional and global analyses. Glob. Environ. Chang. 1999, 9, S69–S87. [Google Scholar] [CrossRef]
- DeSantis, L.R.G.; Bhotika, S.; Williams, K.; Putz, F.E. Sea-level rise and drought interactions accelerate forest decline on the Gulf Coast of Florida, USA. Glob. Chang. Boil. 2007, 13, 2349–2360. [Google Scholar] [CrossRef]
- Allen, C.D.; Macalady, A.K.; Chenchouni, H.; Bachelet, D.; McDowell, N.; Vennetier, M.; Kitzberger, T.; Rigling, A.; Breshears, D.D.; Hogg, E.H.; et al. A global overview of drought and heat-induced tree mortality reveals emerging climate change risks for forests. For. Ecol. Manag. 2010, 259, 660–684. [Google Scholar] [CrossRef]
- Carnicer, J.; Coll, M.; Ninyerola, M.; Pons, X.; Sánchez, G.; Penuelas, J. Widespread crown condition decline, food web disruption, and amplified tree mortality with increased climate change-type drought. Proc. Natl. Acad. Sci. USA 2011, 108, 1474–1478. [Google Scholar] [CrossRef] [PubMed]
- Grossman, D. Warming up to a not-so-radical idea: Tort-based climate change litigation. Columbia J. Environ. Law 2003, 1, 1–62. [Google Scholar]
- Allen, M. Liability for climate change. Nature 2003, 421, 891–892. [Google Scholar] [CrossRef]
- Healy, K.; Tapick, J. Climate Change: It’s Not Just a Policy Issue for Corporate Counsel—It’s a Legal Problem. Columia J. Environ. Law 2004, 89, 1–23. [Google Scholar]
- Hancock, E. Red Dawn, Blue Thunder, Purple Rain: Corporate Risk of Liability for Global Climate Change and the SEC Disclosure Dilemma. Georget. Environ. Law Rev. 2005, 17, 233–251. [Google Scholar]
- Farber, D.A. Basic Compensation for the Victims of Climate Change. Univ. Pa. Law Rev. 2007, 155, 1605–1656. [Google Scholar] [CrossRef][Green Version]
- Kilinsky, J. International climate change liability: A myth or a reality. J. Transit. Law. Policy 2008, 18, 377. [Google Scholar]
- Farber, D.A. Tort Law in the Era of Climate Change, Katrina and 9/11: Exploring Liability for Extraordinary Risks. SSRN Electron. J. 2008, 43, 1075. [Google Scholar] [CrossRef]
- Farber, D.A. Apportioning Climate Change Costs. UCLA J. Environ. Law Policy 2008, 26, 21. [Google Scholar]
- Farber, D.A. The case for climate compensation justice for climate change victims in a complex world. Utah Law Rev. 2008, 2, 377–413. [Google Scholar]
- Preston, B.J. The influence of climate change litigation on governments and the private sector. Clim. Law 2011, 2, 485–513. [Google Scholar] [CrossRef]
- Williams, C.A. Disclosure of Information Concerning Climate Change: Liability Risks and Opportunities; Commonwealth Climate and Law Initiative: Oxford, UK, 2018. [Google Scholar]
- Heidari, N.; Pearce, J.M. A review of greenhouse gas emission liabilities as the value of renewable energy for mitigating lawsuits for climate change related damages. Renew. Sustain. Energy Rev. 2016, 55, 899–908. [Google Scholar] [CrossRef]
- Bang, A.; Holle, M.-L. Making Legal History: State Liability for Negligence in Climate Change; Social Science Research Network: Rochester, NY, USA, 2019. [Google Scholar]
- Lawlor, A.; Gravelle, T.B. Framing trans-border energy transportation: The case of Keystone XL. Environ. Polit. 2018, 27, 666–685. [Google Scholar] [CrossRef]
- Wood, T. The many voices of business: Framing the Keystone pipeline in US and Canadian news. Journalism 2017, 20, 292–312. [Google Scholar] [CrossRef]
- Diotalevi, R.N.; Burhoe, S. Native American Lands and the Keystone Pipeline Expansion: A Legal Analysis. Indig. Policy J. 2017, 27. [Google Scholar] [CrossRef]
- Zhang, Q. Legal Options to Stop the Revival of Keystone XL Pipeline. Environ. Claims J. 2019, 1–20. [Google Scholar] [CrossRef]
- U.S. EPA. Facility Level GHG Emissions Data 2018. Available online: http://ghgdata.epa.gov/ghgp/main.do (accessed on 19 February 2020).
- U.S. Energy Information Administration (EIA). Coal Data Browser 2018. Available online: https://www.eia.gov/coal/data/browser/ (accessed on 5 June 2020).
- U.S. Energy Information Administration (EIA). Liquids Pipeline Projects Database 2019. Available online: https://www.eia.gov/todayinenergy/detail.php?id=42356 (accessed on 5 June 2020).
- Enbridge’s Energy Infrastructure Assets Report. April 2020. Available online: https://www.enbridge.com/~/media/Enb/Documents/Factsheets/FS_EnergyInfrastructureAssets.pdf?la=en (accessed on 17 April 2020).
- U.S. Environmental Protection Agency (EPA). Greenhouse Gases Equivalencies Calculator—Calculations and References. Available online: https://www.epa.gov/energy/greenhouse-gases-equivalencies-calculator-calculations-and-references (accessed on 1 April 2020).
- U.S. Energy Information Administration (EIA). Monthly Energy Review (Rep.). 2020. Available online: https://www.eia.gov/totalenergy/data/monthly/pdf/mer.pdf (accessed on 5 June 2020).
- U.S. Environmental Protection Agency (EPA). PDF (Methodology and Data for Estimating CO2 Emissions from Fossil Fuel Combustion). 2019. Available online: https://www.epa.gov/sites/production/files/2019-04/documents/us-ghg-inventory-2019-annex-2-emissions-fossil-fuel-combustion.pdf (accessed on 5 June 2020).
- Intergovernmental Panel on Climate Change (IPCC). Guidelines for National Greenhouse Gas Inventories. 2006. Volume 2 (Energy). Available online: https://www.ipcc-nggip.iges.or.jp/public/2006gl/pdf/2_Volume2/V2_2_Ch2_Stationary_Combustion.pdf (accessed on 5 June 2020).
- U.S. Energy Information Administration (EIA). Independent Statistics and Analysis. 2019. Available online: https://www.eia.gov/energyexplained/natural-gas/natural-gas-and-the-environment.php (accessed on 28 April 2020).
- EPA’s Overview of Greenhouse Gases. 2020. Available online: https://www.epa.gov/ghgemissions/overview-greenhouse-gases (accessed on 28 April 2020).
- Jackson, R.B.; Down, A.; Phillips, N.G.; Ackley, R.; Cook, C.W.; Plata, D.L.; Zhao, K. Natural Gas Pipeline Leaks Across Washington, DC. Environ. Sci. Technol. 2014, 48, 2051–2058. [Google Scholar] [CrossRef]
- U.S. Energy Information Administration (EIA). Independent Statistics and Analysis. 2019. Available online: https://www.eia.gov/energyexplained/natural-gas/ (accessed on 28 April 2020).
- Kovats, S.; Depledge, M.; Haines, A.; Fleming, L.E.; Wilkinson, P.; Shonkoff, S.B.; Scovronick, N. The health implications of fracking. Lancet 2014, 383, 757–758. [Google Scholar] [CrossRef]
- EPA’s Study of Hydraulic Fracturing for Oil and Gas and Its Potential Impact on Drinking Water Resources. 2020. Available online: https://www.epa.gov/hfstudy (accessed on 28 April 2020).
- Gordalla, B.C.; Ewers, U.; Frimmel, F.H. Hydraulic fracturing: A toxicological threat for groundwater and drinking-water? Environ. Earth Sci. 2013, 70, 3875–3893. [Google Scholar] [CrossRef]
- Williams Companies. Transco Overview. Available online: https://www.williams.com/pipeline/transco/ (accessed on 19 May 2020).
- Schroeder, C.H. Corrective Justice and Liability for Increasing Risks. UCLA Law Rev. 1990, 37, 439–478. [Google Scholar]
- Lipanovich, A. Smoke before Oil: Modeling a Suit against the Auto and Oil Industry on the Tobacco Tort Litigation is Feasible. Gold. Gate Univ. Law Rev. 2005, 35, 429–489. [Google Scholar]
- Tietenberg, T.H. Economic Instruments for Environmental Regulation. Oxf. Rev. Econ. Policy 1990, 6, 17–33. [Google Scholar] [CrossRef]
- Ross, C.M.; Evan, M.; Hecht, S. Limiting Liability in the Greenhouse: Insurance Risk-Management Strategies in the Context of Global Climate Change. Stanf. Environ. Law J. 2007, 26, 252–317. [Google Scholar]
- Schwarze, R. Liability for Climate Change: The Benefits, the Costs, and the Transaction Costs. Univ. Pa. Law Rev. 2007, 155, 1947–1952. [Google Scholar]
- Lin, A.C. Beyond Tort: Compensating Victims of Environmental Toxic Injury. South. Calif. Law Rev. 2005, 78, 1439–1528. [Google Scholar]
- Heine, D.; Faure, M.G.; Dominioni, G. The Polluter-Pays Principle in Climate Change Law: An Economic Appraisal. Clim. Law 2020, 10, 94–115. [Google Scholar] [CrossRef]
- U.S. EPA. Superfund: CERCLA Overview. 2018. Available online: https://www.epa.gov/superfund/superfund-cercla-overview (accessed on 1 May 2020).
- Bennett & Wells; Baue, W. Global Warming Shareowner Resolution Filed at “Filthy Five” Electric Companies, SOCIALFUNDS; Supra Note 47, at 2. Available online: http://www.socialfunds.com/news/article.cgi/1008.html (accessed on 17 January 2003).
- Radevsky, R.; Scott, D. Pipeline Insurance—Technical Aspects of Underwriting and Claims. In Conference on Terrain and Geohazard Challenges Facing Onshore Oil and Gas Pipelines; Institution of Civil Engineers: London, UK, 2004. [Google Scholar]
- Allianz Group and WWF. Climate Change & the Financial Sector: An Agenda for Action (Rep.). June 2005. Available online: https://wwfeu.awsassets.panda.org/downloads/wwfallianzclimatechangereportjune2005.pdf (accessed on 1 July 2020).
- Pidot, J.R. Global Warming in the Courts: An Overview of Current Litigation and Common Legal Issues; Georgetown Environmental Law & Policy Institute: Washington DC, NJ, USA, 2006; Available online: https://ssrn.com/abstract=1695720 (accessed on 1 May 2020).
- Zhuge, C.; Wei, B.; Dong, C.; Shao, C.; Shan, Y. Exploring the future electric vehicle market and its impacts with an agent-based spatial integrated framework: A case study of Beijing, China. J. Clean. Prod. 2019, 221, 710–737. [Google Scholar] [CrossRef]
- Zhou, Y.; Wang, M.; Johnson, L.; Wang, H.; Hao, H. Plug-in electric vehicle market penetration and incentives: A global review. Mitig. Adapt. Strat. Glob. Chang. 2014, 20, 777–795. [Google Scholar] [CrossRef]
- Noori, M.; Tatari, O. Development of an agent-based model for regional market penetration projections of electric vehicles in the United States. Energy 2016, 96, 215–230. [Google Scholar] [CrossRef]
- Zhang, Q.; Ou, X.; Yan, X.; Zhang, X. Electric Vehicle Market Penetration and Impacts on Energy Consumption and CO2 Emission in the Future: Beijing Case. Energies 2017, 10, 228. [Google Scholar] [CrossRef]
- Beiter, P.; Musial, W.; Smith, A.; Kilcher, L.; Damiani, R.; Maness, M.; Sirnivas, S.; Stehly, T.; Gevorgian, V.; Mooney, M.; et al. A Spatial-Economic Cost-Reduction Pathway Analysis for U.S. Offshore Wind Energy Development from 2015–2030. Off. Sci. Tech. Inf. 2016. [Google Scholar] [CrossRef]
- Nemet, G.F. How Solar Energy Became Cheap: A Model for Low-Carbon Innovation; Routledge: Abingdon, UK, 2019. [Google Scholar]
- Solomon, T. Renewable Energy is Cheaper than Fossil Fuels. California Proves It. Indig. Policy J. 2019, 30. [Google Scholar]
- Kåberger, T. Progress of renewable electricity replacing fossil fuels. Glob. Energy Interconnect. 2018, 1, 48–52. [Google Scholar]
- British Petroleum (BP). Peak Oil Demand and Long-Run Oil Prices (Rep.). 2020. Available online: http://www.aspo.be/wpcontent/uploads/2019/03/bp_peak_oil_demand_2018.pdf (accessed on 15 June 2020).
- British Plastics Federation. Oil Consumption. 2019. Available online: https://www.bpf.co.uk/press/oil_consumption.aspx (accessed on 15 June 2020).
- Geyer, R.; Jambeck, J.R.; Law, K.L. Production, use, and fate of all plastics ever made. Sci. Adv. 2017, 3, e1700782. [Google Scholar] [CrossRef]
- Cruz Sanchez, F.A.; Boudaoud, H.; Camargo, M.; Pearce, J.M. Plastic recycling in additive manufacturing: A systematic literature review and opportunities for the circular economy. J. Clean. Prod. 2020, 264, 121602. [Google Scholar] [CrossRef]
- Dertinger, S.C.; Gallup, N.; Tanikella, N.G.; Grasso, M.; Vahid, S.; Foot, P.J.; Pearce, J.M. Technical pathways for distributed recycling of polymer composites for distributed manufacturing: Windshield wiper blades. Resour. Conserv. Recycl. 2020, 157, 104810. [Google Scholar] [CrossRef]
- Zhong, S.; Pearce, J.M. Tightening the loop on the circular economy: Coupled distributed recycling and manufacturing with recyclebot and RepRap 3-D printing. Resour. Conserv. Recycl. 2018, 128, 48–58. [Google Scholar] [CrossRef]
- Wood, G. Fossil Fuels in a Carbon-Constrained World. In The Palgrave Handbook of Managing Fossil Fuels and Energy Transitions; Wood, G., Baker., K.C., Eds.; Springer International Publishing: Cham, Switzerland, 2020; pp. 3–23. [Google Scholar]
- Hubacek, K.; Baiocchi, G. Fossil Fuel Assets May Turn Toxic. Joule 2018, 2, 1407–1409. [Google Scholar] [CrossRef]
- Intergovernmental Panel on Climate Change (IPCC). Managing the Risks of Extreme Events and Disasters to Advance Climate Change Adaptation. In Changes in Climate Extremes and their Impacts on the Natural Physical Environment; Cambridge University Press: Cambridge, UK, 2010; pp. 109–231. Available online: https://www.ipcc.ch/site/assets/uploads/2018/03/SREX-Chap3_FINAL-1.pdf (accessed on 15 June 2020).
- Banholzer, S.; Donner, S. The Impact of Climate Change on Natural Disasters, In Reducing Disaster: Early Warning Systems for Climate Change; Kossin, J., Ed.; Springer Science and Business Media LLC: Berlin/Heidelberg, Germany, 2014; pp. 21–49. [Google Scholar]
- Dancy, J.R.; Dancy, V.A. Terrorism and oil & gas pipeline infrastructure: Vulnerability and potential liability for cybersecurity attacks. Oil Gas Nat. Res. Energy J. 2017, 2, 579–620. [Google Scholar]
- Lia, B.; Kjok, A. Energy Supply as Terrorist Targets? Patterns of “Petroleum Terrorism”. In Oil in the Gulf: Obstacles to Democracy and Development; Taylor & Francis Group: Abingdon, UK, 2017; pp. 1968–1999. [Google Scholar]
- Loadenthal, M. Eco-Terrorism: An Incident-Driven History of Attack (1973–2010). J. Study Radical. 2017, 11, 1–34. [Google Scholar] [CrossRef]
- Da Silva, J.R. The Eco-Terrorist Wave 1970–2016. Ph.D. Thesis, Central European University, Budapest, Hungary, 2016. [Google Scholar]
- Verhovek, S.H. Pipeline Crews Tackle Huge Oil Spill Caused by Shooting. N. Y. Times 2001, 1, 11. [Google Scholar]
- Burnham, A.; Han, J.; Clark, C.E.; Wang, M.; Dunn, J.B.; Palou-Rivera, I. Life-Cycle Greenhouse Gas Emissions of Shale Gas, Natural Gas, Coal, and Petroleum. Environ. Sci. Technol. 2011, 46, 619–627. [Google Scholar] [CrossRef] [PubMed]
- Krackeler, T.; Schipper, L.; Sezgen, O. Carbon dioxide emissions in OECD service sectors: The critical role of electricity use. Energy Policy 1998, 26, 1137–1152. [Google Scholar] [CrossRef]
- Karion, A.; Sweeney, C.; Pétron, G.; Frost, G.; Hardesty, R.M.; Kofler, J.; Miller, B.; Newberger, T.; Wolter, S.; Banta, R.; et al. Methane emissions estimate from airborne measurements over a western United States natural gas field. Geophys. Res. Lett. 2013, 40, 4393–4397. [Google Scholar] [CrossRef]
- Hendrick, M.F.; Ackley, R.; Sanaie-Movahed, B.; Tang, X.; Phillips, N.G. Fugitive methane emissions from leak-prone natural gas distribution infrastructure in urban environments. Environ. Pollut. 2016, 213, 710–716. [Google Scholar] [CrossRef]
- MacLean, H.L.; Lave, L.B.; Lankey, R.; Joshi, S. A Life-Cycle Comparison of Alternative Automobile Fuels. J. Air Waste Manag. Assoc. 2000, 50, 1769–1779. [Google Scholar] [CrossRef]


| Type of Entity | Fossil Fuel | ||
|---|---|---|---|
| Coal | Oil | Natural Gas | |
| Resource Extraction | Underground and Strip Mines | Wells | Wells/Pumping Stations |
| Transport | N/A * | Shipping/Pipelines | Shipping/Pipelines |
| End Use/Product Sale | Power Plants | Processing/Refineries | Power Plants |
© 2020 by the authors. Licensee MDPI, Basel, Switzerland. This article is an open access article distributed under the terms and conditions of the Creative Commons Attribution (CC BY) license (http://creativecommons.org/licenses/by/4.0/).
Share and Cite
Pascaris, A.S.; Pearce, J.M. U.S. Greenhouse Gas Emission Bottlenecks: Prioritization of Targets for Climate Liability. Energies 2020, 13, 3932. https://doi.org/10.3390/en13153932
Pascaris AS, Pearce JM. U.S. Greenhouse Gas Emission Bottlenecks: Prioritization of Targets for Climate Liability. Energies. 2020; 13(15):3932. https://doi.org/10.3390/en13153932
Chicago/Turabian StylePascaris, Alexis S., and Joshua M. Pearce. 2020. "U.S. Greenhouse Gas Emission Bottlenecks: Prioritization of Targets for Climate Liability" Energies 13, no. 15: 3932. https://doi.org/10.3390/en13153932
APA StylePascaris, A. S., & Pearce, J. M. (2020). U.S. Greenhouse Gas Emission Bottlenecks: Prioritization of Targets for Climate Liability. Energies, 13(15), 3932. https://doi.org/10.3390/en13153932