Tests of an Absorption Cooling Machine at the Gijón Solar Cooling Laboratory


Abstract
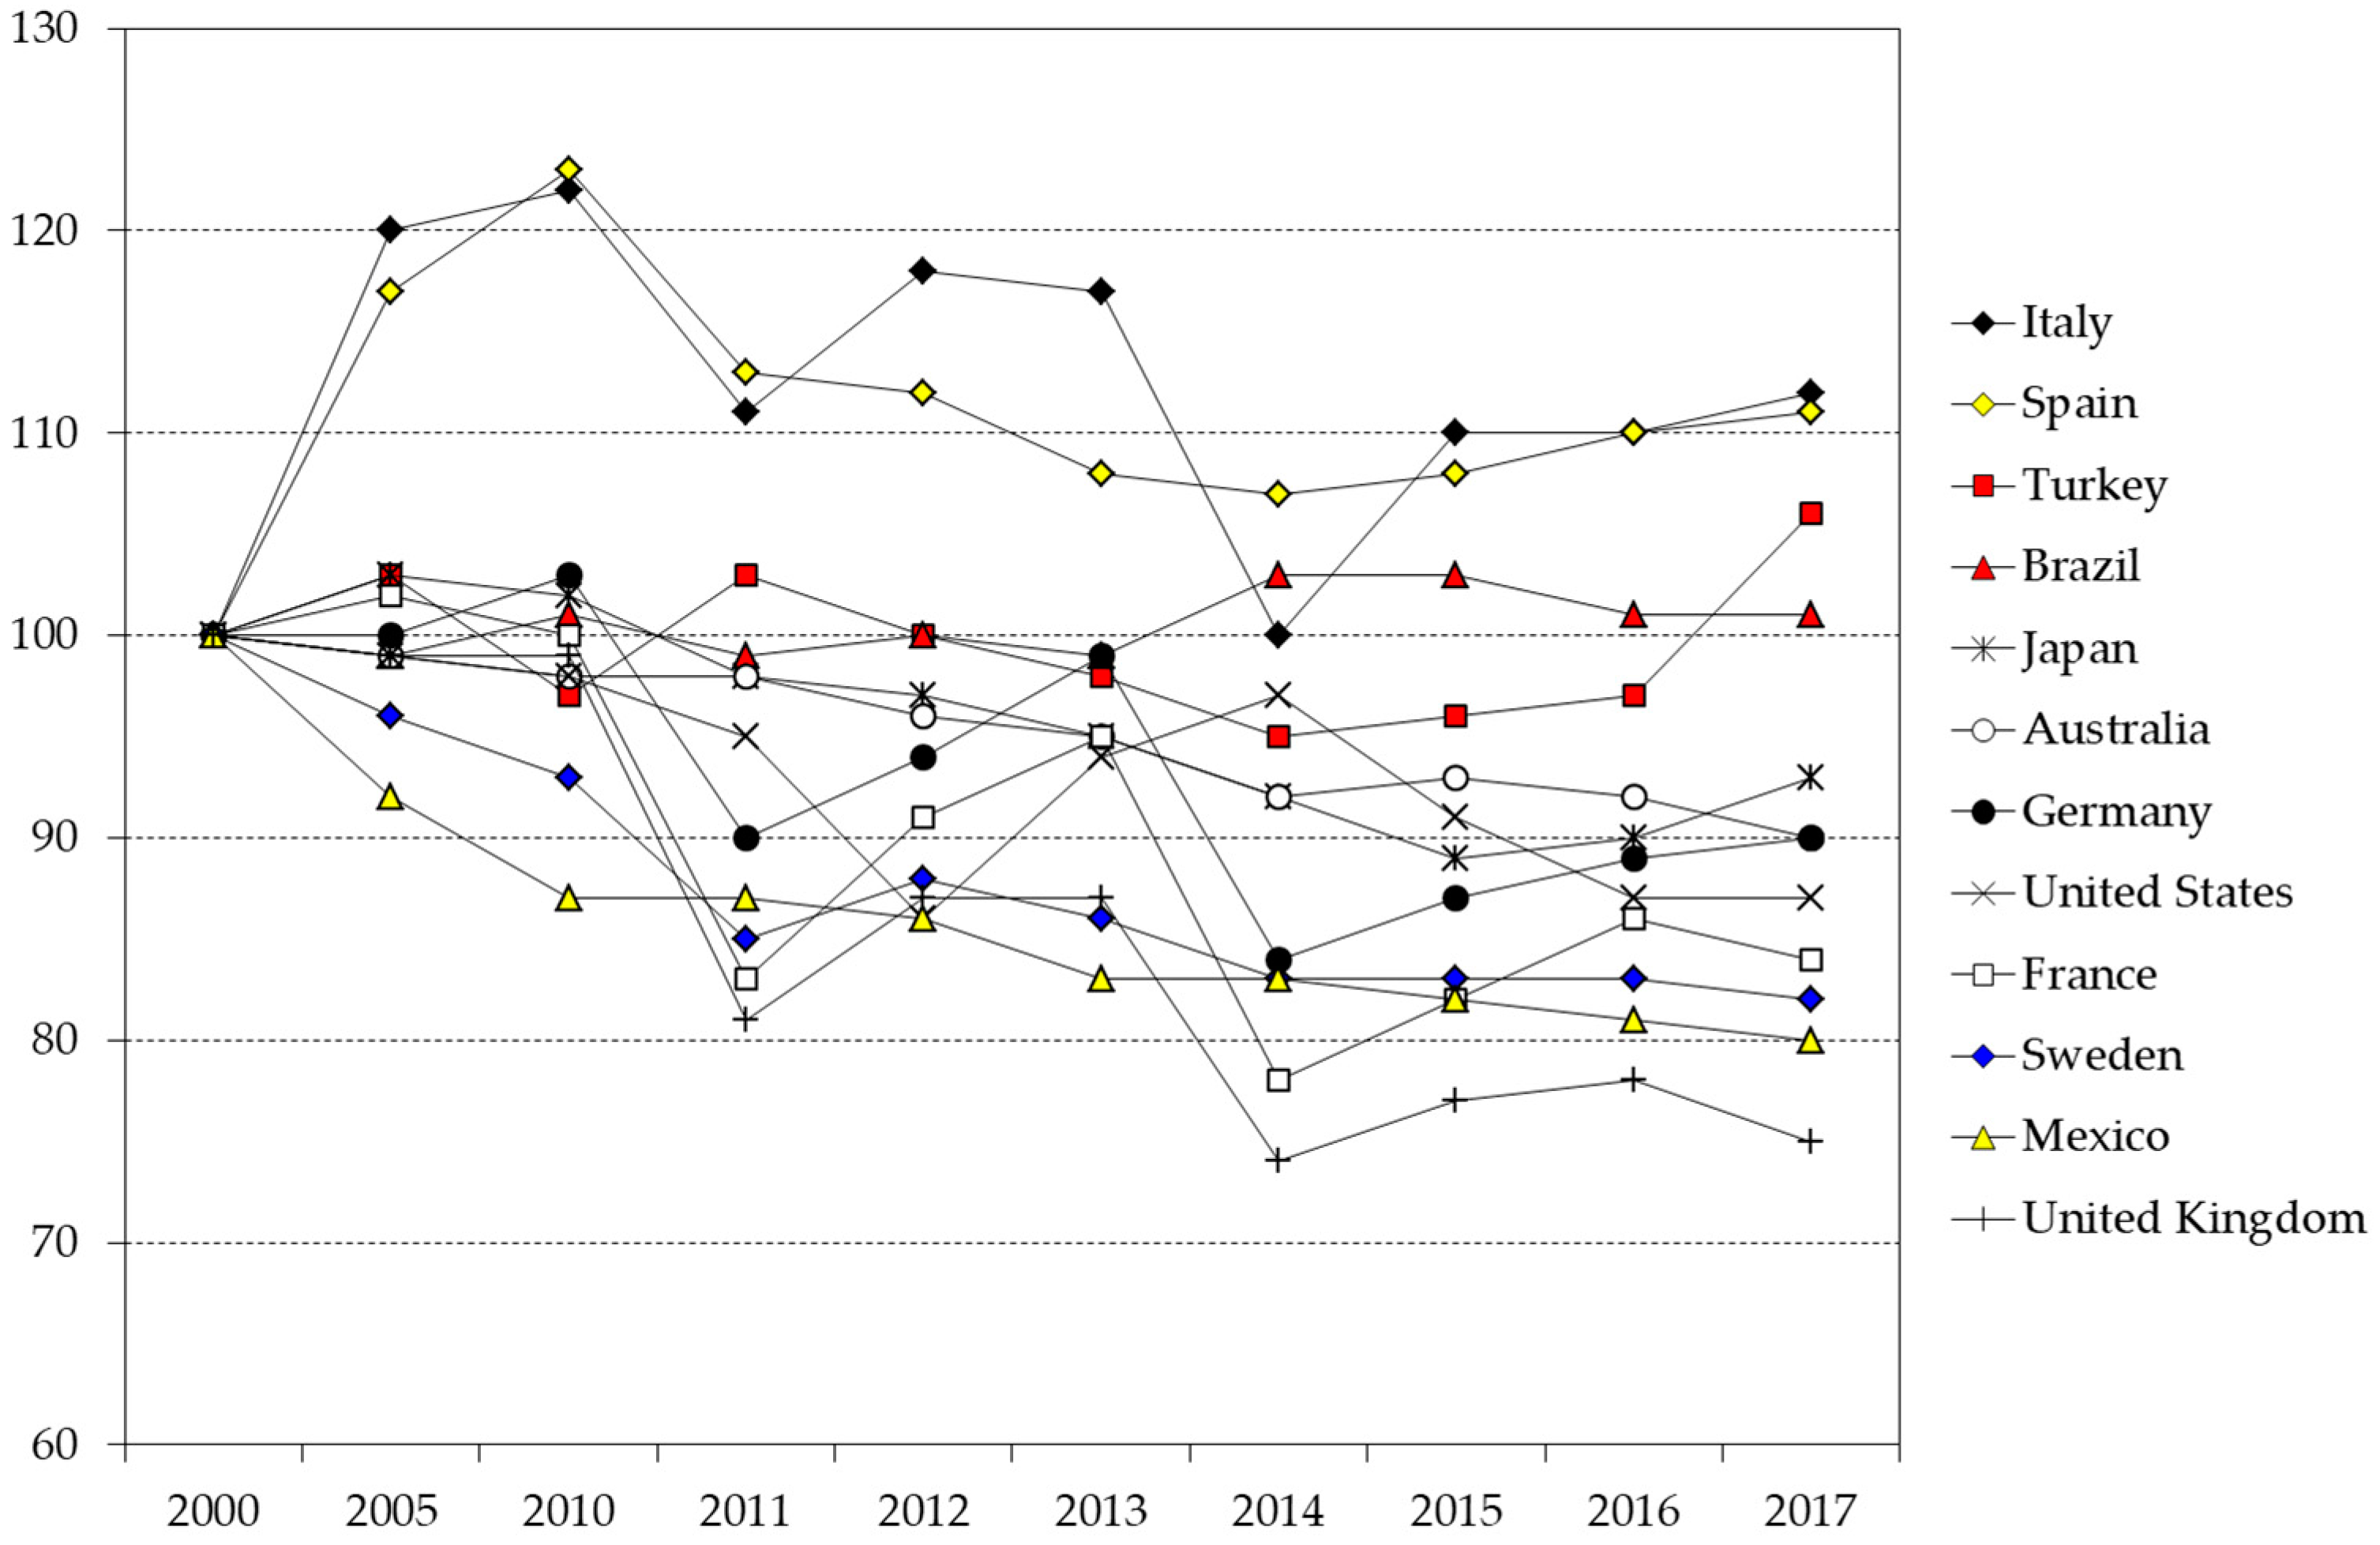
:1. Introduction
2. Materials and Methods
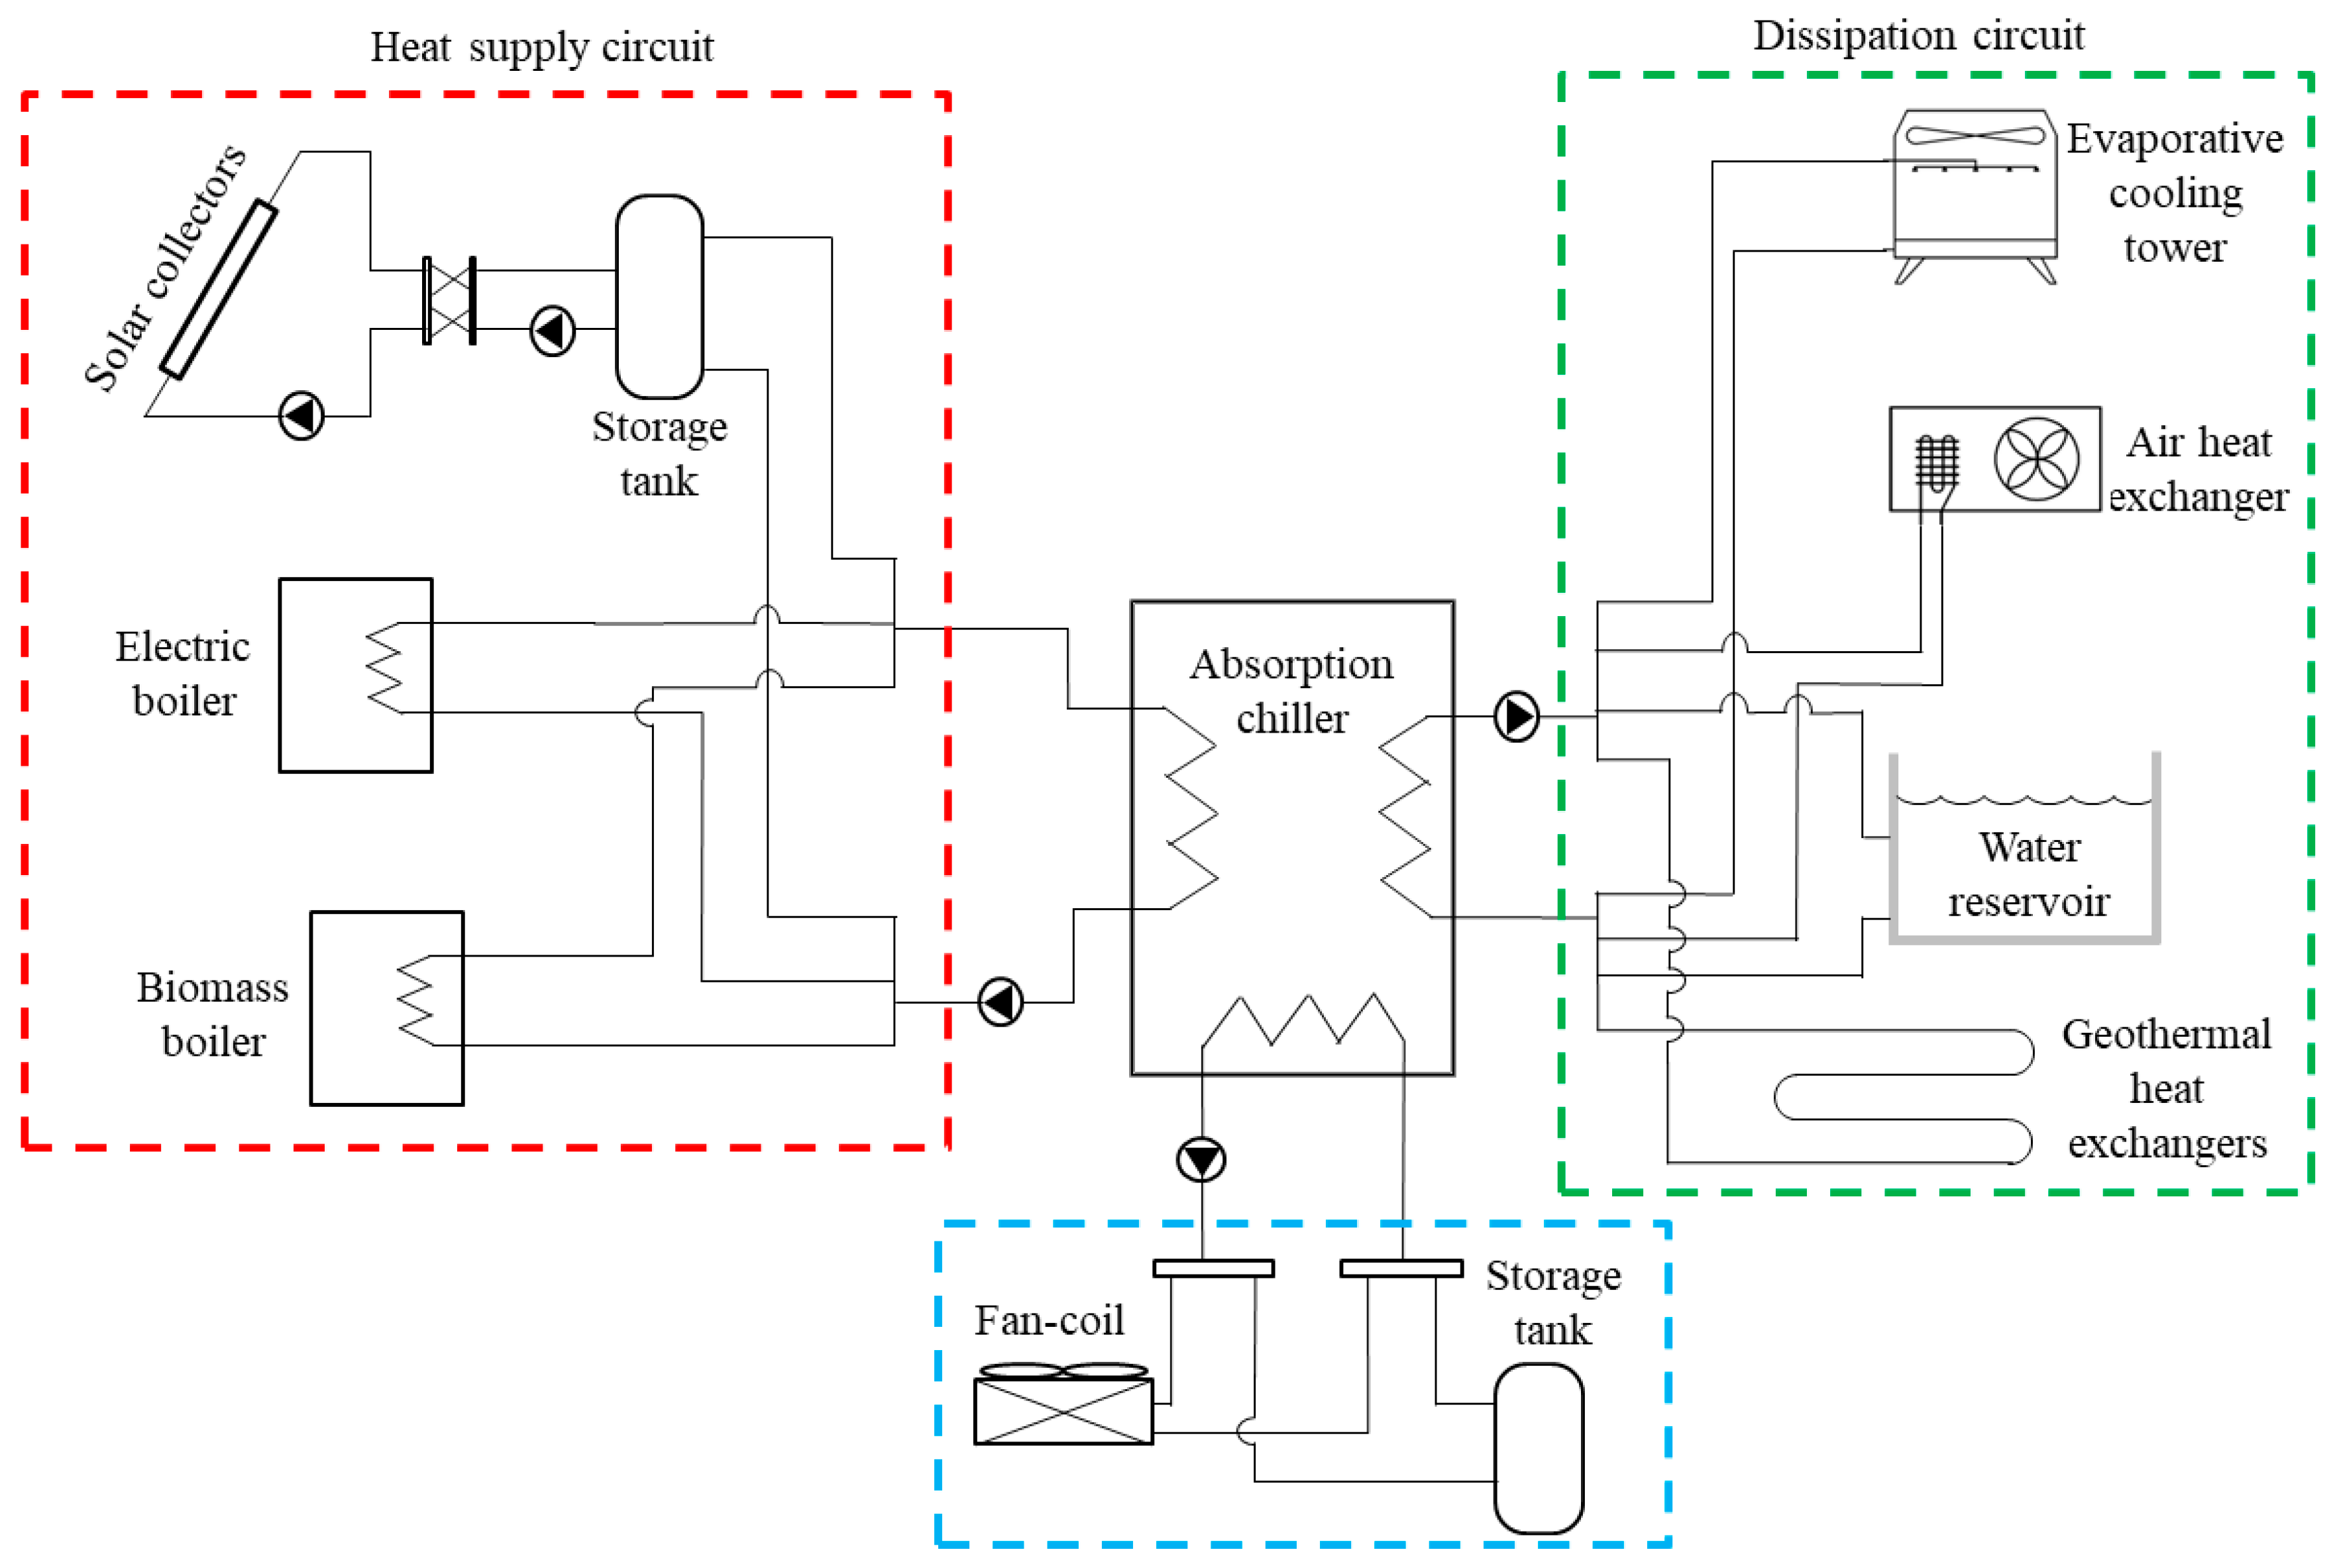
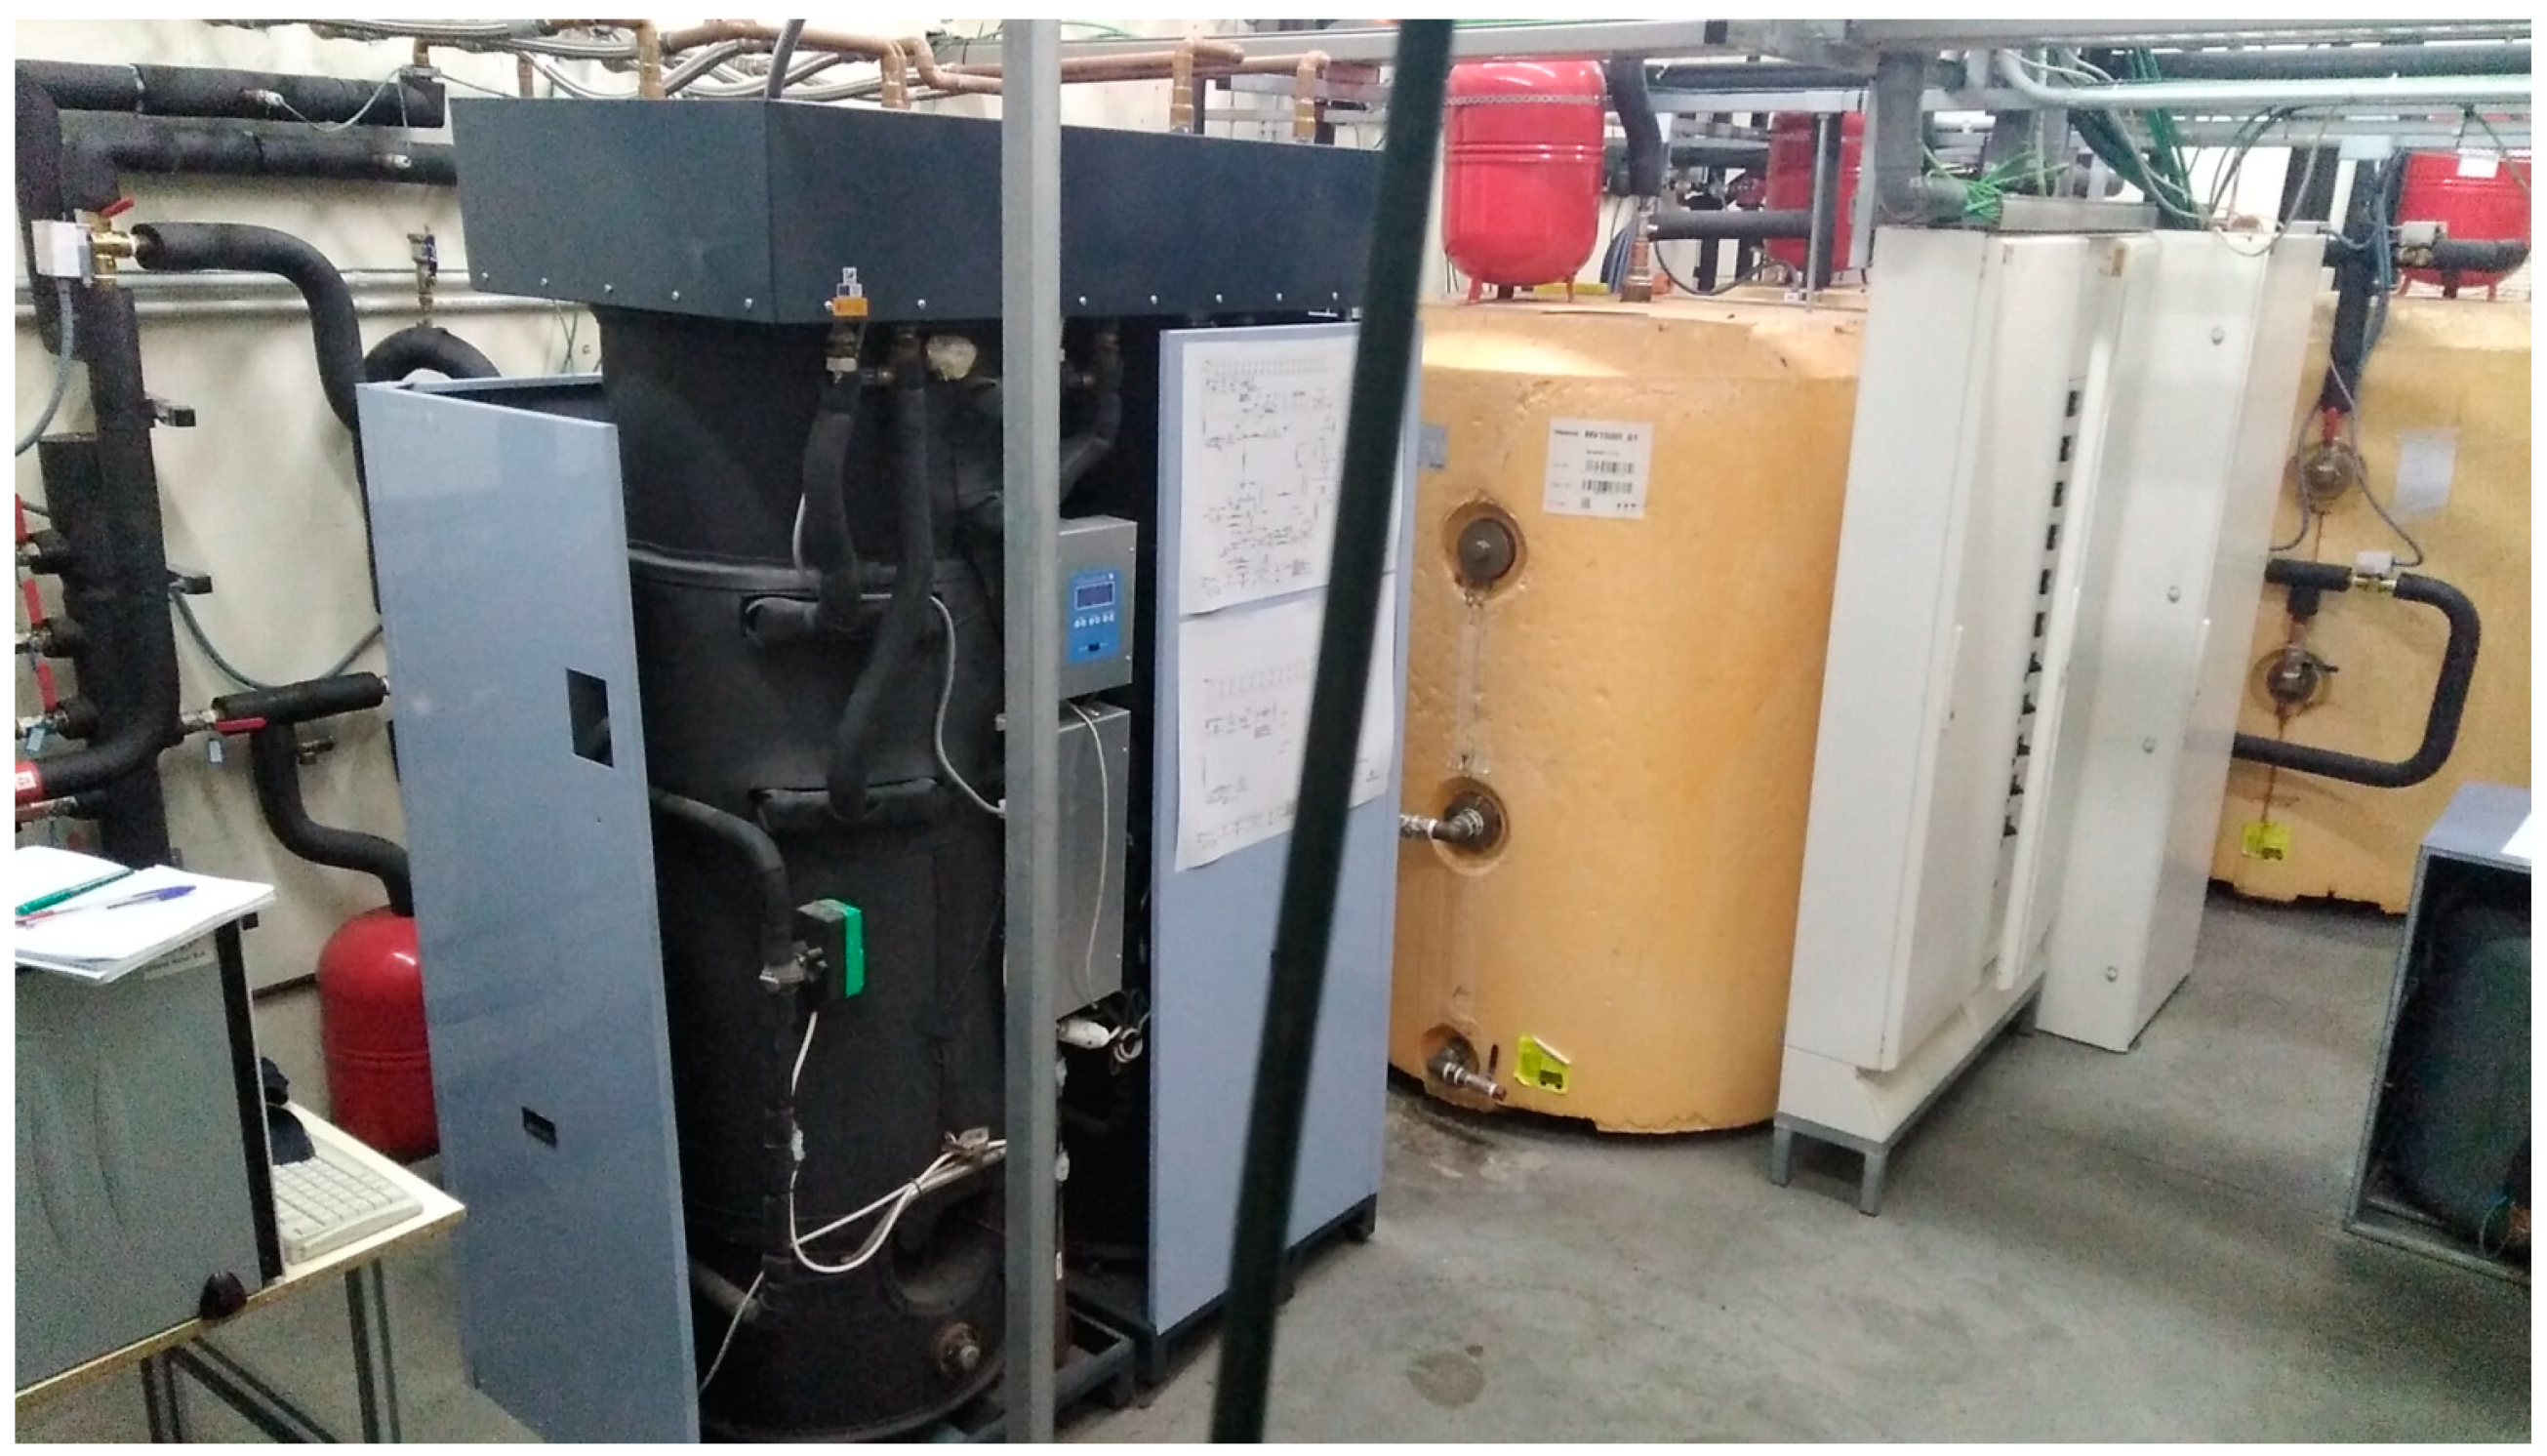
2.1. Description of the GSCL
2.2. Test Setup
3. Results and Discussion
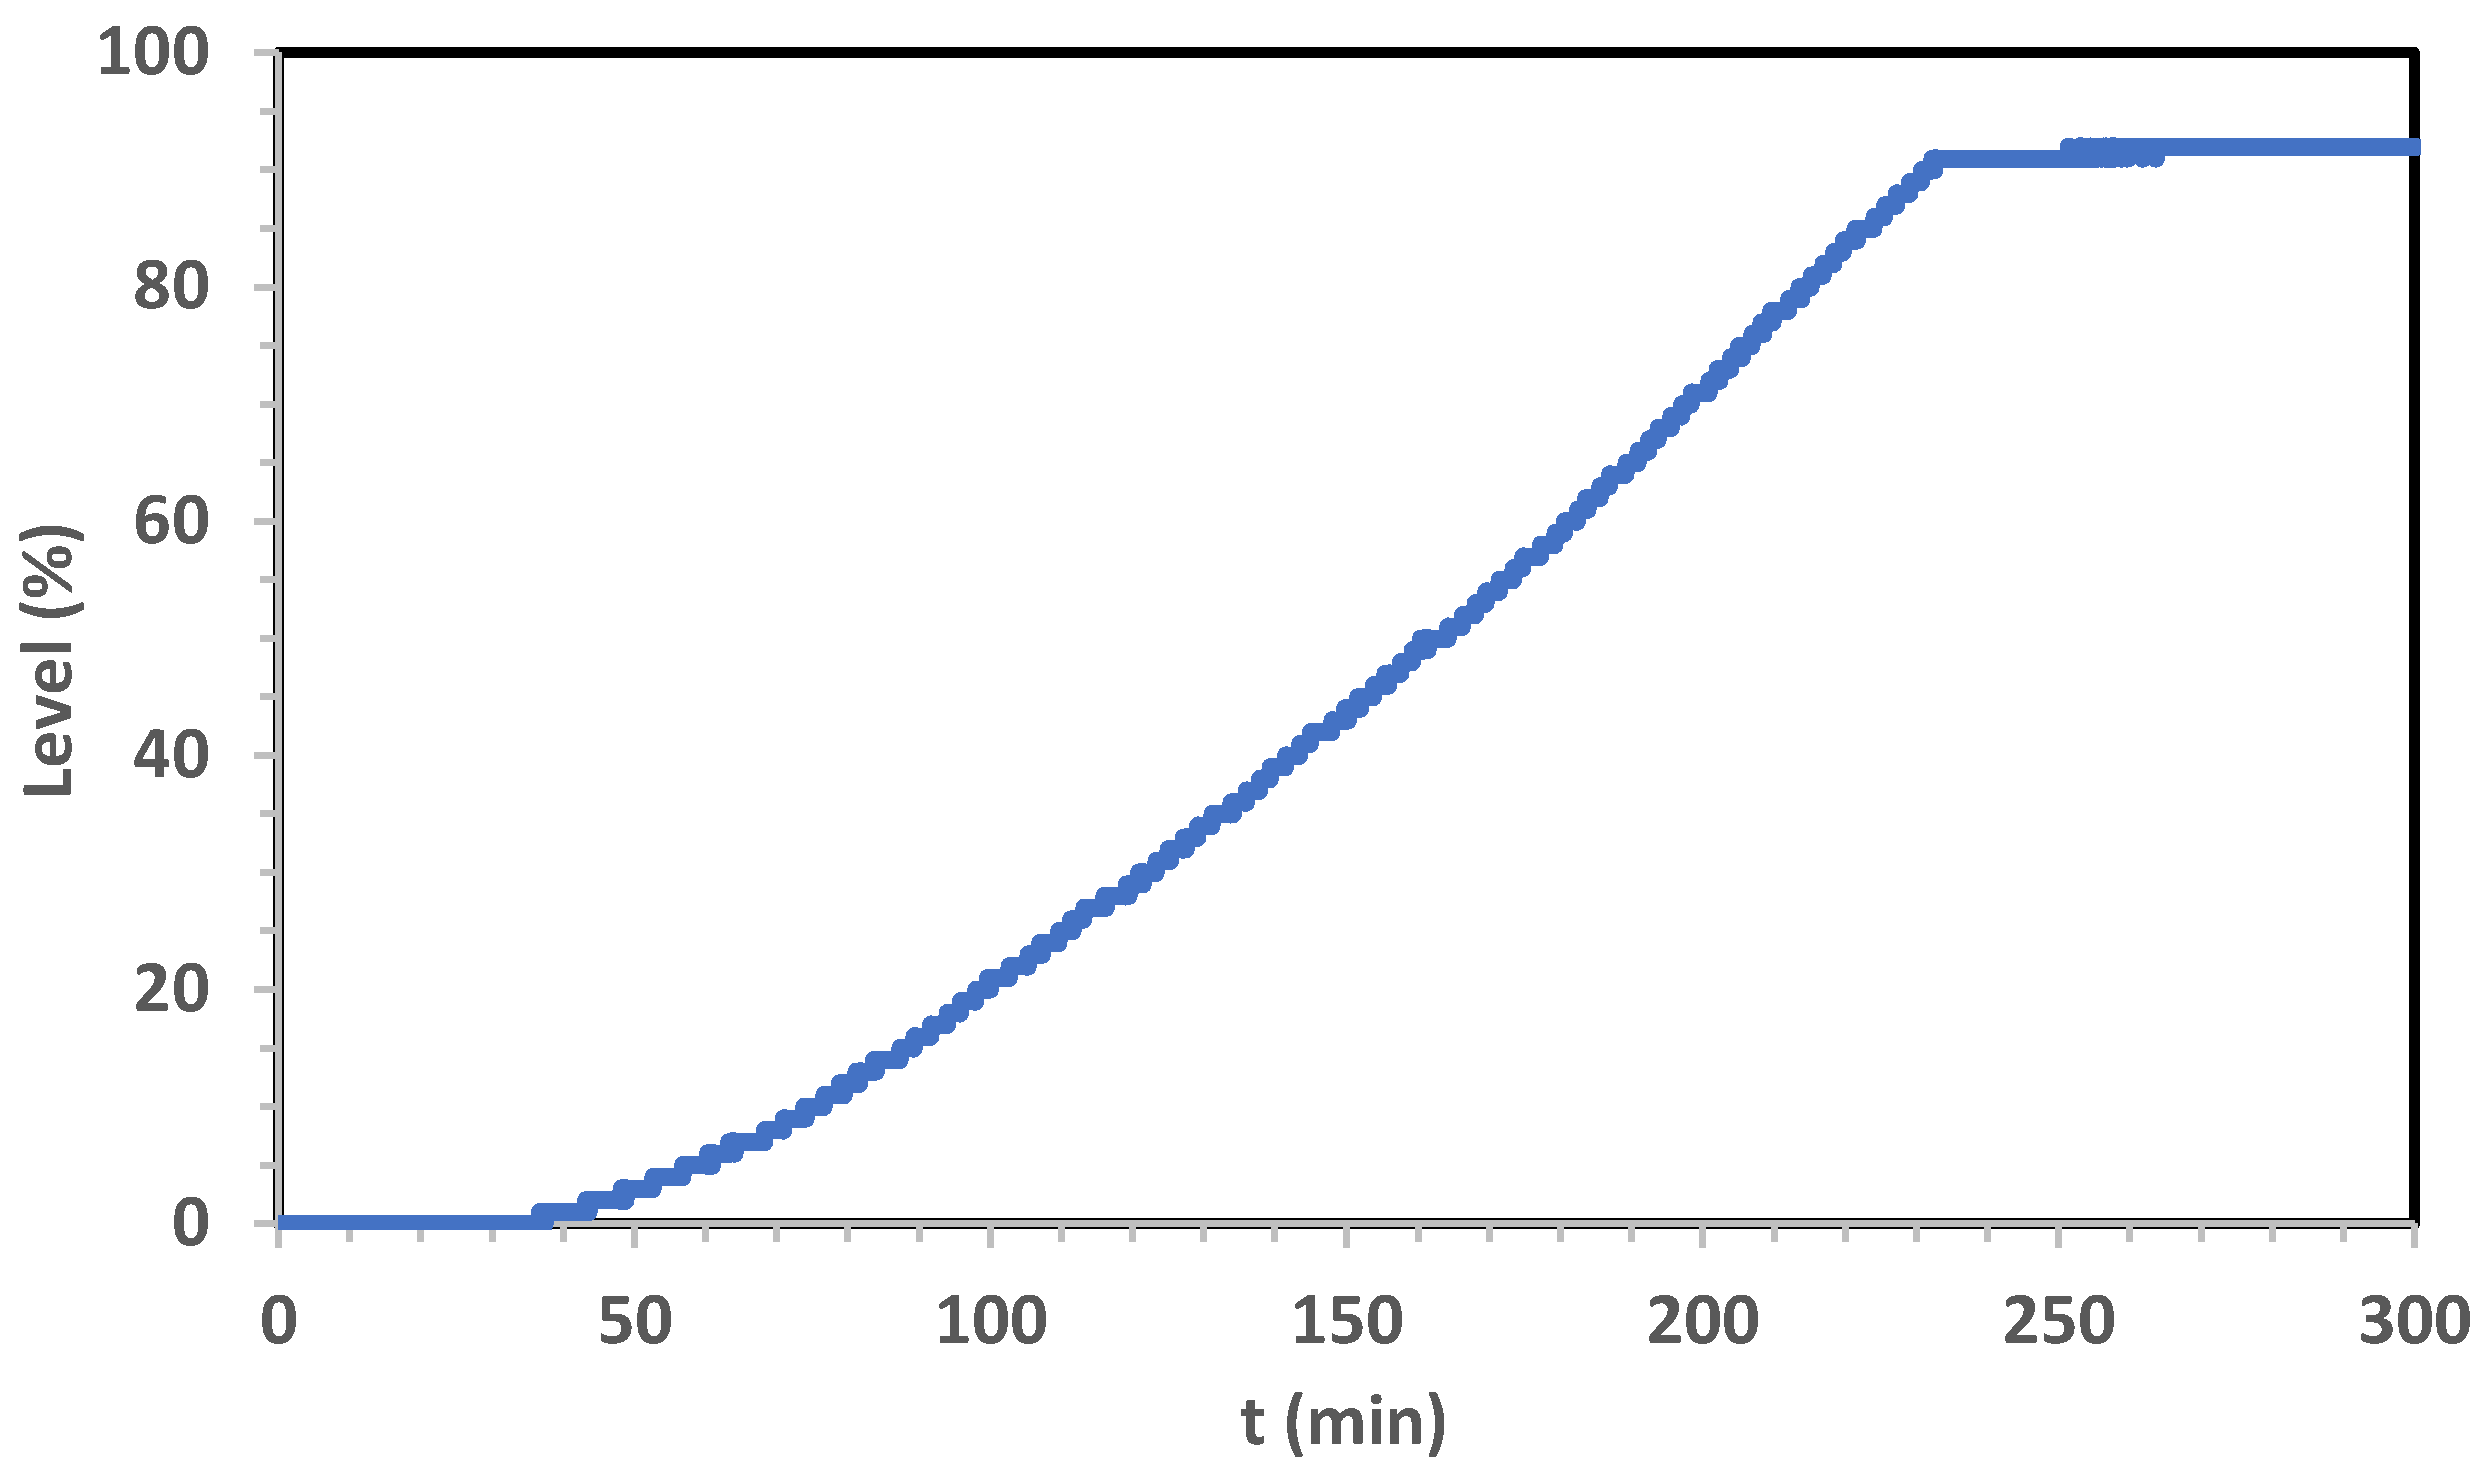
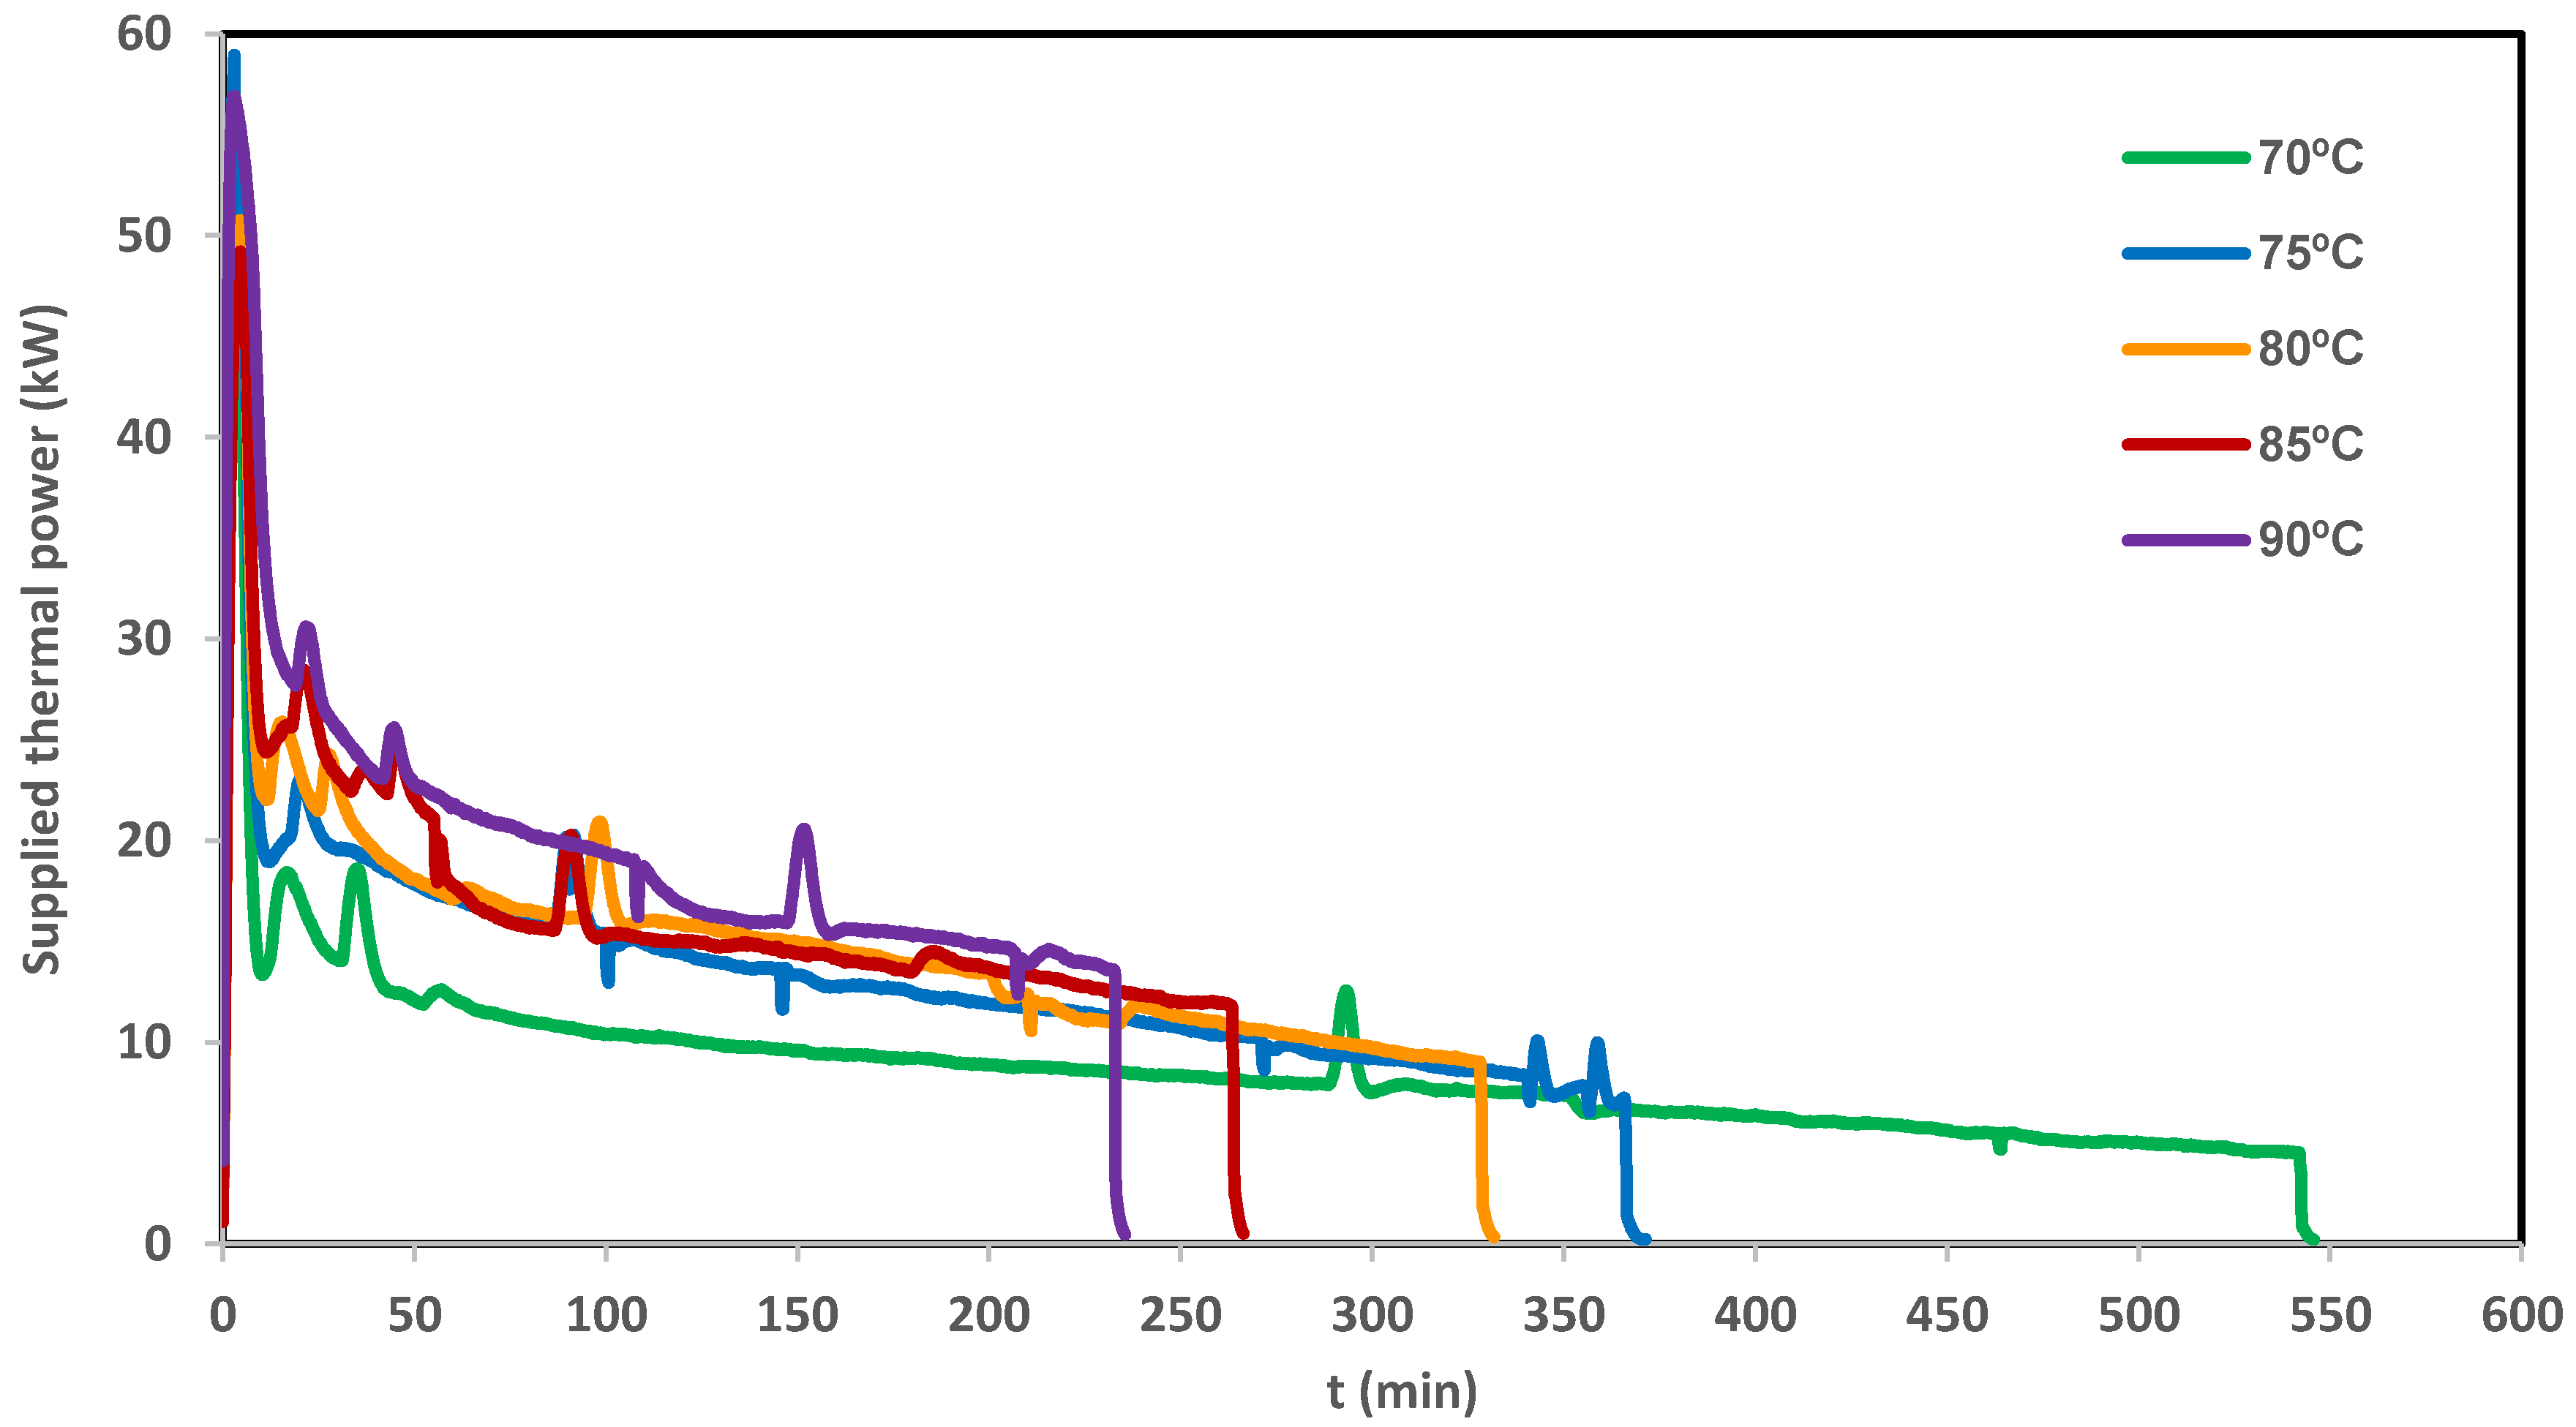
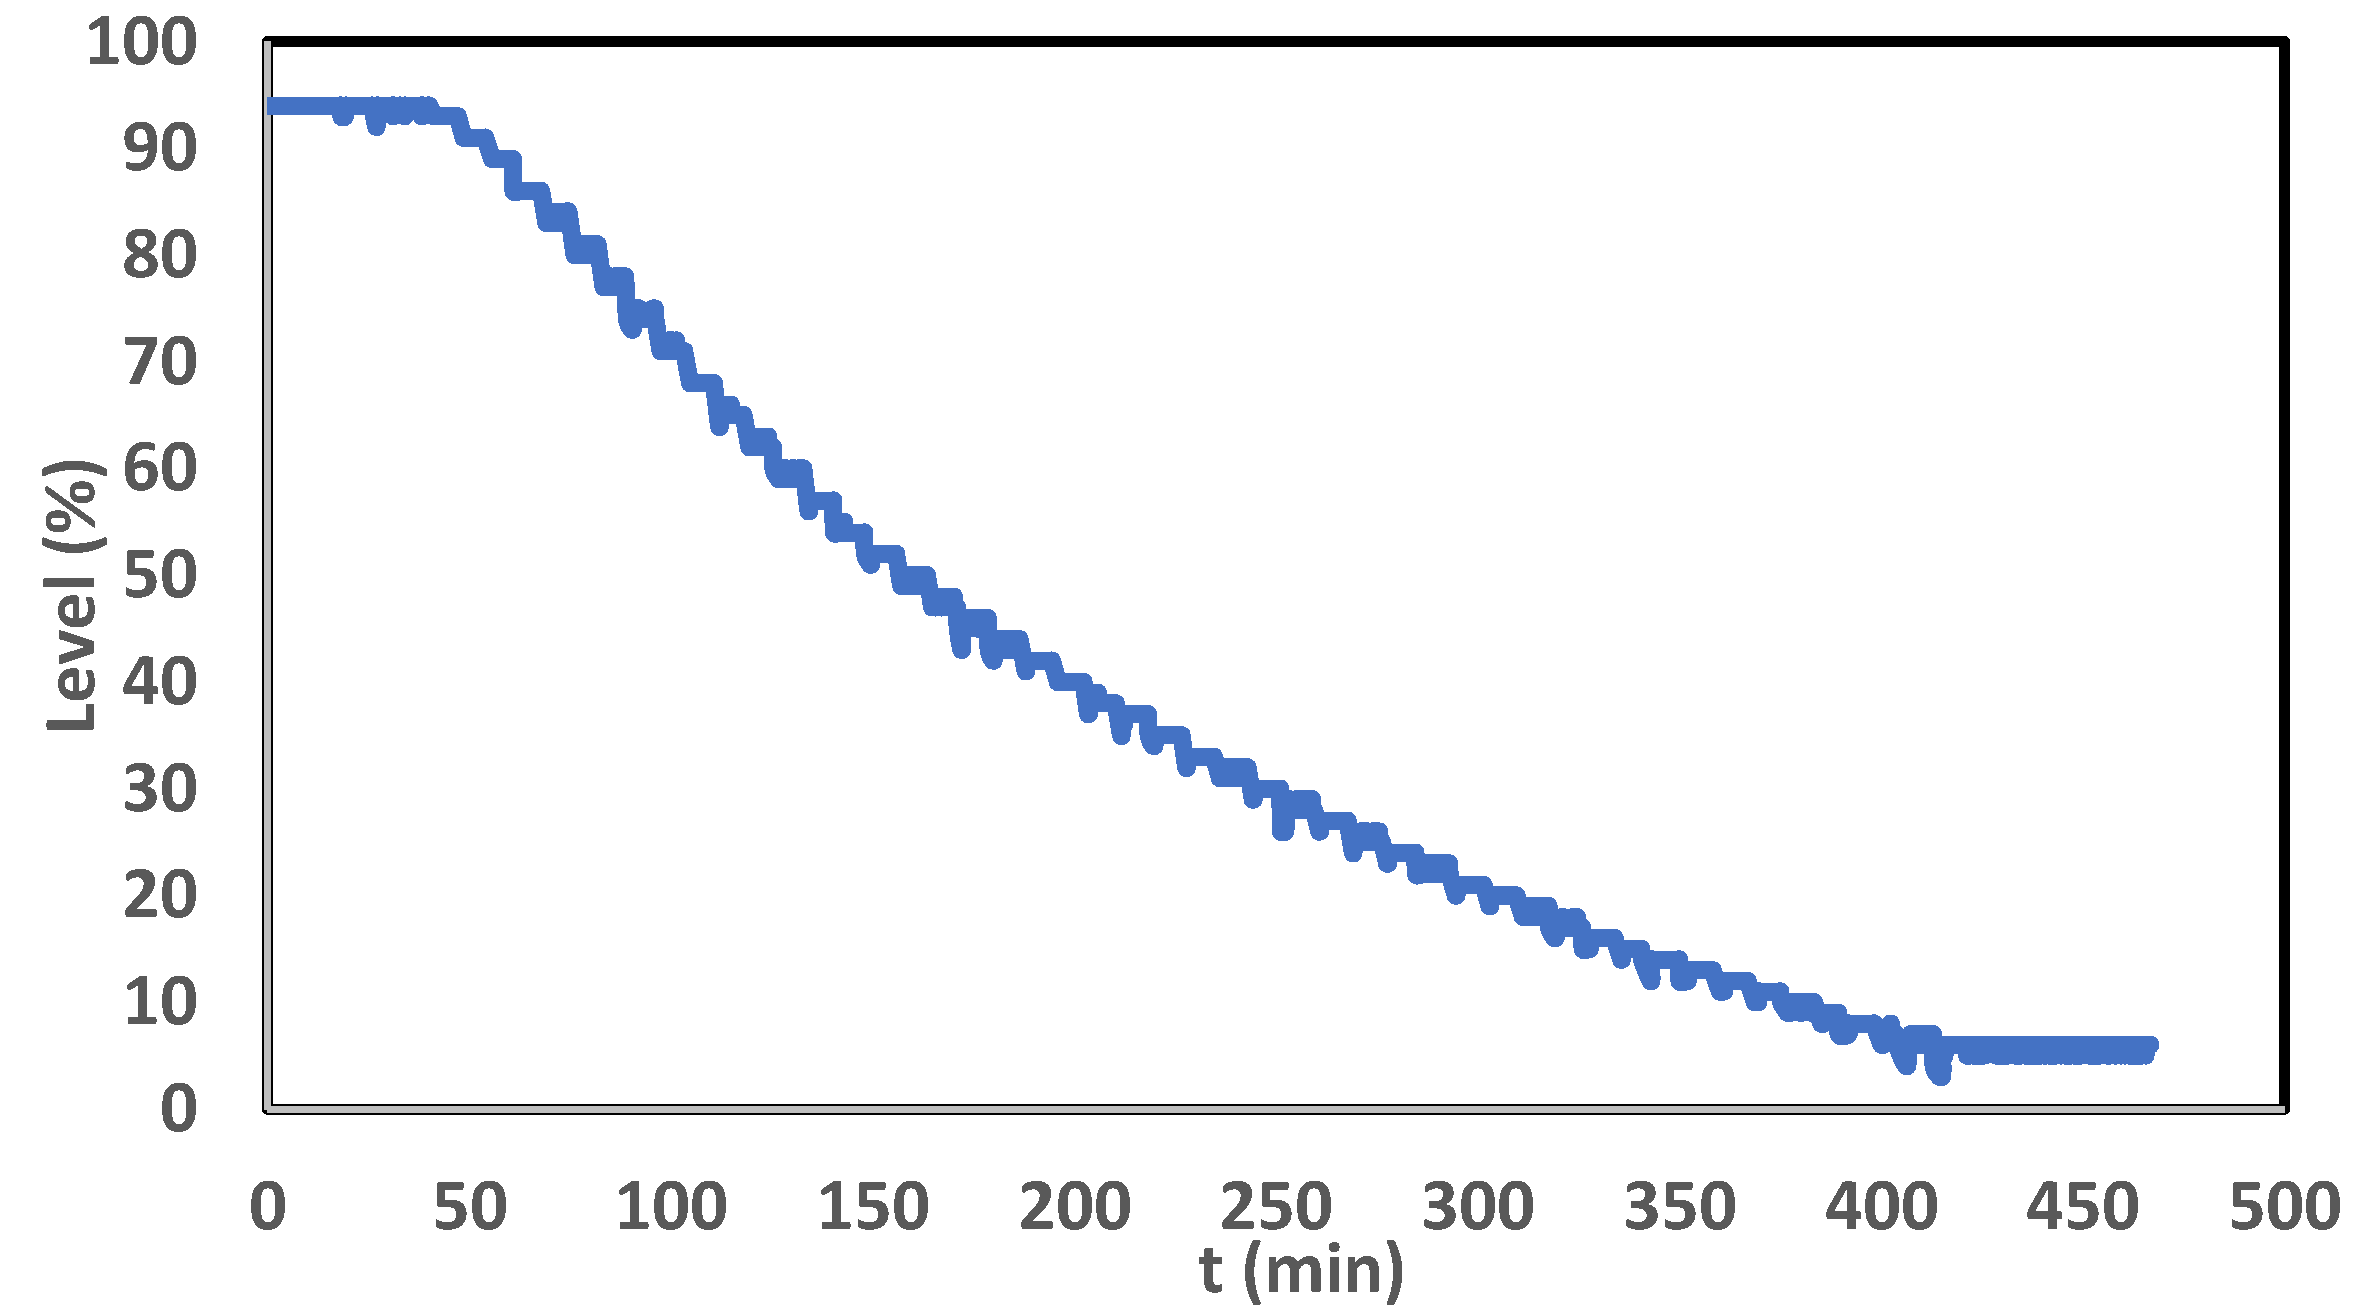
3.1. Charge Process of the Absorption Machine
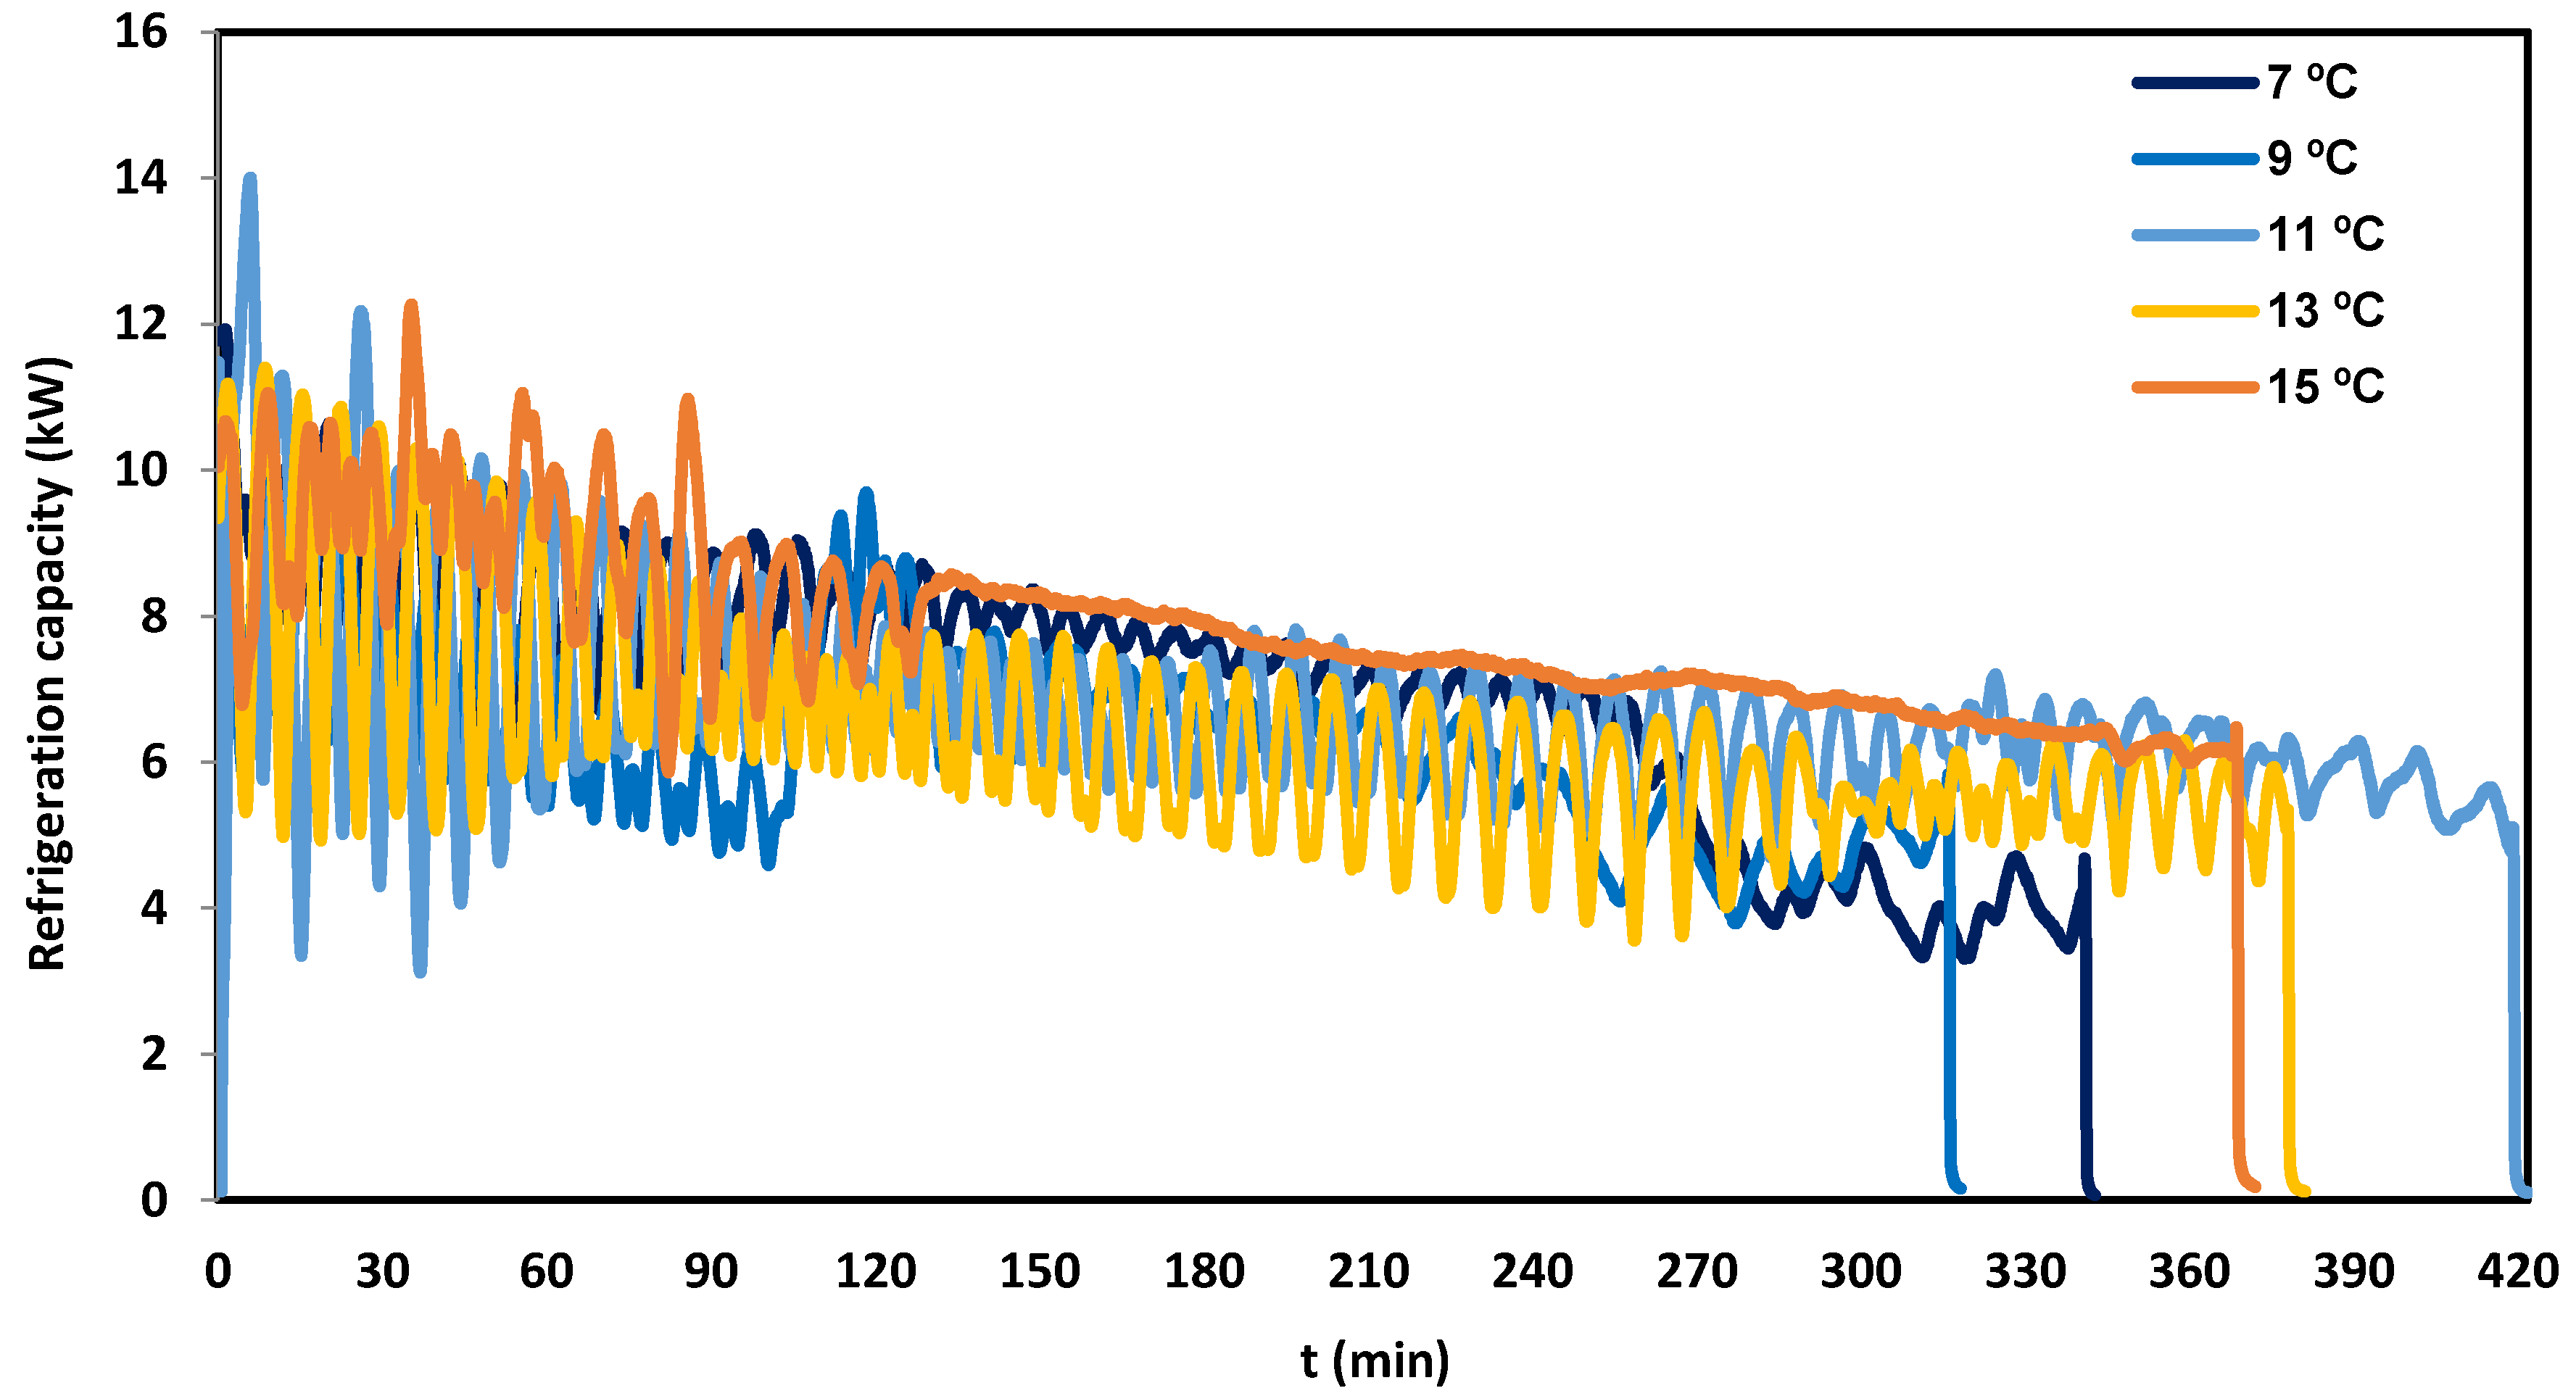
3.2. Discharge Process of the Absorption Machine
3.3. Coefficient of Performance
4. Conclusions
Author Contributions
Funding
Acknowledgments
Conflicts of Interest
References
- Anon. Energy Statistics Pocketbook, Department of Economic and Social Affairs; United Nations: New York, NY, USA, 2018. [Google Scholar]
- Anon. Energy Efficiency Indicators; Statistical Report; IEA: Paris, France, 2019; Available online: https://www.iea.org/reports/energy-efficiency-indicators-2019 (accessed on 17 January 2020).
- Anon. CO2 Emissions from Fuel Combustion; Statistical Report; IEA: Paris, France, 2019. [Google Scholar]
- Murphy, P. (Ed.) IEA Solar Heating & Cooling Programme. 2004 Annual Report; Morse Associates Inc.: Washington, DC, USA, 2005. [Google Scholar]
- Rodríguez-Muñoz, J.L.; Belman-Flores, J.M. Review of diffusion–absorption refrigeration technologies. Renew. Sustain. Energy Rev. 2014, 30, 145–153. [Google Scholar] [CrossRef]
- Allouhi, A.; Kousksou, T.; Jamil, A.; Bruel, P.; Mourad, Y.; Zeraouli, Y. Solar driven cooling systems: An updated review. Renew. Sustain. Energy Rev. 2015, 44, 159–181. [Google Scholar] [CrossRef]
- Syed, A.; Izquierdo, M.; Rodríguez, P.; Maidment, G.; Misseden, J.; Lecuona, A.; Tozer, R. A novel experimental investigation of a solar cooling system in Madrid. Int. J. Refrig. 2005, 28, 859–871. [Google Scholar] [CrossRef]
- Bellos, E.; Tzivanidis, C.; Antonopoulos, K.A. Exergetic, energetic and financial evaluation of a solar driven absorption cooling system with various collector types. Appl. Therm. Eng. 2015, 102, 749–759. [Google Scholar] [CrossRef]
- Bellos, E.; Tzivanidis, C.; Symeou, C.; Antonopoulos, K.A. Energetic, exergetic and financial evaluation of a solar driven absorption chiller—A dynamic approach. Energy Convers. Manag. 2017, 137, 34–48. [Google Scholar] [CrossRef]
- Saleh, A.; Mosa, M. Optimization study of a single-effect water–lithium bromide absorption refrigeration system powered by flat-plate collector in hot regions. Energy Convers. Manag. 2014, 87, 29–36. [Google Scholar] [CrossRef]
- Al-Alili, A.; Islam, M.D.; Kubo, I.; Hwang, Y.; Radermacher, R. Modeling of a solar powered absorption cycle for Abu Dhabi. Appl. Energy 2012, 93, 160–167. [Google Scholar] [CrossRef]
- Nasruddin; Aisyah, N.; Alhamid, M.I.; Saha, B.B.; Sholadudin, S.; Lubis, A. Solar absorption chiller performance prediction based on the selection of principal component analysis. Case Stud. Therm. Eng. 2019, 13, 10039. [Google Scholar] [CrossRef]
- Lubis, A.; Jeong, J.; Saito, K.; Giannetti, N.; Yabase, H.; Alhamid, M.I.; Nasruddin. Solar-assisted single-double-effect absorption chiller for use in Asian tropical climates. Renew. Energy 2016, 99, 825–835. [Google Scholar] [CrossRef]
- Zhai, X.Q.; Qu, M.; Li, Y.; Wang, R.Z. A review for research and new design options of solar absorption cooling systems. Renew. Sustain. Energy Rev. 2011, 15, 4416–4423. [Google Scholar] [CrossRef]
- Marc, O.; Sinama, F.; Praene, J.P.; Lucas, F.; Castaing-Lasvignottes, J. Dynamic modeling and experimental validation elements of a 30 kW LiBr/H2O single effect absorption chiller for solar application. Appl. Therm. Eng. 2015, 90, 980–993. [Google Scholar] [CrossRef]
- Sokhansefat, T.; Mohammadi, D.; Kasaeian, A.; Mahmoudi, A.R. Simulation and parametric study of a 5-ton solar absorption cooling system in Tehran. Energy Convers. Manag. 2017, 148, 339–351. [Google Scholar] [CrossRef]
- Shirazi, A.; Taylor, R.A.; White, S.D.; Morrison, G.L. A systematic parametric study and feasibility assessment of solar-assisted single-effect, double-effect, and triple-effect absorption chillers for heating and cooling applications. Energy Convers. Manag. 2016, 114, 258–277. [Google Scholar] [CrossRef]
- Gupta, A.; Anand, Y.; Tyagi, S.K.; Anand, S. Economic and thermodynamic study of different cooling options: A review. Renew. Sustain. Energy Rev. 2016, 62, 164–194. [Google Scholar] [CrossRef]
- Heras, M.R.; Jiménez, M.J.; Ferrer, J.A.; Bosqued, R.; Batlles, F.J.; Prieto, J.I.; Avellaner, J.; Guerra, I. Towards a New Generation of Buildings with Almost Zero Energy Consumption and Zero-Emission; CIEMAT: Madrid, Spain, 2014. (In Spanish) [Google Scholar]
- Sanjuan, C.; Soutullo, S.; Heras, M.R. Optimization of a solar cooling system with interior energy storage. Sol. Energy 2010, 84, 1244–1254. [Google Scholar] [CrossRef]
- Soutullo, S.; San Juan, C.; Heras, M.R. Comparative study of internal storage and external storage absorption cooling systems. Renew. Energy 2011, 36, 1645–1651. [Google Scholar] [CrossRef]


| Power | Operating Temperatures | Working Fluids | Flow Range |
|---|---|---|---|
| Cooling: 10 kW Supply: 26 kW | Chilled water: 7–18 °C Cooling water: 20–40 °C Hot water to generator: 65–105 °C | Water (refrigerant) Aqueous solution of LiCl (absorbent) Solid phase of crystallized LiCl | 15–30 L/min |
| Solar Collectors | Electric Boiler | Biomass Boiler |
|---|---|---|
| 20 collectors Unisol 90 Clima TIM. Aperture area: 20 × 1.91 m2 | Model ETE-GP46/2 ECO Maximum heating power: 54 kW | Model VETO-30 Maximum heating power: 30 kW |
| Air Heat Exchanger | Cooling Tower | Water Reservoir | Ground Heat Exchangers |
|---|---|---|---|
| Model BTUEA66-024007.46/H 2 × 1.9 kW fans | Model EWK 036 Maximum power: 46 kW | Concrete basin Volume: 90 m3 Free surface: 30 m2 | Horizontal tubes: 4.8 kW thermal power Vertical tubes: 12.5 kW thermal power |
| Fan Coil | Water Tanks |
|---|---|
| Model BTU VVC-95/P/2T Refrigeration capacity: 8246 W Heating power: 9164 W | 2 × 1500 liters Thermally insulated |
| Driving Heat Temperature (°C) | Charging Time (h:min:s) | Average Supplied Thermal Power (kW) | Supplied Energy (kJ) | Cooling Water Temperature (°C) |
|---|---|---|---|---|
| 70 | 09:06:09 | 8.72 | 285,569 | 20.35 |
| 75 | 06:12:15 | 13.39 | 298,275 | 19.02 |
| 80 | 05:32:01 | 14.91 | 296,800 | 20.20 |
| 85 | 04:26:33 | 16.72 | 267,248 | 19.26 |
| 90 | 03:55:35 | 19.93 | 281,543 | 20.06 |
| Average Chilled Water Inlet Temperature (°C) | Set-Point Temperature (°C) | Average Chilled Water Outlet Temperature (°C) | Average Refrigeration Capacity (kW) | Discharging Time (h:min:s) | Cooling Energy (kJ) |
|---|---|---|---|---|---|
| 19.45 | 7 | 10.45 | 7.08 | 05:43:30 | 145,653 |
| 18.94 | 9 | 10.89 | 6.31 | 05:34:02 | 120,446 |
| 19.43 | 11 | 11.41 | 6.67 | 07:08:31 | 168,869 |
| 20.01 | 13 | 12.90 | 6.33 | 06:19:50 | 144,710 |
| 20.26 | 15 | 10.11 | 7.77 | 06:11:20 | 173,400 |
© 2020 by the authors. Licensee MDPI, Basel, Switzerland. This article is an open access article distributed under the terms and conditions of the Creative Commons Attribution (CC BY) license (http://creativecommons.org/licenses/by/4.0/).
Share and Cite
Suárez López, M.-J.; Prieto, J.-I.; Blanco, E.; García, D. Tests of an Absorption Cooling Machine at the Gijón Solar Cooling Laboratory. Energies 2020, 13, 3962. https://doi.org/10.3390/en13153962
Suárez López M-J, Prieto J-I, Blanco E, García D. Tests of an Absorption Cooling Machine at the Gijón Solar Cooling Laboratory. Energies. 2020; 13(15):3962. https://doi.org/10.3390/en13153962
Chicago/Turabian StyleSuárez López, María-José, Jesús-Ignacio Prieto, Eduardo Blanco, and David García. 2020. "Tests of an Absorption Cooling Machine at the Gijón Solar Cooling Laboratory" Energies 13, no. 15: 3962. https://doi.org/10.3390/en13153962
APA StyleSuárez López, M.-J., Prieto, J.-I., Blanco, E., & García, D. (2020). Tests of an Absorption Cooling Machine at the Gijón Solar Cooling Laboratory. Energies, 13(15), 3962. https://doi.org/10.3390/en13153962