Abstract
In this paper two solar electric-driven air conditioning systems are compared and analyzed from an energy and environmental point of view. Both systems satisfy the electricity, space heating and cooling needs of an existing multi-purpose, multi-story building that is simulated with TRNSYS 17. The first one, considered as reference system, is based on a centralized electric heat pump coupled with a conventional photovoltaic plant installed 10 years ago. The second one, hereinafter proposed system, has a hybrid configuration, consisting of a ground-source heat pump, a low temperature thermal network and a series of electric heat pumps, one per apartment. In addition, the plant is connected to a high-performance commercial photovoltaic system equipped with a solar tracking system to the panels. Five different solutions realized with vertical, two horizontal orientations, polar and two-axis trackers are taken into account and compared with the standard fixed configuration. The last hybrid configuration can be seen as an upgrade of an existing decentralized air conditioning system in which the local electric heat pumps are converted in water-to-water devices that interact with the thermal grid representing the heat source/sink for them. In both solar electric heating and cooling plants the photovoltaic system is installed on the building roof and it produces electricity to feed the heat pumps and end-users. The electricity surplus or the load not covered by solar field is fed to/taken from power grid. The energy and environmental analyses have been performed by considering both average annual and monthly values of power grid efficiency and CO2 emission factor for electricity. By comparing reference system and proposed one equipped with a two-axis tracker system a primary fossil energy saving of 101.67% is achieved in summer period and 28.10% in winter period. These percentages are the highest values recorded, even if, for all configurations the energy analysis rewards the proposed system. The results of environmental analysis demonstrate that the reference system has the worst performances compared to proposed system with all solar tracker systems selected guarantying positive values for avoided carbon dioxide index up to 45.86%.
1. Introduction
The total final energy consumption in the EU-28 amounted to 13,414 TWh in 2017. Buildings (residential and tertiary sector) made a substantial contribution to European countries energy consumption. In particular, 37.5% (5028 TWh) of final energy demand in EU-28 was due to buildings in 2017 [1]. Among others, in the same year, the energy consumption for heating, cooling and domestic hot water accounted for 79% of total EU-28 total energy demand. Furthermore, cooling requests have experienced a growing trend in the civil sector during last decade due to the increase of indoor comfort expectations and the climate change resulting in environmental temperature rises [2]. Regarding European industrialized countries this growing trend in buildings’ energy consumption has been particularly acute. For instance, in Italy an increase percentage of 49.9% in final energy consumption of civil sector in 2017 has been recorded compared to 1990 [3].
According to Eurostat, up to 75% of buildings’ cooling and total heating demand (including domestic hot water requirements) is still covered by fossil fuels and only a little share—19%—is satisfied by means of Renewable Energy Sources (RESs) [4]. Subsequently, EU buildings were responsible of about 36% of the total European CO2 emissions [5]. Thus, to reach the EU’s energy and climate targets for 2030 (at least 40% cuts in greenhouse gas emissions from 1990 levels; 32% share for renewable energy, 32.5% improvement in energy efficiency [6]), buildings must reduce their energy consumption and use of fossil fuels. Thus can be fulfilled by improving the thermal behavior of building envelopes and by using smart techniques (smart thermostats or demand side management solutions) to manage energy consumption. Energy can also be saved by replacing existing heating and cooling plants with more efficient technologies. On the other hand, the reduction of reliance on fossil fuels can be achieved with the diffusion of RESs-based energy conversion systems to satisfy heating, cooling and electricity needs in the civil sector. As regards this last occurrence, in the pastyears, under the pressure of regulatory measures and international/national incentives, increased use of RESs has been observed and above all photovoltaic (PV) system exploitation has exhibited an unprecedented increase. Grid-connected PV capacity in the EU-28 has increased tenfold, from 11.3 GW in 2008 to over 117 GW in 2017. Consequently, in the EU-28 around 130 TWh of electricity has been produced from PV plants covering 4.8% of the final electricity demand. In the same year, in Italy, 440 MW of PV systems have been connected to the power grid, increasing the total installed capacity to 20.1 GW and providing 22.9 TWh of electricity (7.1% of the total electricity requirements in 2017) [7]. Thus, PV plants are nowadays a well-established technology that can be particularly suitable when coupled with air conditioning systems. Traditionally, Heating Ventilation and Air Condition (HVAC) systems coupled with solar thermal plants face two issues: the high investment cost and the difficulty to manage and operate the systems used in cooling operation that have not yet reached a satisfactory level of technological development [8]. On the contrary, the use of solar electric heating and cooling systems (SEHC) allows one to achieve high performance and to overcome various problems. Indeed, the cooling equipment used in SEHC is a mature technology well established in the market. In addition, SEHC plants operate in parallel with the power grid, making the whole system flexible. It is possible to feed in or take from the grid electricity when a surplus or deficit occurs, whereas it is not possible to manage the excess of thermal energy with the same flexibility in a solar thermal heating and cooling system and often there is a risk of wasting it. On the basis of these advantages in recent years many researchers have focused their attention on SEHC systems.
Some authors have compared SEHC system performance with that of solar thermal air conditioning plants. In [9] the authors have modelled and simulated different configurations for a solar-assisted heat pump meeting thermal, cooling and domestic hot water requests of a two-story building with various insulation levels. One configuration is composed by a SEHC system consisting of a heat pump connected to a PV plant (with a nominal peak power of 1.20 kW) and an electric storage system with a capacity varying from 1.2 to 19.2 kWh. Considering the highly and medium insulated building, the greatest energy reduction (−30% and −24%, respectively) is achieved by SEHC plant with a battery storage of 19.2 kWh, while, the solar thermal air conditioning system is the most profitable solution from an economic point of view in the highly insulated building case. In [10] researchers have investigated the performance of two different solar-assisted heat pump configurations: one coupled with thermal collectors and one with PV panels. The systems meet the heating and cooling load of an office building located in North Europe. The results show that the solar-assisted absorption heat pump ensures a higher renewable energy share with respect to the PV-activated heat pump. Nevertheless, the economic analysis indicates the electrically based systems are better. Nizetic et al. [11] have conducted experimental analysis on a PV-driven electric heat pump under three specific working regimes in a Mediterranean climate. They have found that the performance parameters calculated under all operating conditions encourage the use of this plant solution for small/medium civil applications in mild climates.
Bellos et al. [12] have studied different combinations of solar thermal/PV panels and heat pumps to identify the best plant configuration from the economic and energy viewpoint. They have found that the PV-assisted air source heat pump shows the best economic performance, instead the hybrid system composed by photovoltaic and thermal collectors coupled with a water source heat pump guarantees the best energy results. The performances of a SEHC system serving an office building in Romania have been compared to a thermal-driven solar heating and cooling plant [13]. The results indicate that the SEHC plant achieves a one-year solar cooling fraction equal to 36.6% while that of the thermal activated system is 24.5%. However, the unstable and discontinuous nature of the solar energy source make necessary to couple the SEHC with back-up sources or storage systems to smooth the system operation. Thus, several works have paid attention to defining the optimal plant configuration and size of SEHC systems. Different strategies have been studied to couple solar-assisted plants with batteries storage systems and all of them have highlighted the effectiveness of this configuration in reaching high levels of solar energy self-consumption [14,15,16,17]. The PV energy can be stored in either electric or thermal form as in [18] where a PV-driven electric heat pump installed in a reference building located in Sweden has been analyzed. Two different energy storage technologies have been investigated. One storage system is composed of batteries with a capacity of 48 kWh and another one is a hot water tank in which the photovoltaic electricity is stored as latent heat. The results demonstrate that the electric storage achieves the highest level of on-site consumption but also delivers the worst economic performance. The heat pump coupled with hot water storage tank achieves energy performances not far from those of the plant with the battery system, but on the contrary it shows a levelized cost of electricity more than two times lower than the plant with electric storage. Among the back-up sources used to circumvent the intermittent behavior of solar energy availability, the use of ground as a stable source of a heat pump driven by PV system, seems to be an attractive solution. Indeed, the literature is rich in works exploring the performances of ground source heat pumps (GSHPs) coupled with PV plants.
In [19] the authors have performed and energy and economic analysis of a system composed by a PV driving a GSHP varying the photovoltaic system capacity (2.5–10.0 kW) and the battery storage size (3.2–9.6 kWh). Litjens et al. [20] have proved by means of measured data that that PV system can provide around 19% of the GSHP electricity demand when installed in residential dwellings in The Netherlands, while enhanced batteries are able to reduce the peak electricity demand by 45%. In [21] and [22] the authors have investigated a stand-alone PV-GSHP plant by means of experimental data. On the contrary, in [23], [24] and [25] the performances of solar-assisted GSHP have been studied through dynamic simulations using the TRNSYS 17 software [26]. Other studies [27,28] have focused on the development of optimization models of PV-GSHP plants. The topic is very interesting and the aforementioned works are just a few of the extensive literature investigating these systems.
From the previous literature review the following gaps emerge:
- (i)
- the performances of SEHC technologies are often compared to those of air conditioning plants activated by solar thermal systems, neglecting the comparison among different SEHC plants consisting of various energy conversion systems;
- (ii)
- the PV-GSHP plant has been widely investigated in recent years, nevertheless, to the best of the authors’ knowledge, none have considered the effect of the adding a solar tracking system to PV-panels on the whole plant performance. This solution has been already analyzed in literature considering other configurations and it has shown encouraging results. For instance, in [29] the authors have considered the coupling of an air-conditioning unit based on a desiccant wheel with a photovoltaic plant including a solar tracking system. They have found that the PV-electricity production substantially grows for each tracking configuration compared with the standard fixed orientation.
Thus, the novelty of this work lies in the fact that both the previous issues are addressed in this paper for the first time. More precisely, two SEHC systems have been analyzed and compared from an energy and environmental point of view by dynamic simulation using the TRNSYS 17 software. Both plant configurations satisfy the electricity, space heating and cooling demand of a block of flats located in Naples (South of Italy). The first plant is based on a centralized electric heat pump coupled with obsolete conventional PV system installed 10 years ago. This solution is chosen because the use of EHP as main energy conversion system in Italian existing buildings is widespread since it has been recognized as technology able to reduce primary energy consumption [30]. The second one has a hybrid configuration, consisting of a ground-source heat pump, a low temperature thermal network and a series of electric heat pumps, one for each apartment. In addition, in this last solution, a high performance photovoltaic plant equipped with a solar tracking system and installed on the building roof produces electricity to feed the heat pumps and end-users. Five different solar tracking systems—vertical, two horizontal orientations, polar and two-axis trackers—have been considered and compared to a standard fixed configuration. This solution can be seen as an upgrade of an existing decentralized air conditioning system (as considered in [31]) in which the local electric heat pumps are converted into water-to-water devices that interact with the thermal grid representing the heat source/sink for them. The comparison among two systems has been conducted by considering both yearly and monthly average values of power grid efficiency and CO2 emission factors for electricity in the energy and environmental analysis. The values of these parameters are referred to the real Italian electricity production in 2017.
2. Users and Building Description
The building served by the considered energy conversion systems is a block of six flats located in Naples (South of Italy; Heating Degree Days = 1034, Italian climatic zone C). In Figure 1 the annual trend of air temperature for Naples, ranging from −3.00 °C to 35.00 °C is shown, while Figure 2 displays the total horizontal solar radiation trend for Naples. Obviously, it is higher in the summer period, achieving values up to 970 W/m2 and it decreases in winter months.
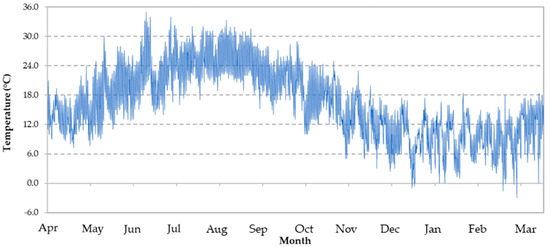
Figure 1.
Annual air temperature trend for Naples.
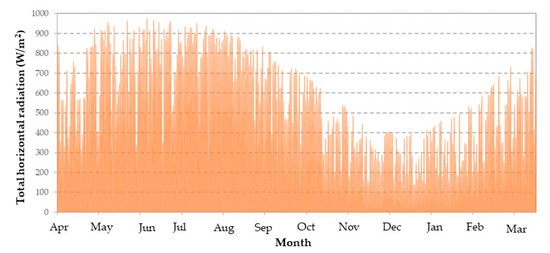
Figure 2.
Annual total solar horizontal radiation trend for Naples.
Each floor is composed of two 100 m2 apartments. The first two floors of the building are intended for office use while the remaining floors are occupied by households. There are 12 occupants in each office from 8:00 a.m. to 7:00 p.m. during working days, whereas there is nobody on holidays, Saturday and Sunday. As regards to residential users, four typical Italian families (two with four components and two with a couple of people) are taken into account. They are defined as follows:
- User#1: a couple of workers with two students;
- User#2: a couple of workers with one son and a retired person;
- User#3: a couple of workers;
- User#4: a couple of unemployed people.
The distribution of users in each flat is reported in Table 1, where the annual electricity, space heating and cooling demands are listed too. The apartments are named with an upper case letter “E” for the East-facing flats and “W” for the West-facing lodgings and a Roman numeral indicating the floor (I for the first floor, II for the second floor, etc.). The electric load of offices referred only to the typical equipment used for desk work (printers, computers, copiers, etc.) according to [32]. For each type of residential user, a specific annual stochastic electricity profile has been defined considering the occupancy of active households, their typical behavior, the lighting device and domestic appliances by means of a one-minute time resolution model developed by Richardson et al. [33].

Table 1.
User type and electricity, heating and cooling demand on annual basis for each flat.
The space heating demand is referred to a period that goes from 15 November to 31 March, that is the heating period considered by Italian legislation for climatic zone C [34]. Moreover, in that period, the heating systems are activated no more than 10 h/day to be compliant with Italian law requirements [35]. However, Italian legislation does not impose a limit for the cooling period that is chosen from 1 June to 30 September taking into account the typical environmental temperature trend. From 1 April to 31 May and from 1 October to 14 November, the SEHC systems do not operate, thus only the PV system is working and only electricity demand occurs. The total building annual energy requests for heating and cooling purpose are 14.15 MWh/y and 11.76 MWh/y, respectively and they are obtained through a dynamic simulation in the TRNSYS 17 environment using a 1.5 min’ time-step.
The thermal transmittance of each envelope component of the existing building is 0.39 W/m2K for the external vertical walls, 0.37 W/m2K for the flat roof and 0.42 W/m2K for the ground floor. The ground floor transmittance refers to a basement floor layer made of gravel and sand with a thermal conductivity of 2.0 W/(m K) according to [36]. The transmittance of windows is equal to 2.71 W/m2K including both glass and aluminum frame transmittances. The frame is 15% of total transparent component that is equipped with a low-e double glass (3/2.5) with a 12.7 mm interspace filled with argon and with a solar energy transmittance equal to 0.76. The total transparent surface represents about 20% of total vertical walls area.
3. Solar Electric Heating and Cooling Configurations and Components
Two solar electric heating and cooling systems are analyzed and compared in this work. Both of them satisfied the electricity, heating and cooling demands of the same building described in the previous section. The two SEHCs are centralized systems located in a plant room at the building ground floor and they are connected to each flat by means of a thermal grid (TG). It is 19.8 m long and it is composed by ducts with a diameter and thermal loss coefficient equal to 6.5 cm and 0.83 W/(m2 K), respectivetly. The TG is composed by two hydraulically balanced pipelines: one line supplies water to each flat and another one, counter-currently to the first line, collects water from each apartments and back towards the plant room.
The first SEHC plant analyzed and chosen as Reference System (RS) in this work is composed by a PVRS system coupled with an air to water electric heat pump (EHPRS) (Figure 3).
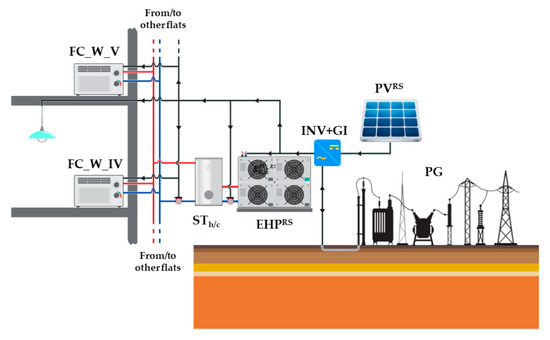
Figure 3.
RS layout scheme. FC_W_V/FC_W_IV: fan-coil of flat W_V and W_IV; STh/c: storage tank; EHPRS: air to water electric heat pump; PVRS: photovoltaic system; PG: power grid; INV+GI: inverter and grid interface.
Electricity produced by the photovoltaic panels is used both to activate the EHPRS and to satisfy the users‘ electricity needs. When there is a deficit or surplus of photovoltaic electricity it is possible to take/feed electricity from/to the external power grid (PG). A coupled inverter and grid interface system (INV+GI) manage the electricity produced from PVRS panels and the electricity flows to/from PG. The PVRS plant has been considered as installed on the roof of the analyzed building for a total power of 14.25 kWEl. The panels cover the maximum usable roof surface without shading each other and they are arranged in 3 strings of 19 units and face south. The modules have a tilt angle of 30°, other technical data are reported in Table 2 [37], instead the inverter characteristics are listed in Table 3 [38].
Table 2.
PVRS and PVPS panels technical data.
Table 3.
Inverter characteristics for RS and PS.
The EHPRS has a heating and cooling capacity equal to 63.7 kWTh and 60.3 kWCo, respectively. Its nominal coefficient of performance (COP) is equal to 3.12, whereas the energy efficiency ratio (EER) amounts to 3.00 [39]. The energy conversion system is linked to a hot/cold storage tank (STh/c) where the stored water is maintained in a temperature range equal to 50 ± 2 °C during the heating period and 8 ± 2 °C during cooling operation. The hot/cold water from STh/c is sent to each apartment by means of a thermal grid (TG) to which the heating/cooling terminals are connected.
The second SEHC plant, hereinafter considered as Proposed System (PS), consists of the PVPS plant coupled with a GSHP, a low temperature TG and a series of water-to-water EHPsPS located at each apartment (Figure 4). This configuration is an upgrade of an existing decentralized air conditioning system in which the local electric heat pumps are converted in water-to-water devices interacting with the thermal grid (TG) representing the heat source/sink for them. The PVPS system is composed by high performance panels [40] arranged in the fixed configuration of five rows of 11 modules with a total peak power of 22 kW, facing South. The main characteristics of the panels are listed in Table 2, while the inverter is the same of RS and its main features are listed in Table 3. The PVPS system are linked to the INV+GI system managing the electricity flows from the PVPS panels and the electricity flows from/to PG. As for the RS configuration, PVPS electricity production is used to meet electricity requests of both GSHP and users. When the photovoltaic electricity exceeds the demands, the surplus electric energy is supplied to power grid (PG). Vice versa, if an electricity deficit occurs, it is covered by taking electricity from PG. The analyzed GSHP has a cooling capacity and EER equal to 40.3 kWCo and 3.91 while during the heating period, its heating capacity amounts to 46.5 kW and COP is 3.82 [41]. It is a water to water EHP interacting with ground by means of nine boreholes (BOR) each of which is 93 m deep. The boreholes have been sized following the ASHRAE guidelines [42] and the parameters described in [43] have been used in the dimensioning. Thus, the total boreholes length is 837 m. The centralized GSHP is connected to a STh/c from which a TG departs connecting the centralized energy conversion system with the local EHPsPS at each flat. The water stored in the STh/c is maintained to 20 ± 2 °C in both heating and cooling mode. The water in TG is circulated by means of the circulating pump, only when one or more EHPsPS operates and the flow rate is regulated as a consequence. The EHPsPS are linked in parallel to TG that acts as a source/sink for the evaporators/condensers of the water to water heat pumps. Each EHPPS has a rated heating and cooling capacity of 7.63 kWTh and 6.28 kWCo, respectively, and a COP of 3.71 while the EER is equal to 3.63 [41]. This configuration ensures a better performance with respect to the plant before upgrading since the EHPsPS are able to interact with a source with a more stable temperature (water in TG) with respect to the temperature fluctuations of environment air.
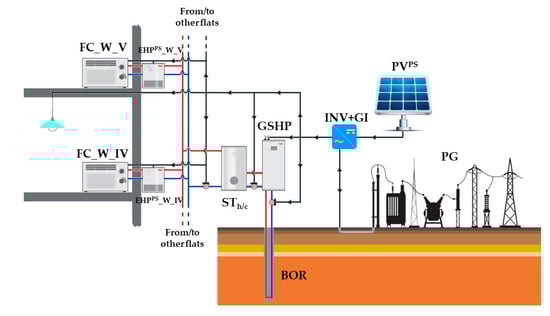
Figure 4.
PS layout scheme. FC_W_V/FC_W_IV: fan-coil of flat W_V and W_IV; STh/c: storage tank; EHPPS_W_V/EHPPS_W_IV: water to water electric heat pump of flat W_V and W_IV; PVPS: photovoltaic system; PG: power grid; INV+GI: inverter and grid interface; GSHP: ground source heat pump; BOR: boreholes.
The STh/c in both RS and PS is a vertical tank with a volume of 3 m3 and an insulation layer that covers the metal envelope, with a thickness of 10 cm and a thermal conductivity of 0.35 W/m K [44]. In addition, each flat is equipped with five fan-coils (FCs) with a cooling and heating capacity of 1.22 kWCo and 1.51 kWTh, respectively at water inlet temperature of 7 °C/50 °C [45]. A thermostat in each dwelling turns ON/OFF the terminals in order to reach the indoor air temperature of 26 ± 0.5 °C and 20 ± 0.5 °C in cooling and heating mode, respectively.
4. Description of Models
The building, RS and PS have been modeled in the TRNSYS 17 software in order to perform a yearly dynamic simulation with a 1.5 min time-step. The TRNSYS 17 program allows one to obtain the transient behavior of many energy systems activated by both fossil and renewables sources coupled or not with one or more buildings. Each component is modelled by means of an elementary “object” called “type” that describes its behavior by means of a mathematical model requiring input variables and parameters. The types can belong to TRNSYS standard library [46] or to the TESS (Thermal Energy Systems Specialists, Madison, WI, USA) library [47]. Hereinafter, a shortly description about simulation models is provided. Each component has been validated by various researchers on the basis of experimental results thus, in Table 4 the types, libraries and references reporting detailed description or validation process of main components used in the simulation are summarized. As regards to PS, “type 557” is adopted to model the boreholes as vertical pipes exchanging heat with ground. The mathematical model used to calculate the heat transfer fluid temperature is based on two methods: the explicit finite temperature approach and the analytic one. GSHP and EHPsPS at each dwelling are modelled trough “type 927” that defines the dynamic behavior of a water to water heat pump. More precisely, type 927 model depends upon constructor’s performance map of energy conversion system. It calculates the normalized heating capacity by means of an interpolation of temperatures and flow rates of heat transfer fluids at ground and load side. Also, the centralized air to water heat pump of RS is modelled by means of a model based on the manufacturer’s performance map data implemented in “type 941”.
Table 4.
Main device, type number, libraries and reference for description/validation models.
In addition, the following components are common to both PS and RS and they have been modelled using the same types in both systems. “Type 534” is adopted to model STh/c as a vertical cylindrical buffer separated into a certain number of smaller superimposed cylinders. The temperature in each section is supposed uniform and it is evaluated through the solution energy balance equations. The two pipes heating/cooling terminals are simulated using “type 600” which models an air handling appliance in which the heat transfer between the air stream crossing the coil and the hot or cold water contained in it, occurs. The ducts of TG and the thermal behavior of water flowing through them are described by type 31. PV panels are modelled through type 94 that simulates the current-voltage characteristics of a single module using the performance data of PV panel provided by constructor. Moreover, the inverter is defined by type 48 based on a constant efficiency model including the direct current from PV systems and the electricity demands of users to regulate the feeding or drawing of electricity from/to power grid. Finally, the building is modelled by type 56 that returns the dynamic behavior of a building with more than one thermal zones.
5. Methodology
A SEHC system well-designed should export a little amount of electricity to power grid, maximizing the photovoltaic electricity on-site consumption. Thus, as first step, RS and PS have been compared assessing two indices that express the on-site use of renewable electricity in both SEHC systems. The first index, s, returns the amount of electricity requested by SEHC systems and covered by PV plants. It is defined for RS (sRS) and PS (sPS) as reported in Equations (1) and (2), respectively:
where and are the electricity delivered by the RS and PS PV plants, respectively, and used on-site to satisfy the electricity demand, whereas, , are the electricity demands of the centralized EHP and plant auxiliaries in RS. As regards to Equation (2), is the electricity used to activate GSHP in PS while is the electricity demand of decentralized EHPs in PS. In addition, is the electricity required by auxiliaries of PS. In both Equations (1) and (2) is the electricity demand of residential and office users.
The second index, d, is the ratio between the photovoltaic electricity used on-site to satisfy the electricity requests and the total electricity produced by PV systems defined as for PS and for RS. Thereby, dRS (Equation (3)) and dPS (Equation (4)) are expressed as follows:
The comparison of PS and RS energy performances has been performed by calculating the Primary Fossil Energy Saving (PFES) index. This parameter indicates the amount of primary energy due to fossil fuels avoided thanks to the employment of PS instead of RS. PFES is defined as reported in Equation (5):
where:
Primary energy of RS (PERS) and PS (PEPS) are defined as a ratio in which at numerator there is the electricity imported from power grid by RS () and PS () reduced by the electricity exported to power grid by RS () and PS (), respectively, while, the denominator consists of the power grid efficiency (). Thus, the exported electricity is considered as a credit in primary energy calculation in agreement with the approach proposed by International Energy Agency [49].
The environmental performances of SEHC systems are compared by means of avoided carbon dioxide emissions parameter (ΔCO2) determined as:
where:
The carbon dioxide emissions of RS () and PS () are obtained multiplying the electricity taken from PG reduced by the electricity fed into PG, by the carbon dioxide emission factor for electricity (α). Following the same method used for the energy analysis, the electricity exported to the power grid is accounted as a credit in CO2 emissions evaluation. All the energy flows reported in the previous equations have been evaluated as the sum of the corresponding quantity in each time-step of the performed dynamic simulation.
The power grid efficiency () and CO2 emission factor for electricity (α) adopted in the energy and environmental analysis are referred to the Italian electricity production from fossil-based and renewables-based power plants in 2017. The most of works investigating SEHC performances used fixed efficiency and environmental parameters for power grid. Nevertheless, and α can substantially vary all over the year due to the variability of electricity production mix. Thus, in this paper, the energy and environmental analysis have been performed considering two scenarios:
- Scenario_YV (YV): in which the average annual values of and α are used in the evaluation. In particular, the average yearly calculated on the basis of hourly Italian power grid efficiency amounts to 0.710 while the average annual α is equal to 356 gCO2/kWhEl. [50].
- Scenario_MV (MV): that takes in two account the average monthly values of and α evaluated in [50] and summarized in Table 5
Table 5. Average monthly values of and α referred to Italian electricity production in 2017 [50].
In addition, energy and environmental evaluation have been carried out considering different solar tacking system solutions for high-performance panels of PS. The possible configurations are summarized in the following bulleted list:
- FIXED: the panels have a fixed position and they cannot move. They face South with a tilt angle of 30°;
- VAT: the modules rotate around a vertical axis following the Sun from East to West maintaining their tilt angle of 30°;
- 2AT: the panels rotate around two axes following solar azimuth and zenith angles;
- HAT_EW: the panels rotate around a horizontal axis oriented from East to West following the solar zenith angle variation;
- HAT_NS: the panels rotate around a horizontal axis oriented from North to South following the solar azimuth angle variation;
- PAT: the panels rotate from East to West around an axis that faces South with a tilt angle equal to the location latitude (41° 08′ N).
The FIXED case is considered for both RS and PS, while the reaming five cases are analyzed only for PS.
6. Results and Discussion
In order to assess the PS behavior, the mean temperature of the boreholes during the simulation has been analyzed (Figure 5). It can be noticed that the borehole temperature rises during the cooling period that represents the charging phase and it decreases during heating operations (discharge phase). The maximum temperature value is about 20.5 °C, while the minimum is 16.9 °C. The thermal drift phenomenon during the year is not significant.
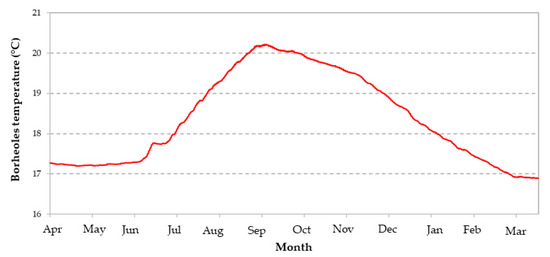
Figure 5.
Simulated mean temperature of boreholes for one year.
The results of dynamic simulation recorded with a 1.5 min time-step for both RS and PS, have been elaborated to compare the SEHC systems form an energy and environmental viewpoint following the methodology described in the previous section. The following outcomes have been divided in winter (WIN) and Summer (SUM) period where winter period includes the months of heating operation and autumn from 1 October to 15 November, while summer period is referred to months of cooling operation and the springtime from 1 April to 31 May. In addition, the subsequent histograms (Figure 6, Figure 7, Figure 8 and Figure 9) show the results with this logic:
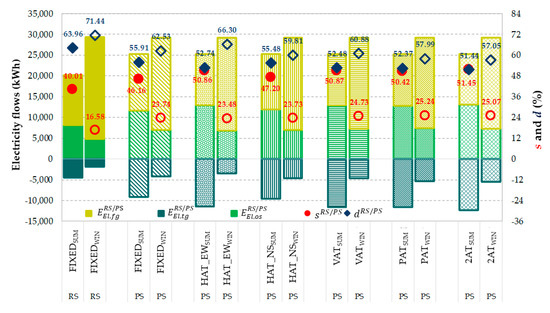
Figure 6.
Electricity flows, s and d index for RS and PS in all solar tracker system configurations on seasonal basis.
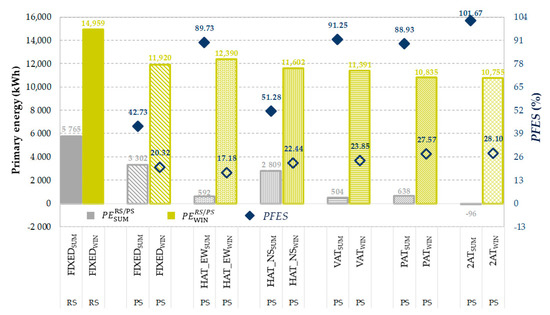
Figure 7.
Primary energy demand of RS and PS, PFES index in Scenario_MV.
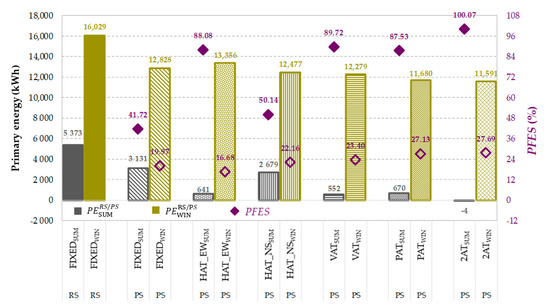
Figure 8.
Primary energy demand of RS and PS, PFES index in Scenario_YV.
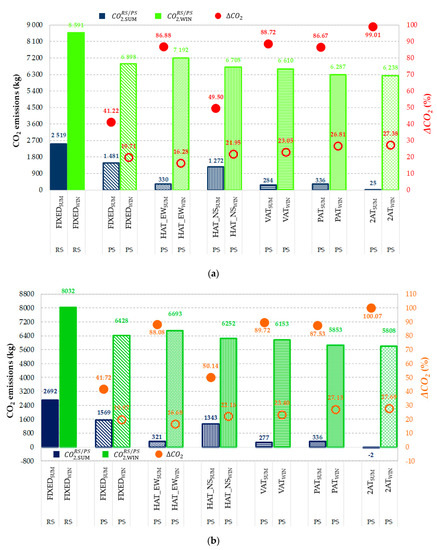
Figure 9.
CO2 emissions of RS and PS, ΔCO2 index in Scenario_MV (a) and Scenario_YV (b).
- the first two bars refer to RS and they are color-filled;
- the remaining bars are referred to the solar tracking system configurations of PS. Each configuration is distinguished by a various patterned fill, maintaining the same colors used for SUM and WIN bars of RS;
- the color filled markers indicate indices in SUM, while the empty markers refer to same indices in WIN.
- For each couple of bars, both for RS and PS, the first one refers to SUM and the second one to WIN.
In Figure 6 s and d parameters are showed for both RS and PS with reference to each configuration of solar tracking system analyzed. Furthermore, the electricity flows corresponding to electricity fed/taken to/from power grid and on-site consumed in summer and winter periods by RS and PS are represented. The values achieved by s index are significantly higher in PS than RS. More precisely, in summer period s index of RS amounts to 40.01% while, by considering PS, it ranges from 46.16% when panels have a fixed position (FIXED case) to 51.45% when panels rotate around two axes (2AT case). With reference to winter period, the s index maintains the same trend, but it reaches lower values for both RS and PS in all solar tracking system configurations. Indeed, the greatest values achieved by s parameter in summer period depend upon the large availability of electricity from PV systems. The amount of photovoltaic electricity consumed on-site with respect to the total renewable electricity production (d index) reaches its maximum value in winter period for RS (71.44%). It has been observed that in those months the availability of electricity from PVRS system is particularly limited. The highest value of d index for PS takes place when the panels rotate around a horizontal axis oriented from East to West (66.30% HAT_EW case) in winter period, when, the denominator of d index (Equation (3)) is lowest as it can be seen from the sum of the bars representing the electricity exported to the power grid () and the electricity consumed on-site () in Figure 6.
In Figure 7 the results of energy analysis in the Scenario_MV are displayed. In particular, the primary energy consumption for reference and proposed system (PERS, PEPS) and the primary fuel energy saving index (PFES) in all cases are shown. The PERS in both winter and summer period is higher than PEPS for all considered configuration of solar tracking system in PS. Even if the FIXED position for modules (that is the only one solution taken into account in RS) is examined, the PS is awards because it is equipped with high-performance panels with respect to the obsolete modules installed in RS. Referring to PS, the best configuration for solar tracker is 2AT (in which the panels rotate around two axes) since it ensures a negative PEPS (−96 kWh) in summer period and the lowest PEPS in winter period (10,755 kWh). The negative value means that the electricity exported to the grid (), accounted as a credit in PEPS evaluation (Equation (7)) is higher that the electricity taken from the gird (). As a general consideration, in summer period the primary energy demand is lower than winter period in both SEHC systems since the amount of electricity taken from the grid is little thanks to the photovoltaic electricity availability increases. Thereby, by comparing RS and PS equipped with a two axis tracker system (2AT), a PFES index of 101.67% is achieved in summer period and 28.10% in winter period. These one are the highest values recorded for PFES index, even if, for all configurations the energy analysis rewards PS. Indeed, PFES index is always positive assuming the lowest values (42.73%) when a fixed position (FIXED) for modules in PS is considered in SUM, and when a horizontal axis oriented from East to West (HAT_EW) is chosen for the solar tracker system (17.18%) in winter (WIN).
In Figure 8 the outcomes of energy analysis referred to scenario in which the average yearly values of power grid efficiency are considered (Scenario_YV), are represented. The trends of PERS, PEPS and PFES index are the same of scenario in which the average monthly values of power grid efficiency are accounted (Scenario_MV), even if the values achieved are different. This variation lies in the fact that in Scenario_YV a fixed value of power gird efficiency () is used for accounting primary energies of both systems (PEPS and PERS), neglecting the intrinsic variation of this parameter.
This approach is often adopted in literature and it can prejudice the results. Indeed, the energy benefits achieved by using PS instead of RS (in all configuration) are underestimated if Scenario_YV is considered instead of Scenario_MV. For instance, PFES in summer (SUM) for the case in which the panels rotate from East to West around a tilted axis (PAT case), decreases from 88.93% (in Scenario_MV) to 87.53%. Moreover, the differences between the two scenarios are more evident in SUM due to the occurrence that during this period has a higher fluctuation with respect to fixed value because of the penetration of the of the intermittent solar-based electricity in production mix. As regards to environmental analysis, in Figure 9a,b , and ΔCO2 indexes are reported both for Scenario_MV and Scenario_YV, respectively.
RS is responsible of the greatest carbon dioxide emissions in both scenarios. By analyzing all cases analyzed for solar tracker system in PS, the best environmental performances are achieved when the panels rotate around two axes (2AT case) both in Scenario_MV and Scenario_YV. Thus, 2AT case for PS results also in the best solution for the comparative environmental analysis since ΔCO2 amounts to 99.01% (Scenario_MV) and 100.07% (Scenatio_YV).
The use of average monthly values of α parameter in the environmental analysis of Scenario_MV leads to outcomes different from those one obtained for Scenario_YV. More precisely, the avoided CO2 index (ΔCO2) is overestimated if a fixed α factor is adopted, and the increase percentage varies from 1% to about 3% among all cases of Scenario_YV and Scenario_MV.
Hereinafter, the analysis performed with reference to all year not considering the seasonal division, is presented and discussed.
Figure 10 shows the electricity flows, s and d indices for RS and PS on annual basis. The sum of electricity taken from the power grid and the electricity exported to the power grid for each bar of histogram, represents the electricity requests of SEHC systems. It can be observed that, as expected, the electricity demand of PS does not change by considering different solar tracker configurations, in addition, the overall electricity requirement of RS system is lower than that of PS. This fact is due to the greater complexity of PS system. Nevertheless, a substantial difference exists between the value achieved by s index in RS (26.12%) and all configurations of PS.
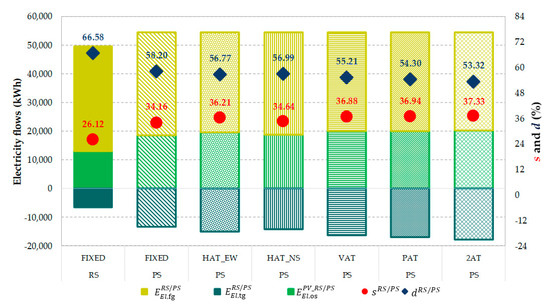
Figure 10.
Electricity flows, s and d index for RS and PS in all solar tracker system configurations on annual basis.
Referring to PS, the solar radiation exploitation improves by considering a solar tracker system with respect to the fixed position of solar panels and the best solution results again in the full tracking system (2AT), for which 37.33% (s index) of overall electricity demand is covered by photovoltaic electricity. However, not significant variations are observed by comparing s index of HAT_EW, VAT and PAT cases as well as by comparing s index in FIXED case and when the panels the panels rotate around a horizontal axis oriented from North to South (HAT_NS case). In addition, by analyzing the electricity flows of PS, it can be noticed that even if the availability of photovoltaic electricity increases by equipping the PVPS plant with a solar tracker system, the electricity consumed on-site does not grow correspondingly. Vice versa, the electricity exported to power grid rises. This is due the fact that a certain electric load occurs in the evening hours when PV electricity is not available, while during the middle of the day (when photovoltaic energy availability is higher and the load is lower) the electricity is fed into power grid. Thus, the results can be improved by adding an electric storage to the PS plant in order to better manage the photovoltaic electricity and the matching with the electric load. As regards to d index, the results awards RS, indeed 66.58% of the electricity produced by PV system is consumed on-site. By considering the high-performance panels in RS the photovoltaic electricity production increases but also a larger amount of it is exported to the power grid resulting in lower values of d index that reaches 58.20% in FIXED case.
The above considerations affect the energy analysis results on annual basis evaluated in terms of primary energy demand and PFES index in both scenarios (MV) and (YV) (Figure 11). The first two bars in Figure 11. are referred to RS in Scenario_MV and YV, while the remaining bars consider PS in all solar tracker configurations and in both scenarios. PERS is always significantly higher than PEPS, thus PFES index is always positive varying from 26.55% (FIXED case) to 48.57% (2AT case) for Scenario_MV (average monthly values of power grid efficiency) and from 25.43% (FIXED case) to 45.86% (2AT case) in Scenario_YV (average yearly values of power grid efficiency). The full solar tracking system reappears the best solution in both scenarios and it achieves the highest performances when the more accurate analysis conducted by using monthly average values of is performed. In particular, it has been found that the variation between PFES index in Scenario_MV and YV ranges from one to three points percentage.
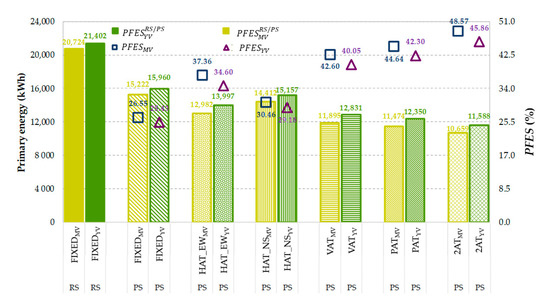
Figure 11.
Energy analysis on annual basis in both Scenario_MV and YV.
Figure 12 displays the environmental analysis outcomes on annual basis in both MV and YV scenarios. The RS shows the worst performances compared to PS with all solar tracking systems selected guarantying positive values for ΔCO2 index up to 45.86% (2AT case in Scenario_YV). From environmental viewpoint 2AT case is confirmed the best configuration while the highest CO2 emissions are achieved for PS system equipped with PV panels in fixed position followed by cases in which the panels rotate around a horizontal axis oriented from North to South (HAT_NS) or from East to West (HAT_EW case). CO2 emissions when the modules rotate around a vertical axis (VAT case) and when they rotate from East to West around an axis that faces South (PAT case) are not so far from the best case.
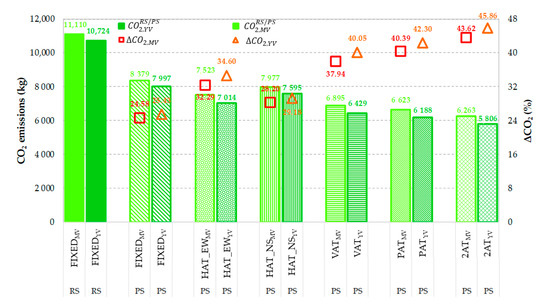
Figure 12.
Environmental analysis on annual basis in both Scenario_MV and YV.
By comparing the two scenarios, ΔCO2 index can assume in Scenario_MV values up to 3 percentage points lower than those achieved in Scenario_YV.
Definitely, in Table 6 are summarized the annual energy and environmental analysis results as well as the values of s and d indices. The outcomes are referred to both reference and proposed system for each configuration of solar tracker system in Scenario_MV and YV.
Table 6.
Energy and environmental analysis results on annual basis for PS and RS in both scenarios.
Finally, it is useful to discuss the economic aspects concerning both PS and RS.
Table 7 reports the investment cost of each component of both systems and the corresponding references where they have been resumed. The total cost of PS is significantly higher than those of RS, since the cost to drill boreholes and the cost of solar tracking systems affect a lot the investment resulting in an extra-cost ranging from about 145,000 € (in FIXED case) to 167,000 € (in 2AT case). Instead, considering a unitary electricity price equal to electricity of 0.2 €/kWhEl for the electricity imported from grid and to 0.12 €/kWhEl for electricity exported to the power grid [19], the difference between the operating cost of RS and PS is positive. In particular, it varies from about 985 €/y (in FIXED case) to 1861 €/y in (2AT case). It is clear that the PS is penalized in the economic analysis by its plant complexity and by the lack of commercial maturity for its innovative components. Indeed, the payback period is very high. Nevertheless, it could be possible to achieve better economic outcomes by considering some financial support mechanisms only for PS that is able to reach significant benefits from energy and environmental viewpoints with respect to RS.
Table 7.
Components investment cost of RS and PS and the corresponding reference.
7. Conclusions
In this paper two solar electric heating and cooling systems have been compared from an energy and environmental viewpoint. Both systems satisfy the heating, cooling and electricity demand of a block of flats located in Naples (South of Italy). The first plant, considered as the reference system, consists of a centralized electric heat pump coupled with a photovoltaic plant. The second plant is composed by a centralized ground-source heat pump, a low temperature thermal network and a series of electric heat pumps, one for each apartment. Furthermore, the plant is coupled with a high-performance photovoltaic system. The last configuration, intended as proposed system, can be seen as an upgrade of an existing decentralized air conditioning system in which the local electric heat pumps are converted in water-to-water devices that interact with the thermal grid representing the heat source/sink for them. In both solar electric heating and cooling plants the photovoltaic system is installed on the building roof and it produces electricity to feed heat pumps and end-users. The deficit or surplus of electricity is taken/fed from/to power grid. The reference and proposed systems as well as the building have been modeled and simulated in the dynamic simulation software TRNSYS 17. The outcomes of simulations have been used to perform an energy and environmental analysis by considering yearly and monthly average values of power grid efficiency and emission factors for electricity and five different solar tracking systems for the high-performance photovoltaic plant of proposed system. In particular, the analyzed solutions are realized with vertical, two horizontal orientations, polar and two-axis trackers and they have been compared with the standard fixed configuration. The main outcomes can be summarized as follows:
- even if the proposed system has a high complex plant layout, it achieves good results in terms of primary energy savings and avoidance of carbon dioxide emissions in comparison with the reference system. These good performances are ensured by the high-performance photovoltaic plant considered in the proposed system. Indeed, by comparing reference system and proposed one equipped with a two-axis tracker system a primary energy saving of 101.67% is achieved in summer period and 28.10% in winter period. Moreover, the avoided carbon dioxide emission index is always positive, reaching the maximum value of 45.86% when a two axis tracker system is considered;
- the use of a solar tracking system guarantees a better exploitation of solar radiation than the standard fixed configuration and the best solution is that one that allows the panels rotation around two axes following solar azimuth and zenith angles. Thus, by considering the average monthly values of environmental and efficiency indicators, the highest values of primary energy fossil energy saving index (48.57%) and carbon dioxide emission factors index (43.62%) are achieved when the two-axis solar tracking system is accounted in the comparison;
- the improvement in solar radiation exploitation going from a standard fixed configuration of panels to that one equipped with a solar tracking system, does not correspond to a significant increase in electricity consumed on-site. Vice versa, it results in an increase in the amount of electricity exported to the power grid. This is due to a time-shift between the electricity demand occurrence and the availability of photovoltaic electricity;
- the use of average monthly values for power grid efficiency and emission factor for electricity lead to different results than those one achieved by adopting average yearly values. In particular, a difference up to three percentage points has been recorded in the environmental and energy indices between the two calculation methods.
Thus, further improvements of this work will concern the investigations of solar electric heating and cooling systems coupled with electric storage or electric vehicles, in order to solve the issue regarding the matching of photovoltaic electricity availability and electricity demands. Furthermore, it will be possible to detail the analysis taking into account the real hourly values of energy and environmental parameters to discover how a more accurate analysis, in terms of time-resolution of adopted factors, can affect the outcomes. Another possible advance of this paper deals with the validation of the current simulation results on an existing system.
Author Contributions
E.M., C.R. and F.T. contributed to the design and implementation of the research, to the analysis of the results and to the writing of the manuscript. All authors have read and agreed to the published version of the manuscript.
Funding
The authors gratefully acknowledge the financial support of GeoGrid project POR Campania FESR 2014/2020 CUP B43D18000230007.
Conflicts of Interest
The authors declare no conflict of interest.
Nomenclature
| E | Energy (kWh) |
| EER | Energy Efficiency Ratio (-) |
| COP | Coefficient Of Performance (-) |
| CO2 | Carbon dioxide emission (kgCO2) |
| PE | Primary Energy (kWh) |
| PFES | Primary Fossil Energy Saving index (%) |
| s | Ratio between the photovoltaic electricity on-site consumed and the total electricity request (%) |
| Greek symbols | |
| α | Emission factor for electricity (gCO2/kWhEl) |
| η | Efficiency (-) |
| ΔCO2 | Avoided Carbon dioxide emissions (%) |
| Subscripts | |
| Co | Cooling |
| El | Electric |
| fg | from power grid |
| h/c | Hot/cold water |
| os | On-site |
| tg | To power grid |
| Th | Thermal |
| Superscripts and Acronyms | |
| AUX | Auxiliaries equipment |
| BOR | Boreholes |
| E | Est |
| EHP | Electric Heat Pump |
| FC | Fan-coil |
| FIXED | Fixed axis |
| GSHP | Ground Source Heat Pump |
| HAT_EW | Horizontal Axis Tracker (from East to West) |
| HAT_NS | Horizontal Axis Tracker (from North to South) |
| INV+GI | Inverter and Grid Interface system |
| MV | Referred to Scenario_MV that considers average monthly values of efficiency and environmental parameters of power grid. |
| PAT | Polar Axis Tracker |
| PG | Power Grid |
| PV | Photovoltaic |
| RESs | Renewable energy sources |
| RS | Reference System |
| SEHC | Solar Electric Heating and Cooling |
| ST | Storage Thank |
| SUM | Summer |
| TG | Thermal Grid |
| US | Users |
| VAT | Vertical Axis Tracker |
| W | West |
| WIN | Winter |
| YV | Referred to Scenario_YV that considers average annual values of efficiency and environmental parameters of power grid. |
| 2AT | Two Axis Tracker |
References
- IEA. International Energy Agency. Data and Statistics. Available online: https://www.iea.org/data-and-statistics/data-tables?country=EU28 (accessed on 4 June 2020).
- EC. European Commission. Heating and Cooling. Available online: https://ec.europa.eu/energy/topics/energy-efficiency/heating-and-cooling_en (accessed on 5 June 2020).
- ENEA. Italian Institute for New Technologies, Energy and the Environment. Rapporto Annuale Sull’Efficienza Energetica 2019. Available online: https://www.efficienzaenergetica.enea.it/ (accessed on 5 June 2020).
- Eurostat. Statistical Office of the European Communities. Key Figures on Europe Statistics Illustrated 2019. Available online: https://ec.europa.eu/eurostat/documents/3217494/10164469/KS-EI-19-001-EN-N.pdf (accessed on 5 June 2020).
- EC. European Commission. New Rules for Greener and Smarter Buildings Will Increase Quality of Life for All Europeans. Available online: https://ec.europa.eu/info/news/new-rules-greener-and-smarter-buildings-will-increase-quality-life-all-europeans-2019-apr-15_en (accessed on 5 June 2020).
- Communication from the Commission to the European Parliament, the Council, the European Economic and Social Committee and the Committee of the Regions. A Policy Framework for Climate and Energy in the Period From 2020 to 2030. Available online: https://eur-lex.europa.eu/legal-content/EN/TXT/?uri=CELEX:52014DC0015 (accessed on 5 June 2020).
- Jäger-Waldau, A. PV Status Report 2019; EUR 29938 EN; Publications Office of the European Union: Luxembourg, 2019; ISBN 978-92-76-12608-9. JRC118058. [Google Scholar] [CrossRef]
- Marrasso, E.; Roselli, C.; Sasso, M.; Tariello, F. Analysis of a hybrid solar-assisted trigeneration system. Energies 2016, 9, 705. [Google Scholar] [CrossRef]
- Pinamonti, M.; Baggio, P. Energy and economic optimization of solar-assisted heat pump systems with storage technologies for heating and cooling in residential buildings. Renew. Energy 2020, 157, 90–99. [Google Scholar] [CrossRef]
- Reda, F.; Paiho, S.; Pasonen, S.; Helm, M.; Menhart, F.; Schex, R.; Laitinen, A. Comparison of solar assisted heat pump solutions for office building applications in Northern climate. Renew. Energy 2020, 147, 1392–1417. [Google Scholar] [CrossRef]
- Nizetic, S.; Coko, D.; Marasovic, I. Experimental study on a hybrid energy system with small- and medium-scale applications for mild climates. Energy 2014, 75, 379–389. [Google Scholar] [CrossRef]
- Bellos, E.; Tzivanidis, C.; Moschos, K.; Antonopoulos, K.A. Energetic and financial evaluation of solar assisted heat pump space heating systems. Energy Convers. Manag. 2016, 120, 306–319. [Google Scholar] [CrossRef]
- Porumb, R.; Bălan, M. Baseline evaluation of potential to use solar radiation in air conditioning applications. Energy Procedia 2016, 85, 442–451. [Google Scholar] [CrossRef][Green Version]
- Yang, L.; Tai, N.; Fan, C.; Meng, Y. Energy regulating and fluctuation stabilizing by air source heat pump and battery energy storage system in microgrid. Renew. Energy 2016, 95, 202–212. [Google Scholar] [CrossRef]
- Terlouw, T.; AlSkaif, T.; Bauer, C.; Van Sark, W. Optimal energy management in all-electric residential energy systems with heat and electricity storage. Appl. Energy 2019, 254, 113580. [Google Scholar] [CrossRef]
- Fischer, D.; Madani, H. On heat pumps in smart grids: A review. Renew. Sustain. Energy Rev. 2017, 70, 342–357. [Google Scholar] [CrossRef]
- Song, Y.; Hu, W.; Xu, X.; Huang, Q.; Chen, G.; Han, X.; Chen, Z. Optimal investment strategies for solar energy based systems. Energies 2019, 12, 2826. [Google Scholar] [CrossRef]
- Thygesen, R.; Karlsson, B. Simulation and analysis of a solar assisted heat pump system with two different storage types for high levels of PV electricity self-consumption. Sol. Energy 2014, 103, 19–27. [Google Scholar] [CrossRef]
- Roselli, C.; Diglio, G.; Sasso, M.; Tariello, F. A novel energy index to assess the impact of a solar PV-based ground source heat pump on the power grid. Renew. Energy 2019, 143, 488–500. [Google Scholar] [CrossRef]
- Litjens, G.B.M.A.; Worrell, E.; Van Sark, W.G.J.H.M. Lowering greenhouse gas emissions in the built environment by combining ground source heat pumps, photovoltaics and battery storage. Energy Build. 2018, 180, 51–71. [Google Scholar] [CrossRef]
- Anifantis, A.S.; Colantoni, A.; Pascuzzi, S. Thermal energy assessment of a small scale photovoltaic, hydrogen and geothermal stand-alone system for greenhouse heating. Renew. Energy 2017, 103, 115–127. [Google Scholar] [CrossRef]
- Gurler, T.; Elmer, T.; Cui, Y.; Omer, S.; Riffat, S. Experimental investigation of a novel PVt/heat pump system for energy-efficient poultry houses. Int. J. Low Carbon Technol. 2018, 13, 404–413. [Google Scholar] [CrossRef]
- Xia, L.; Ma, Z.; Kokogiannakis, G.; Wang, S.; Gong, X. A model-based optimal control strategy for ground source heat pump systems with integrated solar photovoltaic thermal collectors. Appl. Energy 2018, 228, 1399–1412. [Google Scholar] [CrossRef]
- Yildirim, N.; Bilir, L. Evaluation of a hybrid system for a nearly zero energy greenhouse. Energy Convers. Manag. 2017, 148, 1278–1290. [Google Scholar] [CrossRef]
- Nakomčić Smaragdakis, B.B.; Dragutinović, N.G. Hybrid renewable energy system application for electricity and heat supply of a residential building. Therm. Sci. 2016, 20, 695–706. [Google Scholar] [CrossRef]
- TRNSYS 17. A TRaNsient System Simulation Program; Solar Energy Laboratory, University of Wisconsin: Wisconsin, MD, USA, 2010. [Google Scholar]
- Tu, T.; Rajarathnam, G.P.; Vassallo, A.M. Optimization of a stand-alone photovoltaic-wind-diesel-battery system with multi-layered demand scheduling. Renew. Energy 2019, 131, 333–347. [Google Scholar] [CrossRef]
- Abbasi, Y.; Baniasadi, E.; Ahmadikia, H. Performance assessment of a hybrid solar-geothermal air conditioning system for residential application: Energy, exergy, and sustainability analysis. Int. J. Chem. Eng. 2016, 2016, 13. [Google Scholar] [CrossRef]
- Roselli, C.; Tariello, F.; Sasso, M. Assessment of a solar PV-driven desiccant-based air handling unit with different tracking systems. Sustain. Energy Technol. 2019, 34, 146–156. [Google Scholar] [CrossRef]
- Jarre, M.; Noussan, M.; Poggio, A.; Simonetti, M. Opportunities for heat pumps adoption in existing buildings: Real-data analysis and numerical simulation. Energy Procedia 2017, 134, 499–507. [Google Scholar] [CrossRef][Green Version]
- Marrasso, E.; Roselli, C.; Sasso, M.; Tariello, F. Global and local environmental and energy advantages of a geothermal heat pump interacting with a low temperature thermal micro grid. Energy Convers. Manag. 2018, 172, 540–553. [Google Scholar] [CrossRef]
- Menezes, A.C.; Cripps, A.; Buswell, R.A.; Wright, J.; Bouchlaghem, D. Estimating the energy consumption and power demand of small power equipment in office buildings. Energy Build. 2014, 75, 199–209. [Google Scholar] [CrossRef]
- Richardson, I.; Thomas, M.; Infield, D.; Cifford, C. Domestic electricity use: A high resolution energy demand model. Energy Build. 2010, 42, 1878–1887. [Google Scholar] [CrossRef]
- UNI TS 11300-2. Energy Performance of Buildings. Part 2: Evaluation of Primary Energy Need and System Efficiencies for Space Heating and Domestic Hot Water Production. 2008. Available online: https://infostore.saiglobal.com/en-us/Standards/UNI-TS-11300-2-2008-1074840_SAIG_UNI_UNI_2504623/ (accessed on 10 July 2020).
- Italian Decree, D.P.R. 26 August 1993, n. 412. Regulation for the design, installation, operation and maintenance of heating system in building for the purpose of reducing consumption energy. (in Italian)
- CEN. Heating Systems in Buildings—Method for Calculation of the Design Heat Load; EN 12831; European Standard, European Committee for Standardization (CEN): Brussels, Belgium, 2003. [Google Scholar]
- Conergy. Technical Datasheet PowerPlus 250P. Available online: https://www.energyplan.it/documenti/Conergy-Power-Plus-230P-250P.pdf (accessed on 12 June 2020).
- ABB. Datasheet Solar Inverter. Available online: https://library.e.abb.com/public/f3d233db0c1dced0c1257e1900268eab/TRIO-20.0-27.6-TL-OUTD-Product%20manual%20IT-RevE(M000001EI).pdf (accessed on 12 June 2020).
- Technical Data-Sheet Aermec NLC 0280/300. Available online: https://global.aermec.com/it/products/scheda-prodotto/?t=Refrigeratori%20e%20pompe%20di%20calore%20aria-acqua&c=CAT_50HZ_UE&f=chiller_air&Code=NLC_1503_HP (accessed on 12 June 2020).
- High Efficiency Photovoltaic Panels Technical Data Sheet. Available online: https://www.sunpower.com.au/sites/default/files/2019-07/max3-400-390-370-au_0.pdf (accessed on 18 June 2020).
- Technical Booklet Aermec WRL Water/Water Reversible Heat Pumps for Geothermal Applications. Available online: http://download.aermec.com/docs/istr/wrl_1hp_t-en.pdf?r=1813 (accessed on 12 June 2020).
- Kavanaugh, S.P.; Rafferty, K. Ground-Source Heat Pumps—Design of Geothermal System for Commercial and Institutional Buildings; ASHRAE Applications Handbook: Atlanta, GA, USA, 1997. [Google Scholar]
- Angrisani, G.; Diglio, G.; Sasso, M.; Calise, F.; Dentice d’Accadia, M. Design of a novel geothermal heating and cooling system: Energy and economic analysis. Energy Convers. Manag. 2016, 108, 144–159. [Google Scholar] [CrossRef]
- Technical Data-Sheet Cordivari Puffer VT COMPACT. Available online: https://www.cordivari.it/downloads/7750/2085/SCHEDA_TECNICA_ACQUA_RISCALDAMENTO_PUFFER_COMPACT.pdf (accessed on 12 June 2020).
- Technical Data-Sheet Aermec Fan Coil FCX. Available online: http://download.aermec.com/docs/schede/fcx_en.pdf?r=8744 (accessed on 12 June 2020).
- TRNSYS 17 Mathematical Reference. Available online: http://web.mit.edu/parmstr/Public/TRNSYS/04-MathematicalReference.pdf (accessed on 15 June 2020).
- Thermal Energy System Specialists. Component Libraries v.17.01 for TRNSYS v.17.0 and the TRNSYS Simulation Studio, Parameter/Input/Output Reference Manual; Thermal Energy System Specialists: Madison, WI, USA, 2004. [Google Scholar]
- Chu, J. Evaluation of a Dual Tank Indirect Solar-Assisted Heat Pump System for a High Performance House. Ph.D. Thesis, Carleton University, Ottawa, ON, Canada, April 2014. [Google Scholar]
- Dorer, V.; Weber, A. Methodologies for the Performance Assessment of Residential Cogeneration Systems, Report of Subtask C of FC+COGEN-SIM: Simulation of Building-Integrated Fuel Cell and Other Cogeneration Systems, Annex 42 of the International Energy Agency 2007. Available online: http://www.ecbcs.org/Data/publications/EBC_Annex_42_Performance_Assessment_of_Residential_Cogeneration_Systems_in_Different_Italian_Climatic_Zones.pdf (accessed on 16 June 2020).
- Marrasso, E.; Roselli, C.; Sasso, M. Electric efficiency indicators and carbon dioxide emission factors for power generation by fossil and renewable energy sources on hourly basis. Energy Manag. Convers. 2019, 15, 1369–1384. [Google Scholar] [CrossRef]
- Aermec Price List Air Water Heat Pump NLC300. Available online: https://morettihvac.files.wordpress.com/2016/02/09072015_listino-generale-euro-al-pubblico_2015rev11.pdf (accessed on 7 July 2020).
- Sunpower Solar Panels Price List. Available online: https://www.sunpowercorp.co.uk/ (accessed on 7 July 2020).


© 2020 by the authors. Licensee MDPI, Basel, Switzerland. This article is an open access article distributed under the terms and conditions of the Creative Commons Attribution (CC BY) license (http://creativecommons.org/licenses/by/4.0/).