Article

A Novel Methodology for Evaluating the Impact of Energy Efficiency Measures on the Cabin Thermal Comfort of Electric Vehicles

AIT Austrian Institute of Technology, Giefinggasse 4, 1210 Vienna, Austria
*
Author to whom correspondence should be addressed.
Energies 2020, 13(15), 3872; https://doi.org/10.3390/en13153872
Submission received: 3 June 2020 / Revised: 9 July 2020 / Accepted: 27 July 2020 / Published: 29 July 2020

Abstract

:
Climate control systems have a largely negative effect on the energy consumption of electric vehicles and consequently on their real driving range. Improving the efficiency of climate control systems requires advanced simulation tools for an accurate evaluation of both the energy savings and thermal comfort of innovative heating and cooling solutions. In this study, the advancements beyond the state of the art consists primarily of the methodology tackling the reduction of computational costs of intensive computational fluid dynamics (CFD) simulations and/or time-consuming experimental investigations and the simultaneous assessment of vehicle cabin thermal comfort and energy flows. The approach was validated against climatized chassis dyno measurements from the EU Horizon 2020 research project QUIET. Indeed, all the considered locations within the cabin were properly validated, both in steady state and transient conditions with the largest deviations at steady state below 3 °C. Additionally, the validation results show a perfect agreement for the average cabin predicted mean vote (PMV) value and a largest deviation in terms of the PMV for the other locations below 0.3. Furthermore, the applicability of the methodology is proved with the help of its application on a parametric study for which various cabin temperature setpoints and heating, ventilation and air conditioning (HVAC) modes were simulated in winter operation.

1. Introduction

1.1. Background and Problem

Electric vehicles (EV), as local zero emissions vehicles, positively address and tackle the environmental problems, significantly reducing greenhouse gas (GHG) emissions, air pollution and additionally, noise pollution [1]. Moreover, considering the higher energy efficiency well-to-wheel of battery electric vehicles (BEV), they lead to a substantial reduction in the oil imports dependency for the mobility sector [2].
Several studies showed the negative impact that the cabin cooling has on energy consumption for both conventional internal combustion engine (ICE), plug-in hybrid electric (PHEV) and battery electric vehicles (BEV). Shete and Farrington et al. (respectively, in [3] and [4]) highlight the negative impact of the air conditioning systems of ICE vehicles on CO2 emissions and fuel consumption and suggest various ways to reduce the amount of energy spent for cabin environment control using parked car ventilation, recirculated air, and advanced glazing, among others. Li et al. [5] carried out tests for both indoor chassis dynamometer and on-road tests using PHEV, and concluded that air conditioner power consumption accounts for a large fraction of the total power. Various studies [6,7,8,9,10] analysed the power demand of the auxiliary systems of electric cars and concluded as well that the external air temperature has a significant impact on the energy consumption of an electric car, both due to the cabin conditioning but also related to the efficiency of the battery at different temperatures. On the other hand, the energy consumption is drastically affected in winter conditions, mainly for BEV, considering that ICE vehicles use waste heat from the engine and that ICE vehicles provide thermal comfort in winter operation at no additional costs to the vehicle’s propulsion energy demands.
Therefore, the developments of new BEVs, due to limited battery capacities, among other factors, is contributing to the growing interest in decreasing heating, ventilation and air conditioning (HVAC) systems’ energy consumption, since the large heating and cooling demand of HVAC conventional systems can drastically decrease the real driving range [11].

1.2. Previous Research on the Topic

In order to improve HVAC systems’ design and control, various studies developed and investigated, on a simulation base, the climate control loads of EVs. The studies performed simulations ranging from 1D to 3D computational fluid dynamics (CFD) [12,13,14,15,16]. At the scope of limiting and/or reducing the loads of climate control, the studies tried to optimise the systems with limited or no major focus on thermal comfort [17,18,19].
On the other hand, thermal comfort has been studied extensively (see Figure 1) and resulted in several indices, however disconnected from energy efficiency figures.
Differently from the building sector, the thermal comfort assessment in vehicle cabins introduces various challenges. Several studies [21,22,23] reviewed the most popular thermal comfort models and gave an overview of the most relevant factors that affect thermal comfort in vehicles’ cabins. They showed, among others, that those standardised models were developed starting around four decades ago, and only marginally changed ever since, with small modifications such as the introduction of factors for considering the effect of solar radiation [24].
Experimental thermal comfort investigation is probably the most common method used for vehicle cabin comfort assessment [25,26] which can be costly and time consuming. Zhou et al. [27] conducted tests under outdoor driving conditions, measuring the outside weather conditions, the air and surface temperatures inside a car, and the skin temperatures and thermal sensation votes of the driver. The results showed that the air and surface temperatures in the car were non-uniform and did not reach a steady state for short commutes. Thus, a thermal comfort study in a car should be conducted under transient conditions. Additionally, the study found that the thermal sensation of the driver under outdoor driving conditions was different from that when the vehicle was parked.
However, even though the experimental investigation under outdoor driving conditions can depict the real behaviour and performances of the system, and in many cases is mandatory (e.g., for the certification process), the prediction of thermal conditions in the design phase plays an important role and has been intensively tackled by various studies with CFD methods, among others [28,29,30,31,32]. In this case, CFD models can be supplementary to the experimental activities and can be a powerful tool which allows to simulate the environmental conditions in the vehicle cabin and test different strategies and/or designs of HVAC systems.
In order to reduce the computational costs of intensive CFD simulation, Chen et al. [33] and Warey et al. [34] proposed to use machine learning approaches to systematically generate a comprehensive dataset that spans the entire range of boundary conditions, which influence occupant thermal comfort and apply machine learning algorithms to predict occupant thermal comfort (both front and rear) for any combination of environmental conditions and HVAC settings (flow rate and discharge air temperature).
As reported, thermal comfort has been intensively studied, however, studies on the quantification of energy measures which have an impact on thermal comfort are very limited and they usually study single measures and/or have focus on indoor air quality [35,36].

1.3. Boundaries of the Current Research Problem

The present work differs from the previous aforementioned studies in several aspects. First, the vehicle cabin simulation model was created based on a generic and modular CFD approach, which has made it possible to form a comprehensive dataset of the relevant vehicle cabin and HVAC system alternative configurations, modes and boundary conditions. Second, the results from the CFD generic approach were analysed, validated and extrapolated in order to be optimally integrated in a 1D dynamic model, including the thermal aspects of both the vehicle cabin and HVAC system. The advancements beyond the state of the art consist primarily of the methodology that spans the entire range of boundary conditions which influence occupant thermal comfort. Moreover, the advancements lie in the simplification approach for the implementation of the CFD results in a fast-transient 1D simulation environment. The approach was validated against measurements from the research project QUIET [37], and more information is reported in Section 2.2.
The developed methodology tackles a two-fold problem: (a) to reduce the computational costs of highly intensive CFD simulations and/or time-consuming experimental investigations and (b) to simultaneously assess both vehicle cabin thermal comfort and the impact of alternative configurations on the energy efficiency of the HVAC system.

2. Methodology

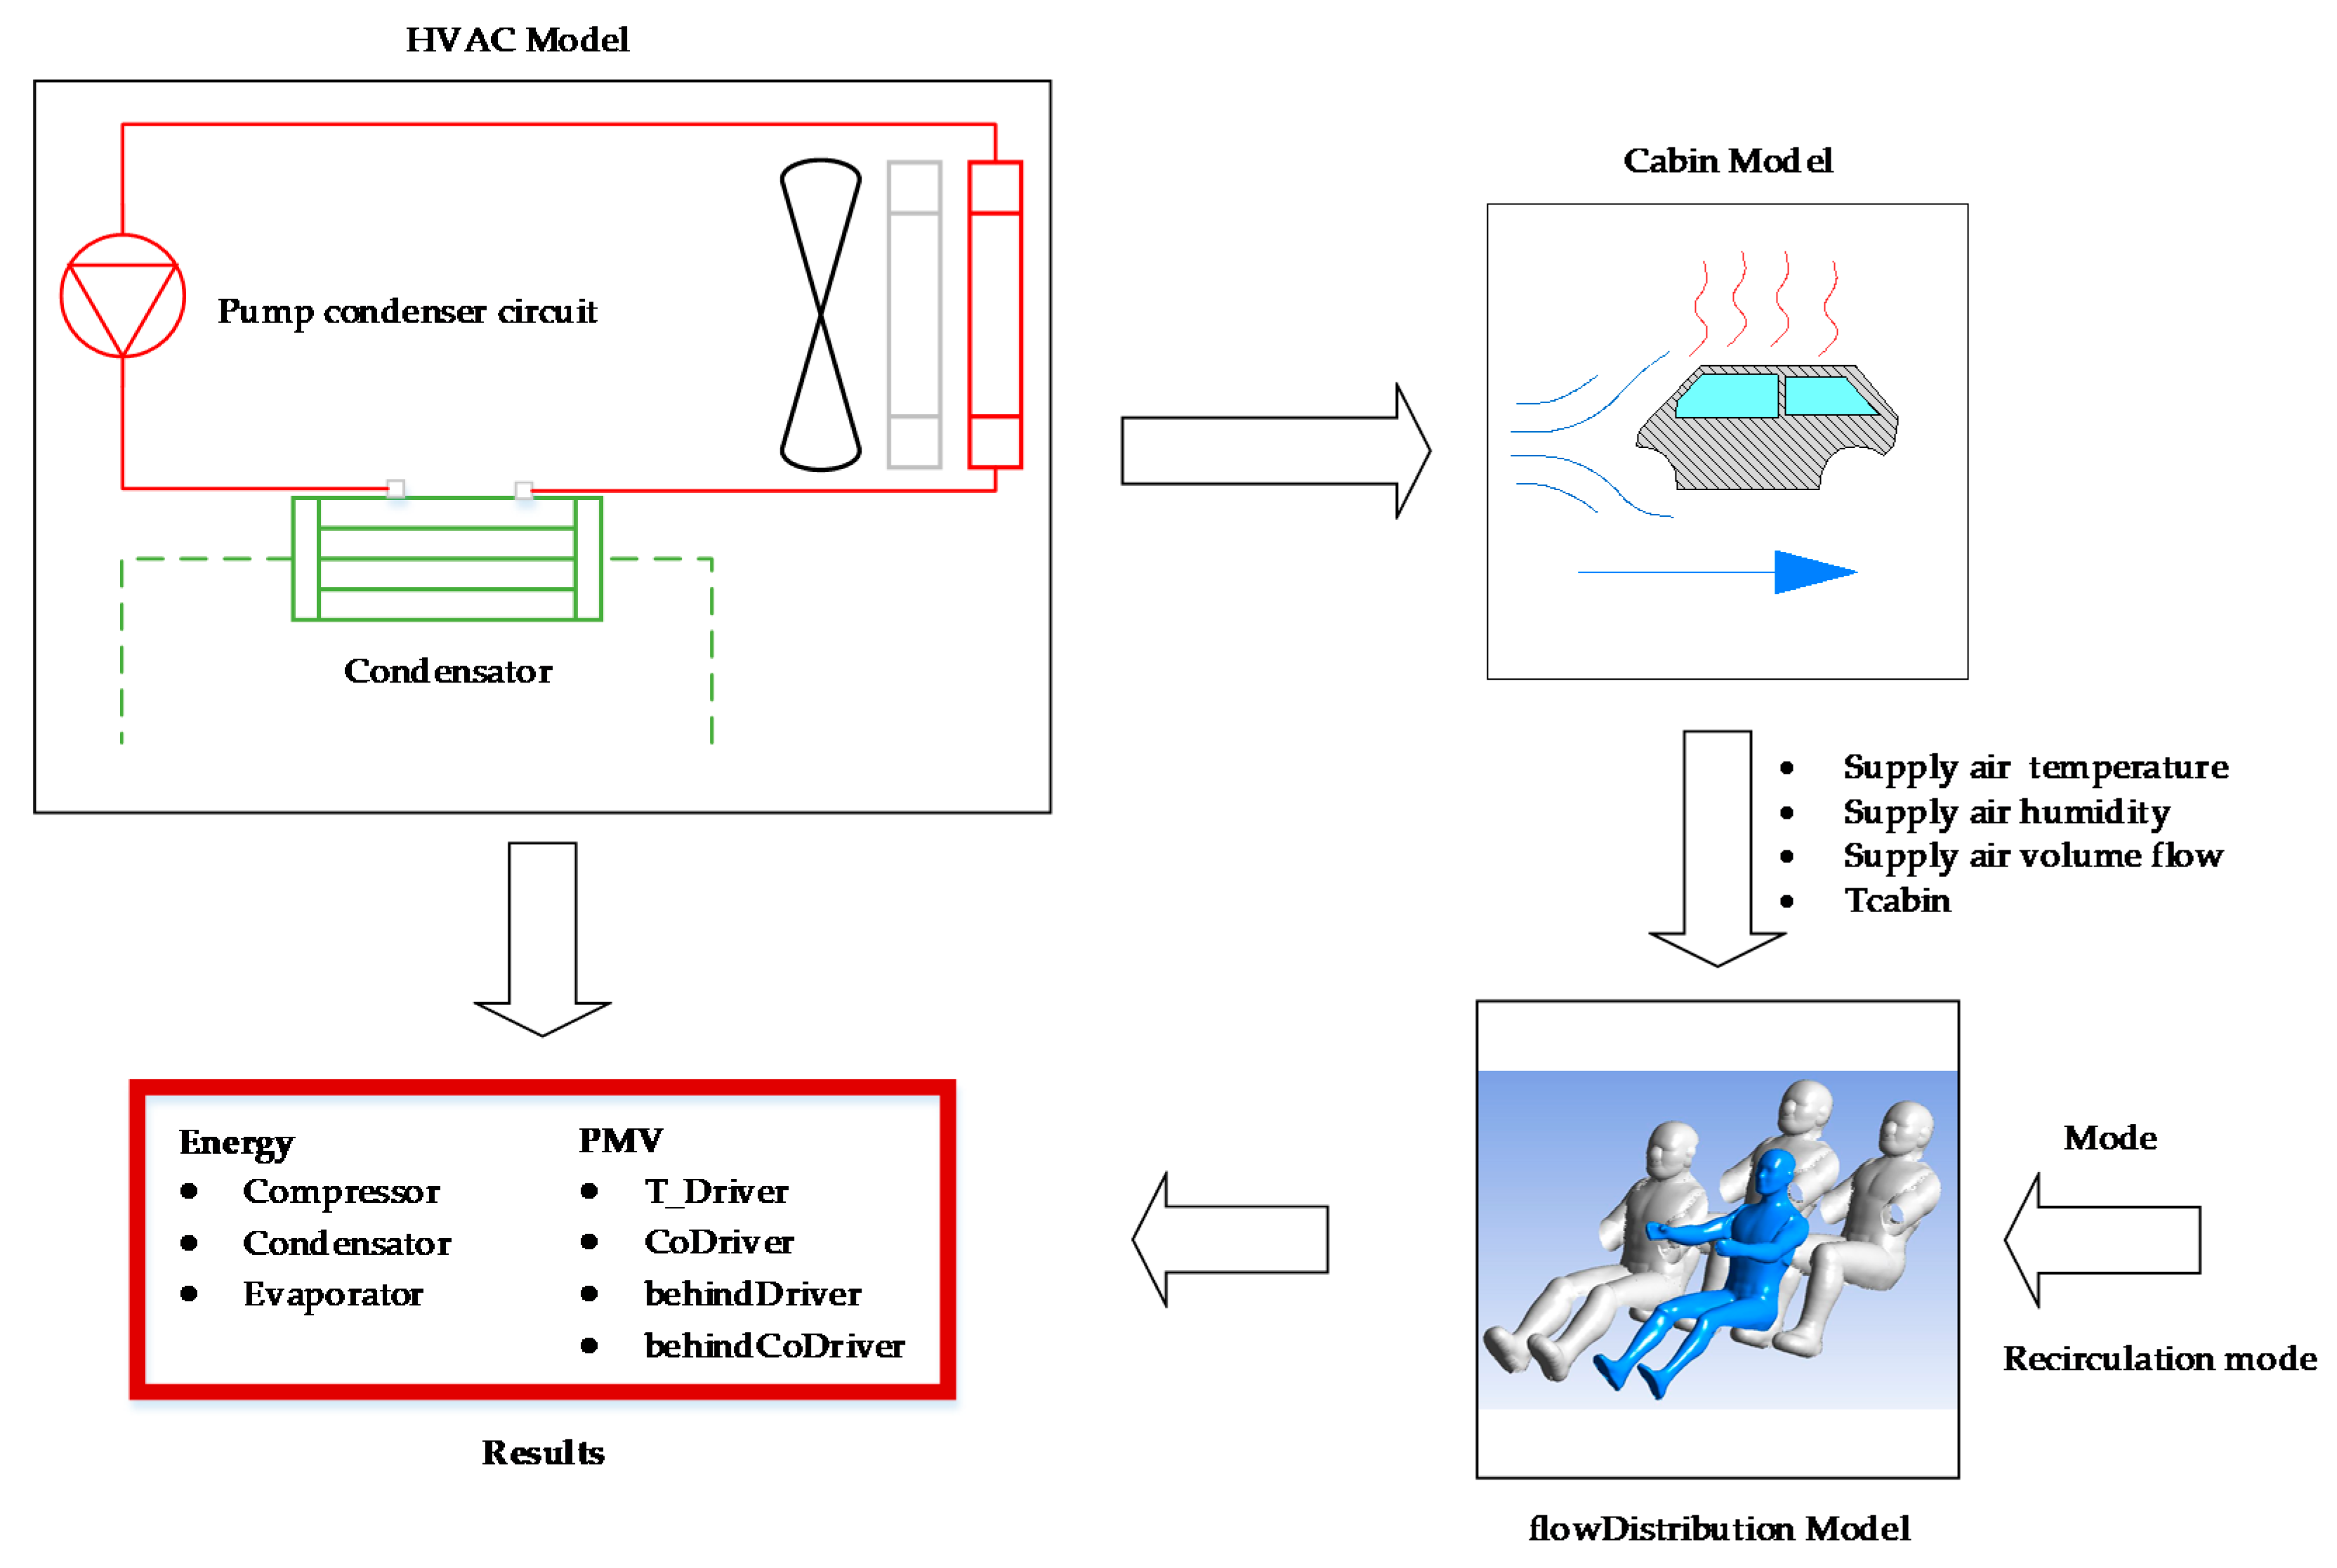
2.1. Overall Methodology

The developed methodology, presented in the flow chart (Figure 2), includes the definition of the standardised cases used in the parametrisation of the CFD models, the HVAC system model and the 1D thermal and comfort models integrated in the overall system model.
CFD simulations of the cabin model were performed for 80 standardised cases with variations in terms of the HVAC settings, ambient temperatures and humidity. The standardised cases are reported in Table 1 and include the most relevant scenarios for automotive heating and cooling systems. For the CFD model, only the temperatures and air velocity at distinct locations were evaluated, therefore the air humidity was neglected and set to 0%.
The simulation results from the CFD model were collected and post-processed for use in the 1D thermal model, which was implemented in the simulation environment Dymola/Modelica [38,39]. The CFD results were interpolated between the operating points, allowing the usage of detailed results from CFD while requiring low computational effort. In parallel, a model of the HVAC system was implemented in Dymola/Modelica. Both the 1D thermal and comfort models and the HVAC system model were implemented in the simulation platform (overall system model).

2.2. Case Study

The case study was based on the demonstrator of the EU H2020 research project QUIET, which was the Honda Fit EV. This vehicle was derived from the second-generation Honda Jazz (called “Fit” in Japan, Sri Lanka, China, and the Americas).
The Honda Fit EV was derived from the conventionally powered Honda Jazz/Fit and the HVAC system is a direct conversion from that model. The cabin of the demonstrator vehicle and the location of the corresponding air outlets can be seen in Figure 3. Five outlets were located on the dashboard: one on the driver′s left side (VENT side), one on the passenger′s right side (VENT side), and three in the middle position (VENT and DEF). An additional four outlets were in the leg space of the driver, front passenger (FR HEAT) and back passengers (RR HEAT).
The target outlet temperature (Tin) to the vehicle cabin was adjusted by mixing hot and fresh air. The operational modes nomenclature is defined in Table 2 and defines five different settings for the air flow distribution.
The methodology includes the development of a dataset of simulations from the CFD generic approach, in order to be optimally integrated in a 1D dynamic model, including the thermal aspects of both the vehicle cabin and the HVAC system. In order to validate the methodology, a validation case was selected, and the settings are reported in Table 3.
The validation case measurements were taken in a climatized chassis dyno [37] with K-type thermocouples to monitor surface temperatures in different locations (head, chest, legs) of the vehicle cabin. Additionally, comfort measurements were taken with the device FLATMAN, developed by LumaSense/Innova. The device FLATMAN is a thermal measurement mannequin with an aluminium frame, equipped with dry heat loss transducers at the representative locations.

2.3. Thermal Comfort Modelling

Thermal comfort is the condition of mind that expresses satisfaction with the thermal environment [40]. The thermal comfort assessment in a confined space, such as a vehicle cabin, is a complex task since it involves the evaluation of both the physiological and the psychological states of the person under consideration. A well known index used to estimate the global thermal comfort of people is the predicted mean vote (PMV) index [40], which gives the thermal comfort response in steady state for an airconditioned environment, and was originally developed for building applications. The PMV is a quantitative measure of human warmth, and a graphical representation of it is presented in Table 4.
The index was developed based on a large statistical research study on a group of individuals and it defines the ranges that result in thermal satisfaction for most of the occupants in a confined space. A PMV value of zero represents the ideal value considered as the thermal neutrality. PMV values in the range between −1.0 and +1.0 were considered acceptable and recommended. The PMV value is calculated based on Equations (1) and (2). The PMV index is a function of four thermal environment variables and two human body factors, see Figure 4.
The PMV index [40] includes the factors related to thermal comfort, such as the metabolism rate (M), clothing insulation (Icl), air humidity (RH), air temperature (Tair), radiant temperature (Trad) and air speed (vair):
PMV = (0.303 e0.303 + 0.028 {(M − W) − 3.05 [5.73 − 0.07 (M − W) − pa ] − 0.42 [(M − W) − 58.15] − 0.0173 M (5.87 − pa) − 0.0014 M (307 − ta) − 3.96 10−8 fcl [(tcl4 − tmr4] − fcl hc (tcl − ta)]}
where:
tcl = 35.7 − 0.028 (M − W) − Icl {(M − W) −3.05 [5.73 − 0.007 (M − W) − pa] − 0.42 [(M − W) −58.15] −0.0173 M (5.87 − pa)−0.0014 M (307 − ta)}
with:
  • M metabolic heat rate (W/m2);
  • W activity level (W/m2) removed from the inputs of Figure 4 as assumed negligible;
  • tcl temperature at clothes’ level (K);
  • pa water vapour pressure (Pa);
  • ta air temperature (K);
  • Icl thermal insulation of clothes (Clo);
  • fcl clothing factor (-);
  • tmr mean radiant temperature (K);
  • hc convective heat transfer (W/m2.K).
Table 5 gives an overview of the PMV factors with the typical ranges and the specific factors used for the case study.

2.4. Cabin CFD Modelling

Geometry data, provided by HONDA, were processed with SpaceClaim 3D [41] in Ansys Fluent [42]. The geometry model reproduces the physical properties of the vehicle cabin, including the heating and vent inlet and outlet locations and dimensions, windshield angle, and chassis parameters, which are influential to the performance of the vehicle cabin heating and cooling system. In this study, an additional four manikins were modelled. These manikins were designated as the driver and three passengers and were in a sitting posture. The material properties specified for the car compartment surfaces and the human body are listed in Table 6. The wall properties were iteratively adapted in order to obtain comparable heat losses, as for the validation case.
The fluid flow distribution within the cabin was obtained using the commercial CFD package ANSYS Fluent [43]. The flow is governed by the conservation equations for mass, momentum and energy. The effects of turbulence were accounted for using the Reynolds-averaged Navier-Stokes (RANS) approach (k-w SST) [43], which ensures higher accuracy near the wall, and is therefore appropriate when simulating the maninkins [43]. The snappyHexMesh utility [44] was used for the generation of the mesh. Starting from the triangulated surface representation of the geometry (STL), the polyhedral mesh was generated by snapping the background mesh onto the nearest surface. Figure 5 illustrates the meshed grid of the model for the vehicle cabin. The CFD model includes the heat transfer phenomena of conduction, convection and radiation, although radiation represents a minor effect due to the small temperature difference between the surfaces and the assumption of no solar radiation. The boundary conditions were extrapolated from experimental data.
The cabin supply air flow rate and temperature were specified at the outlet vent surfaces. The pressure outlet boundary condition used at the outlet vents was at a constant atmospheric pressure of 101.3 kPa, with the vehicle at rest. Nonslip wall conditions were imposed at the wall surfaces of the windshield, side window, rear window, dashboard, seats, and floor. The windshield, side window, and rear window were treated in the radiation equations as semi-transparent walls. To ensure the reliability of the simulated results, the CFD model was validated against the experimental data and the validation results are provided in Section 3.

2.5. HVAC System Modelling

The HVAC system 1D model was developed based on models of the Modelica Standard Library [39] and TIL Suite [45]. The parameters for each of the sub-models were derived either from the available measurement data or from a technical datasheet. The system depicted in Figure 6 consisted of three different loops: (1) refrigerant propane R290, (2) coolant with a water–glycol 50% mixture and (3) air cycle.
The HVAC system is built up in an indirect topology, which means that the thermal power provided by the refrigerant cycle is transmitted to the coolant cycle via plate heat exchangers. The coolant cycle, based on a 50% water–glycol mixture, is connected to MPET (multi-port extruded tube) heat exchangers for the condenser and evaporator, which transmit the thermal power to the air side, either to the ambient at the vehicle front or to the cabin air. The coolant valves can be used to switch between the heating or cooling operation (connecting the condenser heat exchanger to the heater core for the heating operation or the evaporator heat exchanger to the low-temperature radiator for the cooling operation). Even though direct refrigerant cycles can achieve higher system efficiencies, a coolant-based system is easier and safer to install due to the lower pressure. The refrigerant cycle, consisting of the compressor, condenser, expansion valve (TXV), internal heat exchanger (IHX) and evaporator, is based on propane as a refrigerant.

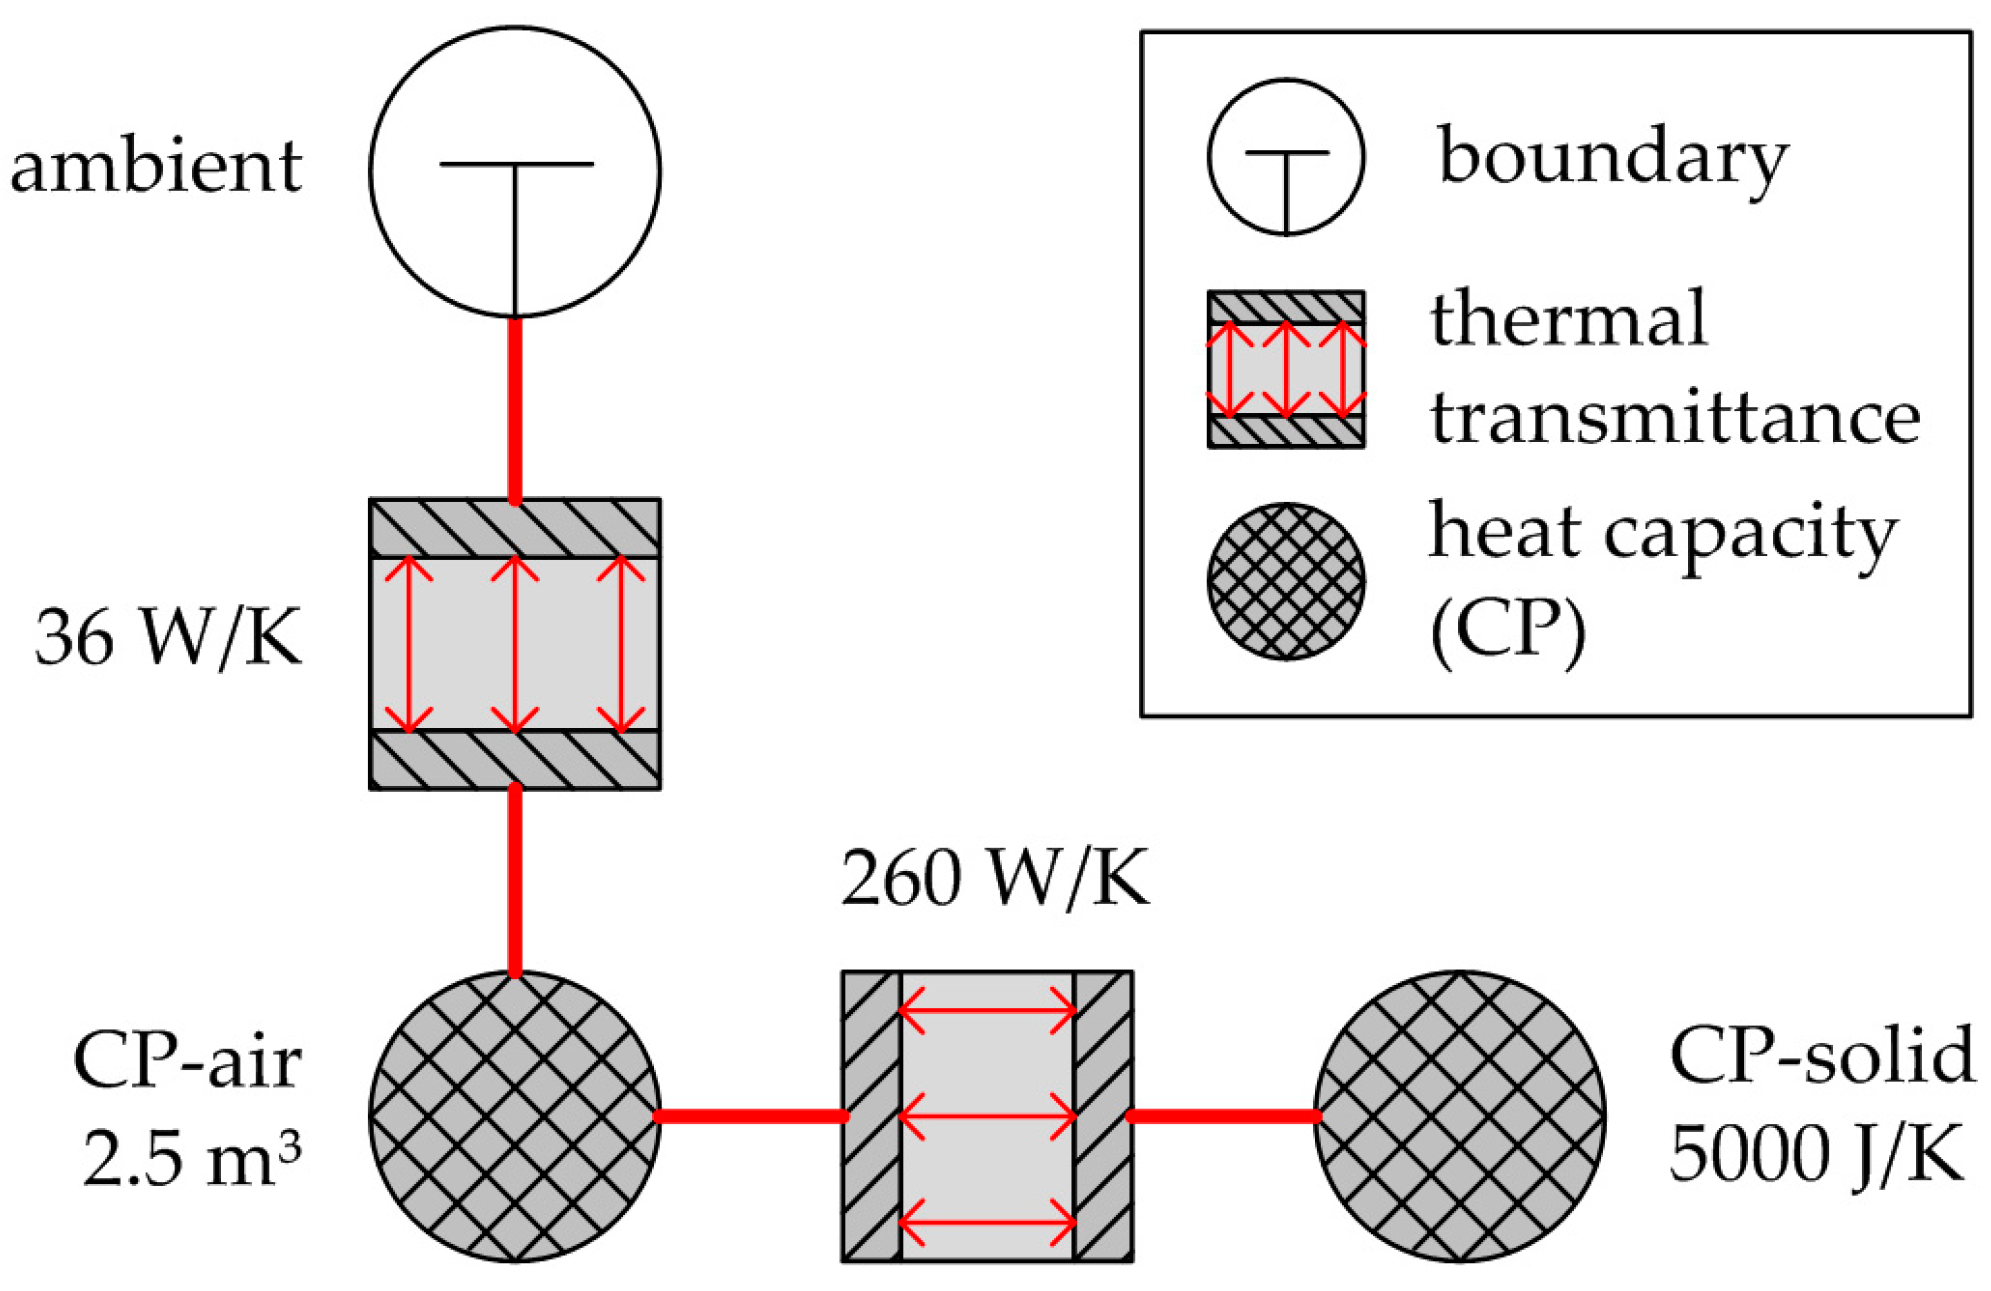
2.6. Thermal and Comfort Model and HVAC System Integration

The cabin 1D thermal model was used to calculate the cabin temperature. It was based on two thermal masses: the cabin air (assumed 2.5 m3) and the solid cabin parts. The total thermal mass of the solid cabin parts (such as doors, steering wheel, seats, etc.) was an estimated 120 kg with a total thermal capacity of 5000 J/K, while the convective heat transfer between the air and solid parts was set to 260 W/K. The 1D thermal model considers an overall heat transfer from cabin to outside of about 36 W/K. A schematic overview of the thermal cabin model is provided in Figure 7. The aforementioned parameters for the model were derived from the measurement data.
The cabin model exchanges data with the HVAC model and the sub-model “flowDistribution” in which the results of the CFD simulations are derived and implemented, Figure 8. The “flowDistribution” model implements the temperature and air-velocity distribution at distinct locations in the cabin, i.e., the head, chest and legs of each of the four passengers (driver, co-driver, behind driver, behind co-driver), constituting the mean value of the entire cabin and the comfort model based on the equations presented in Section 2.3.
The “flowDistribution” is derived from the parametric variation with the various boundary conditions as presented in Table 7 (80 CFD simulation results).
Steady state results from the CFD simulations are implemented in the “flowDistribution” model as lookup tables (I = 1.10) and depending on the values of “Mode” and “Recirculation mode”, the corresponding (table) is retrieved:
table(i) = f (HVAC mode, recirculation mode)
Temperature (Tss) and the velocity (v) at steady state conditions for all positions (j = 1.3) are obtained, linearly interpolating the values with respect to the cabin supply volume flow rate (Vin) and the cabin supply temperature (Tin):
Tss = f (table(i), Vin, Tin), at location j
v = f (table(i), Vin, Tin), at location j
As a next step, the actual temperature (Tactual) is calculated based on the factor (k) which is obtained from the 1D thermal model (Tcabin), the steady state mean cabin temperature (Tcabin,ss) from the CFD simulations and the ambient temperature (Tambient):
k = (Tcabin − Tambient)/(Tcabin,ss − Tambient),
As the temperature (Tcabin) from the 1D thermal model has a transient behaviour, the actual temperatures for the various locations of the cabin will inherit the behaviour, and namely:
Tactual = (Tss − Tambient) k + Tambient, at location j
The approach provides transient results from the CFD steady state conditions, contributing to a large simulation time and computational effort savings. The calculated temperatures (Tactual) and air velocities (v) at the various locations (j) were then used as inputs for the PMV model implemented in Dymola/Modelica. As a result, the PMV model gives the response to a change from an equilibrium or a steady state, thus resulting in the capability of predicting the transient behaviour for the PMV index.

3. Results

Section 3.1 reports the models’ validation, and Section 3.2, the application of the methodology on a selected case study.

3.1. Models Validation

The following sections demonstrate the validity of the developed methodology, and namely validate the CFD model, the 1D thermal (results are reported in Section 3.1.1) and the comfort model (results are reported in Section 3.1.2).

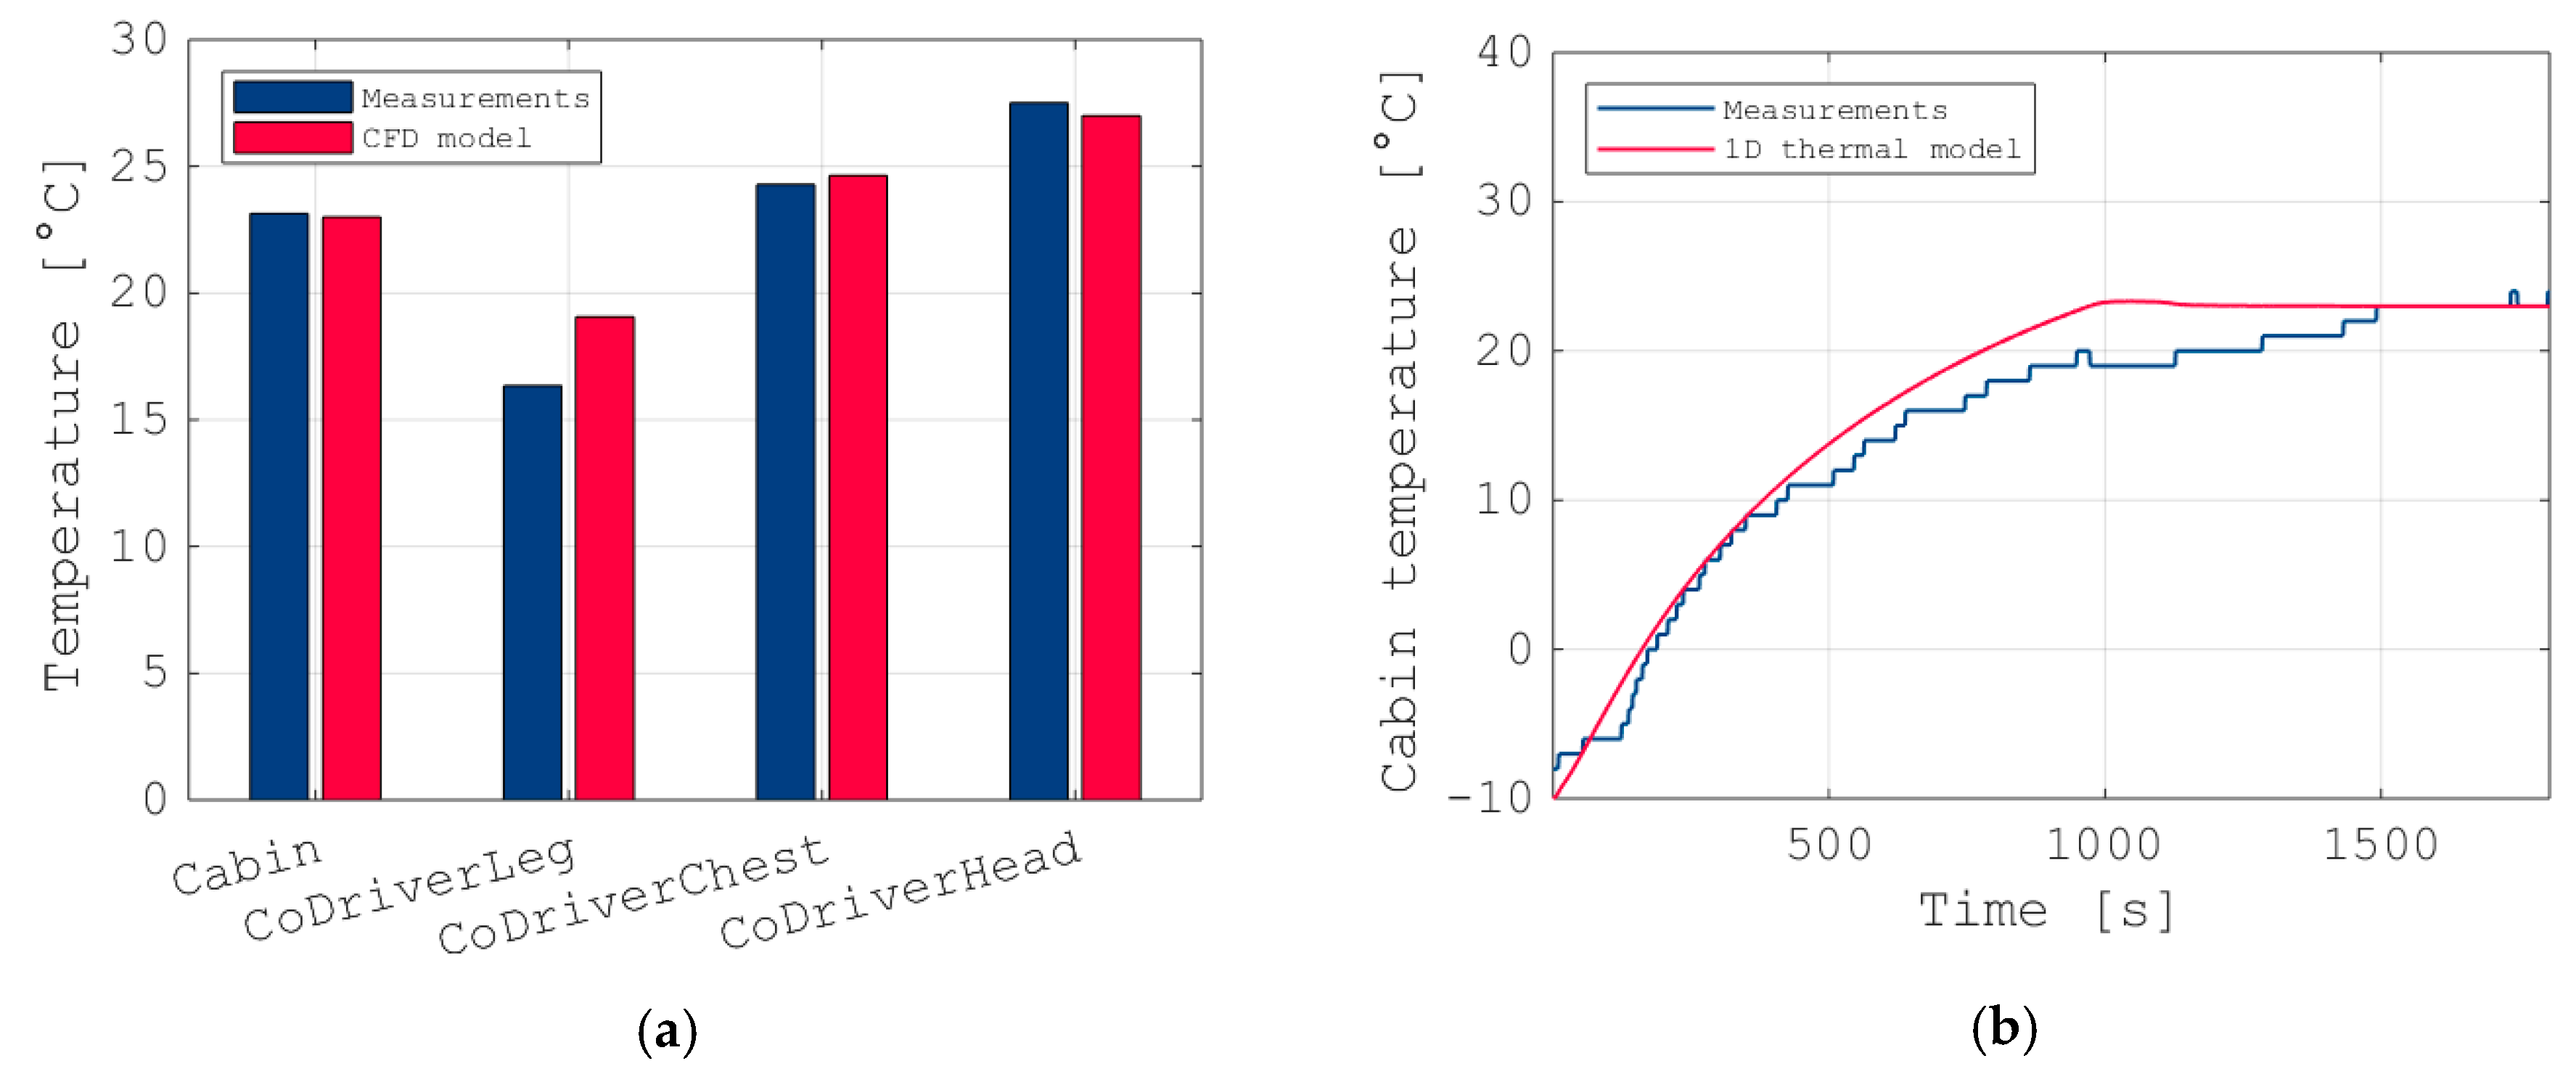
3.1.1. CFD and 1D Thermal Model

The 1D thermal model, which was based on the interpolation of the CFD simulation results, was validated against experimental data in terms of cabin temperature distribution.
Figure 9a shows the CFD model validation results for the four locations in steady state conditions, with satisfactory accuracy from the model. Indeed, for the different regions, the temperature distribution accurately fits the measurements with the largest deviation in the leg region of about +2.7 °C. Figure 9a also highlights that the temperature differences between leg and head were adequately simulated and the error of the difference leg–head is about 3.2 °C. Cabin temperature, the temperature at the location which is typically used from the HVAC control system, was satisfactorily simulated with an error of 0.1 °C. Figure 9b presents the transient behaviour for the cabin temperature, which was based on the results of the 1D thermal model. The comparison shows the appropriateness of the thermal capacity models and highlights the validity of CFD results and the further implementation in the 1D thermal model for the transient conditions assessment.

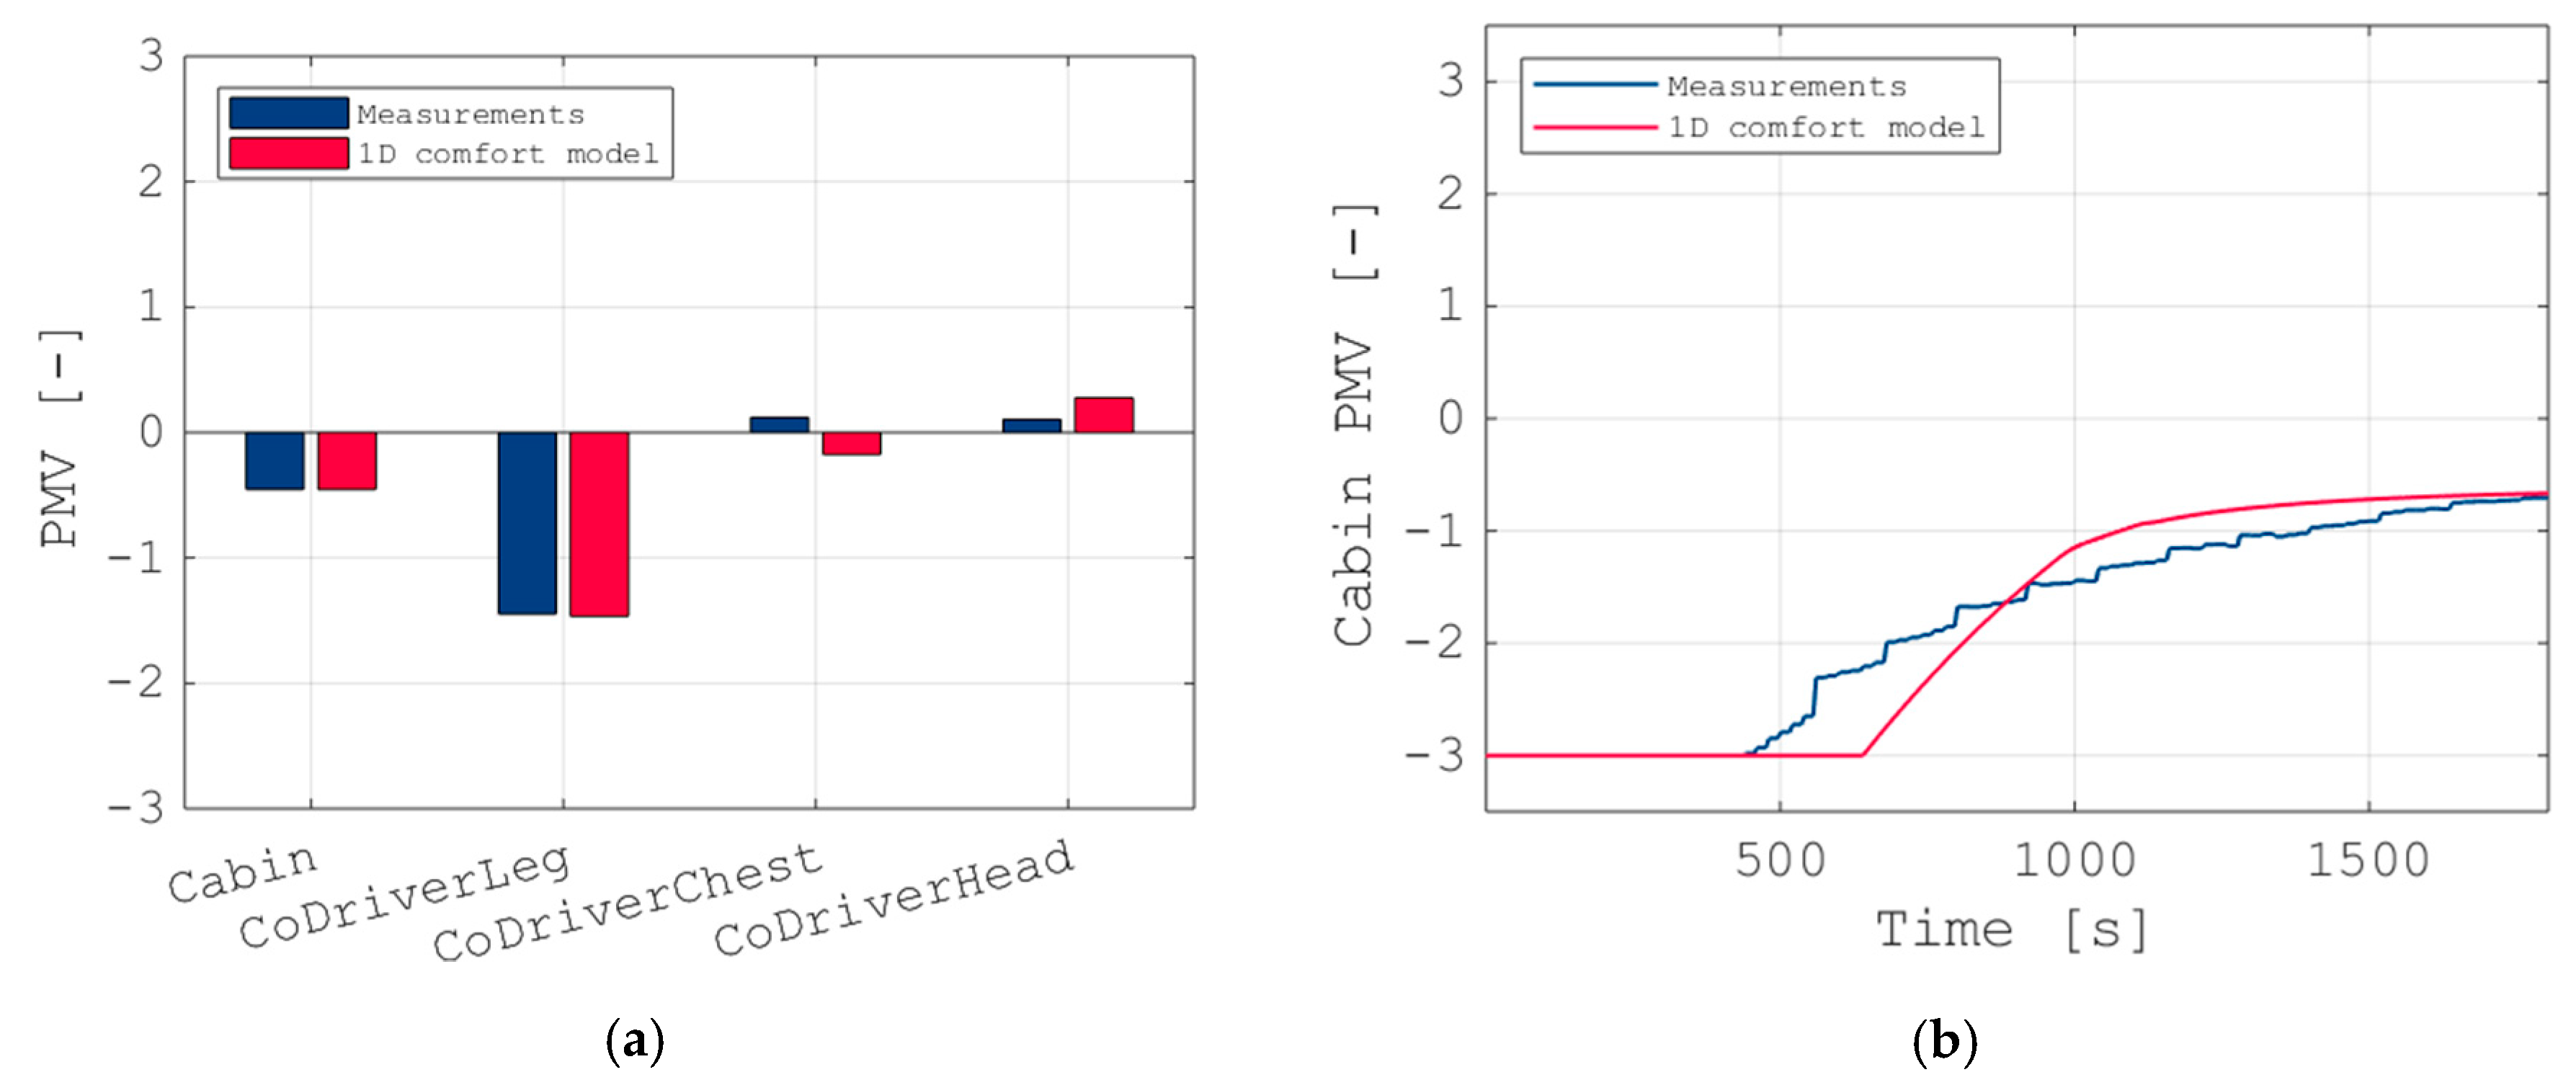
3.1.2. One-Dimensional Comfort Model

The 1D comfort model used in this work was validated against experimental data in terms of PMV values. The validation compared the measurements and 1D comfort model in three locations (head, chest, legs) of the FLATMAN mannequin (positioned at the co-driver side) and in terms of average cabin PMV value. Figure 10a presents the steady state values at the different locations and Figure 10b the transient behaviour for the average cabin PMV value. As it can be seen, small differences between the measurements and the model occur in the leg, chest and head region, respectively, of −0.02, −0.29 and +0.17. For the average cabin, the PMV values from the measurements and 1D comfort model are identical with an error close to 0. Moreover, Figure 10b shows the transient behaviour of the 1D comfort model, which accurately follows the measurements. Indeed, the PMV value reaches the comfort zone (PMV value above −1) for the measurements at about 1400 s and for the model at about 1100 s. The difference can be attributed to a small difference in the air velocities distribution, since on the other hand, the transient behaviour of the cabin temperature is correctly pictured.

3.2. Parametric Variations on the Case Study

The applicability and objective of the proposed methodology was proven with the help of its application on the case study, including a parametric study with various boundary conditions. The application focuses on HVAC system design and optimisation from a technical and thermal comfort perspective, aiming at exploiting optimum solutions for the efficient heating and cooling of an electric vehicle. Hence, no monetary optimisations were applied, i.e., neither investment nor operational costs were considered. However, the proposed application of the methodology is not limited, and alternative applications such as system design validation can be considered. Figure 11 shows the PMV for the three main positions (head, chest and legs), both for the driver and the co-driver for a parametric variation in terms of HVAC mode.
The results highlight that at the considered outdoor temperature condition (−10 °C) and indoor temperature condition (+24 °C), the overall PMV for the cabin is in an adequate range (PMV in the range between +1.5 and −1.5). For Mode 1 (VENT) and Mode 5 (DEF) the head position for the driver and co-driver have PMV values above +1 and for the leg location PMV values below −1. However, this is in line with the position of the flaps for the Mode 1 (VENT) and Mode 5 (DEF), and is therefore adequate. Figure 12 shows the PMV for the three main positions (head, chest and legs), both for the driver and the co-driver, for a parametric variation in terms of cabin temperature setpoint, for MODE 3.
The results highlight that at the considered outdoor temperature condition (−10 °C) there is a linear dependency between all the PMV values and the cabin temperature setpoint between +20 °C and +26 °C, and that the PMV for the cabin varies between −0.5 and about +1. The parametric study can be used for control strategies during the development of a new HVAC system for electric vehicles, balancing between thermal comfort and energy efficiency targets.
Additionally, Figure 13 shows the electric load from the compressor at steady state conditions (after 1 h) for the parametric variation in terms of cabin temperature setpoint between +20 °C and +26 °C. The results highlight that a considerable amount of energy is required when increasing the cabin temperature from +20 °C to +26 °C, and specifically about +35°%.
As it can be seen in Figure 14, the best compromise between thermal comfort and energy demand is with a cabin temperature setpoint of about 22 °C, which results in a PMV of about 0 and an electrical load of the compressor at a steady state of 1.75°kW. Indeed, on the other hand, when increasing the cabin temperature to 26 °C, the resulting PMV for the head, chest and legs is about 0.8, which is still experienced as comfortable, but the electrical load of the compressor at steady state is increased to 2.15°kW or +23°%.

4. Discussion and Conclusions

This work presents a novel methodology for the thermal and comfort assessment of energy reduction measures in electric vehicles. The approach addresses the technical challenges of integrating complex CFD models within 1D thermal and comfort models, at the scope of exploiting unused synergies in thermal and comfort modelling. As such, this approach is a significant extension of the established tools for the optimisation of HVAC systems for electric vehicles and offers significant computational time and effort savings. The methodology offers the capability of assessing the performance of different scenarios which would otherwise require an extensive measurement campaign. The applicability of the methodology is proved with the help of its application on a use case. Indeed, the optimal cabin temperature setpoints of 22 °C was selected, which would reduce on the one hand the electrical load of the compressor by about 23% (compared to the case with cabin temperature setpoint of 26 °C), and on the other hand would guarantee the necessary thermal comfort in the cabin with a PMV index of around 0.
Moreover, with this approach, advanced algorithms of the control system can be tested before the hardware implementation, offering an impulse for the HVAC control system development. Future developments will be linked to find integration possibilities to enhance the control of the HVAC system for electric vehicles to couple the control of physical components (e.g., compressor, valve opening, etc.) with the thermal comfort assessment based on the limited number of sensors in the cabin.

Author Contributions

D.B. for the concept; D.B. and D.D. for the methodology; D.B., D.D., I.G. for the modelling work; D.B. for the investigation; D.B., D.D., I.G. for writing the draft; D.B. for reviewing and editing the final draft version. All authors have read and agreed to the published version of the manuscript.

Funding

The QUIET project has received funding from the European Union’s Horizon 2020 research and innovation programme under grant agreement No. 769826. The content of this publication is the sole responsibility of the QUIET consortium partners and does not necessarily represent the view of the European Commission or its services.

Conflicts of Interest

The authors declare no conflict of interest.

References

  1. European Commission. Regulation (EC) No 443/2009 of the European Parliament and of the Council; European Commission: Brussels, Belgium, 2009. [Google Scholar]
  2. Athanasopoulou, L.; Bikas, H.; Stavropoulos, P. Comparative Well-to-Wheel Emissions Assessment of Internal Combustion Engine and Battery Electric Vehicles. Procedia CIRP 2018, 78, 25–30. [Google Scholar] [CrossRef]
  3. Shete, K. Influence of Automotive Air Conditioning load on Fuel Economy of IC Engine Vehicles. Int. J. Sci. Eng. Res. 2015, 6, 1367–1372. [Google Scholar]
  4. Farrington, R.; Rugh, J. Impact of Vehicle Air Conditioning on Fuel Economy, Tailpipe Emissions, and Electric Vehicle Range. In Proceedings of the Earth Technologies Forum, Washington, DC, USA, 31 October 2000. [Google Scholar]
  5. Li, C.; Brewer, E.; Pham, L.; Jung, H. Reducing Mobile Air Conditioner (MAC) Power Consumption Using Active Cabin-Air-Recirculation in A Plug-In Hybrid Electric Vehicle (PHEV). World Electr. Veh. J. 2018, 9, 51. [Google Scholar] [CrossRef] [Green Version]
  6. Shibata, S.; Nakagawa, T. Mathematical Model of Electric Vehicle Power Consumption for Traveling and Air-Conditioning. J. Energy Power Eng. 2015, 9, 269–275. [Google Scholar] [CrossRef] [Green Version]
  7. Adriano, S.; Chiara, F.; Fabrizio, Z.; Alessandro, D.; Fabio, O.; Annalisa, D. Experimental Analysis of the Auxiliaries Consumption in the Energy Balance of a Pre-Series Plug-In Hybrid-Electric Vehicle. Energy Procedia 2014, 45, 779–788. [Google Scholar] [CrossRef] [Green Version]
  8. Van Vliet, O.; Brouwer, A.S.; Kuramochi, T.; van Den Broek, M.; Faaij, A. Energy use, cost and CO2 emissions of electric cars. J. Power Sources 2011, 196, 2298–2310. [Google Scholar] [CrossRef] [Green Version]
  9. Evtimov, I.; Ivanov, R.; Sapundjiev, M. Energy consumption of auxiliary systems of electric cars. MATEC Web Conf. 2017, 133, 06002. [Google Scholar] [CrossRef]
  10. Iora, P.; Tribioli, L. Effect of Ambient Temperature on Electric Vehicles’ Energy Consumption and Range: Model Definition and Sensitivity Analysis Based on Nissan Leaf Data. World Electr. Veh. J. 2019, 10, 2. [Google Scholar] [CrossRef] [Green Version]
  11. Kapeller, H.; Dvorak, D.; Simic, D. Improvement potentials for user-centrically designed electric vehicles: The QUIET Project. In Proceedings of the 8th Transport Research Arena TRA 2020, Helsinki, Finland, 27–30 April 2020. [Google Scholar]
  12. Doyle, A.; Muneer, T. Energy consumption and modelling of the climate control system in the electric vehicle. Energy Explor. Exploit. 2019, 37, 519–543. [Google Scholar] [CrossRef] [Green Version]
  13. Gellai, I.; Basciotti, D.; Simic, D. 1D thermal model and measurements to estimate HVAC-modules energy consumption of an electric truck cabin. In Proceedings of the SAE Thermal Management Systems Symposium, Plymouth, MI, USA, 15–17 October 2019. [Google Scholar]
  14. Kambly, K.R.; Bradley, T.H. Estimating the HVAC energy consumption of plug-in electric vehicles. J. Power Sources 2014, 259, 117–124. [Google Scholar] [CrossRef]
  15. Zhang, Z.; Li, W.; Zhang, C.; Chen, J. Climate control loads prediction of electric vehicles. Appl. Therm. Eng. 2017, 110, 1183–1188. [Google Scholar] [CrossRef]
  16. Al Faruque, M.A.; Vatanparvar, K. Modeling, analysis, and optimization of Electric Vehicle HVAC systems. In Proceedings of the 21st Asia and South Pacific Design Automation Conference (ASP-DAC), Macau, China, 25–28 January 2016. [Google Scholar]
  17. Mebarki, B.; Draoui, B.; Allaou, B.; Rahmani, L.; Benachour, E. Impact of the Air-Conditioning System on the Power Consumption of an Electric Vehicle Powered by Lithium-Ion Battery. Model. Simul. Eng. 2013, 2013, 935784. [Google Scholar] [CrossRef] [Green Version]
  18. Hendricks, T.J. Vehicle Transient Air Conditioning Analysis: Model Development & System Optimization Investigations; National Renewable Energy Lab. (NREL): Golden, CO, USA, 2001.
  19. Lee, H.; Hwang, Y.; Song, I.; Jang, K. Transient thermal model of passenger car’s cabin and implementation to saturation cycle with alternative working fluids. Energy 2015, 90, 1859–1868. [Google Scholar] [CrossRef]
  20. Elsevier. Available online: https://www.sciencedirect.com/ (accessed on 3 February 2020).
  21. Danca, P.; Vartires, A.; Dogeanu, A. An overview of current methods for thermal comfort assessment in vehicle cabin. In Proceedings of the Sustainable Solutions for Energy and Environment, EENVIRO—YRC 2015, Bucharest, Romania, 18–20 November 2015. [Google Scholar]
  22. Croitoru, C.; Nastase, I.; Bode, F.; Meslem, A.; Dogeanu, A. Thermal comfort models for indoor spaces and vehicles—Current capabilities and future perspectives. Renew. Sustain. Energy Rev. 2015, 44, 304–318. [Google Scholar] [CrossRef]
  23. Simion, M.; Socaciu, L.; Unguresan, P. Factors which influence the thermal comfort inside of vehicles. Energy Procedia 2016, 85, 472–480. [Google Scholar] [CrossRef] [Green Version]
  24. Moon, J.H.; Lee, J.W.; Jeong, C.H.; Lee, S.H. Thermal comfort analysis in a passenger compartment considering the solar radiation effect. Int. J. Therm. Sci. 2016, 107, 77–88. [Google Scholar] [CrossRef]
  25. Qia, C.; Heliana, Y.; Liua, J.; Zhang, L. Experiment Study on the Thermal Comfort inside a Car Passenger Compartment. Procedia Eng. 2017, 205, 3607–3614. [Google Scholar] [CrossRef]
  26. Mao, Y.; Wang, J.; Li, J. Experimental and numerical study of air flow and temperature variations in an electric vehicle cabin during cooling and heating. Appl. Therm. Eng. 2018, 137, 356–367. [Google Scholar] [CrossRef]
  27. Zhou, X.; Lai, D.; Chen, Q. Experimental investigation of thermal comfort in a passenger car under driving conditions. Build. Environ. 2019, 149, 109–119. [Google Scholar] [CrossRef]
  28. Kong, M.; Dang, T.Q.; Zhang, J.; Khalifa, H.E. Micro-environmental control for efficient local heating: CFD simulation and manikin test verification. Build. Environ. 2019, 147, 382–396. [Google Scholar] [CrossRef]
  29. Alahmer, A.; Abdelhamid, M.; Omar, M. Design for thermal sensation and comfort states in vehicles cabins. Appl. Therm. Eng. 2012, 36, 126–140. [Google Scholar] [CrossRef]
  30. Changa, T.-B.; Sheub, J.-J.; Huangb, J.-W.; Lina, Y.-S.; Chang, C.-C. Development of a CFD model for simulating vehicle cabin indoor air quality. Transp. Res. Part D 2018, 62, 433–440. [Google Scholar] [CrossRef]
  31. Oha, J.; Choia, K.; Sona, G.; Parka, Y.-J.; Kangd, Y.-S.; Kim, Y.-J. Flow analysis inside tractor cabin for determining air conditioner vent lacation. Comput. Electron. Agric. 2020, 169, 105199. [Google Scholar] [CrossRef]
  32. Danca, P.; Bode, F.; Nastase, I.; Meslem, A. On the possibility of CFD modeling of the indoor environment in a vehicle. Energy Procedia 2017, 112, 656–663. [Google Scholar] [CrossRef]
  33. Chen, K.; Kaushik, S.; Han, T.; Ghosh, D.; Wang, M. Thermal Comfort Prediction and Validation in a Realistic Vehicle Thermal Environment. In Proceedings of the SAE 2012 World Congress & Exhibition, Detroit, MI, USA, 24–26 April 2012. [Google Scholar]
  34. Warey, A.; Kaushik, S.; Khalighi, B.; Cruse, M.; Venkatesan, G. Data-driven prediction of vehicle cabin thermal comfort: Using machine learning and high-fidelity simulation results. Int. J. Heat Mass Transf. 2020, 148, 119083. [Google Scholar] [CrossRef]
  35. Oi, H.; Tabata, K.; Naka, Y.; Takeda, A.; Tvochihara, Y. Effects of heated seats in vehicles on thermal comfort during the initial warm-up period. Appl. Ergon. 2012, 43, 360–367. [Google Scholar] [CrossRef]
  36. Oh, M.S.; Ahn, J.H.; Kim, D.W.; Jang, D.S.; Kim, Y. Thermal comfort and energy saving in a vehicle compartment using a localized air-conditioning system. Appl. Energy 2014, 133, 14–21. [Google Scholar] [CrossRef]
  37. QUIET Project. Available online: http://www.quiet-project.eu/ (accessed on 3 April 2020).
  38. Dymola. Available online: https://www.3ds.com/products-services/catia/products/dymola (accessed on 3 April 2020).
  39. Modelica Standard Library. Available online: https://www.modelica.org/libraries (accessed on 3 April 2020).
  40. American Society of Heating, Refrigerating and Air-Conditioning Engineers (ASHRAE). Chapter 8 Thermal Comfort. In ASHRAE Handbook Fundamentals; ASHRAE: Atlanta, GA, USA, 1997; pp. 8.1–8.26. [Google Scholar]
  41. Ansys SpaceClaim 3D Modeling. Available online: http://www.spaceclaim.com/en/default.aspx (accessed on 10 January 2020).
  42. Ansys Fluent. Available online: https://www.ansys.com/products/fluids/ansys-fluent (accessed on 10 January 2020).
  43. ANSYS. ANSYS Fluent Theory Guide; ANSYS Inc.: Canonsburg, PA, USA, 2013. [Google Scholar]
  44. SnappyHexMesh. Available online: http://www.wolfdynamics.com/wiki/meshing_OF_SHM.pdf (accessed on 10 January 2020).
  45. TIL Suite. Available online: https://www.tlk-thermo.com/index.php/en/software/til-suite (accessed on 3 April 2020).
Figure 1. Publications from the literature review [20] based on keywords: vehicle cabin thermal comfort.
Energies 13 03872 g001
Figure 2. Methodology flow chart.
Energies 13 03872 g002
Figure 3. (a) Air outlet locations; and (b) temperature sensors’ position.
Energies 13 03872 g003
Figure 4. Thermal comfort model dependencies and scale.
Energies 13 03872 g004
Figure 5. Ansys Fluent computational model of the case study.
Energies 13 03872 g005
Figure 6. Case study HVAC system model in: (a) heating mode; and (b) cooling mode.
Energies 13 03872 g006
Figure 7. Schematic overview of the thermal cabin model.
Energies 13 03872 g007
Figure 8. Scheme integration CFD simulation in 1D.
Energies 13 03872 g008
Figure 9. One-dimensional thermal model validation: (a) the steady state conditions; and (b) transient behaviour.
Energies 13 03872 g009
Figure 10. One-dimensional comfort model validation: (a) the steady state; and (b) transient behaviour.
Energies 13 03872 g010
Figure 11. PMV value vs. HVAC mode: (left) driver; (right) co-driver.
Energies 13 03872 g011
Figure 12. PMV value vs. the cabin temperature: (left) driver; (right) co-driver.
Energies 13 03872 g012
Figure 13. Electrical load of the compressor vs. the cabin temperature.
Energies 13 03872 g013
Figure 14. Electrical load of the compressor vs. the PMV value: (left) driver; (right) co-driver.
Energies 13 03872 g014
Table 1. Standardised heating and cooling cases for the 1D thermal and comfort model.
Standardised Cases
Ambient temperature Winter: −10 °C, Summer: +40 °C
Ambient humidity ~0%
Radiation ~0 W/m2
HVAC settingsRecirculationFRESH
ModeVENT, BI-LEV, HEAT, HEAT-DEF
Fan50, 200, 400 m3/h
Target outlet temperatureWinter: 45 °C, Summer: 5 °C
Table 2. Air flow distribution ratios.
ModeVENT (side)VENTHEATDEF
(1) VENTOpeneach 25%0%0%
(2) BI-LEVOpen50%50%0%
(3) HEATOpen15%75%10%
(4) HEAT-DEFOpen20%45%35%
(5) DEFOpen32%0%6%
Table 3. Validation case for the 1D thermal and comfort models.
Validation Case
Ambient temperature Winter: −10 °C
Ambient humidity ~0%
Radiation ~0 W/m2
HVAC settingsRecirculationFRESH
ModeDEF
Fan150 m3/h
Target outlet temperatureDEF 60 °C, VENT 55 °C
Table 4. Thermal comfort scale based on the predicted mean vote index.
−3−2−10+1+23
coldcoolslightly coolthermal neutral stateslightly warmwarmhot
Table 5. PMV index factors overview.
VariableTypical RangesCase Study
M46 to 232 W/m2 (0.8 to 4 met)70 W/m2 (1.2 met)
Icl0 to 0.310 m2.K/W (0 to 2 clo)0.186 m2.K/W (1.2 clo)
Tair10 to 30 °C23 °C
Trad10 to 40 °Cequal to air temperature
vair0 to 1 m/svalues from simulation
RH20–80%<5%
Table 6. Material properties of the vehicle cabin surfaces and the human body.
ReferenceMaterialDensitySpecific HeatThermal Conductivity
(-)(kg/m3)(J/kg.K)(W/m.K)
Windshield[42]Glass25307541.17
WallAssumptionsFictive material99614802.70
ManikinAssumptionsSkin100035000.21
Table 7. Parametric variation of the CFD simulations.
VariableValue
Mode (5)VENT, BI-LEV, HEAT, HEAT-DEF, DEF
Recirculation mode (2)on, off
Cabin supply temperature (2)10 °C, 45 °C
Cabin supply volume flow rate (4)0, 50, 200, 400 m3/h

