Article

Research on Injection-Production Capability and Seepage Characteristics of Multi-Cycle Operation of Underground Gas Storage in Gas Field—Case Study of the Wen 23 Gas Storage

1
School of Engineering Science, University of Chinese Academy of Sciences, Beijing 100190, China
2
Institute of Porous Flow & Fluid Mechanics, Research Institute of Petroleum Exploration & Development, PetroChina Company Limited, Langfang 065007, China
3
School of Petroleum Engineering, Chongqing University of Science and Technology, Chongqing 401331, China
4
School of Geosciences, Yangtze University, Wuhan 430100, China
*
Authors to whom correspondence should be addressed.
Energies 2020, 13(15), 3829; https://doi.org/10.3390/en13153829
Submission received: 11 May 2020 / Revised: 14 July 2020 / Accepted: 21 July 2020 / Published: 25 July 2020
(This article belongs to the Section L: Energy Sources)

Abstract

:
With the increasing energy demands of current modern society, underground gas storage (UGS) in gas fields is the most popular type of UGS used to meet the seasonal variation of gas consumption. However, compared with gas fields, UGS in gas fields has the characteristics of periodic high-speed injection and production of exploitation modes and operation rules, which causes the rules of gas-water seepage and utilization of reserves to be more particular and complicated. In this paper, based on Wen 23 gas storage, the rules of multicycle injection and production flow and the utilization of UGS pore volume were investigated. The experimental results showed that variation in porosity and permeability caused by injection and production pressure changes in Wen 23 gas storage can be neglected. The pore volume of gas storage and the degree of gas recovery increased gradually in the pre-UGS gas zone, which was higher than that of reservoirs. In the initial stage of UGS operation, the pore volume of gas storage and the degree of gas recovery were low in the gas-drive-water gas zone as a result of water invasion during the process of reservoir exploitation. During operation of multicycle high-speed injection and production, the seepage conditions in the gas-drive-water gas zone gradually improved. The higher the reservoir permeability, the greater increases in pore volume and degree of gas recovery. In the gas-water transition zone, gas and water were reciprocated and displaced with the multicycle injection-production of UGS, resulting in the gradual deterioration of pore volume and gas recovery, which remained stable at a low value. The negative effects of reservoir heterogeneity on the effective utilization of UGS occurred in the gas-water transition zone. These findings may contribute to a better understanding of the rules of multicycle injection and production flow and utilization of UGS to optimize the injection-production efficiency of Wen 23 gas storage.

1. Introduction

Natural gas, the cleanest fossil fuel and a potential substitute energy, plays an important and increasingly recognized role in meeting the world’s energy demands [1,2,3]. According to the US Energy Information Administration (EIA), over the next 20 years, the average growth rate of natural gas demand in China is likely to be over 11% per year, far ahead of developed countries and other developing countries. These data suggest that natural gas will be in great demand in the future [4]. With rapid development of the natural gas industry in China, the fluctuations and crises that arise from imbalances in the seasonal demand for natural gas are becoming increasingly prominent [5,6]. Due to this seasonal variation in demand, natural gas is often stored during low-consumption seasons and withdrawn during high-demand seasons [7]. The main storage methods of natural gas are underground gas storage (UGS), LNG (liquefied natural gas), gas storage tanks, and pipeline gas storage. Among these, UGS is the most popular type of gas storage project [8,9,10]. UGS involves storing a mass volume of natural gas within the porous media of cores at different depths [4]. Its main function of operation is the transmission of natural gas from one reservoir to another closer to the consumer market to avoid volatility of natural gas supply and economical demand. Since the first successful UGS was piloted in 1915 in Canada, 715 UGSs have been established globally, with this number still increasing [6,11]. UGS is regarded as the key to maintaining the reliability, integrity, and capability of the Nation’s natural gas transmission and distribution network [12]. At present, four main classifications of UGS exist, namely, underground gas storage in gas-oil fields, aquifer reservoirs, salt cavern reservoirs, and abandoned mines [13]. Gas storage based in depleted gas reservoirs is the most commonly used and economical form of underground gas storage in the world. One of the key advantages of depleted gas reservoirs is that they accommodate easy, low-cost gas storage because they possess appropriate permeability characteristics and pore connectivity [14]. Some data, including geological characteristics, petrophysical properties, capacity, pressure, and production history of depleted gas-oil reservoirs, were thoroughly investigated and well recorded, allowing the employment of computer models in the oil and gas industries to simulate the injection-production process of underground gas storage [5,9,15]. Furthermore, the sound and efficient infrastructure originally used to produce and transfer gas from depleted fields can be utilized for storage operations. In addition to the above advantages, high-pressure gas injection significantly positively impacts the recovery of the remaining hydrocarbon in depleted gas-oil reservoirs [16,17,18]. According to statistics, the working gas volume of UGS in gas field accounts for about 75% of the total working gas volume of stored gas globally, which is the most important underground gas storage peak shaving facility [19,20].
Before planning UGS construction, an investigation regarding the relationship between gas storage capacity and market demand is crucial [21]. UGS operation design depends on reservoir location and performance, which is always close to the consumer market. Further, parameters such as trap dynamic sealing capacity, well integrity, capacity, pressure, permeability, and the production history of the field should be carefully analyzed to avoid UGS gas leakage and operation failure. Generally, the life cycle of UGS mainly includes four stages, namely, site selection, construction, operation, and abandonment [22]. The construction and operation processes occupy the greatest parts of the UGS lifecycle, in which injection-production faces many particularities and challenges. Compared with foreign depleted gas reservoirs, reservoirs to build gas storage in China characteristically demonstrate strong reservoir heterogeneity, water invasion, and complex formation fluid distribution [19]. In the middle and late stages of gas reservoir development, with the intrusion of the edge or bottom water, the actual storage spaces in the reservoir became smaller, and different fluid distribution areas are formed in the longitudinal and traverse planes of the reservoir. During the injection and production operations of the gas storage, the gas-water interface moves downward when gas is injected and the moves upward when gas is produced [22]. The storage space of UGS can be divided into four zones by gas-water interface, namely, the pre-UGS gas zone, the gas-drive-water gas zone, the gas-water transition zone, and the watered-out zone [23,24,25]. During gas storage, the injection and production wells alternately inject and produce for long periods of time to meet the peak shaving requirements, with the fluid seepage velocity being much higher than during gas reservoir development. This phenomenon has two effects. On one hand, there is a change in the physical properties of the reservoir due to repeated water intrusion [26,27]. On the other hand, the rule of multiphase fluid seepage is different from the development of conventional gas reservoirs during high-speed injection and production. High-speed fluid flow inevitably exacerbates the impact of reservoir heterogeneity [28]. Underground gas storage facilities rebuilt from gas reservoirs present sound gas reservoir data and gas well production data, so reservoir models and numerical simulations are often used to predict hydrocarbon movement and trapping and the injection and production operation processes of gas storage [9,15,17,29,30,31]. However, compared to reservoir exploitation, the formation of physical properties changes due to repeated water intrusion during the injection-production operation of UGS. In addition, due to the periodic high-speed injection and production characteristics of UGS, the seepage rules are also different from reservoir exploitation. Therefore, this difference leads to inaccurate numerical simulations based on gas reservoir data and gas well production data. So far, few studies have provided a comprehensive and systematic understanding of the injection-production capabilities and seepage characteristics of the multicycle operations of UGS in gas fields. Therefore, it is necessary to conduct a systematic study on the changes in physical properties of UGS due to repeated intrusion of water and the multiphase seepage rules during the high-speed injection-production operation.
Specifically, the following issues are addressed in this work: (1) the variation in permeability and porosity involved in the operation of UGS, and (2) the rules of multicycle injection and production flow and UGS utilization in various storage zones. In this study, sample cores with different permeability levels were selected based on the reservoir characteristics of Wen 23 UGS. Then, physical simulation methods for different UGS zones and the test to evaluate formation damage were established and conducted to understand the seepage rules. Meanwhile, the effects of the permeability and reservoir heterogeneity properties on the variation of pore volume and gas recovery in UGS were studied. These findings may contribute to a comprehensive and systematic understanding of the rules of multicycle injection and production flow and utilization of UGS in gas fields.

2. Field Description

2.1. Reservoir Location and Characteristics

Wen 23 underground gas storage rebuilt from Wen 23 gas fields is the first super-large gas storage facility in China, with a storage capacity of 10 billion; it is expected to solve the problem of peak shaving of many pipelines in North China. Wen 23 gas fields are located in Pu yang, Northern Henan province. Its geographical location is close to the economically developed eastern parts of China and has the geographical advantage of connections between multiple long-distance pipelines. As the largest sandstone dry gas field in eastern China, it extends over an area of 11.76 km2 and the proven total reserves of natural gas make up 132.79 billion m3. Wen 23 gas fields are characteristically abundant in reserves, have high pressure, and exhibit gas drying, development of edges, and bottom water. The initial reservoir pressures range from 38.62 to 38.87 MPa, the formation temperatures range from 113 to 120 °C, the formation depths range from 2750 to 3120 m, the formation pressure coefficients range from 1.1 to 1.27, and the formation water salinity levels range from 260,000 to 30,000 ppm. The gas fields are divided into the main block, east block, south block, and west block by four faults. Among them, the main block demonstrates the widest gas-bearing area and resources. Furthermore, each block has a good sealing capacity of trap dynamics and unified water-air interface, which provide convenient conditions for the rebuilding of the underground gas storage. The formation pressures of each block show synchronized decreases during production. By the end of December 2015, the cumulative gas production of 57 wells in the main block of the Wen 23 gas field was 94.07 × 10⁸ m3. After 30 years of development, the Wen 23 gas field is already exhausted. The main formation of the average pressure decreased from 38.75 to 3.5 MPa, and the pressure coefficient decreased from 1.30–1.35 to 0.10–0.60. Meanwhile, the water-air interface of each independent block rose to 2–10 m.

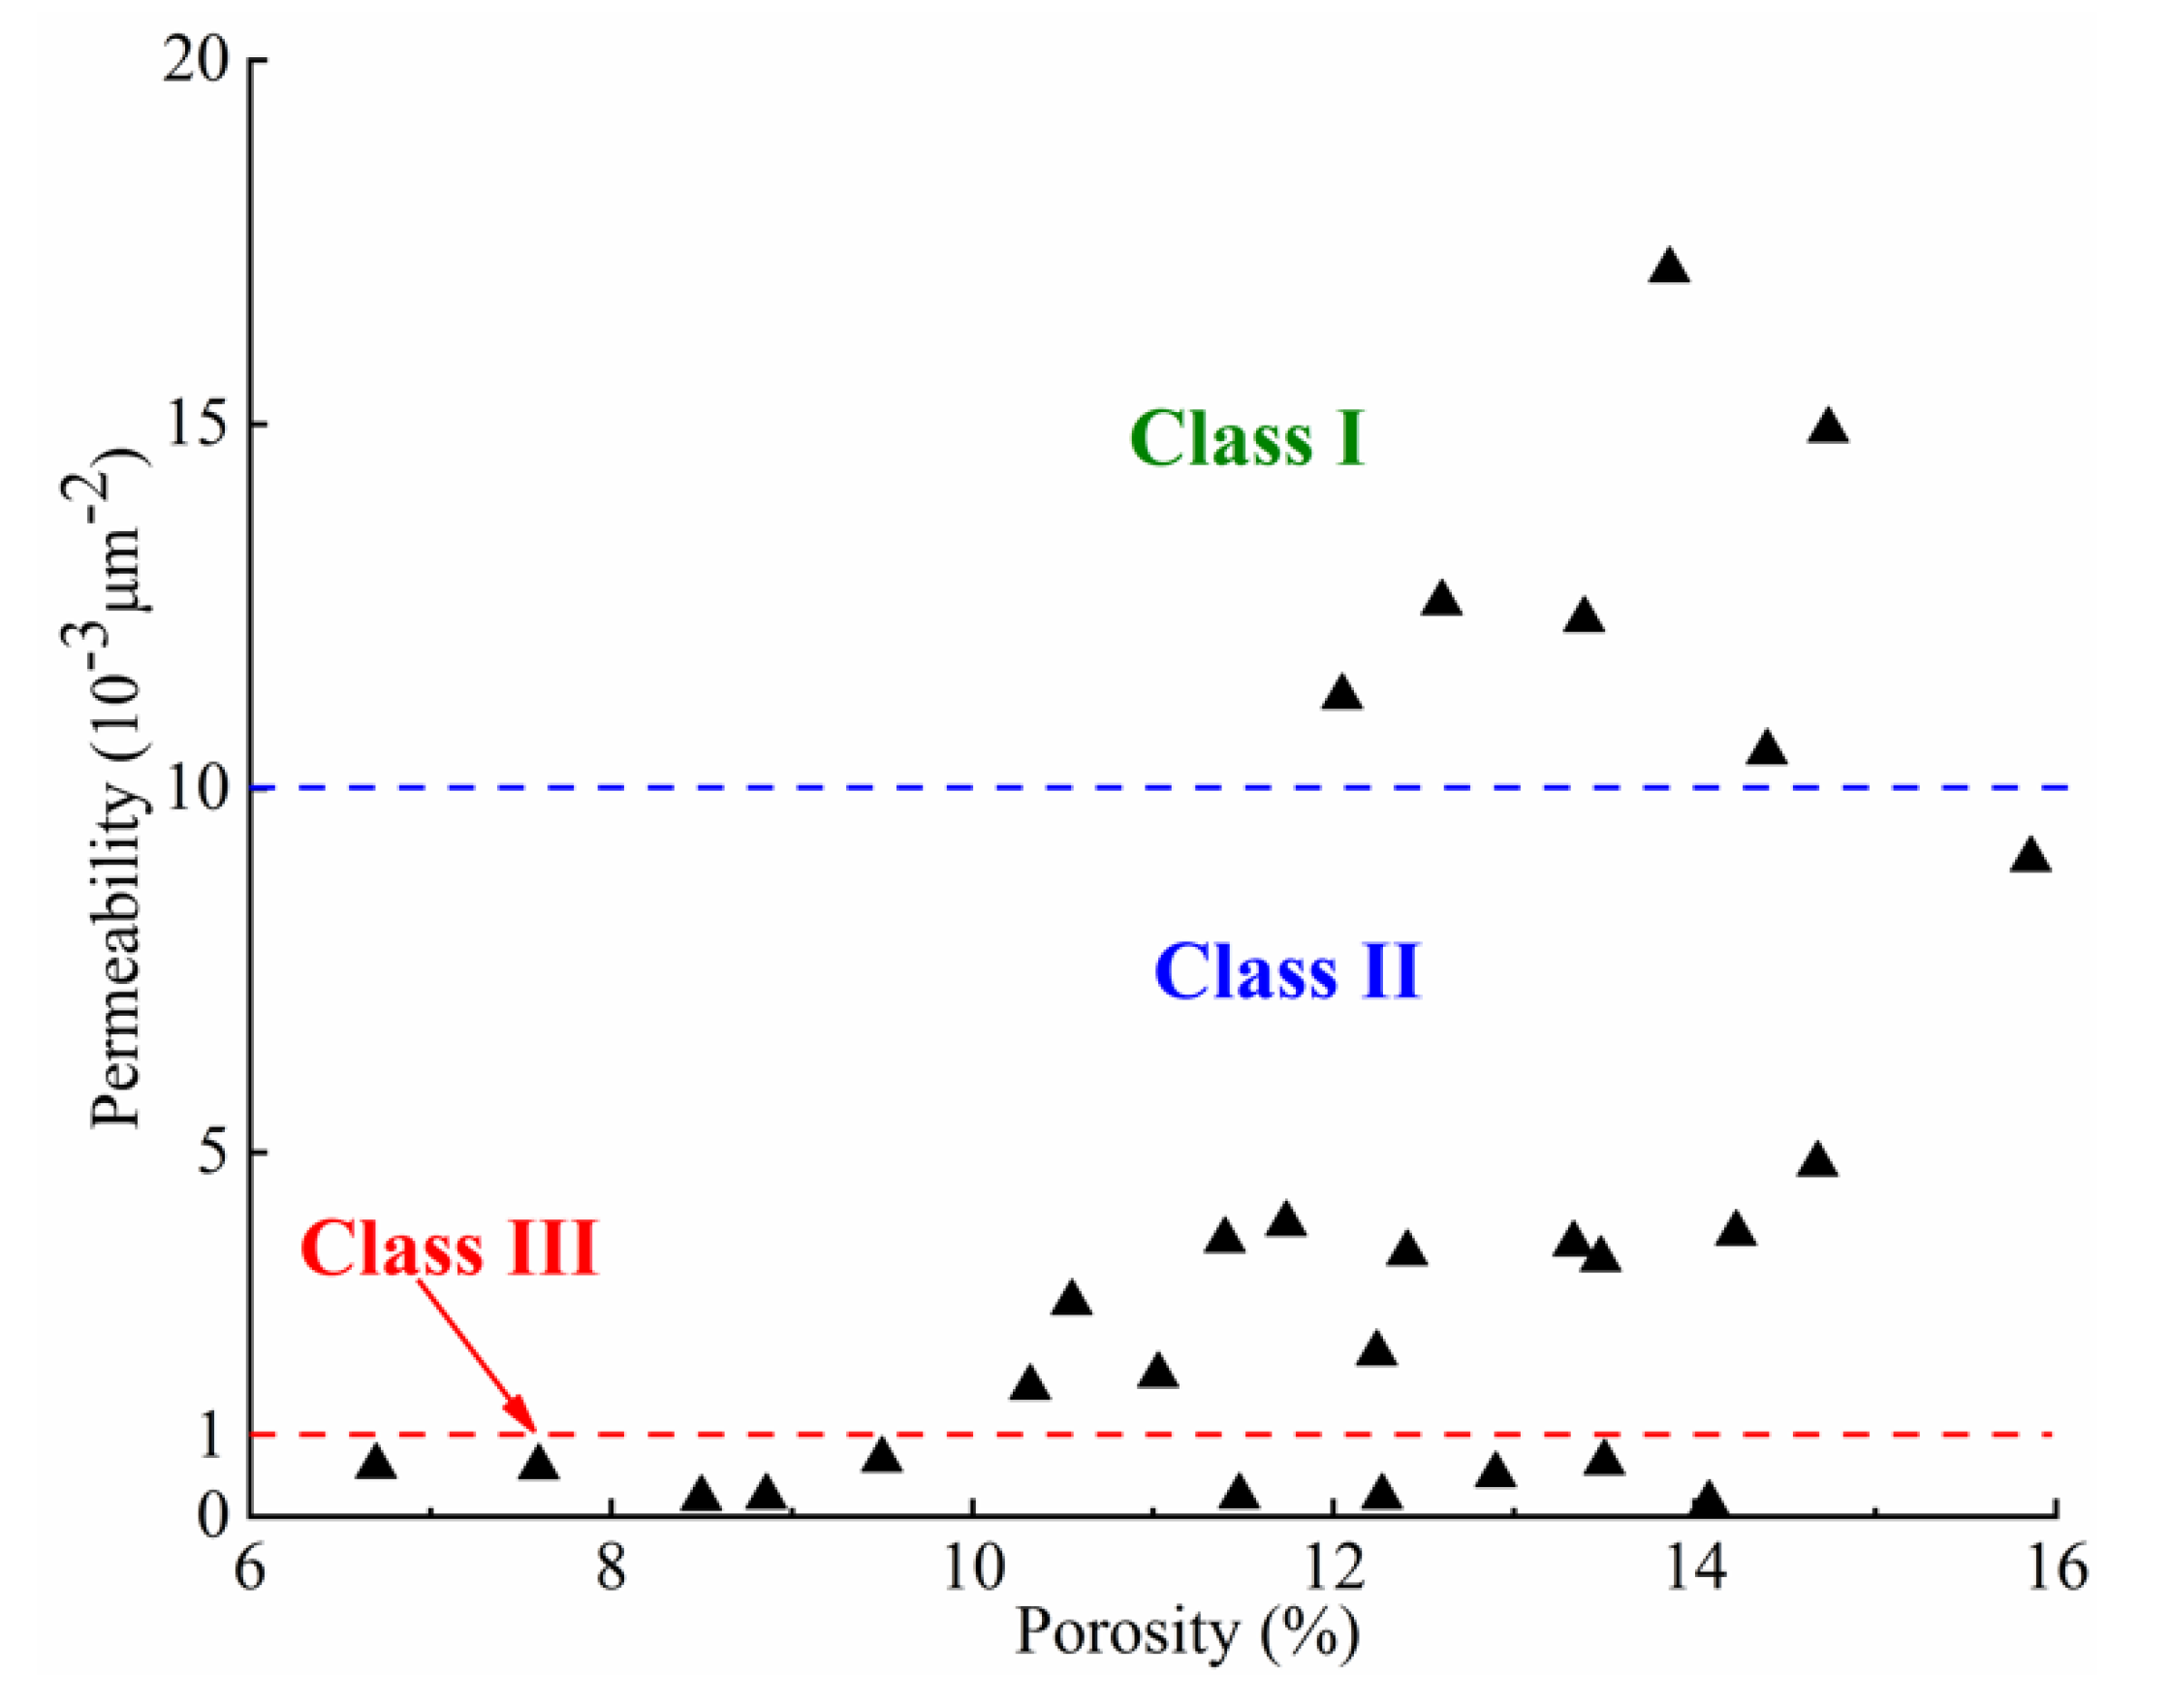
2.2. Petrophysical Characteristics of the Reservoir

Generally, cores from coring formation provide a relatively complete reservoir data for parameter calculations [5]. According to the statistical analysis of the full-diameter core samples collected from the Wen 23 gas fields, the porosity ranged from 8.86% to 13.86% and was 11.36% on average, with the permeability distributed mainly in 0.27 × 10⁻³ μm and 17.12 × 10⁻³ μm and an average of 8.696 × 10⁻³ μm, as shown in Figure 1. According to the sandstone reservoir classification criteria, the gas field reservoir is divided into three types: Class I, K > 10 × 10−3 μm; Class II, 1 × 10⁻³ μm < K< 10 × 10−3 μm; and Class III, K < 1 × 10⁻³ μm.
According to the results obtained by core observation, casting slices, and electron microscope scanning, the main reservoir space of the Wen 23 fields is composed of secondary intergranular corrosion pore. Furthermore, according to the results of X-ray diffraction analysis, the main clay mineral type in the rock is illite and illite mixed layer, with average proportions of 58.9% and 27.3%, respectively. Illite is a fast-sensitive mineral, which easily causes particle migration and blocks formation. The illite mixed layer is a mineral that swells in water and easily causes clay expansion and dispersion, resulting in formation damage.

3. Experimental Samples and Methods

3.1. Multi-Cycle Formation Damage Evaluation by Flow Test

During the cyclic injection-production operation of the gas storage, the pressure of the fluid in the reservoir varies between cycles, resulting in the net overburden stress also changing periodically. Therefore, it is critical to study the characteristics of physical parameters in UGS under various net overburden pressures. This experiment aimed to investigate the variation in permeability and porosity involved in the UGS operation process. Cores samples representing different reservoir types were selected for this investigation. The basic properties of the core samples used in this experiment are shown in Table 1.
Various methods were proposed to study the stress sensitivity of reservoirs; among them, the confining pressure lifting method is one of the simplest and most practical test methods [32]. The measuring instrument is the “CMS-300 overburden permeability-porosity tester” developed by American Core Lab company, which can realize the measurement of permeability and porosity under overpressure. This method was modified from the confining pressure lifting method, with the principal steps as follows:
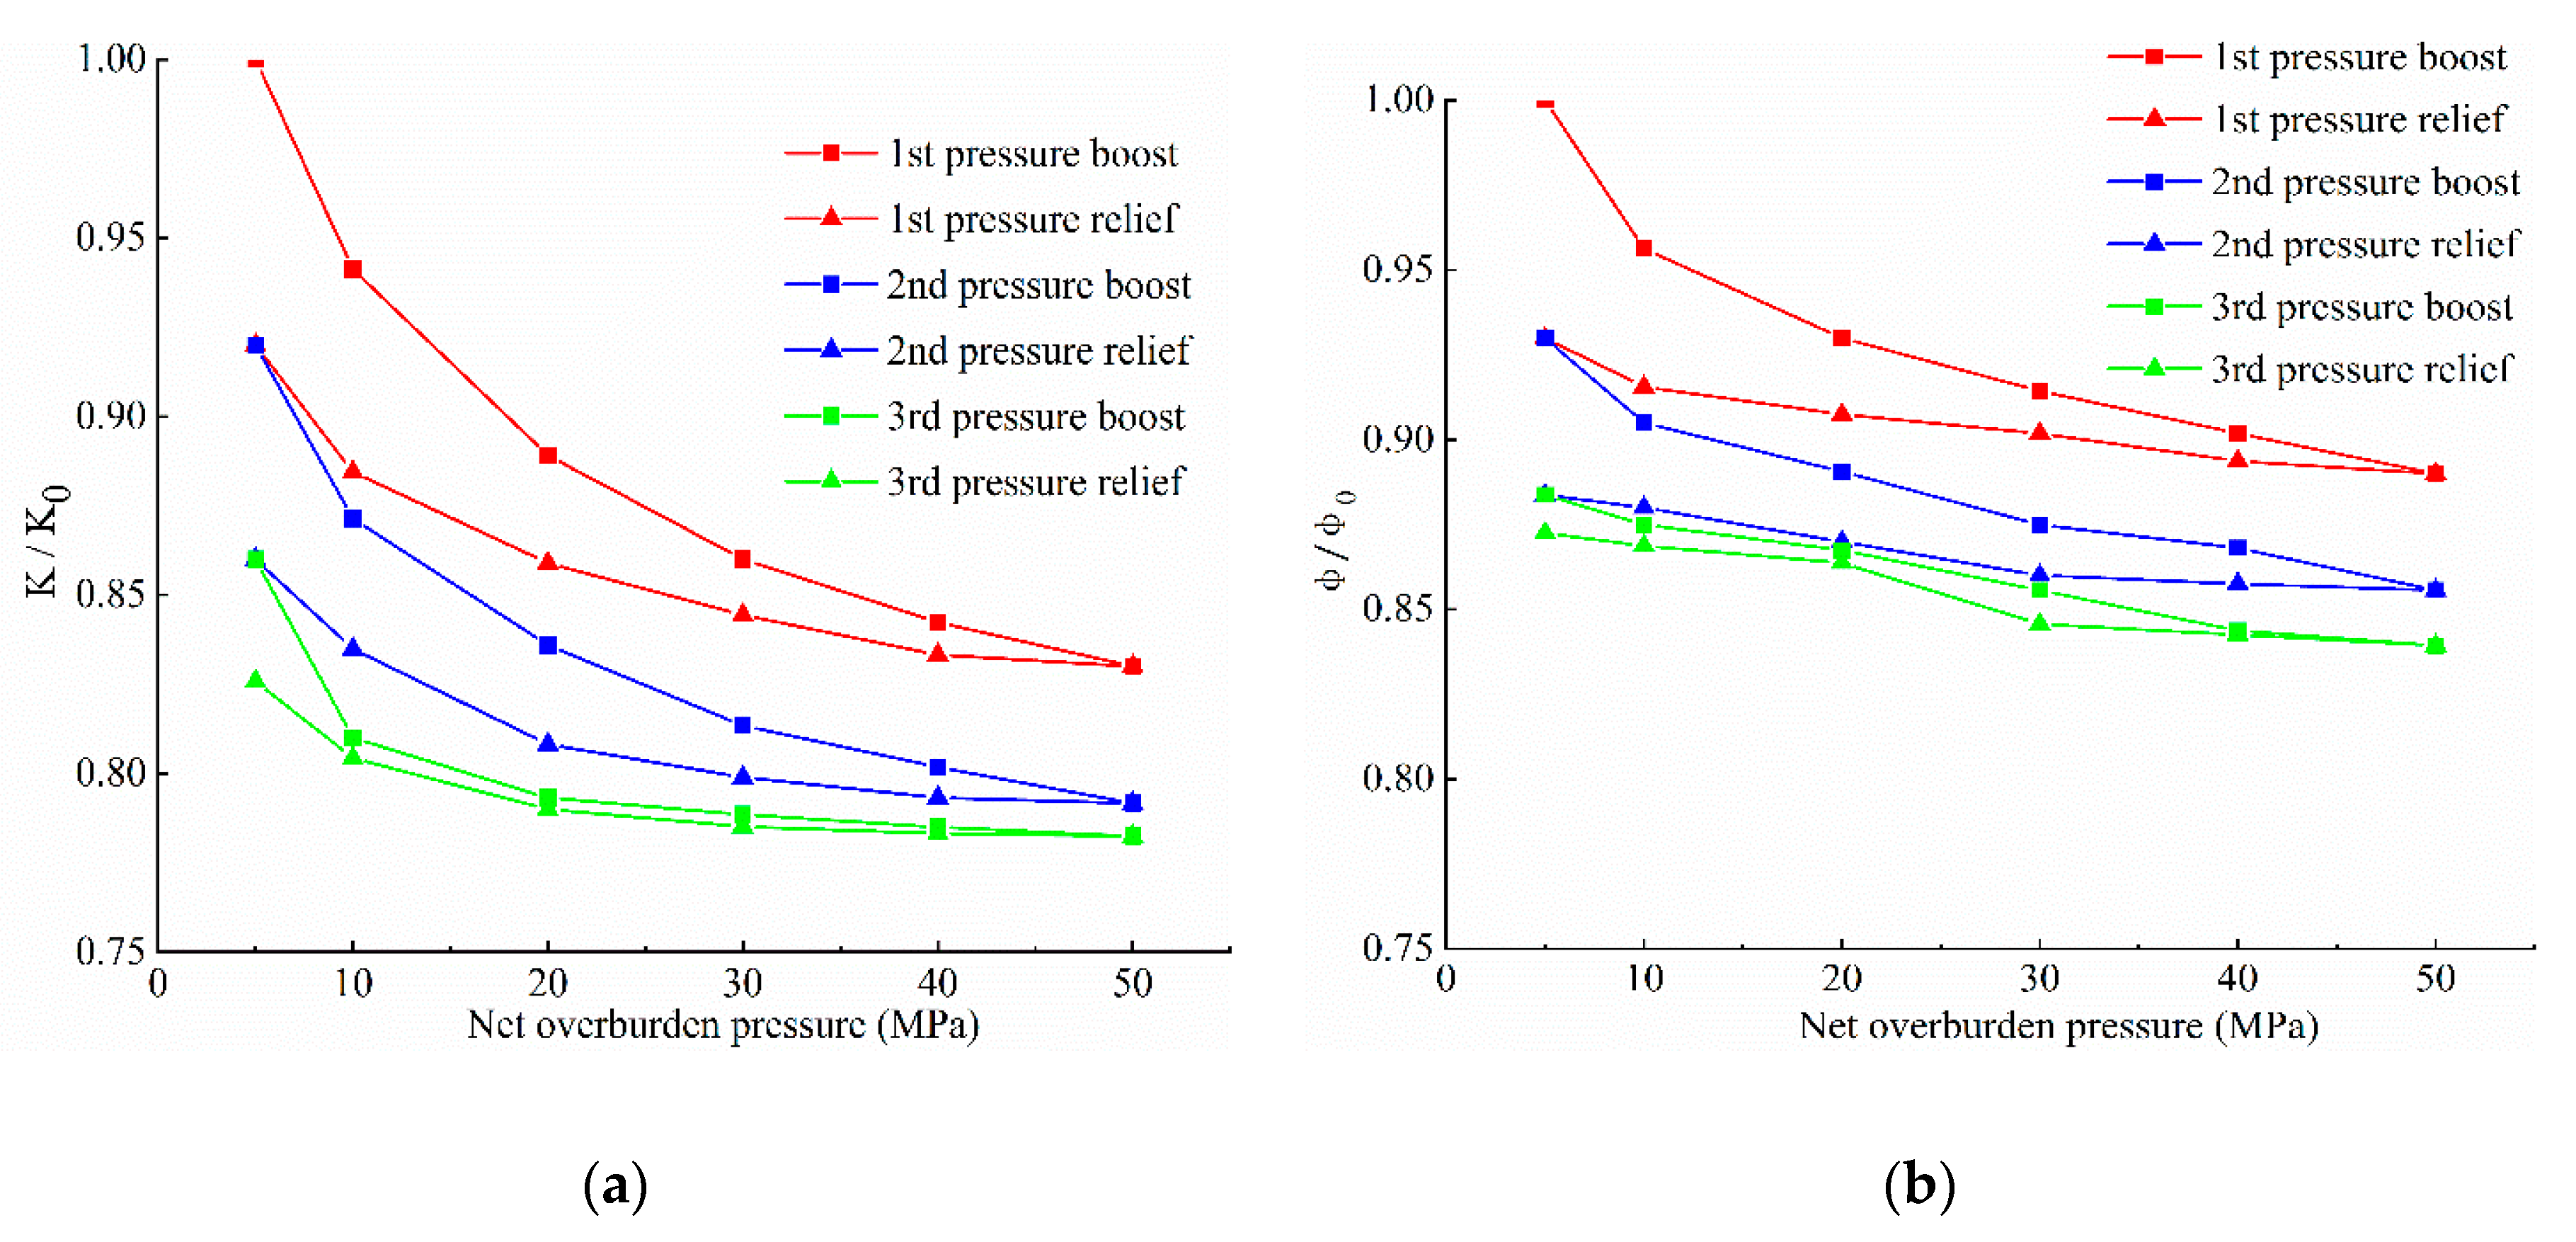
  • The confining pressure was gradually increased to 5, 10, 20, 30, 40, and 50 MPa while measuring the permeability and porosity of the core samples, respectively.
  • The confining pressure was gradually reduced to 50, 40, 30, 20, 10, and 5 MPa while measuring the permeability and porosity of core samples, respectively.
  • Steps 2 and 3 were repeated three times.
  • At the end of the experiment, the data were analyzed comprehensively.

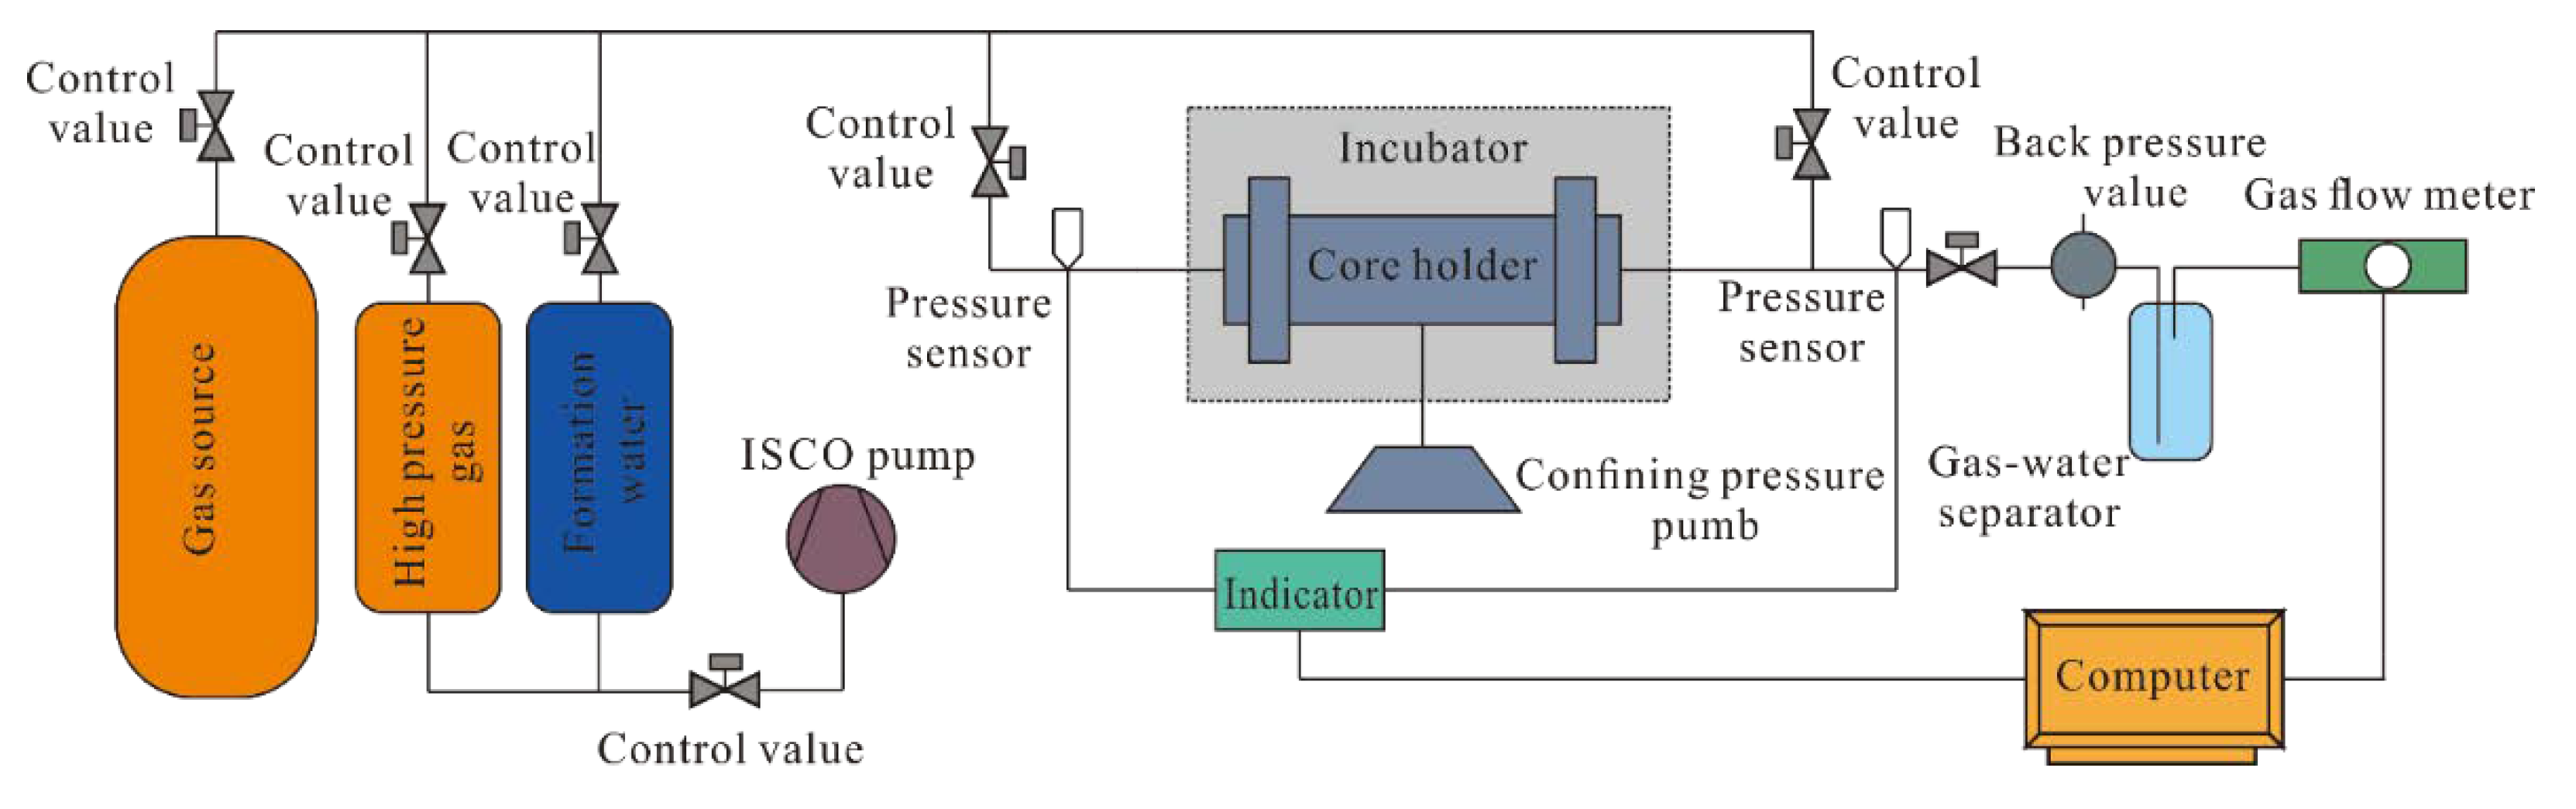
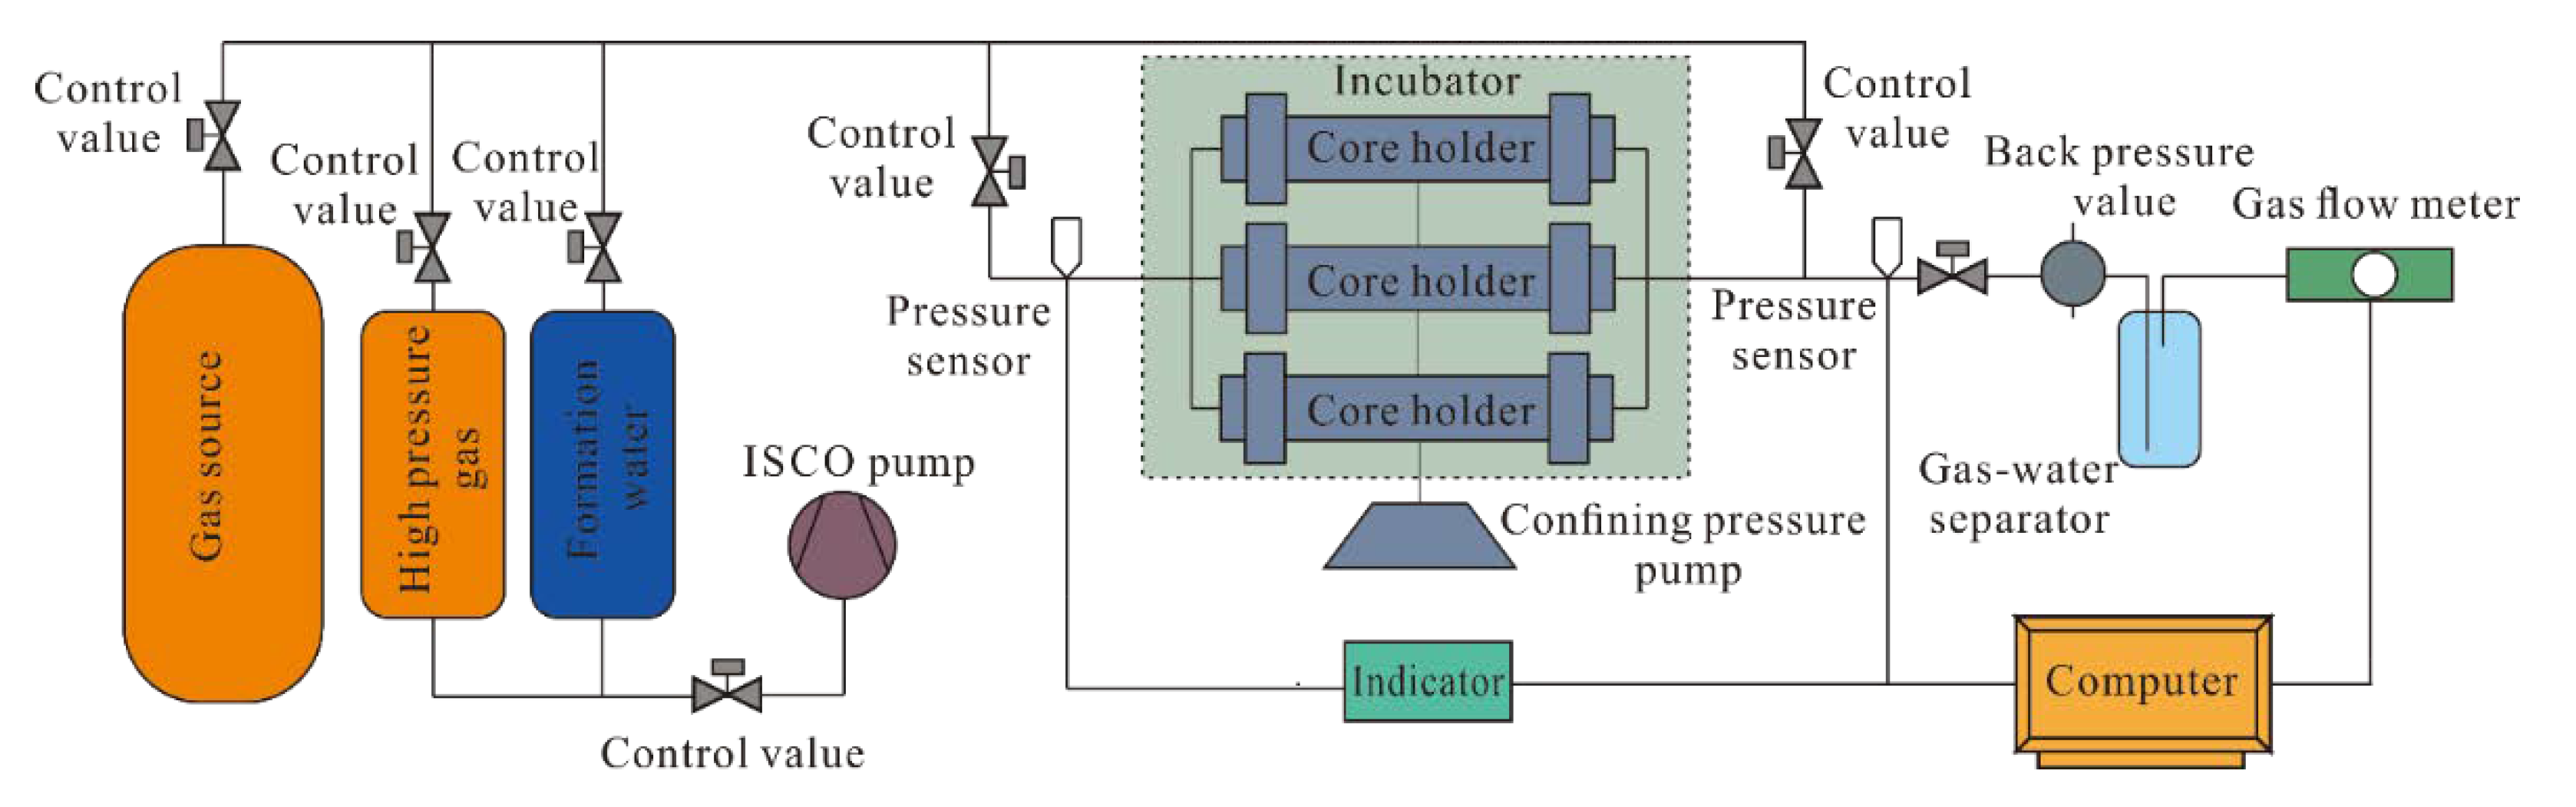
3.2. Physical Simulation Experiment of Multi-Cycle Injection and Production in UGS

As mentioned in the literature review, the UGS formation is divided into four zones, namely, the pre-UGS gas zone, the gas-drive-water gas zone, the gas-water transition zone, and the watered-out zone [25]. Among them, the pre-UGS gas zone, the gas-drive-water gas zone, and the gas-water transition zone are the gas storage spaces of UGS. The pre-UGS gas zone refers to the zone above the water-gas interface in the depleted gas reservoirs without the invasion of water. Further, the pre-UGS gas zone experiences no water intrusion during the multicycle injection and production of UGS. The gas-drive-water gas zone is located between the gas-water interface corresponding to the lower limit pressure of the gas storage and the initial gas-water interface. At the end of gas reservoir exploitation, the gas-drive-water gas zone is invaded by water, but this water is displaced during the gas injection stage of UGS. No water intrusion exists during the multicycle injection and production processes of UGS in the gas-drive-water gas zone. The gas-water transition zone is located between the gas-water interface corresponding to the lower and upper pressure limits of the gas storage. During multicycle injection and production of UGS, gas-water reciprocation exists in the gas-water transition zone. This experiment aimed to investigate the rules of injection-production flow in the UGS operation process. The design of the experimental scheme in this paper was based on the characteristics of each gas storage zone and the characteristics of high-speed UGS injection and production. The cores selected in this experiment showed a uniform diameter of 3.8 cm and length of 6.5 cm. The confining pressure was 68 MPa and the operating pressure of gas injection and production was 18–38 MPa. Flows chart of the experiment are illustrated in Figure 2 and Figure 3. The basic properties of the core samples and the experimental scheme used in this experiment are shown in Table 2.
To mimic the actual operation of UGS, the physical simulation experiment was roughly classified into three stages:
  • Simulation of gas reservoir accumulation. Firstly, gas was injected from the left end of the core holder. When the core was driven from the saturated water state to the bound water state, the right end of the holder was closed. Then, gas was injected slowly from the left end of the core to reach the required reservoir pressure.
  • Simulation of gas reservoir exploitation. Gas was produced via constant flow from the left end of the core to reach the required depletion pressure of the gas reservoir. No water invasion was present in the simulation of the pre-UGS gas zone at this stage.
  • Simulation of multicycle injection-production in UGS. Firstly, gas was injected at high speed from the left end of the core to reach the upper pressure limit of the UGS operation, 38 MPa. Then, after the pressure distribution in the core was balanced, gas was produced at high speed from the left end of the core to the lower pressure limit of the UGS operation, 18 MPa. The injection-production process was repeated to complete six injection-production cycles. No water invasion was present in either the simulation of the pre-UGS gas zone or the gas-drive-water gas zone during this stage.

4. Results and Discussion

4.1. Characteristics of the Stress Sensitivity of Permeability and Porosity

The intrinsic form of the change in reservoir rock caused by the change in effective pressure is mainly the tension and compression of the pore and rock frame [33]. This change is expressed by variation in permeability and porosity [32]. This section attempts to discuss the variation in permeability and porosity involved in the UGS operation process. Regression analysis was used to process the data of this experiment, which were normalized to obtain the normalized permeability and porosity curves.
Figure 4 provides the results obtained from the preliminary analysis of the variation in permeability and porosity. The vertical axis indicates the relative permeability and porosity, which is the relative ratio of the original permeability and porosity levels, respectively. According to the results, both the permeability and porosity decreased alongside the net overburden pressure (confining pressure minus interstitial fluid pressure). However, the decrease in permeability was greater than the decrease in porosity. When the net overburden pressure increased to 50 MPa in the first pressure boot, the permeability stress sensitivity index ( 1 K K 0 ) and the porosity stress sensitivity index ( 1 ϕ ϕ 0 ) were 0.17 and 0.11, respectively, illustrating that permeability is more sensitive to changes in net overburden pressure than the porosity. During the initial change in net overburden pressure (5–30 MPa), the permeability and porosity change ranges were larger. With the further increase of net overburden pressure, the porosity permeability change range was small. Further analysis showed that as the levels of pressure-boost and pressure-relief increased, the curves of permeability and porosity with net overburden pressure tended to be gentle, demonstrating that the permeability stress sensitivity and porosity stress sensitivity gradually decreased.
The burial depth in the middle of Wen 23 UGS is about 2900 m. According to the empirical formula, the pressure of the overlying strata is about 68 MPa. The operating pressure of the gas storage is 18–38 MPa and the change range of the net overburden pressure during multicycle injection and production in UGS is 30–50 MPa. Therefore, the porosity and permeability rates within the range of net overburden pressure could be calculated based on experimental data.
The calculation formula was as follows:
Δ ϕ = ϕ 30 ϕ 50 ϕ 30 × 100 %
Δ K = K 30 K 50 K 30 × 100 %
ϕ 30 , ϕ 50 , K 30 , K 50 stand for the porosity and permeability measured under confining pressures of 30 and 50 MPa, respectively.
The results of the correlational analysis are presented in Table 3. From Table 3, it can be seen that under the operating pressure of the gas storage, the porosity and permeability of the reservoir experienced little change. The permeability change rate of the three types of reservoirs in Wen 23 gas storage was between 0.3% and 3.5%, and the porosity change rate was between 0.32% and 2.67%. Further analysis shows that the change rate of permeability and porosity become smaller as the number of pressure-boost and pressure-relief increases. Take A1 for example, the change rate of permeability and porosity in the first pressure-boost is 3.5% and 2.67%, while in the third pressure-boost is 0.76% and 1.9%, respectively. This shows that after several times of pressure-boost and pressure-relief, the pore structure of formation tends to a new stable equilibrium state, and the deformation of pore structure caused by the pressure change is getting smaller. Therefore, the changes in reservoir porosity and permeability caused by injection and production pressure changes in Wen 23 gas storage were negligible.

4.2. Characteristics of Multi-Cycle Injection and Production Flow in the Pre-UGS Gas Zone

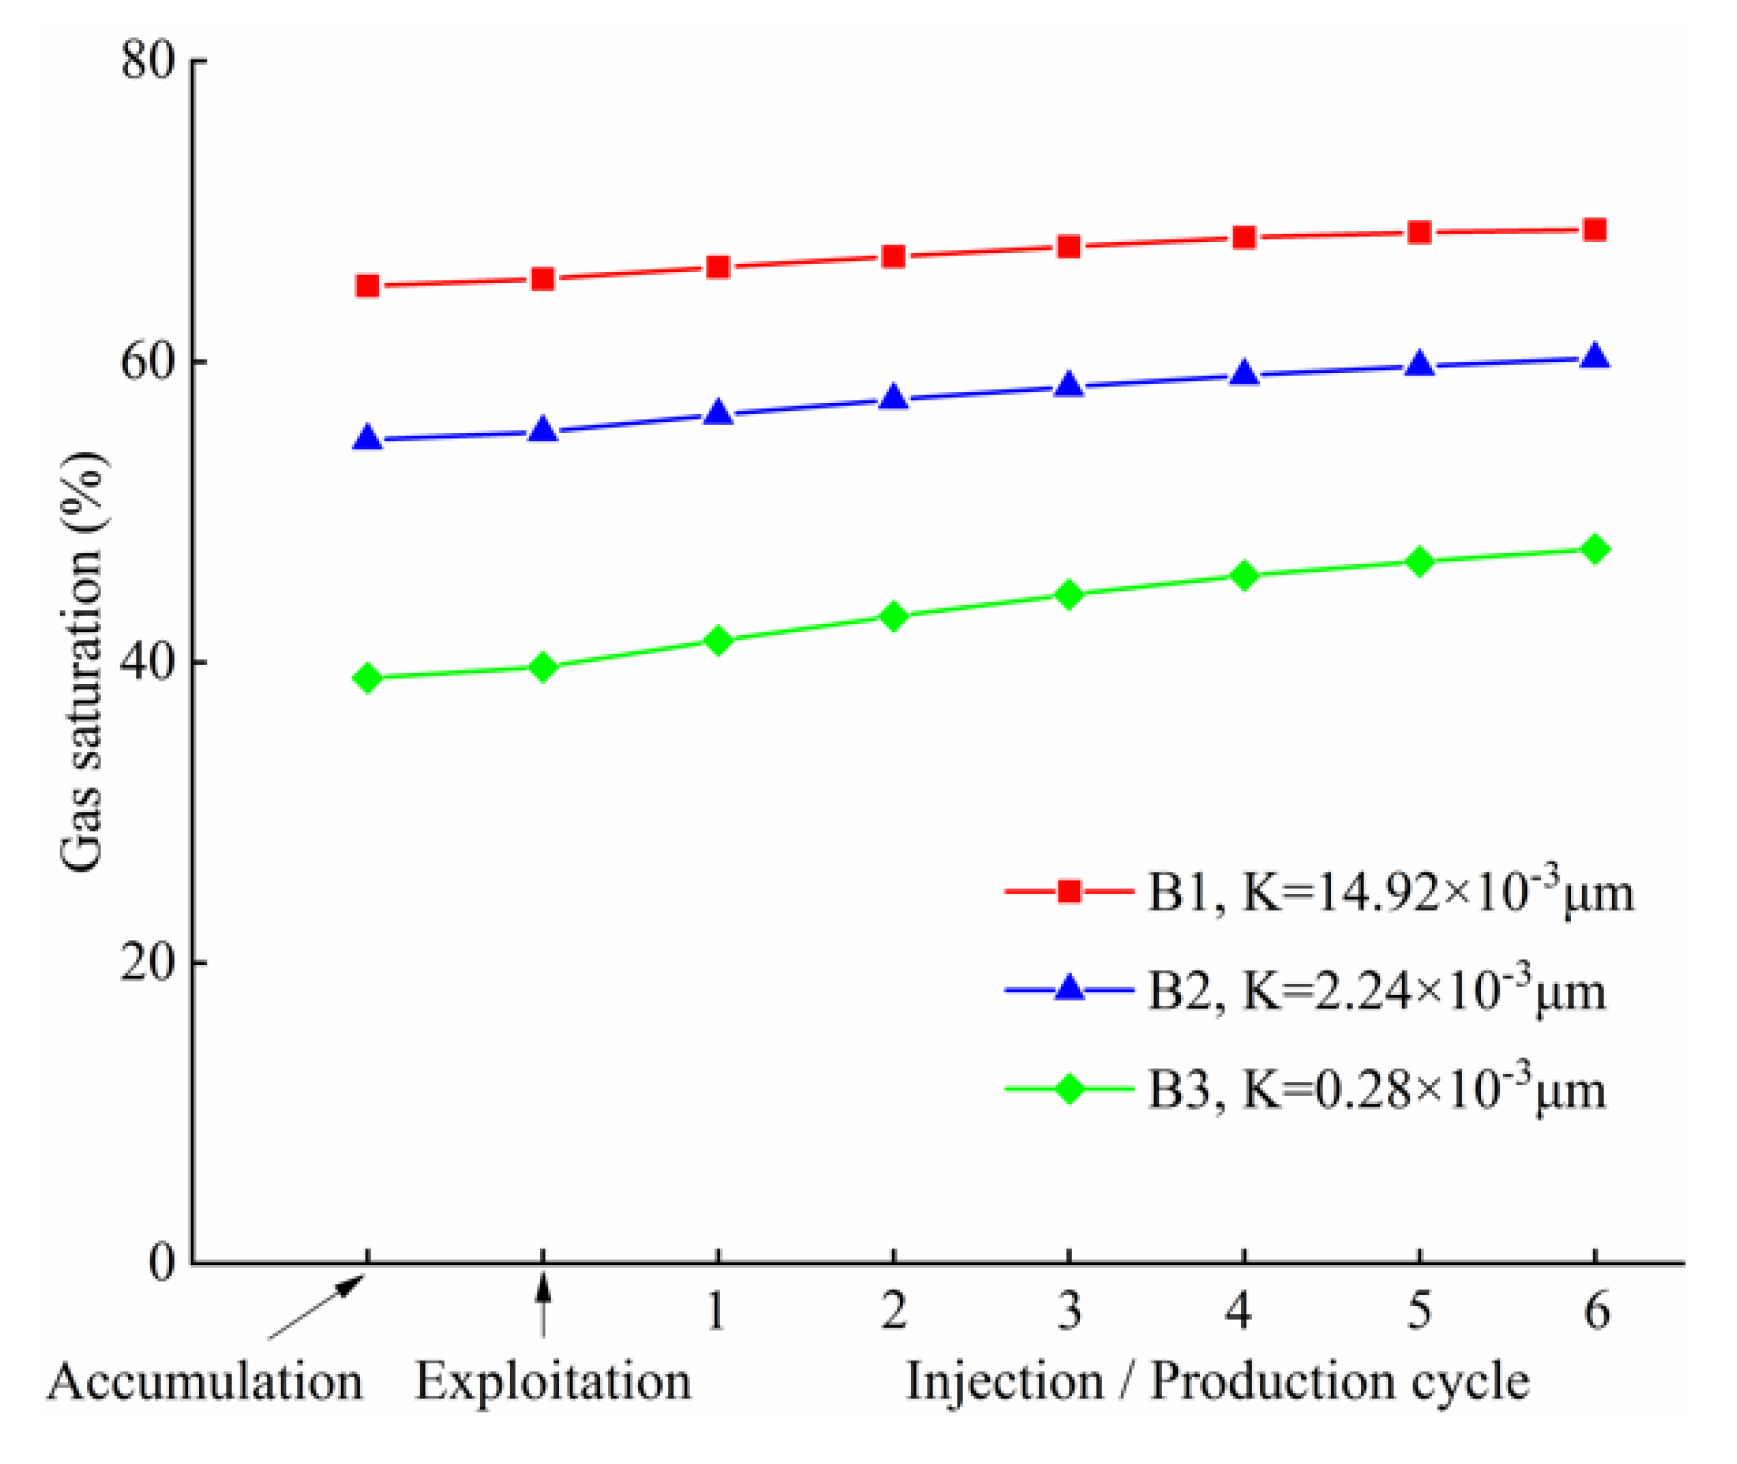
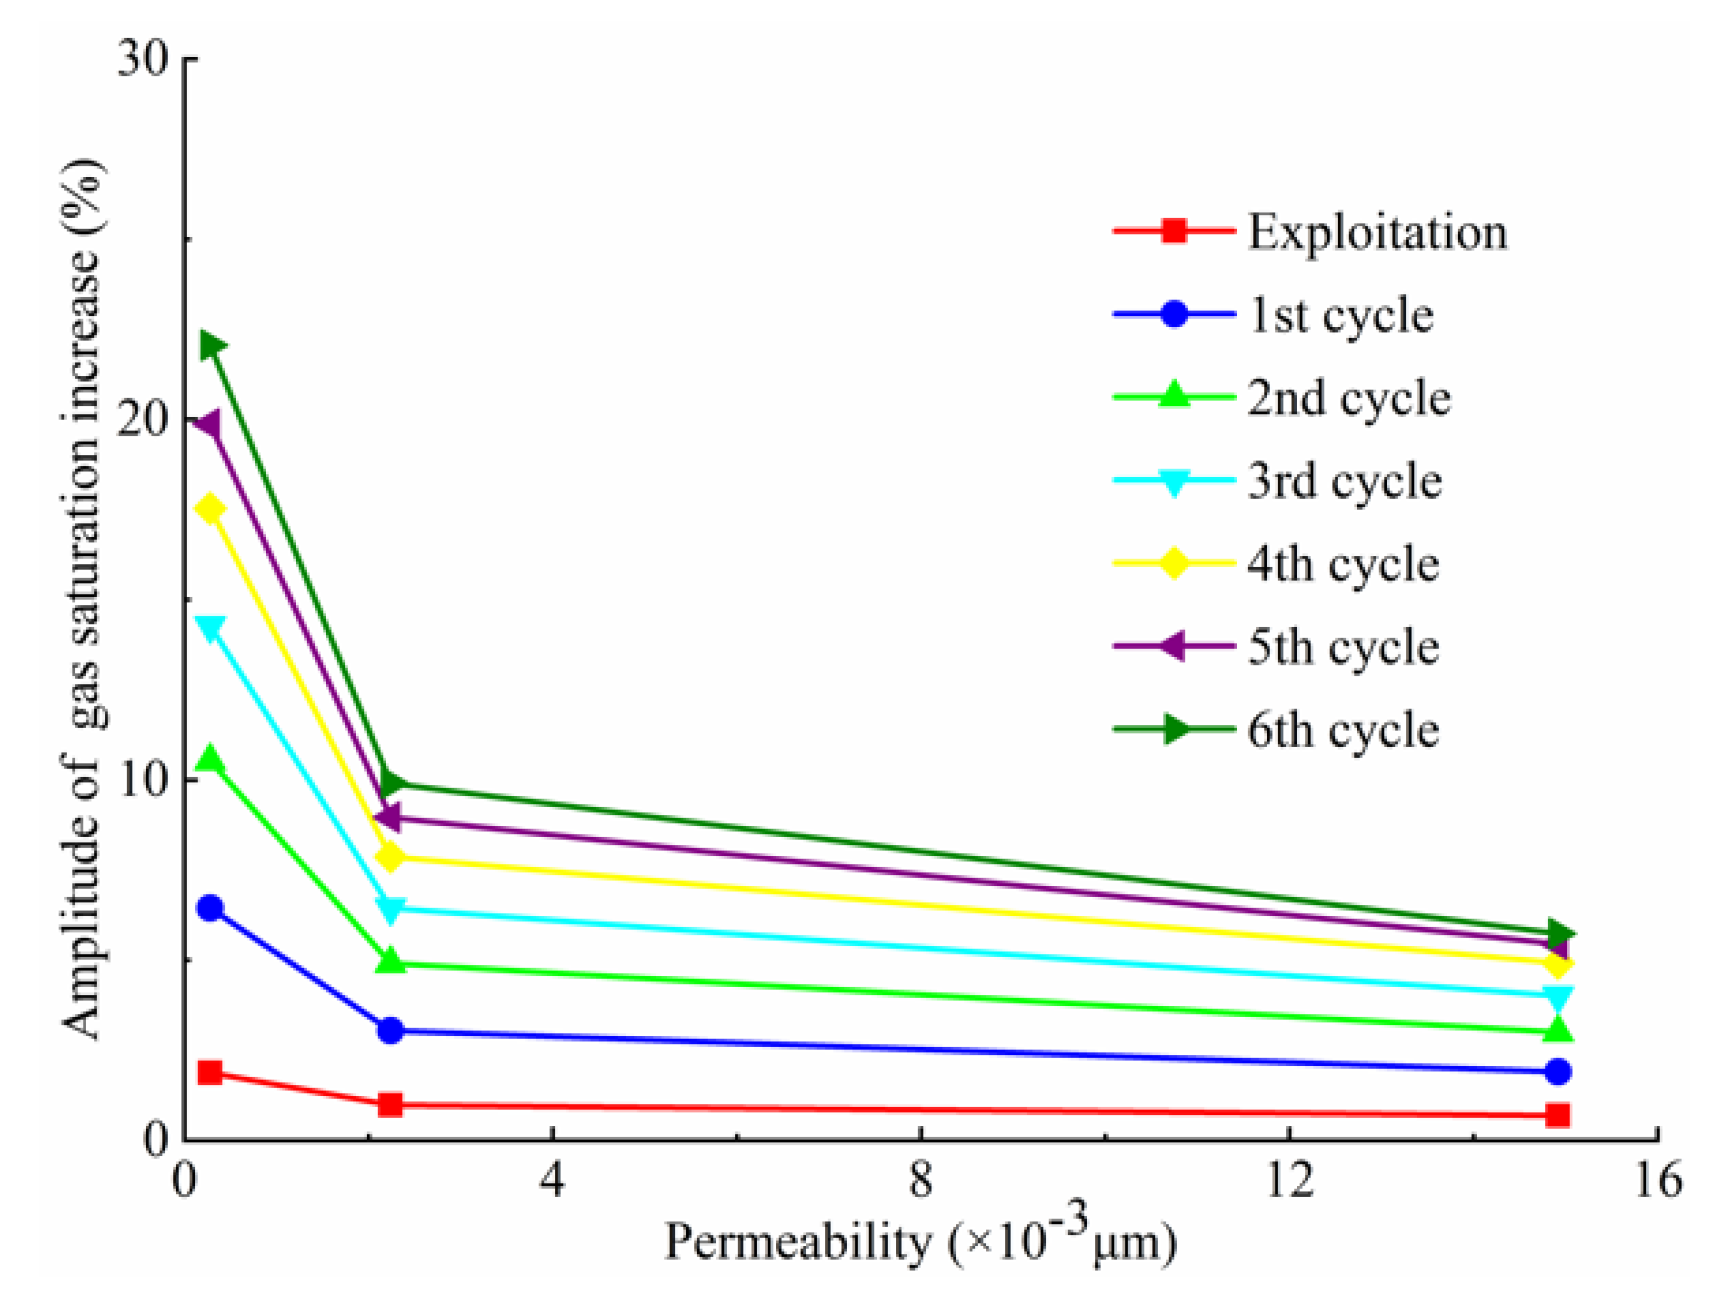
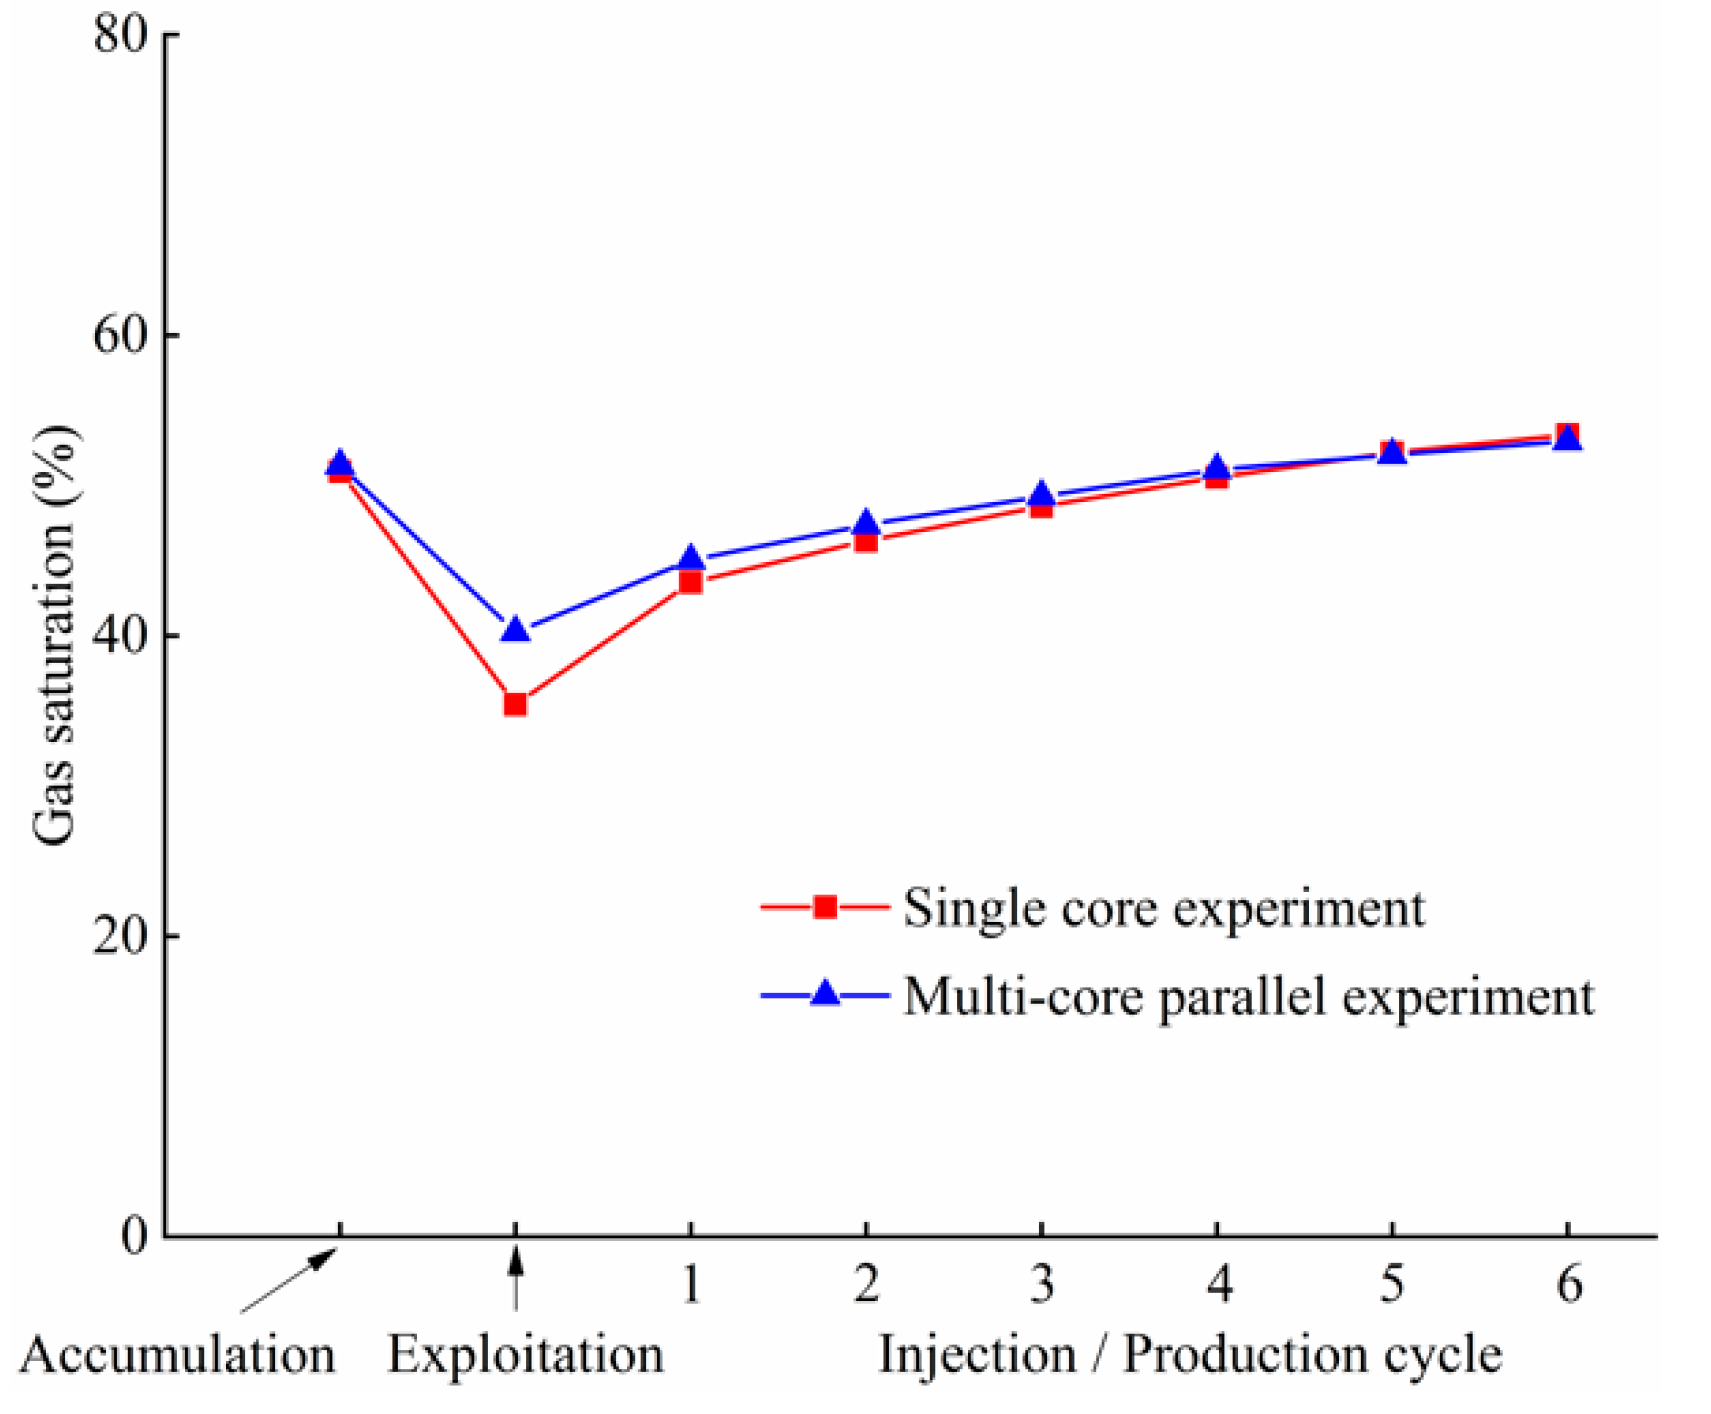
4.2.1. Variation Characteristics of Gas Saturation in the Pre-UGS Gas Zone

Figure 5 provides the experimental data regarding the variation of gas saturation during multicycle injection-production in the pre-UGS gas zone. The average gas saturations of the three types of reservoirs during gas injection-production were 67.75%, 58.54%, and 44.84%, respectively. Figure 5 shows that gas saturation increased with the injection-production cycle, suggesting that the characteristics of high-speed multicycle injection and production in UGS were conducive to the increased gas-containing pore space. This result may be explained by the fact that as the injection-production cycle increased, the rapid flow of gas in the pore throat development area continued to carry bound water for production. Meanwhile, the water film deposited in the small pore throat was concentrated to the larger throat under the wetting function and then carried out by the gas, which functioned to release the storage space occupied by the formation water and dead gas zones.
Further analysis of the data revealed small but significant negative correlations between permeability and the amplitude of gas saturation increase, as shown in Figure 6. After six injection and production cycles, the gas saturation increases of B1, B2, and B3 were 5.73%, 9.91%, and 22.05%, respectively. Therefore, it seems that reservoirs with low permeability generally greatly increase pore gas storage space during multicycle injection and production in the pre-UGS gas zone, as seen from the association of lower permeability with high initial water saturation. Furthermore, the greater the relative amount of liquid phase continuously carried and dried during high-speed development, the greater the increase in gas saturation.

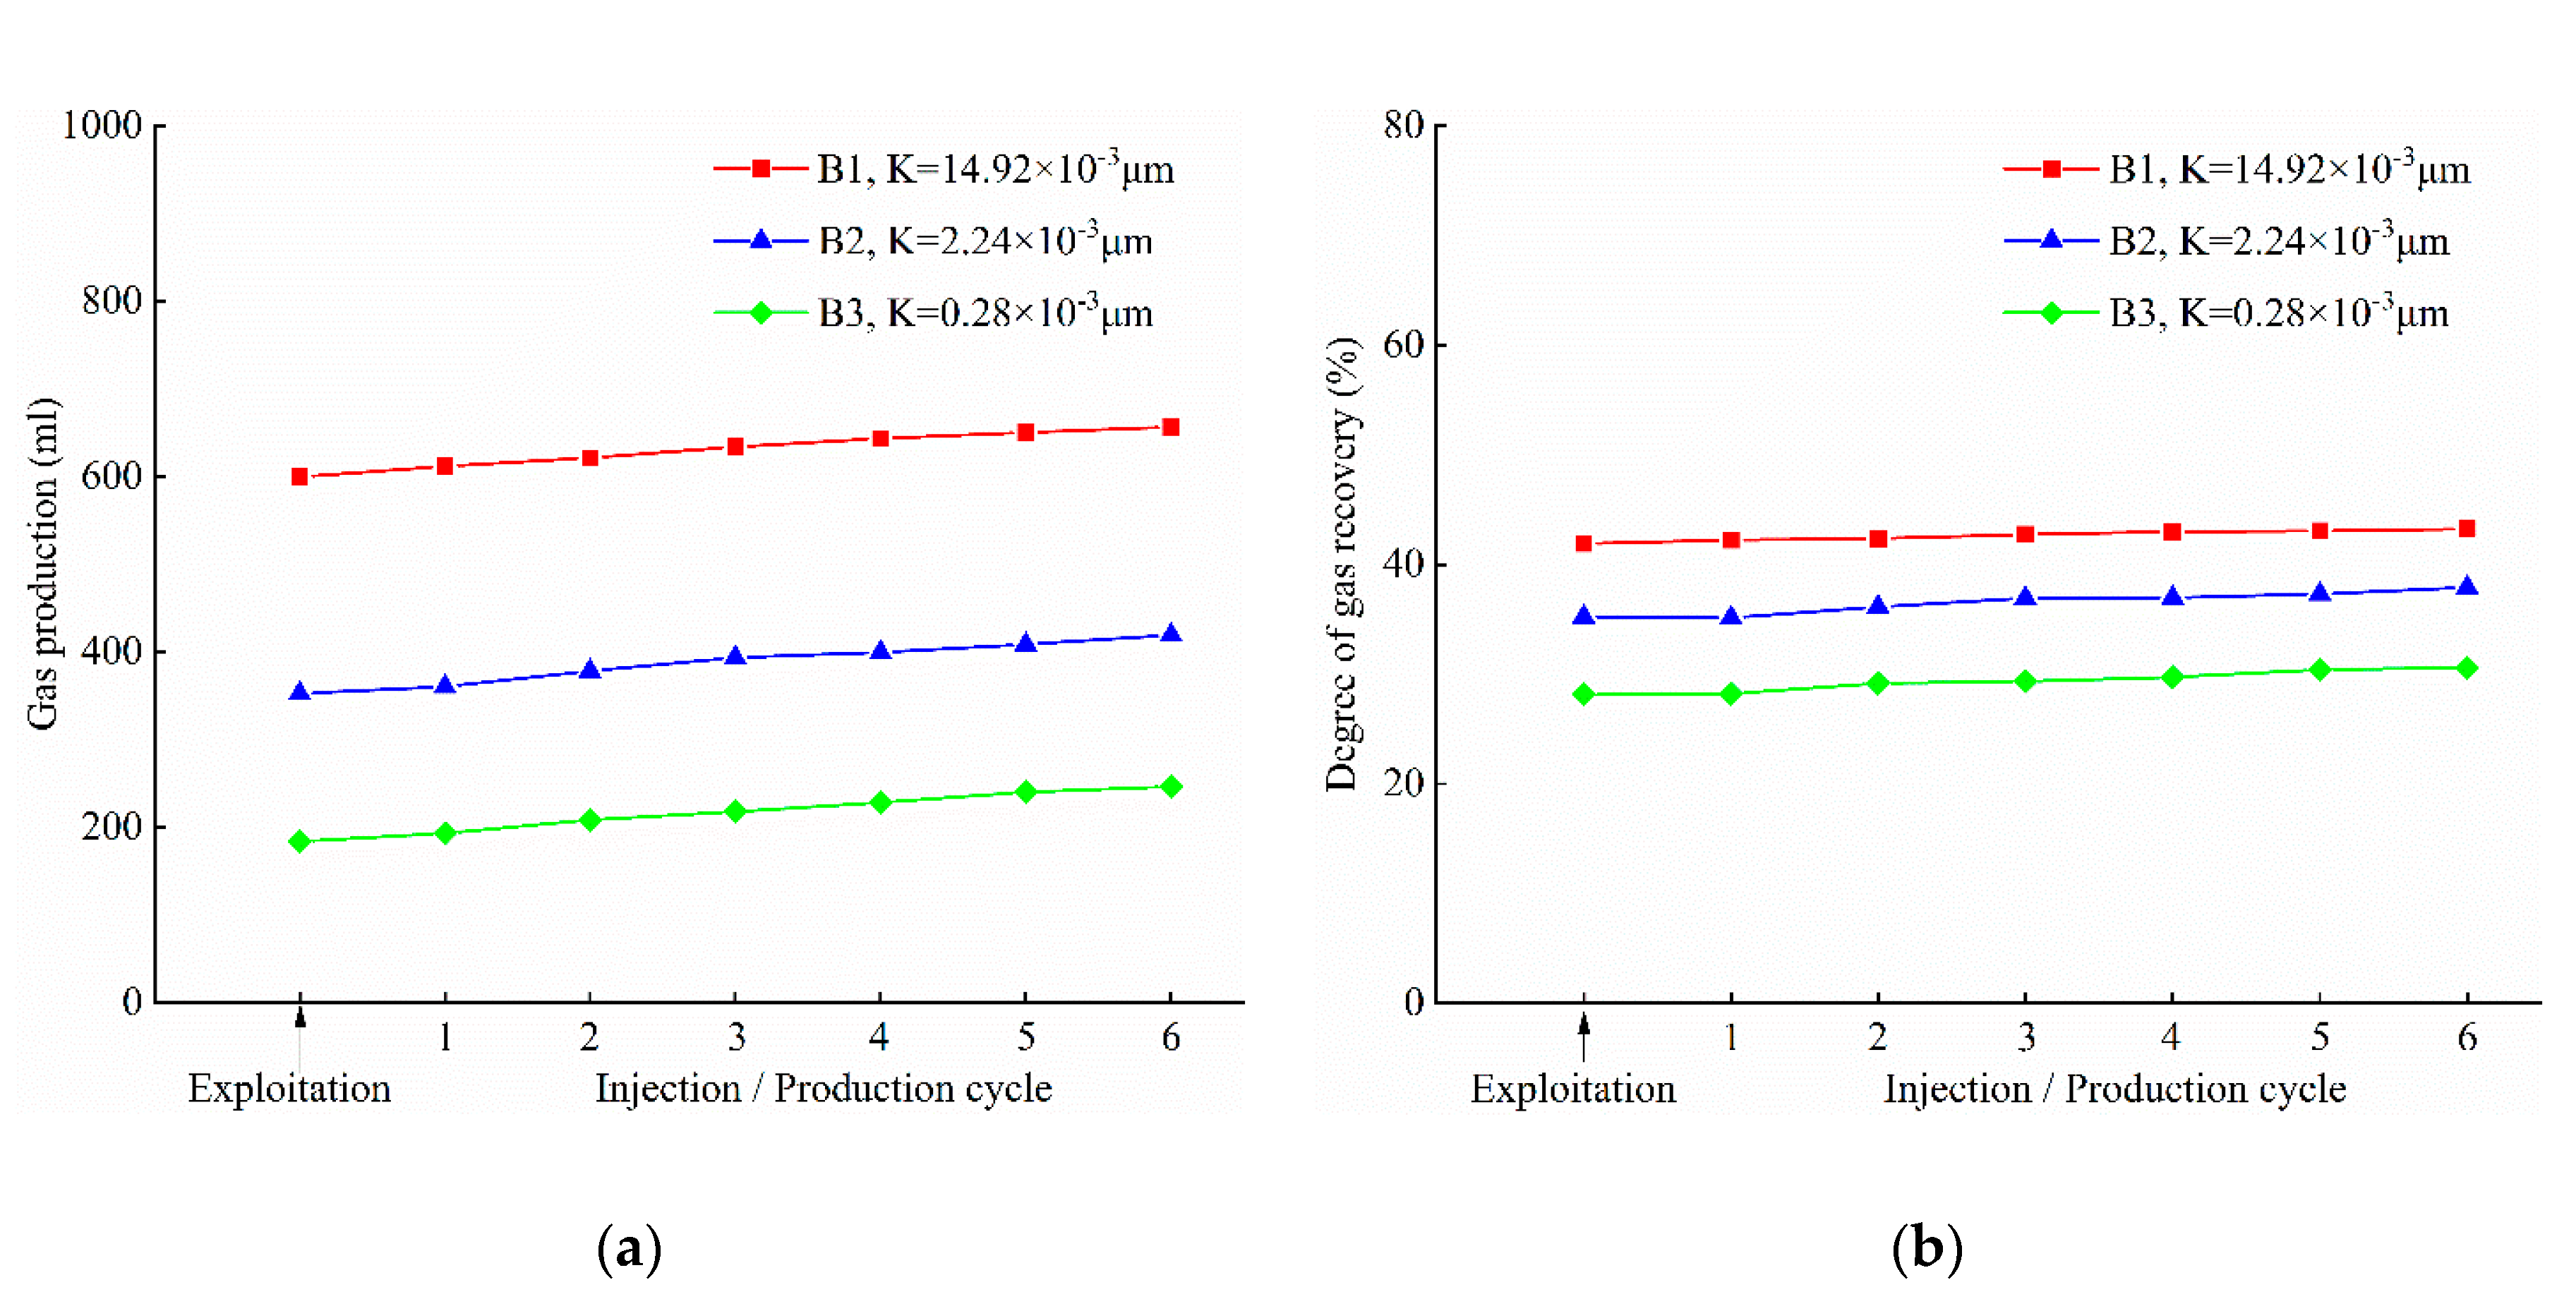
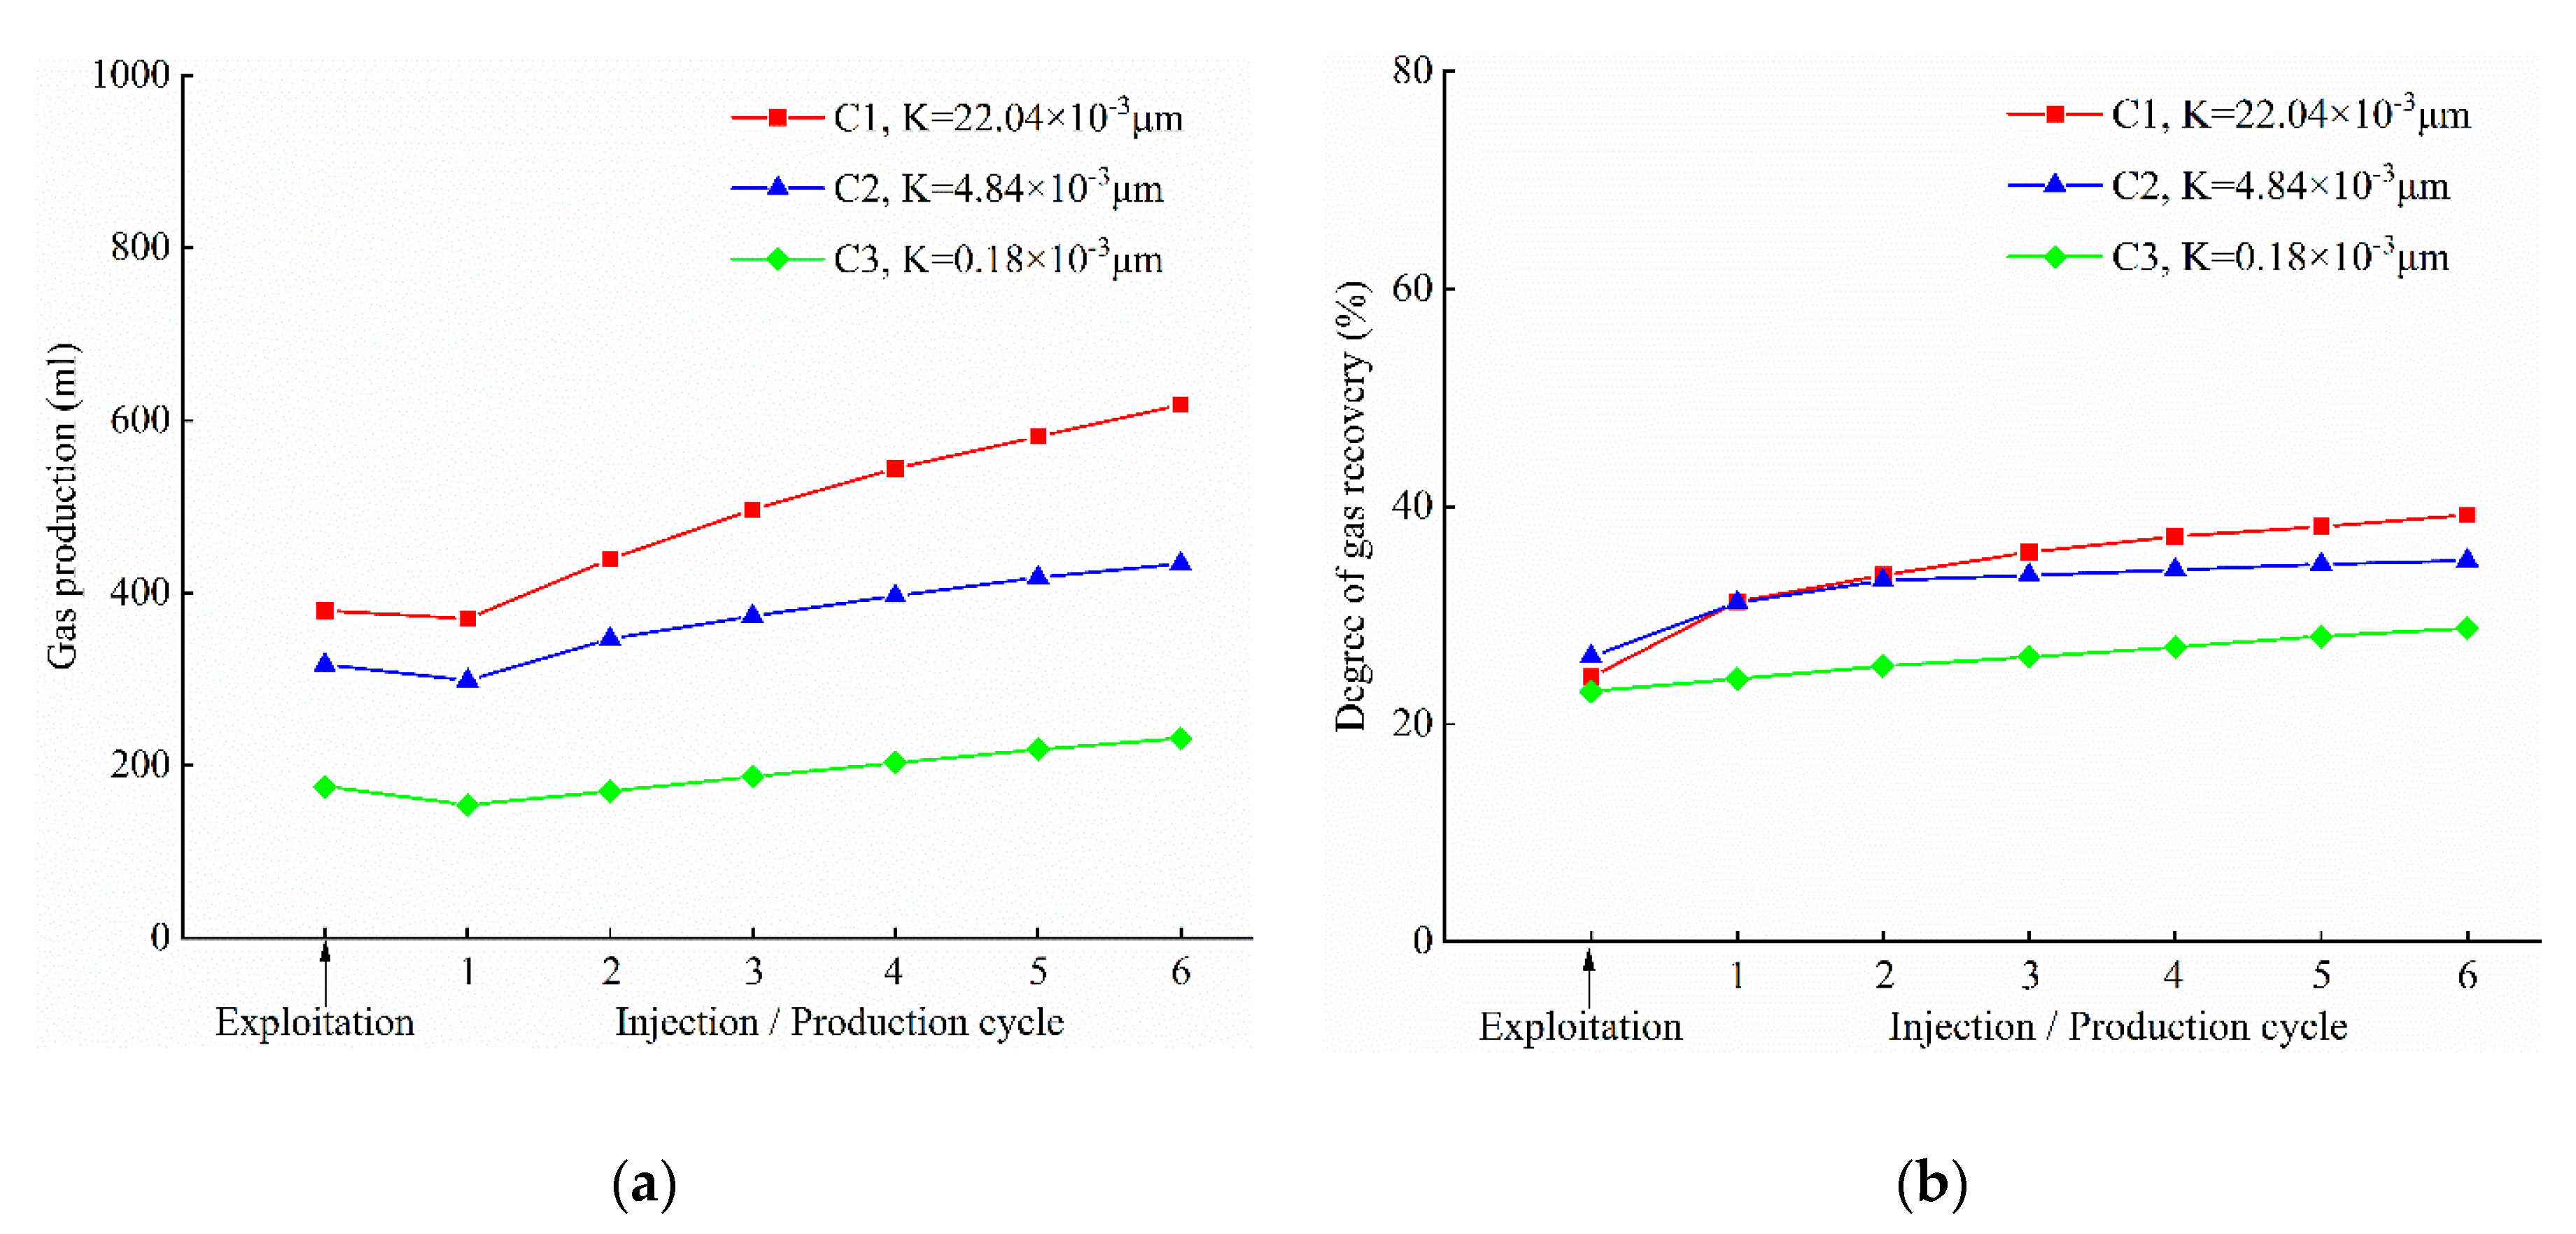
4.2.2. The Rules of Reserve Utilization in the Pre-UGS Gas Zone

Figure 7 presents the gas production and degree of gas recovery in the pre-UGS gas zone. Gas production increased with the injection-production cycle, suggesting that the gas injection-production capacity in the pre-UGS gas zone gradually improved. Further analysis shows that the degree of gas recovery also increased with the injection-production cycle, however, there were obvious differences in the degree of gas recovery in the pore space according to different physical properties. Reservoirs with high permeability showed strong seepage capacity, and under the same injection-production operation conditions, the gas production and the degree of gas recovery were high. The average degrees of gas recovery of the three types of reservoirs were 42.76%, 36.73%, and 29.57%, respectively. After six injection and production cycles, the degrees of gas recovery of B1, B2, and B3 were 43.24%, 37.9%, and 30.58%, respectively.

4.3. Characteristics of Injection-Production Flow in the Gas-Drive-Water Gas Zone

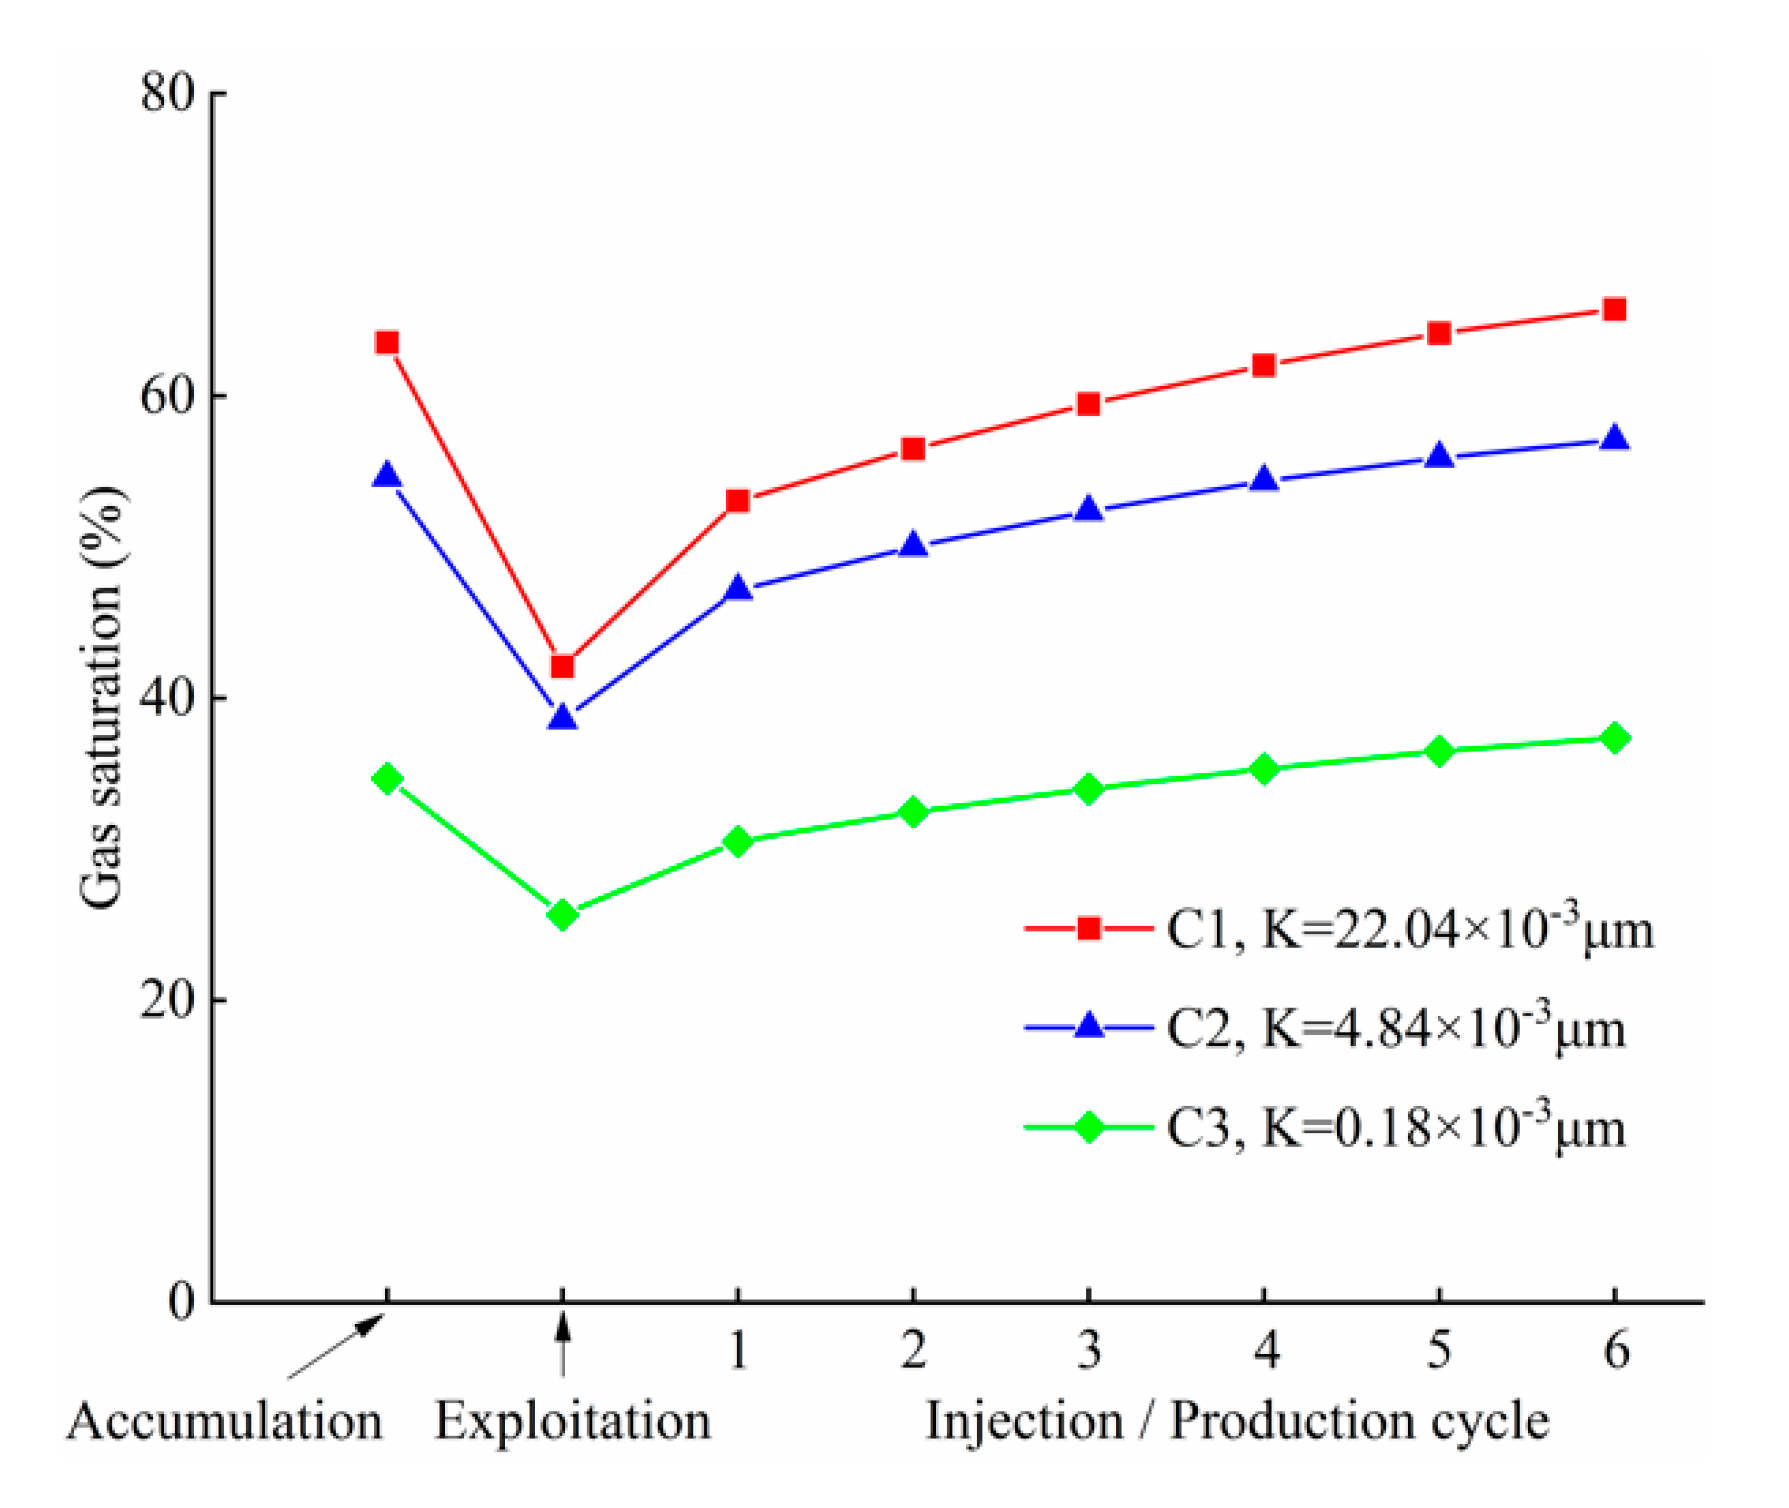
4.3.1. Variation Characteristics of Gas Saturation in the Gas-Drive-Water Gas Zone

As mentioned in the literature review, water invasion is present during reservoir exploitation in the gas-drive-water zone, thus, distinctions can be made between the pre-GUS zone and the gas-drive-water zone. The results regarding the variation of gas saturation with multicycle injection-production in the gas-drive-water zone are shown in Figure 8. Overall, gas saturation tended to decline first in the exploitation stage, then significantly increased during multicycle injection and production, showing that when the gas-drive-water gas zone was converted into gas storage, the gas saturation and space for storing gas was reduced. In the low-speed exploitation stage, part of the gas storage space was occupied by water due to the intrusion of side and bottom water, and there was also a trap for the gas-containing space. Further analysis showed that the higher the permeability, the greater the reduction in gas saturation due to water intrusion. The gas saturation of cores C1, C2, and C3 decreased by 33.73%, 29.38%, and 26.04%, respectively. During multi-cycle injection-production in UGS, no water invasion was present in the gas-drive-water zone. On one hand, the initial gas injection stage of gas storage displaced part of the invading water, however, similar to the pre-UGS gas zone, residual water was produced under the action of high-speed injection-production cycle extraction. After six injection and production cycles, gas saturation amplitudes of C1, C2, and C3 increased by 56.14%, 47.96%, and 45.69%, respectively. The experimental results showed that the storage space and storage capacity in the gas-drive-water gas zone is greatly improved. Therefore, the gas-drive-water zone is the main dilatant zone of UGS.
Regarding reservoir heterogeneity, variations in the gas saturation of the gas-drive-water zone are shown in Figure 9, which demonstrates that the trends of average gas saturation in the multicore parallel experiment were similar to the trend in the single-core experiment. However, the reduction in gas saturation due to water intrusion was relatively small in the multicore parallel experiment. The reduction values of average gas saturation due to water invasion were 30.43% and 21.63%, respectively. Under the influence of storage heterogeneity, the water body was mainly promoted by high-permeability formation, while medium-permeability and low-permeability formation were less affected by water intrusion. Further, the gas saturation in the multicore parallel experiment showed a smaller increase. After six injection and production cycles, the gas saturation of the multicore parallel experiment and the single-core experiment increased by 50.64% and 31.59%, respectively. This discrepancy could be attributed to reservoir heterogeneity. During high-speed injection and production, the gas preferentially seeped in the high-permeability formation, resulting in the recovery of gas saturation mainly in the high-permeability reservoir.

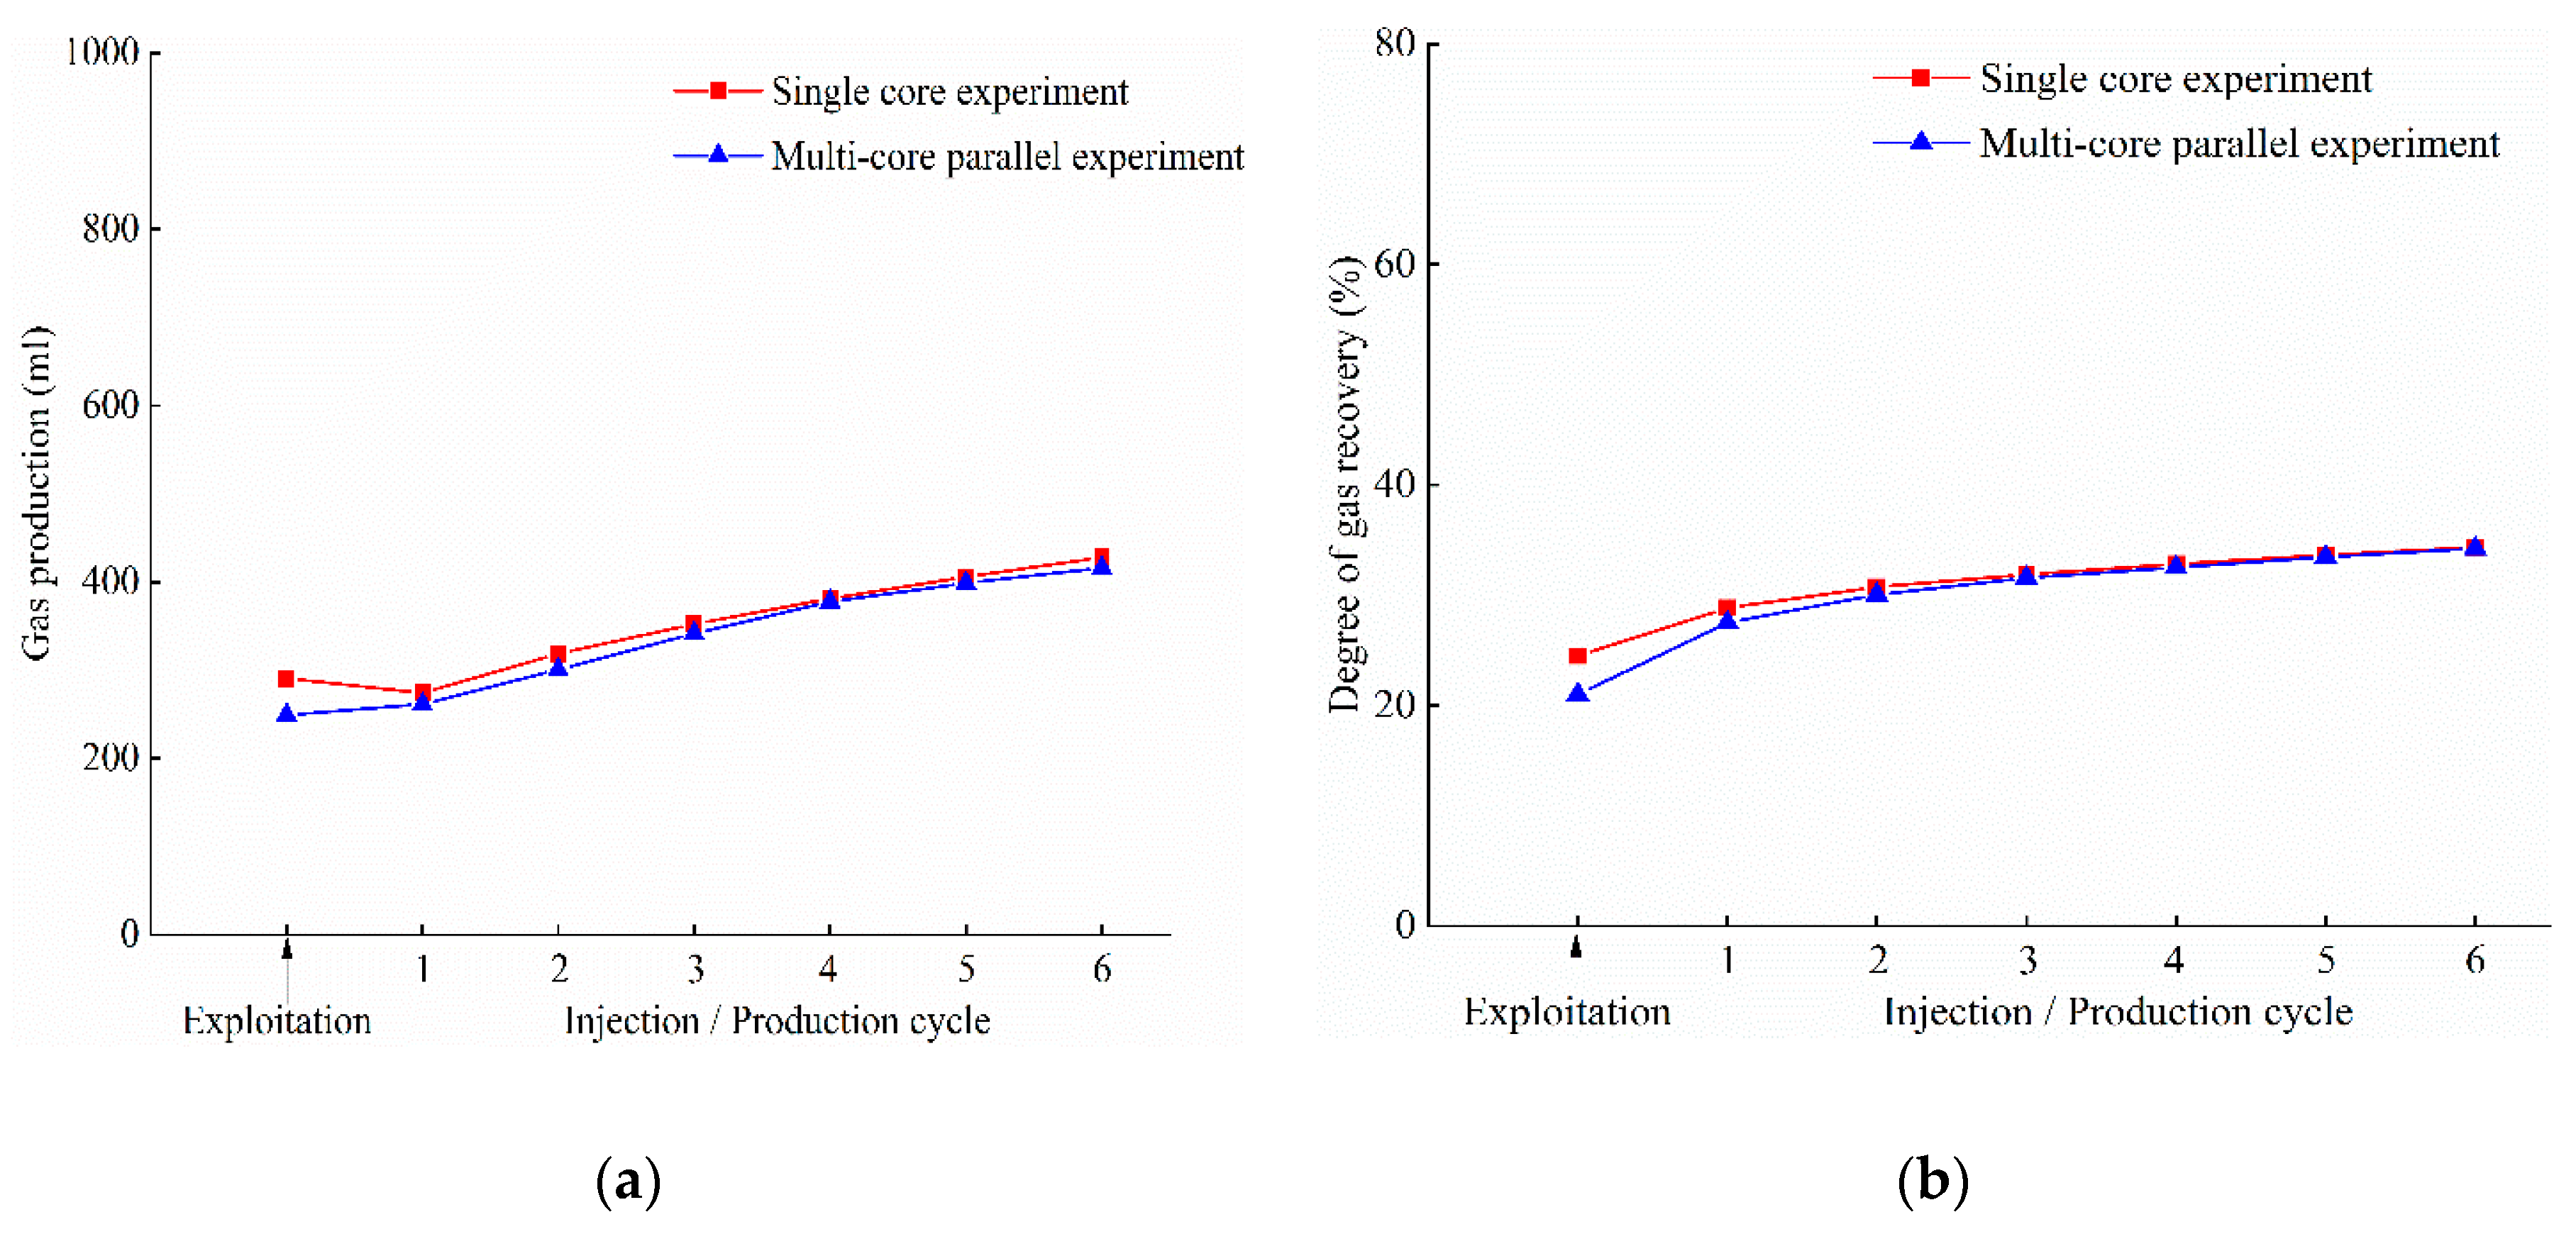
4.3.2. The Rules of Reserve Utilization in the Gas-Drive-Water Gas Zone

Figure 10 presents the gas production and degree of gas recovery in the gas-drive-water gas zone. The average degrees of gas recovery of the three types of reservoirs during gas injection and production were 35.89%, 33.64%, and 26.6%, respectively. Due to water intrusion during the exploitation stage, the gas saturation and gas storage space were reduced, alongside the gas seepage capacity. Further, clay minerals in the reservoir expand when they encounter water, occupying the pore throat space and reducing the gas permeability of the reservoir. Therefore, the gas production and degree of gas recovery were relatively low in the first injection-production cycle. Meanwhile, lower permeability associated with a low level of gas production and degree of gas recovery. The average degrees of gas recovery of the three types of reservoirs in the first injection-production cycle were 31.25%, 31.05%, and 24.25%, respectively. However, in the later injection-production cycle, the gas saturation and gas seepage capacity of the gas storage gradually increased. After six injection and production cycles, the average degrees of gas recovery of the three types of reservoirs were 39.21%, 35.01%, and 28.79%, respectively. Furthermore, the higher the permeability, the greater the increase in gas production and utilization.
The variation curves of gas production and the degree of gas recovery in the gas-drive-water gas zone are shown in Figure 11, which indicates that the trends of average gas production and the degree of gas recovery in the multicore parallel experiment were basically consistent with the trends seen in the single-core experiment. These results suggest that reservoir heterogeneity does not affect gas production or the degree of gas recovery in the gas-drive-water gas zone.
Taken together, these results suggest that multicycle injection and production contribute to the gas-drive-water gas zone transition into the pre-UGS gas zone. Meanwhile, the gas saturation and gas storage space were increased, the reservoir seepage conditions improved, and the gas production and the degree of gas recovery eventually increased as a result.

4.4. Characteristics of Injection-Production Flow in the Gas-Water Transition Zone

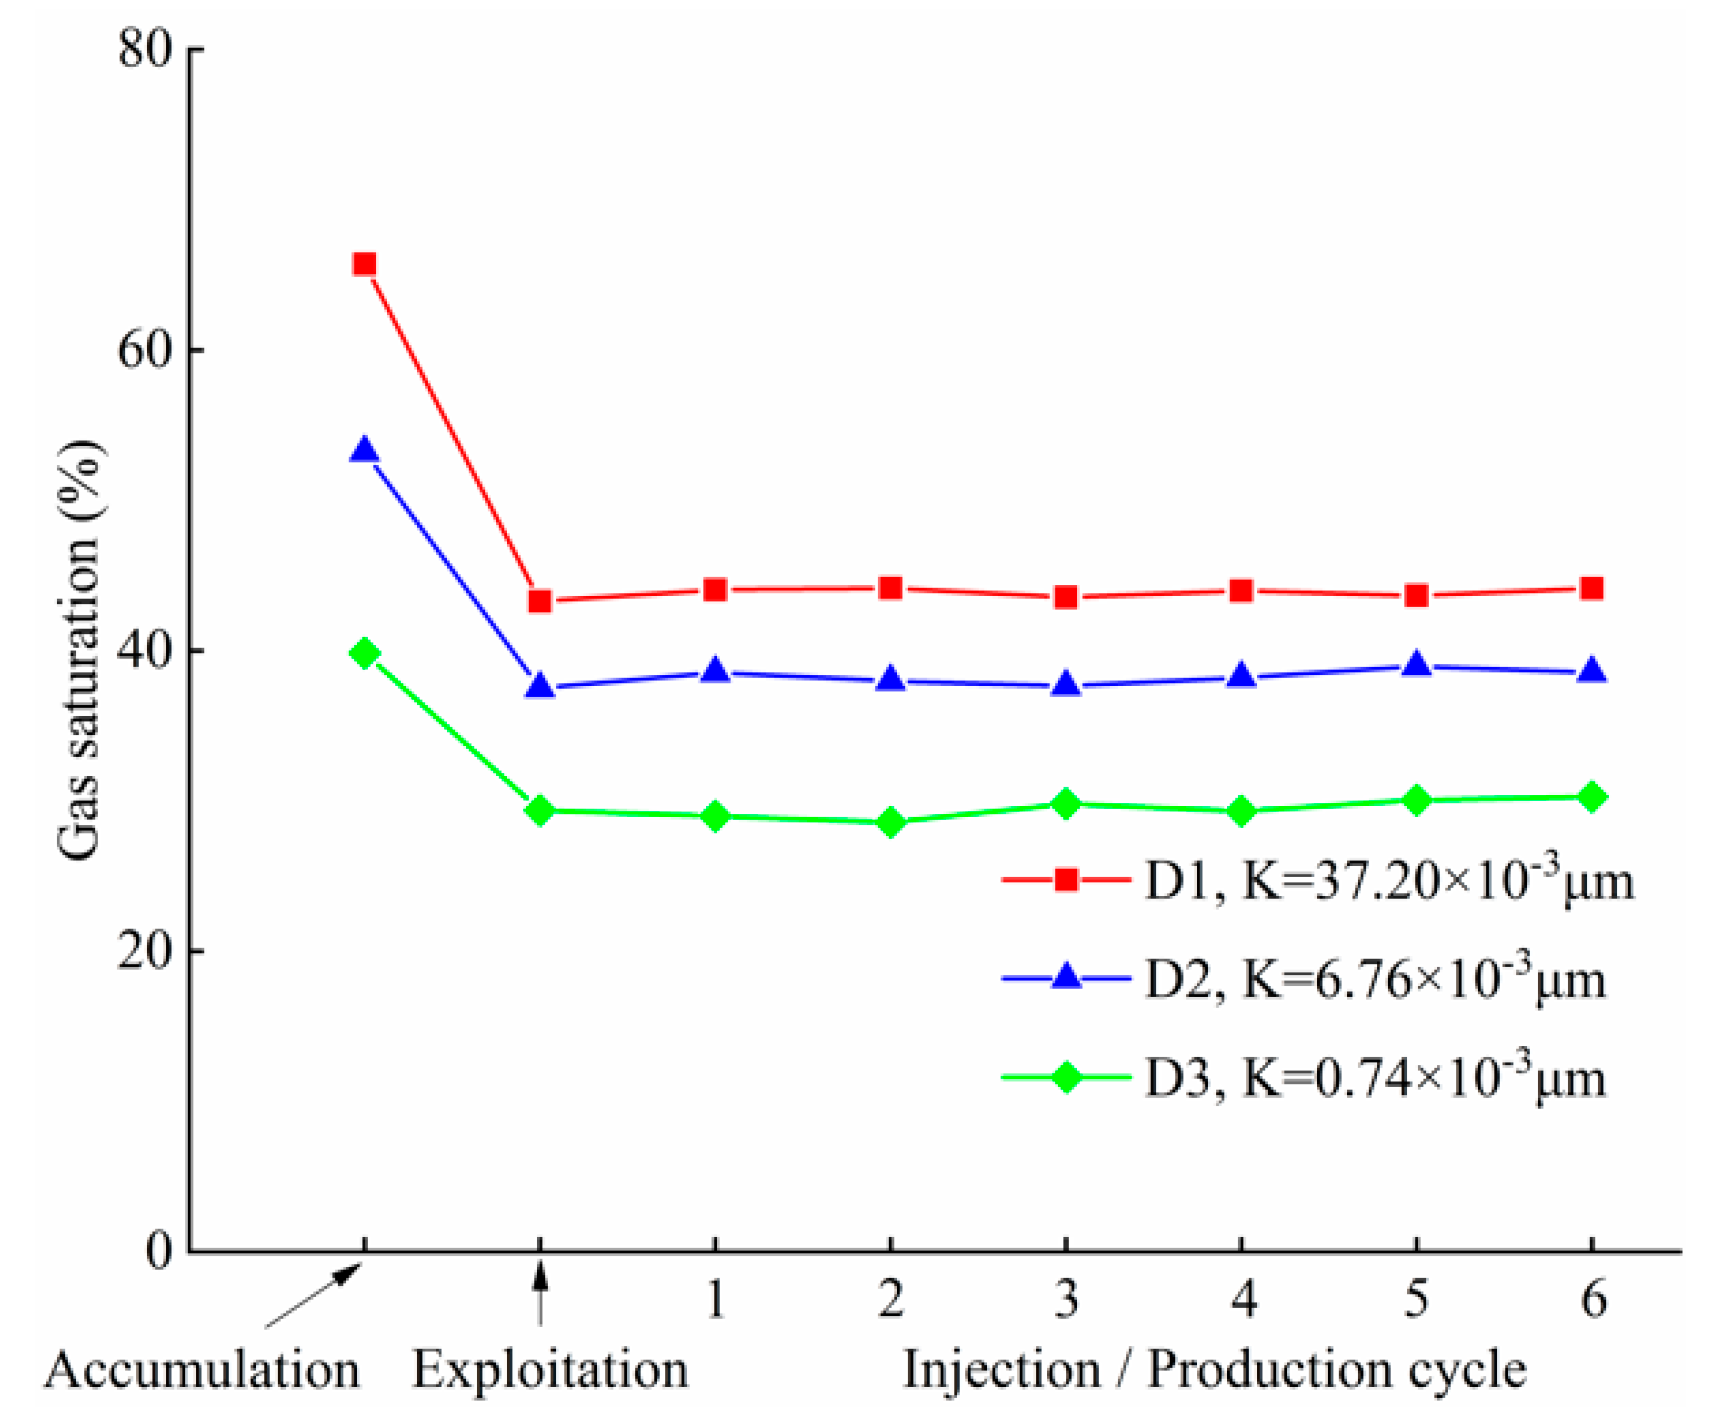
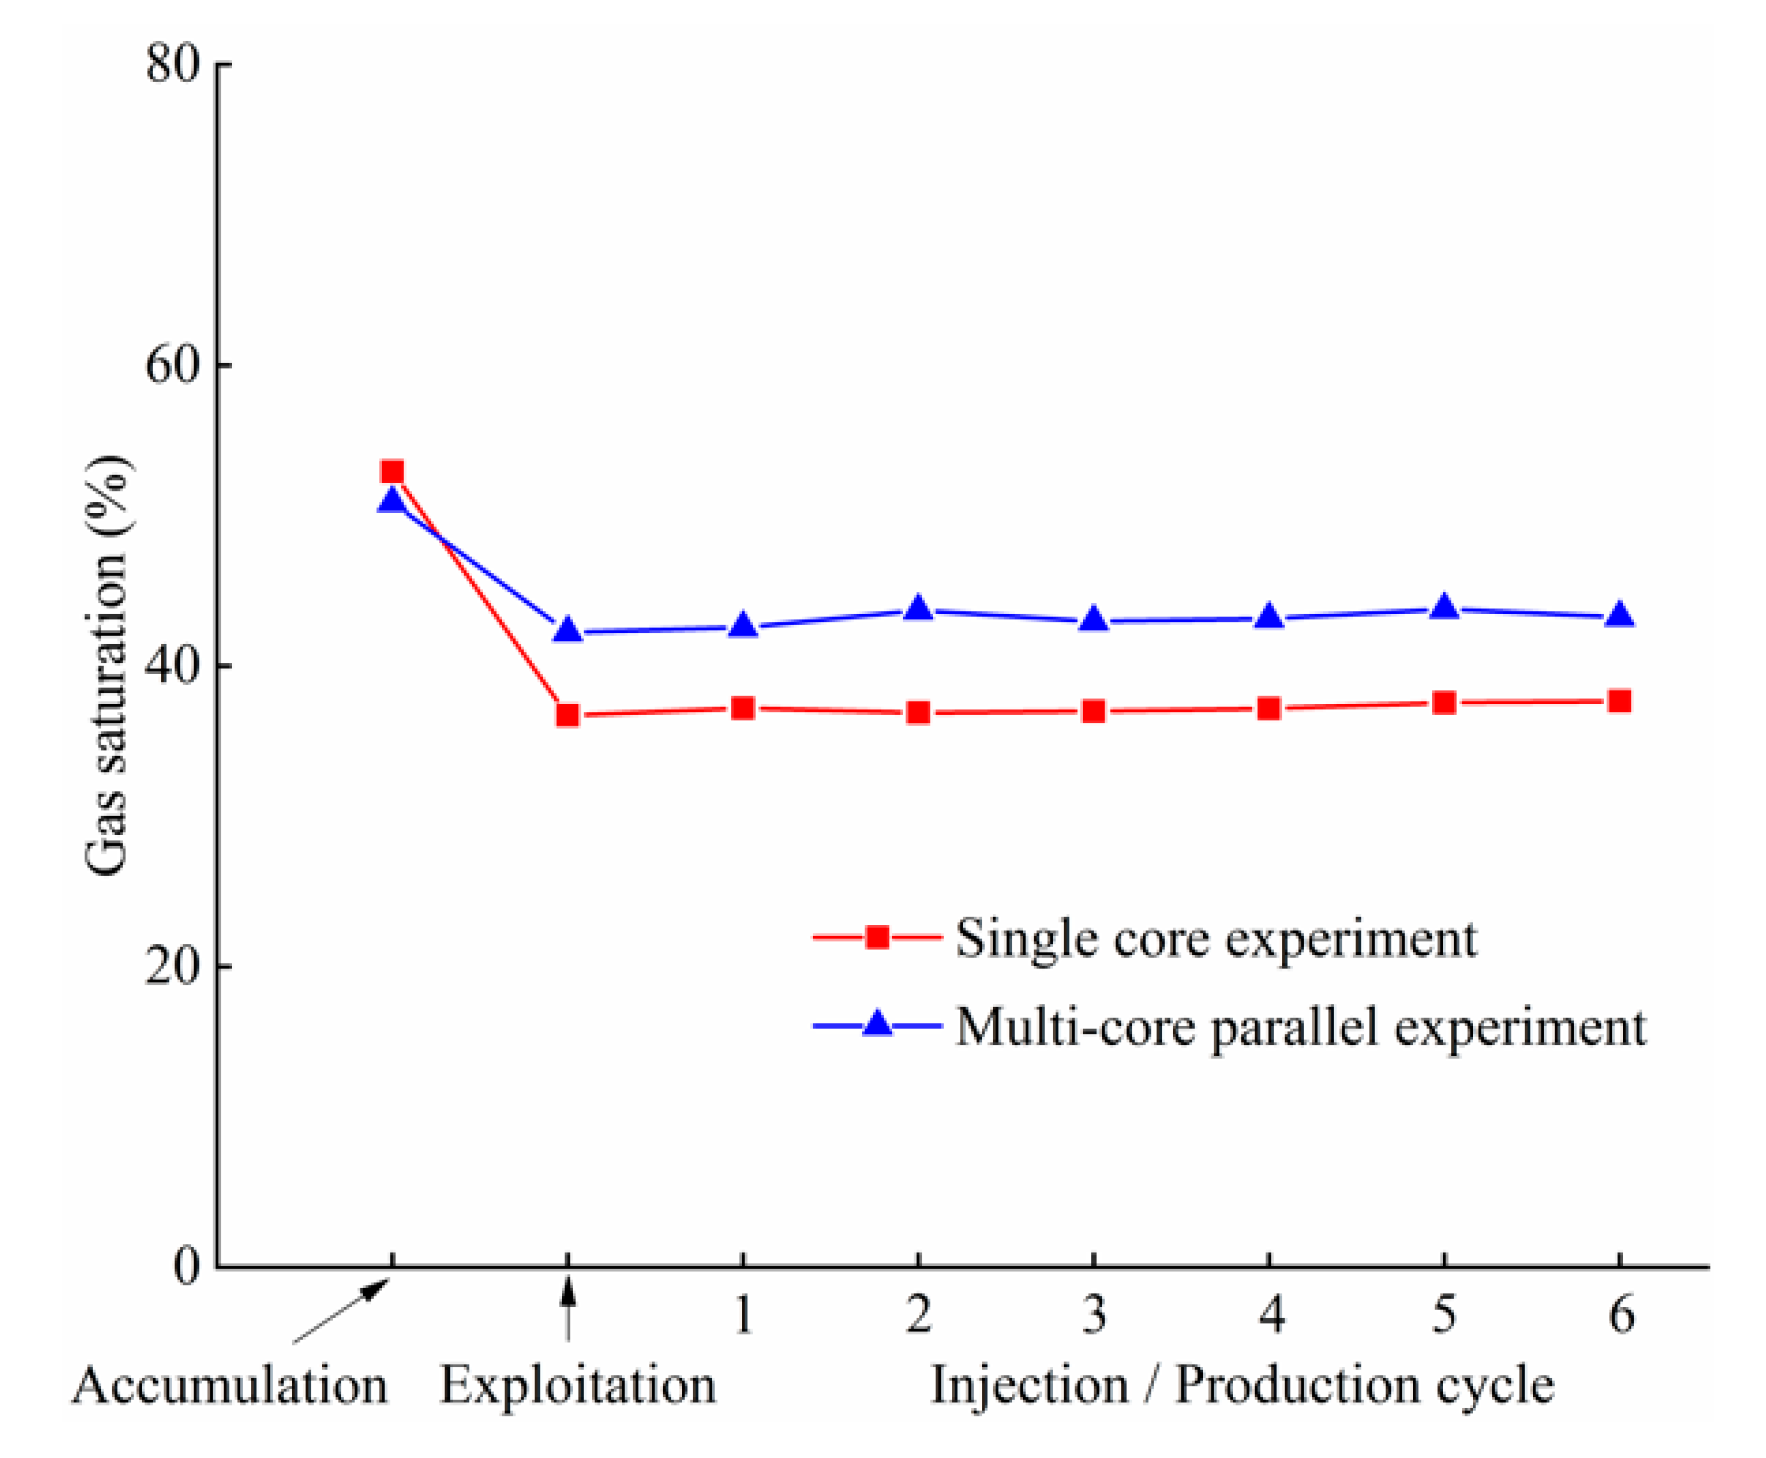
4.4.1. Variation Characteristics of Gas Saturation in the Gas-Water Transition Zone

The mining feature of the gas-water transition zone demonstrated that water intrusion occurred not only during gas field exploitation, but also during the gas storage cycle operation stage. Results regarding the variation of gas saturation with multicycle injection and production in the gas-water zone are shown in Figure 12. Overall, gas saturation declined during the exploitation stage in a similar way to the gas-drive-water gas zone. However, the multicycle injection-production mechanism is complicated due to the effect of the physical properties and heterogeneity, wettability, and capillary pressure of the reservoir. During the operation of multicycle injection-production in the gas-water transition zone, the relationship between gas and water tended to be stable and the gas saturation tended to plateau. On one hand, alternate displacement of gas and water forms residual gas and confined gas, resulting in a reduction in effective gas-containing space, but gas saturation changes little in entire reservoirs. On the other hand, high-speed injection and production continue to carry bound water for production, but the main displacement in the gas storage operation concerns the water in the large pore throat, whereas the water in the micropore throat is difficult to displace. Therefore, the gas saturation in the entire gas-water transition zone tended to plateau. In the later stage of the injection and production operation, due to the reduction of water intrusion energy, the gas saturation slightly increased.
In the case of reservoir heterogeneity, the variation in gas saturation in the gas-water transition zone is shown in Figure 13. Overall, the gas saturation during the exploitation stage was similar to that observed in the gas-drive-water gas zone. The values of average gas saturation in the single-core experiment and multicore parallel experiment were reduced by 30.62% and 16.95%, respectively. However, the average gas saturation observed in the single-core experiments during injection-production was less than that of the multicore experiments. The average gas saturation of single-core experiments and multicore experiments during injection-production were 37.25% and 43.23%, respectively. This is because, for strong heterogeneous reservoirs, although the edge and bottom water are rapidly invaded by the high permeability formation, causing a large amount of gas in the reservoir to be trapped and not produced. However, low permeability formation will be protected from water invasion.

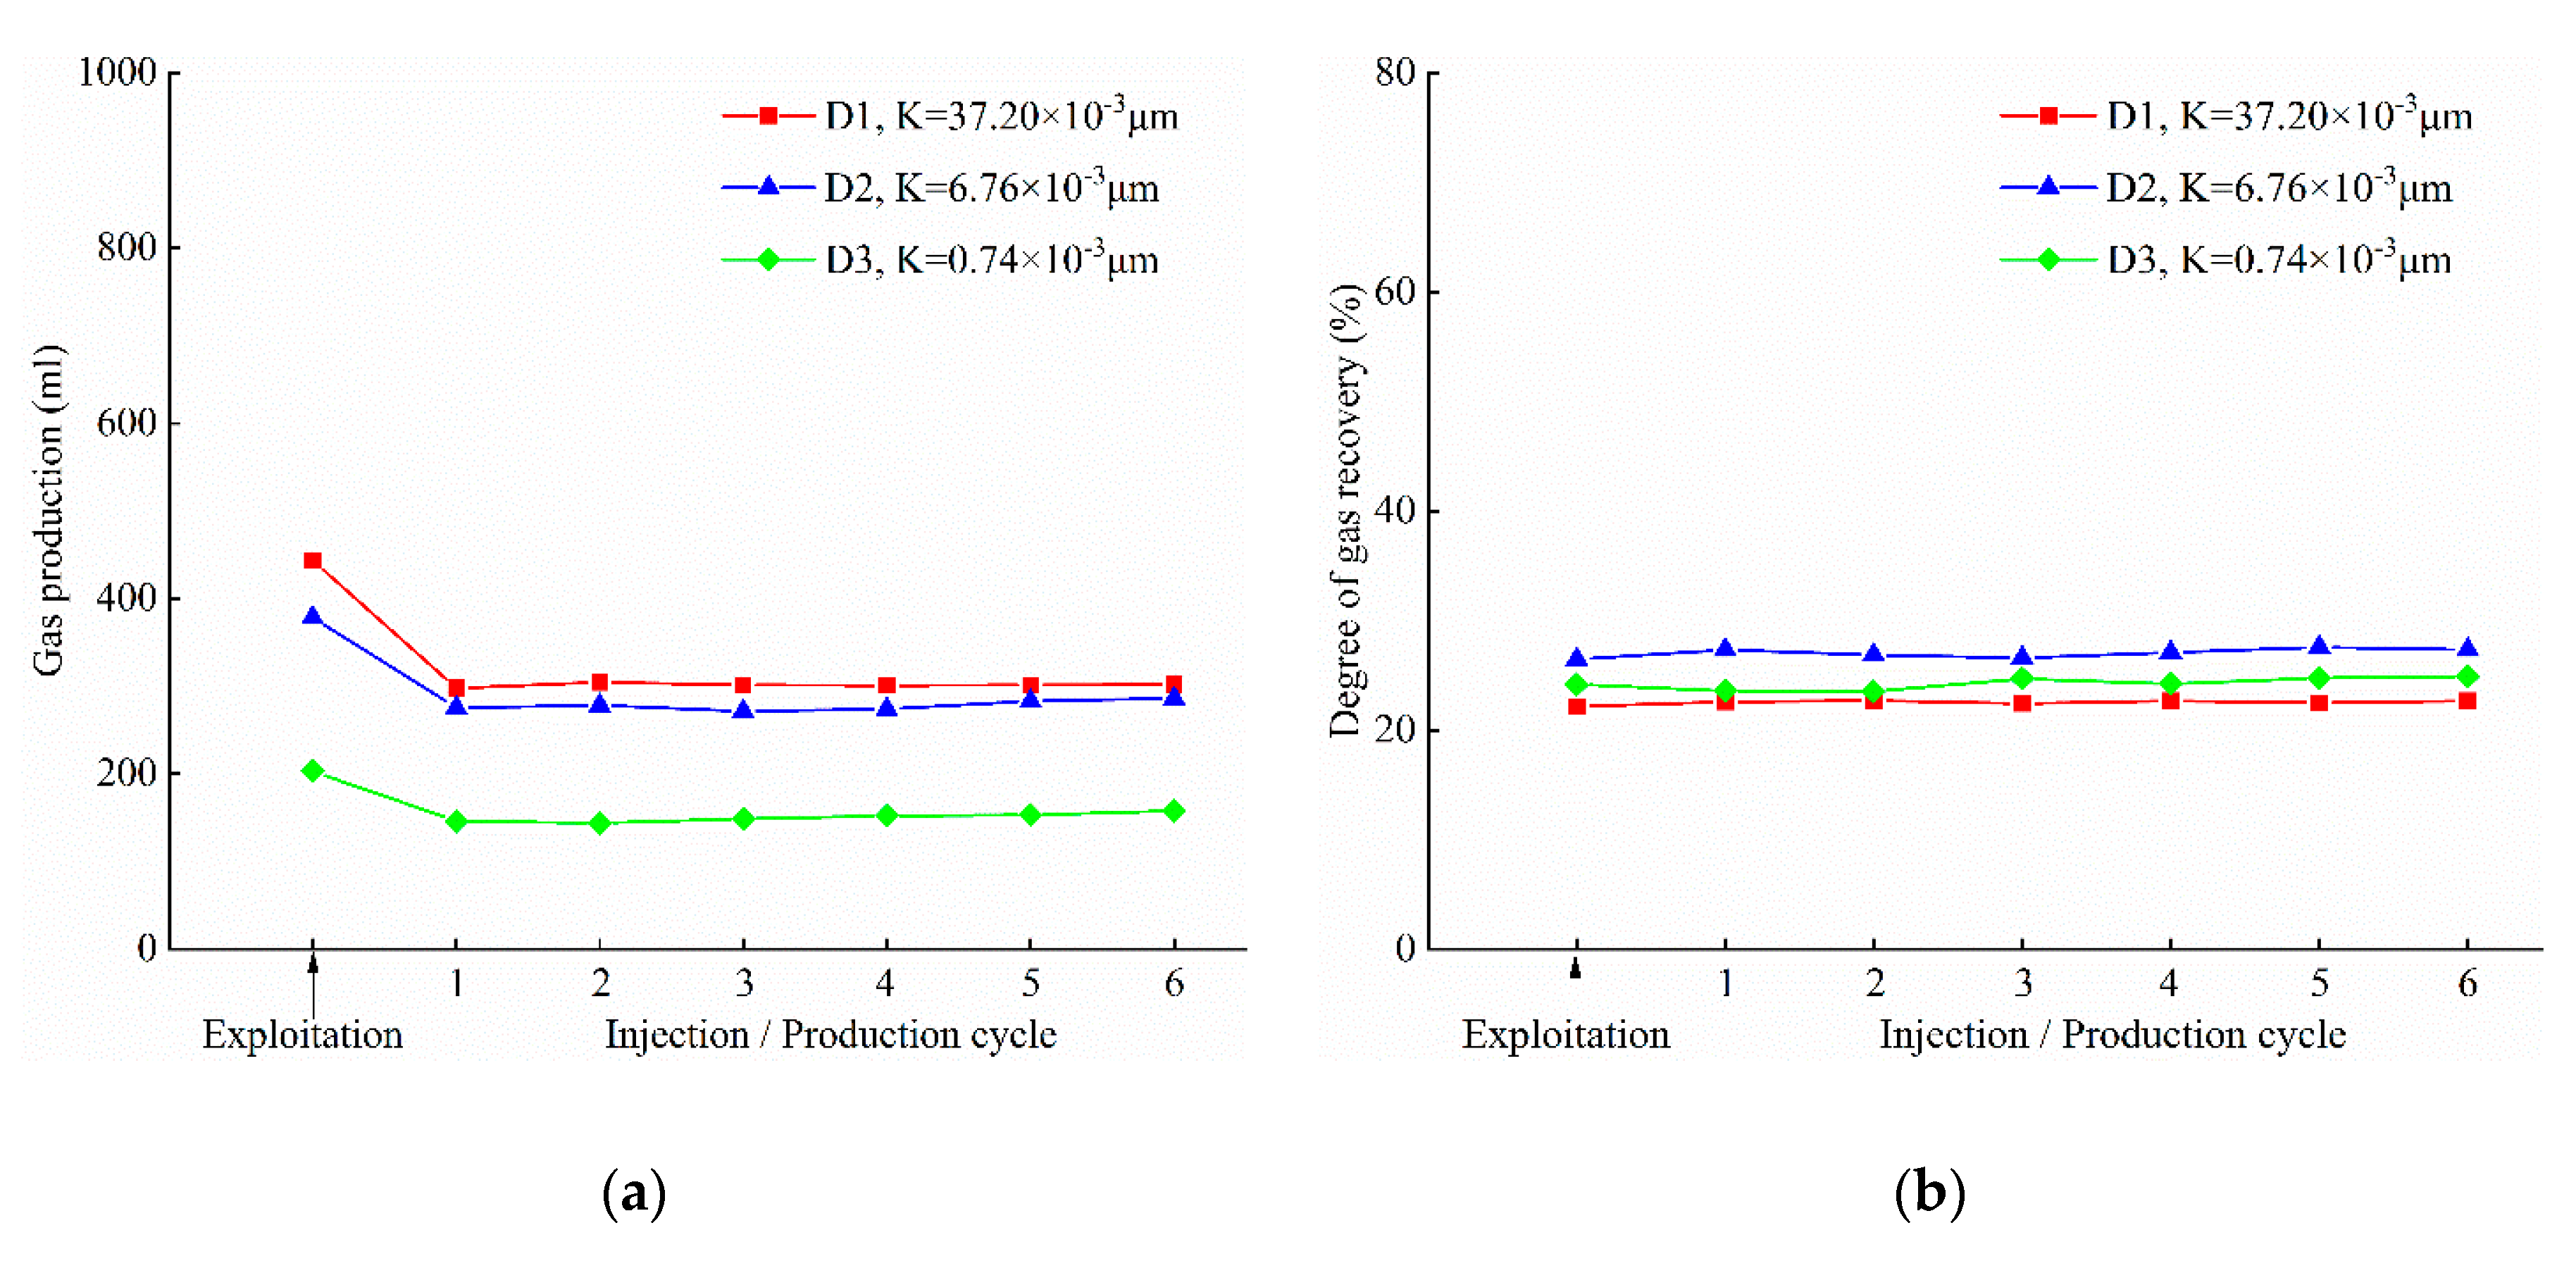
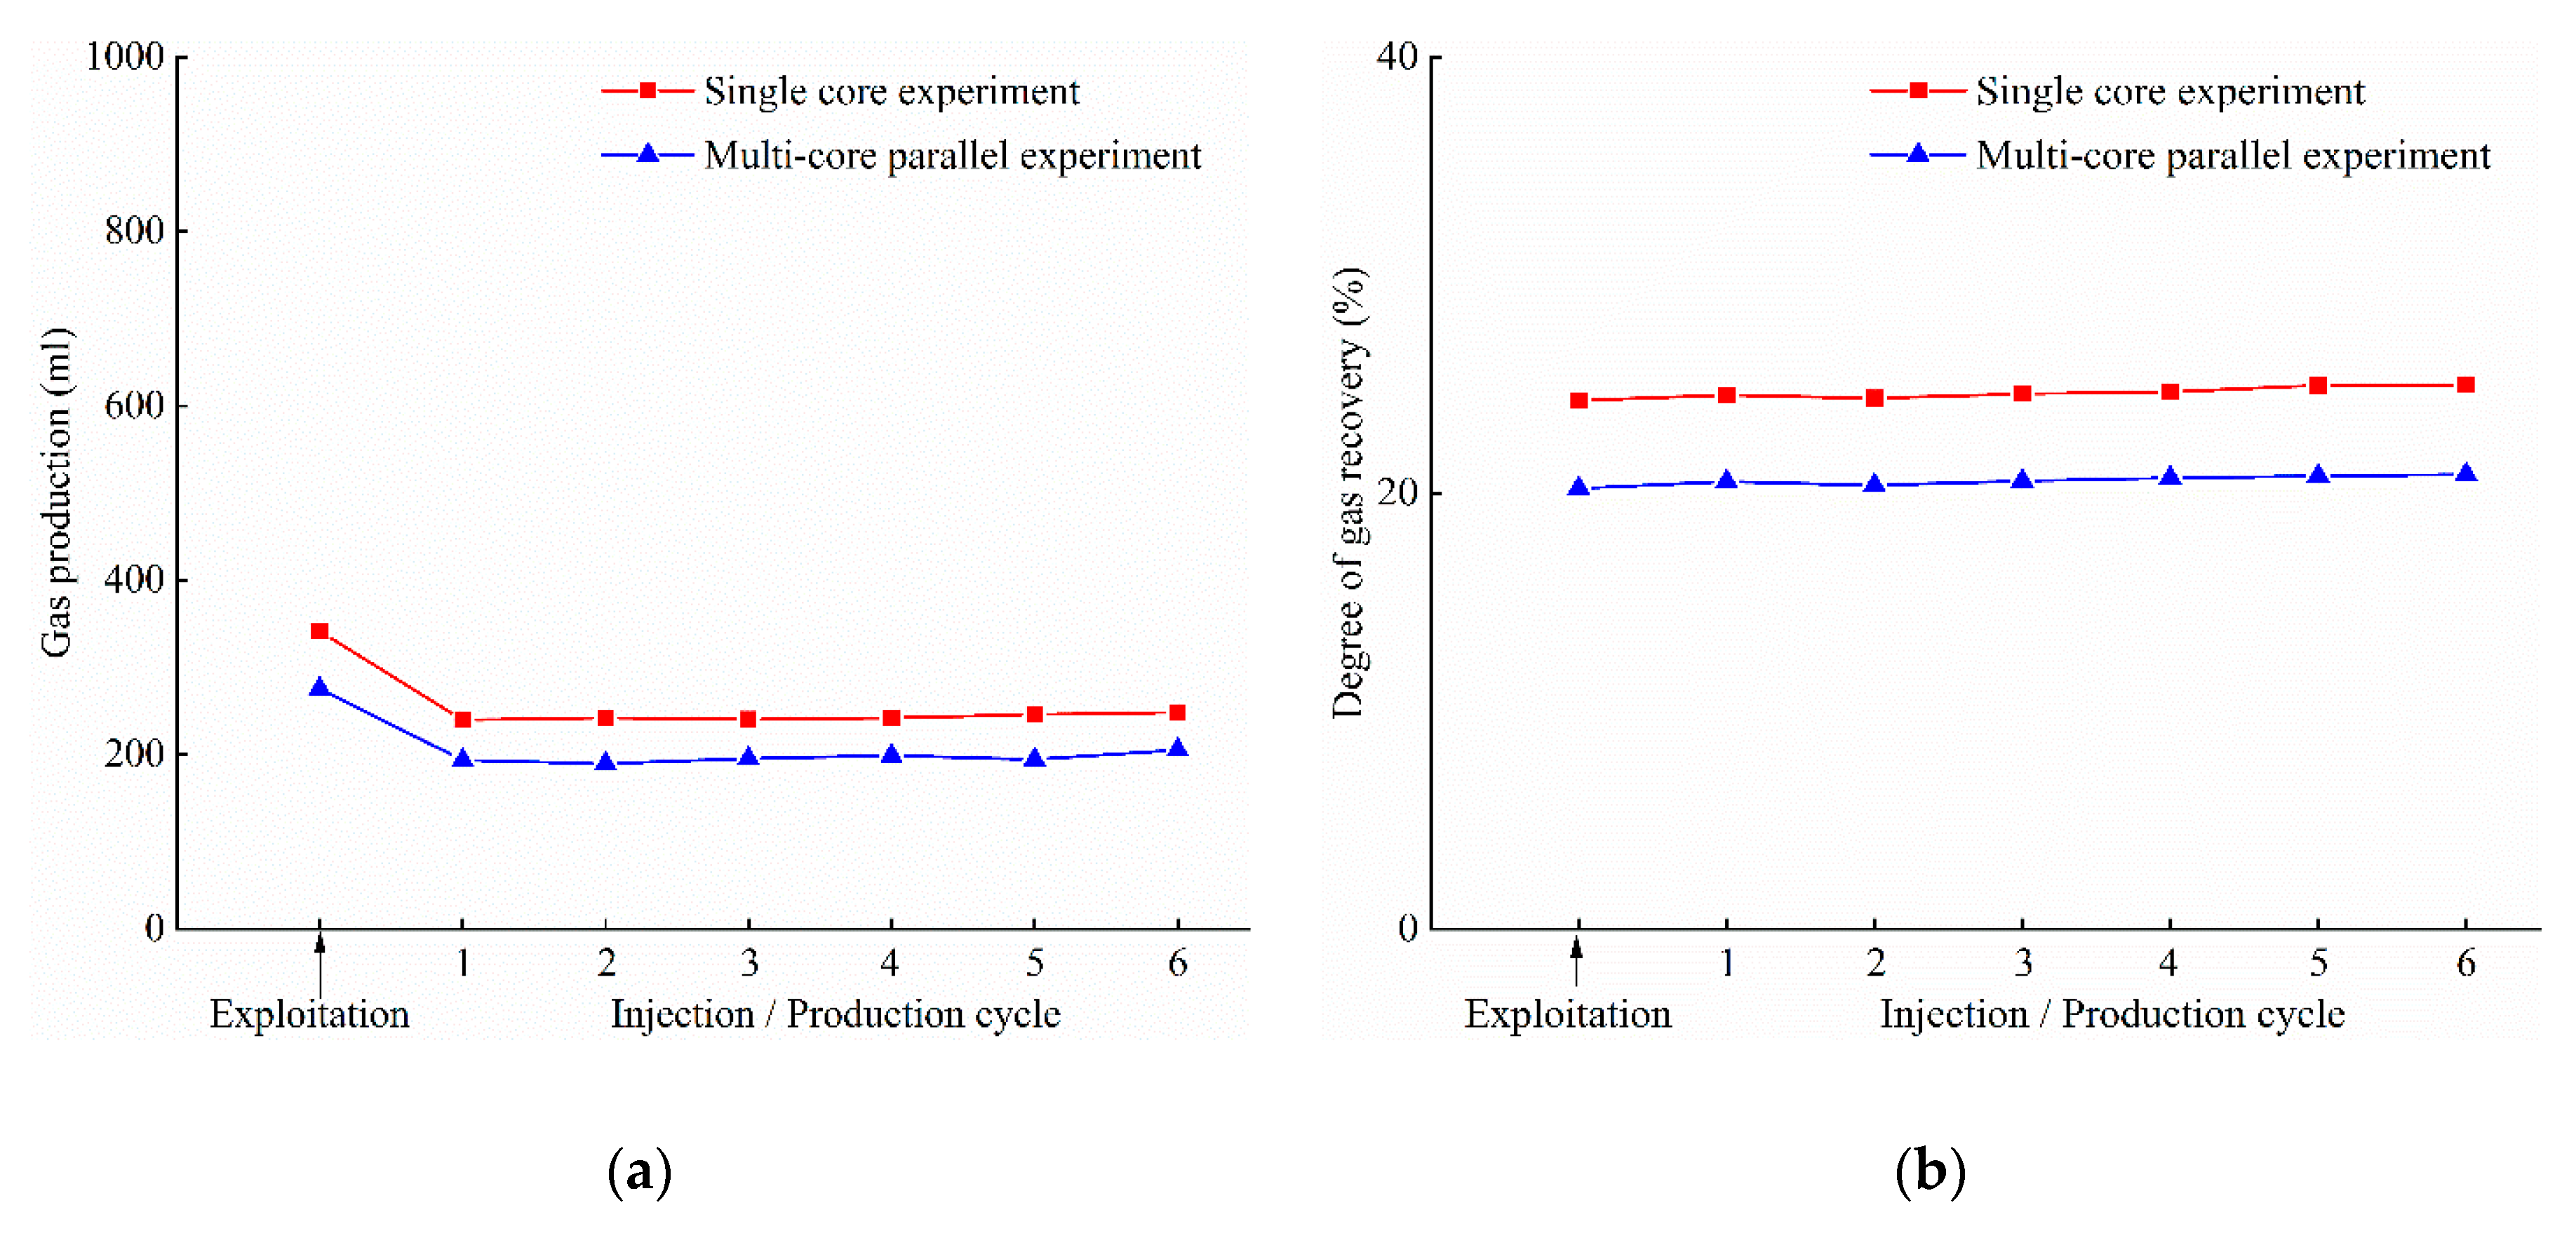
4.4.2. The Rules of Reserve Utilization in the Gas-Water Transition Zone

Figure 14 presents the results regarding gas production and the degree of gas recovery in the gas-water transition zone. It can be seen from Figure 14 that the gas injection-production capacities of the three types of reservoirs in the gas-water transition area were low, because the gas and water were repeatedly displaced during the periodic injection and production process, resulting in reductions in the effective gas storage space and the seepage capacity. Further analysis of the data revealed no significant difference between the degrees of gas recovery of the three types of reservoirs. For low-permeability reservoirs, the seepage capacities of gas and water are poor. Although the impact of water invasion is reduced to some extent, the overall utilization is still low. For high-permeability reservoirs, the seepage capacities of gas and water are strong, but the formation water easily invades the high-permeability channel, resulting in low utilization. This shows that the gas-water transition zone is the main zone that worsens the utilization of UGS.
In the case of reservoir heterogeneity, the variation curve of gas production and the degree of gas recovery in the gas-water transition zone are shown in Figure 15, which demonstrates that the average gas production and the degree of gas recovery in the multicore parallel experiment were lower than the levels observed in the single-core experiment. After six injection and production cycles, the degrees of gas recovery of the multicore parallel experiment and the single-core experiment were 20.85% and 24.95, respectively, showing reservoir heterogeneity harms the recovery of the gas-water transition zone.
These results indicated that the gas-water transition zone of UGS has low gas saturation and poor recovery. Furthermore, reservoir heterogeneity affects the effective utilization of the gas-water transition zone.
Therefore, the effective utilization of gas-containing pore space under the condition of high-speed injection-production of gas storage is obviously different from gas reservoir exploitation. Therefore, the optimum design of UGS capacity and the calculation of gas storage parameter should be based on the effective utilization of the gas-containing pore space and effective pore space of the reservoir construction in different zones.

5. Conclusions

In this study, based on the Wen 23 UGS, the injection-production capability and seepage characteristics in different zones of underground gas storage in gas fields were investigated. The conclusions that were drawn include that the variations in porosity and permeability caused by injection and production pressure changes in Wen 23 gas storage are small and can be neglected. For the pre-UGS gas zone, the pore volume of gas storage and the degree of gas recovery gradually increased with the injection-production process. For the gas-drive-water gas zone, the pore volume of gas storage and the degree of gas recovery were low during the initial injection-production, and then increased due to improvement of the seepage conditions. The gas-drive-water zone was shown to be the main dilatant zone of UGS. For the gas-water transition zone, the gas and water were reciprocated and displaced due to the multicycle injection-production process of UGS, resulting in the gradual deterioration of pore volume and gas recovery and maintenance of a stable low value. The gas-water transition zone was shown to be the main zone that worsened the utilization of UGS. These findings may contribute to a better understanding of the rules regarding multicycle injection and production flow and UGS utilization to optimize the injection-production efficiency of Wen 23 gas storage.

Author Contributions

This paper is a collaborative work of all the authors. J.Z., F.F., and W.L. proposed the idea and wrote the manuscript. J.Z., Y.L., Q.L., and Y.Y. cored the sandstone sample and carried out the experiment. S.G., F.F., and W.L. helped with the analysis of the experimental data. All authors have read and agreed to the published version of the manuscript.

Funding

This study was financially supported by the National Science and Technology Project of China (NO. 2016ZX05017-001-002HZ).

Conflicts of Interest

The authors declare no conflict of interest.

References

  1. De Santis, D.; Mason, J.A.; James, B.D.; Houchins, C.; Long, J.R.; Veenstra, M. Techno-economic analysis of metal-organic frameworks for hydrogen and natural gas storage. Energy Fuels 2017, 31, 2024–2032. [Google Scholar] [CrossRef]
  2. Razmjoo, A.; Shirmohammadi, R.; Davarpanah, A.; Pourfayaz, F.; Aslani, A. Stand-alone hybrid energy systems for remote area power generation. Energy Rep. 2019, 5, 231–241. [Google Scholar] [CrossRef]
  3. Pao, H.T.; Fu, H.C. Renewable energy, non-renewable energy and economic growth in Brazil. Renew. Sustain. Energy Rev. 2013, 25, 381–392. [Google Scholar] [CrossRef]
  4. Wang, X.; Economides, M.J. Purposefully built underground natural gas storage. J. Nat. Gas Sci. Eng. 2012, 9, 130–137. [Google Scholar] [CrossRef]
  5. Mazarei, M.; Davarpanah, A.; Ebadati, A.; Mirshekari, B. The feasibility analysis of underground gas storage during an integration of improved condensate recovery processes. J. Pet. Explor. Prod. Technol. 2019, 9, 397–408. [Google Scholar] [CrossRef] [Green Version]
  6. Zhang, G.; Li, B.; Zheng, D.; Ding, G.; Wei, H.; Qian, P.; Li, C. Challenges to and proposals for underground gas storage (UGS) business in China. Nat. Gas Ind. B 2017, 4, 231–237. [Google Scholar] [CrossRef]
  7. Alim, C.N.; Tohidi, B. A flow assurance evaluation of gas storage in depleted reservoirs. In Proceedings of the Nigeria Annual International Conference and Exhibition, Lagos, Nigeria, 10–12 August 2012; pp. 1–13. [Google Scholar]
  8. Juez-Larre, J.; Remmelts, G.; Breunese, J.; Van Gessel, S.; Leeuwenburgh, O. Using underground gas storage to replace the swing capacity of the giant natural gas field of Groningen in the Netherlands. A reservoir performance feasibility study. J. Pet. Sci. Eng. 2016, 145, 34–53. [Google Scholar] [CrossRef]
  9. Aminian, K.; Brannon, A.; Ameri, S. Gas storage in a depleted gas/condensate reservoir in the appalachian basin. In Proceedings of the SPE Eastern Regional Meeting, Canton, OH, USA, 11–13 October 2006; pp. 126–138. [Google Scholar]
  10. Jodeyri Entezari, A.; Azin, R.; Nasiri, A.; Bahrami, H. Investigation of underground gas storage in a partially depleted naturally fractured gas reservoir. Iran. J. Chem. Chem. Eng. 2010, 29, 103–110. [Google Scholar]
  11. Flanigan, O. Underground Gas Storage Facilities: Design and Implementation; Gulf Professional Publishing: London, UK, 1995; ISBN 978-0884152040. [Google Scholar]
  12. Bai, M.; Shen, A.; Meng, L.; Zhu, J.; Song, K. Well completion issues for underground gas storage in oil and gas reservoirs in China. J. Pet. Sci. Eng. 2018, 171, 584–591. [Google Scholar] [CrossRef]
  13. Malakooti, R.; Azin, R. The Optimization of Underground Gas Storage in a Partially Depleted Gas Reservoir. Pet. Sci. Technol. 2011, 29, 824–836. [Google Scholar] [CrossRef]
  14. Kuncir, M.; Chang, J.; Mansdorfer, J.; Dougherty, E. Analysis and optimal design of gas storage reservoirs. In Proceedings of the SPE Eastern Regional Meeting, Pittsburgh, PA, USA, 6–10 September 2003; pp. 1066–1076. [Google Scholar]
  15. Azin, R.; Nasiri, A.; Entezari, J. Underground gas storage in a partially depleted gas reservoir. Oil Gas Sci. Technol. 2008, 63, 691–703. [Google Scholar] [CrossRef] [Green Version]
  16. Shin, C.; Lee, J. A numerical study on the compositional variation and the validity of conversion of a gas condensate reservoir into underground storage. Energy Sources Part A Recovery Util. Environ. Eff. 2011, 33, 1921–1932. [Google Scholar] [CrossRef]
  17. Eren, T.; Polat, C. Natural gas underground storage and oil recovery with horizontal wells. J. Pet. Sci. Eng. 2020, 187, 106753. [Google Scholar] [CrossRef]
  18. Anyadiegwu, C. Development of depleted oil reservoirs for simultaneous gas injection for underground natural gas storage and enhanced oil recovery in Nigeria. In Proceedings of the SPE Nigeria Annual International Conference and Exhibition, Lagos, Nigeria, 2–4 August 2016; pp. 170–188. [Google Scholar]
  19. Ma, X.; Zheng, D.; Shen, R.; Wang, C.; Luo, J.; Sun, J. Key technologies and practice for gas field storage facility construction of complex geological conditions in China. Pet. Explor. Dev. 2018, 45, 489–499. [Google Scholar] [CrossRef]
  20. Tureyen, O.I.; Karaalioglu, H.; Satman, A. Effect of the wellbore conditions on the performance of underground gas-storage reservoirs. In Proceedings of the SPE/CERI Gas Technology Symposium, Calgary, AB, Canada, 3–5 April 2000; pp. 77–88. [Google Scholar]
  21. Confort, M.J.F.; Mothe, C.G. Estimating the required underground natural gas storage capacity in Brazil from the gas industry characteristics of countries with gas storage facilities. J. Nat. Gas Sci. Eng. 2014, 18, 120–130. [Google Scholar] [CrossRef]
  22. Dharmananda, K.; Kingsbury, N.; Singh, H. Underground gas storage: Issues beneath the surface. In Proceedings of the SPE Asia Pacific Oil and Gas Conference and Exhibition, Perth, Australia, 18–20 October 2004; pp. 10–17. [Google Scholar]
  23. Tang, L.; Wang, J.; Ding, G.; Sun, S.; Zhao, K.; Sun, J.; Bai, F. Downhole inflow-performance forecast for underground gas storage based on gas reservoir development data. Pet. Explor. Dev. 2016, 43, 127–130. [Google Scholar] [CrossRef]
  24. Xu, H.; Wang, J.; Qu, P.; Feng, Y.; Deng, C. A prediction model of storage capacity parameters of a geologically-complicated reservoir-type undergroung gas storage. Nat. Gas Ind. 2015, 35, 103–108. [Google Scholar]
  25. Zheng, D.; Xu, H.; Wang, J.; Sun, J.; Zhao, K.; Li, C.; Shi, L.; Tang, L. Key evaluation techniques in the process of gas reservoir being converted into underground gas storage. Pet. Explor. Dev. 2017, 44, 794–801. [Google Scholar] [CrossRef]
  26. Du, Q. Variation law and microscopic mechanism of permeability in sandstone reservoir during long-term water flooding development. Acta Pet. Sin. 2016, 37, 1159–1164. [Google Scholar]
  27. Costa, A. Permeability-porosity relationship: A reexamination of the Kozeny-Carman equation based on a fractal pore-space geometry assumption. Geophys. Res. Lett. 2006, 33, 106–126. [Google Scholar] [CrossRef]
  28. Grigg, R.B.; Hwang, M.K. High velocity gas flow effects in porous gas-water system. In Proceedings of the SPE Gas Technology Symposium, Calgary, AB, Canada, 15–18 March 1998; pp. 44–66. [Google Scholar]
  29. Bilgesu, H.; Ali, W. Effect of reservoir properties on the performance and design of gas storage wells. In Proceedings of the SPE Eastern Regional Meeting, Charleston, WV, USA, 15–17 September 2004; pp. 169–181. [Google Scholar]
  30. Kurihara, M.; Liang, J.; Fujimoto, F.; Nghiem, L.; Sammon, P. Development and application of underground gas storage simulator. In Proceedings of the SPE Asia Pacific Conference on Integrated Modelling for Asset Management, Yokohama, Japan, 25–26 April 2000; pp. 339–352. [Google Scholar]
  31. Gumrah, F.; Izgec, Ö.; Gokcesu, U.; Bagci, S. Modeling of underground gas storage in a depleted gas field. Energy Sources 2005, 27, 913–920. [Google Scholar] [CrossRef]
  32. Zhao, L.; Chen, Y.; Ning, Z.; Fan, Z.; Wu, X.; Liu, L.; Chen, X. Stress sensitive experiments for abnormal overpressure carbonate reservoirs: A case from the Kenkiyak low-permeability fractured-porous oilfield in the littoral Caspian Basin. Pet. Explor. Dev. 2013, 40, 2–20. [Google Scholar] [CrossRef]
  33. Liu, B.; Yang, Y.; Li, J.; Chi, Y.; Li, J.; Fu, X. Stress sensitivity of tight reservoirs and its effect on oil saturation: A case study of Lower Cretaceous tight clastic reservoirs in the Hailar Basin, Northeast China. J. Pet. Sci. Eng. 2020, 184, 106484. [Google Scholar] [CrossRef]
Figure 1. Distribution diagram of reservoir permeability and porosity in Wen 23 gas field.
Energies 13 03829 g001
Figure 2. The experimental flow chart of the single-core experiment.
Energies 13 03829 g002
Figure 3. The experimental flow chart of the multi-core parallel experiment
Energies 13 03829 g003
Figure 4. The permeability (a) and porosity (b) change curve of A1 core with net overburden pressure.
Energies 13 03829 g004
Figure 5. Variation curve of gas saturation in the pre-UGS gas zone.
Energies 13 03829 g005
Figure 6. The relation curve between gas saturation and permeability
Energies 13 03829 g006
Figure 7. Variation curve of gas production (a) and degree of gas recovery (b) in the pre-UGS gas zone.
Energies 13 03829 g007
Figure 8. Variation curve of gas saturation in the gas-drive-water gas zone.
Energies 13 03829 g008
Figure 9. Variation curve of gas saturation with reservoir heterogeneous in the gas-drive-water gas zone.
Energies 13 03829 g009
Figure 10. Variation curve of gas production (a) and degree of gas recovery (b) in the gas-drive-water gas zone.
Energies 13 03829 g010
Figure 11. Variation curve of gas production (a) and degree of gas recovery (b) with reservoir heterogeneous in the gas-drive-water gas zone.
Energies 13 03829 g011
Figure 12. Variation curve of gas saturation in the gas-water transition zone
Energies 13 03829 g012
Figure 13. Variation curve of gas saturation with heterogeneous reservoir in the gas-water transition zone.
Energies 13 03829 g013
Figure 14. Variation curve of gas production (a) and degree of gas recovery (b) in the gas-water transition zone.
Energies 13 03829 g014
Figure 15. Variation curve of gas production (a) and degree of gas recovery (b) with reservoir heterogeneous in the gas-water transition zone.
Energies 13 03829 g015
Table 1. Basic properties of sandstone core samples used in this experiment.
Core NoCore ClassificationsPermeability (×10−3 μm)Porosity (%)
A1Class I12.1616.56
A2Class II3.2413.42
A3Class III0.329.67
Table 2. The basic properties of core samples and experimental scheme.
Simulation ZoneCore NoCore ClassificationsPermeability (×10−3 μm)Porosity (%)Experiment Types
Pre-UGS gas zoneB1Class I14.9214.74Single-core experiment
B2Class II2.2412.24
B3Class III0.2811.48
Gas-drive-water gas zoneC1Class I22.0416.38Single-core experiment
C2Class II4.8414.68
C3Class III0.1814.08
C4Class I21.0516.78Multi-core parallel experiment
C5Class II9.0315.86
C6Class III0.2712.27
Gas-water transition zoneD1Class I37.2020.11Single-core experiment
D2Class II6.7617.74
D3Class III0.7413.50
D4Class I25.7417.68Multi-core parallel experiment
D5Class II3.8914.23
D6Class III0.5712.9
Table 3. The rate of core permeability and porosity under the operating pressure of underground gas storage (UGS).
Core No1st Pressure-Boost1st Pressure-Relief2nd Pressure-Boost2nd Pressure-Relief3rd Pressure-Boost3rd Pressure-Relief
A1 Δ K 3.5%1.7%2.68%0.92%0.76%0.34%
Δ ϕ 2.67%-2.21%-1.9%-
A2 Δ K 2.34%1.25%2.12%1.03%0.72%0.30%
Δ ϕ 1.35%-0.78%-0.32%-
A3 Δ K 1.88%1.23%1.42%0.82%0.67%0.42%
Δ ϕ 1.32%-0.9%-0.35%-

