Article

A Fuzzy Energy Management Strategy for the Coordination of Electric Vehicle Charging in Low Voltage Distribution Grids

by
Vasileios Boglou
1,
Christos-Spyridon Karavas
2,3,
Konstantinos Arvanitis
2,* and
Athanasios Karlis
1
1
Department of Electrical and Computer Engineering, School of Engineering, Democritus University of Thrace, 671 00 Xanthi, Greece
2
Department of Natural Resources Development and Agricultural Engineering, School of Environment and Agricultural Engineering, Agricultural University of Athens, 118 55 Athens, Greece
3
Research, Technology & Development Department, Independent Power Transmission Operator (IPTO) S.A., 104 43 Athens, Greece
*
Author to whom correspondence should be addressed.
Energies 2020, 13(14), 3709; https://doi.org/10.3390/en13143709
Submission received: 7 June 2020 / Revised: 10 July 2020 / Accepted: 16 July 2020 / Published: 18 July 2020
(This article belongs to the Section E: Electric Vehicles)

Abstract

:
Electric vehicles (EVs) have become widespread during the last decade because of the distinct advantages they offer compared to the conventional ones. However, the increased penetration of EVs in the global transportation market has led increased electricity demands, which is expected to affect the operation of energy distribution systems. In the present paper, a demonstration about the effects of uncontrolled EVs charging in a case study low voltage (LV) network is demonstrated and a fuzzy energy management strategy for the coordination of EV charging in LV networks is presented, by including the distance of the EVs from the transformers in the fuzzy management systems for the first time. The Institute of Electrical and Electronics Engineers (IEEE) European Test Feeder is used as a case study low voltage distribution grid. In particular, the developed system configuration takes into consideration the architecture of the grid, the ampacities of the lines and the voltages at the system’s buses. Moreover, electric vehicles are considered as agent-based models, which are characterized by the model of each EV, the state-of-charge of their batteries and the charging power. In particular, an investigation into the effects of uncontrolled charging is performed, in which two approaches are examined. The first approach investigates the maximum number of chargeable EVs in the case study network and how it is influenced by the grid’s household loads. The second approach examines the number of network undervoltages and lines ampacity violations in a set of simulation scenarios. The results of the first approach show that the distance of the EVs from the networks substation affects the maximum number of chargeable EVs in a significant manner. Based on the observed results of the two approaches, a fuzzy management system is designed for the coordination of EV changing, which takes into account the distance from the EV charging points to the feeder substation, the state-of-charge of the EVs’ batteries and the EVs’ charging delay time.

1. Introduction

The world’s transportation and electric power generation sectors are the major consumers of fossil fuels, resulting in high carbon dioxide emissions and an energy supply crisis [1]. The wide use of electric vehicles (EVs), as an alternative transportation technology, is expected to mitigate undesirable environmental air pollution and reduce the strong dependence of the transportation sector on oil as well as the costs of fossil fuels [2]. EVs seem to be the future of transportation since they present various advantages compared to conventional internal combustion engine vehicles, e.g. lower operating and maintenance costs and less emissions [3]. It is well known that the electric motors in EVs can operate with efficiency levels above 90% [4]. According to [5], the projected increase in the number of EVs in circulation will reduce the oil demand and CO2 emissions by 1–5 Mb/d and up to 75 million tons per year by 2035, respectively. In addition, the total penetration of EVs in global mobility market is expected to increase by 30% and EV-driven electricity demand is projected to reach 640 TWh in 2030 [6]. Moreover, the European Environment Agency expects that EVs’ energy demand will be about 9.5% of the total electricity consumption in Europe by 2050 [7].
This increased number of EVs is expected to have negative impacts on the operation, stability, feasibility and power quality of energy distribution systems. According to the literature, EV integration will increase the peak loads of the grids in a significant manner [8]. The existing distribution systems have been built based on past load requirements, without taking into consideration the existence of future new dynamic loads with high-energy consumption, such as EVs [9]. The most important effects of the uncontrolled EV charging process in low voltage (LV) networks are: (i) drop voltages below the specific lower voltage limits in the buses of the network, (ii) line ampacity violations, (iii) phase asymmetries in the grid due to the connection of EVs in a single phase, (iv) transformer overloading and aging, (v) increased grid peak demand and (vi) losses in power lines [10,11,12,13,14].
Several studies have been conducted to investigate the aforementioned restrictions related with the integration of EVs in distribution grids. The effects of EV penetration in different modelled low voltage (LV) networks have been investigated displaying that voltage stability is the main critical factor, which restricts the uncontrolled integration of EVs in such networks. Also, the thermal limits of the lines influence EVs integration. This factor is rather connected with the individual characteristics of each grid [15].
Furthermore, researches have been conducted for the evaluation of EVs uncontrolled charge effects in different case study distribution grids. The results show that the suburban grids suffer from a significant reduction in power quality, compared to the urban networks, due to the unequal load distribution across the three phases [16]. Moreover, it is shown that the parameters, which are related with the EVs penetration in distribution grids and influence the operation of the networks, are the charging rates of the EVs’ batteries, the location of EVs connections to the grid, the expected EV penetration concurrency and the charger harmonic emissions. Furthermore, investigations about the influence of EVs uncontrolled charging in energy distribution networks show that the transformers of the grids are also affected [17]. It is indicated that the uncontrolled adoption of EVs by distribution grids may cause serious damage to the transformer, by contributing to the aging process [18].
On the other hand, it is essential for distribution system operators (DSOs) to maintain distribution system power quality by upgrading the grid infrastructure, which can be achieved by installing battery storage systems [19] or/and by implementing smart charging control algorithms [20]. To this end, several charging management algorithms have been implemented based on different aspects and perspectives. The aim of the charging algorithms in distribution networks is to determine which EVs are to be charged, the charging time space and the charging power of each EV [21]. The adoption of controlled charging algorithms compared to uncontrolled charging processes, results to the significantly increase of distribution networks’ capacity for additional loads [22].
EV charging management strategies are divided into two main categories: centralized energy management systems (CEMS) and decentralized energy management systems (DEMS). In CEMS, there is a centralized controller which tracks the EVs’ key information, such as the charging current and voltage, state-of-charge (SoC) of EVs’, arrival and departure times on the charging station, and the state of the grid at each time step in order to control the charging process for each EV, with respect to a grid’s stable operation [23]. The advantages of CEMS rely on the well-known architecture on which are based, the better use of grid capacity, the better provision of ancillary services and the possibility of business model implementation. Despite the many advantages of CEMS, they need a complex communication layer, since the controller acts on a limited number of EVs and it requires high processing capacity. In addition, the data privacy and information security issues must be considered [24]. In DEMS, the EV charging process is controlled individually, and it is usually based on the battery SoC and the local grid’s state. The aim of DEMS is to maximize EV charging rates or/and minimize total charging time, by maintaining the grid’s voltage and service cable loading within acceptable limits. DEMS are sufficient for lower EV penetration levels and the necessity for the required communications infrastructure is limited [25]. However, in DEMS, there are no communication links to the overall network and the safety-required margins to maintain operating limits are restricted [26].
Different optimization techniques have been proposed to address the charging scheduling problem of EVs. Two key conventional techniques to address the problem are: (i) linear programming (LP) and (ii) quadratic programming (QP) [27]. LP has been used for the control of EV charging in low voltage grids. The formulation of the optimization problem takes into consideration the behavior of the network and decides the charging power of each charging EV, by minimizing the EVs’ charging costs [27]. Another approach, based on LP, introduces a real time energy management system for EV charging, which defines the charging priority of EVs and the dynamic regulation of the grid’s voltage [28]. The QP technique has been used to solve different nonlinear objective functions, related to the coordination of EV charging, such as the maximization of DSOs’ profits [29] and the minimization of power losses and the voltage deviations of EVs in residential distribution grids [30].
Energy management systems based on artificial intelligence techniques, such as dynamic programming [31], neural networks [32], multi-agent systems [33], and game theory approaches [34] have been successfully applied in distributed energy systems. In addition, other researchers have proposed fuzzy logic energy management systems for EV charging scheduling. A Mamdani-type fuzzy interface system (FIS) has been developed for the EV scheduling problem by determining the charging/discharging priority values of all connected EVs. The input values of the FIS were the SoC of EVs’ batteries, the remaining charging time and the electricity price. Thus, the optimization of the problem lies on the maximization of the charging/discharging rates and the minimization of the charging costs [35]. Moreover, a logical power flow controller has been presented to control the power rates at different priority levels, in which EVs will charge or discharge in a car park infrastructure. The inputs of the real time controller were the energy price and the forecasted power flow of the grid [36]. Furthermore, two fuzzy logic charging controllers have been proposed to verify fairness between the charging EVs. The first controller considers the value of the electricity price and the SoC of each EV’s battery in order to determine the charging power levels for each connected EV. In the second controller, the output is replaced by a charging/discharging membership function [37]. A fuzzy logic optimization principle has been applied to determine the charging rates of charging EVs, by considering the time of charging, which includes off peak and peak hours and the charging duration of each EV [38]. Another approach introduces a fuzzy logic control strategy based on the bus voltage limits. A central controller performs power flow analysis to the grid in order to calculate the minimum system voltage and then a fuzzy logic controller determines the charging level of each EV, taking also into account the SoC of each EV [39].
The present paper demonstrates the effects of uncontrolled charging of EVs in low voltage distribution grids, in order to solve them by presenting a fuzzy-based centralized energy management system, which has been developed and investigated for the coordination of EV charging in such networks. The fuzzy logic approach was chosen since linguistic rules can simplify the management and control of the charging scheduling problem of EVs in low voltage distribution grids, given its complexity. The IEEE European Low Voltage Test Feeder has been used. The specific feeder is used, because it represents a typical European LV network and thus, the data of the network and the residential power curves of the specific network, are widely available. The examined effects are the drop voltages in the buses of the studied network and the overloaded lines. The study about the effects of uncontrolled charge included two approaches. The first approach examines how the distance of the charging EVs from the main grid’s substation influence the number of chargeable EVs, while the second approach focuses on the number of buses drop voltages and lines overloads in a set of typical EV penetration scenarios. Based on the results of the study, a fuzzy-based energy management system was developed for the coordination of EV charging, with respect to the grid’s constraints. The proposed fuzzy-based controller considers the SoC of each EV, the distance of each EV from the substation and the charging delay time, in order to determine the priority of each EV in the charging process. To the best of the authors’ knowledge, this is the first time that the distance of the EVs from the network’s substation is used as a variable in a fuzzy controller for the coordination of the charging process in LV networks. The results of the examined simulation scenarios showed that the consideration of the distance may decreases the mean EV charging time. Moreover, an integrated framework for the modelling and simulation of EVs and distribution grids in a common environment is presented, by using the MATLAB® Environment, (MathWorks, Natick, MA, USA) and the OpenDSS (EPRI, Palo Alto, CA, USA).
The rest of the paper is organized as follows: in Section 2, the case study distribution grid, the modelling of the EVs and the overall simulations framework is presented, along with a short introduction to fuzzy systems. In Section 3, the investigation on the effects of uncontrolled charging process in the case study LV system is presented. Section 4 describes the design and simulations study of the fuzzy energy management system for the coordination of EV charging in energy distribution networks. The paper concludes with Section 5, wherein the key points of the investigation are summarized and the basic structure of the proposed charging strategy is referred and discussed, along with some directions of future research work.

2. Grid Distribution System

2.1. System Topology

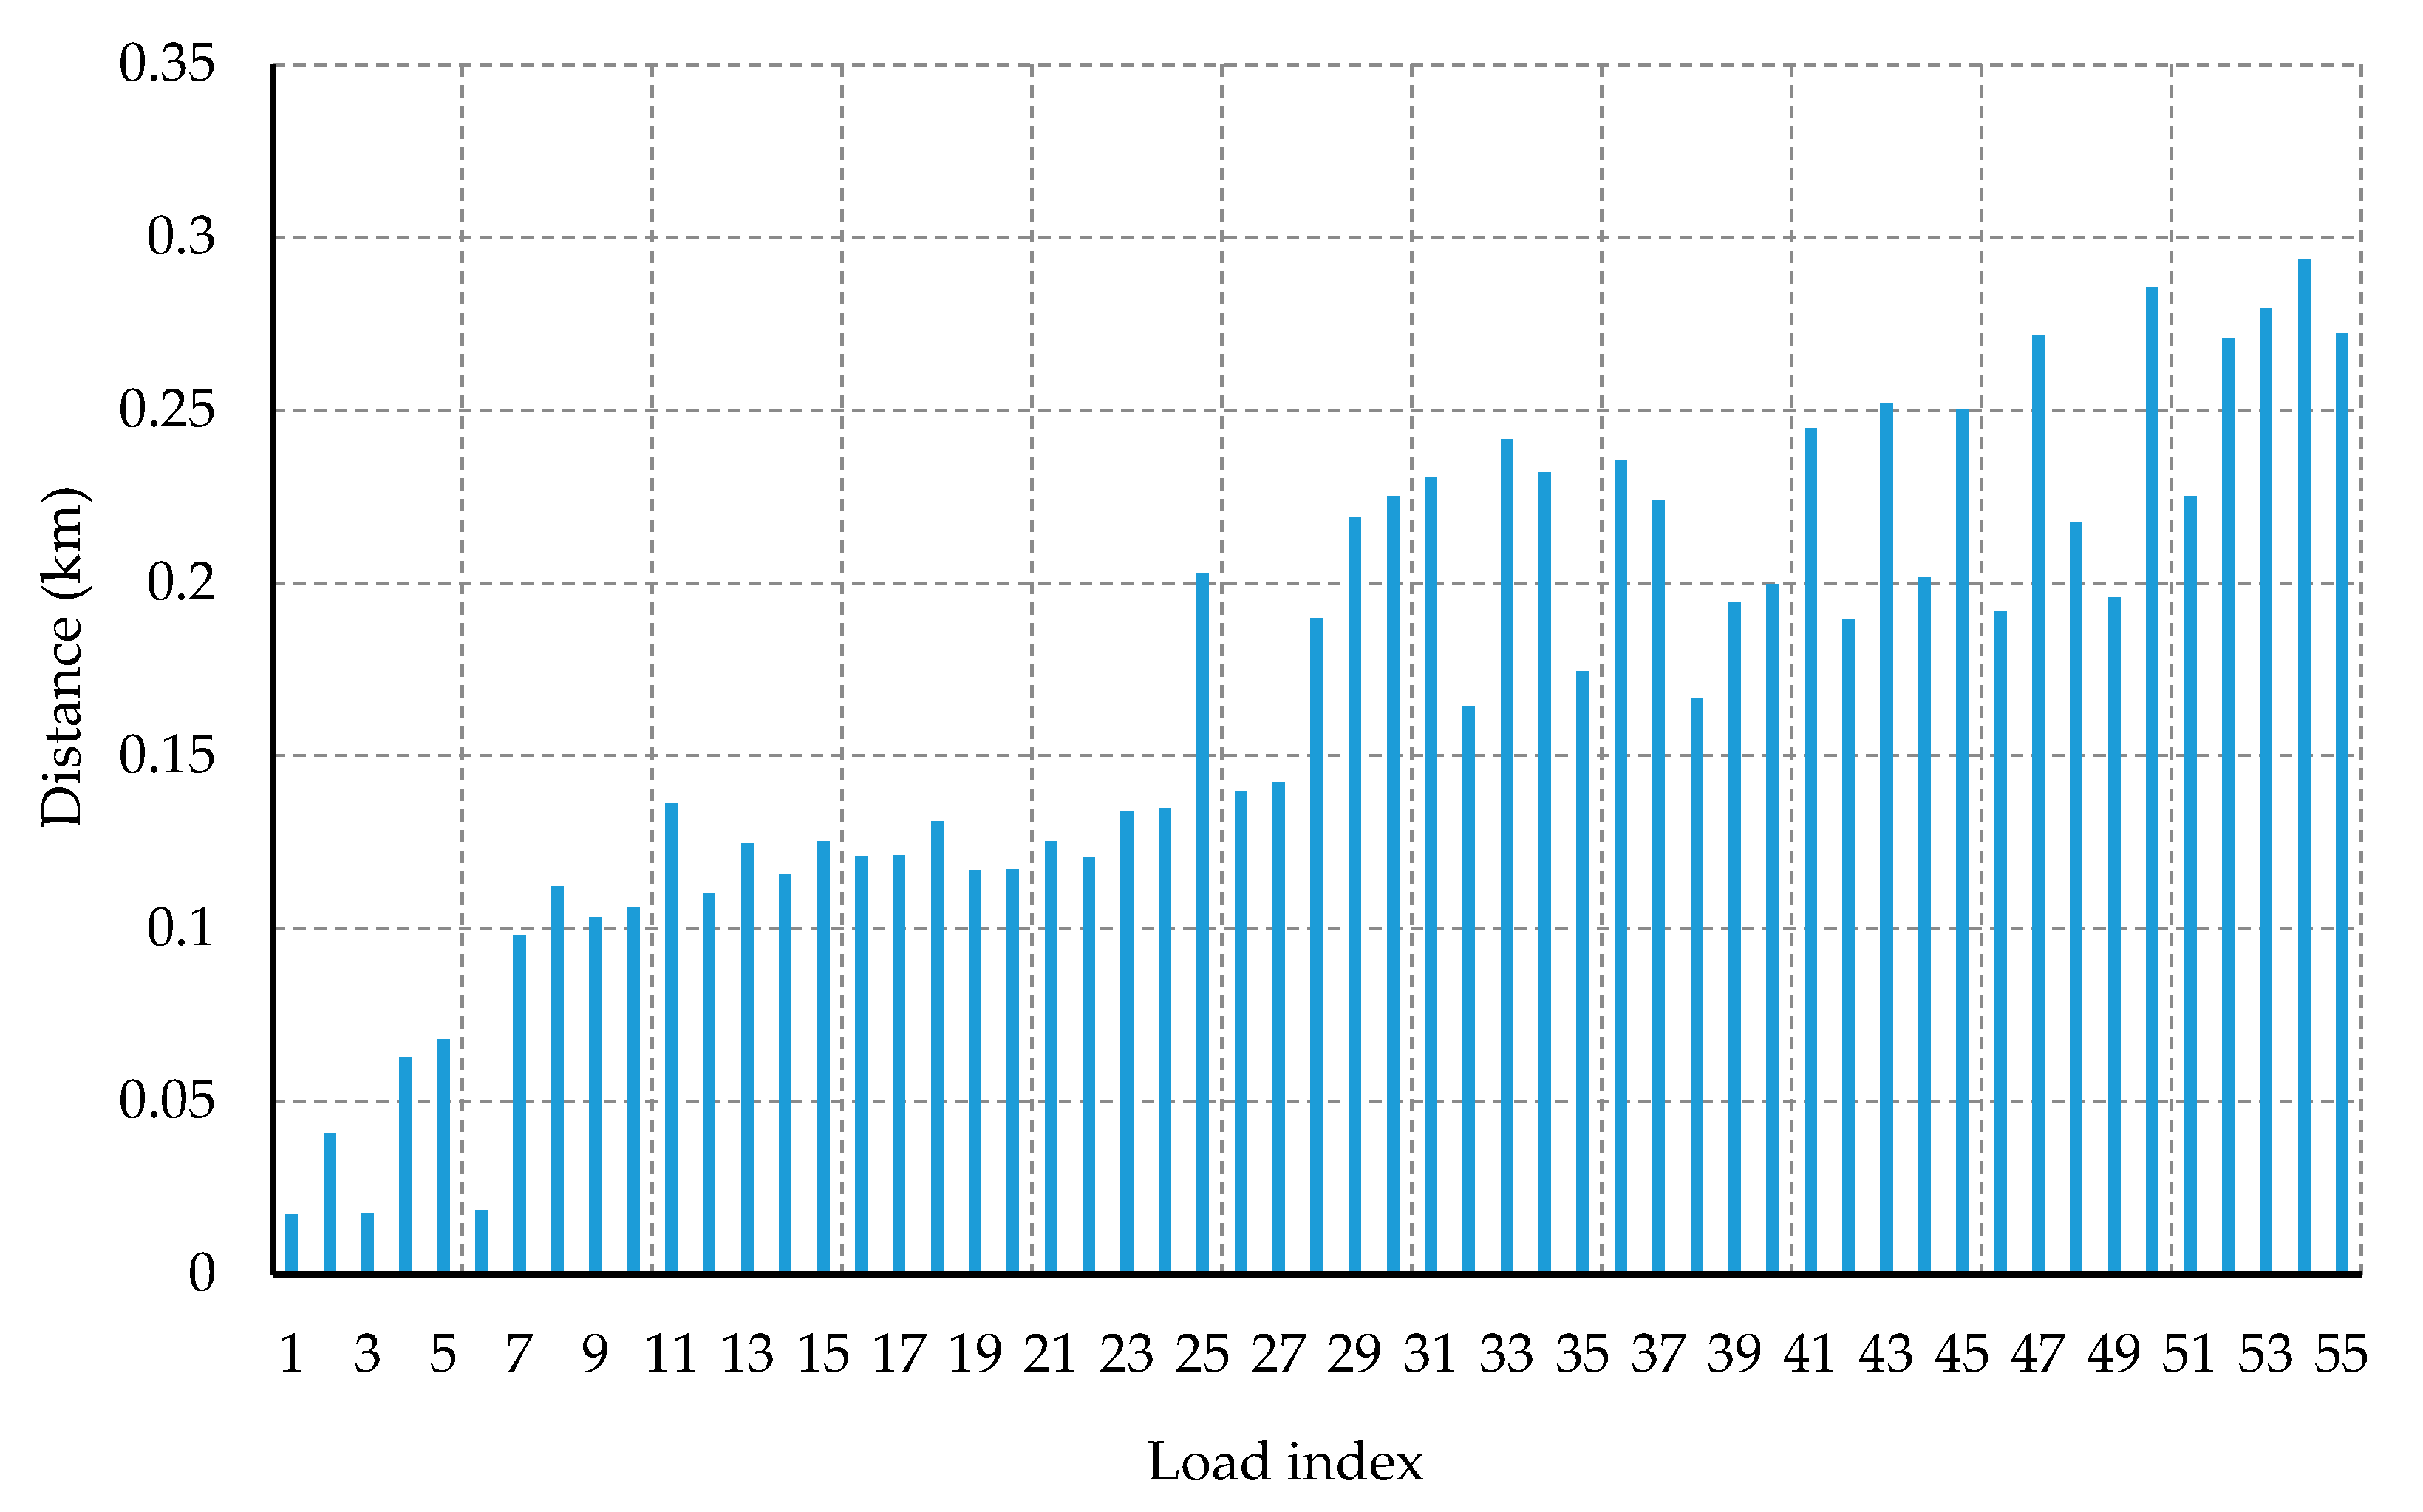
The selected system is a modification of the IEEE European Low Voltage Test Feeder, which formulated to consider EV charging points. This network represents a typical European distribution system (three-phase low-voltage feeder) with a base frequency of 50 Hz. The network starts from an 800 kVA delta-wye transformer, which steps down the voltage from 11 kV to 416 V, with a power factor (PFload) equal to 0.95, by using a total three phase network of 907 lines and 903 buses, in which 55 are load buses and 848 buses are used to connect the feeder’s lines across the network. The network feeds 55 single phase residential loads (Figure 1). The connected loads in each system’s phase are: (i) 21 loads in phase A, (ii) 19 loads in phase B, (iii) 15 loads in phase C. The entire required feeder’s data are available in model’s online dataset [40]. The single-phase diagram of the feeder and the location of each residential load in the network are presented in Figure 1. The distances of each load from the grid’s substation are presented in Figure 2.
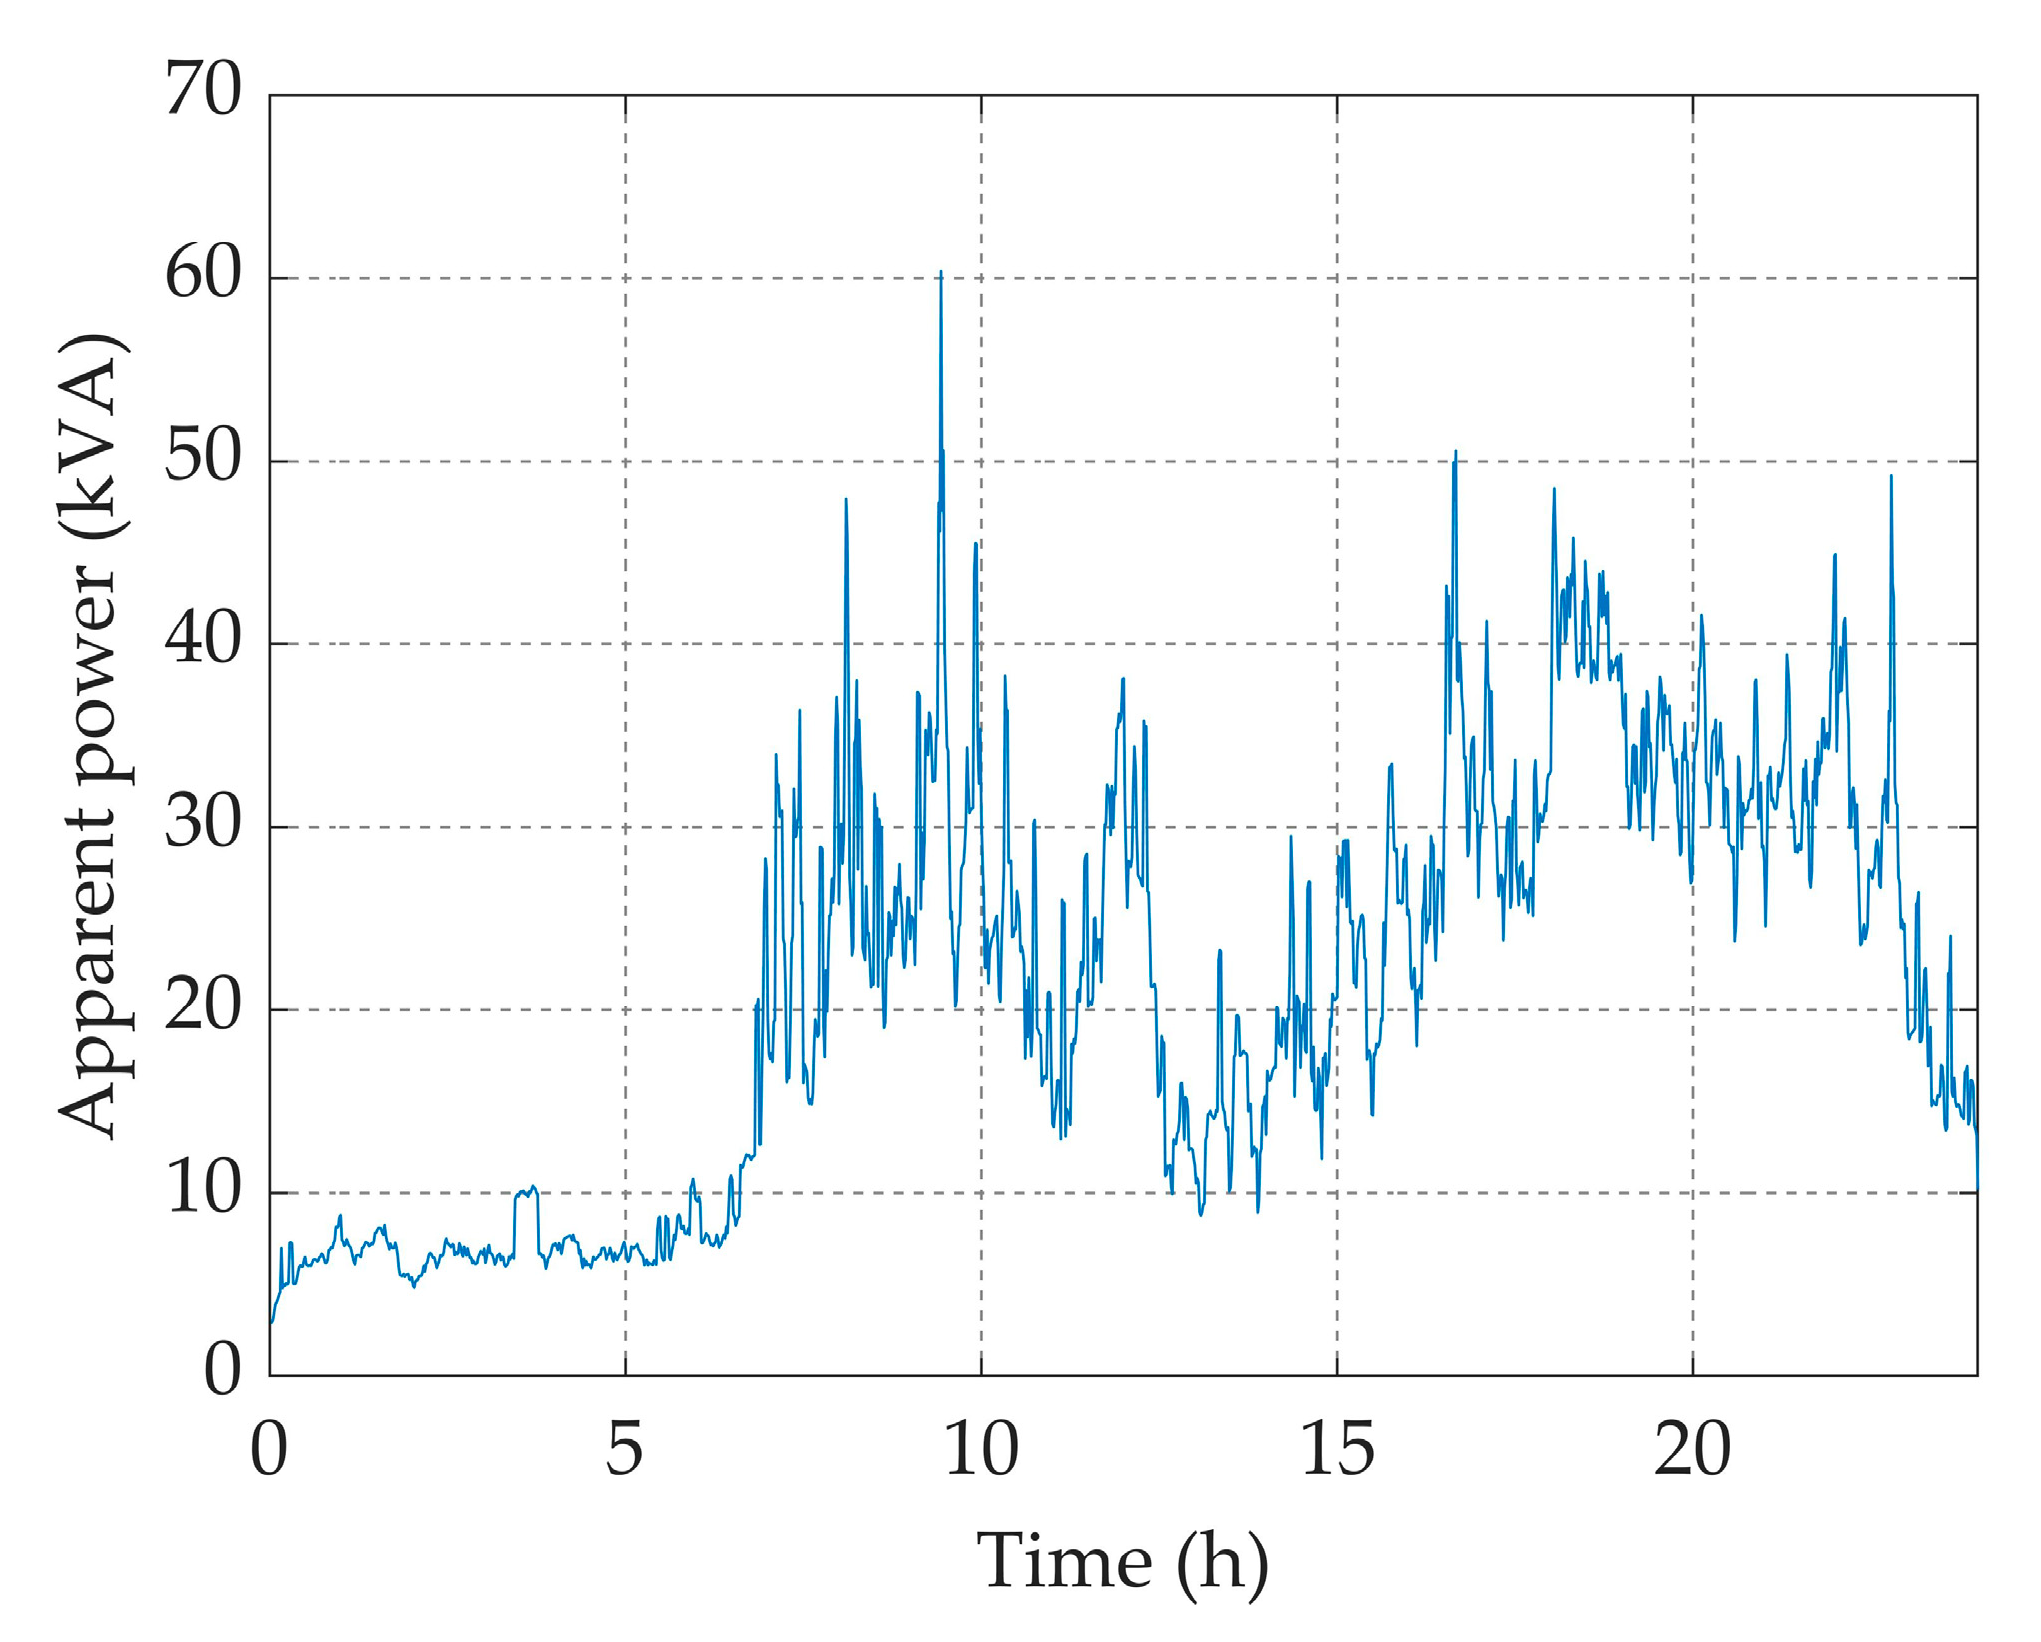
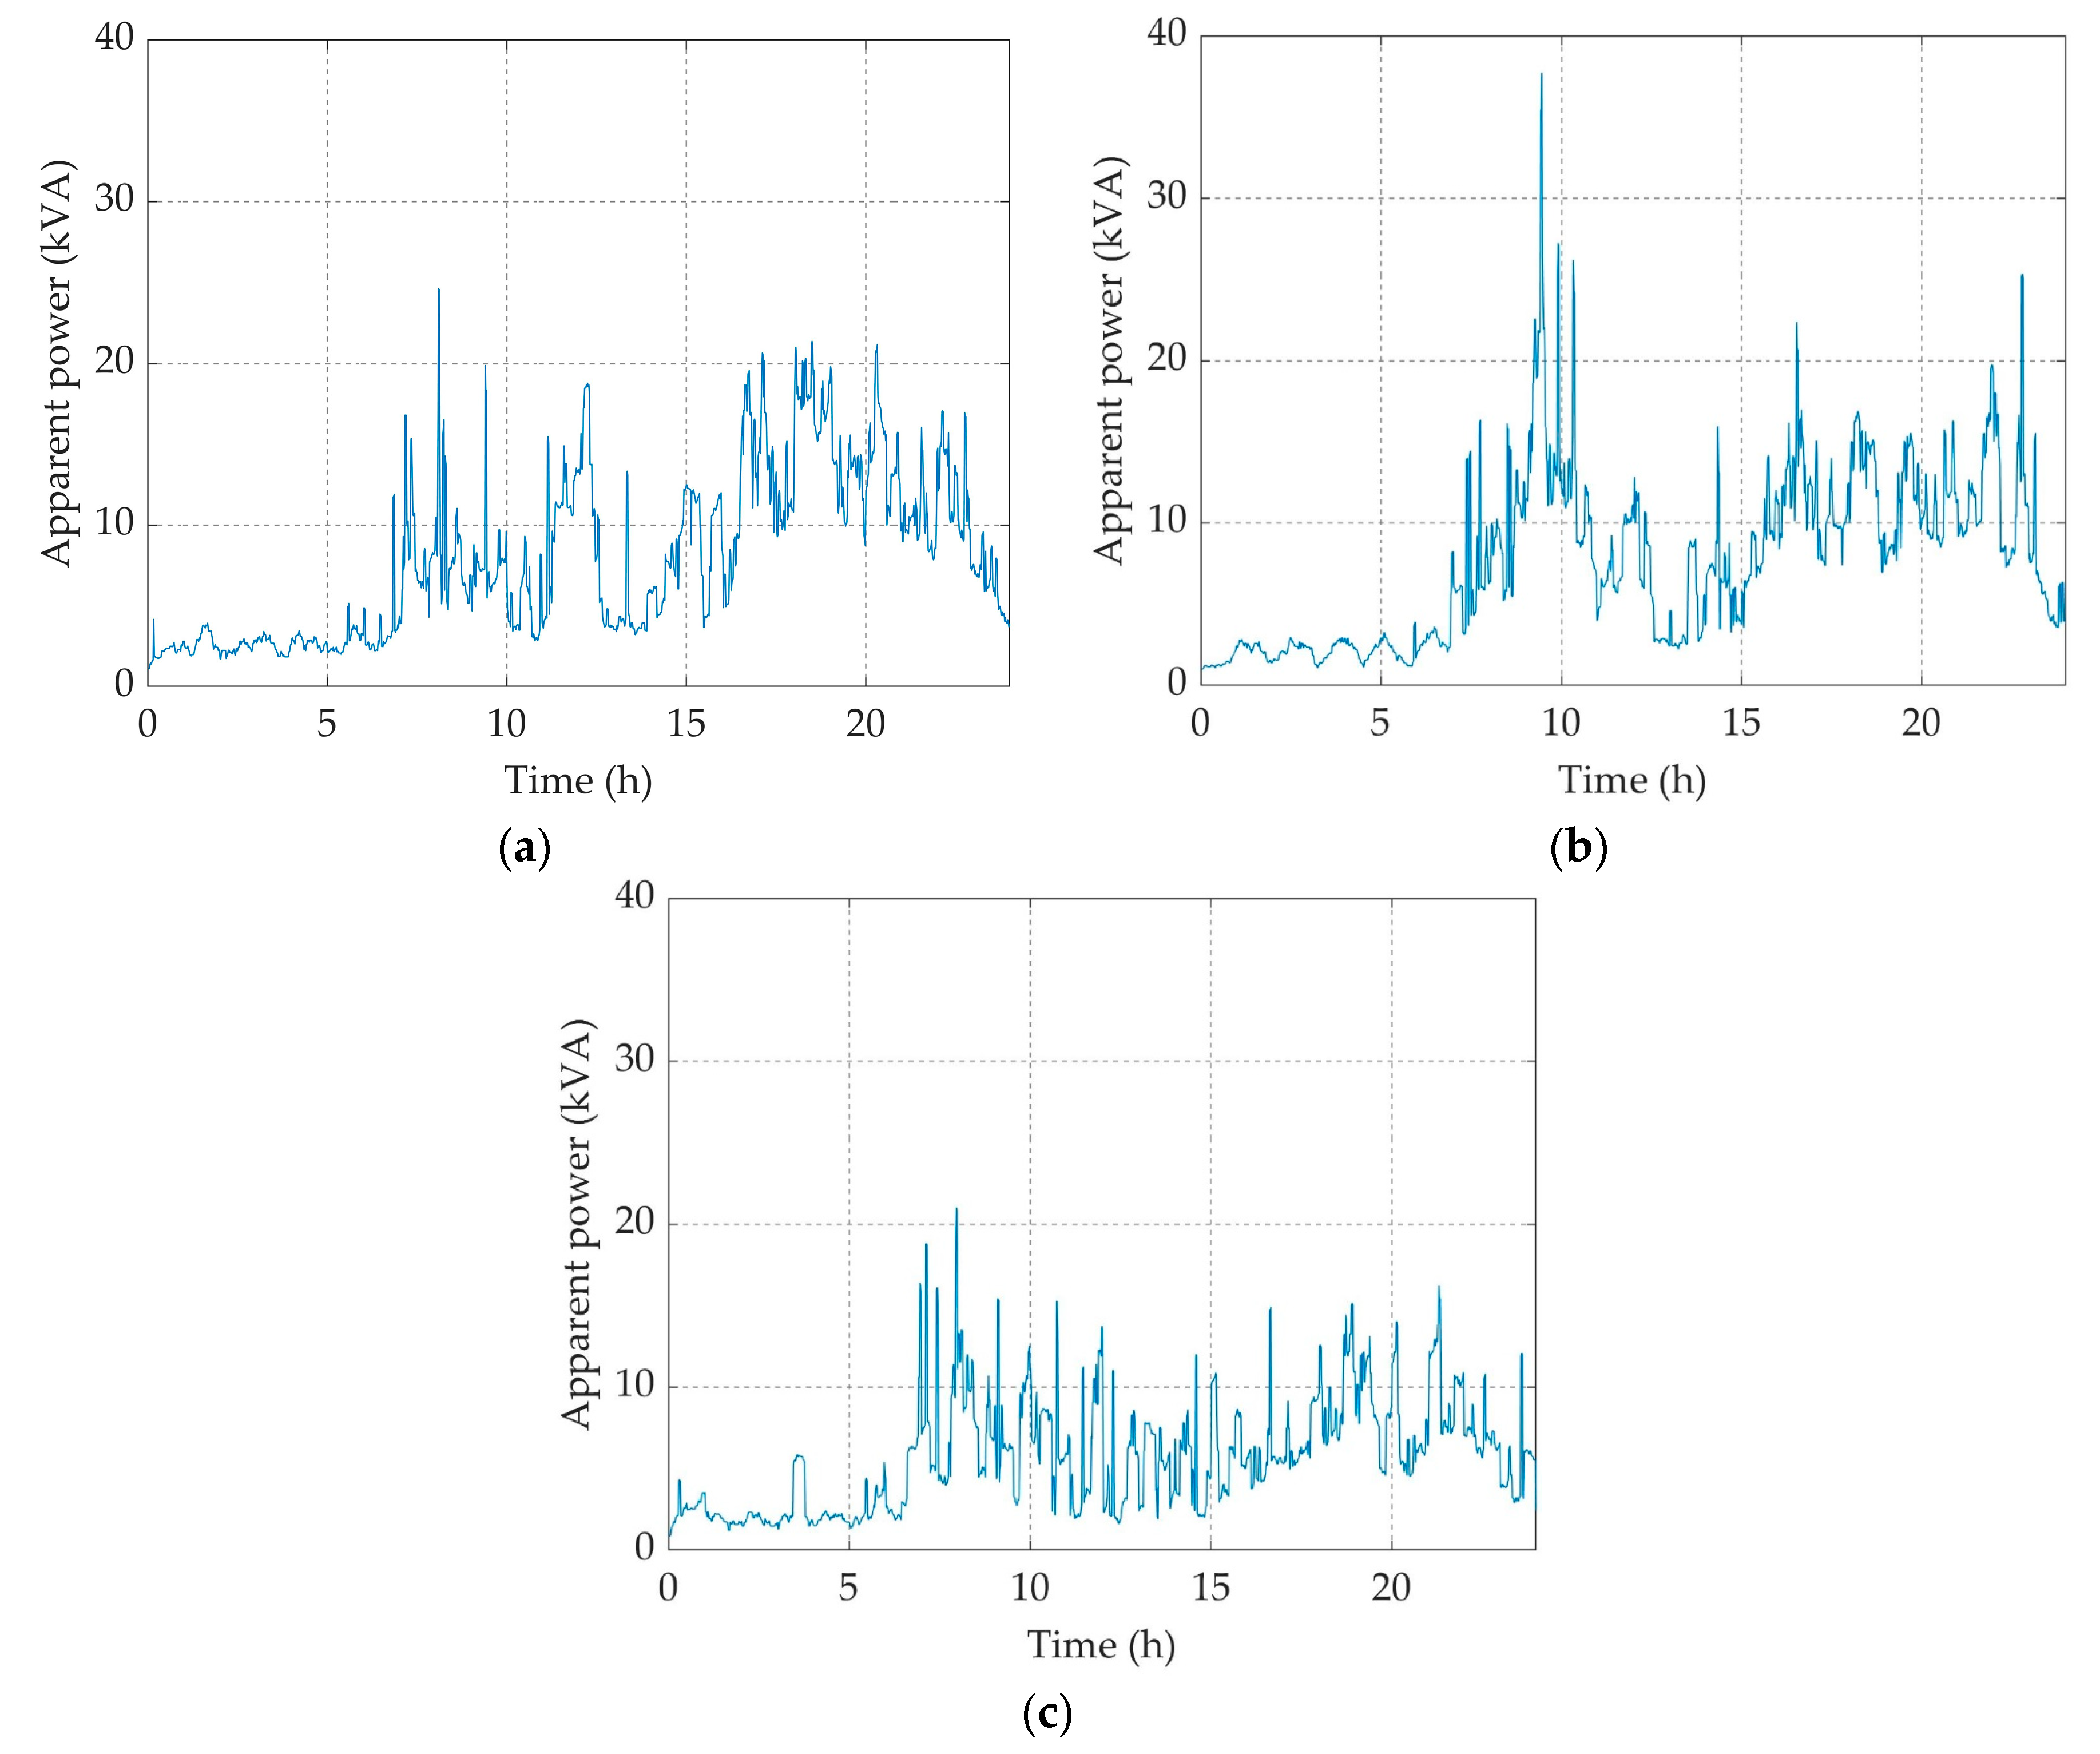
The dataset of the IEEE European Low Voltage Test Feeder includes typical daily power curves for each network’s residential load [40]. The transformer’s load curve is depicted in Figure 3. The consumed power for each system’s phase is shown in Figure 4, while Table 1 presents the total peak load and the average daily energy consumption for the transformer and for each phase, separately.
The selected network was reformulated since no electric vehicles were considered originally. Hence, it is now considered that each house has also an electric vehicle, which connects to the distribution grid, by battery chargers. Therefore, a fixed number of 55 charging points are considered to the network. A schematic representation of the overall system configuration is illustrated in Figure 5. The model consists of the following components: (a) the radial low voltage network, (b) the distributed household loads, and (c) the electric vehicles and battery chargers.

2.2. Technical Constraints for Grid Distribution System Operation

All electric households’ needs ought to be covered at 100% throughout the day. Therefore, the system must cover specific technical constraints, in order to ensure the grid’s stability and safe operation and performance.
The voltage constraints of the distribution system will be considered by setting the upper and lower limits to correspond to voltage regulation limits. The voltage limits are set to ±5% (Vmin = 0.95 pu and Vmax = 1.05 pu) which is typical of many distribution systems. Thus, the following constraint must be considered for the voltage for each phase:
V min V k V max   for   k = 1 , , n .
where k and n are the bus number and total number of buses, respectively.
The second constraint is for setting the upper limit of the ampacity. Taking into consideration the necessary data obtained by [41], the types of each line of feeder are presented in Figure 6 and the upper limit of grid’s lines ampacities are presented in Table 2. Thus, the following constraint must be considered for the ampacity for each phase:
I k I max   for   k = 1 , , n .
where k and n are the line number and total number of lines, respectively.
The transformer’s rated power is not taken into consideration in the present work, since the consumed power does not exceed the operational limits in any of the examined simulation scenarios.

2.3. Electric Vehicle Agent

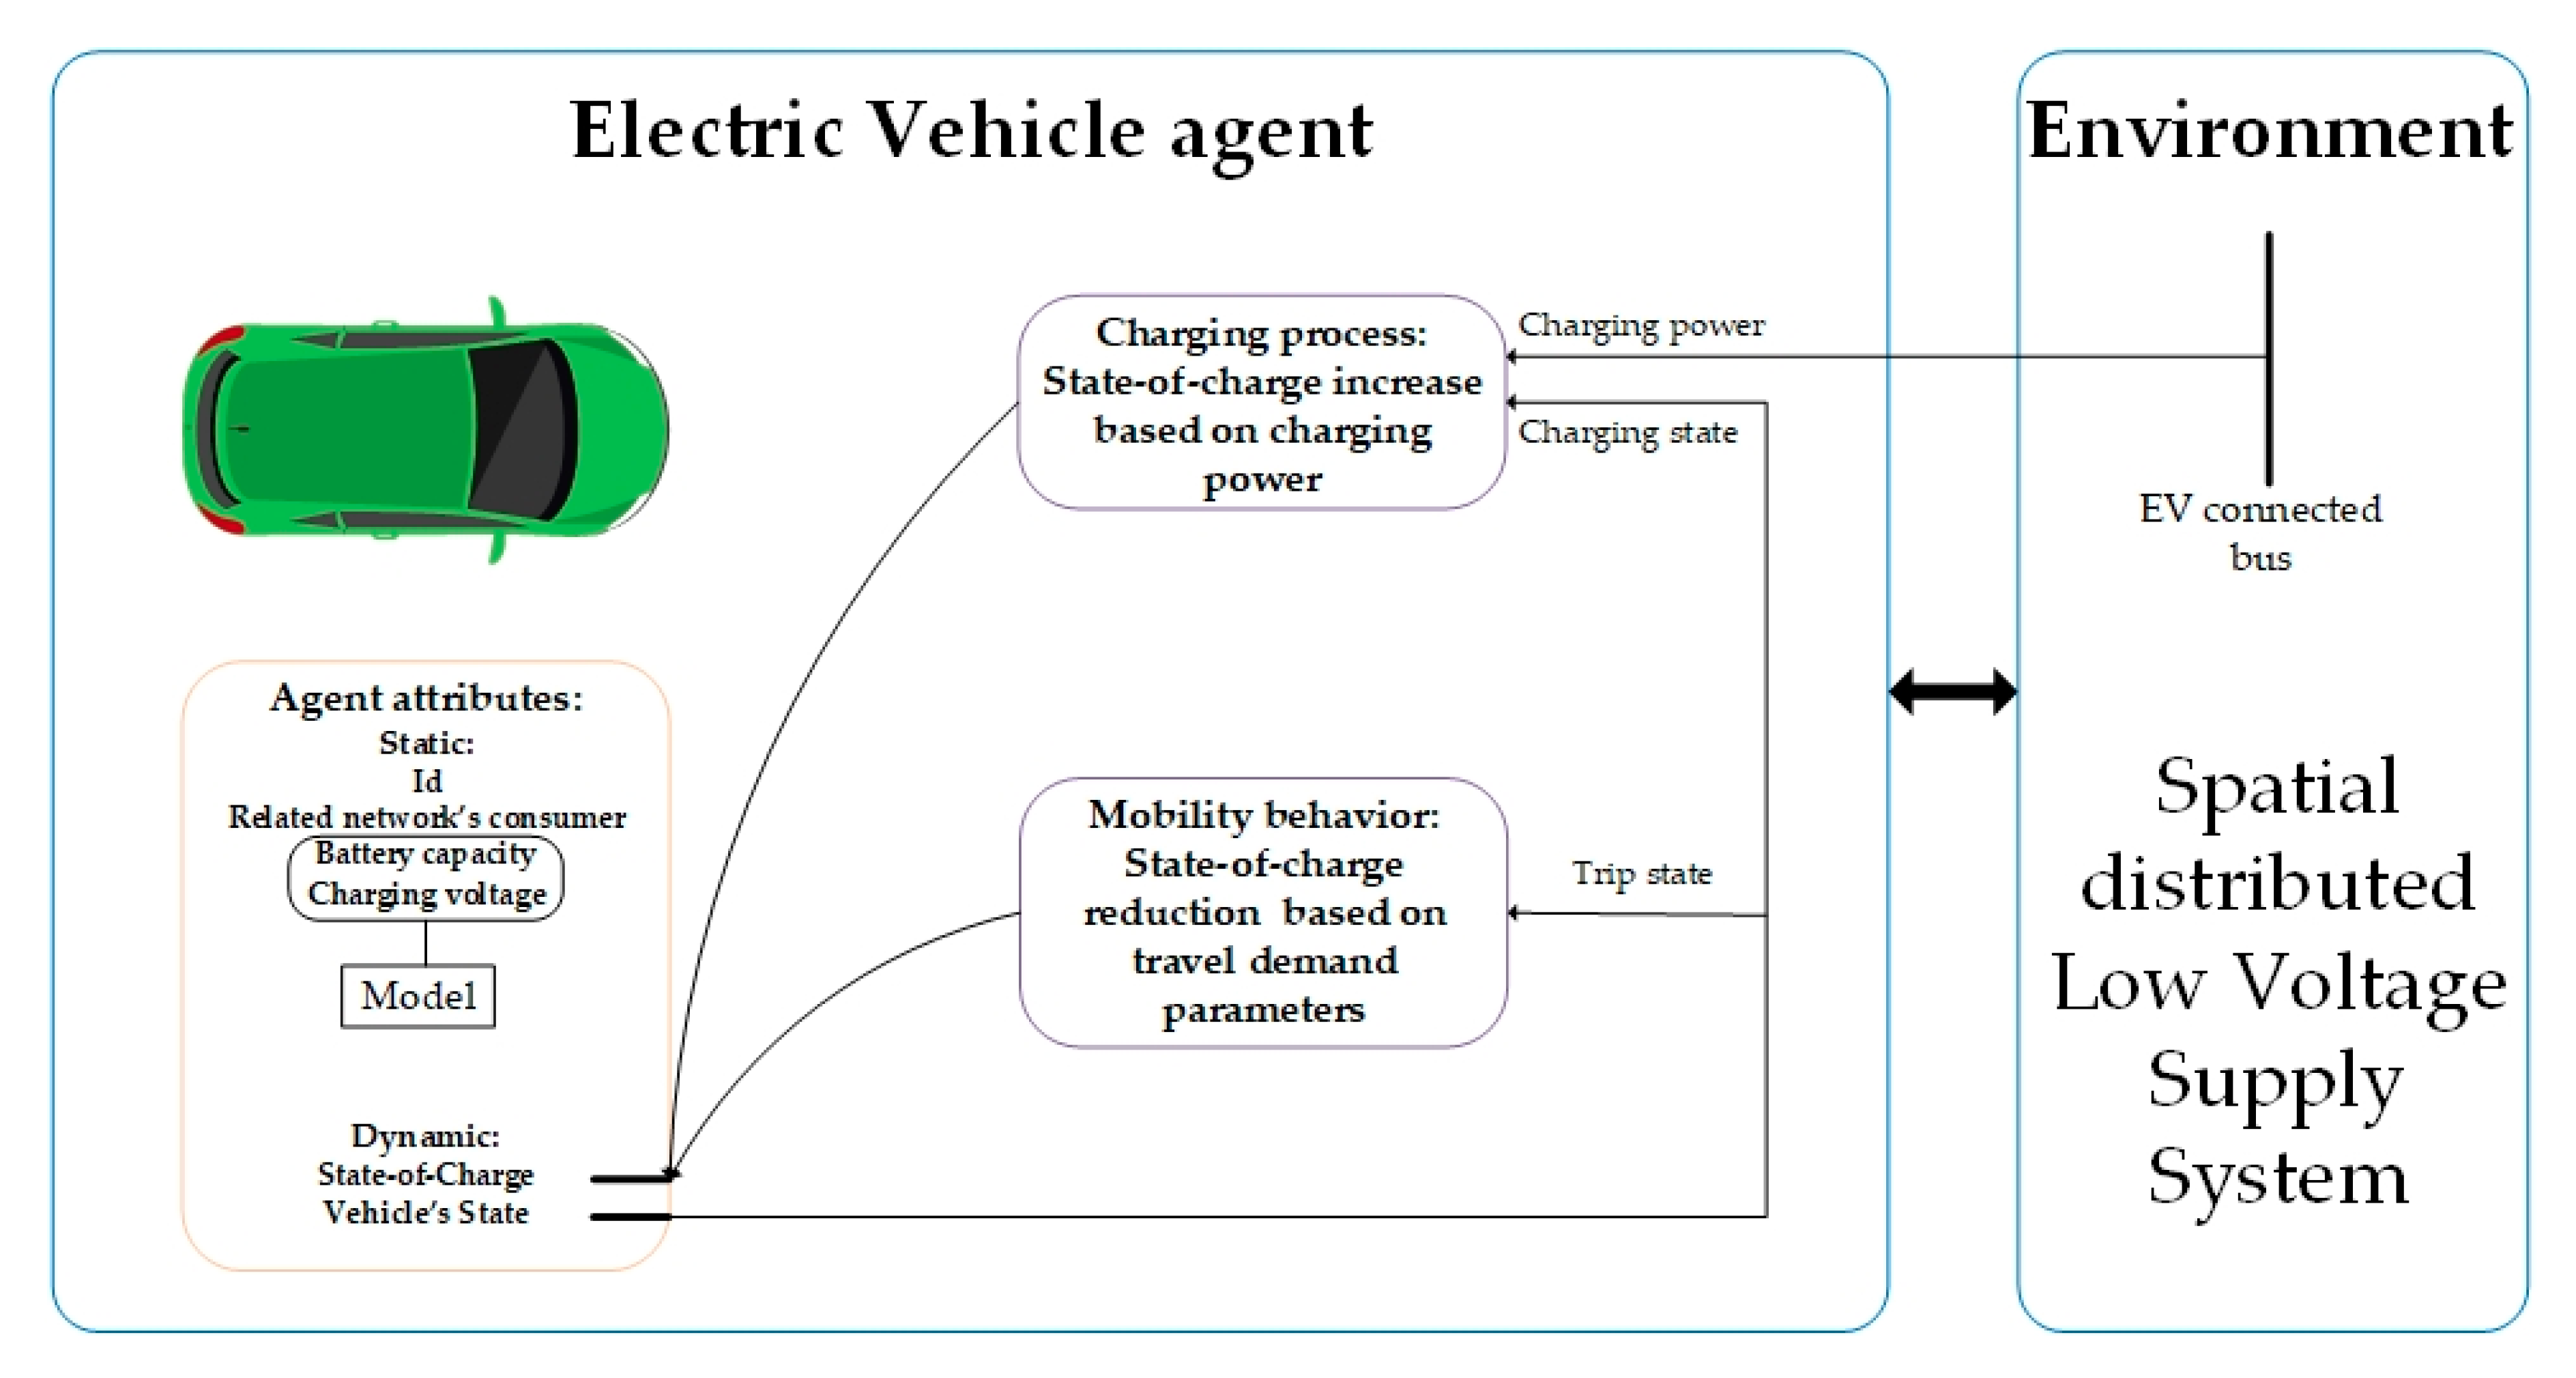
The electric vehicles are represented by agents. The structure of EV agents is shown in Figure 7. EV agents are defined by their attributes and their behavior.
The attributes of the agents are:
  • The EV’s model, which defines the capacity of its battery and the energy consumption per km
  • The EV’s index, which declares the location of its charging point to the grid
  • The EV’s battery state-of-charge (SoC)
  • The EV’s state, which defines if the vehicle takes a trip, is connected to grid and charging, or is parked
  • The EV’s charging signal, which declares if the vehicle will charge at a given time interval and it is produced by the charging management algorithm
The behavior of each EV includes the charging and mobility procedures. When a specific EV, say n, is charged, its SoC of each vehicle’s battery increases, based on Equation (3) [42]:
S o C n ( t + 1 ) = S o C n ( t ) + d t Q n I c h ( t ) × 100 % ,
where, Qn and Ich are the total capacity and the charging current at each interval time of the each EV, respectively.
EV agent’s mobility behavior, when EVs are not parked or connected to the charging points, is calculated based on the average energy consumption per km of each EV’s model and the distance travelled. When an EV takes a trip, the SoC at each time step is calculated by Equation (4):
S o C n ( t + 1 ) = S o C n ( t ) E C P K E max , n l × 100 % ,
where, ECPK is the energy consumption per km, Emax,n is the rated battery’s energy capacity of the EV and l is the distance travelled at each time step.
In the present paper, five different commercial EVs are used for the simulation purposes. The models and their basic technical characteristics are presented in Table 3 [43,44]. As mentioned by the EV manufacturers, the SoC of their batteries is limited between 20–80%. The charging of the upper 10–20% SoC window leads to increased batteries degradation [45]. This concept is also considered in the present study.
In addition, it is assumed that a battery charger has been installed in each house. The EV battery charger must have the ability to charge the battery of each EV. According to the battery sizes of Table 3, the EV battery capacities range from just over 30 kWh (33 kWh, BMW i3) to over 70 kWh (75 kWh, Tesla Model S-75). Taking into consideration the power ability of the grid and with emphasis given on the EV battery life optimization (depth of discharge equal to 60%), a typical battery charger is considered with available rated power of 7.4 kW, AC current of 32 A and efficiency (η) of 88 % [45,46].
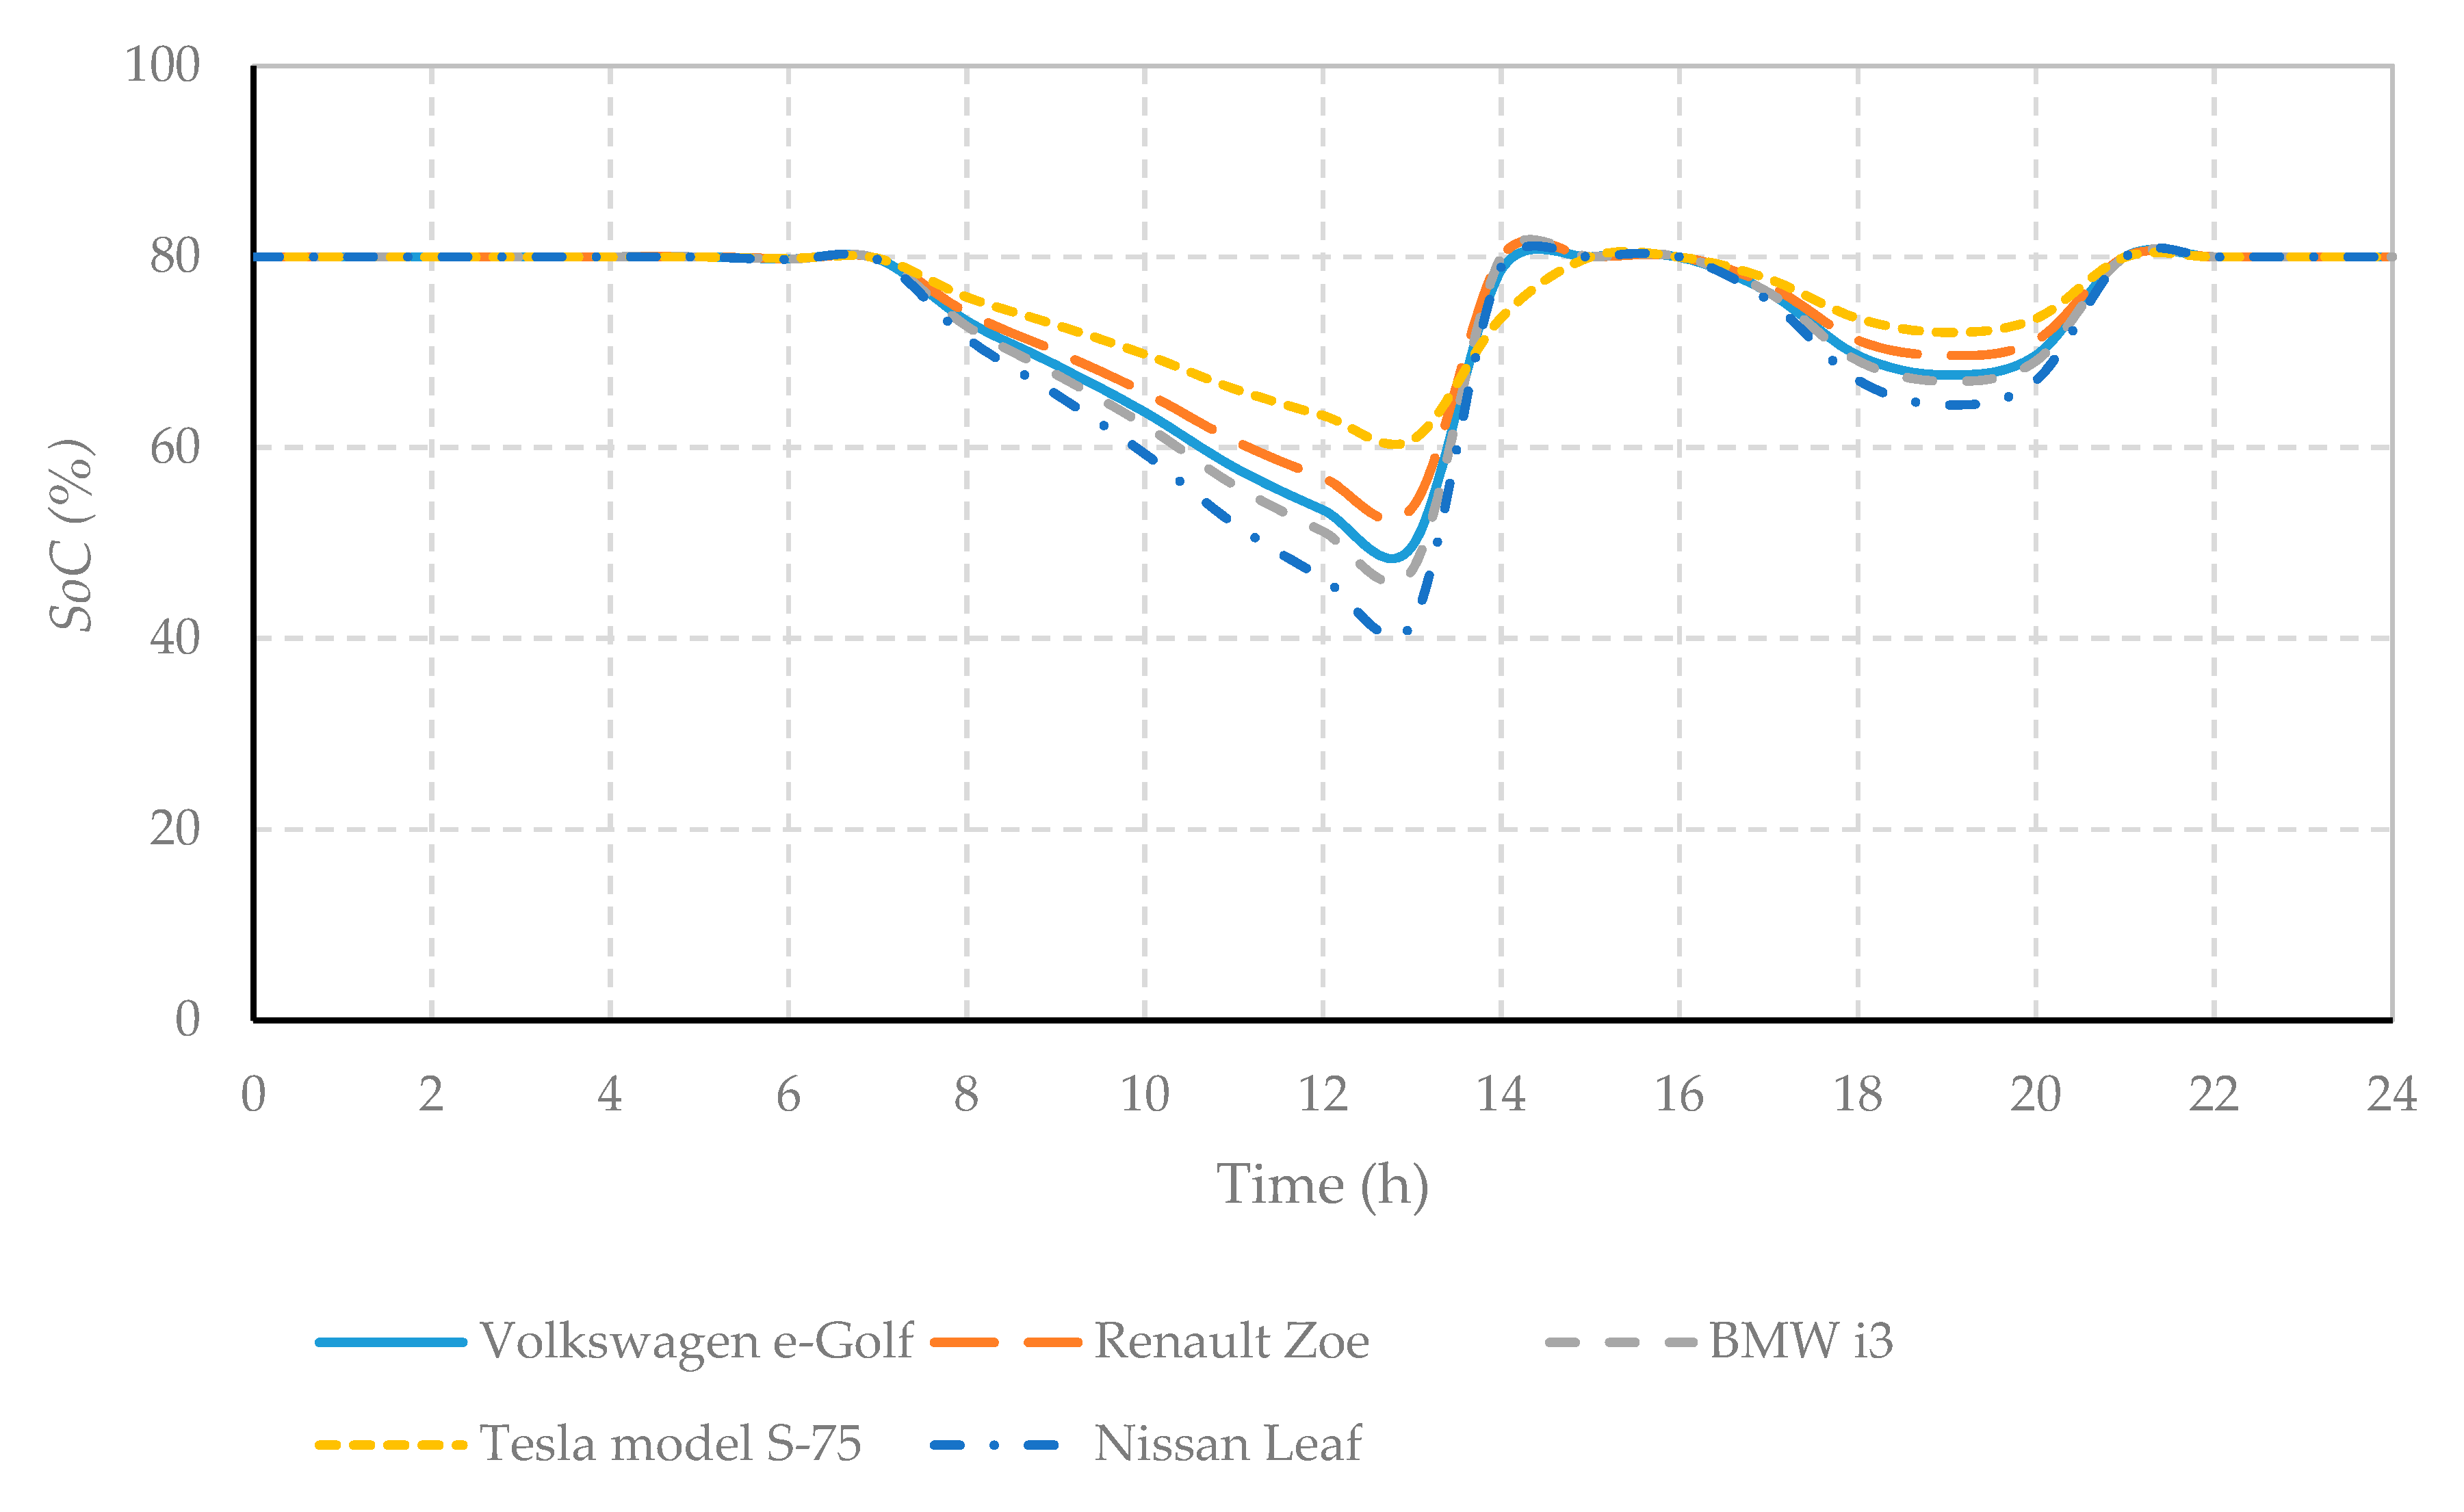
A typical daily behavior of each EV is depicted in Figure 8, according to the above-mentioned charging (Equation (3)) and discharging (Equation (4)) principles. The same trip has been considered for all the examined EVs. Specifically, the total distance travelled by the EVs is 100 km; 70 km between 7:00 h and 13:00 h, and 30 km between 16:00 h and 19:00 h. According to the Table 3, the Nissan Leaf has the lowest battery capacity and the second greater ECPK. The combination of these variables leads to a faster reduction of the SoC, compared to the other examined EV models, and this is observed in Figure 8.

2.4. Fuzzy Logic Based Controllers

Fuzzy logic is a mathematical framework which is widely used in many control applications, by extending binary logic sets to a more general fuzzy ones, in which, the elements of the sets partially exist [47].
In complex control systems, the definition of the controllers’ precise objectives, based on traditional control methods, is a difficult process. The coordination of EV charging in distribution networks is one of them. The logic of fuzzy-based controllers overcomes the existing drawbacks. The architecture of a typical fuzzy based controller is presented in Figure 9.
The fuzzification of the fuzzy controller includes the conversation of the controller’s crisp input values into a set of fuzzy linguistic values, by using membership functions. The most widely used membership functions for the fuzzification of the controller’s input set are the Gaussian, triangular, and trapezoidal ones. The produced linguistic values are read by the fuzzy interface system (FIS), which is the core of the Fuzzy Logic Controller (FLC). The FIS, based on the stored knowledge of the controlled procedure, maps the linguistic inputs to the output linguistic outputs, by performing approximate reasoning. The output of the FIS is driven to the defuzzifier, which converts the gathered from the FIS fizzy values into crisp output values. The conversation of the fuzzy linguistic output values into crisp values is also based on the output membership functions, such as the inputs [48].

2.5. Modelling and Simulation Framework

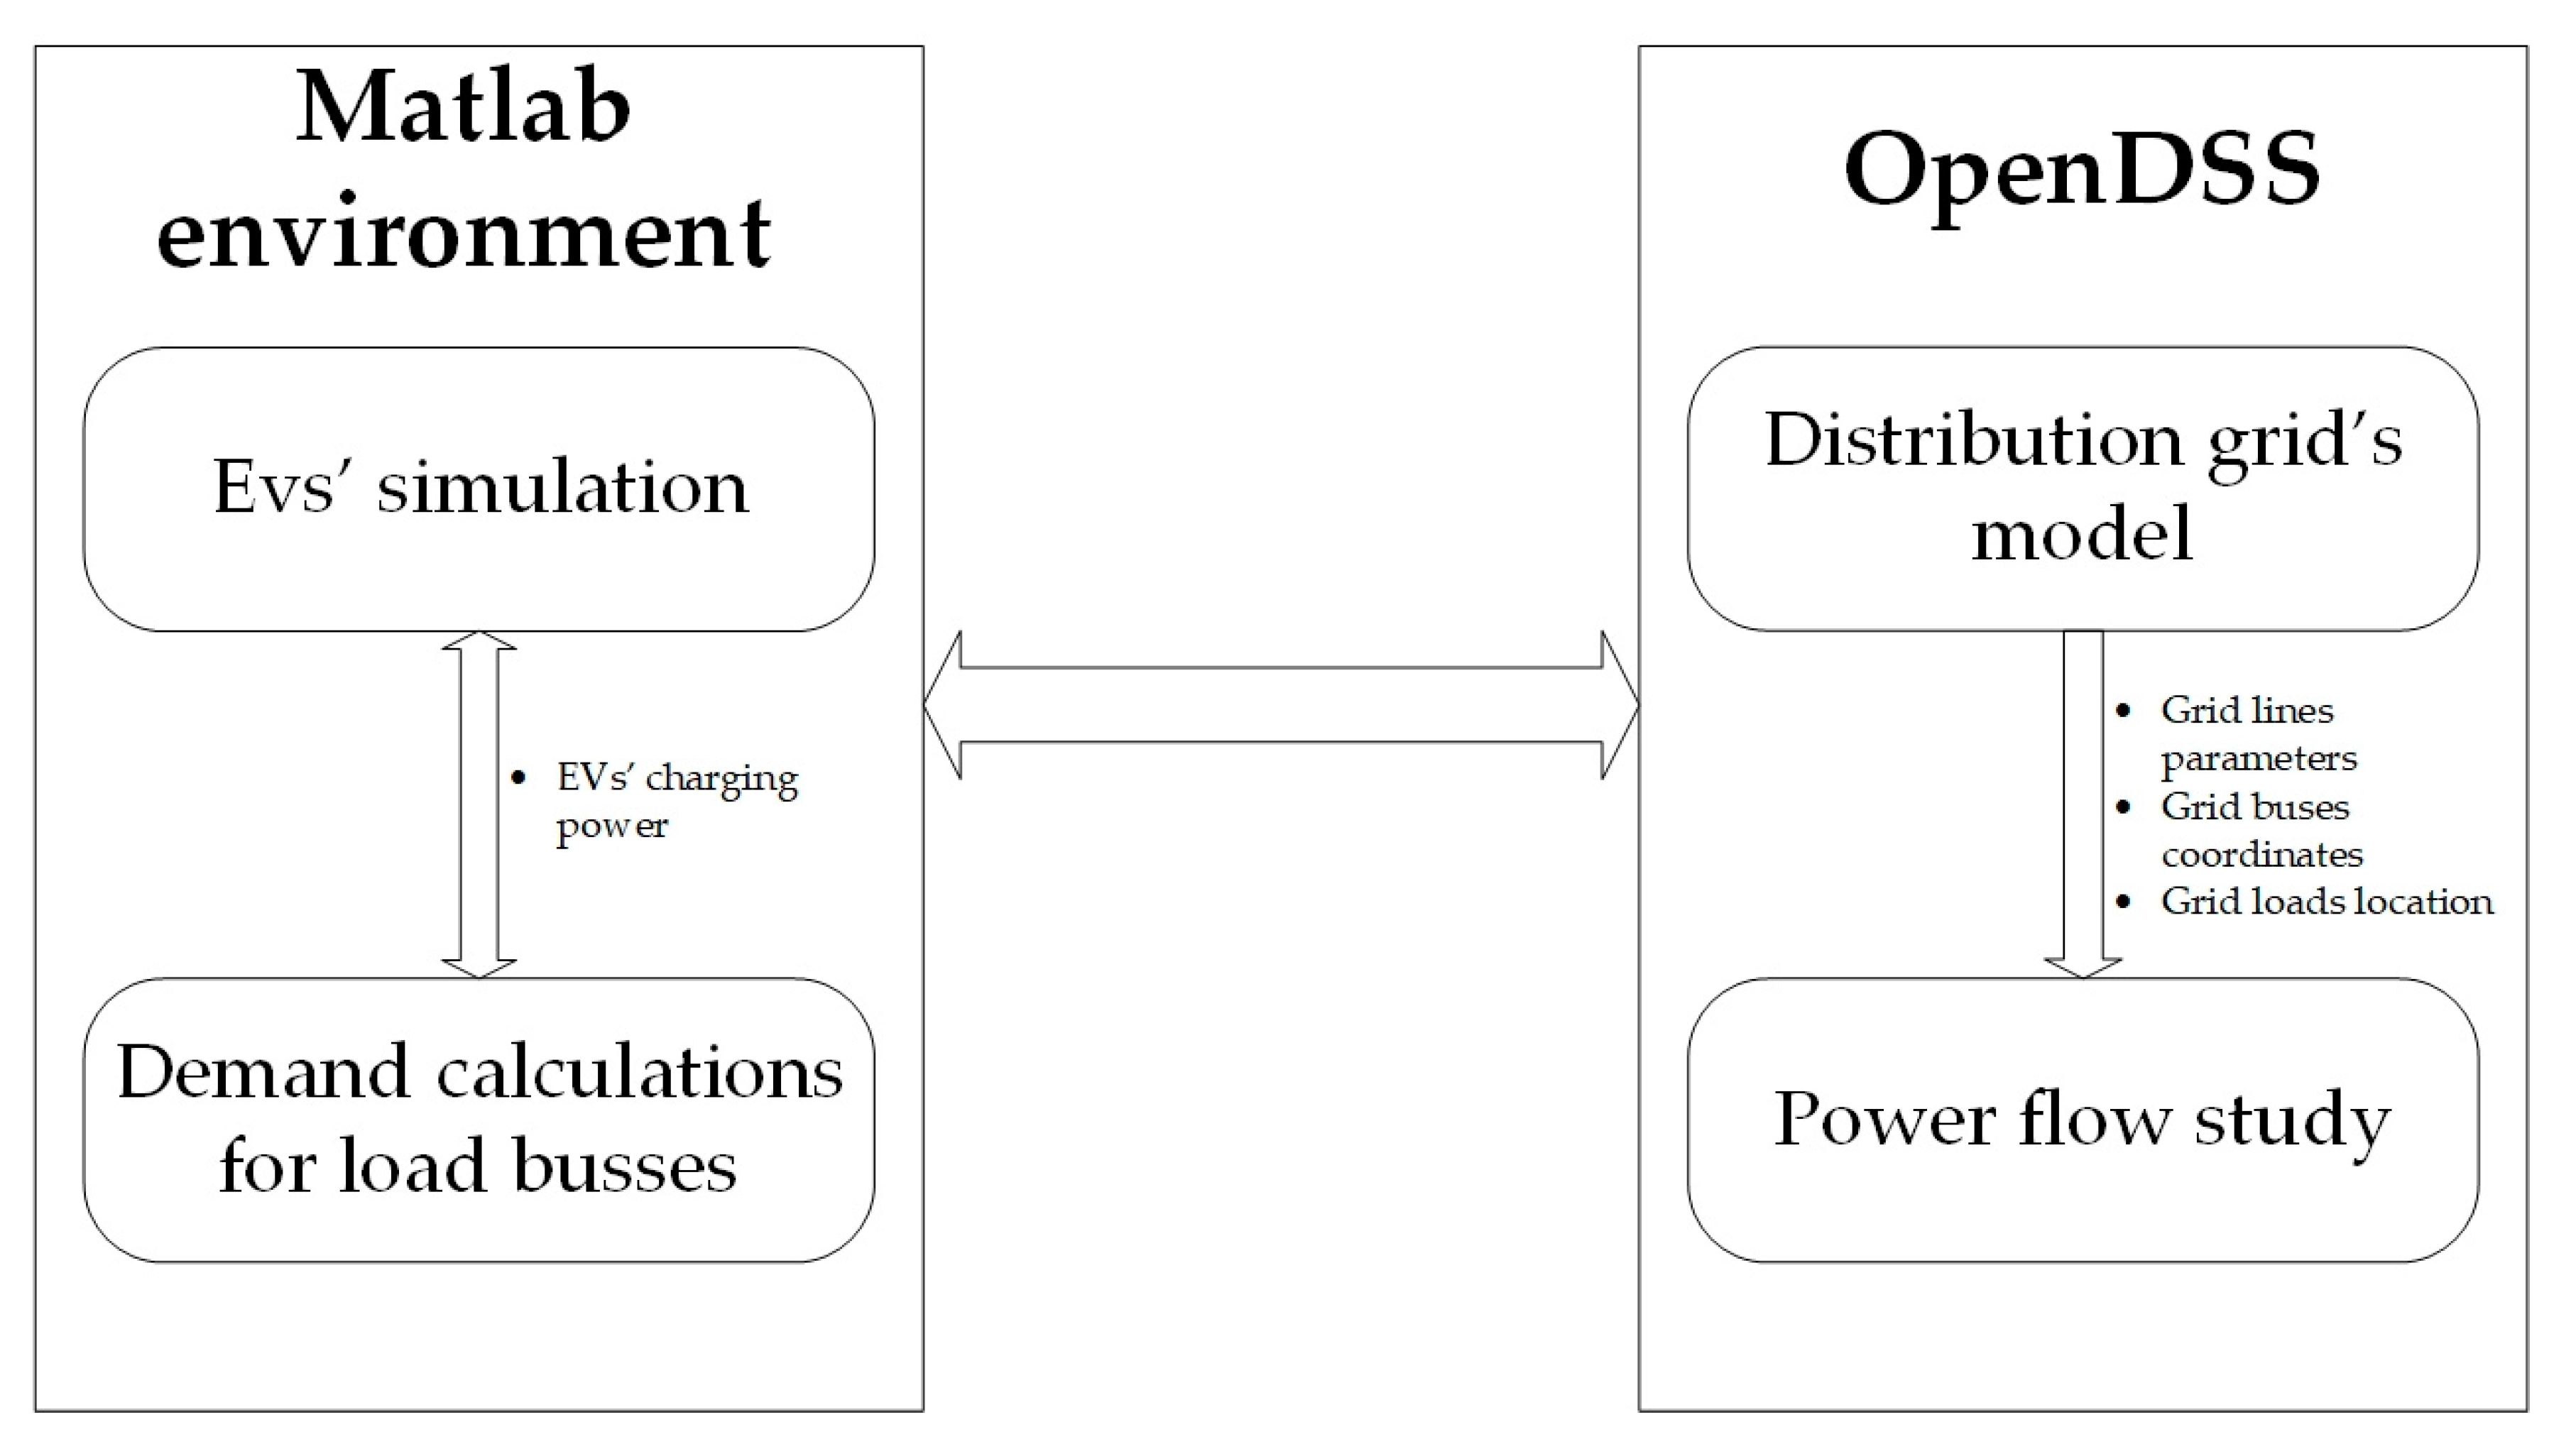
The environment of the low voltage grid was modelled and implemented by using the OpenDSS, an electric power distribution system simulator (DSS), which is designed for supporting distributed resource integration and grid modernization efforts, and used for the power flow calculations of the low voltage network [49,50]. MATLAB® software environment was used for the design, modelling and simulation of EV agents. Thus, the OpenDSS COM Interface (EPRI, Palo Alto, CA, USA) was used for the connection of the OpenDSS and the MATLAB® routines. In addition, Matlab was used for the development of the FIS for the centralized control of EVs charging behavior. The structure of the total framework is presented in Figure 10.

3. Effects of EVs Penetration in Distribution Grids

3.1. Investigation of Maximum Chargeable EVs in the Case Study Grid

The considered feeder has been designed without the penetration of EVs, like most distribution networks. Consequently, EVs will have an increased grid impact. From the grid point of view, the aim is to investigate the maximum number of EVs that can be charged, by avoiding grid’s abnormal operation (bus voltages and lines ampacity must within the limits, according to Equations (1) and (2)). To this end, two different case studies were examined. The first case study (CS1) examines the maximum number of EVs that can be charged, from the nearest to the furthest charging points, by increasing the number of connected EVs to grid in an ascending relation to the distance of each load from the substation. In the second case study (CS2), the maximum number of connected EVs is calculated by starting the penetration of EVs to the grid, from the furthest charging point. In both scenarios, the households’ power consumption of each load is covered. The objective is to examine the maximum chargeable EVs at each time step for the overall model and for each phase separately. The simulations are referring to a 24 h time period, with 1 min time step. Figure 11 depicts the maximum allowed EVs in each of the two scenarios. Figure 12 presents the maximum chargeable EVs for each grid’s phase, separately. Furthermore, in order to quantify and discuss the results of Figure 11 and Figure 12, two basic statistics are used: (i) the mean of the chargeable EVs, which is calculated by Equation (5), and (ii) the variance of the chargeable EVs, which is calculated by Equation (6). The results are presented in Table 4.
N m e a n = i = 1 N n i N ,
var ( n ) = i = 1 N ( n i N m e a n ) 2 N ,
where ni is the number of chargeable EVs at timestep i, N is the total number of the simulation timesteps, Nmean the mean of the chargeable EVs and var the variance of chargeable EVs.
According to Figure 11 and Figure 12, it is clear that the location and the distance of the charging EVs influence the total number of EVs chargeable on the grid. The results show that the adopted EVs, which are closer to the substation, such as in CS1, cause less power losses in the network’s lines and the voltages at the buses are more stable.
The results of Table 4 show that the total mean utilization of chargeable EVs in CS1 is 21.5 % more than in CS2. Thus, the variance of the maximum chargeable EVs in CS2 is smaller than in CS1. This fact indicates that the influence of a grid’s household loads on the maximum EV utilization is greater when EVs are located near the substation totally and for each phase separately. The increased number of chargeable EVs in CS1, compared to CS2, was expected. The aforementioned facts show that the distance and the location of EVs in the grid’s topology is a major factor which affects the maximum EV utilization. Therefore, in the present paper, the distance of the EVs’ charging points from the main system’s substation is considered in the proposed energy management system.

3.2. Investigation of Unctrolled Charging Effects on the Case Study Grid’s Buses and Lines

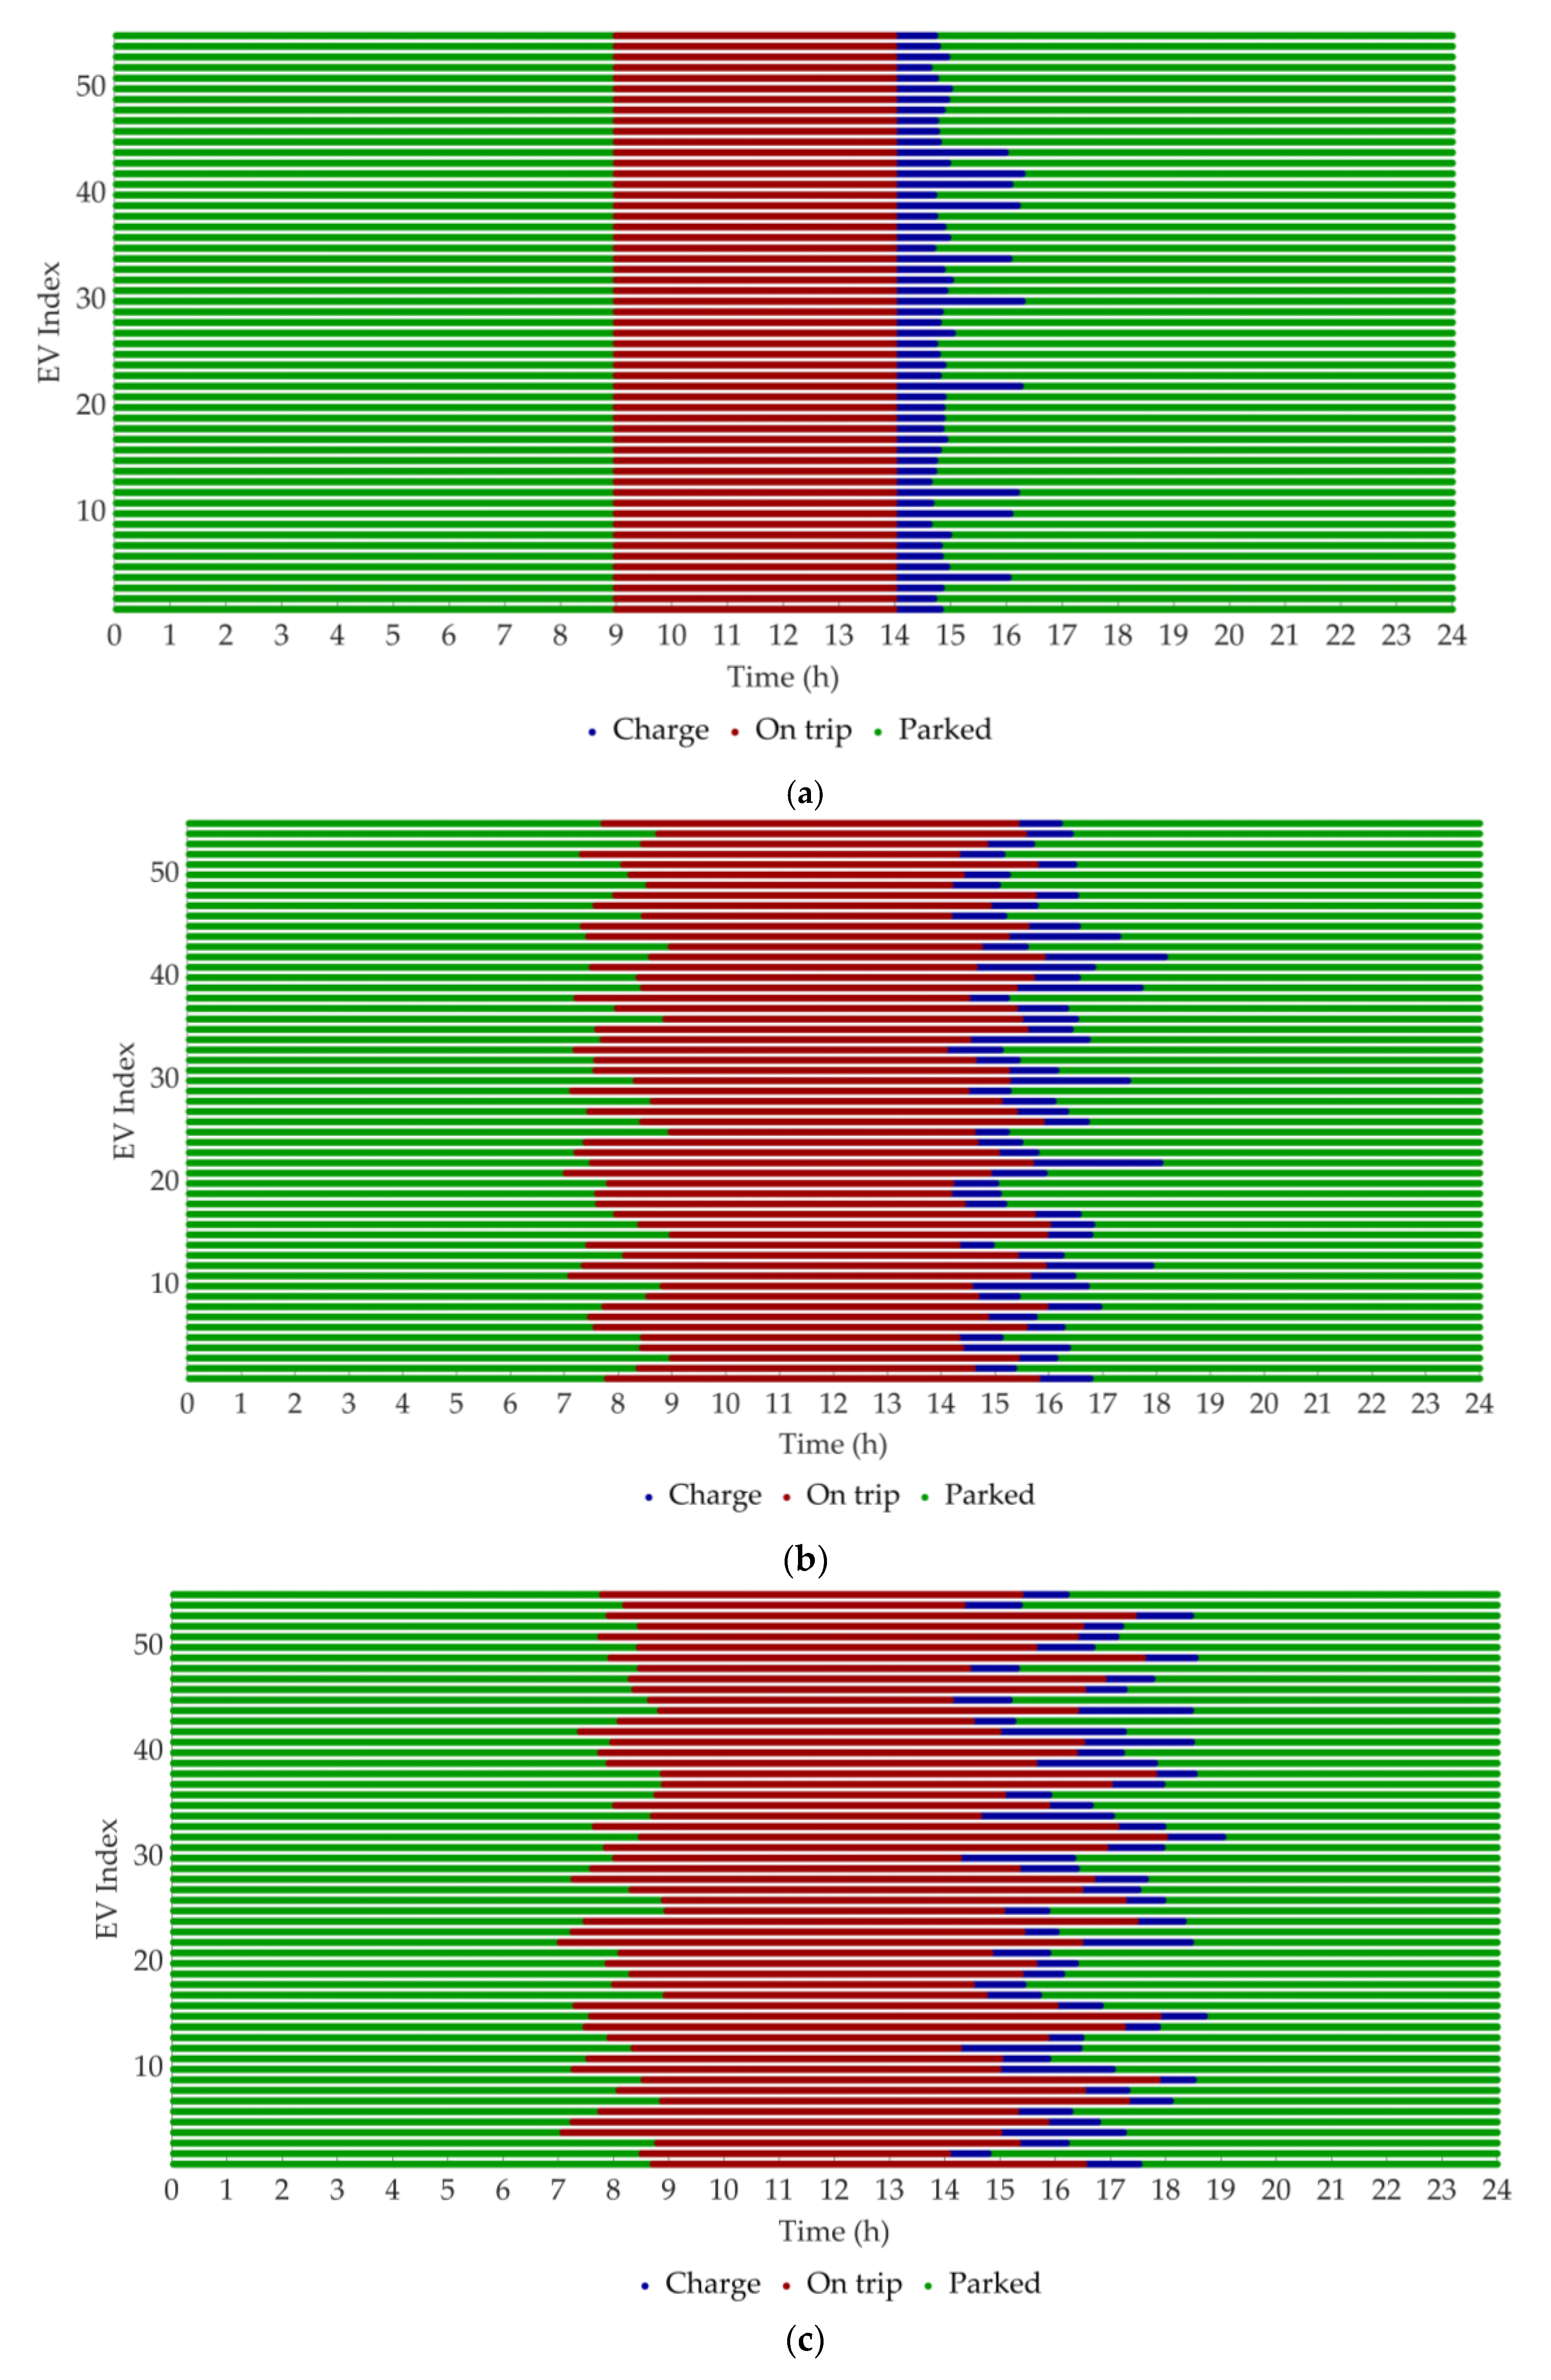
Four different uncontrolled charging scenarios are assessed in term of their grid impact, by changing the time space in which EVs are connected to the grid in order to be charged. The aim of the simulation scenarios is to demonstrate the effects of EVs uncontrolled charging in the number of the grid’s buses and lines and to evaluate the proposed energy management system in Section 4. In all scenarios, the same loads demand profiles are considered (Figure 3) and also the same types of EVs (Table 3). Initially, in all scenarios, the EVs are parked and are fully charged. The four scenarios are:
(i) Scenario 1: EVs depart at 9:00 h and connect to the grid at 14:00 h.
This scenario represents a worst-case scenario, in which EVs are connected to the grid at the same time. In this scenario, the EVs depart from each house is scheduled at 9:00 h. After taking a trip between 9:00 h and 14:00 h, they return at 14:00 h to the charging points in order to be charged. The present scenario is considered in order to examine the system’s behavior in a stressed grid’s situation.
(ii) Scenario 2: EVs are departing between 07:00 h and 9:00 h and connect to the grid between 14:00 h and 16:00 h.
In this scenario EVs depart from their house between 7:00 h and 9:00 h. After taking a trip, they arrive at the charging points between 14:00 h and 16:00 h. The departure and arrival times of each EV are calculated randomly based on uniform distribution. In this scenario, the EVs arrive at their charging points in a time window of two hours.
(iii) Scenario 3: EVs are departing between 7:00 h and 9:00 h and connected to the grid between 14:00 h and 18:00 h.
In this scenario EVs depart from their house between 7:00 h and 9:00 h. After taking a trip, they return to the charging points between 14:00 h and 18:00 h. The departure and arrival times of each EV are calculated randomly based on uniform distribution. The present scenario is considered in order to examine the system’s behavior in a stressed situation. Both Scenarios 2 and 3 are also examined in order to investigate the effect of the arriving time windows on the grid’s stability. Thus, they represent more realistic scenarios compared with Scenario 1. The difference between Scenarios 2 and 3 is the arrival time window, in which EVs are returning to the charging points in order to be charged. In Scenario 3, the arrival time window has been extended by two hours, compared to the arrival time window of Scenario 2.
(iv) Scenario 4: EVs are randomly connected to the grid or disconnected at certain times.
In this scenario, the EVs’ state changes randomly during the simulation period. The aim of this scenario is to investigate the existence of bus undervoltages and lines overloads when the EVs takes more than one trip and their state changes randomly. The parameters of the simulation scenarios are summarized in Table 5.
Figure 13 illustrates the state of each EV, which is determined based on the times that the EVs: (i) travel, means that the EVs consume energy from the battery banks (legend titled “On Trip” in Figure 13), (ii) are parked without being charged (legend titled “Parked” in Figure 13), and (iii) are connected to the network in order to be charged (legend titled “Charge” in Figure 13), for the four scenarios.
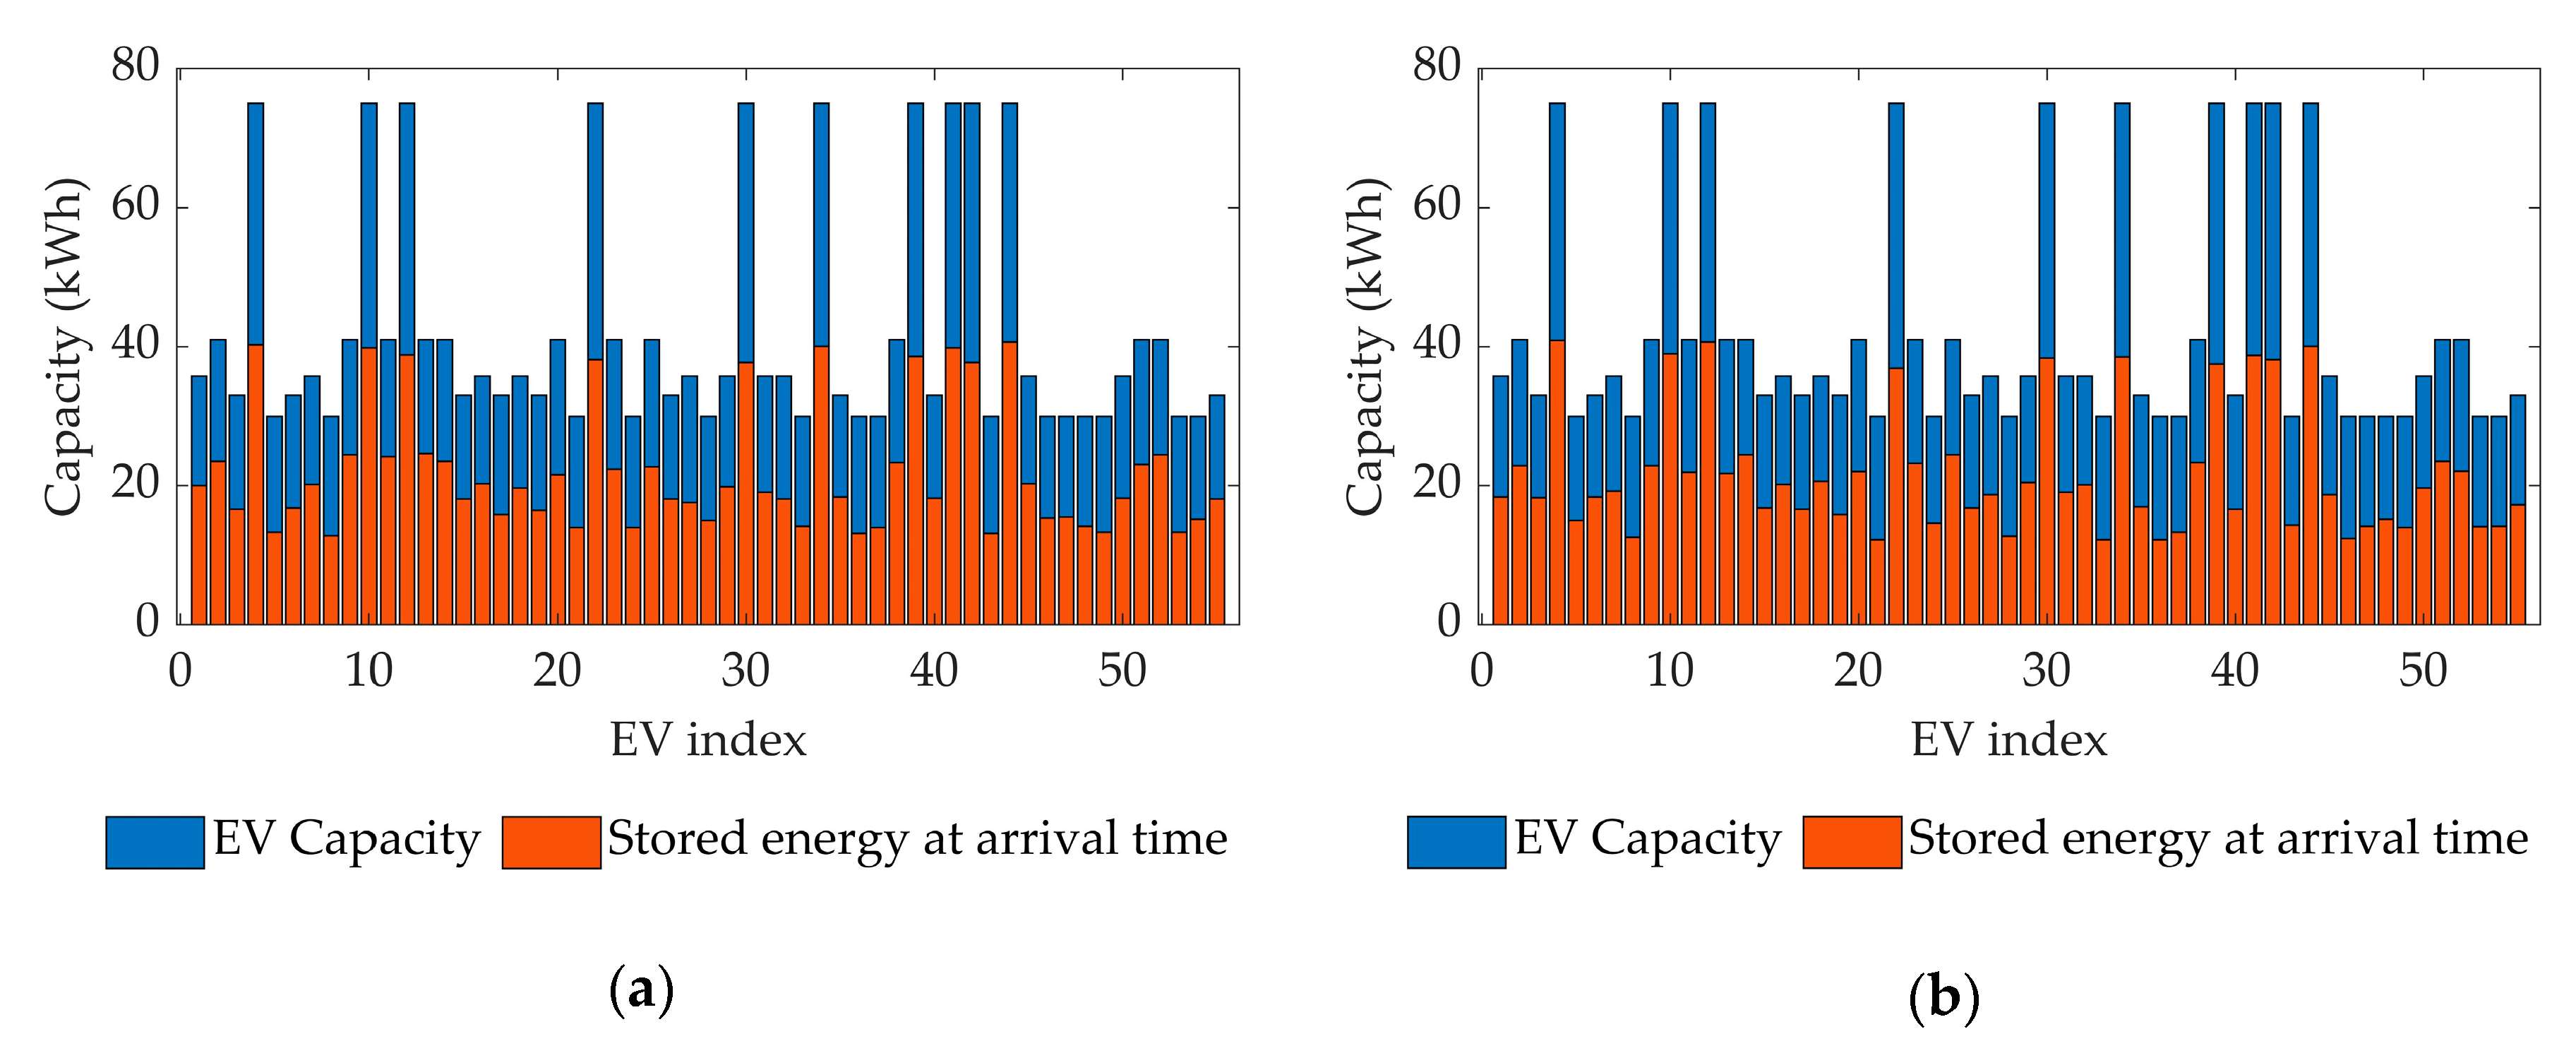
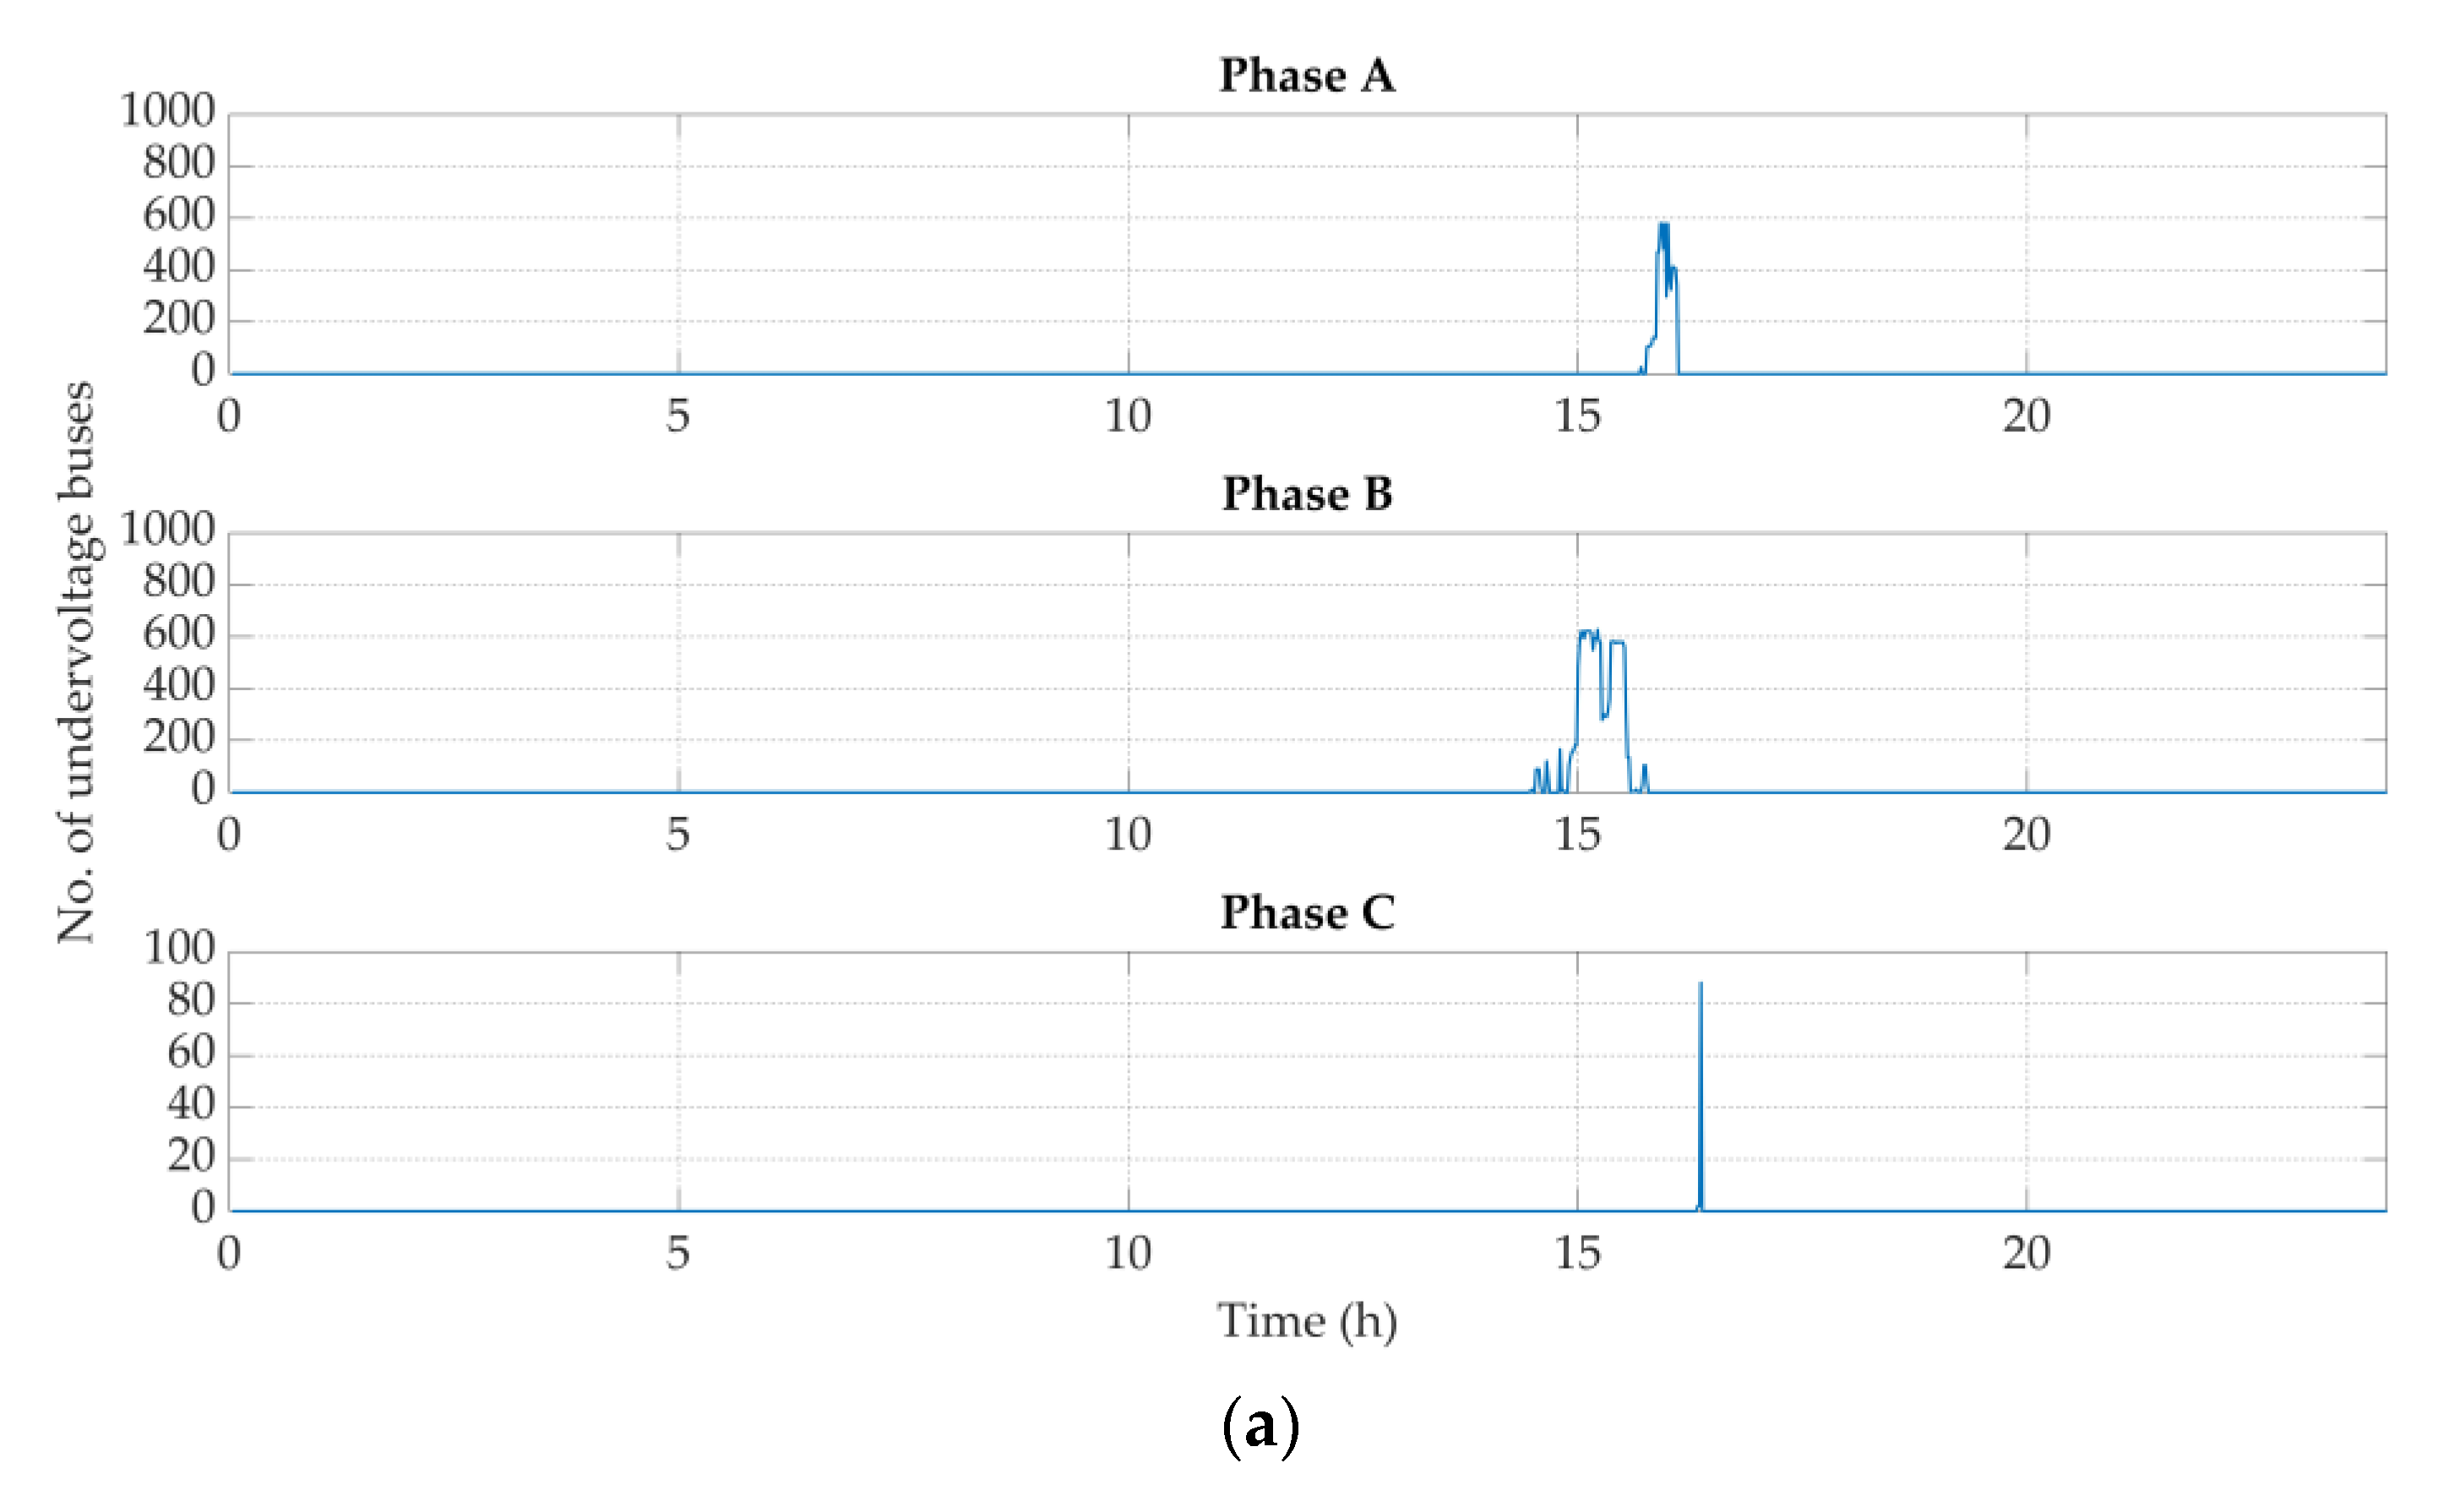
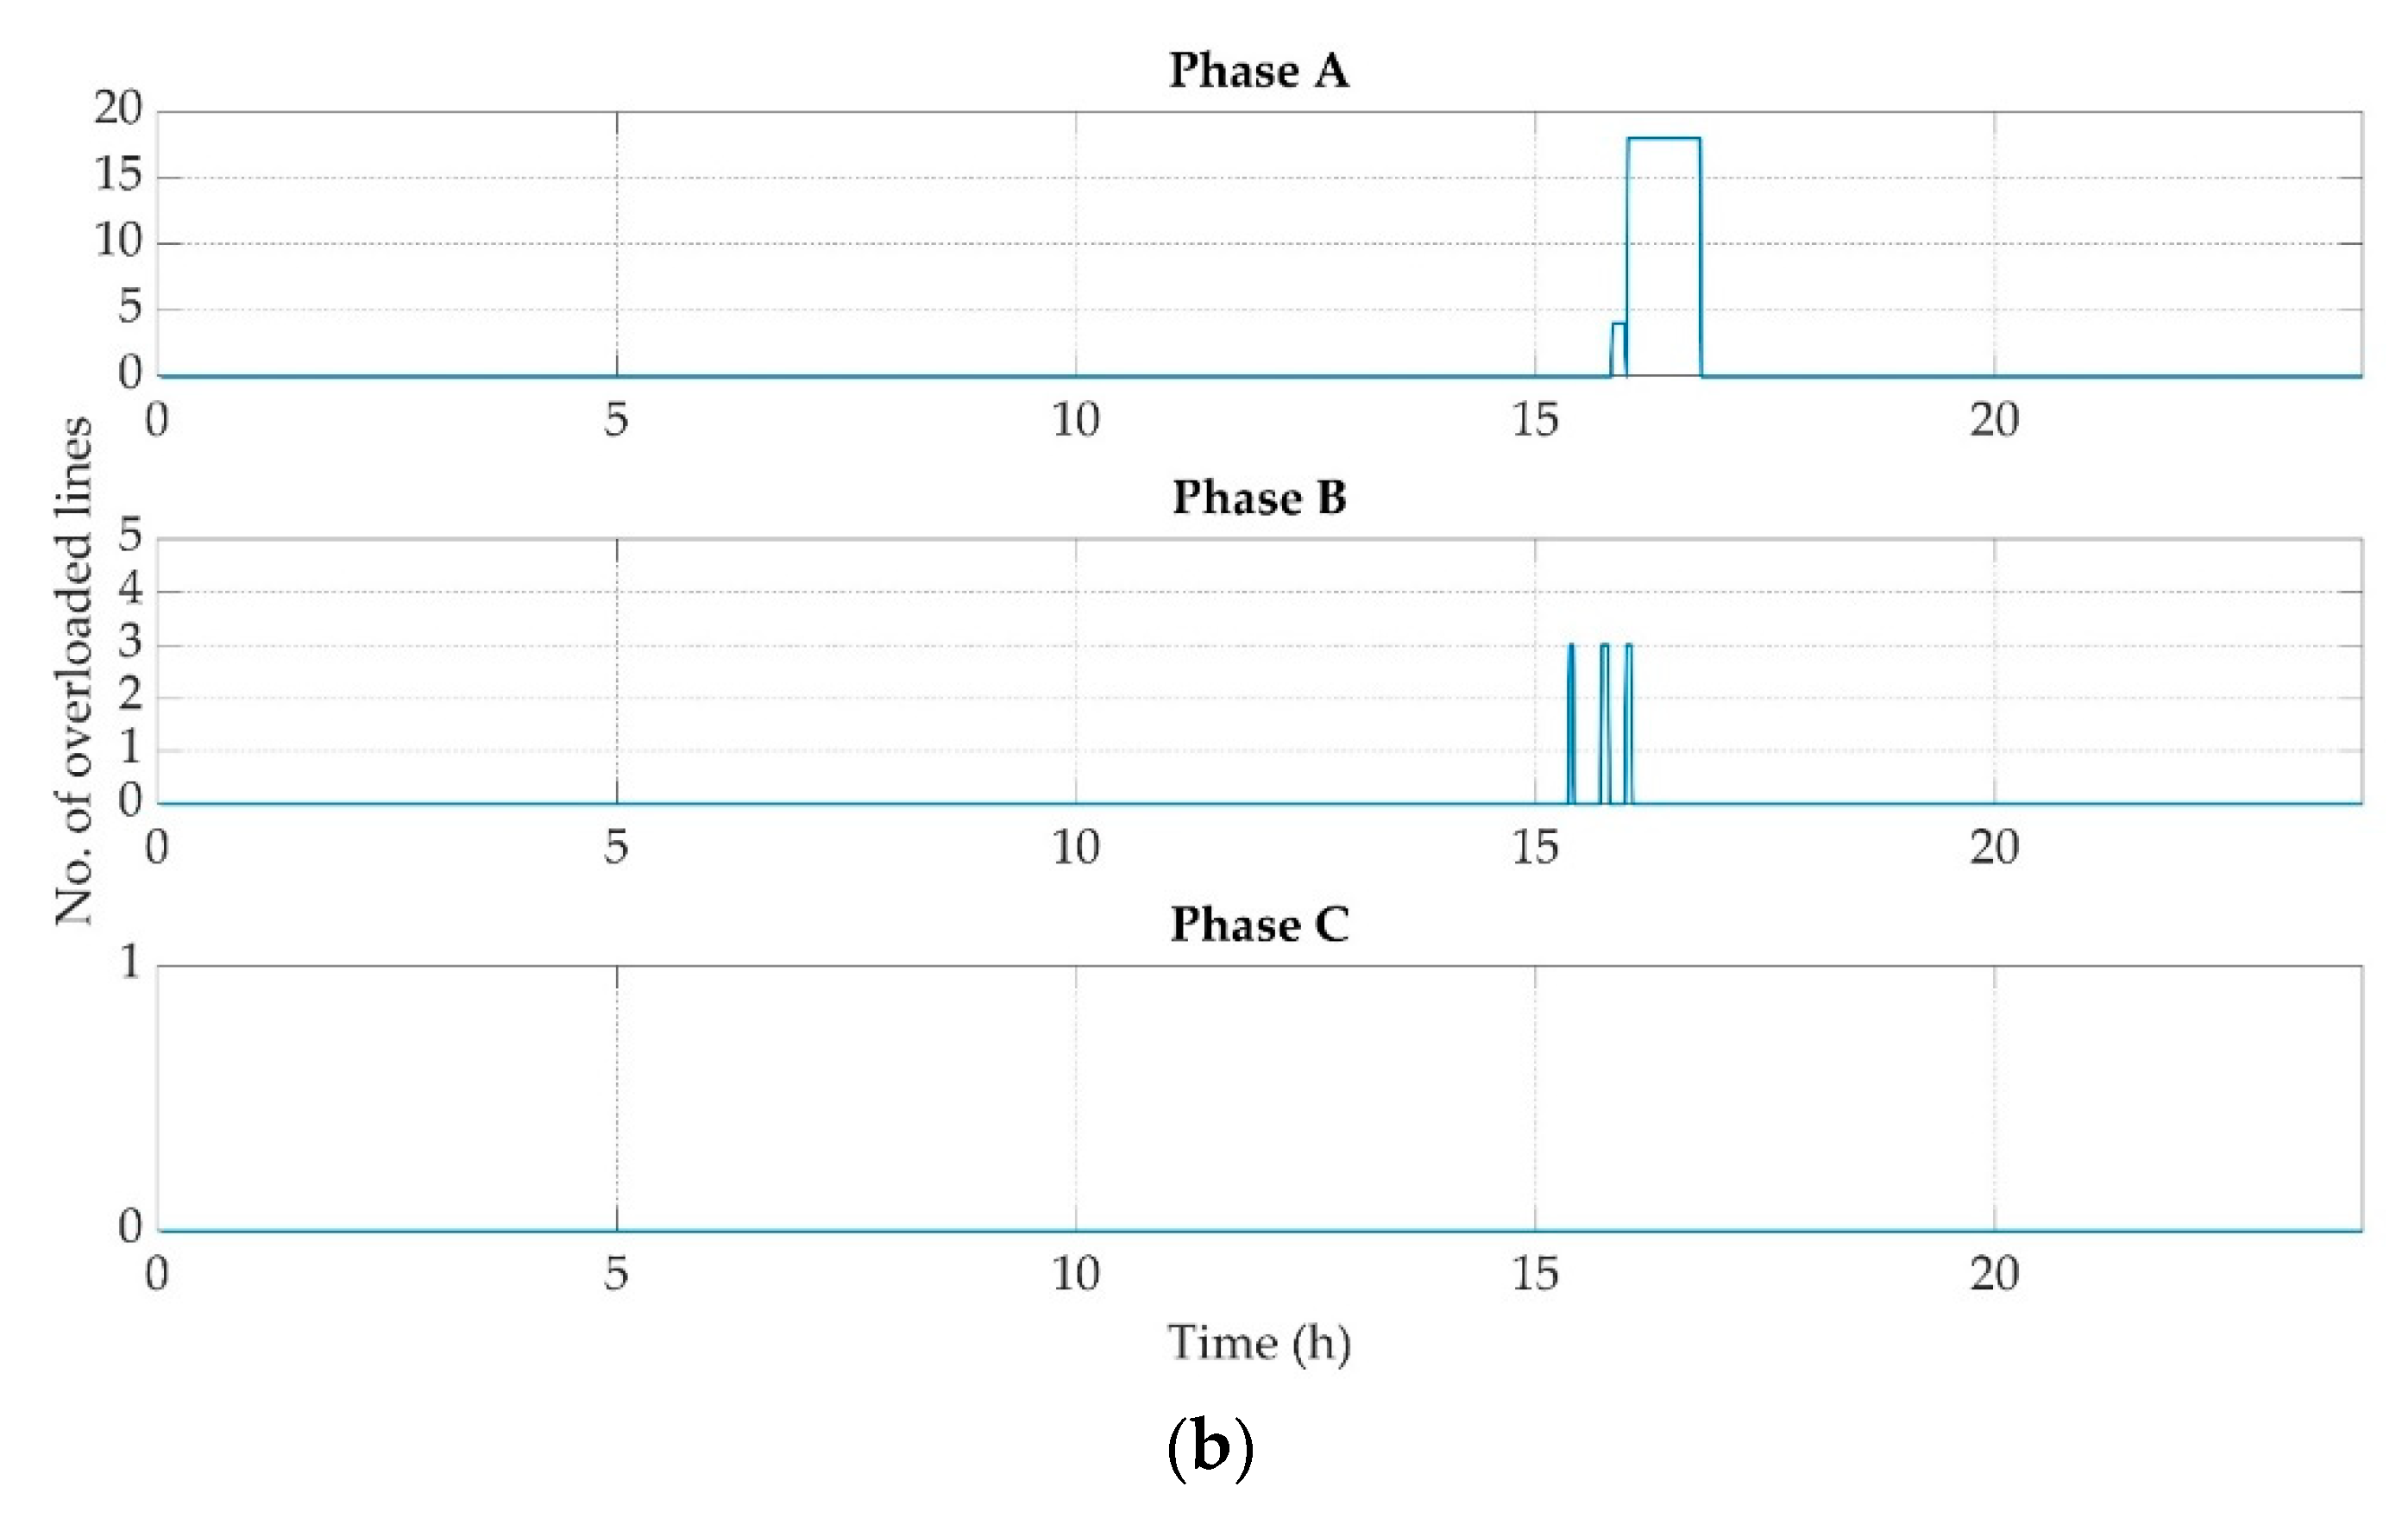
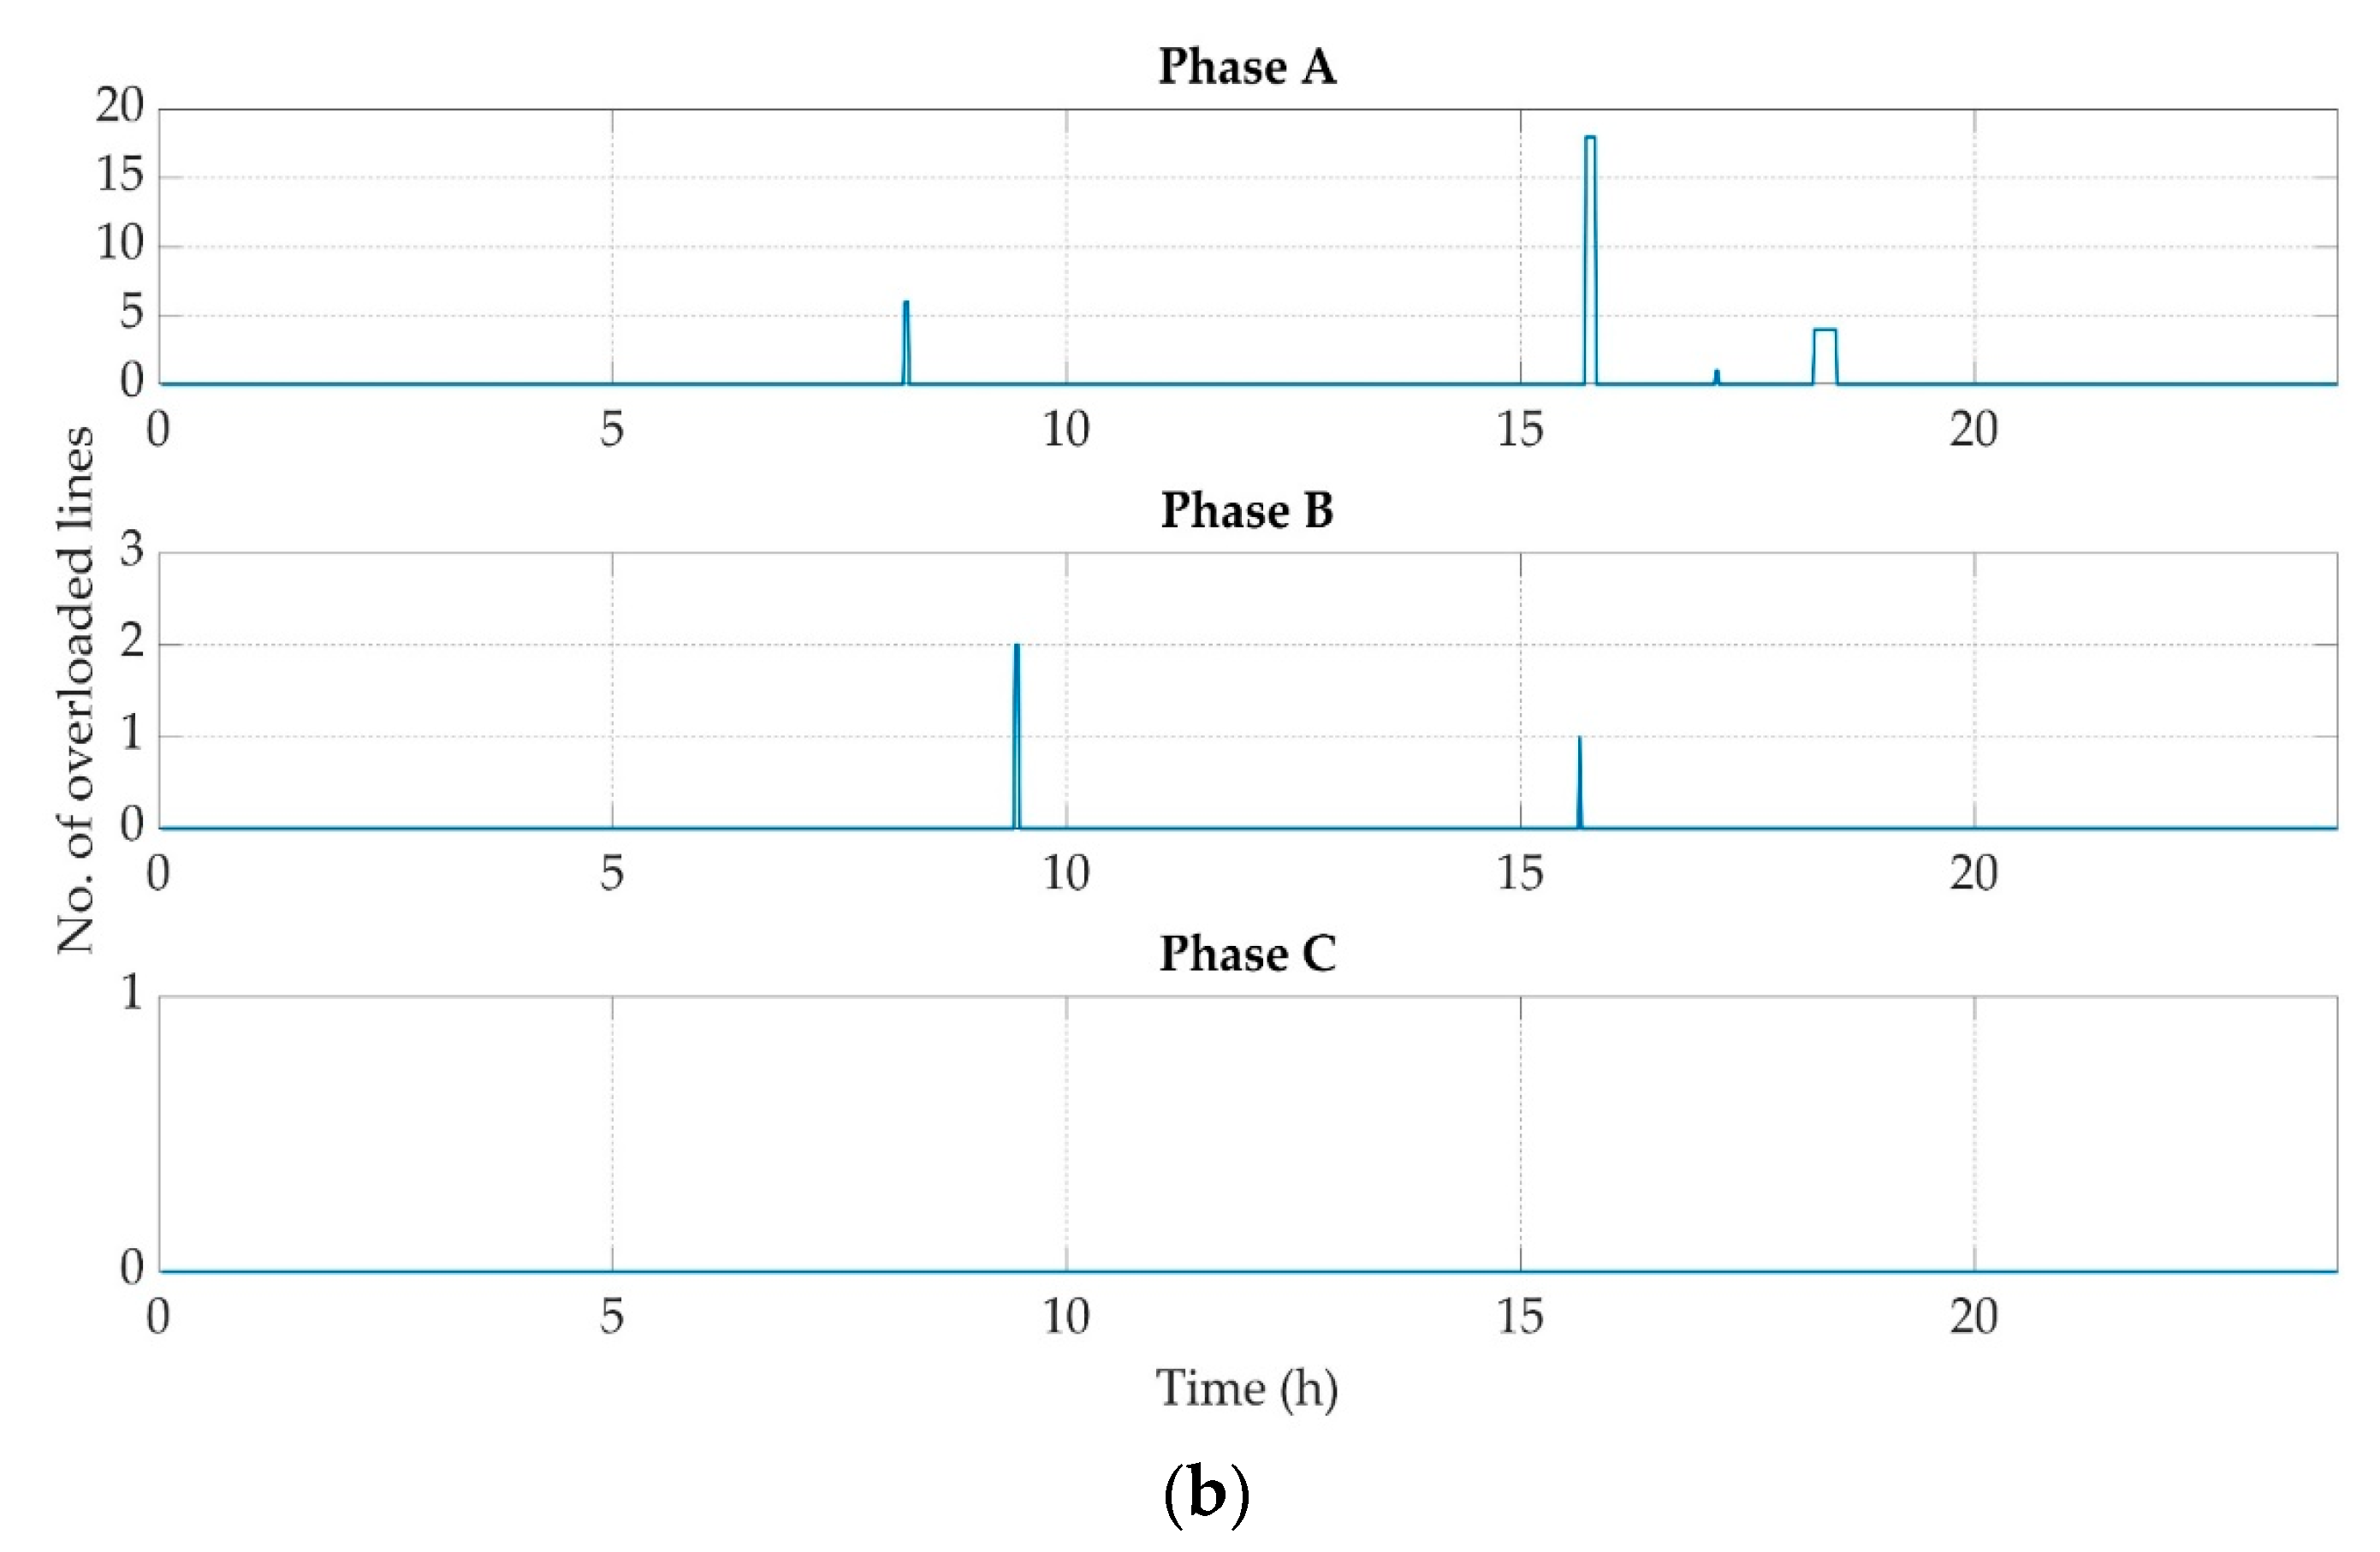
Table 6 shows the number and the model of EVs that used in the simulation scenarios. In Figure 14 the EVs’ battery capacities and the stored energy are presented, when EVs are connected to grid in order to be charged, for Scenarios 1–3. The EVs’ stored energy of Scenario 4 is not depicted, because the EVs are connected to grid, in order to be charged, more than once (multiple trips). Figure 15, Figure 16, Figure 17 and Figure 18 depict the number grid’s buses that have undervoltages and the number of the overloaded lines for each simulation scenario, respectively.
The results of Figure 15 refer to the worst-case scenario (Scenario 1), in which all EVs arrive to the charging points at the same simulation time. Figure 15a refers to the number of the system’s buses, which present undervoltages and Figure 15b to the number of the overloaded lines. The system faces voltage constraint violations at in the buses of all phases and ampacity violations at the lines of phases A and B. By examining the number of the system’s undervoltages in each phase, it is shown that the voltages of phases A and B are affected more than the voltages of the phase C. The increased number of the connected charging points lead to the increased number of voltage constraint violations in system’s buses. The system’s constraint violations exist for a time period of one hour, between 14:00 h and 15:00 h, when most of EVs are charging.
Figure 16 refers to the results of the simulation Scenario 2. In this scenario, there is a time window of two hours, in which EVs arrive at the charging points. The results show that, also in this case, voltage and ampacity violations occur. During the simulation, voltage constraint violations are observed in phases B and C, while lines of A and B suffer from overloads. The number of the affected buses and lines are reduced, as compared to Scenario 1. The system’s constraints in phase B are violated between 15:00 h and 16:00 h, while phase A suffers from overloads between 16:00 h and 17:00 h.
Scenario 3 examines the behavior of the grid, when EVs arrive at the charging points, in a time window of 4 h. The results are shown in Figure 17. In comparison with the results of Scenario 2 (Figure 16), the number of the affected lines and buses that appeared in Scenario 3 is reduced, because of the double increased time window. However, even, in this scenario, the constraints of the system are violated. Phase B is affected at 16:00 h, while in phase A, minor number of lines is overloaded at 18:00 h. The time differences of the violations in phases A and B are related to the residential energy consumption of phase A, which is increased compared to phase B, as shown in Figure 4a,b, respectively.
Figure 18 refers to the results of the Scenario 4. The aim of this scenario is to examine the occurrence of grid’s constraints violations in a random scenario, in which EVs take more than one trip. Even in a randomly change of EVs state, the grid is facing voltage constraint violations and overloads.

4. Fuzzy Charging Management System

4.1. Overview

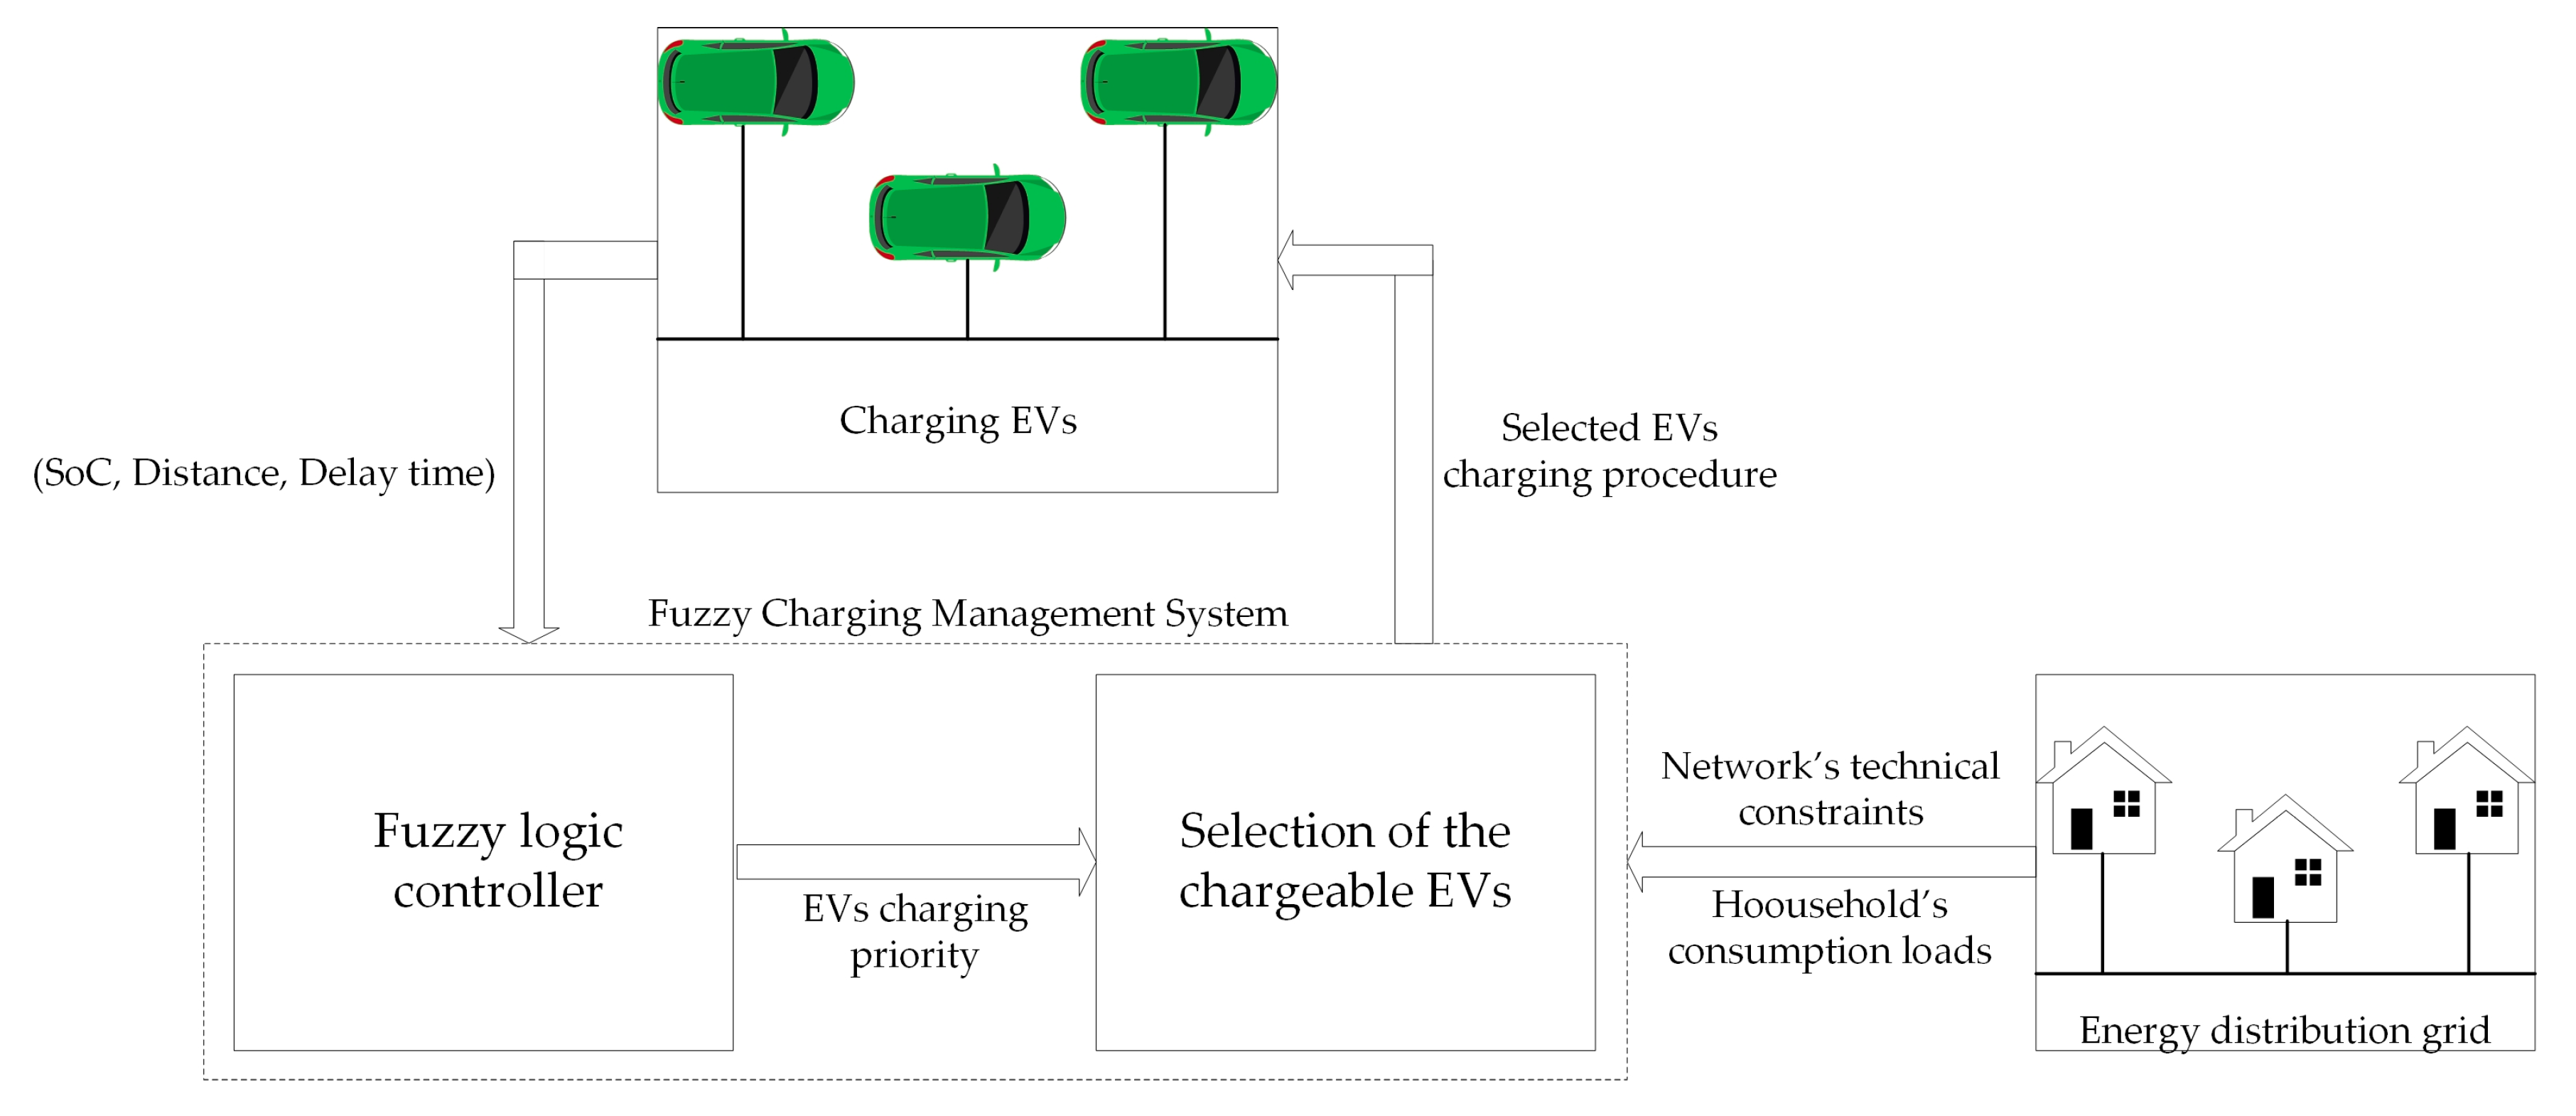
In the previous section, it was clearly demonstrated that the location and the distance of the charging EVs from the network’s Medium Voltage to Low Voltage (MV/LV) transformer has a significant impact on the grid’s stability. This fact imposes the necessity to take into consideration the connection location of each charging vehicle to the grid and its distance from the substation. In this section, a charging priority system for the coordination of EVs, when the distribution system cannot support all the vehicles, is proposed. The aim of the designed fuzzy CEMS is to define the charging priority of each EV in order to select the number of EVs, which can be charged and to select the EVs, which will be charged based on their charging priority and with respect to the network’s constraints. The flowchart of the proposed fuzzy charging management system is presented in Figure 19. Algorithm 1 presents the pseudocode for the selection of the chargeable EVs based on their charging priorities.
Algorithm 1 Selection of the Chargeable EVs
1:for each time step do
2: Get the charging priorities of the EVs from the Fuzzy Logic Controller
3: Create a list for each phase that include the EVs to be charged and sorted in an ascending order of charging priority.
4: Perform grid’s power flow analysis
5:If voltage or ampacity violation occur in a phase then
6:  Remove EV with the lowest priority from each corresponding list
7:  Return to action 3
8:else
9:  Charge the selected EVs
10:end if
11:end for

4.2. Proposed Fuzzy Interface System

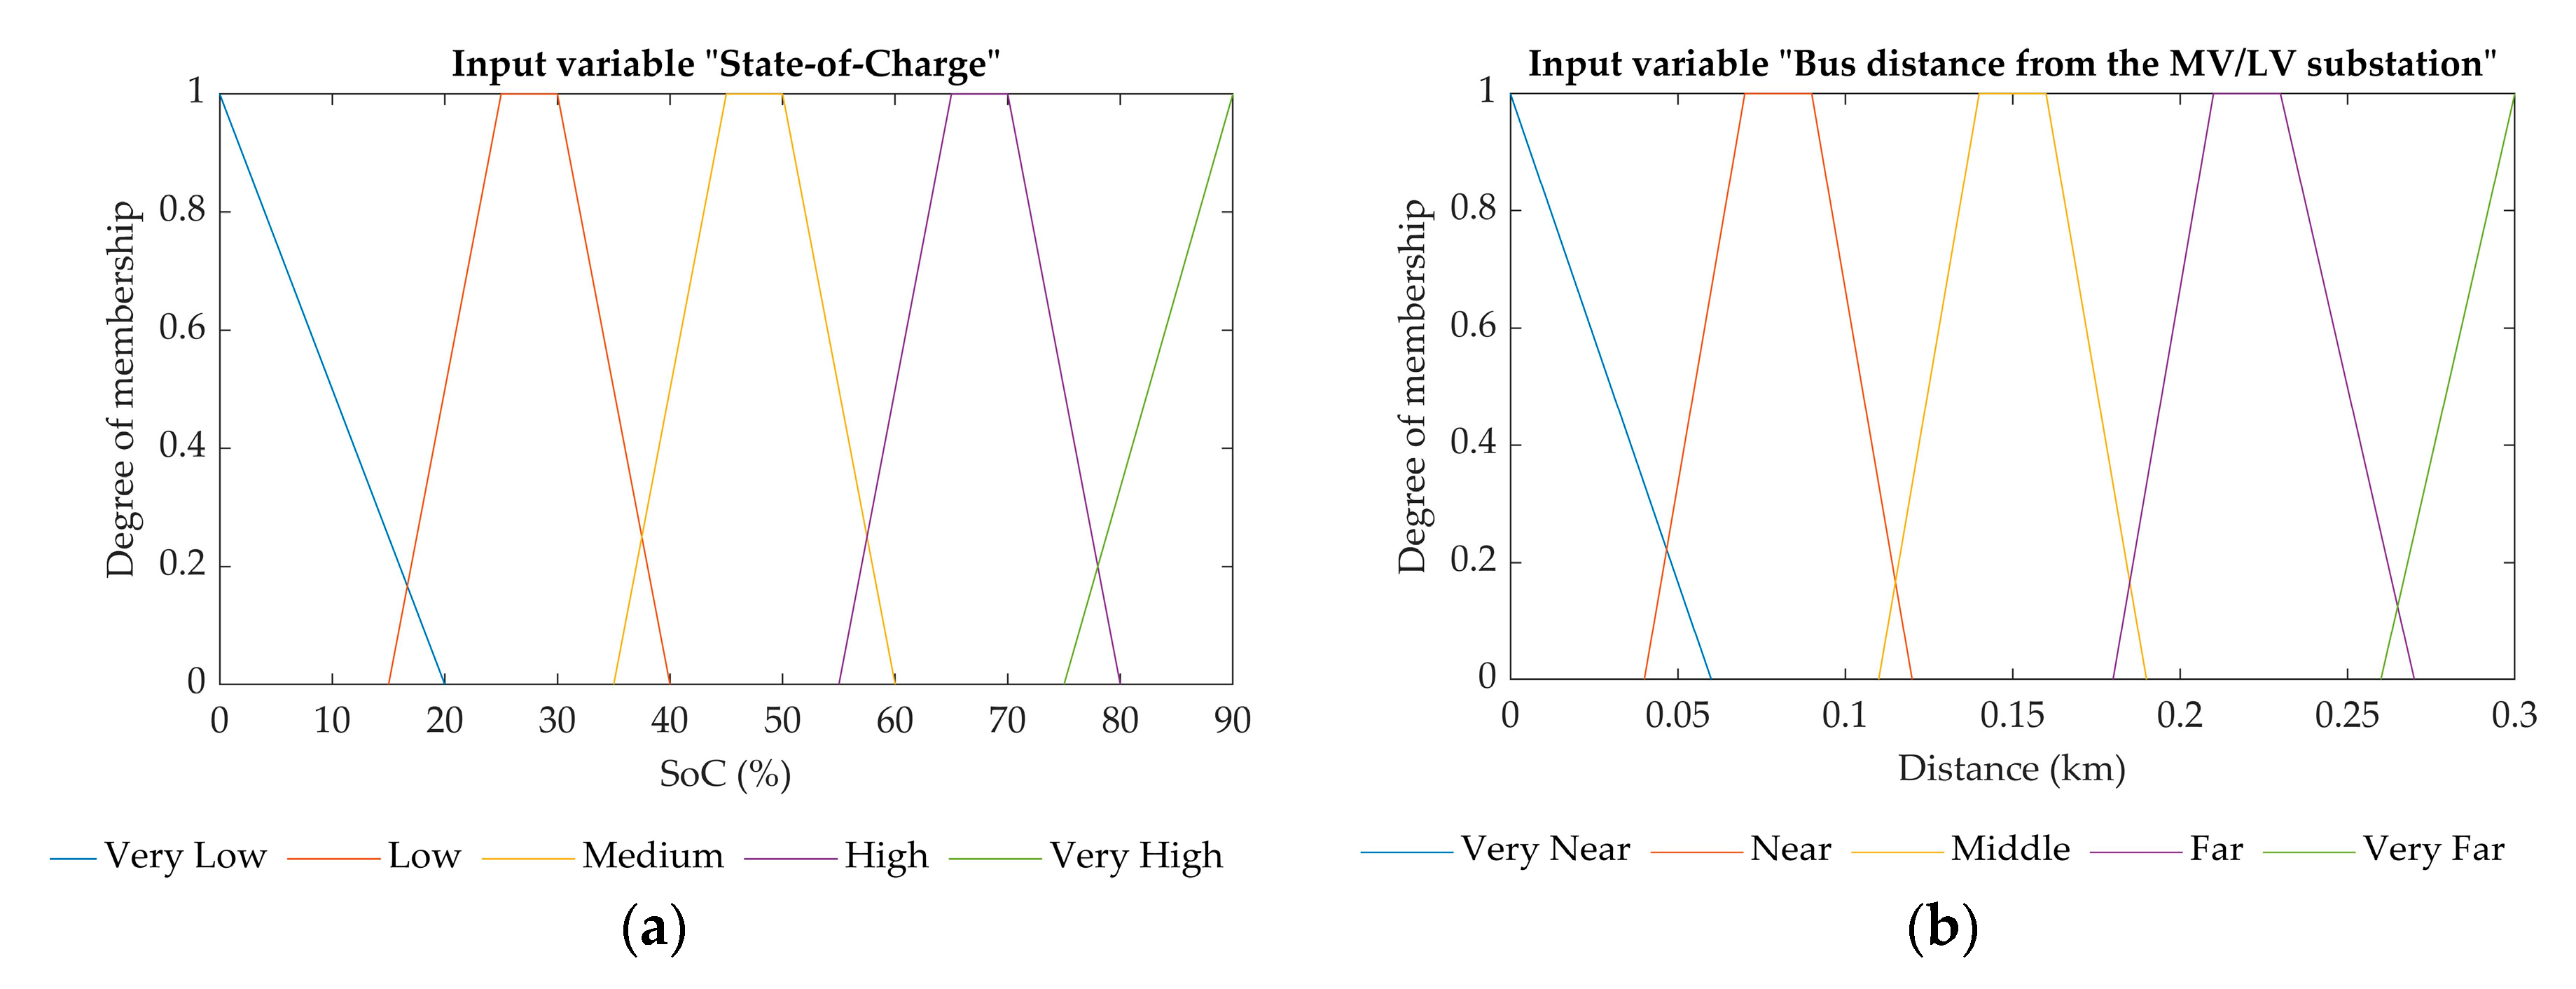
The charging priority of each EV, at each time step is calculated by a real time Mamdani type fuzzy interface controller, where its inputs are the vehicle’s battery SoC, which ranges from 20% to 90%, the delay time, in which the EV is connected to grid and waiting to charge and ranges from 0 to 60 min, and the distance of the EV’s charger from the LV grid’s substation, which ranges from 0 to 0.3 km. The sets of the aforementioned crisp input values are converted into fuzzy linguistic values, by using the input membership functions, as defined in Figure 20a–c, respectively. The output’s membership function is shown in Figure 20d. The membership functions declare the degree of membership of the considered variables in each of the fuzzy sets accordingly. The selection of the shapes and the numbers of the membership functions for the three input variables have been selected based on the experience of the research team [34,51,52]. In the proposed FIS, all the linguistic variables include five fuzzy sets, in which the left-right shoulders are triangular membership functions and the other three are trapezoidal membership functions. The same number and shape of the membership functions is applied in both input and output variables. The definition of the different considered linguistic variables of the inputs and the output membership functions are presented in Table 7.
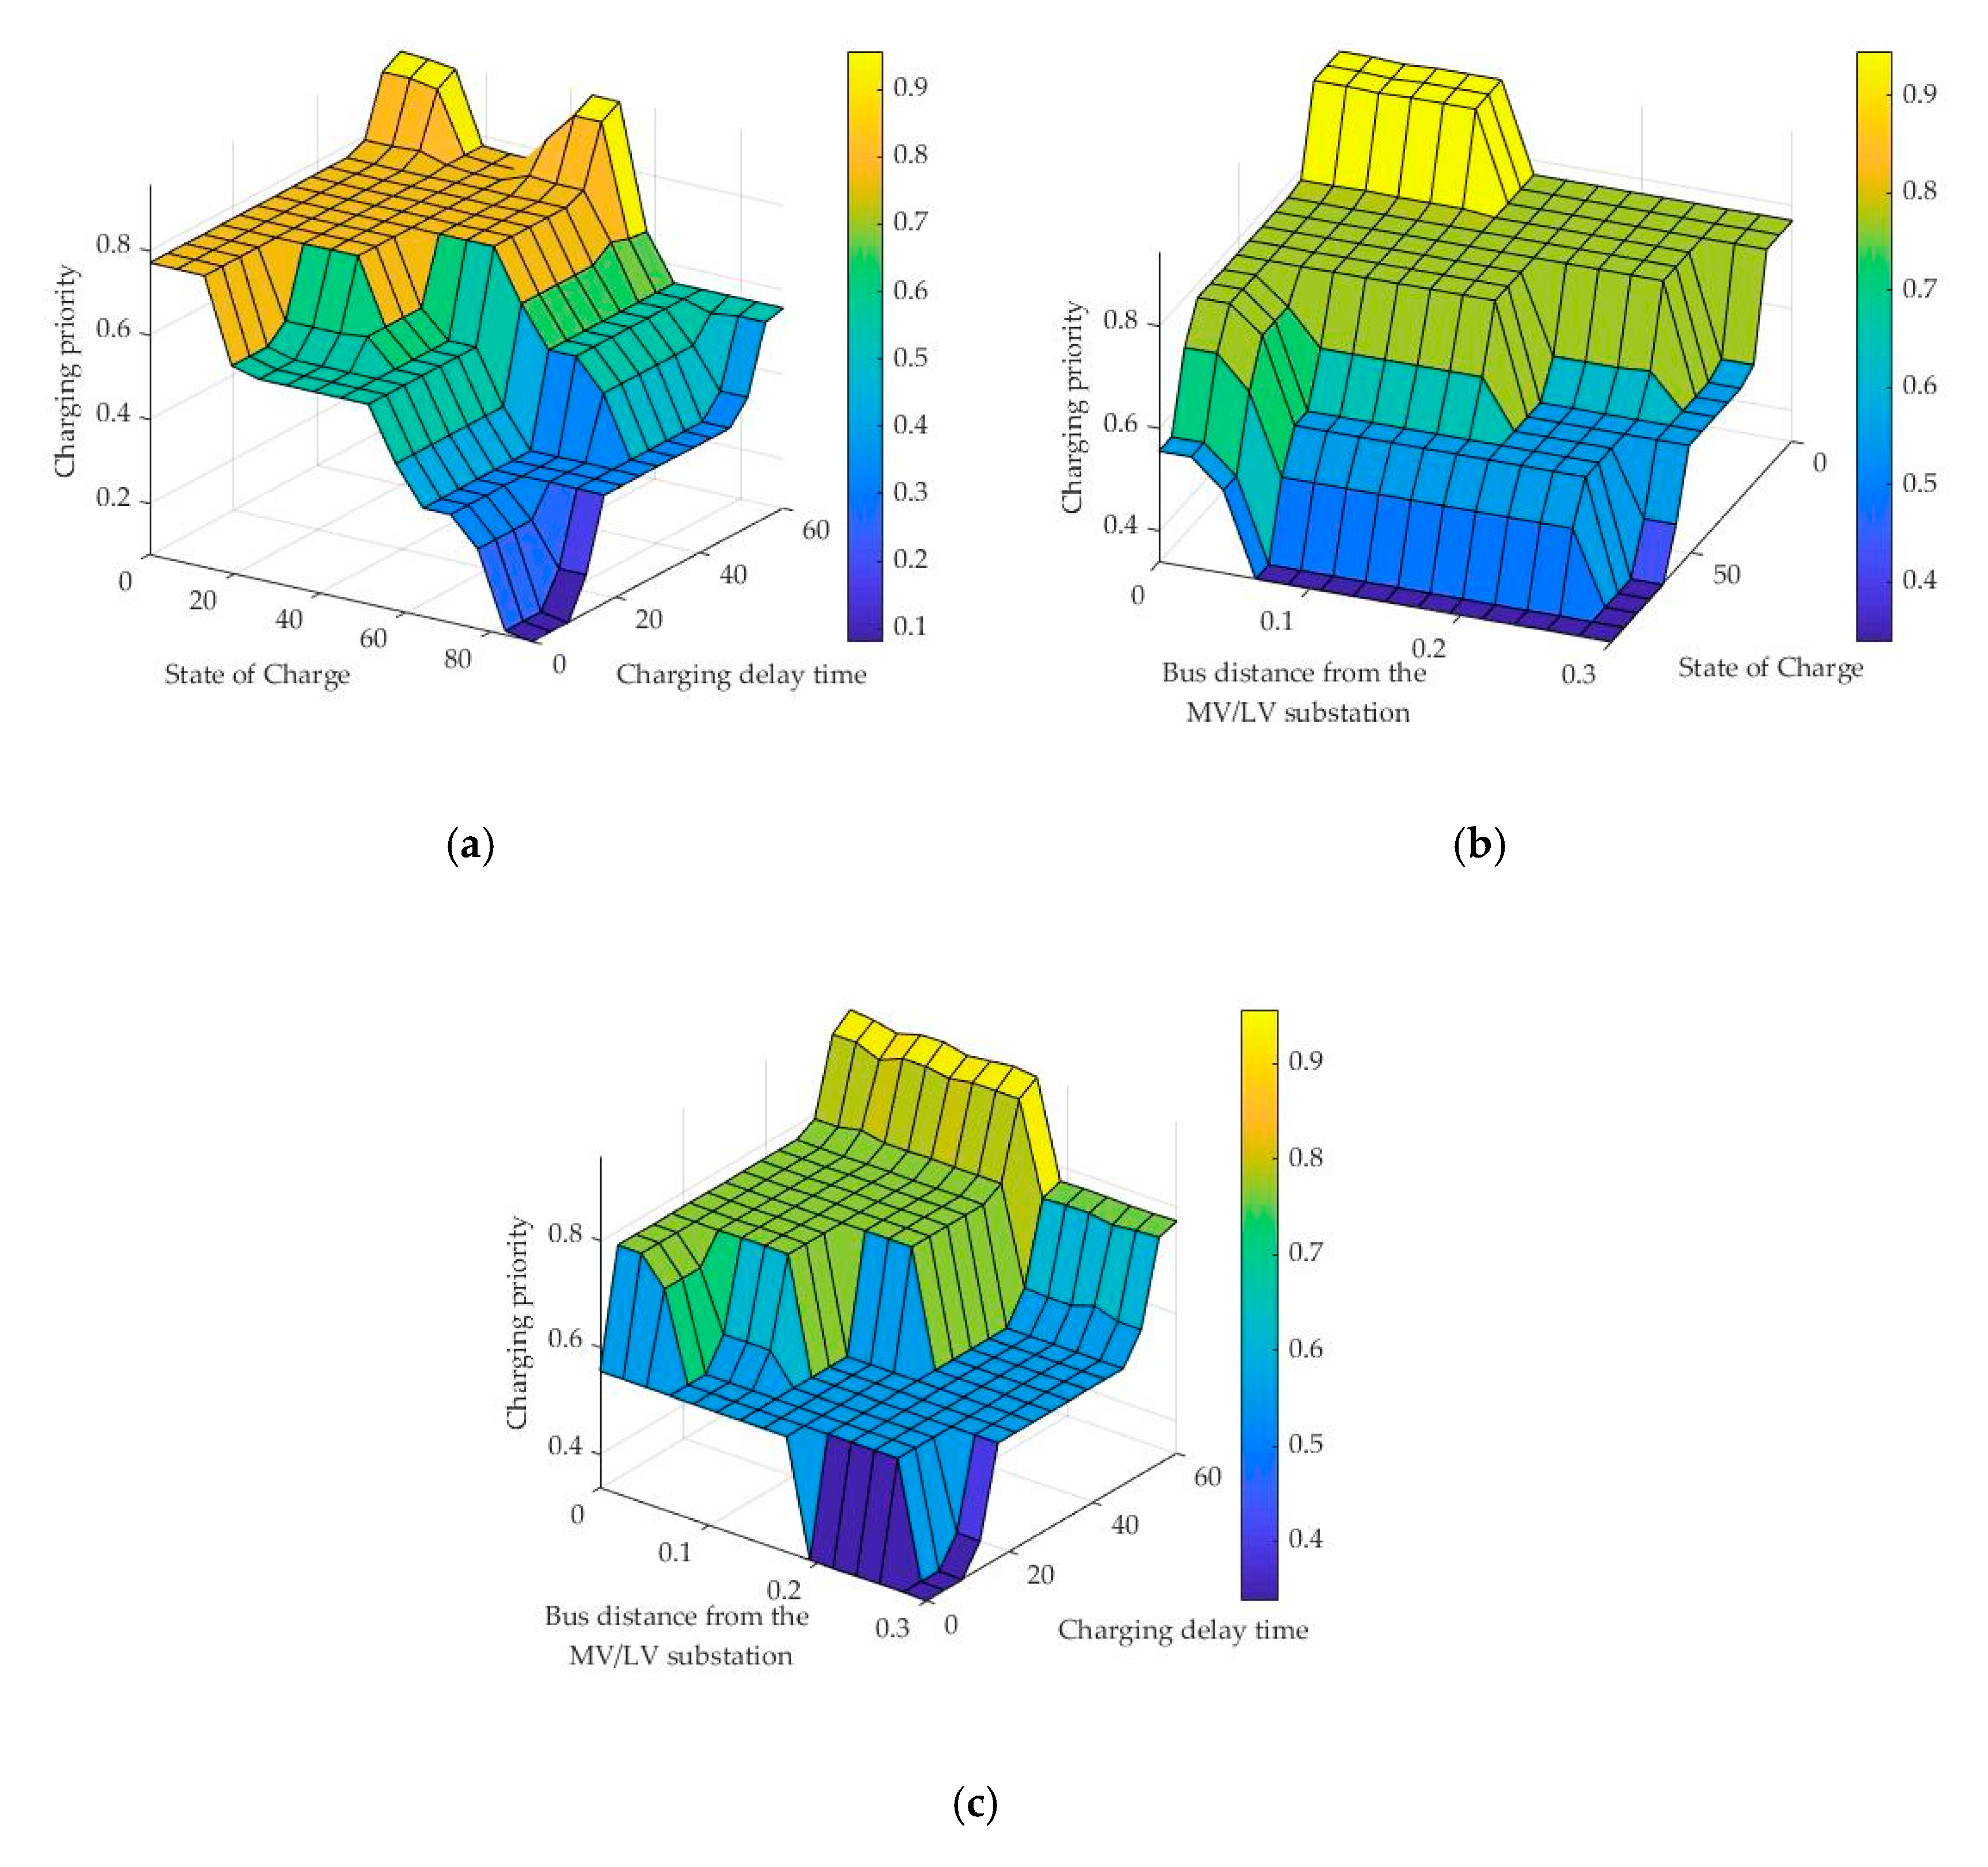
The fuzzy interface system includes the membership functions of the input variables, the membership function of the output variable and the set of the fuzzy rules. The fuzzy rules map the linguistic input variables (SoC, distance, delay time) to the output variable by using a list of IF-THEN statements. In the present FIS, there are three linguistic inputs, each one with five levels. Hence, 125 fuzzy rules have been defined. Table 8, Table 9, Table 10, Table 11 and Table 12 present the fuzzy rules in matrix form, for each EVs’ distance fuzzy state, respectively. The rules for each of the routines were developed based on the knowledge and experience of the members of the research team [34,51,52,53]. It is clear that a given set of the input linguistic values may enable several fuzzy rules at the same time. The linguistic inputs of the SoC, the distance and the charging delay time are combining together in order to establish a rule strength for each fuzzy rule. In order to calculate the charging priority linguistic value, from the several consequents of the fuzzy rules, the min-max aggregation method has been used. The decision surfaces of the proposed FIS are presented in Figure 21. The surfaces are three-dimensional curves that represent the mapping from inputs to output, taking into consideration the membership functions and the fuzzy rules of the system.
The charging priority of each EV is calculated based on the defuzzification process of the FIS, which converts the linguistic charging priority variable, as extracted from the fuzzy interface system, into a numerical value, which ranges from 0 to 1. The defuzzification of the FIS is based on the center of the gravity (centroid), since it is the most suitable technique that can be applied in the application [34,51,52,53]. The EV with the highest output value gets the highest priority in order to be charged at its nominal power.

4.3. Simulation Scenarios and Results

The total developed framework is used for the examination of CEMS impact in low distribution grids and the evaluation of charging management algorithm by examining a variety of scenarios, based on the behavior and the state of EVs. In order to examine the operation of the proposed fuzzy charging algorithm the aforementioned Scenarios 1–4, as presented in Section 3.2, are considered. Figure 22 illustrates the state of each EV for each simulation scenario. The numerical results, corresponding to the times of the charging states, as presented in Figure 22, are reported in Appendix A.
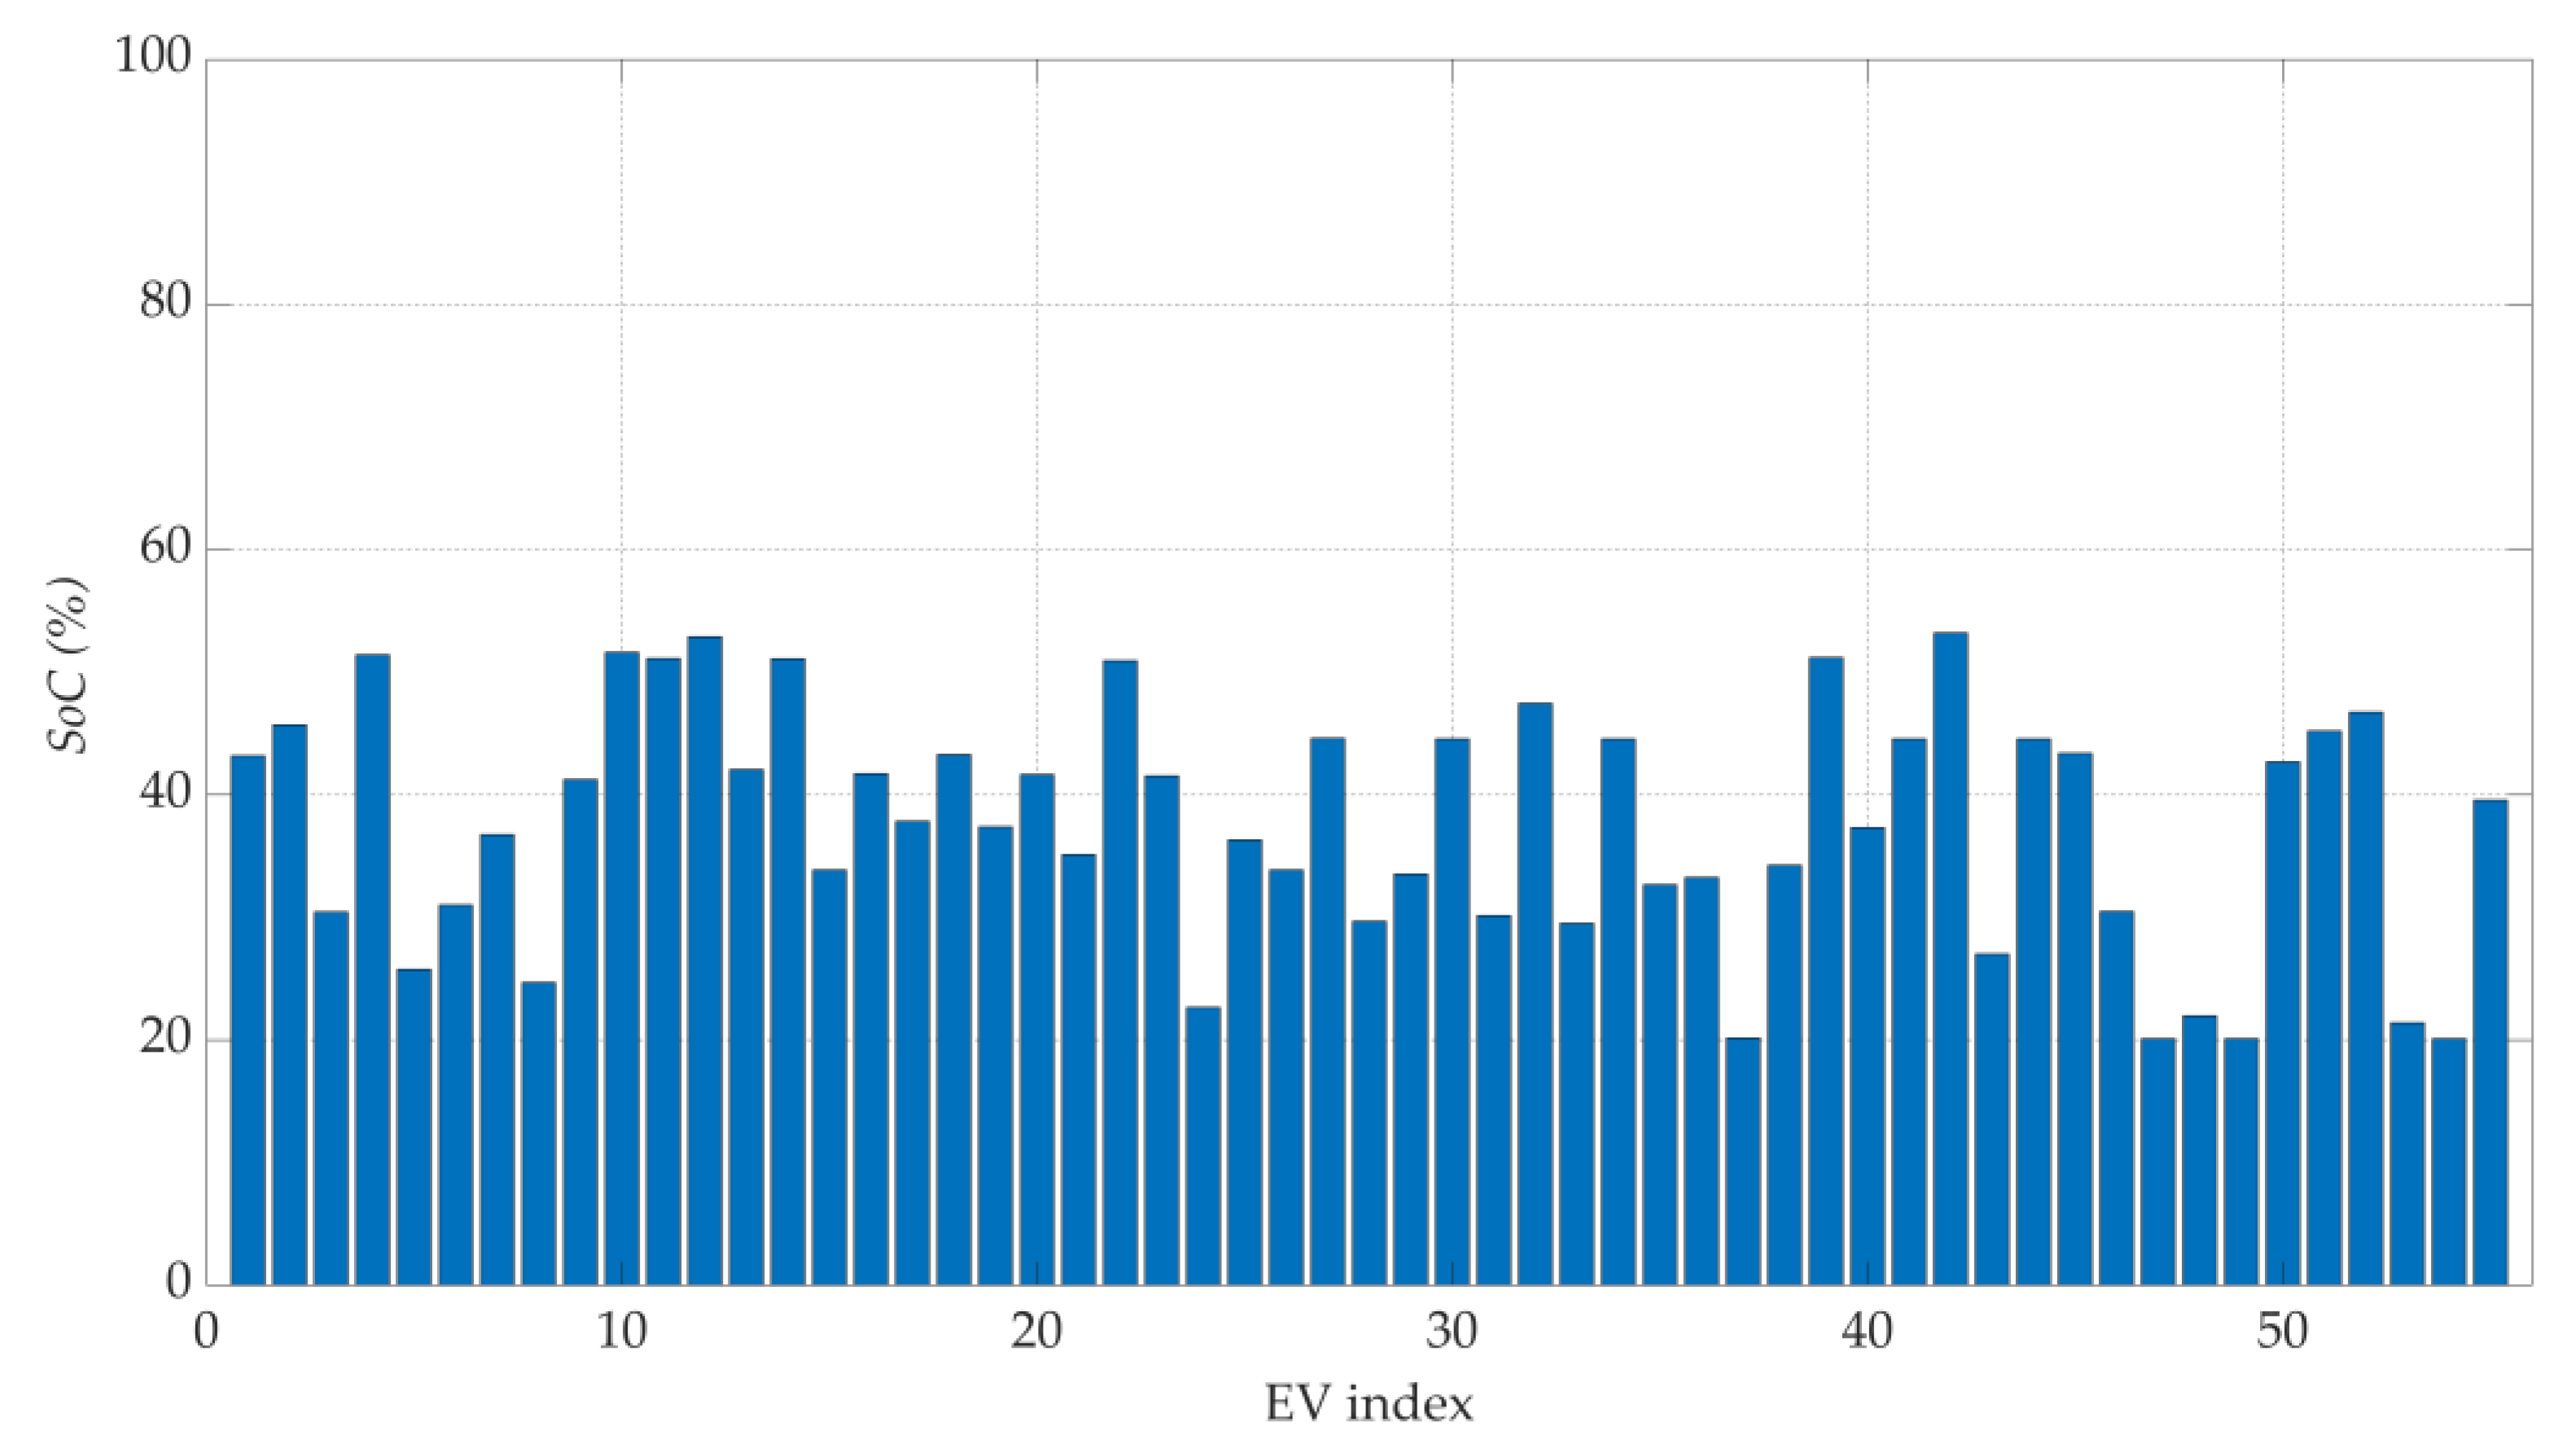
The results of Figure 22 show how the fuzzy energy management strategy affects the charging state of each EV. According to the results of Figure 22a,b most of the EVs are suffering from charging delay times because of the increased number of charging EVs, which arrive at the charging points at the same time in Scenario 1 and within a relatively small charging window of two hours in Scenario 2. On the other hand, the EVs’ charging state is also affected in Scenarios 3 and 4, although to a less extent compared to the results of Scenarios 1 and 2. Figure 23 depicts the totally simulation’s minimum values of SoC, that each EV experiences in Scenario 4.
A first approach for the evaluation of the fuzzy management strategy is based on Scenario 4, which is used in order to evaluate the operation of the proposed energy management strategy based on the capability of the EVs to travel within the scenario ranges, by keeping the batteries SoC within the manufacturers’ proposed limits. According to the Figure 23, which presents the minimum SoC of each EV’s battery in the total simulation of Scenario 4, all EVs are capable of travelling their trip distances, without battery energy issues.
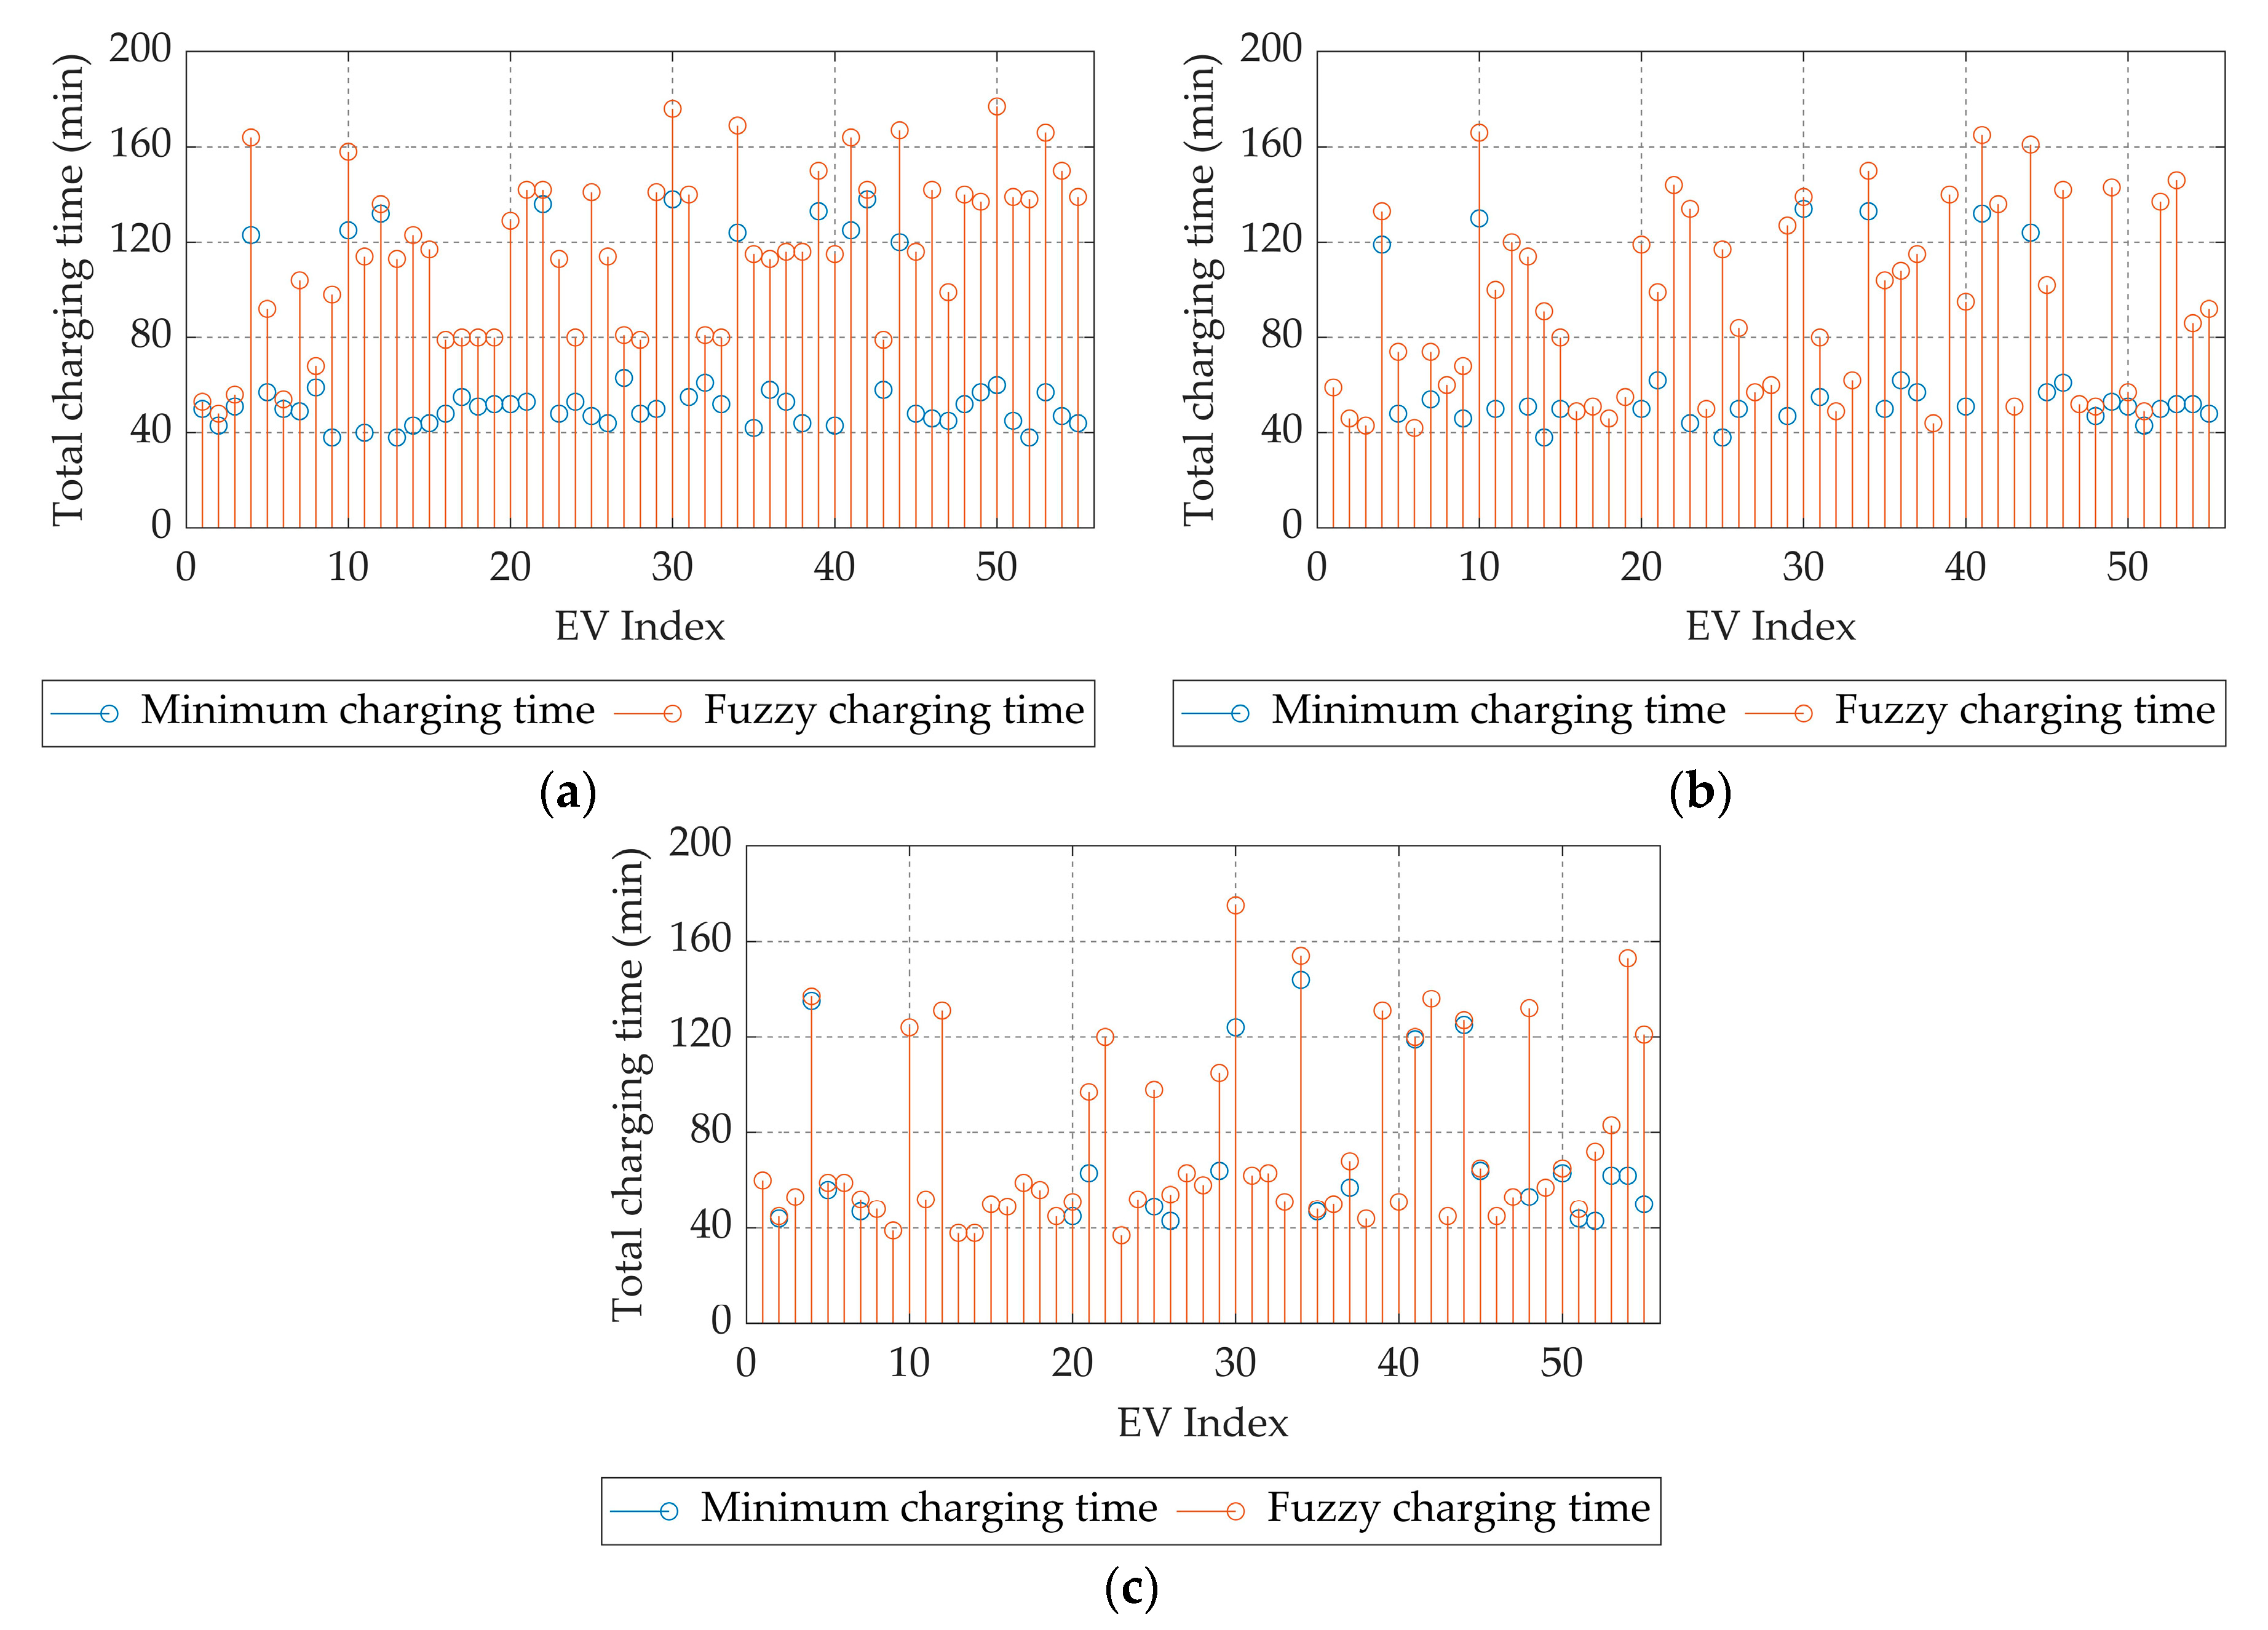
The second system’s evaluation approach focuses on the charging behavior of the EVs in simulation Scenarios 1-3 Figure 24 depicts the EVs’ charging times, based on the priorities, given by the energy management system, thus, the minimum charging times, in which EVs’ would be charged, in case that the network could support the EVs’ charging without exceeding the limits of the technical constraints. In this approach, Scenario 4 is not examined due to the randomness of EV’s state and charging times.
Let us consider, as an example, EV 50. According to the Figure 2, the charging point of this EV is one of the furthest from the grid’s substation. By examining the charging behavior in Scenario 1 (Figure 22a and Figure 24a), it is shown that the EV, when arriving at the charging point, delays longer than the other EVs, due to the fact that the distance of the charging points from the main substation is one of the key factors considered in the proposed energy management system. The EV stands for charging due to its low priority according to the fuzzy energy management system. The low SoC and the fact that the charge of this EV is delayed, urges the controller to increase the priority of the EV. Furthermore, the priority of the EVs, which are charged during the EV’s delay period, decreases. After that, the EV begins to charge. In Scenarios 2 and 3, there is a time window of two and four hours respectively, in which EVs are connected to the charging points. The EV 50 arrives at 14:40 h in Scenario 2 and at 15:35 h in Scenario 3. In this period, the EVs, which are charged, do not affect the normal operation of the distribution grid and this fact allows all the connected EVs to be charged, along with EV 50. By assessing the whole operation of the system, as depicted in Figure 24, it is evident that the distance of the charging points influences the charging time of the EVs and the factors of charging delay time as well as the SoC ensure the charging of the furthest from the substation EVs, by increasing their priorities. Moreover, by examining the results of the Scenarios 2 and 3 in Figure 22b,c it is shown that a reduced amount of EVs suffers from charging delay times, compared to the results of Scenario 1, which is depicted in Figure 24a. However, most of the EVs suffer from charging delay times.
Furthermore, the EVs’ charging times of the proposed FLC, denoted here as FLC+, are compared with a second modified FLC denoted here as FLC, in which the distance of EVs from the main substation does not taken into consideration. The FLC determines the priority of each EV, based on the EVs’ SoC and the charging delay times respectively. The SoC, charging delay time and the charging priority membership functions are the same, as considered in FLC+ (Figure 20a,c,d). The surface of the FLC is depicted in Figure 21a. The simulation results of the FLC and FLC+, for the simulation Scenarios 1, 2 and 3, are presented in Figure 25, while Table 13 reports the mean charging times in both FLC and FLC+ and the achieved mean charging time reduction in FLC+.
The results clearly show that the enable of the distance as a parameter in the FLC affects the charging behavior of the EVs in a positive way. The charging times of the EVs near the network’s substation significantly decreasing, according to Figure 25a. Despite of the significant reduction of the charging time of the EVs near the substation, the charging times of the furthest EVs, do not affected significantly, i.e. the charging time of EV 49 increases up to 30 min. in the FLC+.
Moreover, in Figure 25a–c it is shown that FLC+ allocates the charging times of EVs, better than FLC. Furthermore, the introduction of the distance in the proposed energy management system reduces the mean charging time, up to 14.7%. The consideration of the distance, as a variable in energy management systems for the coordination of EVs’ charging, seems to improve the overall EVs’ charging behavior and to reduce the EVs’ charging times.

5. Conclusions

The number of EVs in use is expected to increase significantly in future years because of the many advantages they present compared to conventional ones. In the present paper, the effects of uncontrolled charging process in a case study low voltage distribution grid were investigated and a charging coordination management strategy is proposed. The simulation results of the examined penetration scenarios indicate that the voltages in the buses of the system and the thermal limits of the lines are major limiting factors for the penetration of EVs in energy distribution networks. Thus, the distance of the charging EVs from the substation is a major factor for the definition of the maximum chargeable vehicles. The results showed that the mean utilization of chargeable EVs is up to 21.5 % greater, when the location of the charging EVs is near the substation.
Therefore, by evaluating the abovementioned results, an energy management system was developed for the coordination of EVs charging process, in low voltage distributed grids, with respect to network’s restrictions, by introducing EVs distance from the substation for the first time as a critical factor for the priority of chargeable EVs. The proposed EV charging management system lies on the fuzzy logic and takes into consideration the SoC of the charging EVs, their distance from the grid’s substation and the charging delay time. The results of the examined scenarios show that the use of the distance in the proposed fuzzy management system may reduce the EVs’ charging time up to 14.7%. Thus, in all simulation scenarios, the consideration of the EVs’ distance from the substation, influence the charging times of the EVs in a positive way, i.e. reduces the charging time of the vehicles and it leads to a better utilization of the grid’s energy sources.
Future work will concentrate on the optimization of the weights of the presented fuzzy management system, by minimizing the EVs’ charging times, and by introducing more sophisticated charging management algorithms, based on computational intelligence theories.

Author Contributions

Conceptualization, V.B., C.-S.K., K.A and A.K.; methodology, V.B., C.-S.K, K.A and A.K.; formal analysis, investigation, V.B. and C.-S.K; writing—original draft preparation, V.B., C.-S.K, K.A and A.K.; validation, V.B., C.-S.K., K.A. and A.K.; writing—review and editing, V.B., C-S.K., K.A. and A.K. All authors have read and agreed to the published version of the manuscript.

Funding

This research received no external funding.

Conflicts of Interest

The authors declare no conflict of interest.

Appendix A

Appendix A presents numerical values of EVs’ charging times in FLC+ controlled charging. Table A1 reports the charging and stand-by times for each EV and for each simulation scenario respectively, when the fuzzy priority management system is applied. Tstand-by refers to the total stand-by time, in which EVs are connected to the charging points, in order to be charged, but they are waiting due to the low priority they have. Tcharging refers to the charging times, in which EVs are connected to the charging points and are charged. Ttotal refers to the total charging time of EVs, including the overall stand-by and charging times.
Table A1. Numerical values of charging and stand-by times for each EV and for each simulation scenario in FLC+ controlled charging.
Scenario 1Scenario 2Scenario 3Scenario 4
EV IndexTstand-by
(min)
Tcharging
(min)
Ttotal
(min)
Tstand-by
(min)
Tcharging
(min)
Ttotal
(min)
Tstand-by
(min)
Tcharging
(min)
Ttotal
(min)
Tstand-by
(min)
Tcharging
(min)
Ttotal
(min)
13505305959060600141141
25434804646144451118119
35515604343053530134134
4411231641411913321351376233239
5355792264874356590126126
64505404242059590134134
75549104205474547520206206
89596806060048480222222
96038982246680393920172192
10331251583613016601241240309309
11744011450501000525284151235
124132136012012001311310233233
13753811363511140383833118151
14804312353389103838102145247
1573441173050800505059134193
1631487904949049490141141
1725558005151059590175175
1829518004646056560185185
1928528005555045450200200
20775212969501196455112161173
218953142376299346397106126232
2261361420144144012012068312380
2365481139044134037370118118
2427538005050052520126126
259447141793811749499811118129
26704411434508411435431134165
2718638105757063630193193
2831487906060058580216216
2991501418047127416410555141196
303813817651341395112417525233258
31855514025558006262128141269
3220618104949063630187187
3328528006262051510126126
3445124169171331501014415486233319
3573421155450104147480202202
36555811346621080505013126139
37605311358571151157688126134
387244116044440444458118176
3917133150014014001311310233233
4072431154451950515117192209
41391251643313216511191204233237
424138142013613601361360299299
4321587905151045450126126
444712016737124161212512746233279
45684811645571021646570178248
469646142816114204545102208310
4749459405252053530126126
48885214044751795313225235260
49805713790531430575748238286
501176017765157263650141141
519445139643494444852118170
5210038138875013729437225118143
531095716694521462108335126161
5410347150345286916215351240291
559544139444892715012159160219
The EVs’ charging times (Tcharging) is the same in uncontrolled and FLC+ controlled charging.

References

  1. Darabi, Z.; Ferdowsi, M. Impact of Plug-In Hybrid Electric Vehicles on Electricity Demand Profile. Power Syst. 2012, 53, 319–349. [Google Scholar]
  2. Un-Noor, F.; Padmanaban, S.; Mihet-Popa, L.; Mollah, M.N.; Hossain, E. A comprehensive study of key electric vehicle (EV) components, technologies, challenges, impacts, and future direction of development. Energies 2017, 10, 1217. [Google Scholar] [CrossRef] [Green Version]
  3. Sun, X.; Li, Z.; Wang, X.; Li, C. Technology Development of Electric Vehicles: A Review. Energies 2020, 13, 90. [Google Scholar] [CrossRef] [Green Version]
  4. Bilgin, B.; Magne, P.; Malysz, P.; Yang, Y.; Pantelic, V.; Preindl, M.; Korobkine, A.; Jiang, W.; Lawford, M.; Emadi, A. Making the Case for Electrified Transportation. IEEE Trans. Transp. Electrif. 2015, 1, 4–17. [Google Scholar] [CrossRef]
  5. BP. Energy Outlook, 2016 ed.; BP: London, UK, 2016; Available online: https://www.bp.com/en/global/corporate/energy-economics/energy-outlook/energy-outlook-downloads.html (accessed on 4 March 2020).
  6. IEA. Global EV Outlook; IEA: Paris, France, 2019; Available online: https://www.iea.org/reports/global-ev-outlook-2019 (accessed on 4 March 2020).
  7. European Environment Agency. Electric Vehicles and the Energy Sector—Impacts on Europe’s Future Emissions. Available online: https://www.eea.europa.eu/themes/transport/electric-vehicles/electric-vehicles-and-energy (accessed on 4 March 2020).
  8. Martinenas, S.; Knezovic, K.; Marinelli, M. Management of Power Quality Issues in Low Voltage Networks Using Electric Vehicles: Experimental Validation. IEEE Trans. Power Deliv. 2017, 32, 971–979. [Google Scholar] [CrossRef] [Green Version]
  9. Lopes, J.A.; Soares, F.J.; Almeida, M.R. Identifying management procedures to deal with connection of Electric vehicles in the grid. In Proceedings of the 2009 IEEE Bucharest PowerTech Conference, Bucharest, Romania, 28 June–2 July 2009; pp. 1–8. [Google Scholar]
  10. Zou, Y.; Zhao, J.; Gao, X.; Chen, Y.; Tohidi, A. Experimental results of electric vehicles effects on low voltage grids. J. Clean. Prod. 2020, 255, 120270. [Google Scholar] [CrossRef]
  11. Teuscher, J.; Götz, A.; Schufft, W. Electric vehicles and their effects in low-voltage grids. In Proceedings of the International Conference on Renewable Energies and Power Quality, Las Palmas de Gran Canaria, Spain, 13–15 April 2011; pp. 789–792. [Google Scholar]
  12. Held, L.; Uhrig, M.; Suriyah, M.; Leibfried, T.; Junge, E.; Lossau, S.; Konermann, M. Impact of electric vehicle charging on low-voltage grids and the potential of battery storage as temporary equipment during grid reinforcement. In Proceedings of the E-Mobility Integration Symposium, Berlin, Germany, 23 October 2017. [Google Scholar]
  13. Vanin, M.; Geth, F.; Hertem, D.V.A.N. Electric vehicles charging in unbalanced belgian low-voltage grids: A case study. In Proceedings of the CIRED Workshop, Ljubljana, Slovenia, 7–8 June 2018; p. 0495. [Google Scholar]
  14. De Hoog, J.; Thomas, D.A.; Muenzel, V.; Jayasuriya, D.C.; Alpcan, T.; Brazil, M.; Mareels, I. Electric vehicle charging and grid constraints: Comparing distributed and centralized approaches. In Proceedings of the 2013 IEEE Power & Energy Society General Meeting, Vancouver, BC, USA, 21–25 July 2013. [Google Scholar]
  15. Held, L.; Märtz, A.; Krohn, D.; Wirth, J.; Zimmerlin, M.; Suriyah, M.R.; Leibfried, T.; Jochem, P.; Fichtner, W. The Influence of Electric Vehicle Charging on Low Voltage Grids with Characteristics Typical for Germany. World Electr. Veh. J. 2019, 10, 88. [Google Scholar] [CrossRef] [Green Version]
  16. Draz, M.; Vob, M.; Freund, D.; Albayrak, S. The Impact of Electric Vehicles on Low Voltage Grids: A Case Study of Berlin. In Proceedings of the 2018 Power Systems Computation Conference (PSCC), Dublin, Ireland, 11–15 June 2018; pp. 1–7. [Google Scholar]
  17. Cao, C.; Wang, L.; Chen, B. Mitigation of the Impact of High Plug-in Electric Vehicle Penetration on Residential Distribution Grid Using Smart Charging Strategies. Energies 2016, 9, 1024. [Google Scholar] [CrossRef] [Green Version]
  18. Jochem, P.; Märtz, A.; Wang, Z. How might the German distribution grid cope with 100% market share of PEV? In Proceedings of the 31th International Electric Vehicle Symposium, EVS31, Kobe, Japan, 30 September–3 October 2018. [Google Scholar]
  19. Held, L.; Krämer, H.; Zimmerlin, M.; Suriyah, M.R.; Leibfried, T.; Ratajczak, L.; Lossau, S.; Konermann, M. Dimensioning of battery storage as temporary equipment during grid reinforcement caused by electric vehicles. In Proceedings of the 2018 53rd International Universities Power Engineering Conference (UPEC), Glasgow, UK, 4–7 September 2018. [Google Scholar]
  20. Hu, J.; Morais, H.; Sousa, T.; Lind, M. Electric vehicle fleet management in smart grids: A review of services, optimization and control aspects. Renew. Sustain. Energy Rev. 2016, 56, 1207–1226. [Google Scholar] [CrossRef] [Green Version]
  21. Lopes, J.A.P.; Soares, F.J.; Almeida, P.M.R. Integration of electric vehicles in the electric power system. Proc. IEEE 2011, 99, 168183. [Google Scholar] [CrossRef] [Green Version]
  22. Yao, L.; Damiran, Z.; Lim, W.H. A fuzzy logic based charging scheme for electric vechicle parking station. In Proceedings of the 2016 IEEE 16th International Conference on Environment and Electrical Engineering (EEEIC), Florence, Italy, 7–10 June 2016. [Google Scholar]
  23. Aswantara, I.K.A.; Ko, K.S.; Sung, D.K. A centralized EV charging scheme based on user satisfaction fairness and cost. In Proceedings of the 2013 IEEE Innovative Smart Grid Technologies—Asia (ISGT Asia), Bangalore, India, 10–13 November 2013; pp. 1–4. [Google Scholar]
  24. Saldaña, G.; San Martin, J.I.; Zamora, I.; Asensio, F.J.; Oñederra, O. Electric Vehicle into the Grid: Charging Methodologies Aimed at Providing Ancillary Services Considering Battery Degradation. Energies 2019, 12, 2443. [Google Scholar]
  25. Richardson, P.; Flynn, D.; Keane, A. Local versus centralized charging strategies for electric vehicles in low voltage distribution systems. IEEE Trans. Smart Grid 2012, 3, 1020–1028. [Google Scholar] [CrossRef]
  26. Amjad, M.; Ahmad, A.; Husain, M.; Umer, T. A review of EVs charging: From the perspective of energy optimization, optimization approaches, and charging techniques. Transp. Res. Part D 2018, 62, 386–417. [Google Scholar] [CrossRef]
  27. Urbanucci, L. Limits and potentials of Mixed Integer Linear Programming methods for optimization of polygeneration energy systems. Energy Procedia 2018, 148, 1199–1205. [Google Scholar] [CrossRef]
  28. Cai, H.; Huang, J.H.; Xie, Z.J.; Littler, T. Modelling the benefits of smart energy scheduling in micro-grids. In Proceedings of the 2015 IEEE Power & Energy Society General Meeting, Denver, CO, USA, 26–30 July 2015. [Google Scholar]
  29. Clement-Nyns, K.; Haesen, E.; Driesen, J. The impact of Charging plug-in hybrid electric vehicles on a residential distribution grid. IEEE Trans. Power Syst. 2010, 25, 371–380. [Google Scholar] [CrossRef] [Green Version]
  30. Dehdari, V.; Oliver, D.S.; Deutsch, C.V. Comparison of optimization algorithms for reservoir management with constraints—A case study. J. Pet. Sci. Eng. 2012, 100, 41–49. [Google Scholar] [CrossRef]
  31. Sarabi, S.; Kefsi, L. Electric vehicle charging strategy based on a dynamic programming algorithm. In Proceedings of the 2014 IEEE International Conference on Intelligent Energy and Power Systems (IEPS), Kiev, Ukraine, 2–6 June 2014; pp. 204–208. [Google Scholar]
  32. Pilát, M. Controlling the Charging of Electric Vehicles with Neural Networks. In Proceedings of the 2018 International Joint Conference on Neural Networks (IJCNN), Rio de Janeiro, Brazil, 8–13 July 2018. [Google Scholar]
  33. Karavas, C.S.; Kyriakarakos, G.; Arvanitis, K.G.; Papadakis, G. A multi-agent decentralized energy management system based on distributed intelligence for the design and control of autonomous polygeneration microgrids. Energy Convers. Manag. 2015, 103, 166–179. [Google Scholar] [CrossRef]
  34. Karavas, C.S.; Arvanitis, K.; Papadakis, G. A game theory approach to multi-agent decentralized energy management of autonomous polygeneration microgrids. Energies 2017, 10, 1756. [Google Scholar] [CrossRef] [Green Version]
  35. Sun, B.; Huang, Z.; Tan, X.; Tsang, D.H.K. Optimal scheduling for electric vehicle charging with discrete charging levels in distribution grid. IEEE Trans. Smart Grid 2018, 9, 624–634. [Google Scholar] [CrossRef]
  36. Ma, T.; Mohammed, O.A. Optimal charging of plug-in electric vehicles for a car-park infrastructure. IEEE Trans. Ind. Appl. 2014, 50, 2323–2330. [Google Scholar] [CrossRef]
  37. Salama, H.S.; Said, S.M.; Vokony, I.; Hartmann, B. Impact of Different Plug-in Electric Vehicle Categories on Distribution Systems. In Proceedings of the 2019 7th International Istanbul Smart Grids and Cities Congress and Fair (ICSG), Istanbul, Turkey, 25–26 April 2019; pp. 109–113. [Google Scholar]
  38. Karmaker, A.K.; Ahmed, M.R. Fuzzy Logic based Optimization for Electric Vehicle Charging Station in Bangladesh. In Proceedings of the 2019 1st International Conference on Advances in Science, Engineering and Robotics Technology (ICASERT), Dhaka, Bangladesh, 3–5 May 2019; pp. 1–5. [Google Scholar]
  39. Eajal, A.A.; Shaaban, M.F.; El-Saadany, E.F.; Ponnambalam, K. Fuzzy logic-based charging strategy for Electric Vehicles plugged into a smart grid. In Proceedings of the International Conference on Smart Energy Grid Engeineering (SEGE) 2015, Oshawa, ON, Canada, 17 August 2015. [Google Scholar]
  40. IEEE PES Distribution Systems Analysis Subcommittee Radial Test Feeders. Available online: https://site.ieee.org/pes-testfeeders/resources/ (accessed on 20 December 2019).
  41. Rivera, J.; Jacobsen, H.-A. On the Effects of Distributed Electric Vehicle Network Utility Maximization in Low Voltage Feeders. arXiv 2017, arXiv:1706.10074v1. Available online: https://arxiv.org/abs/1706.10074v1 (accessed on 20 December 2019).
  42. Hannan, M.A.; Lipu, M.S.H.; Hussain, A.; Mohamed, A. A review of lithium-ion battery state of charge estimation and management system in electric vehicle applications: Challenges and recommendations. Renew. Sustain. Energy Rev. 2017, 78, 834–854. [Google Scholar] [CrossRef]
  43. Ahmadian, A.; Mohammadi-ivatloo, B.; Elkamel, A. A Review on Plug-in Electric Vehicles: Introduction, Current Status, and Load Modeling Techniques. J. Mod. Power Syst. Clean Energy 2019, 8, 1–15. [Google Scholar]
  44. Electric Vehicle Database. Available online: Ev-database.org (accessed on 20 December 2019).
  45. Marra, F.; Yang, G.Y.; Traholt, C.; Larsen, E.; Rasmussen, C.N.; You, S. Demand profile study of battery electric vehicle under different charging options. In Proceedings of the IEEE Power Energy and Energy Society General Meeting, San Diego, CA, USA, 22–26 July 2012; pp. 1–7. [Google Scholar]
  46. Duvall, M.; Knipping, E.; Alexander, M. “Environmental assessment of plug-in hybrid electric vehicles”, Volume 1: Nationwide Greenhouse Gas Emissions. EPRI 2007, 1, 1–56. Available online: https://www.energy.gov/sites/prod/files/oeprod/DocumentsandMedia/EPRI-NRDC_PHEV_GHG_report.pdf (accessed on 20 December 2019).
  47. Katbab, A. Fuzzy logic and controller design-a review. In Proceedings of the IEEE Southeastcon ’95. Visualize the Future, Raleigh, NC, USA, 26–29 March 1995; pp. 443–449. [Google Scholar]
  48. Tai, K.; El-Sayed, A.-R.; Biglarbegian, M.; Gonzalez, C.I.; Castillo, O.; Mahmud, S. Review of Recent Type-2 Fuzzy Controller Applications. Algorithms 2016, 9, 39. [Google Scholar] [CrossRef] [Green Version]
  49. Dugan, R.C.; Montenegro, D.; Ballanti, A. “Reference Guide: The Open Distribution System Simulator (OpenDSS)”, EPRI Tech, Rep. March 2018. Available online: https://dokumen.tips/download/link/reference-guide-the-open-distribution-manual-program-revision-76-march (accessed on 20 December 2019).
  50. Dugan, R.C.; McDermott, T.E. An open source platform for collaborating on smart grid research. In Proceedings of the IEEE Power & Energy Society General Meeting, Detroit, MI, USA, 24–29 July 2011. [Google Scholar]
  51. Karavas, C.S.; Arvanitis, K.G.; Papadakis, G. Optimal technical and economic configuration of photovoltaic powered reverse osmosis desalination systems operating in autonomous mode. Desalination 2019, 466, 97–106. [Google Scholar] [CrossRef]
  52. Petropoulos, S.; Karavas, C.S.; Balafoutis, A.T.; Paraskevopoulos, I.; Kallithraka, S.; Kotseridis, Y. Fuzzy logic tool for wine quality classification. Comput. Electron. Agric. 2017, 142, 552–562. [Google Scholar] [CrossRef]
  53. Kasabov, N. Evolving fuzzy neural networks—Algorithms, applications and biological motivation. Methodol. Concept. Des. Appl. Soft Comput. 1998, 1, 271–274. [Google Scholar]
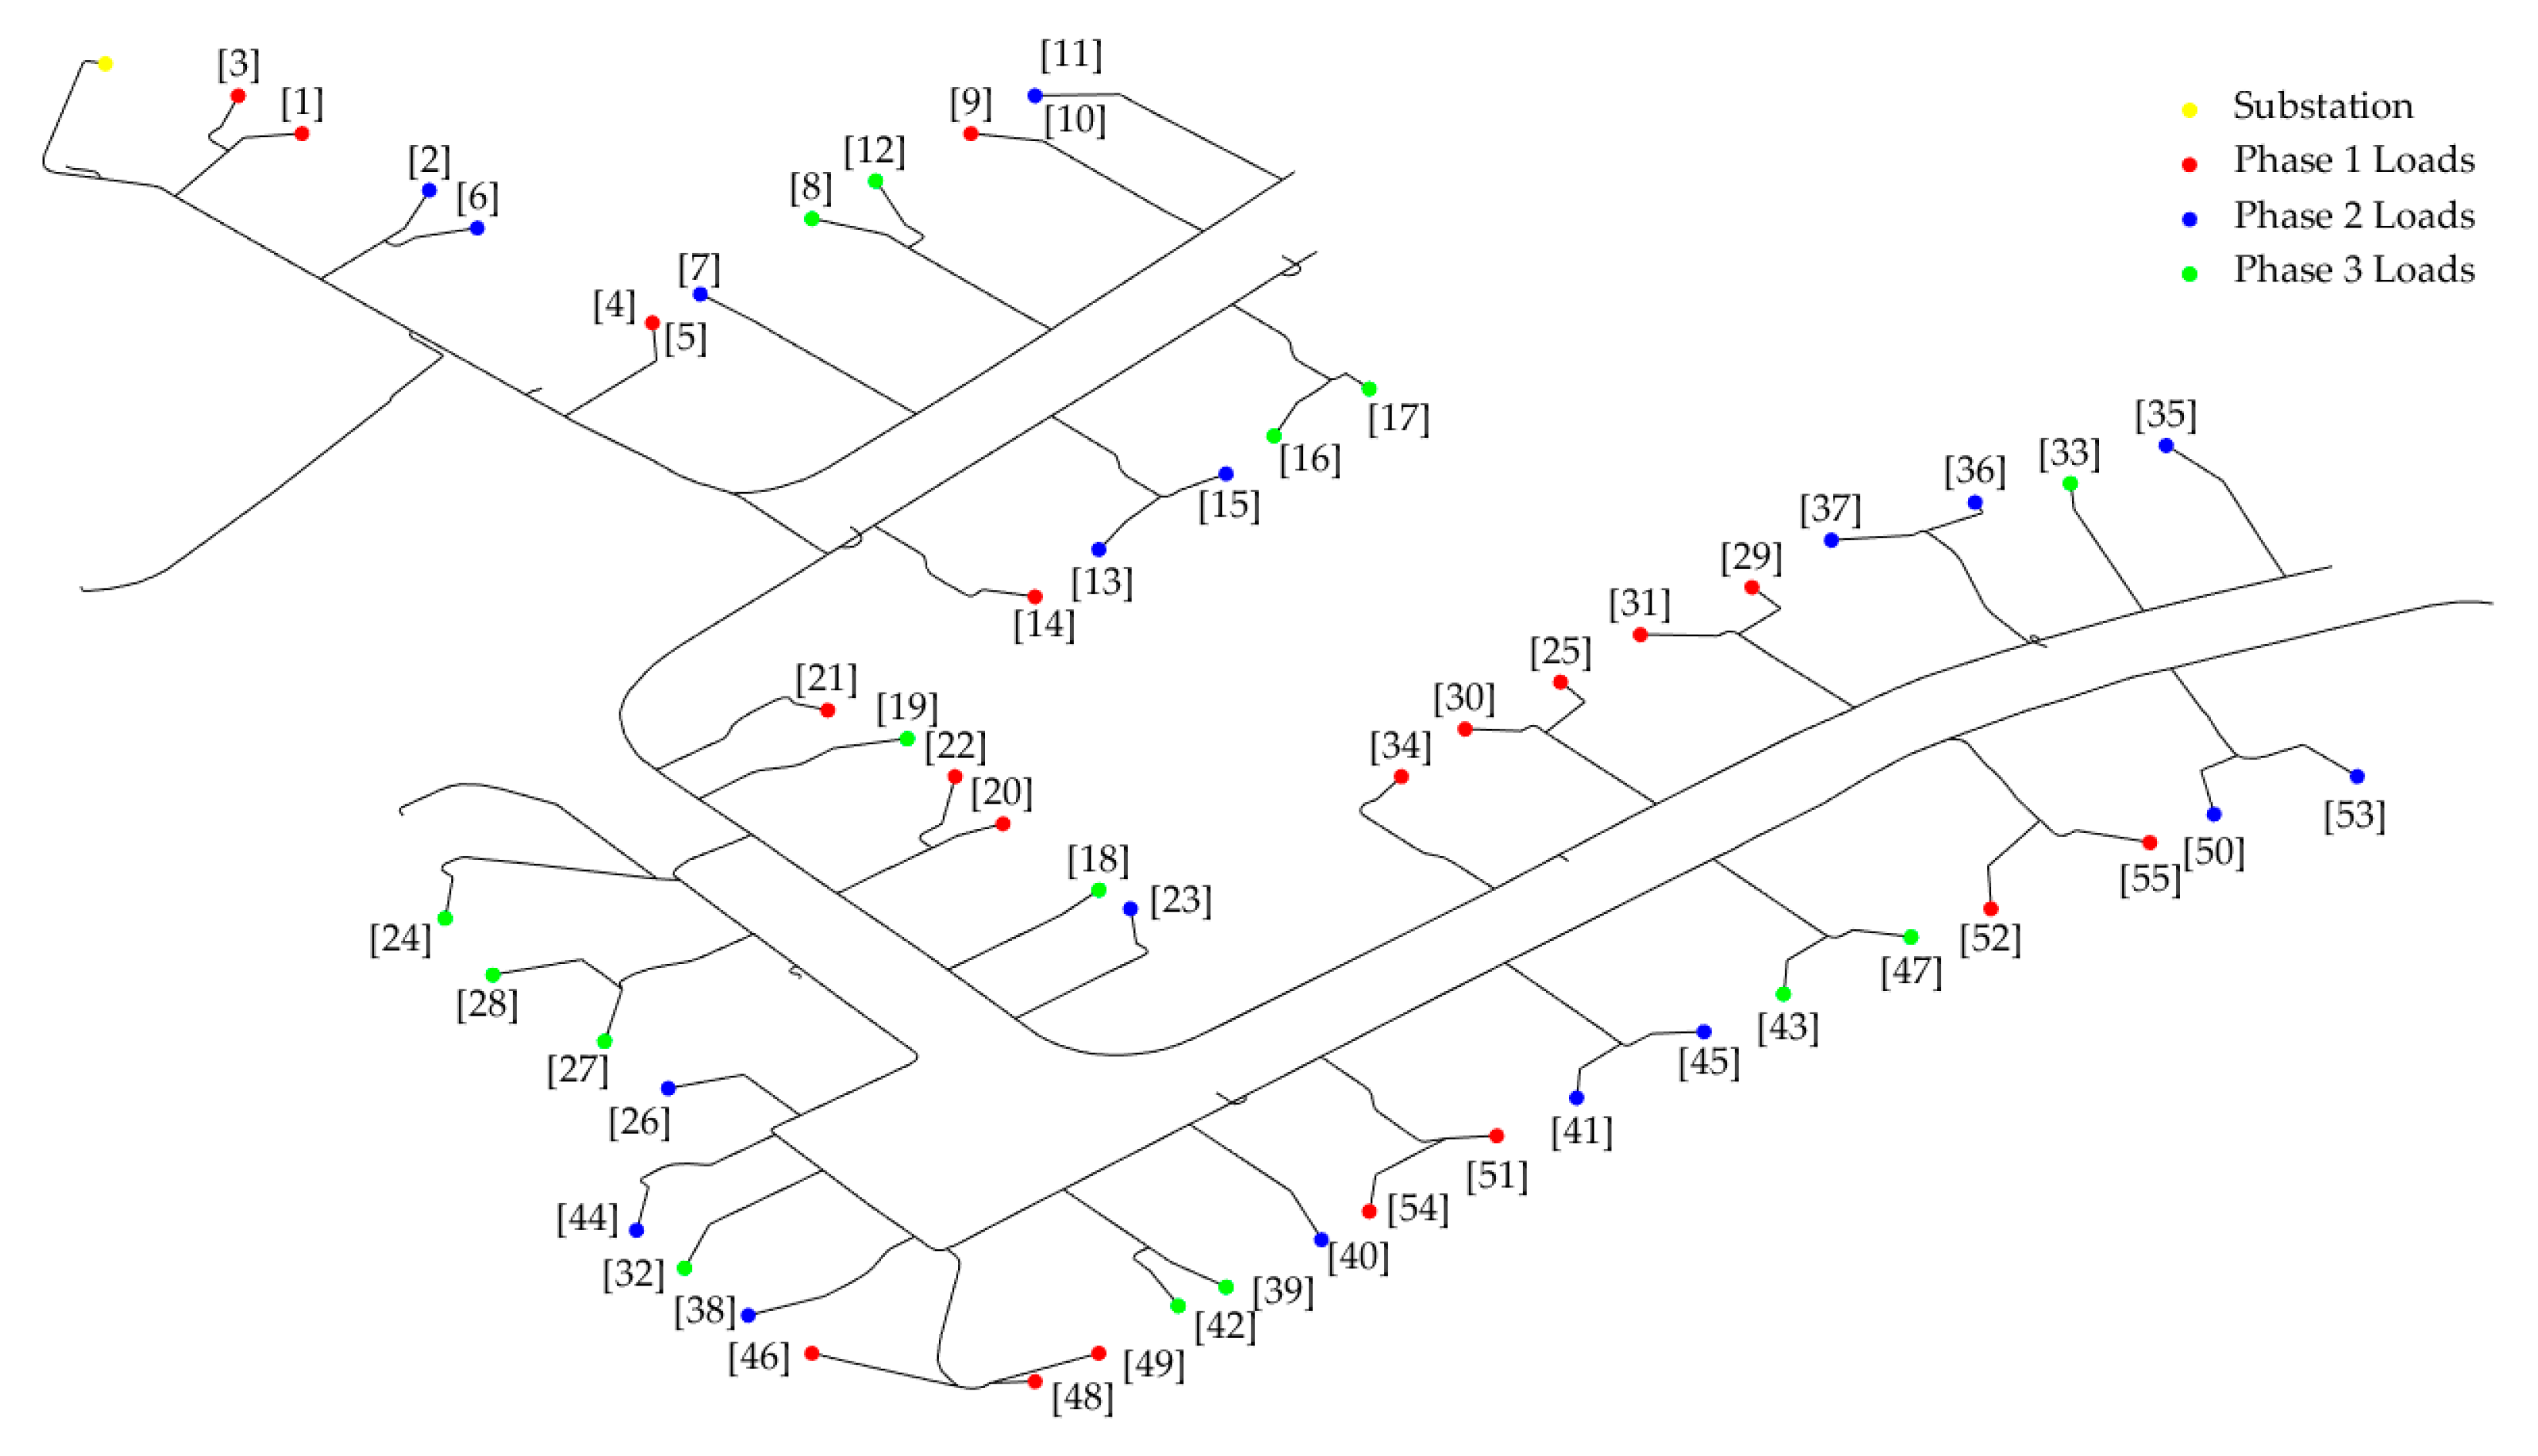
Figure 1. Single line diagram of the IEEE European Low Voltage Test feeder.
Energies 13 03709 g001
Figure 2. Loads distances from grid’s substation.
Energies 13 03709 g002
Figure 3. Transformers total load curve.
Energies 13 03709 g003
Figure 4. Transformer’s residential power for each phase: (a) Phase A; (b) Phase B; (c) Phase C.
Energies 13 03709 g004
Figure 5. Model’s configuration single phase schematic representation.
Energies 13 03709 g005
Figure 6. The IEEE European Low Voltage Test Feeder lines configurations. The legend refers to the feeder’s line codes, which are described in Table 2.
Energies 13 03709 g006
Figure 7. Electric vehicle agent structure.
Energies 13 03709 g007
Figure 8. Typical behavior of EV agents in a 24 h simulation scenario with 1 h time step for each model: Volkswagen e-Golf, Renault Zone, BMW i3, Tesla model S-75 and Nissan Leaf.
Energies 13 03709 g008
Figure 9. Block diagram of a fuzzy logic controller.
Energies 13 03709 g009
Figure 10. Structure of the modelling and simulation framework.
Energies 13 03709 g010
Figure 11. Total grid’s maximum number of chargeable EVs for Scenarios 1a and 1b.
Energies 13 03709 g011
Figure 12. Maximum number of chargeable EVs for CS1 and CS2: (a) maximum allowed EVs for phase A; (b) maximum allowed EVs for phase B; (c) maximum allowed EVs for phase C.
Energies 13 03709 g012
Figure 13. EVs state for each simulation scenario: (a) Scenario 1; (b) Scenario 2; (c) Scenario 3; (d) Scenario 4. Red color declares that EVs are travelled; Blue color declares that EVs are charging; Green color declares that EVs are parked.
Energies 13 03709 g013aEnergies 13 03709 g013b
Figure 14. EVs’ batteries capacity and stored energy at the arrival time to the charging points: (a) Scenario 1; (b) Scenario 2; (c) Scenario 3.
Energies 13 03709 g014aEnergies 13 03709 g014b
Figure 15. Simulation results of Scenario 1: (a) Number of grid’s buses that face undervoltages; (b) Number of grid’s overloaded lines.
Energies 13 03709 g015aEnergies 13 03709 g015b
Figure 16. Simulation results of Scenario 2: (a) Number of grid’s buses that faces undervoltages; (b) Number of grid’s overloaded lines.
Energies 13 03709 g016aEnergies 13 03709 g016b
Figure 17. Simulation results of Scenario 3: (a) Number of grid’s buses that face under voltages; (b) Number of grid’s overloaded lines.
Energies 13 03709 g017aEnergies 13 03709 g017b
Figure 18. Simulation results of Scenario 4: (a) Number of grid’s buses that face undervoltages; (b) Number of grid’s overloaded lines.
Energies 13 03709 g018aEnergies 13 03709 g018b
Figure 19. Block diagram of fuzzy charging algorithm.
Energies 13 03709 g019
Figure 20. Membership functions for each input and output: (a) SoC; (b) Bus distance from the MV/LV substation; (c) Charging delay time; (d) Charging priority.
Energies 13 03709 g020aEnergies 13 03709 g020b
Figure 21. The surfaces of the Fuzzy logic priority management system: (a) depending on the state-of-charge and the charging delay time; (b) depending on the bus distance and the state-of-charge; (c) depending on the bus distance and the charging delay time. In each surface, the midpoint of the remaining input variable is considered.
Energies 13 03709 g021
Figure 22. EVs state for simulation scenarios: (a) Scenario 1; (b) Scenario 2; (c) Scenario 3; (d) Scenario 4; Green color declares that EVs are parked; Red color declares that EVs are travelled; Blue color declares that EVs are charging; Yellow color declares that EVs are connected but not charged due to low priority.
Energies 13 03709 g022aEnergies 13 03709 g022b
Figure 23. Total simulation’s minimum values of SoC, that each EV experiences in Scenario 4.
Energies 13 03709 g023
Figure 24. Total duration of charging time for each EV in uncontrolled charging process and fuzzy priority management system: (a) Scenario 1; (b) Scenario 2; (c) Scenario 3.
Energies 13 03709 g024
Figure 25. Total duration of charging time for each EV by using Fuzzy Logic Controllers FLC+ and FLC: (a) Scenario 1; (b) Scenario 2; (c) Scenario 3.
Energies 13 03709 g025
Table 1. Transformer’s peak loads and average energy consumptions.
Reference PointPeak Load
Apparent Power
(kVA)
Peak Load
Active Power
(KW)
Average Energy Consumption
(kWh/day)
Transformer60.3757.3620.16
Phase A24.5923.367.50
Phase B37.7135.827.22
Phase C21.0119.965.44
Table 2. Case study grid’s lines upper limit ampacities [41].
Line CodeAmpacity (A)
2c 00756
2c 022583
2c 1683
35 SAC XSC110
4c 06210
4c 1560
4c 35210
4c 185405
4c 70560
4c 95 SAC XC180
Table 3. Commercial EVs’ charging and discharging parameters.
ModelCapacity (kWh)Type of BatteryTravel Range (km)Energy Consumption per km (kWh/km)
BMW i333.0Lithium-ion183.40.16
Nissan Leaf30.0Lithium-ion172.20.17
Renault Zoe41.0Lithium-ion402.30.16
Volkswagen e-Golf35.8Lithium-ion193.10.16
Tesla Model S-7575.0Lithium-ion400.70.21
Table 4. Mean and Variance of maximum chargeable EVs, based on Figure 11 and Figure 12.
Case StudiesCS1CS2
Chargeable EVsMeanVarianceMean UtilizationMeanVarianceMean Utilization
Total chargeable EVs34.278.8162.3 %22.453.9440.8 %
Chargeable EVs of Phase A11.522.5254.9 %7.310.5535.0 %
Chargeable EVs of Phase B111.0956.6 %8.280.5143.6 %
Chargeable EVs of Phase C121.7880.0 %6.841.0345.6%
Table 5. Simulation scenarios parameters.
ScenarioDeparture
Time Period (hh:mm)
Arrival
Time Period (hh:mm)
Scenario 19:0014:00
Scenario 27:00–9:0014:00–16:00
Scenario 37:00–9:0014:00–18:00
Scenario 4RandomRandom
Table 6. Number of commercial EVs, used in simulation scenarios.
ModelNumber of EVs
BMW i39
Nissan Leaf15
Renault Zoe11
Volkswagen e10
Tesla Model 310
Table 7. Definition of the FLC inputs and output membership functions.
FLC inputs
VariablesFuzzy States
SoCVery Low, Low, Medium, High, Very High
Bus distance from the MV/LV substationVery Near, Near, Middle, Far, Very Far
Charging delay timeVery Low, Low, Medium, High, Very High
FLC output
VariableFuzzy States
Charging priorityVery Low, Low, Medium, High, Very High
Table 8. Fuzzy rules of the proposed system, when the level of the distance variable from the main MV/LV substation is Very Near.
SoC\Delay TimeVery LowLowMediumHighVery High
Very LowHighHighHighVery HighVery High
LowHighHighHighHighVery High
MediumMediumHighHighHighVery High
HighMediumMediumMediumHighHigh
Very HighLowLowLowMediumMedium
Table 9. Fuzzy rules of the proposed system, when the level of the distance variable from the main MV/LV substation is Near.
SoC\Delay TimeVery LowLowMediumHighVery High
Very LowHighHighHighVery HighVery High
LowMediumHighHighHighVery High
MediumMediumMediumHighHighVery High
HighLowMediumMediumMediumHigh
Very HighVery LowLowLowLowMedium
Table 10. Fuzzy rules of the proposed system, when the level of the distance variable from the main MV/LV substation is Middle.
SoC\Delay TimeVery LowLowMediumHighVery High
Very LowHighHighHighHighVery High
LowMediumMediumHighHighHigh
MediumMediumMediumMediumHighVery High
HighLowLowLowMediumMedium
Very HighVery LowVery LowLowLowMedium
Table 11. Fuzzy rules of the proposed system, when the level of the distance variable from the main MV/LV substation is Far.
SoC\Delay TimeVery LowLowMediumHighVery High
Very LowMediumHighHighHighVery High
LowMediumMediumMediumHighHigh
MediumLowMediumMediumMediumHigh
HighLowLowLowMediumMedium
Very HighVery LowVery LowLowLowMedium
Table 12. Fuzzy rules of the proposed system, when the level of the distance variable from the main MV/LV substation is Very Far.
SoC\Delay TimeVery LowLowMediumHighVery High
Very LowMediumMediumHighHighVery High
LowMediumMediumMediumMediumHigh
MediumLowLowMediumMediumHigh
HighVery LowLowLowLowMedium
Very HighVery LowVery LowVery LowLowLow
Table 13. Mean EVs’ charging time, by using FLC and FLC+.
ScenarioMean Charging Time of EVs in FLC (min)Mean Charging Time of EVs in FLC+ (min)Percentage of Charging Time Reduction (%)
Scenario 113611614.7
Scenario 21079313
Scenario 380756