Article

Green Diesel Production over Nickel-Alumina Nanostructured Catalysts Promoted by Copper

1
Department of Chemistry, University of Patras, GR-26504 Patras, Greece
2
School of Science and Technology, Hellenic Open University, Tsamadou 13-15, GR-26222 Patras, Greece
3
Surface Science Laboratory, Department of Chemical Engineering, University of Patras, GR-26504 Patras, Greece
4
Foundation for Research and Technology, Institute of Chemical Engineering Science (FORTH/ICE-HT), Stadiou str., Platani, P.O. Box 1414, GR-26500 Patras, Greece
*
Author to whom correspondence should be addressed.
Energies 2020, 13(14), 3707; https://doi.org/10.3390/en13143707
Submission received: 15 June 2020 / Revised: 9 July 2020 / Accepted: 15 July 2020 / Published: 18 July 2020

Abstract

:
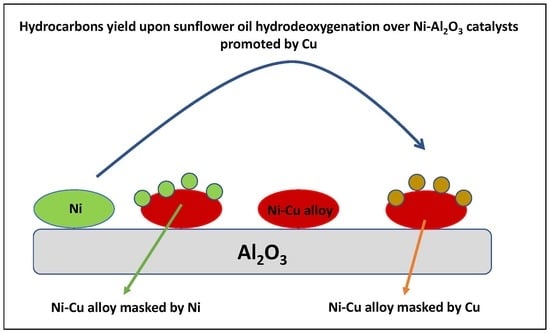
A series of nickel–alumina catalysts promoted by copper containing 1, 2, and 5 wt. % Cu and 59, 58, and 55 wt. % Ni, respectively, (symbols: 59Ni1CuAl, 58Ni2CuAl, 55Ni5CuAl) and a non-promoted catalyst containing 60 wt. % Ni (symbol: 60NiAl) were prepared following a one-step co-precipitation method. They were characterized using various techniques (N2 sorption isotherms, XRD, SEM-EDX, XPS, H2-TPR, NH3-TPD) and evaluated in the selective deoxygenation of sunflower oil using a semi-batch reactor (310 °C, 40 bar of hydrogen, 96 mL/min hydrogen flow rate, and 100 mL/1 g reactant to catalyst ratio). The severe control of the co-precipitation procedure and the direct reduction (without previous calcination) of precursor samples resulted in mesoporous nano-structured catalysts (most of the pores in the range 3–5 nm) exhibiting a high surface area (192–285 m2 g−1). The promoting action of copper is demonstrated for the first time for catalysts with a very small Cu/Ni weight ratio (0.02–0.09). The effect is more pronounced in the catalyst with the medium copper content (58Ni2CuAl) where a 17.2% increase of green diesel content in the liquid products has been achieved with respect to the non-promoted catalyst. The copper promoting action was attributed to the increase in the nickel dispersion as well as to the formation of a Ni-Cu alloy being very rich in nickel. A portion of the Ni-Cu alloy nanoparticles is covered by Ni0 and Cu0 nanoparticles in the 59Ni1CuAl and 55Ni5CuAl catalysts, respectively. The maximum promoting action observed in the 58Ni2CuAl catalyst was attributed to the finding that, in this catalyst, there is no considerable masking of the Ni-Cu alloy by Ni0 or Cu0. The relatively low performance of the 55Ni5CuAl catalyst with respect to the other promoted catalysts was attributed, in addition to the partial coverage of Ni-Cu alloy by Cu0, to the remarkably low weak/moderate acidity and relatively high strong acidity exhibited by this catalyst. The former favors selective deoxygenation whereas the latter favors coke formation. Copper addition does not affect the selective-deoxygenation reactions network, which proceeds predominantly via the dehydration-decarbonylation route over all the catalysts studied.

Graphical Abstract

1. Introduction

The emission of carbon dioxide from the combustion of fossil fuels (carbon, oil, and natural gas) is responsible for the global warming whereas the increasing demands for fossil fuels is expected to lead to their progressive depletion during the 21st century [1]. The replacement of fossil fuels by renewable ones is actually critical for facing such a double problem [1,2,3]. Undoubtedly, biomass is an important source of renewable energy. The animal fat and plant oils triglyceride biomass is very attractive because it is much less complex than lignocellulosic biomass whereas the ratio of oxygen to the combustible carbon and hydrogen atoms in a molecule of triglyceride is relatively small. The catalytic transformation of triglycerides into n-alkanes in the diesel range (green diesel) was initially studied over noble metals and conventional NiMo or CoMo/γ-Al2O3 sulfide catalysts [4]. Nickel non-sulphided catalysts have gained much interest in the last decade [5,6,7,8,9,10,11,12,13,14,15,16]. The previously mentioned transformation over nickel non-sulphided catalysts is realized by hydrotreatment (temperature: 240–360 °C, hydrogen pressure: 10–80 bar) whereas the relevant chemistry, stated in the next paragraph, is now well established.
The removal of oxygen without or with very small fragmentation extent of the side chains of triglycerides is called Selective DeOxygenation (SDO). The first step of the SDO network is the rapid hydrogenation of olefinic bonds of side chains of triglycerides. It is followed by the gradual decomposition of the O-C bonds in the glycerol side resulting progressively to di-glycerides and then mono-glycerides and then to free fatty acids and propane. The free fatty acids could be transformed by direct decarboxylation (deCO2) into n-alkanes with an odd number of carbon atoms (mainly n-C17 and n-C15) and carbon dioxide. However, this pathway, if any, has very low probability above nickel catalysts [4]. Much more probable is the second pathway whereby the free fatty acids are reduced to the corresponding fatty aldehydes by water removal. The aldehydes are then decarbonylated, which results in n-alkanes with an odd number of carbon atoms (mainly n-C17 and n-C15) and carbon monoxide. Thus, the SDO via this route takes place by dehydration–decarbonylation (deH2O-deCO). The third pathway involves the reduction of the fatty aldehydes into the corresponding fatty alcohols and their very rapid equilibration. The fatty alcohols are transformed into olefins by dehydration, which are then hydrogenated and leads to n-alkanes with an even number of carbon atoms (mainly n-C18 and n-C16). Thus, the SDO through this route takes place by dehydration (deH2O). In parallel, the fatty alcohols may react with the fatty acids producing long chain esters [6]. These may undergo SDO resulting in hydrocarbons. The above-described SDO network is schematized in Figure S1 (Supplementary Material). In addition to the previously mentioned liquid phase reactions, reactions may take place between CO2, CO, and hydrogen deliberated in the gas phase (reverse water gas shift and methanation).
Recently, we have contributed to this subject by developing a co-precipitation methodology, which ensures severe control of the precipitation parameters. This methodology allowed preparing nickel–alumina catalysts with a high specific surface area, even at high nickel loading [6]. These catalysts are very active in the SDO of sunflower oil (SFO) under solvent-free conditions and a very high SFO volume/catalyst ratio (100 mL/1 g). This work showed that the yield of green diesel over such catalysts is a linear function of the nickel surface exposed. The highest value of the latter and, thus, the maximum catalytic performance was achieved over the catalyst with nickel content at about 60 wt. % in which a good compromise between the specific surface area and nickel loading has been achieved. This preparation methodology was then successfully applied to nickel–zirconia catalysts [7] and to nickel–alumina catalysts promoted by molybdenum [17] and zinc [18]. Concerning the promoted catalysts, the total amount of the nickel content was about 60 wt. % whereas the promoters exhibited their optimum effect at very small loadings (1–6%) compared to the nickel loading (54–59%).
With the idea to extend our study to the copper promoted catalysts, we are surveying the relevant literature. The promoting action of copper concerning nickel catalysts used in the SDO of plant oils, biodiesel, residual fatty raw materials, and related compounds into green diesel has gained the research interest in the last years [19,20,21,22,23,24,25,26,27,28,29,30]. Yakovlev’s group was pioneer in this subject [19,20,21,22]. They first studied Ni monometallic and Ni-Cu bimetallic catalysts supported on CeO2, ZrO2, or CeO2-ZrO2 in the SDO of biodiesel [19,20] and then a bimetallic Ni-Cu catalyst supported on γ-Al2O3 in the SDO of methyl palmitate and ethyl caprate [21]. The bimetallic catalysts were proved more attractive due to their efficiency to prevent methane formation. The Ni–Cu/CeO2–ZrO2 catalyst exhibited the highest performance partly attributed to the presence of a Ni1−xCux (x = 0.2–0.3) solid solution as a constituent of the active center and partly to the development of a mixed cerium-zirconium oxide phase. The formation of the previously mentioned nickel–copper solid solution was also found in the Ni−Cu/γ-Al2O3 catalyst [21]. The Crocker’s group has also contributed in the domain [23,24,25,26]. In the first work [23], a series of Ni/γ-Al2O3 catalysts were prepared containing 20 wt. % Ni and 0, 1, 2, and 5 wt. % Cu and studied in the SDO of tristearin, stearic acid, and triolein. The maximum performance was obtained over the catalyst 20% Ni–5% Cu/γ-Al2O3. The promoting action of copper was attributed to the increase in the surface of metallic nickel as well as to the suppression of surface coking and, hence, catalyst deactivation. This may reflect the ability of Cu to curb the cracking activity of nickel expressed in the non-promoted catalyst. This was also confirmed in the subsequent articles reported by the group where the un-promoted 20% Ni/γ-Al2O3 catalyst was compared to the promoted 20% Ni–5% Cu/γ-Al2O3 one in the SDO of residual fatty raw materials (yellow grease and hemp seed oil [24], waste free fatty acids, and brown grease [25]). They also compared the 20% Ni–5% Cu/γ-Al2O3 catalyst to the 20% Ni–5% Fe/γ-Al2O3 and 20% Ni-0.5%Pt/γ-Al2O3 ones in the SDO of waste cooking oil (WCO) [26]. A work reported by Jing et al. deals with the copper promoting action in Ni/γ-Al2O3 catalysts containing 20 wt. % Ni and 0, 1, 3, 6, or 10 wt. % Cu in the SDO of biodiesel [27]. The maximum performance was obtained over the catalyst containing 6 wt. % Ni. The decrease in catalytic performance as the copper loading increases from 6 to 10 wt. %, which was attributed to its accumulation on the support surface that leads to pore blocking. As inferred in the first work of the Crocker’s group [23], the promoting action of copper was mainly attributed to coking suppression. Two interesting works were reported by the group of Fu in which methanol was used as a hydrogen donor instead of gas hydrogen [28,29]. In the first work [28], copper (30 wt. %), nickel (30 wt. %), and nickel–copper catalysts (15, 30, 60 wt. %, and Cu/Ni weight ratio = ½) supported on ZrO2 were studied in the SDO of oleic acid. It was reported that the formation of a Cu-Ni alloy favors SDO and inhibits cracking, which increases the catalytic performance. In the second work [29], copper (60 wt. %), nickel (60 wt. %), copper (40 wt. %)-nickel (20 wt. %), copper (30 wt. %)-nickel (30 wt. %), and copper (20 wt. %)-nickel (40 wt. %) catalysts supported on alumina were studied in the SDO of oleic acid. Cracking of C–C bonds deduced by the presence of cracked paraffins was found over the nickel monometallic catalyst. The formation of the Cu–Ni alloy in the bimetallic catalysts and the presence of partially oxidized copper favor SDO and inhibit the cracking of the C–C bonds, which leads to enhanced catalytic performance. A very recent work reported by Miao et al. [30] deals with two monometallic (10 wt. % Ni/γ-Al2O3, 10 wt. % Cu/γ-Al2O3) and five bimetallic NiCu/γ-Al2O3 catalysts with Cu/Ni ratios equal to 1/9, 3/7, 5/5, 7/3, and 9/1 used in the SDO of methyl laurate. They concluded that the oxide precursors can be effectively reduced at 420 °C for 2 h into the corresponding metallic catalysts, which is comprised of Ni0, Cu0, and NiCu alloy-supported species. The formation of the NiCu alloy promotes the electronic interactions between Ni and Cu, which enhances catalytic performance. The catalyst with the Cu/Ni ratio equal to 7/3 was proved to be the most active. The nickel and the copper active centers favor, respectively, SDO through dehydration–decarbonylation and dehydration.
In conclusion, the promoting action of copper has been demonstrated. Some aspects of the promoting action start to emerge. The copper promoting action is expressed through the increase in the nickel dispersion and the formation of nickel-copper alloy with better catalytic behavior than nickel. It seems that this curbs the C-C cracking activity of nickel, which depresses the formation of cracked paraffins, methane, and carbon deposition and favors the formation of diesel range n-alkanes and catalyst stability.
In the present work, we are continuing our research effort on co-precipitated Ni-Al2O3 catalysts by studying the copper and promoting action in these catalysts concerning the SDO of SFO. Four catalysts containing 60, 59, 58, and 55 wt. % Ni and 0, 1, 2, and 5 wt. % Cu, denoted by 60NiAl, 59Ni1CuAl, 58Ni2CuAl, and 55Ni5CuAl, were synthesized following the previously mentioned rigorous co-precipitation methodology. The catalysts were characterized using various methods and evaluated in the SDO of SFO in a semi-batch high-pressure reactor. Our approach differs from those mentioned above [19,20,21,22,23,24,25,26,27,28,29,30] in two points. In our study, the Cu/Ni weight ratio ranges from 0.02 to 0.09 whereas such a ratio was much higher in the studies reported so far (0.33 [19,20], 0.38 [21], 0.05–0.25 [23], 0.25 [24,25,26], 0.05–2. [27], 0.5 [28], 0.5–2.0 [29], and 0.1–9 [30]). The second difference is that the evaluation of the catalysts in the present work was performed under solvent-free conditions and the SFO volume to catalyst ratio is equal to 100 mL/1 g and the reaction time is equal to 9 h. These correspond to an LHSV value equal to 11.1 h−1 for experiments taken place in fixed bed reactors. These experimental conditions are very hard when compared to the corresponding ones reported in the previous works. The choice of SFO as feedstock was done by taking into account that genetically-modified sunflower grown on marginal land has been identified as sustainable biofuel source because it does not encroach upon arable lands [31].

2. Experimental

2.1. Synthesis of the Catalysts

The hydroxide precursors of the catalysts studied were prepared by co-precipitation using an aqueous solution of Al3+, Ni2+, and Cu2+ nitrate salts [Al (NO3)29H20, Ni (NO3)26H2O, Cu (NO3)23H2O, E. Merck]. This solution was in a funnel and was added drop-by-drop to a vessel containing 330 mL distilled water in which the pH was adjusted to 8 by NH4OH. NH4OH 30% solution (Carlo Erba Reagents) was used in a pH-control system (Metrhom) for keeping pH equal to 8 in the previously mentioned vessel during co-precipitation. Figure S2 presents the set-up used and gives more details. Even more experimental details have been reported elsewhere [6,7]. The rate of introduction of the mixed nitrate solution into the co-precipitation vessel was equal to 1.2 mL/min instead 0.7 mL/min adopted in Reference [6]. Using this rate, we prepared both the copper promoted and the non-promoted catalysts. The precipitated hydroxides were dried at 110 °C for 24 h. The dried hydroxides were decomposed to the corresponding oxides by heating them gradually under argon flow of 30 mL/min for 40 min. This time period was necessary for increasing the temperature from 25 to 400 °C. The final catalysts were then synthesized by reduction (activation) of the oxide precursors under hydrogen flow (30 mL/min) at 400 °C for 2.5 h.

2.2. Catalysts Characterization

The physicochemical properties of the catalysts were determined using various techniques. A porosimeter (Micromeritics, Tristar 3000) was used for determining the values of a specific surface area and the pore size distribution. The XRD patterns used for determining the crystal phases and the mean size of nanocrystals (Scherer’s relationship) were recorded in a Brucker D8 Advance diffractometer. The catalyst morphology was determined by SEM and their composition by EDS. A SEMJEOL JSM6300 microscope with an ED spectrometer was used in all cases. The catalysts’ nanostructure was investigated by TEM using a JEOL JEM-2100 system. The surface analysis of the catalysts was obtained by XPS measurements using a MAX200 (LEYBOLD/SPECS) electron spectrometer. The NH3-TPD experiments for determining the acid sites were carried out in a laboratory-developed set up. The above techniques were applied on the final catalysts. In contrast, the H2-TPR experiments were performed in the oxide precursors. Characterization details have been reported elsewhere [6,7,10,17,18,31,32,33,34].

2.3. Catalytic Tests

A semi-batch reactor was used in all cases. The experiments were carried out at 310 °C, H2 pressure, a rate equal to 40 bar and 100 mL/min, respectively, and ratio of sunflower oil volume to catalyst mass equal 100 mL/1 g. The catalytic experiments were monitored for 9 h and performed under solvent-free conditions. Samples withdrawn from the reactor liquid phase were analyzed by GC (Shimadzu GC-2010, column: SUPELCO, MET-Biodiesel, l = 14 m, d = 0.53 mm, tf = 0.16 μm) and GC-MS (GC-MS-QP2010 Ultra). The accuracy of the catalytic results was determined by performing several runs twice. The results differed less than 2% in all cases. Experimental and theoretical mass balance determined for all catalytic tests differ less than ±3%. Experimental details were reported in previous contributions [6,7,10,17,18,31].

3. Results and Discussion

3.1. Catalysts Characterization

The SEM microphotographs recorded at various magnifications were similar to those published previously [6] and showed the presence of micro grains of different sizes and interparticle macro pores as well. Typical pictures for the 60NiAl and 58Ni2CuAl catalysts are presented in Figure S3. The elemental analysis, performed by EDS, indicated compositions very close to the nominal ones for the catalysts prepared. In fact, the percentage composition in nickel/copper determined for the 60NiAl, 59Ni1CuAl, 58Ni2CuAl, and 55Ni5CuAl catalysts were, respectively, equal to 59.8, 58.8/1.3, 57.3/2.3, and 55.5/6.0. A typical example of the EDS analysis concerning the 58Ni2CuAl catalyst is illustrated in Figure S4.
Figure 1 illustrates the pore volume distribution curves obtained for the catalysts studied. The curves show a mono-modal or bimodal pore size distribution in the range of 2–100 nm. The first and the second peak are centered at about 3 and 4–5 nm, respectively. More precisely, the pore size distribution curve of 60NiAl catalyst exhibits a single peak in the previously mentioned range centered at about 3 nm. The addition of a small amount of Cu (59Ni1CuAl catalyst) provoked the rise of an additional peak centered at 4–5 nm. Further increase of Cu content (58Ni2CuAl catalyst) resulted in the disappearance of the peak at 3 nm and the intensification of that centered at 4–5 nm. Adding higher Cu content (55Ni5CuAl catalyst) provoked the re-appearance of the bi-modal pore-size distribution curve but with lower intensity. In all catalysts studied, an additional broad but less intensive peak is observed in the range of pore diameter >100 nm. Thus, the solids prepared exhibit mainly mesoporous texture with the most pores concentrated in the range of 3–5 nm. This implies solids with a very high specific surface area and a very small mean pore diameter. Inspection of Table 1 shows that this is the case. The somewhat smaller value of specific surface area obtained for the 58Ni2CuAl catalyst reflects the disappearance of the pore-size distribution peak at 3.0 nm. It is notable that the addition of copper is bringing no negligible changes in the texture of the catalysts studied, which depend on the copper content.
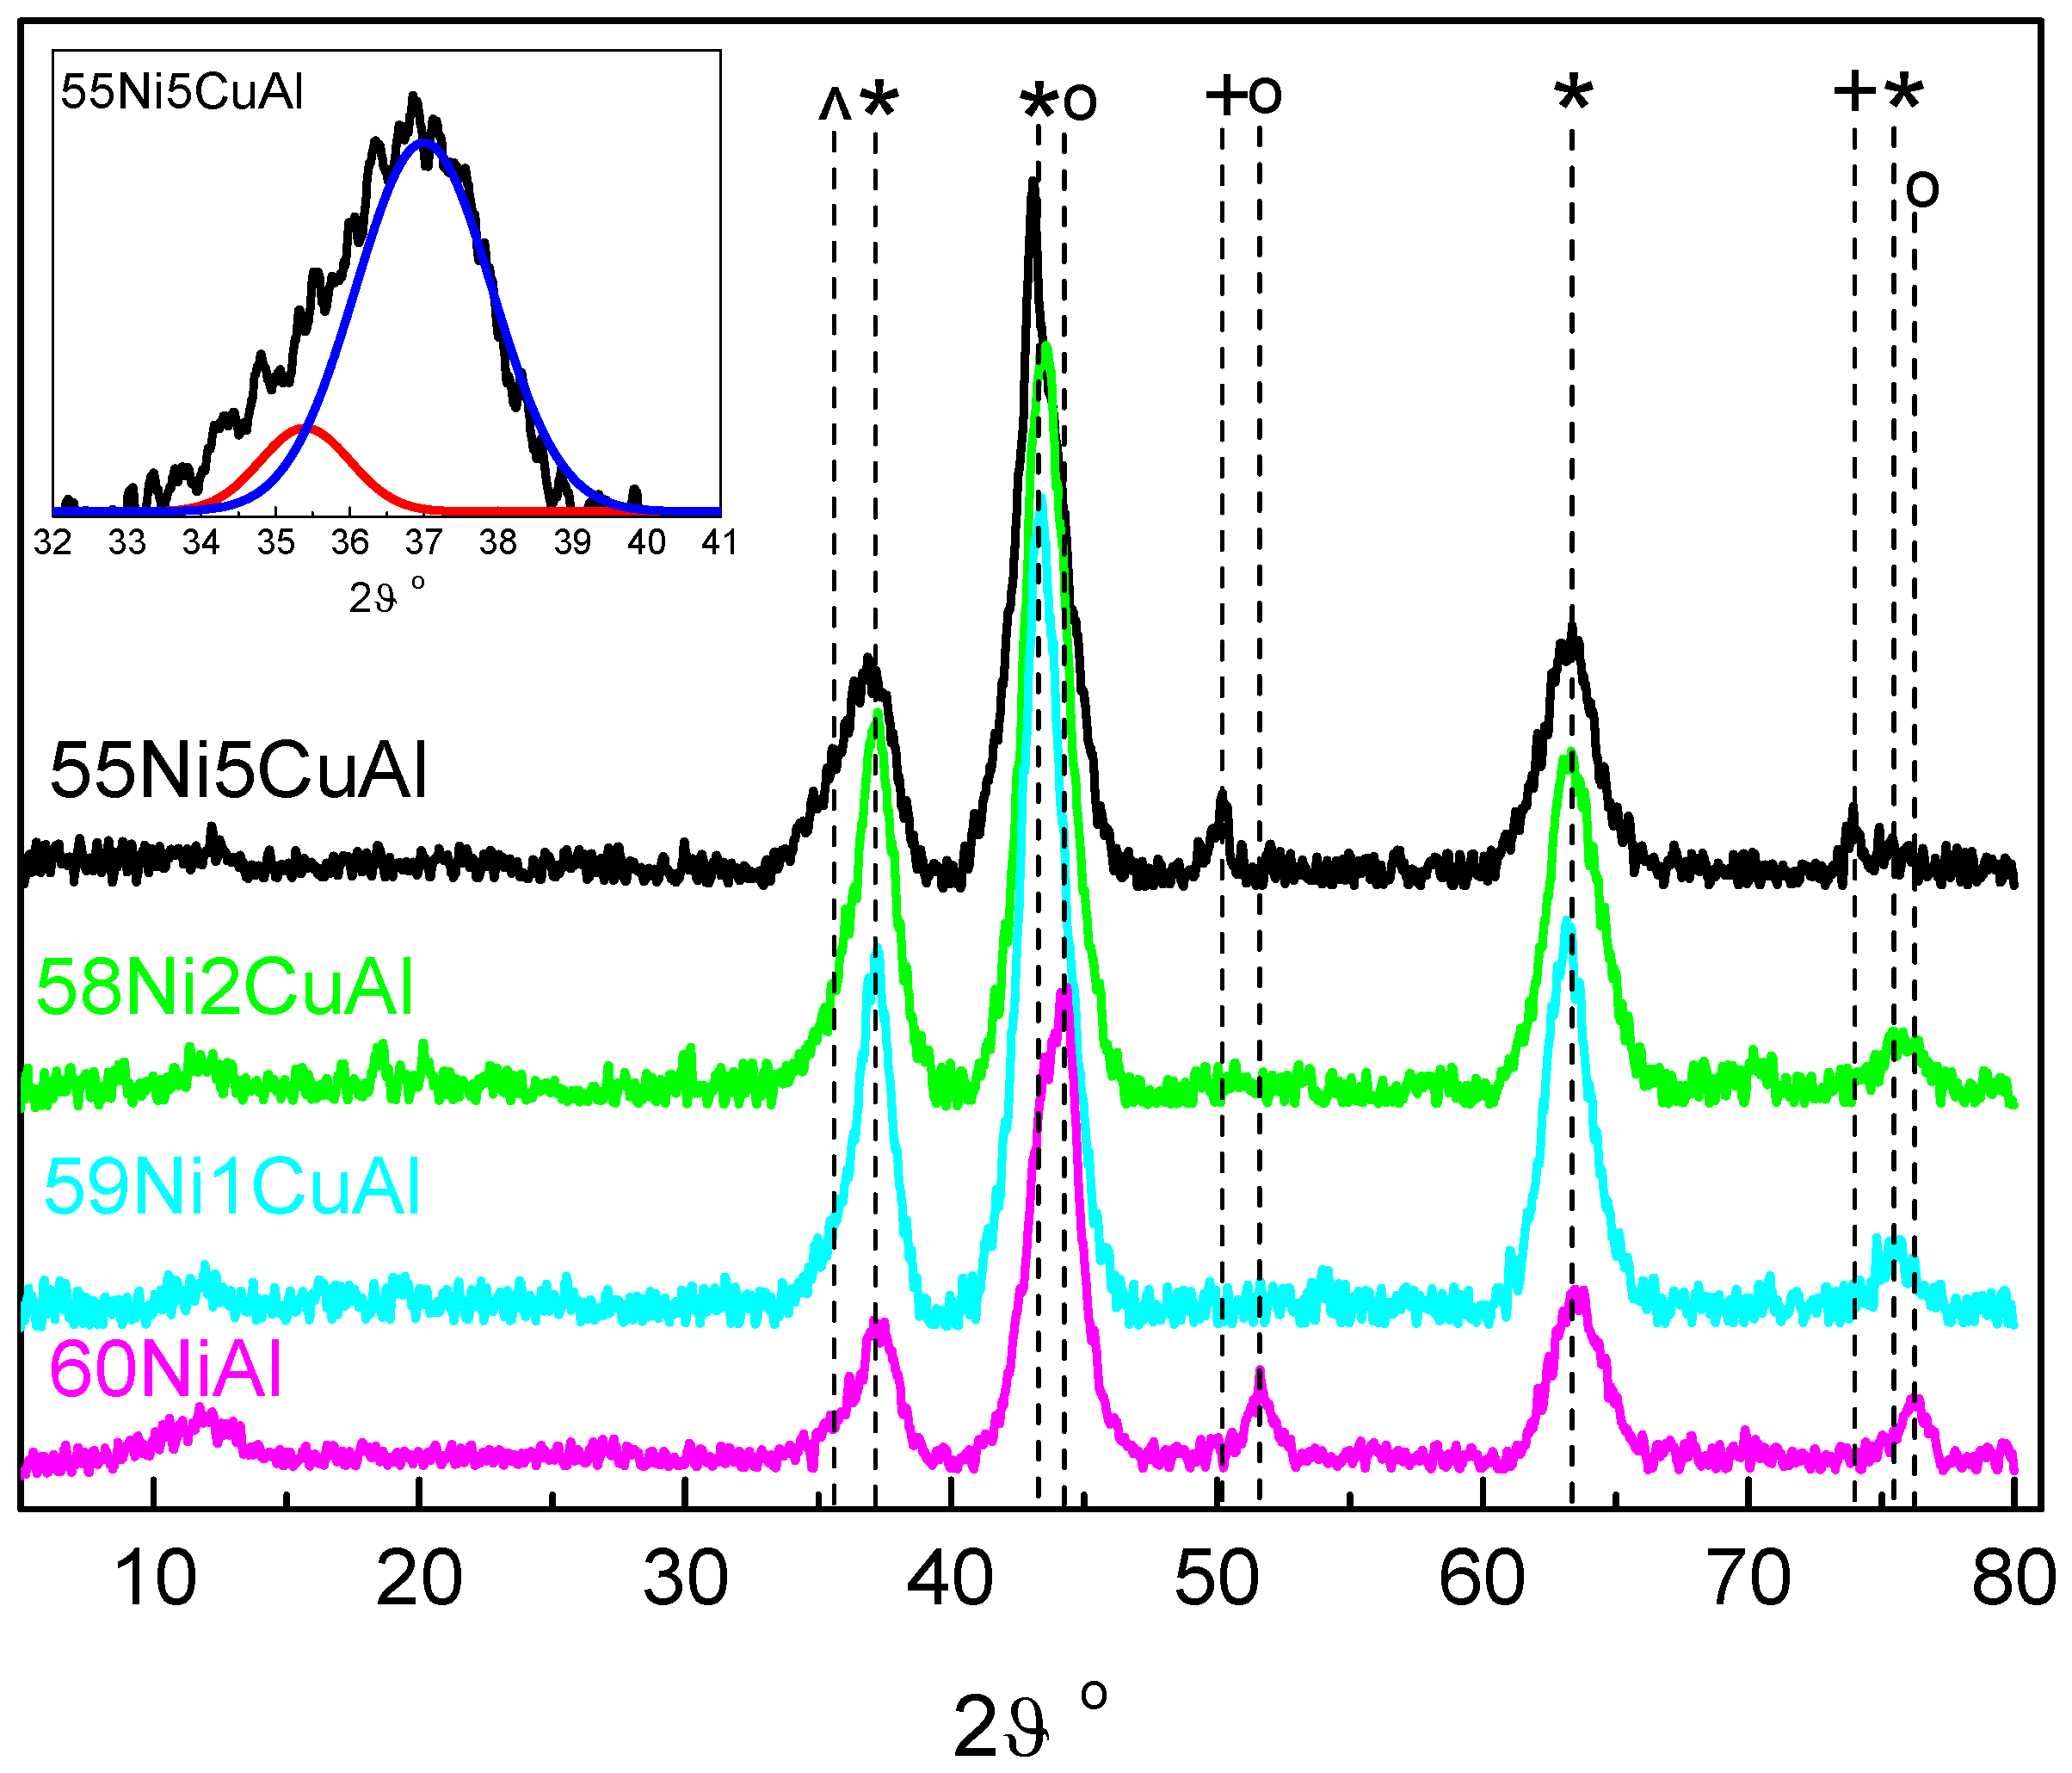
The XRD patterns obtained after activation of the catalysts are illustrated in Figure 2. Inspection of this figure shows that NiO is predominant in the 60NiAl catalyst (main peaks 2θ: 37.2, 43.3, 62.9, and 75.4°/PDF-2 2003 # 47-1049). Moreover, the peaks assigned to metallic nickel, Ni0, (2θ: 44.3, 51.6 and 76.1°/PDF-2 2003 # 01-1258) are also observed.
The addition of Cu to the nickel–alumina catalyst results in the disappearance of the previously mentioned peaks attributed to Ni0. Cu favors the dispersion of Ni (as it is shown below by XPS) and the too small Ni0 crystallites are not any more detectable by XRD. The formation of small amounts of Ni0.95Cu0.05O with diffraction peaks at 2θ 37.2, 43.3, 62.8, and 75.4° (PDF-2 2003 # 78-0644) cannot be excluded in the samples 59Ni1CuAl and 58Ni2CuAl while taking into account that the nominal Cu/Ni ratio in these samples is equal to 0.0157 and 0.0319, respectively, whereas this ratio in the mixed oxide is equal to 0.053. Therefore, copper is not in a sufficient quantity to form exclusively Ni0.95Cu0.5O. The absence of additional peaks relevant to copper phases, for instance copper/copper oxide, could be attributed to the copper entrapment in the Ni0.95Cu0.5O and/or to the formation of nanoparticles below the XRD identification limit. In the sample 55Ni5CuAl with nominal Cu/Ni ratio equal to 0.084, the formation of Ni0.95Cu0.5O is also probable, though a portion of copper is identified as metallic, Cu0, through its characteristic peaks at 2θ 50.4 and 74.1° (PDF-2 2003 # 85-1326). The deconvolution of the asymmetric peak at 2θ ~37° indicated the presence of a monoclinic phase of CuO in this sample (see inset in Figure 2), which is revealed by its characteristic peak at 35.5° (PDF-2 2003 # 80-0076). The absence of any peak due to alumina indicates that this oxide is largely amorphous. The nickel and copper surface speciation is further investigated by XPS.
Based on the XRD peak at 37.2°, we have calculated the mean size of the NiO/Ni0.95Cu0.5O nanocrystals using the Scherer’s relationship. It was found equal to about 5.5 nm. The TEM images of the promoted catalysts showed a rather uniform particle size distribution with a similar mean value. A typical image is illustrated in Figure S4.
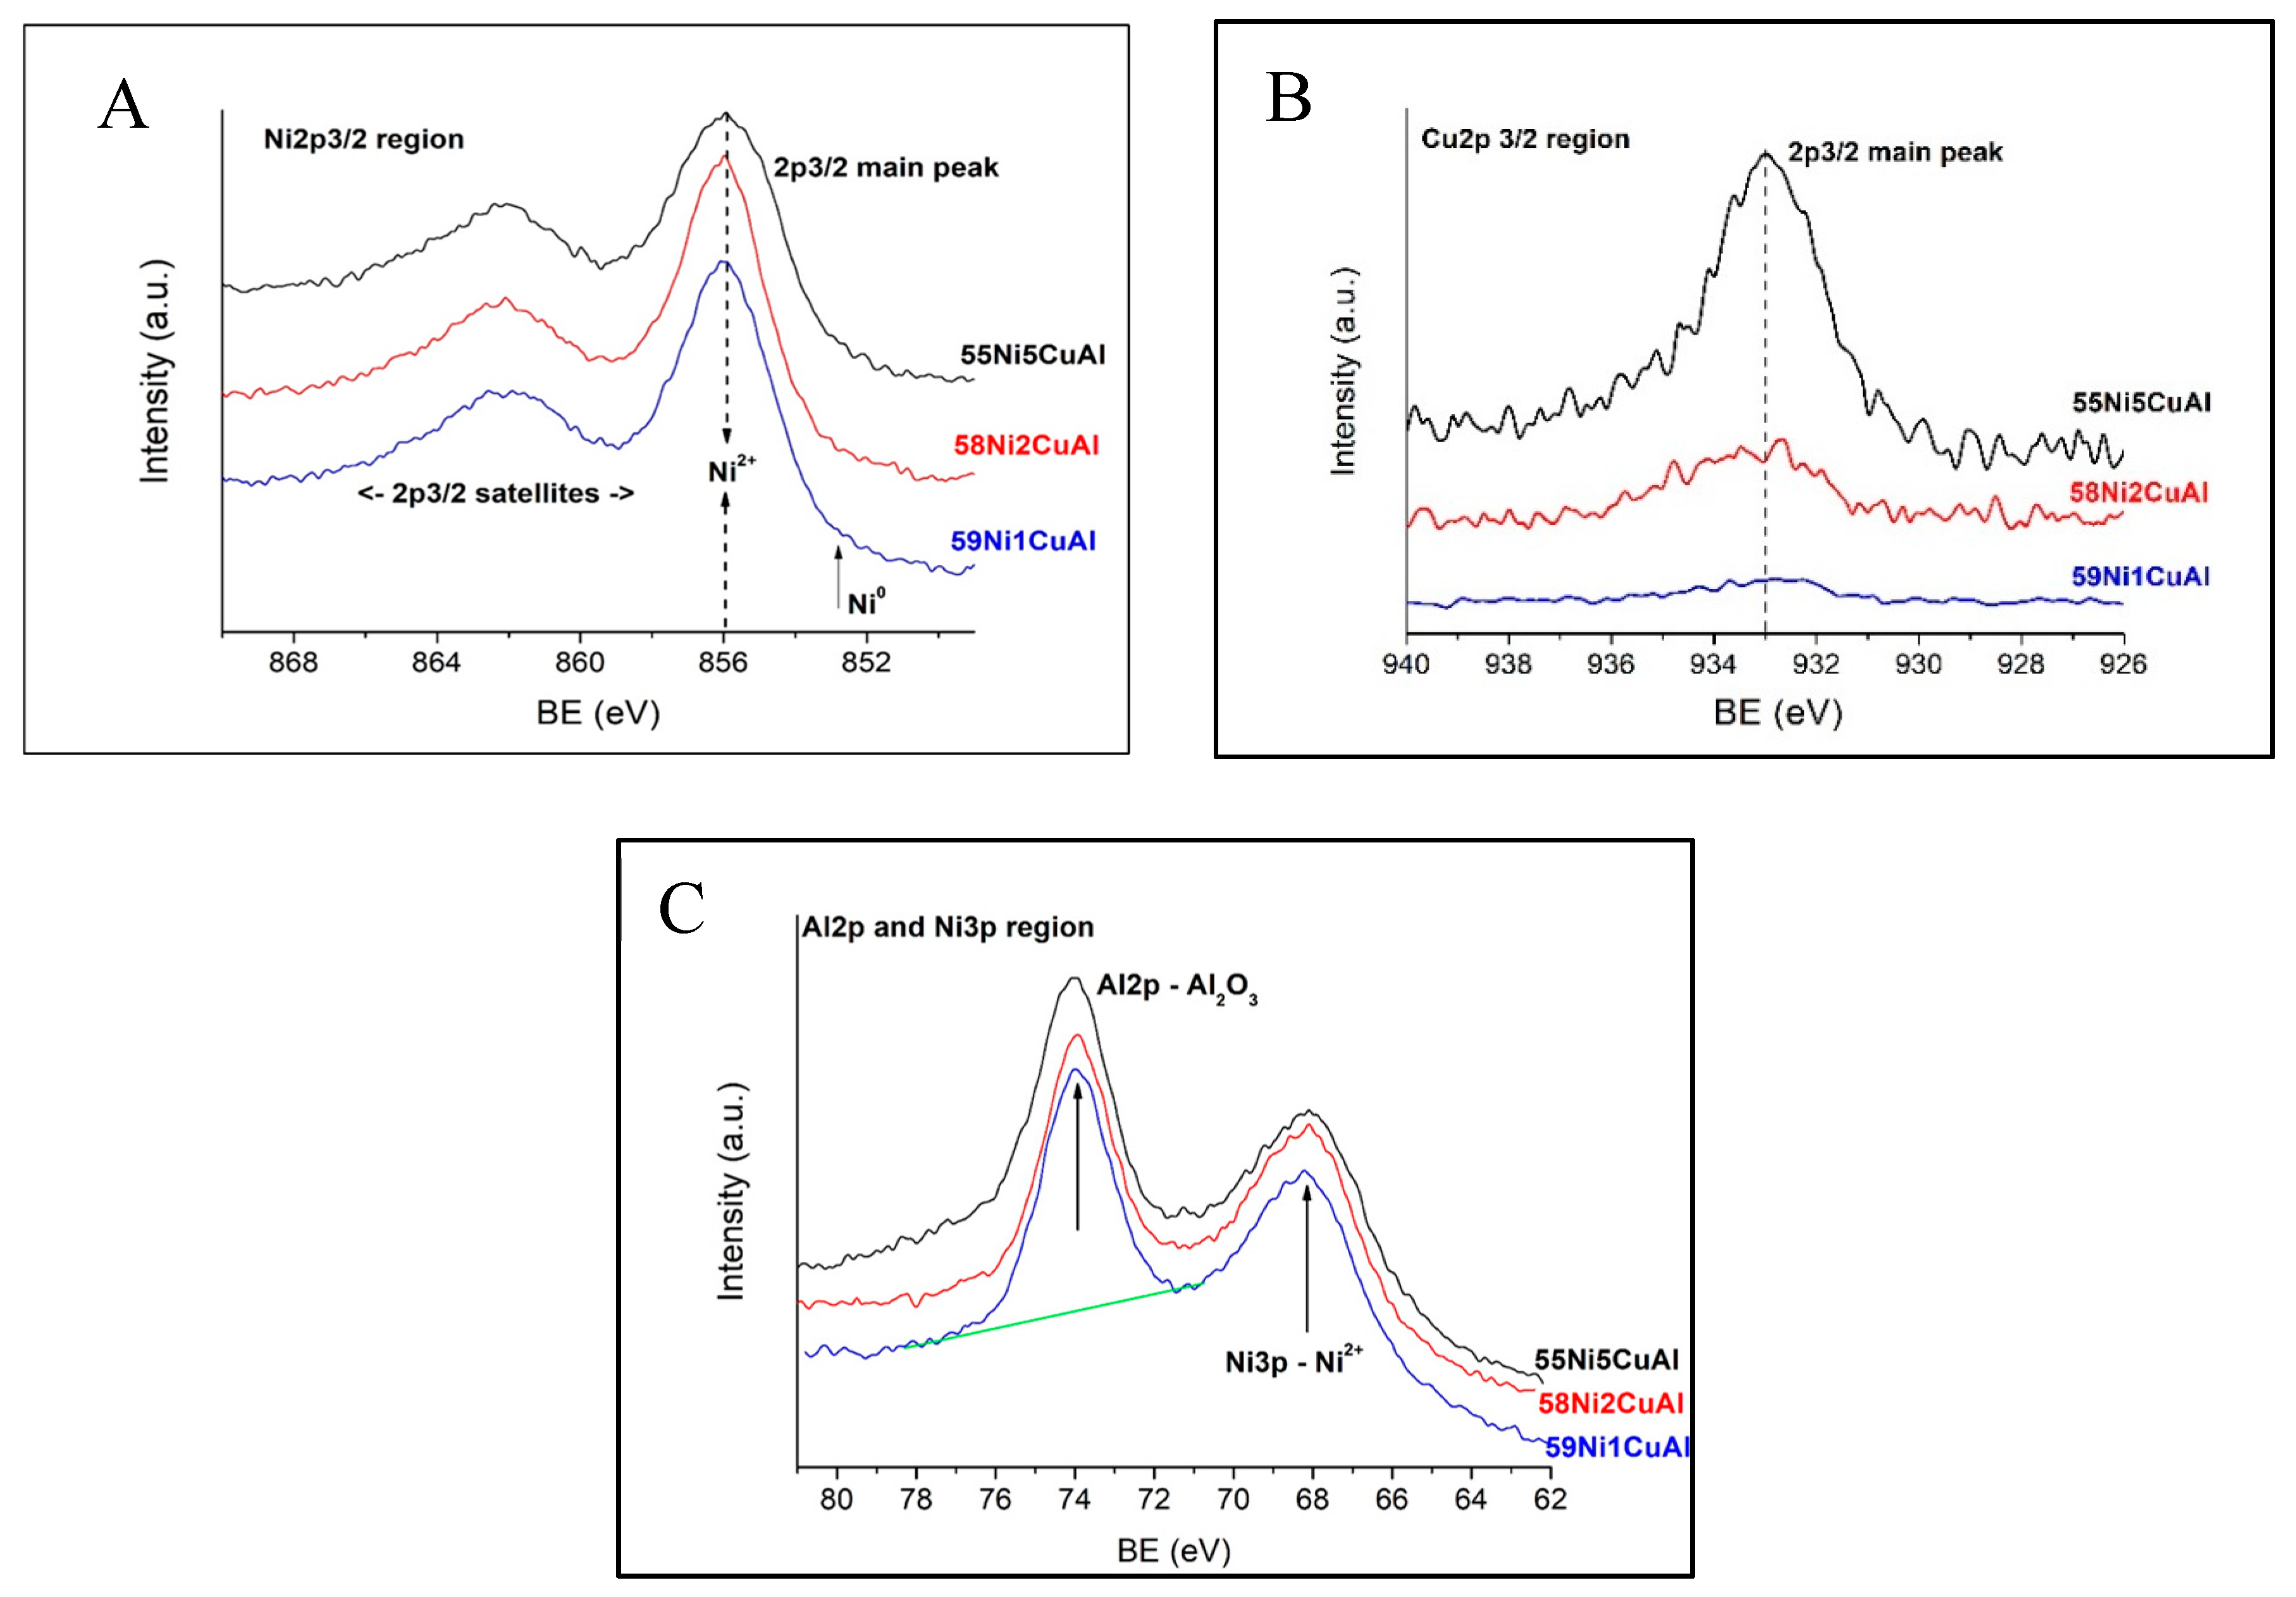
Ex-situ XPS was performed on the promoted catalysts and resulted in the expected detection of Ni, Al, Cu, and O. Organic carbon from a surface contamination layer was also detected. Figure 3A shows the Ni2p3/2 spectral region of the promoted catalysts studied by XPS. The main 2p3/2 component at BE equal to 856 eV is attributed to Ni2+. These spectra show that only traces of Ni0 (less than 5% of the Ni2+) are present in these catalysts, which is in good agreement with the XRD results.
Figure 3B shows the Cu2p3/2 region of the Cu-containing catalysts. Since the Cu-related spectral intensity is small, especially for the 59Ni1CuAl and 58Ni2CuAl catalysts, the Cu2p3/2 spectra for the latter two catalysts in Figure 3B represent the average of 5 and 3 scans, respectively, whereas only one scan was collected for Cu2p3/2 in the 55Ni5CuAl catalyst as well as for all other spectra presented in this section. The Cu2p3/2 peaks are relatively broad and could be described as a superposition of two states, ~932.5 eV (Cu0 or Cu+1) and ~933.7 eV (Cu+2). The low BE state is predominant in the 55Ni5CuAl and 59Ni1CuAl catalysts (FWHM 2.6 and 2.8 eV, respectively), whereas the two states are comparable in the 58Ni2CuAl catalyst (FWHM 3.2 eV). The main Cu Auger LMM peaks (not shown) indicate only very small amounts of Cu0 in the 55Ni5CuAl sample.
Figure 3C shows the broad Ni3p spectral region, which, in all cases, is superimposed by the sharp Al2p peak at a BE of 73.9 ± 0.1 eV, as expected for Al2O3. The area of this peak can be fairly accurately determined by drawing a linear background, as shown in Figure 3C.
The above, in conjunction with the XRD results, provide a deeper insight concerning the nickel–copper surface speciation. Ni2+, Cu0, Cu +1, and Cu+2 phases, which is very likely among Ni0.95Cu0.5O, are present on the surface of the promoted catalysts. The expected formation of alumina was also confirmed.
Table 2 summarizes quantitative surface analysis results obtained by using XPS data (areas of Ni2p3/2, Cu2p3/2, and Al2p peak). More details were reported in Reference [6]. The results are compared with the corresponding calculated nominal atomic bulk compositions, based on the catalyst preparation procedure. The first row in Table 2 shows the corresponding data from measurements on the non-promoted 60NiAl catalyst [6]. One has to notice that the XPS-derived Ni/Al ratio is always larger than the nominal one in the bulk of the corresponding Cu-promoted catalyst (the more so, the higher the Cu content). Furthermore, this ratio is always larger than the corresponding ratio for the non-promoted catalyst (the more so, the higher the Cu content) even though the nominal Ni content in the Cu-containing catalysts should be, in all cases, somewhat smaller than that in the non-promoted one. This suggests that the presence of Cu species tends to increase the dispersion of the Ni-phase in proportion to its content, which is in agreement with the literature [23].
Another interesting observation concerns the relative surface concentration of copper in the promoted catalysts reflected in the Cu/Al ratios. The XPS Cu/Al ratio is lower than the nominal one in the 59Ni1CuAl catalyst. This presumably indicates that the much larger amount of NiO nanoparticles in this catalyst partially cover the copper species during the Ni0.95Cu0.5O phase. This is also reflected in the value of XPS Cu/Ni atomic ratio, which is much lower than the nominal value. In the 58Ni2CuAl catalyst, the XPS Cu/Al atomic ratio is comparable to the nominal one and the value of XPS Cu/Ni atomic ratio is close to the nominal value. Both indicate that there is no considerable masking of the Ni0.95Cu0.5O by the NiO nanoparticles. The situation is very different in the 55Ni5CuAl catalyst where both the XPS Cu/Al and Cu/Ni atomic ratios are higher than the corresponding nominal ones. These indicate that the CuO and Cu0 nanoparticles detected by XRD may situate on the top of Ni0.95Cu0.5O nanoparticles. Thus, the joint use of XRD and XPS characterization shed light on the relative location of the nickel and copper nanoparticles formed on the promoted samples in addition to surface speciation.
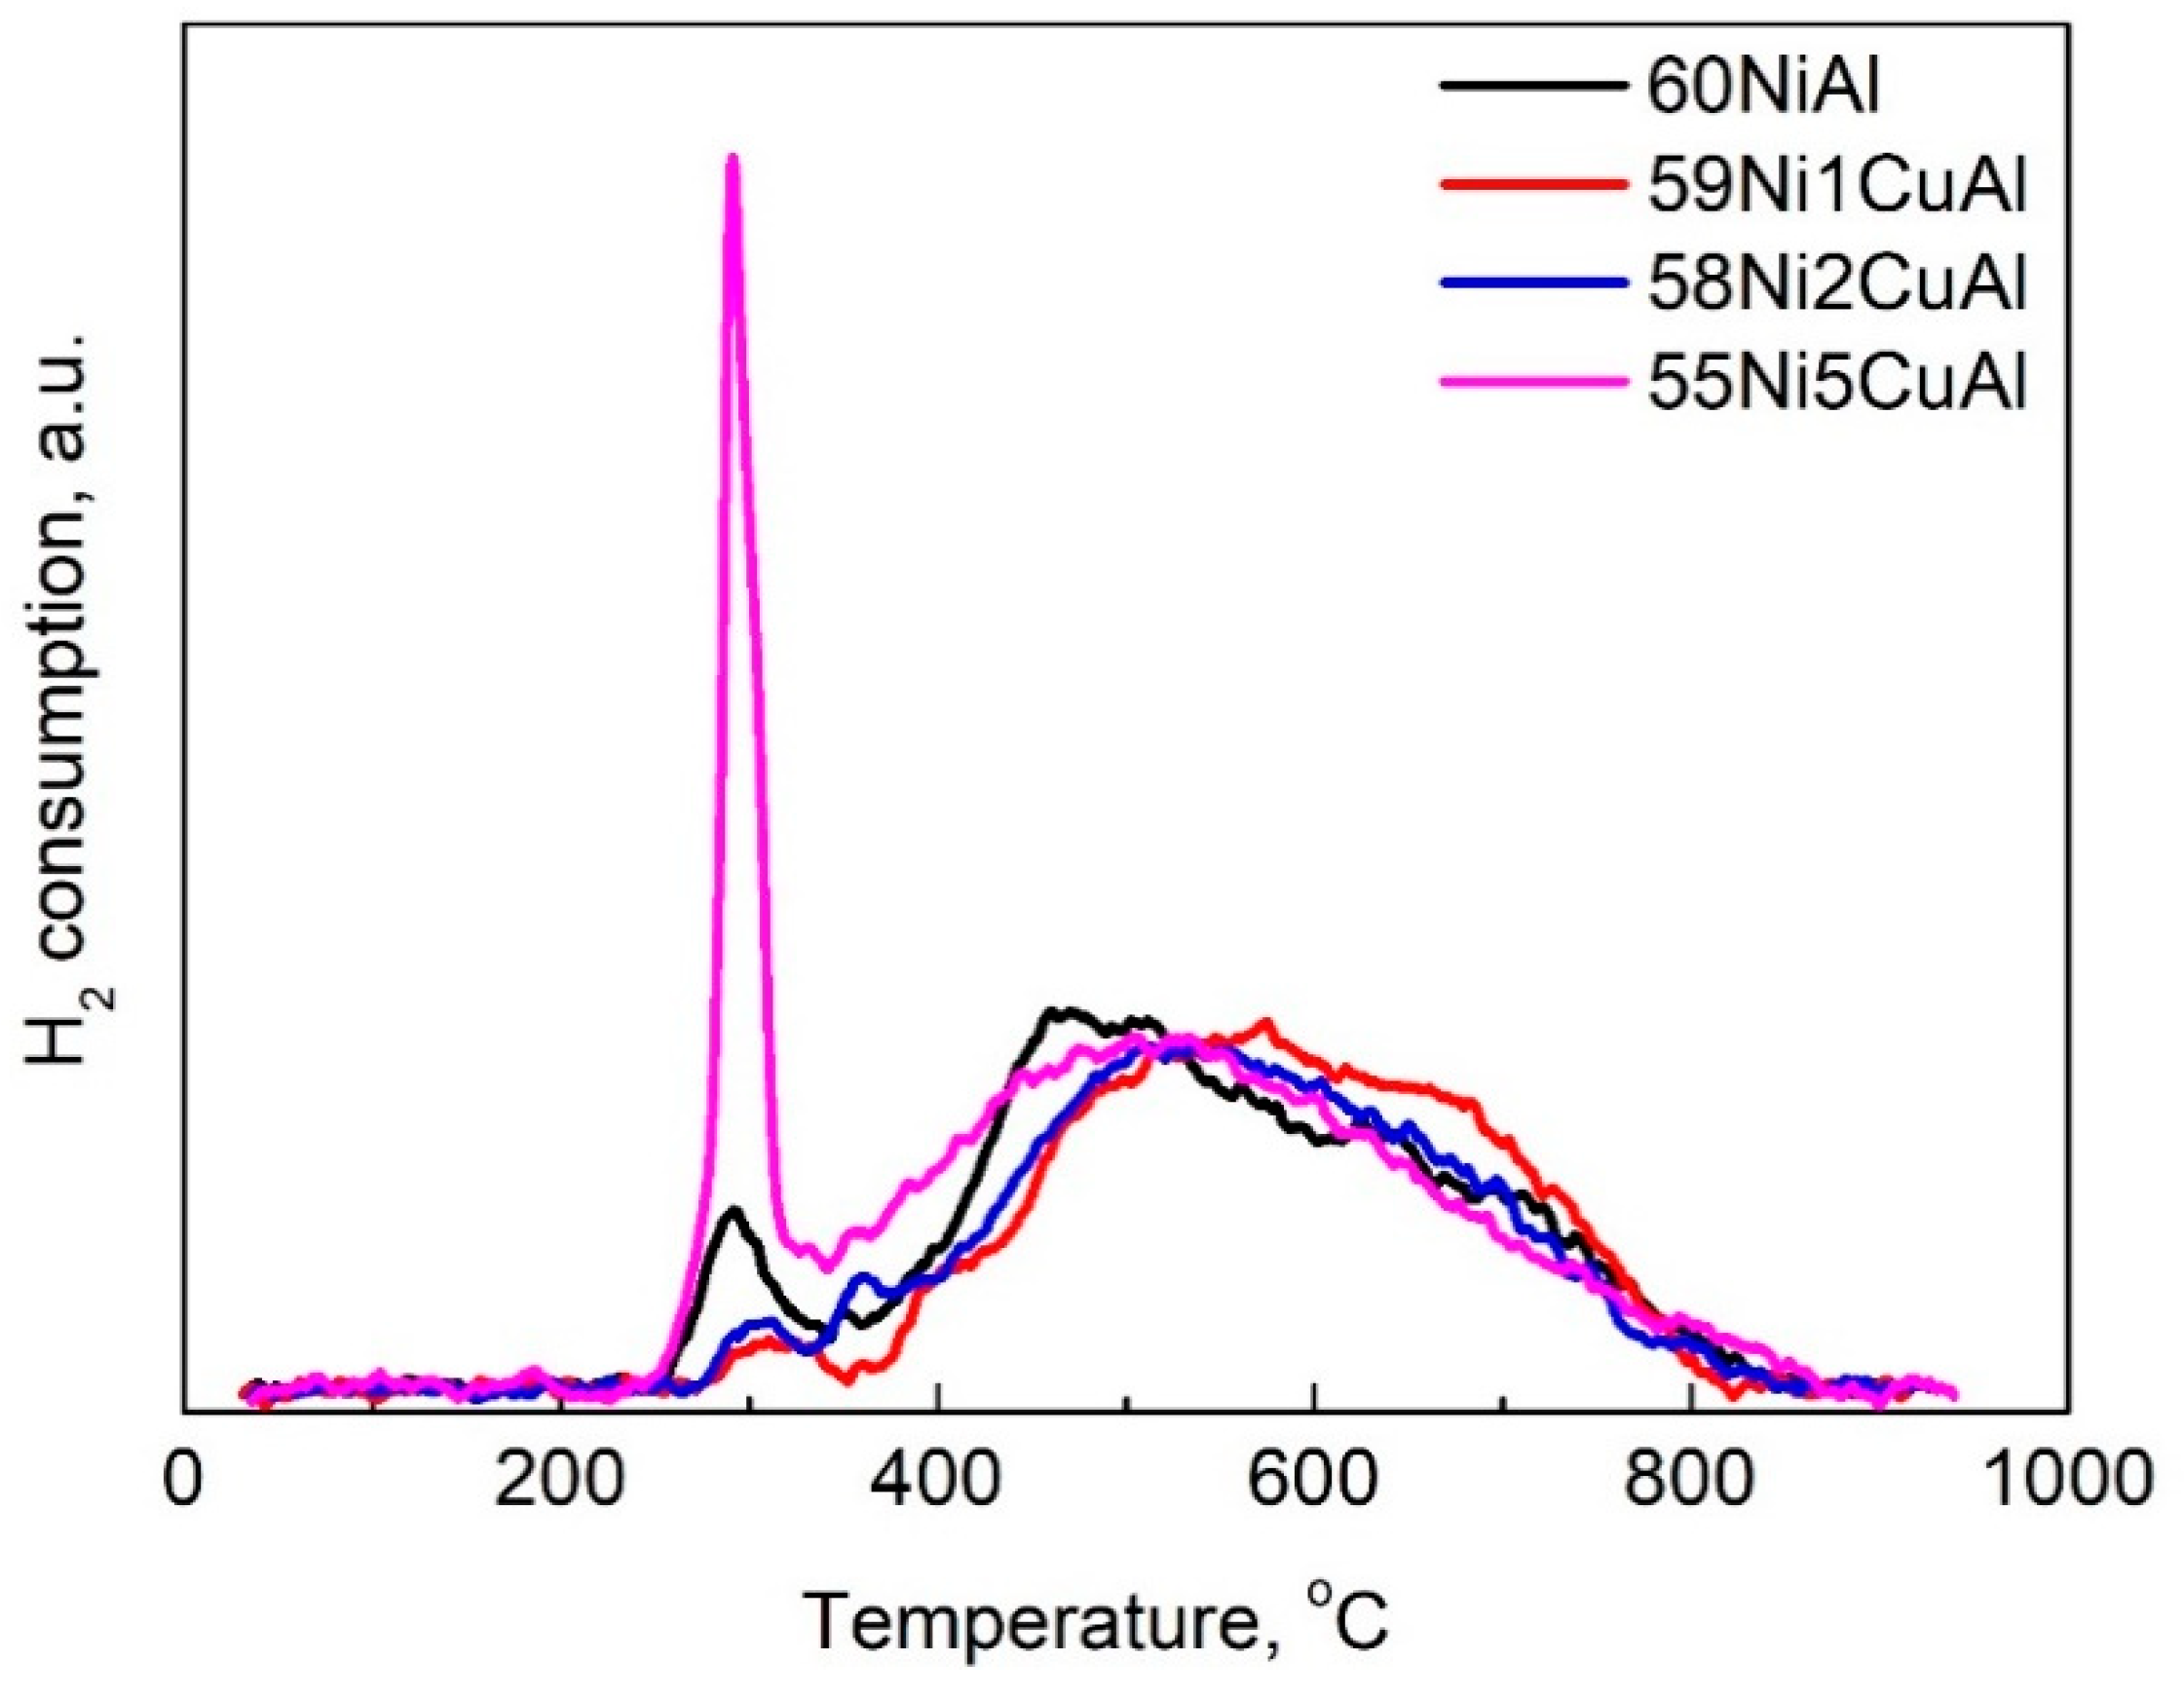
The previously mentioned ex-situ characterization indicated the formation of nickel and copper non-metallic phases. Only in the 55Ni5CuAl catalyst, metallic copper was, in addition, detected. The absence of metallic phases could be attributed either to no formation of these phases upon activation or to the extensive surface re-oxidation of the Ni0 and Cu0 due to the atmospheric exposure. In order to clarify this point, we performed H2-TPR. Figure 4 shows the H2-TPR curves of the catalysts studied.
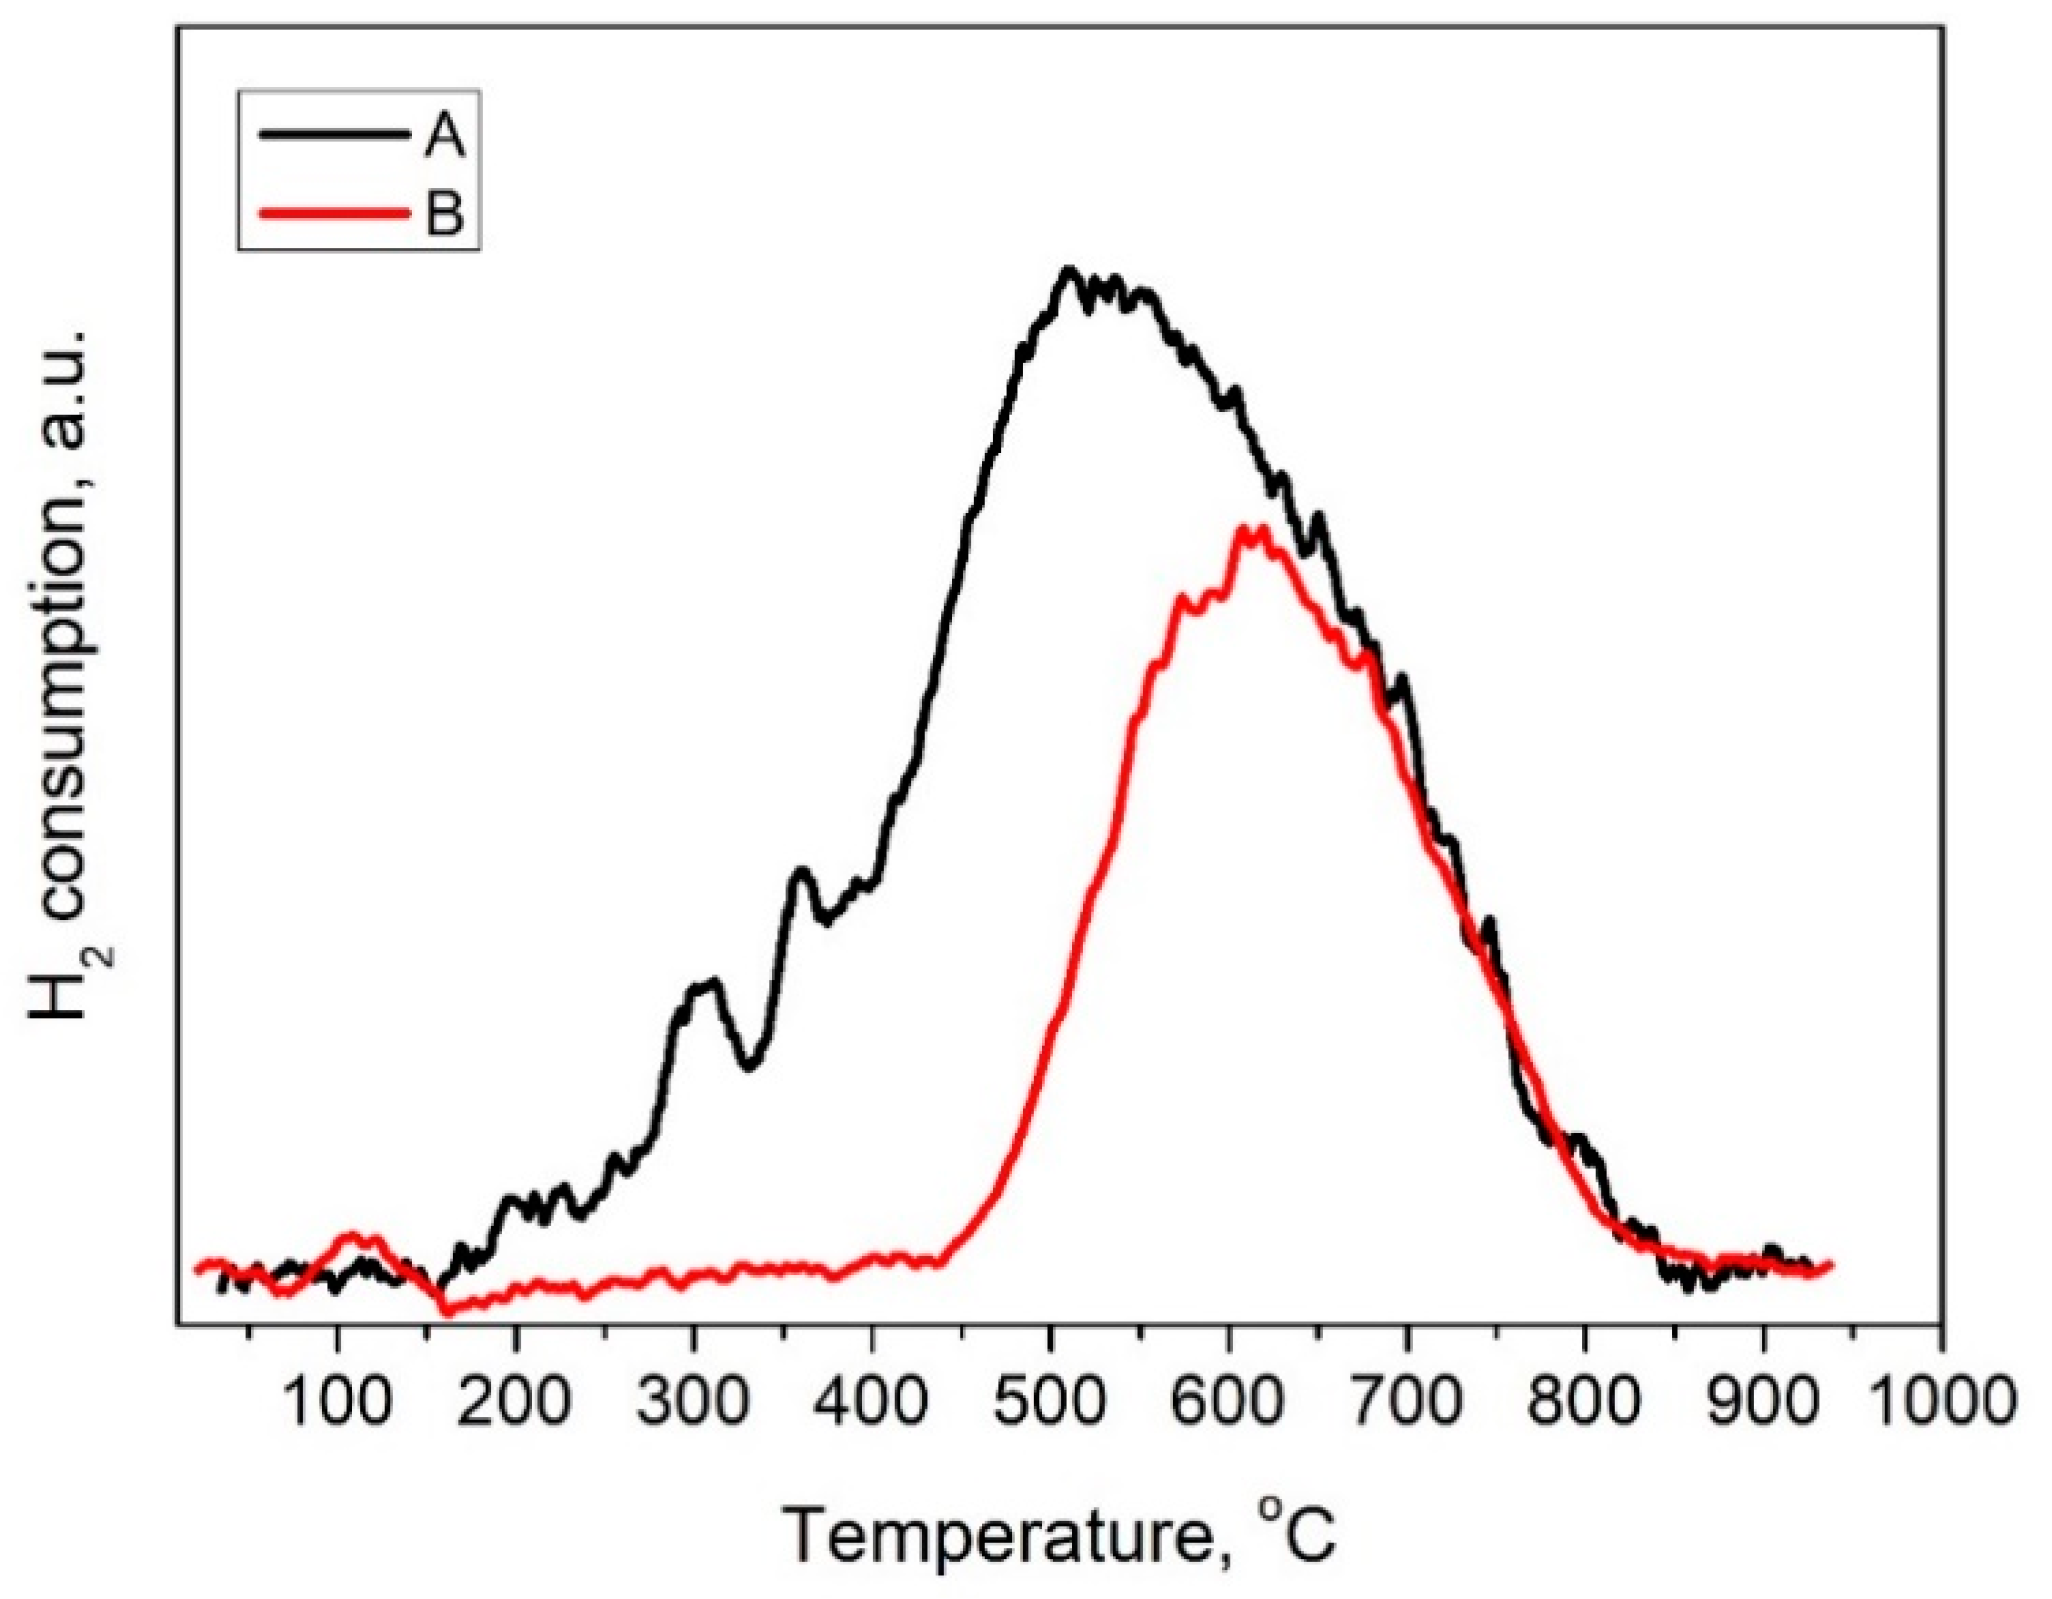
The H2-TPR profile of the sample 60NiAl is characterized by two well-distinguished peaks. The first small size symmetric peak with a maximum at ~300 °C is assigned to the reduction of NiO nanoparticles weakly interacting with alumina [31,35,36]. These particles are created in the precursor state during the thermal treatment of the sample under Ar. The addition of Cu up to 2% decreases the size of this peak, which suggests a decrease of the relatively bigger NiO nanoparticles and, thus, weakly interacting with alumina. This is in line with the increase in the nickel dispersion inferred by XPS. The very high peak at about 300 °C in the sample with the higher Cu loading (55Ni5CuAl) is attributed to the reduction of CuO to Cu0 [23,27,28,29]. There is no doubt that both the previously mentioned NiO and CuO reductions occur upon activation taking place at 400 °C. It is plausible assuming that the metallic nickel (copper) formed is entirely (partially) re-oxidized upon atmosphere exposure, which is in agreement with the XRD and XPS results. The second broad peak is assigned to various Ni-oxo species strongly interacting with the alumina and resembling the hardly reduced NiAl2O4 phase [31,35,36]. The addition of Cu is causing a slight shift of the maximum of the broad peak toward higher temperatures, which likely indicates the increase in the NiO/Ni0.95Cu0.5O dispersion deduced by XPS. Taking into account that (i) the low temperature extreme of the broad reduction band is located below 400 °C, (ii) the catalysts activation-reduction time (2.5 h), and (iii) the transient character of the H2-TPR method, we are arguing that the reduction of the NiO/Ni0.95Cu0.5O and CuO species present in the precursor catalysts are reduced in great extent upon activation. Then these are re-oxidized upon atmospheric exposure. This is in line with the literature. In fact, Miao et al. [30] reported that the oxidic precursors are reduced at 420 °C for 2 h into the corresponding metallic catalysts, comprised from Ni0, Cu0, and NiCu alloy-supported species. In conclusion, the NiO, CuO, and Ni0.95Cu0.5O species deduced by the Ex-situ characterization had been presumably transformed in a great extent into Ni0, Cu0, and a Ni-Cu alloy very rich in nickel catalysts upon activation. To further investigate this point, we are performing the following experiment for the 58Ni2CuAl catalyst, taken as an example. The precursor catalyst was activated in the TPR set–up at 400 °C for 2.5 h, the temperature was reduced at 100 °C under hydrogen flow, and the H2-TPR experiment was performed in situ for the activated catalyst (Figure 5). A comparison of the H2-TPR profiles of the precursor and the activated catalyst clearly shows that inception point of catalyst reduction was shifted from ~200 to ~450 °C after catalyst activation whereas the amount of the reduced species was considerably reduced. This corroborates our previous assumption that the NiO, CuO, and Ni0.95Cu0.5O species deduced by the Ex- situ characterization had been transformed in a great extent into Ni0, Cu0, and a Ni-Cu alloy very rich in nickel upon activation. This is not the case for the like NiAl2O4 surface phase since the reduction above 700 °C is similar for the precursor and activated catalyst. This phase seems to be well dispersed and, thus, it is not detectable by XRD. In this point, one may wonder whether the Ni0, Cu0, and a Ni-Cu species re-oxidized upon exposure in air are actually present in the functional catalysts working under a very reducible atmosphere (hydrogen pressure 40 bar). There is strong evidence that it is actually the case.
In fact, Totong et al. [37] have recorded the H2-TPR profiles after chemical activation (reduction by NaBH2) of nickel catalyst (10 wt. % Ni) supported on CeO2-ZrO2 and its exposure in air. The H2-TPR profile exhibited re-reduction peaks. Moreover, the formation of the Ni-Cu alloy has been reported several times in the literature [19,20,21,22,23,28,29,30]. The formation of the Cu–Ni alloy favors SDO and inhibits cracking of the C–C bonds, which leads to enhanced catalytic performance [23,28,29]. Extending the picture, we had outlined the local arrangement of nickel and copper oxide species into the reduced ones. We are visualizing the surface speciation in the functional catalysts. In the 59Ni1CuAl catalyst, the much larger amount of Ni0 nanoparticles covers partially the Ni-Cu alloy, whereas, in the 58Ni2CuAl catalyst, there is no considerable masking of this Ni-Cu alloy by the Ni0 nanoparticles. Lastly, in the 58Ni5CuAl catalyst, a portion of Cu0 nanoparticles partially cover the Ni-Cu alloy ones.
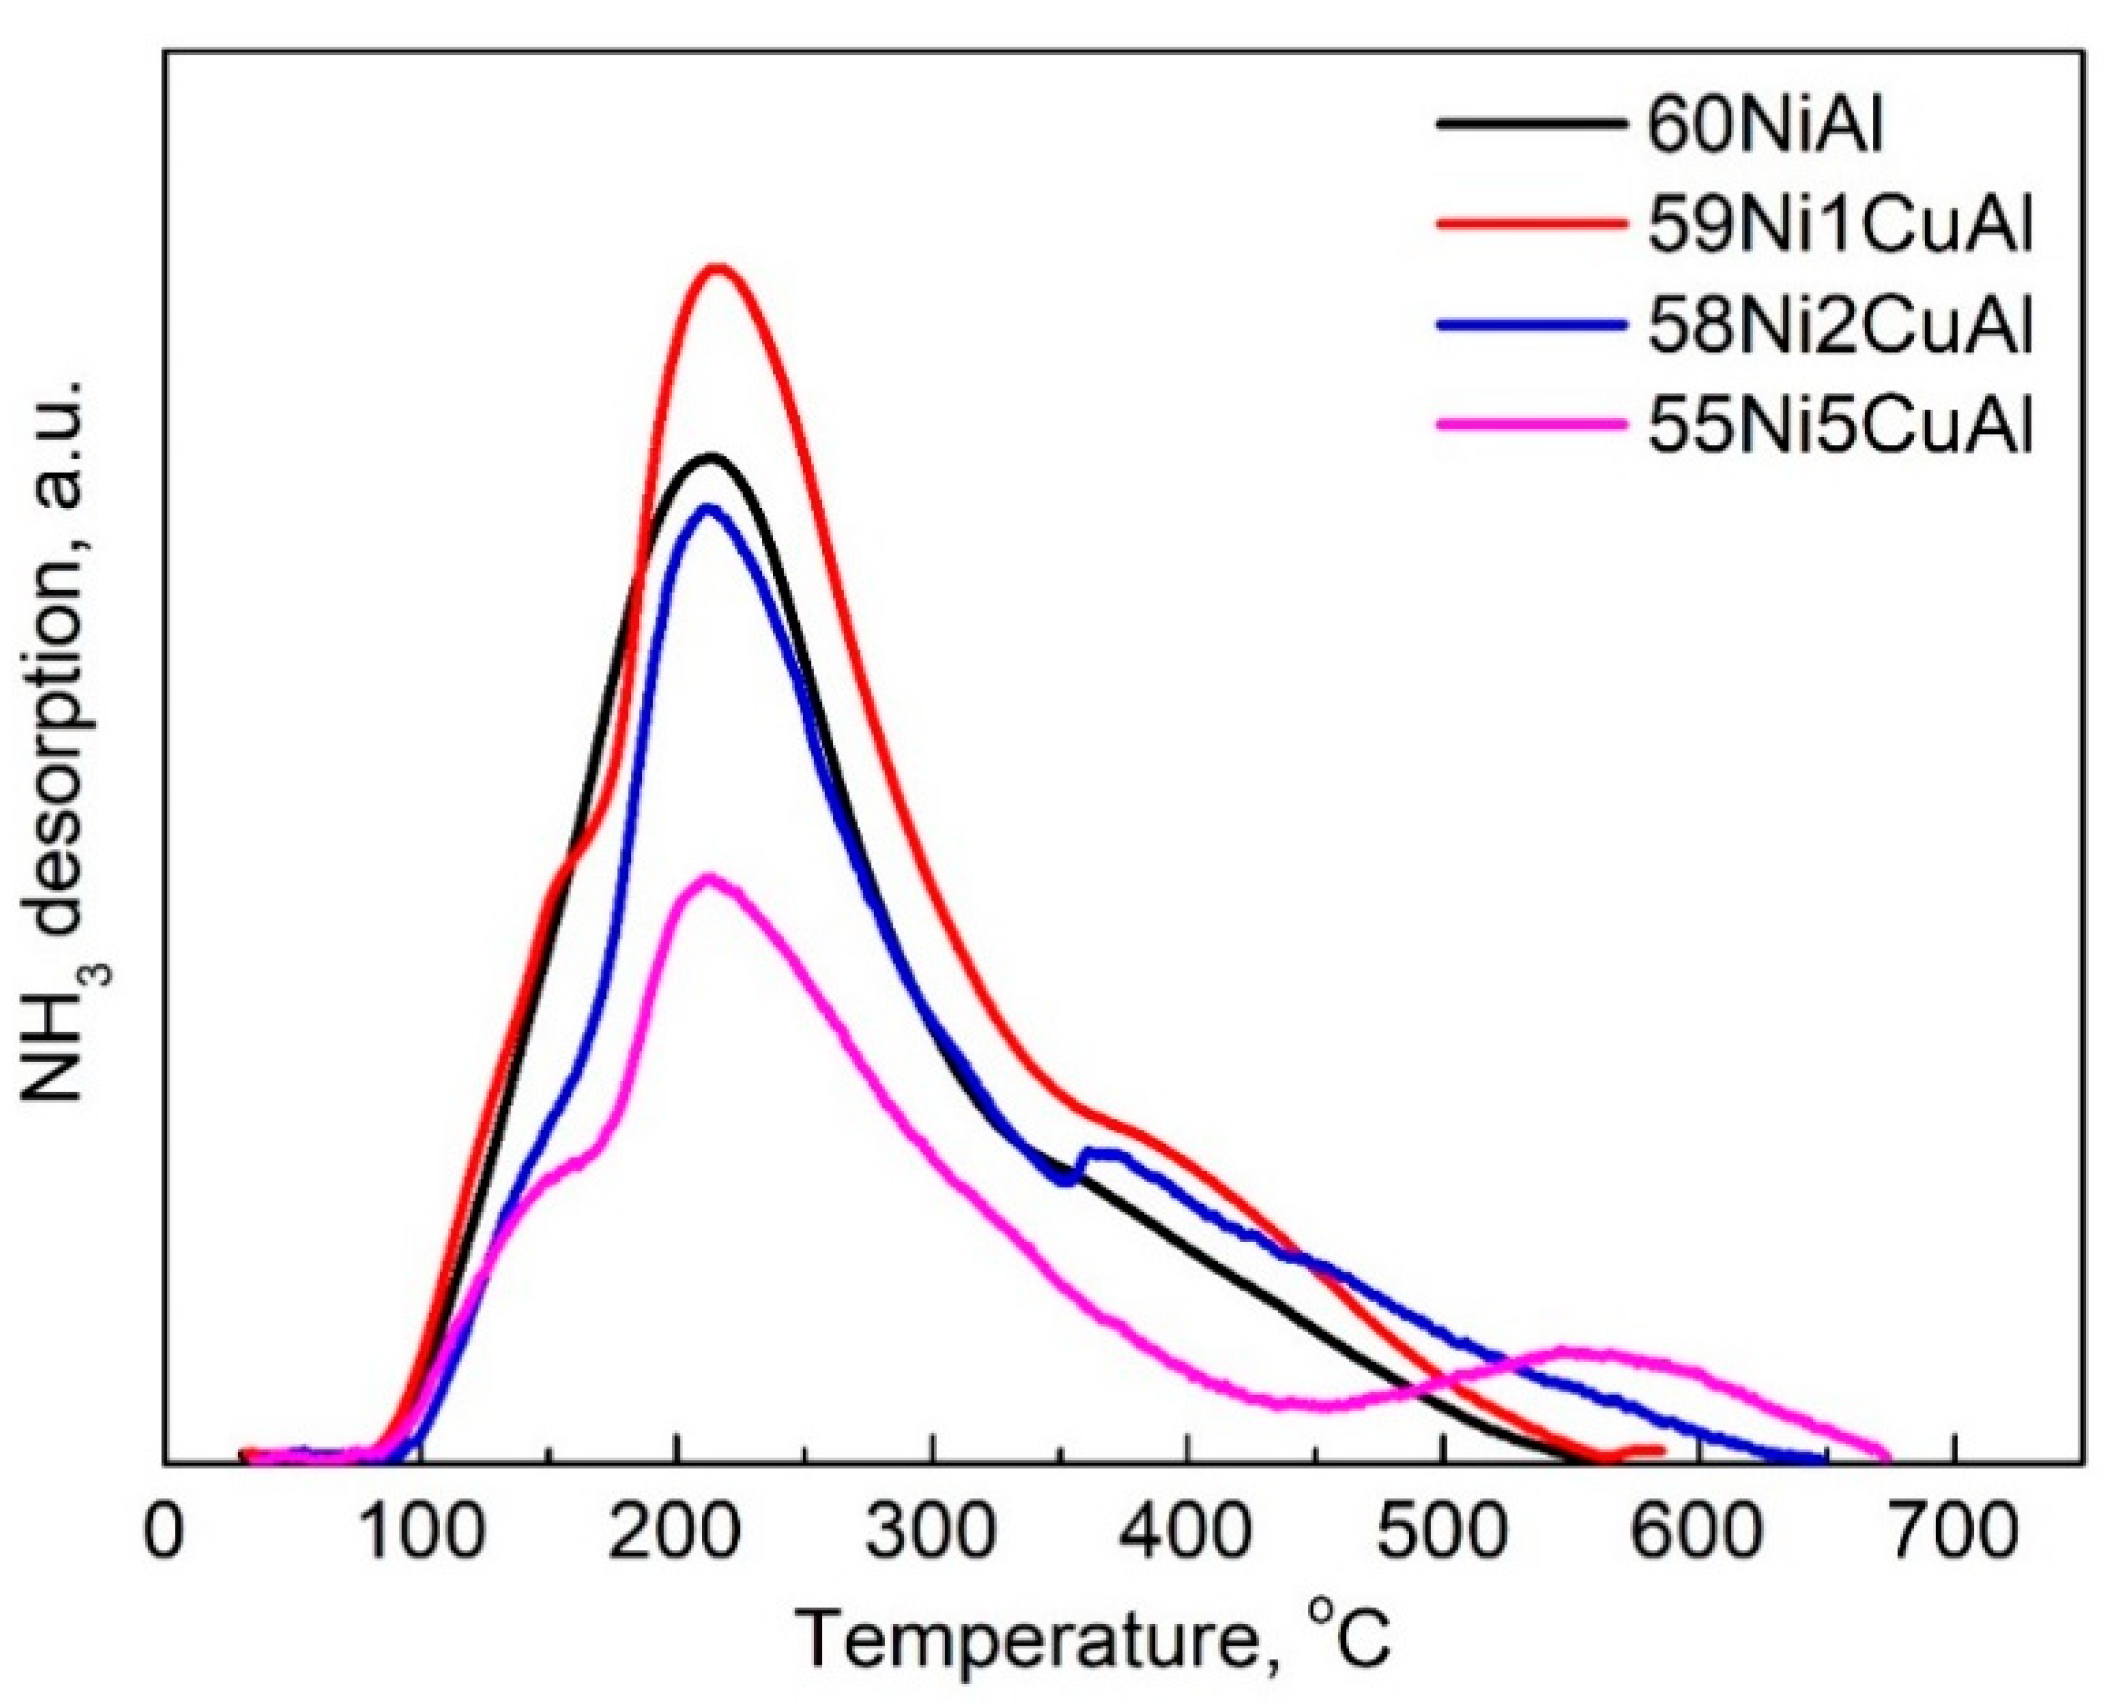
The acidity of the catalysts has been studied by NH3-TPD. Figure 6 reveals that all catalysts exhibit mainly weak (desorption temperature range <300 °C) and relatively low moderate (desorption temperature range 300–450 °C) and very low strong (desorption temperature range >450 °C) acidity [17,38,39]. A small addition of Cu (59Ni1CuAl) increases total acidity. However, this trend is reversed as the Cu loading is further increased. It is interesting that the sample with the maximum copper content exhibits considerably low weak/moderate acidity and relatively high strong acidity.

3.2. Catalysts Evaluation

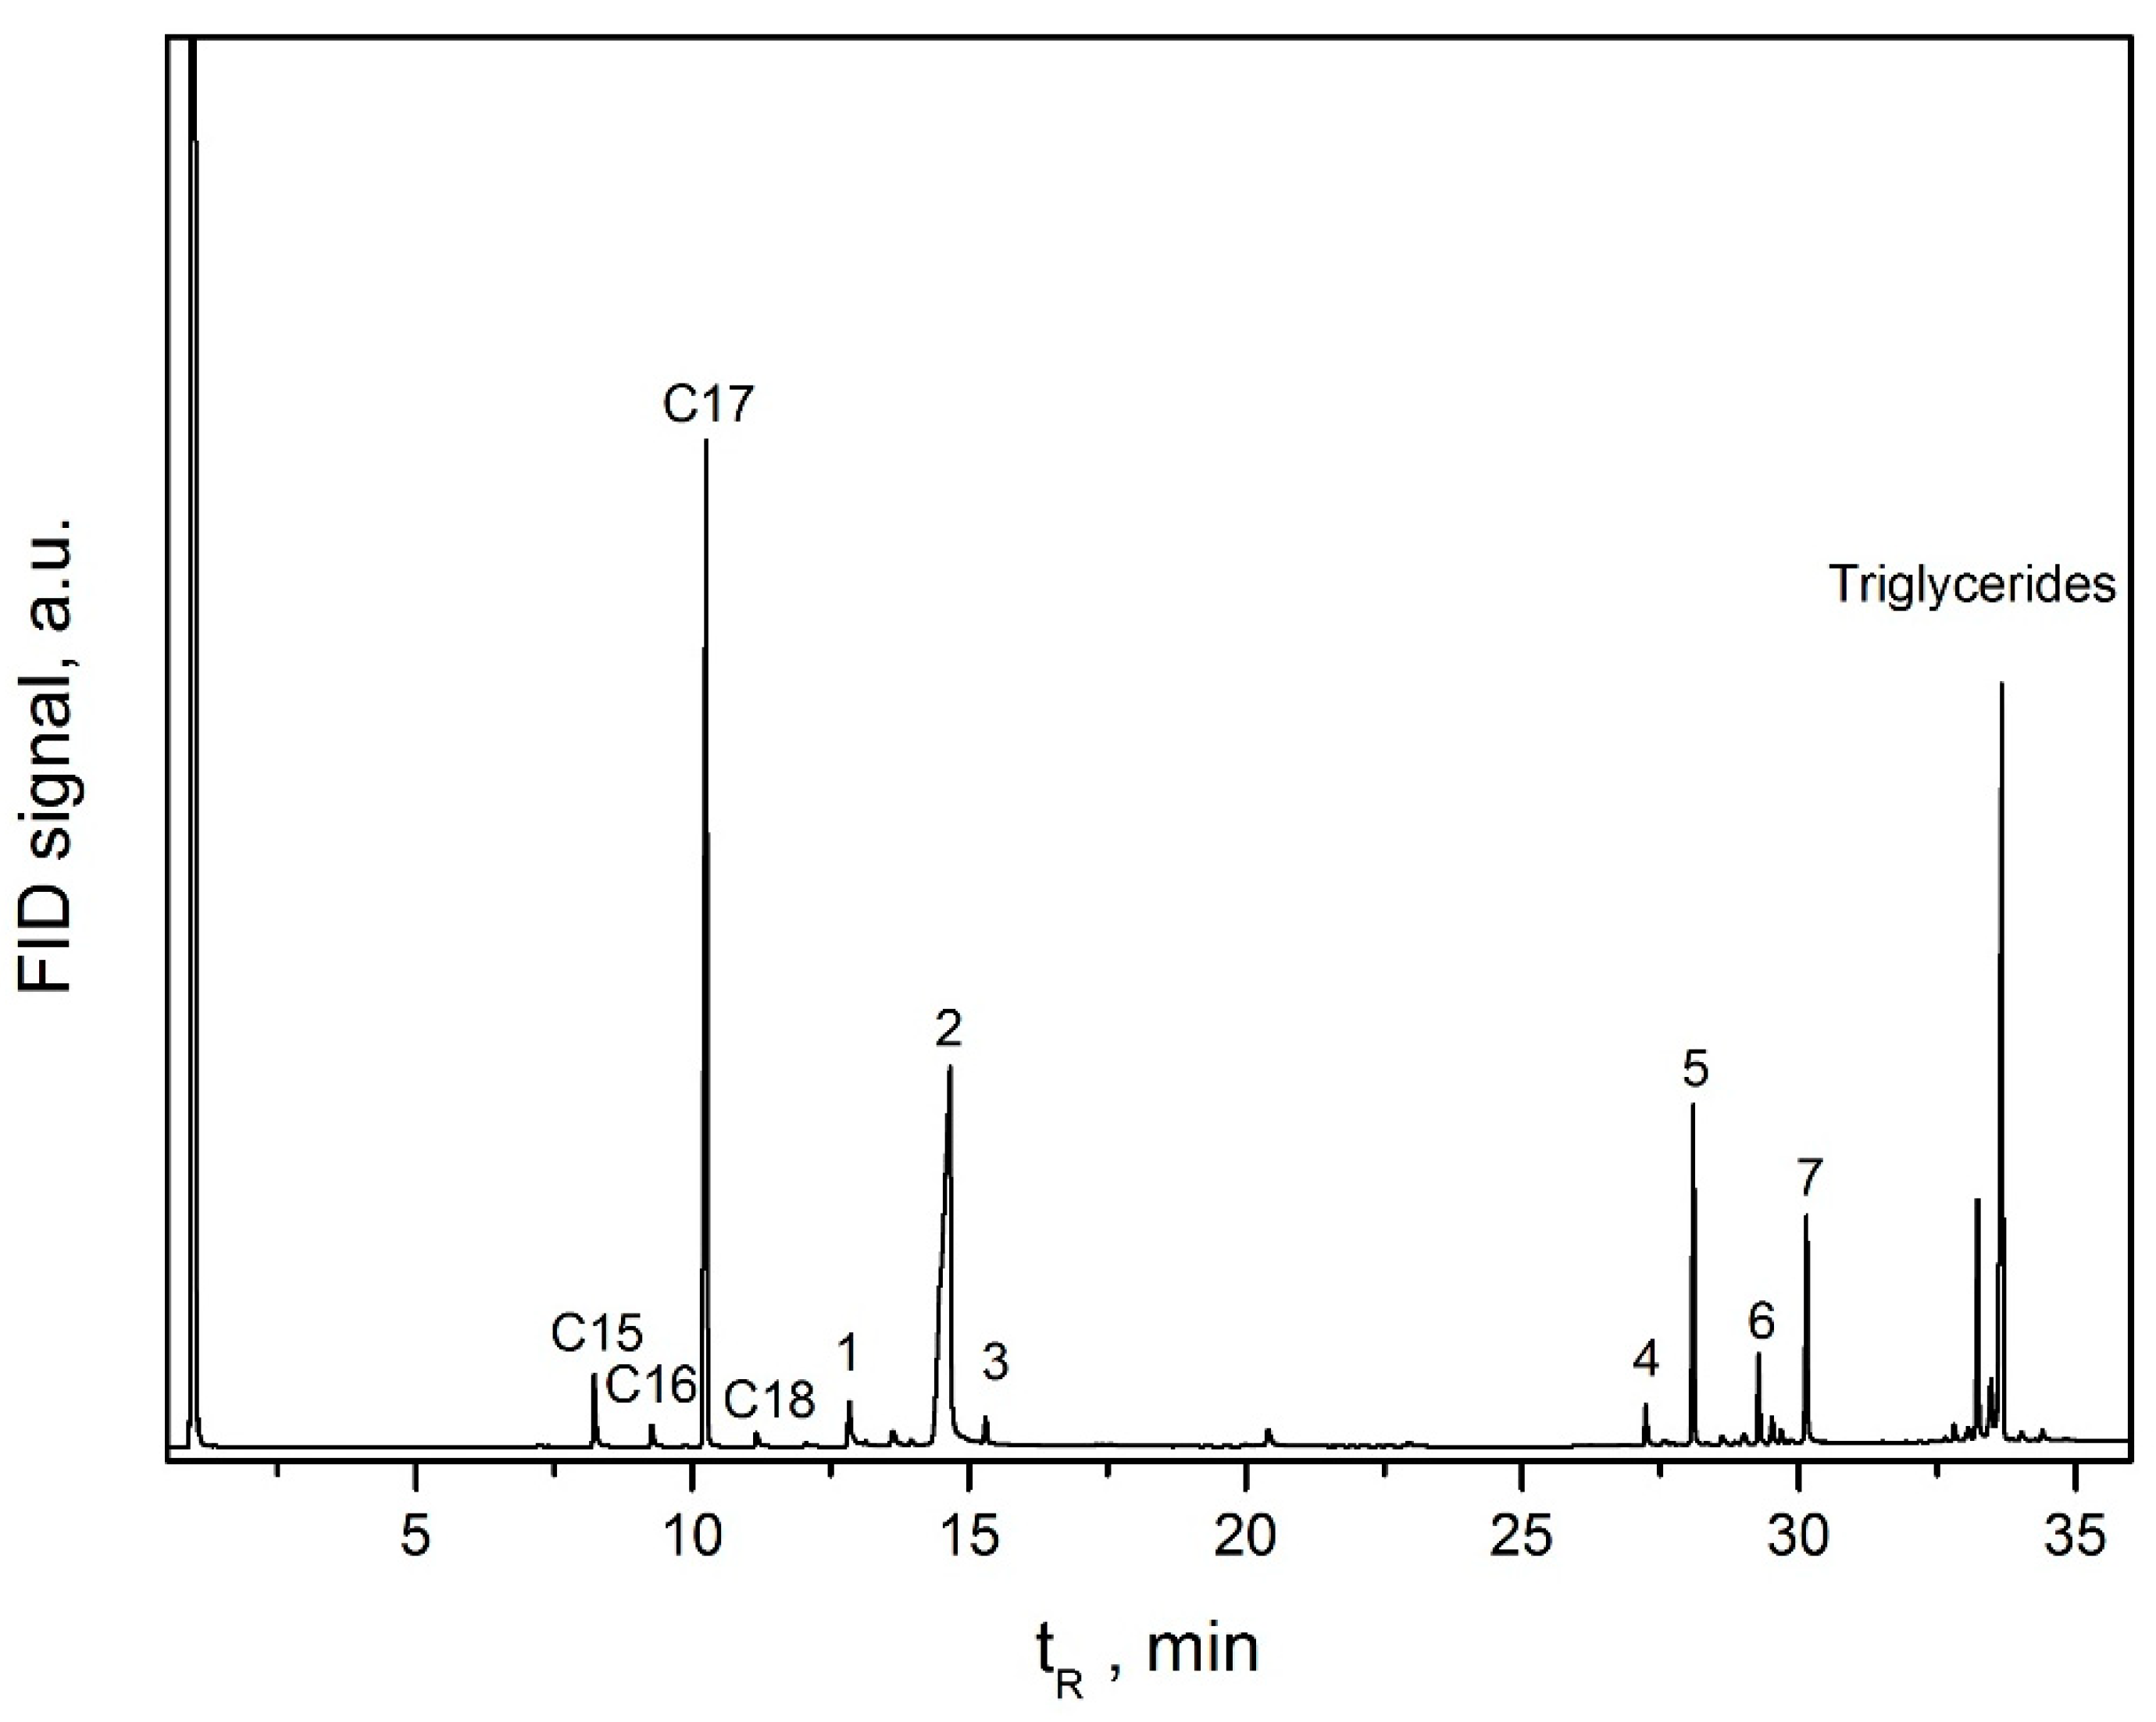
A representative chromatogram taken after sampling the liquid phase of the reactor is depicted in Figure 7.
Inspection of the chromatograms in conjunction with the study of GC-MS spectra showed the presence of the non–reacted SFO and normal alkanes in the diesel range (n-C17, n-C18, n-C15, and n-C16). Hydrocarbons with a smaller number of carbon atoms are not detected in the liquid phase of the reaction mixture. We have detected intermediate compounds such as acids (palmitic and stearic acid), propyl and ethyl esters (ethyl stearate and propyl stearate), bigger esters (palmityl stearate, stearyl stearate, 2(octadecyloxy) ethyl stearate), and saturated diglycerides (distearine). In the gas phase, we have detected propane, CO, CO2, and CH4. The same products were detected in the presence of the non-promoted and the promoted catalysts, which suggests no considerable influence of copper on the entire SDO reaction network described in the introduction.
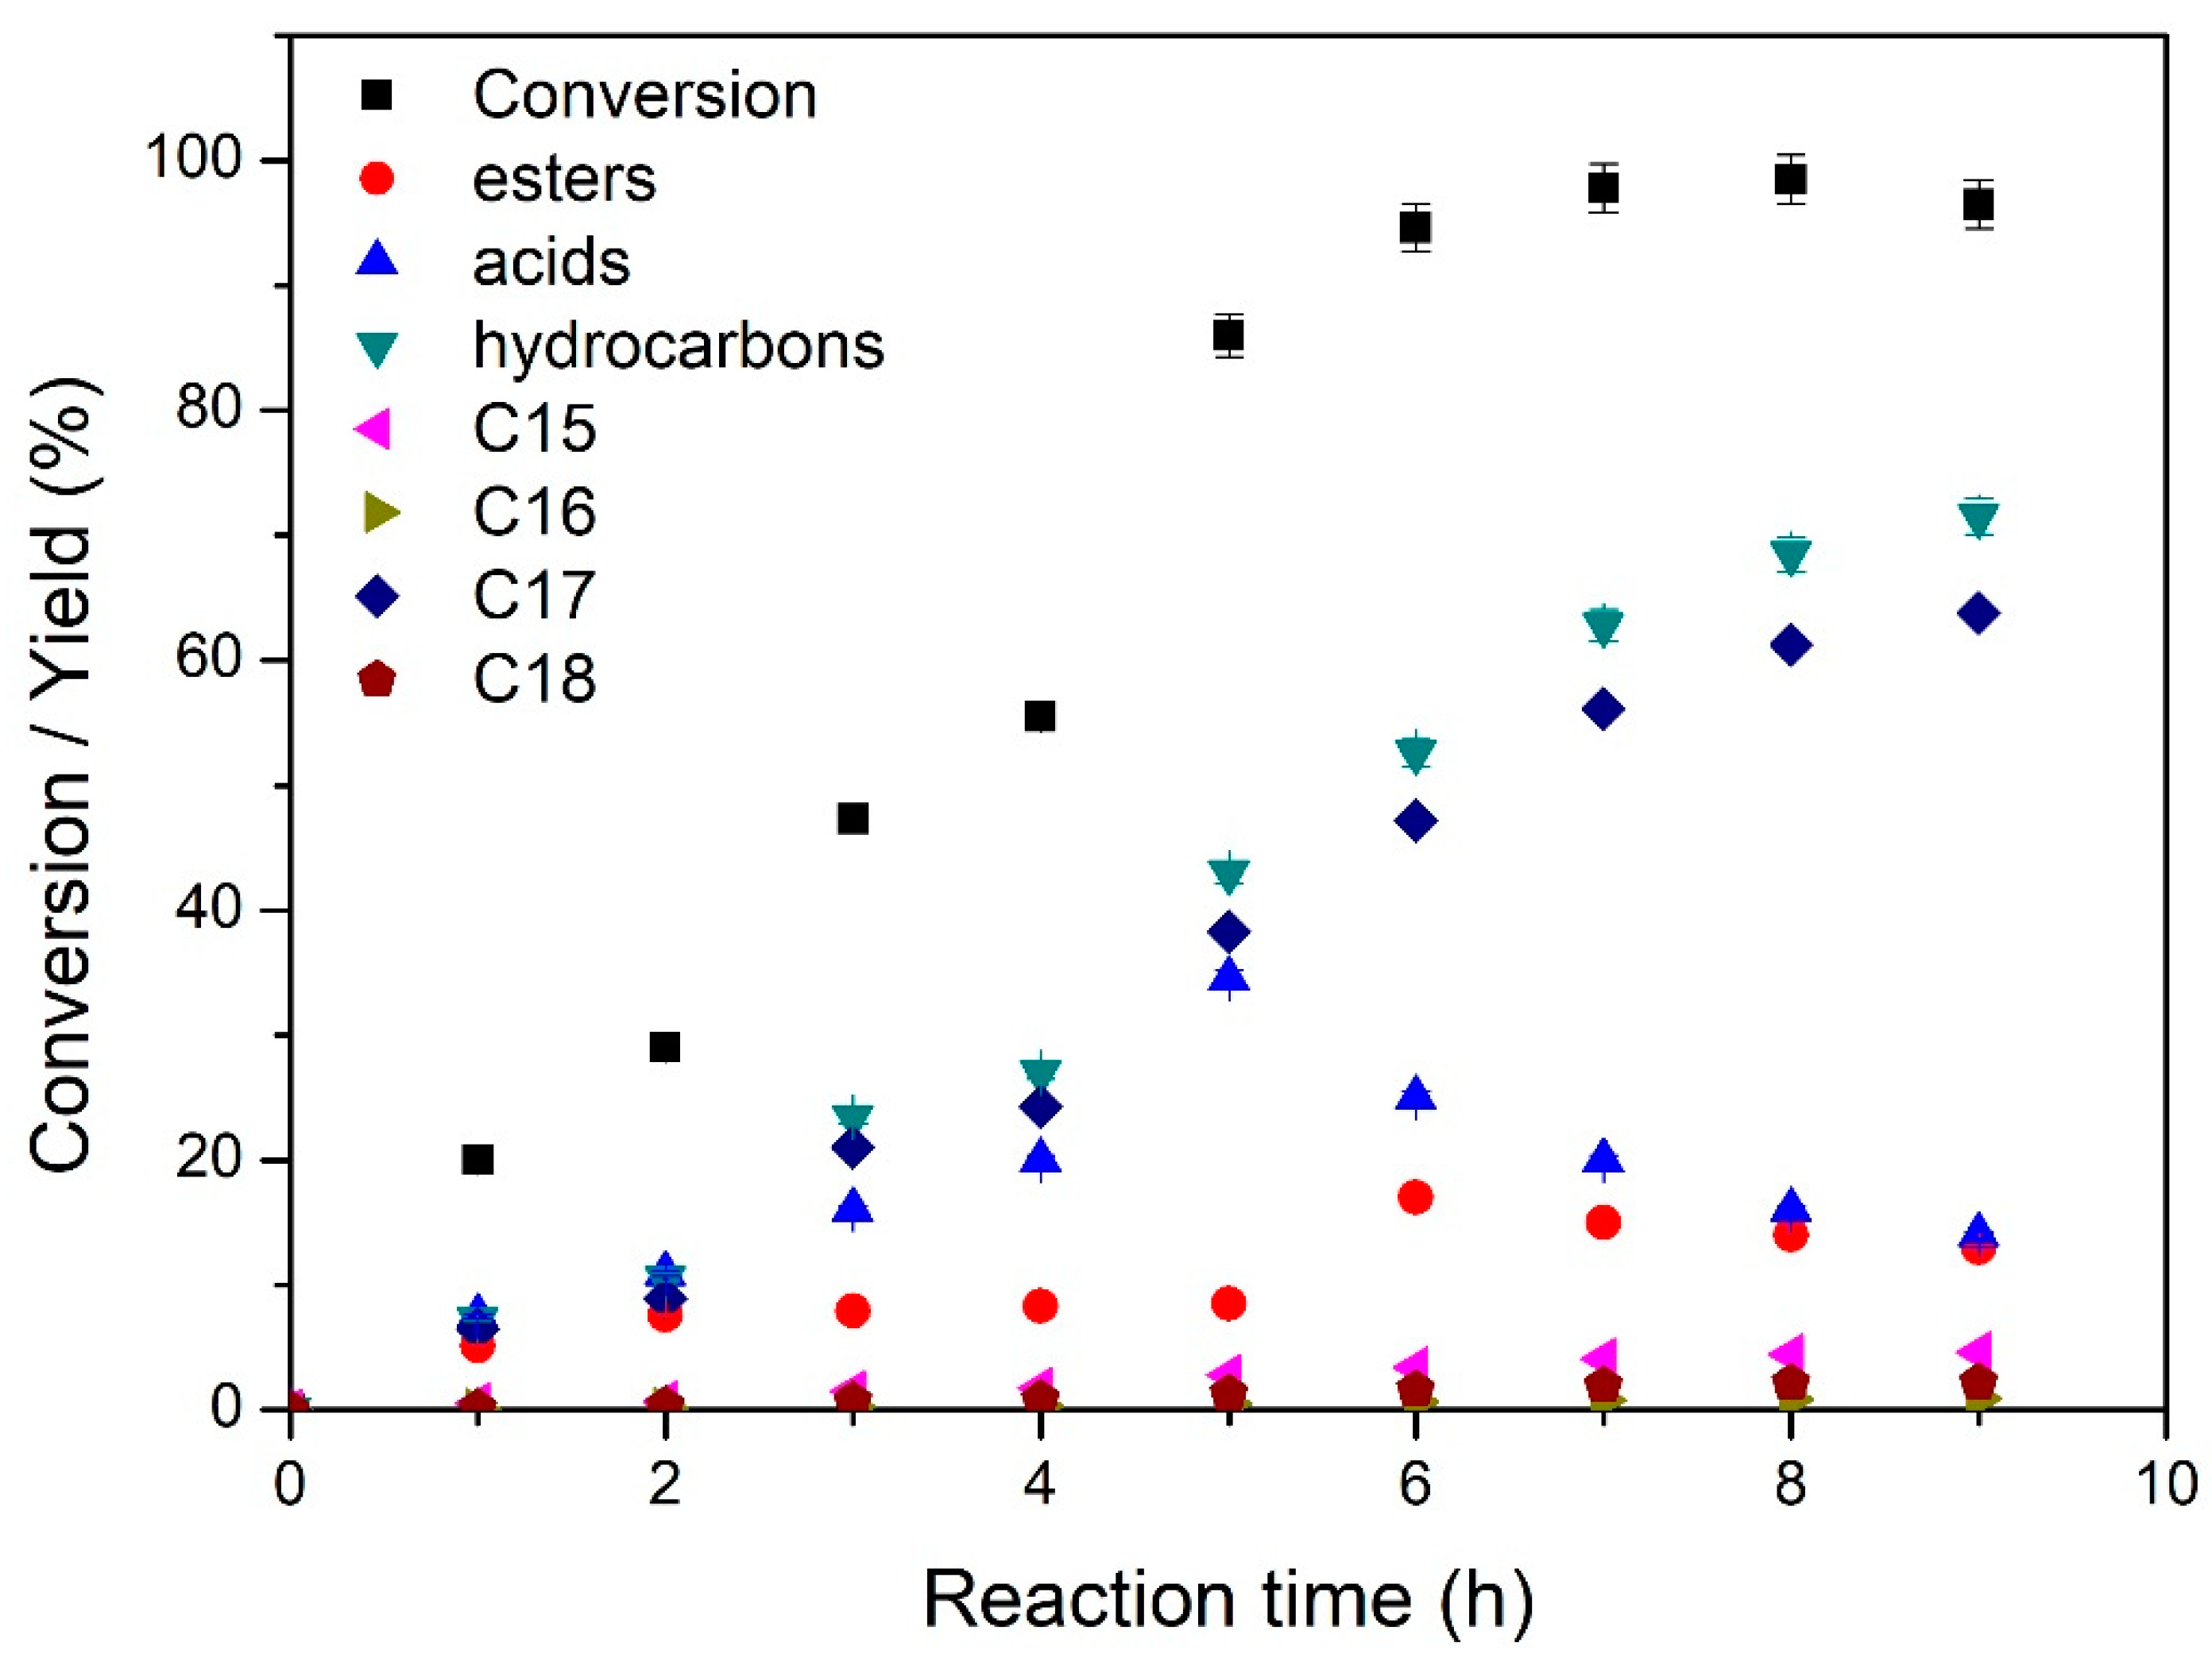
The variation with time of the conversion of SFO and the composition of the liquid reaction mixture in hydrocarbons, acids, and esters, determined over the most active catalyst 58Ni2CuAl, is illustrated in Figure 8.
Inspection of this figure shows that the composition in total hydrocarbons and each hydrocarbon separately increase monotonically with time. In contrast, the composition in the intermediate total acids and esters increases initially with time and then it decreases. Similar kinetic curves were obtained for all the catalysts evaluated in the present work. This suggests no considerable influence of copper on the SDO mechanistic scheme described in the introduction for the nickel-based catalysts.
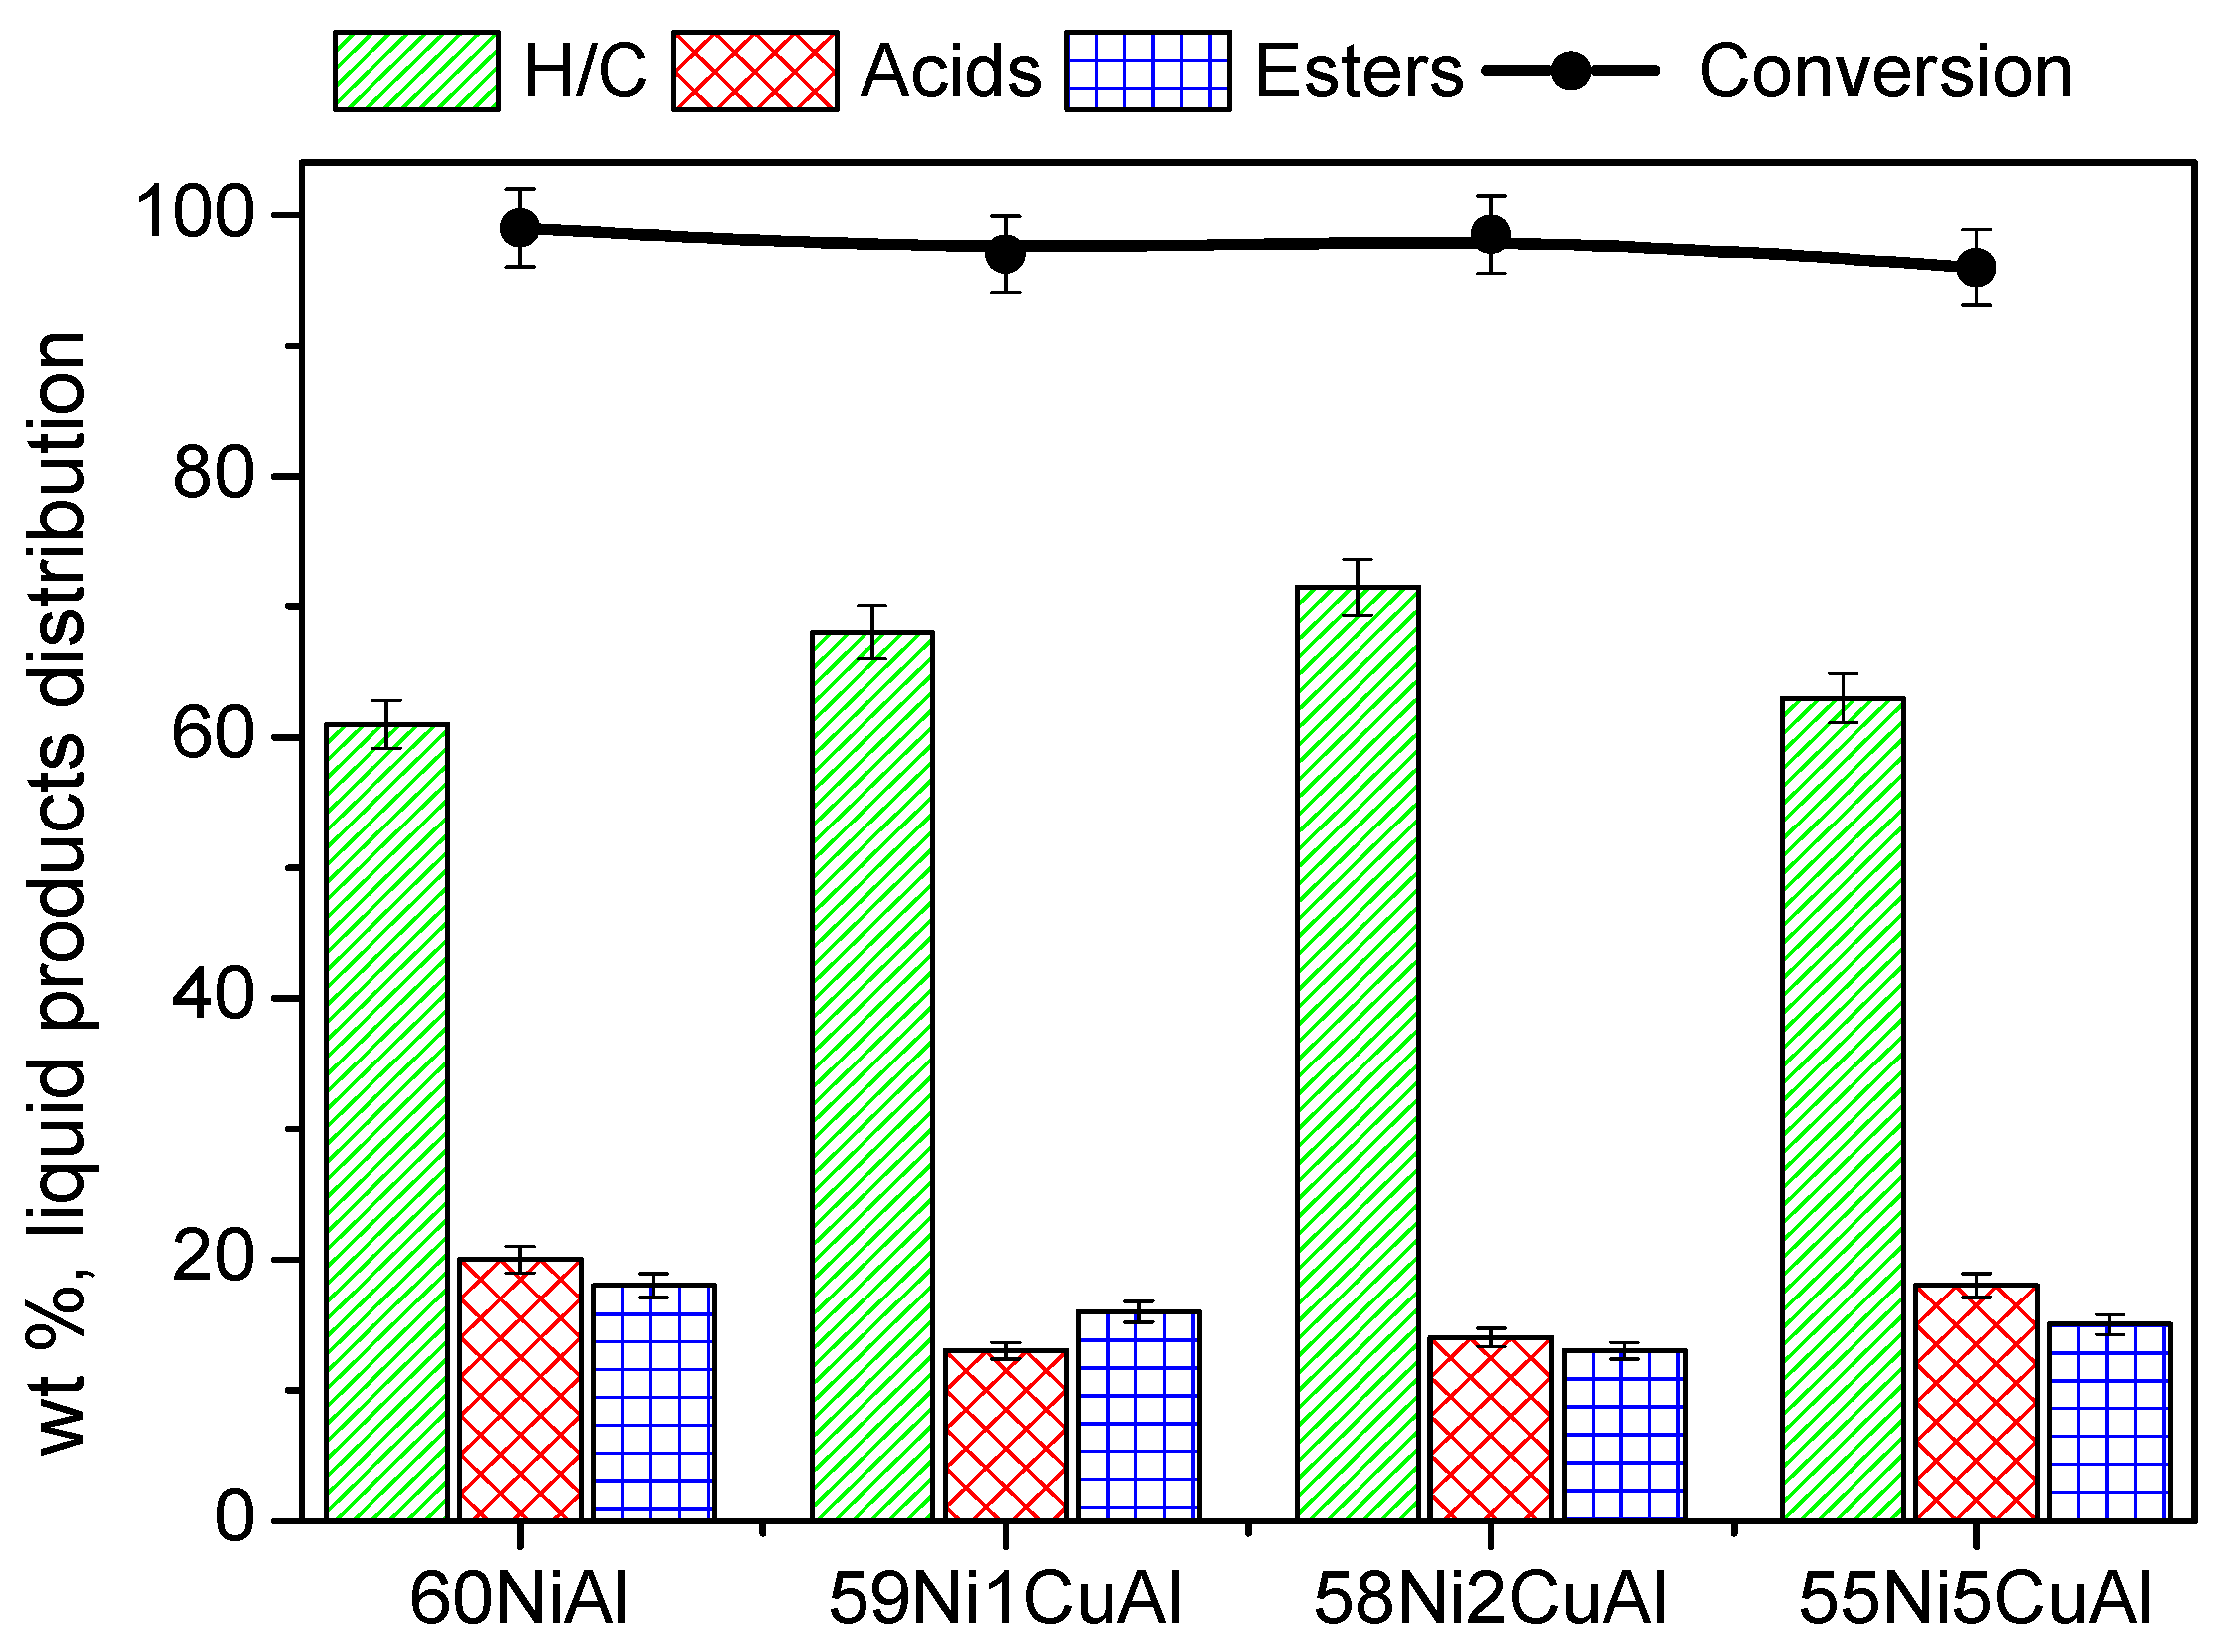
Figure 9 presents the conversion of SFO, and the composition of the liquid reaction mixture in total n-alkanes, acids, and esters, determined after 9 h of the reaction.
A very high conversion is obtained in all cases. The most important intermediate products are esters and fatty acids with their compositions in the reaction mixture in the range of 13–18% and 13–20%, respectively. The most important finding is that copper considerably increases the composition of the liquid reaction mixture in total hydrocarbons in the diesel range, which is the most significant evaluation parameter from the practical point-of-view. The effect is more pronounced in the presence of 58Ni2CuAl catalyst, where an increase of 17.2% has been obtained with respect to the non-promoted 60NiAl catalyst. Therefore, the promoting action of copper is clearly emerged for the first time for catalysts with a very small Cu/Ni weight ratio (0.02–0.09) operating under solvent-free conditions and very high SFO volume-to-catalyst ratio (100 mL/1 g) and a reaction time of 9 h. These correspond to an LHSV value equal to 11.1 h−1 for experiments taken place in fixed bed reactors. Therefore, the values of the composition of the liquid reaction mixture in total hydrocarbons obtained in the present experiments correspond to the mean value obtained for experiments taken place in a fixed bed reactor at LHSV value equal to 1 h−1 and time on stream of 100 h. This is in conjunction with the almost linear increase of this evaluation parameter (Figure 8) with time providing a strong evidence for the relatively high stability of the catalysts tested.
At this point, it should be noted that the commercially produced green diesel initially contains saturated hydrocarbons with carbon atoms in the range of C15–C18, mainly C17 and C18, as in the present work. These linear hydrocarbons improve the ignition properties (cetane number) of fuel, but reduce its flow characteristics. Thus, an effort has been undertaken to improve the latter. Yeletsky et al. [40] have reviewed this issue, which presented recent advances. One may also notice that the yield of total hydrocarbons obtained over the most active catalyst studied was 71.5% (the rest being mainly high molecular weight esters and free fatty acids (Figure 9)). However, the hydrocarbons yield can be very easily increased to 100% by a slight decrease in the “volume of SFO to catalyst mass” ratio.
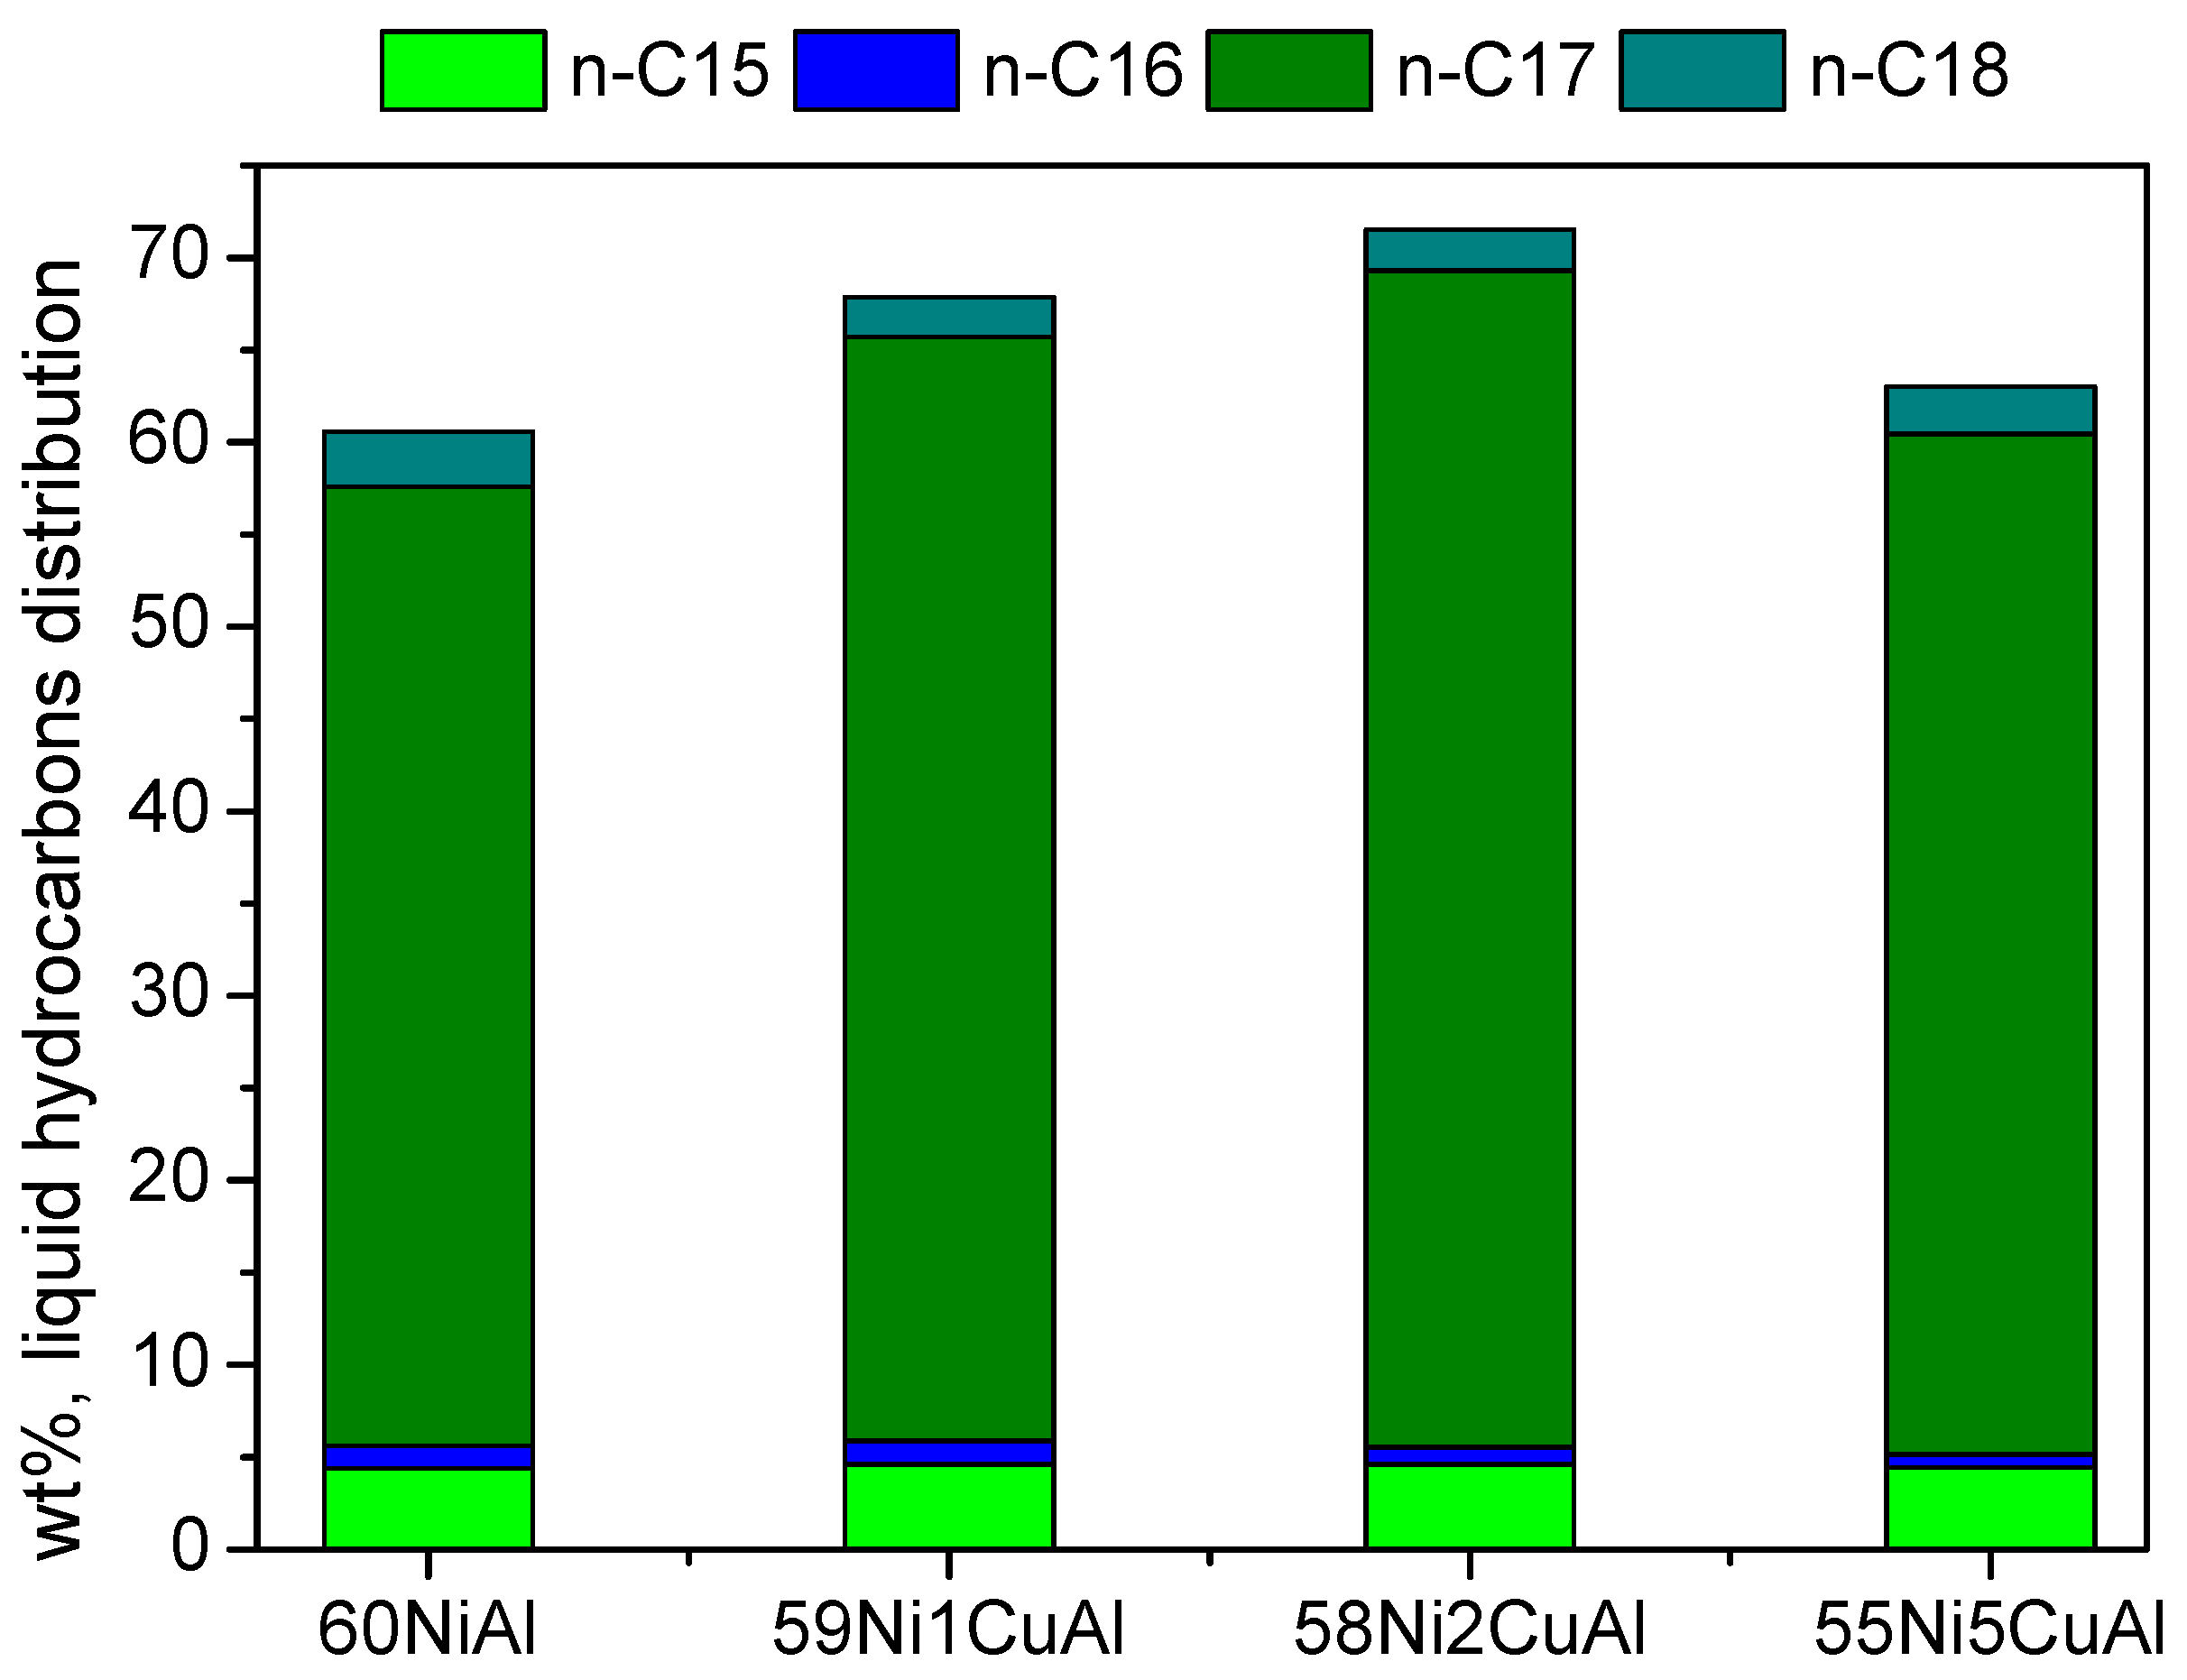
Figure 10 illustrates the composition of the liquid product in n-alkanes obtained over the catalysts studied at 9 h of the reaction.
It is seen that the content of the reaction mixture in hydrocarbons with an odd number of carbon atoms (n-C15 and mainly n-C17) are considerably higher than that of the corresponding ones with even carbon atoms (n-C16 and n-C18). In fact, the values obtained for the ratios (n-C17/(n-C17+n-C18)) and (n-C15/(n-C15+n-C16)) are, respectively, centered in the range of 0.97–0.95 and 0.86–0.77, which indicates that SDO mainly proceeds via deH2O-deCO rather than through deH2O as expected for nickel catalysts [5,6,7,8,10,17,18,31]. The above indicate that the presence of small amounts of copper does not disturb the SDO mechanism.
It seems to us reasonable to relate the copper-promoting action to the increase of nickel dispersion brought about by copper, which is deduced by XPS. However, the monotonous increase of Ni dispersion with the Cu content (Table 2) is not compatible with the volcano-like trend of catalytic performance and its maximization over the catalyst with the medium Cu content (58Ni2CuAl). The inferred formation of a Ni-Cu alloy on the base of catalyst characterization should be another crucial factor [19,20,21,22,23,28,29,30]. The close location of Ni and Cu atoms inside the alloy allows the development of electronic interactions between these two elements, which may influence the intensity of adsorption of hydrogen and several key intermediates and, thus, the catalytic performance to hydrocarbons [30]. It is known that the intensity of adsorption for hydrogen, oxygen, carbon, and several organic molecules is lower on copper when compared to nickel [41] and this could explain the different catalytic behavior exhibited from monometallic nickel and Ni-Cu alloys in several catalytic reactions [42]. As already concluded on the surface of the 59Ni1CuAl and 55Ni5CuAl catalysts, a portion of the more active Ni-Cu alloy nanoparticles is covered by Ni0 and Cu0 nanoparticles, respectively. On the contrary, there is no considerable masking of this Ni-Cu alloy in the 58Ni2CuAl catalyst explaining its highest catalytic performance. The latter could be secondarily attributed to the mono-modal pore size distribution exhibited by this catalyst, centered at about 4.5 nm (Figure 1), which presumably facilitates the reactants/products’ mass transfer. The relatively low performance of the 55Ni5CuAl catalyst with respect to the 59Ni1CuAl and 58Ni2CuAl catalysts could be partly attributed to its remarkably low weak/moderate acidity and the relatively high strong acidity. The former favors SDO whereas the second catalytic cracking results in coking [5].
A direct comparison of the present catalytic results with those of the literature ones is not an easy task. This is due to the high diversity of the set ups (fixed bed, batch, semi-batch), experimental conditions (temperatures: 250–400 °C, hydrogen pressures: 5–40 bar, equivalent LHSV values: 1–7 h−1), and feedstocks (biodiesel, methyl palmitate, ethyl caprate, tristearin, stearic acid, yellow grease, hemp seed oil, waste free fatty acids, brown grease, oleic acid, methyl laurate, and sunflower oil) used in the relevant works [19,20,21,22,23,24,25,26,27,28,29,30]. However, some useful conclusions could be drawn by comparing the present results with the literature results. First, it should be mentioned that, even though the non-promoted catalyst (60NiAl) is very active when compared to the current catalysts, a yield of 61.2% of total hydrocarbons was obtained over this catalyst working under solvent-free conditions and an equivalent LHSV value equal to 11.1 h−1. In spite of this high activity, the presence of a very small amount of copper is sufficient to considerably increase the previously mentioned yield. The maximum promoting action of copper in the present work is obtained in the 58Ni2CuAl catalyst with a Cu/Ni weight ratio equal to 0.034, which is much smaller to those obtained in the other relevant works [19,20,21,22,23,24,25,26,27,28,29,30]. We are attributing this difference to the preparation method followed in the present study (controlled co-precipitation). This method results initially in the formation of layered double hydroxide precipitates in which the Ni2+, Cu2+, and Al3+ ions are atomically mixed in the basal layers of the double hydroxide [43,44,45]. This, in turn, facilitates the well mixing of very small alumina, NiO, CuO, and Ni0.95Cu0.5O particles formed in the subsequent thermal step (heating under argon) and, thus, the well mixing and high dispersion of the Ni0, Cu0, and Ni-Cu alloy rich in nickel is formed upon activation. The high-level synergy between the Ni0 hydrogenation sites and Cu0 sites inside the Ni-Cu alloy seems to be the main reason for the promoting action of copper.
As already mentioned, the presence of copper does not change practically in the SDO network followed in metallic nickel catalysts where the deH2O-deCO pathway predominates. This is in agreement with the literature. In fact, copper has a weak effect, if any, on SDO mechanism. The Ni-Cu bimetallic catalysts still prefer catalyzing the deH2O-deCO pathway [19,23]. A shift of the mechanism from the deH2O-deCO to the deH2O pathway takes place in copper-promoted catalysts above a critical Cu/Ni weight ratio much higher than those studied in the present work. For example, Miao et al. [30] have been recently reported where the SDO network changes from deH2O-deCO to the deH2O pathway at a Cu/Ni weight ratio higher than 2.3. The relatively high concentration of the intermediate esters determined in the present study (Figure 9) was compared to most of the relevant works [19,20,21,22,23,24,25,26,27,28,29,30], which can be effortlessly related to the solvent-free conditions adopted in the present study. This facilitates the bimolecular esterification between the intermediates’ fatty acids and fatty alcohols.

4. Conclusions

Copper doping considerably increases the catalytic performance of the nickel–alumina co-precipitated catalysts (60 wt. % Ni) for the transformation of SFO into green diesel whereas it does not affect the SDO reaction network. The effect is more pronounced in the catalyst containing 2 wt. % copper (58Ni2CuAl), where a 17.2% increase of green diesel content in the liquid product has been achieved with respect to the non-promoted catalyst, 60NiAl. The promoting action of copper is demonstrated for the first time for catalysts with a very small Cu/Ni weight ratio (0.02–0.09). This was attributed to the increase in the nickel dispersion caused by copper and to the formation of a Ni-Cu alloy very rich in nickel, which is considered more active than nickel. In the 59Ni1CuAl and 55Ni5CuAl catalysts, a portion of the Ni-Cu alloy is covered by Ni0 and Cu0 nanoparticles, respectively. On the contrary, there is no considerable masking of this Ni-Cu alloy in the 58Ni2CuAl catalyst, which explains its highest catalytic performance. The relatively low performance of the 55Ni5CuAl catalyst could be partly attributed to its remarkably low weak/moderate acidity and the relatively high strong acidity. The former favors SDO whereas the second catalytic cracking results in coking.

Supplementary Materials

The following are available online at https://www.mdpi.com/1996-1073/13/14/3707/s1. Figure S1: SDO reaction network. Figure S2: Presentation of the setup used for co-precipitation. Figure S3: SEM images. Figure S4: EDS spectrum. Figure S5: TEM image.

Author Contributions

Conceptualization, K.B., C.K. and A.L.; Methodology, M.G. and E.K.; Software, S.L.; Validation, E.K., S.L. and E.S.; Investigation, M.G., E.K. and E.S.; Data Curation, M.G., E.K. and E.S.; Writing-Original Draft Preparation, A.L.; Writing-Review & Editing, K.B.; Visualization, K.B., C.K. and A.L.; Supervision, K.B. and S.L. All authors have read and agreed to the published version of the manuscript.

Funding

This research received no external funding.

Conflicts of Interest

The authors declare no conflict of interest.

References

  1. Lycourghiotis, A.; Kordulis, C.; Lycourghiotis, S. Beyond Fossil Fuels: The Return Journey to Renewable Energy; Crete University press: Herakleion, Greece, 2017. [Google Scholar]
  2. Armaroli, N.; Balzani, V. The Future of Energy Supply: Challenges and Opportunities. Angew. Chem. Int. Ed. 2007, 46, 52–66. [Google Scholar] [CrossRef] [PubMed]
  3. Thomas, J.M.; Harris, K.D.M. Some of tomorrow’s catalysts for processing renewable and non-renewable feedstocks, diminishing anthropogenic carbon dioxide and increasing the production of energy. Energy Environ. Sci. 2016, 9, 687–708. [Google Scholar] [CrossRef]
  4. Frusteri, F.; Aranda, D.; Bonura, G. (Eds.) Sustainable Catalysis for Biorefineries; Green Chemistry Series No 56; RSC: Croydon, UK, 2018. [Google Scholar] [CrossRef]
  5. Kordulis, C.; Bourikas, K.; Gousi, M.; Kordouli, E.; Lycourghiotis, A. Development of nickel based catalysts for the transformation of natural triglycerides and related compounds into green diesel: A critical review. Appl. Catal. B Environ. 2016, 181, 156–196. [Google Scholar] [CrossRef]
  6. Gousi, M.; Andriopoulou, C.H.; Bourikas, K.; Ladas, S.; Sotiriou, M.; Kordulis, C.; Lycourghiotis, A. Green diesel production over nickel-alumina co-precipitated catalysts. Appl. Catal. A Gen. 2017, 536, 45–56. [Google Scholar] [CrossRef]
  7. Zafeiropoulos, G.; Nikolopoulos, N.; Kordouli, E.; Sygellou, L.; Bourikas, K.; Kordulis, C.; Lycourghiotis, A. Developing Nickel–Zirconia Co-Precipitated Catalysts for Production of Green Diesel. Catalysts 2019, 9, 210. [Google Scholar] [CrossRef] [Green Version]
  8. Lycourghiotis, S.; Kordouli, E.; Sygellou, L.; Bourikas, K.; Kordulis, C. Nickel catalysts supported on palygorskite for transformation of waste cooking oils into green diesel. Appl. Catal. B Environ. 2019, 259, 118059. [Google Scholar] [CrossRef]
  9. Hongloi, N.; Prapainainar, P.; Seubsai, A.; Sudsakorn, K.; Prapainainar, C. Nickel catalyst with different supports for green diesel production. Energy 2019, 182, 306–320. [Google Scholar] [CrossRef]
  10. Nikolopoulos, I.; Kogkos, G.; Kordouli, E.; Bourikas, K.; Kordulis, C.; Lycourghiotis, A. Waste cooking oil transformation into third generation green diesel catalyzed by nickel - Alumina catalysts. Mol. Catal. 2020, 482, 110697. [Google Scholar] [CrossRef]
  11. Ochoa-Hernández, C.; Coronado, J.M.; Serrano, D.P. Hydrotreating of Methyl Esters to Produce Green Diesel over Co- and Ni-Containing Zr-SBA-15 Catalysts. Catalysts 2020, 10, 186. [Google Scholar] [CrossRef] [Green Version]
  12. Papanikolaou, G.; Lanzafame, P.; Giorgianni, G.; Abate, S.; Perathoner, S.; Centi, G. Highly selective bifunctional Ni zeo-type catalysts for hydroprocessing of methyl palmitate to green diesel. Catal. Today 2020, 345, 14–21. [Google Scholar] [CrossRef]
  13. Ameen, M.; Azizan, M.T.; Ramli, A.; Yusup, S.; Abdullah, B. The effect of metal loading over Ni/γ-Al2O3 and Mo/γ-Al2O3 catalysts on reaction routes of hydrodeoxygenation of rubber seed oil for green diesel production. Catal. Today 2019, in press. [Google Scholar] [CrossRef]
  14. Srifa, A.; Kaewmeesri, R.; Fang, C.; Itthibenchapong, V.; Faungnawakij, K. NiAl2O4 spinel-type catalysts for deoxygenation of palm oil to green diesel. Chem. Engin. J. 2018, 345, 107–113. [Google Scholar] [CrossRef]
  15. Feng, F.; Shang, Z.; Wang, L.; Zhang, X.; Liang, X.; Wang, Q. Structure-sensitive hydro-conversion of oleic acid to aviation-fuel-range-alkanes over alumina-supported nickel catalyst. Catal. Commun. 2020, 134, 105842. [Google Scholar] [CrossRef]
  16. Afshar Taromi, A.; Kaliaguine, S. Hydrodeoxygenation of triglycerides over reduced mesostructured Ni/γ-alumina catalysts prepared via one-pot sol-gel route for green diesel production. Appl. Catal. A Gen. 2018, 558, 140–149. [Google Scholar] [CrossRef]
  17. Kordouli, E.; Pawelec, B.; Bourikas, K.; Kordulis, C.; Fierro, J.L.G.; Lycourghiotis, A. Mo promoted Ni-Al2O3 co-precipitated catalysts for green diesel production. Appl. Catal. B Environ. 2018, 229, 139–154. [Google Scholar] [CrossRef]
  18. Gousi, M.; Kordouli, E.; Bourikas, K.; Simianakis, E.; Ladas, S.; Panagiotou, G.D.; Kordulis, C.; Lycourghiotis, A. Green diesel production over nickel-alumina nanostructured catalysts promoted by zinc. Catal. Today 2019, in press. [Google Scholar] [CrossRef]
  19. Yakovlev, V.A.; Khromova, S.A.; Sherstyuk, O.V.; Dundich, V.O.; Ermakov, D.Y.; Novopashina, V.M.; Lebedev, M.Y.; Bulavchenko, O.; Parmon, V.N. Development of new catalytic systems for upgraded bio-fuels production from bio-crude-oil and biodiesel. Catal. Today 2009, 144, 362–366. [Google Scholar] [CrossRef]
  20. Dundich, V.O.; Khromova, S.A.; Ermakov, D.Y.; Lebedev, M.Y.; Novopashina, V.M.; Sister, V.G.; Yakimchuk, A.I.; Yakovlev, V.A. Nickel Catalysts for the Hydrodeoxygenation of Biodiesel. Kinet. Catal. 2010, 51, 704–709. [Google Scholar] [CrossRef]
  21. Kukushkin, R.G.; Bulavchenko, O.A.; Kaichev, V.V.; Yakovlev, V.A. Influence of Mo on catalytic activity of Ni-based catalysts in hydrodeoxygenation of esters. Appl. Catal. B Environ. 2015, 163, 531–538. [Google Scholar] [CrossRef]
  22. Kukushkin, R.G.; Eletskii, P.M.; Bulavchenko, O.A.; Saraev, A.A.; Yakovlev, V.A. Studying the Effect of Promotion with Copper on the Activity of the Ni/Al2O3 Catalyst in the Process of Ester Hydrotreatment. Catal. Indust. 2019, 11, 198–207. [Google Scholar] [CrossRef]
  23. Loe, R.; Santillan-Jimenez, E.; Morgan, T.; Sewell, L.; Ji, Y.; Jones, S.; Isaacs, M.A.; Lee, A.F.; Crocker, M. Effect of Cu and Sn promotion on the catalytic deoxygenation of model and algal lipids to fuel-like hydrocarbons over supported Ni catalysts. Appl. Catal. B Environ. 2016, 191, 147–156. [Google Scholar] [CrossRef] [Green Version]
  24. Santillan-Jimenez, E.; Loe, R.; Garrett, M.; Morgan, T.; Crocker, M. Effect of Cu promotion on cracking and methanation during the Ni-catalyzed deoxygenation of waste lipids and hemp seed oil to fuel-like hydrocarbons. Catal. Today 2018, 302, 261–271. [Google Scholar] [CrossRef]
  25. Loe, R.; Lavoignat, Y.; Maier, M.; Abdallah, M.; Morgan, T.; Qian, D.; Pace, R.; Santillan-Jimenez, E.; Crocker, M. Continuous Catalytic Deoxygenation of Waste Free Fatty Acid-Based Feeds to Fuel-Like Hydrocarbons Over a Supported Ni-Cu Catalyst. Catalysts 2019, 9, 123. [Google Scholar] [CrossRef] [Green Version]
  26. Silva, G.C.R.; Qian, D.; Pace, R.; Heintz, O.; Caboche, G.; Santillan-Jimenez, E.; Crocker, M. Promotional Effect of Cu, Fe and Pt on the Performance of Ni/Al2O3 in the Deoxygenation of Used Cooking Oil to Fuel-Like Hydrocarbons. Catalysts 2020, 10, 91. [Google Scholar] [CrossRef] [Green Version]
  27. Jing, Z.; Zhang, T.; Shang, J.; Zhai, M.; Yang, H.; Qiao, C.; Ma, X. Influence of Cu and Mo components of γ-Al2O3 supported nickel catalysts on hydrodeoxygenation of fatty acid methyl esters to fuel-like hydrocarbons. J. Fuel Chem. Technol. 2018, 46, 427–440. [Google Scholar] [CrossRef]
  28. Zhang, Z.; Chen, H.; Wang, C.; Chen, K.; Lu, X.; Ouyang, P.; Fu, J. Efficient and stable Cu-Ni/ZrO2 catalysts for in situ hydrogenation and deoxygenation of oleic acid into heptadecane using methanol as a hydrogen donor. Fuel 2018, 230, 211–217. [Google Scholar] [CrossRef]
  29. Zhang, Z.; Yang, Q.; Chen, H.; Chen, K.; Lu, X.; Ouyang, P.; Fu, J.; Chen, J.G. In situ hydrogenation and decarboxylation of oleic acid into heptadecane over a Cu–Ni alloy catalyst using methanol as a hydrogen carrier. Green Chem. 2018, 20, 197–205. [Google Scholar] [CrossRef]
  30. Miao, C.; Zhou, G.; Chen, S.; Xie, H.; Zhang, X. Synergistic effects between Cu and Ni species in NiCu/γ-Al2O3 catalysts for hydrodeoxygenation of methyl laurate. Renew. Energy 2020, 153, 1439–1454. [Google Scholar] [CrossRef]
  31. Kordouli, E.; Sygellou, L.; Kordulis, C.; Bourikas, K.; Lycourghiotis, A. Probing the synergistic ratio of the NiMo/γ-Al2O3 reduced catalysts for the transformation of natural triglycerides into green diesel. Appl. Catal. B Environ. 2017, 209, 12–22. [Google Scholar] [CrossRef]
  32. Makarouni, D.; Lycourghiotis, S.; Kordouli, E.; Bourikas, K.; Kordulis, C.; Dourtoglou, V. Transformation of limonene into p-cymene over acid activated natural mordenite utilizing atmospheric oxygen as a green oxidant: A novel mechanism. Appl. Catal. B Environ. 2018, 224, 740–750. [Google Scholar] [CrossRef]
  33. Lycourghiotis, S.; Makarouni, D.; Kordouli, E.; Bourikas, K.; Kordulis, C.; Dourtoglou, V. Activation of natural mordenite by various acids: Characterization and evaluation in the transformation of limonene into p-cymene. Mol. Catal. 2018, 450, 95–103. [Google Scholar] [CrossRef]
  34. Lycourghiotis, S.; Makarouni, D.; Kordouli, E.; Bourikas, K.; Kordulis, C.; Dourtoglou, V. Transformation of limonene into high added value products over acid activated natural montmorillonite. Catal. Today 2019, in press. [Google Scholar] [CrossRef]
  35. Liu, Q.; Gao, J.; Gu, F.; Lu, X.; Liu, Y.; Li, H.; Zhong, Z.; Liu, B.; Xu, G.; Su, F. One-pot synthesis of ordered mesoporous Ni–V–Al catalysts for CO methanation. J. Catal. 2015, 326, 127–138. [Google Scholar] [CrossRef]
  36. Tribalis, A.; Panagiotou, G.D.; Bourikas, K.; Sygellou, L.; Kennou, S.; Ladas, S.; Lycourghiotis, A.; Kordulis, C. Ni Catalysts Supported on Modified Alumina for Diesel Steam Reforming. Catalysts 2016, 6, 11. [Google Scholar] [CrossRef] [Green Version]
  37. Totong, S.; Daorattanachai, P.; Laosiripojana, N.; Idem, R. Catalytic depolymerization of alkaline lignin to value-added phenolic-based compounds over Ni/CeO2-ZrO2 catalyst synthesized with a one-step chemical reduction of Ni species using NaBH4 as the reducing agent. Fuel Process. Technol. 2020, 198, 106248. [Google Scholar] [CrossRef]
  38. Zhang, D.; Liu, W.-Q.; Liu, Y.-A.; Etim, U.J.; Liu, X.-M.; Yan, Z.-F. Pore confinement effect of MoO3/Al2O3 catalyst for deep hydrodesulfurization. Chem. Eng. J. 2017, 330, 706–717. [Google Scholar] [CrossRef]
  39. Wagenhofer, M.F.; Baráth, E.; Gutiérrez, O.Y.; Lercher, J.A. Carbon–carbon bond scission pathways in the deoxygenation of fatty acids on transition-metal sulfides. ACS Catal. 2017, 7, 1068–1076. [Google Scholar] [CrossRef]
  40. Yeletsky, P.M.; Kukushkin, R.G.; Yakovlev, V.A.; Chen, B.H. Recent advances in one-stage conversion of lipid-based biomass-derived oils into fuel components—Aromatics and isomerized alkanes. Fuel 2020, 278, Art.N. 118255. [Google Scholar] [CrossRef]
  41. Wu, Q.; Duchstein, L.D.L.; Chiarello, G.L.; Christensen, J.M.; Damsgaard, C.H.D.; Elkjar, C.H.F.; Wagner, J.B.; Temel, B.; Grunwaldt, J.-D.; Jensen, A.D. In Situ Observation of Cu–Ni Alloy Nanoparticle Formation by X-Ray Diffraction, X-Ray Absorption Spectroscopy, and Transmission Electron Microscopy: Influence of Cu/Ni Ratio. Chemcatchem 2014, 6, 301–310. [Google Scholar] [CrossRef]
  42. Saw, E.T.; Oemar, U.; Tan, X.R.; Du, Y.; Borgna, A.; Hidajat, K.; Kawi, S. Bimetallic Ni–Cu catalyst supported on CeO2 for high-temperature water–gas shift reaction: Methane suppression via enhanced CO adsorption. J. Catal. 2014, 314, 32–46. [Google Scholar] [CrossRef]
  43. Fan, G.; Li, F.; Evans, D.G.; Duan, X. Catalytic applications of layered double hydroxides: Recent advances and perspectives. Chem. Soc. Rev. 2014, 43, 7040–7066. [Google Scholar] [CrossRef] [PubMed]
  44. Li, C.; Wei, M.; Evans, D.G.; Duan, X. Layered double hydroxide-based nanomaterials as highly efficient catalysts and adsorbents. Small 2014, 10, 4469–4486. [Google Scholar] [CrossRef] [PubMed]
  45. He, S.; An, Z.; Wei, M.; Evans, D.G.; Duan, X. Layered double hydroxide-based catalysts: Nanostructure design and catalytic performance. Chem. Commun. 2013, 49, 5912–5920. [Google Scholar] [CrossRef] [PubMed]
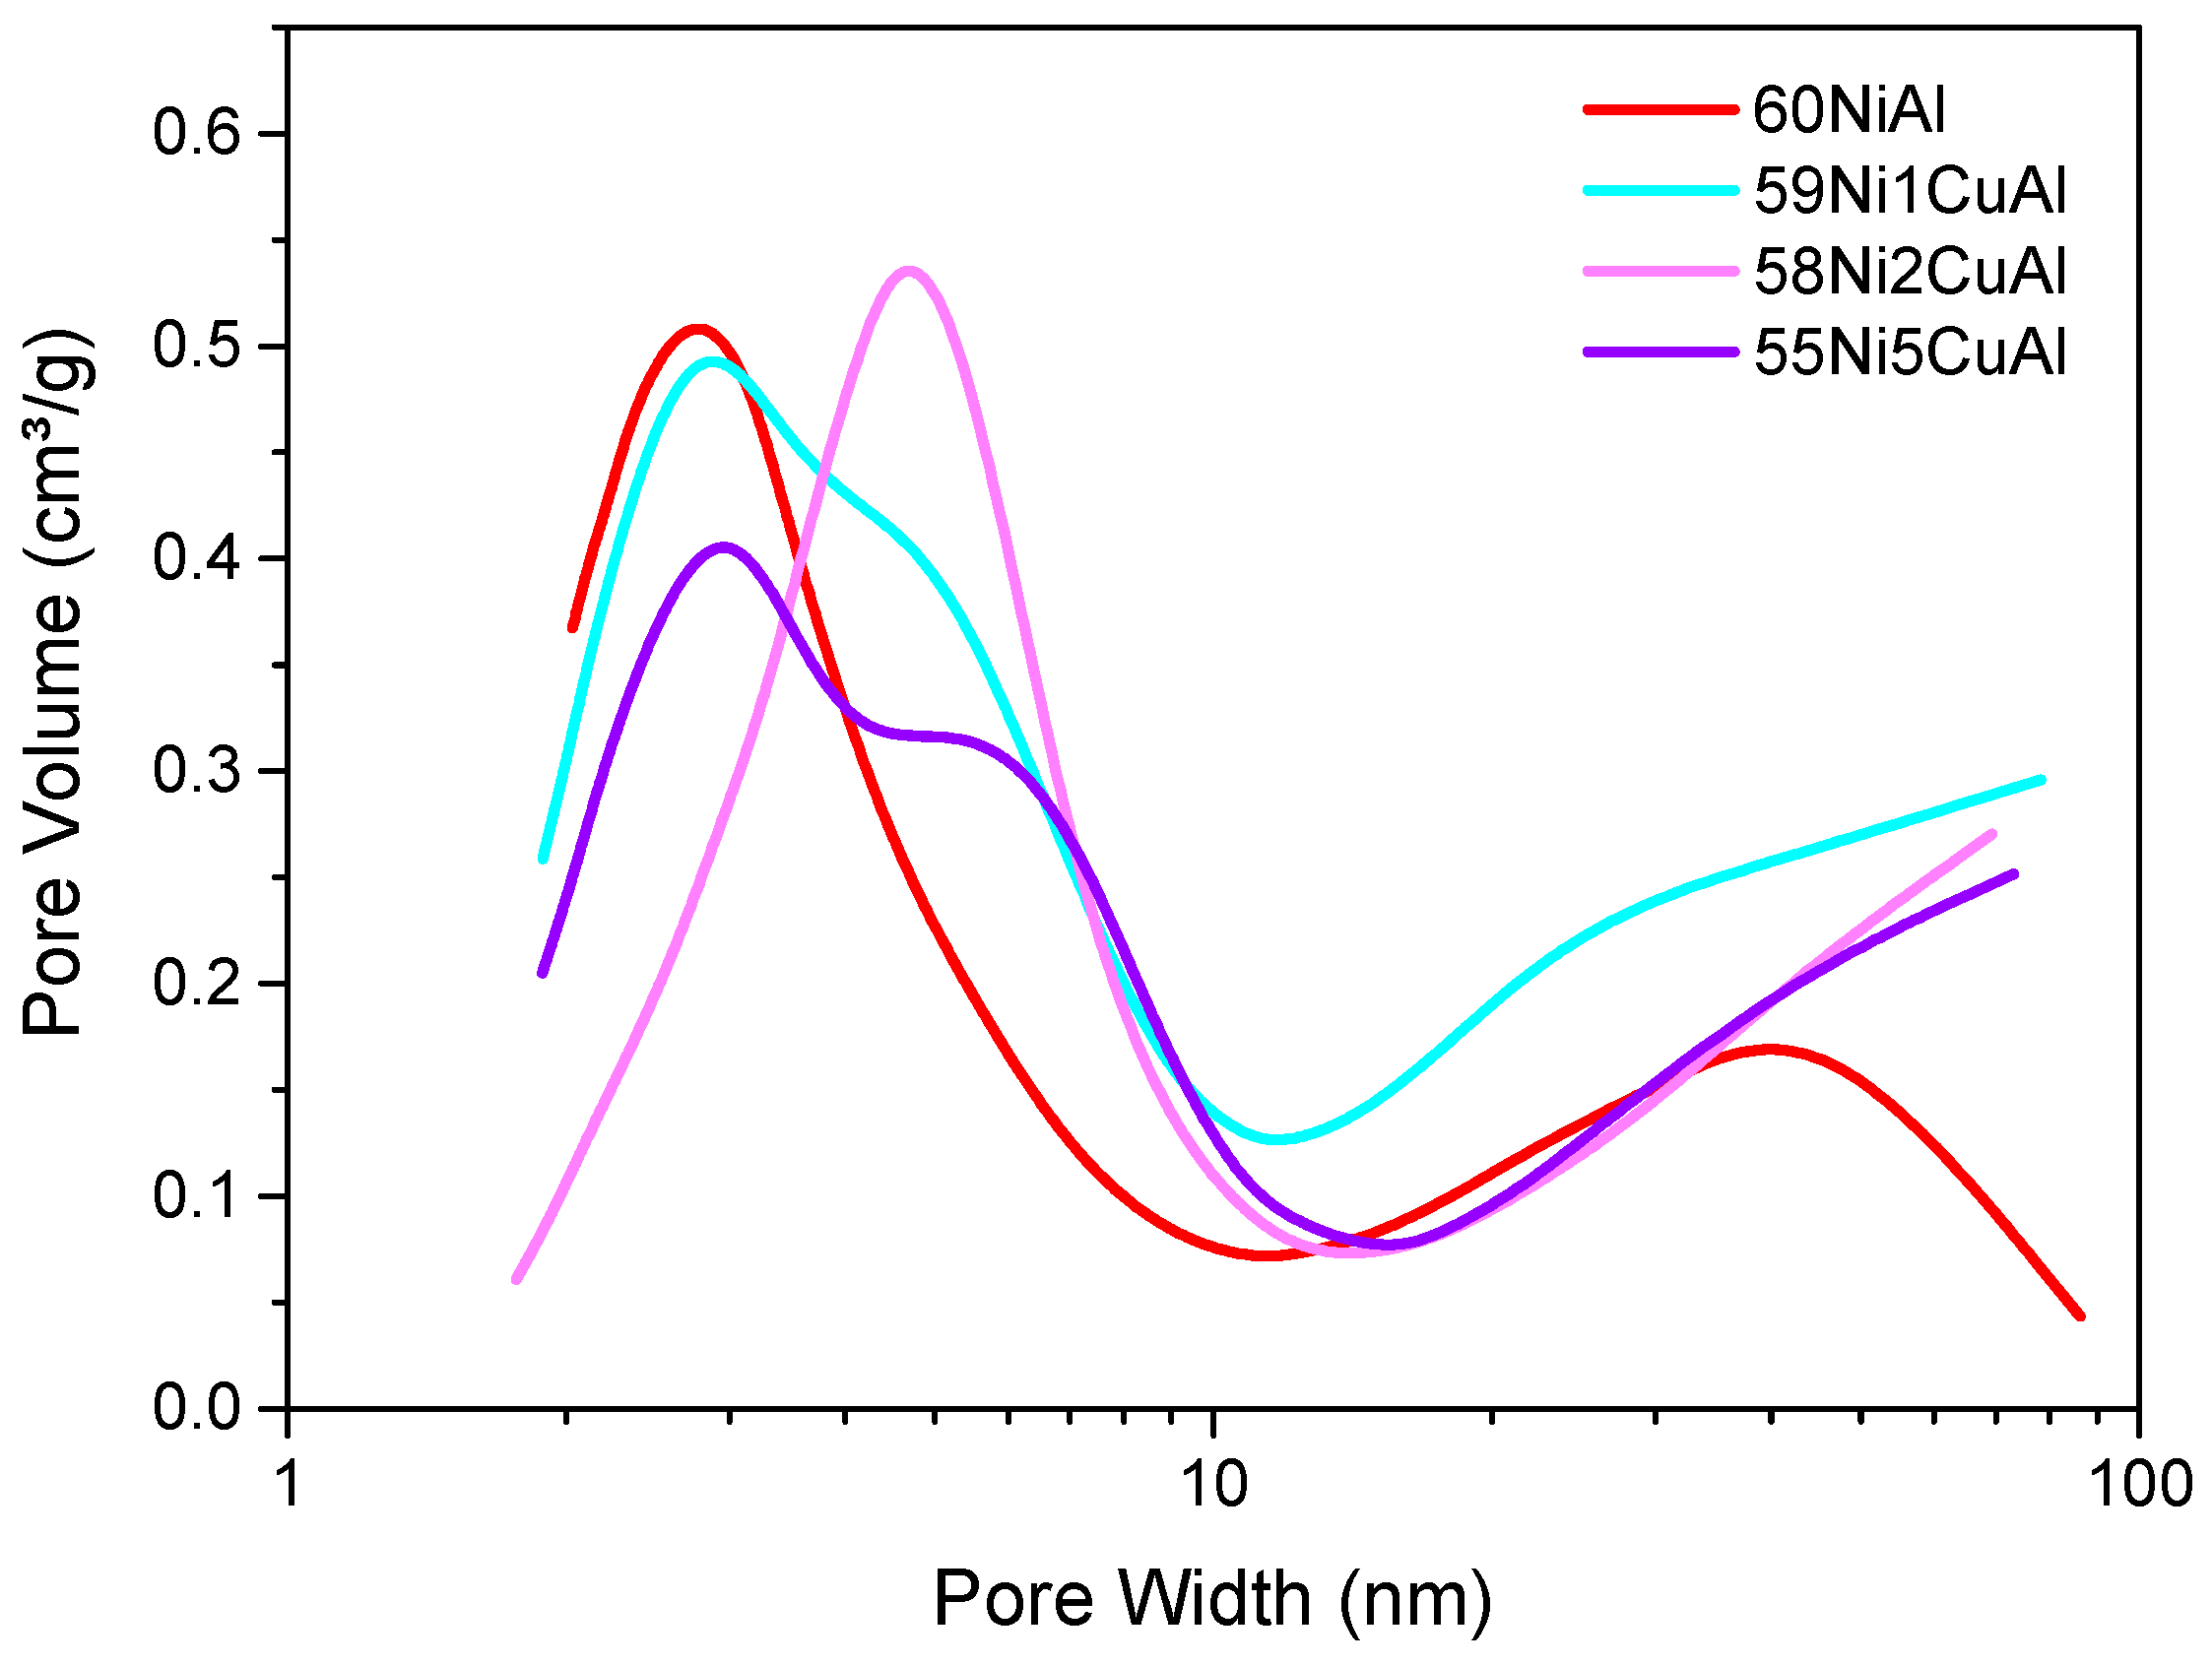
Figure 1. Pore volume distribution curves obtained for the catalysts studied.
Energies 13 03707 g001
Figure 2. XRD patterns of the catalysts studied. The dashed lines correspond to the most important diffractions of the expected phases: (o) Ni0, (*) NiO or Ni0.95Cu0.5O, (+) Cu0, (^) CuO. The deconvolution of the peak at 2θ ~37° (inset) indicates the presence of CuO (red peak).
Energies 13 03707 g002
Figure 3. The XP spectra of the promoted catalysts studied: (A) The Ni2p3/2 spectral region, (B) the Cu2p3/2 spectral region, and (C) the Al2p–Ni3p spectral region.
Energies 13 03707 g003
Figure 4. H2-TPR profiles of the catalysts studied.
Energies 13 03707 g004
Figure 5. H2-TPR profiles of the 58Ni2CuAl precursor catalyst (A) and of the same catalyst after its in-situ activation at 400 °C for 2.5 h (B).
Energies 13 03707 g005
Figure 6. NH3-TPD curves of the catalysts studied.
Energies 13 03707 g006
Figure 7. A typical gas chromatogram of a liquid sample received from the reactor upon transformation of SFO into green over the 58Ni2CuAl catalyst (reaction time = 4 h): C15. Pentadecane, C16. Hexadecane, C17. Heptadecane, C18. Octadecane, 1. Palmitic acid, 2. Stearic acid/ethyl stearate, 3. Propyl stearate, 4. Palmityl stearate, 5. Stearyl stearate, 6. 2(octadecyloxy) ethyl stearate, 7. Distearine. (Reaction conditions: 310 °C, 40 bar hydrogen pressure, hydrogen flow rate = 100 mL/min (STP), reactant volume to catalyst mass ratio = 100 mL/1 g).
Energies 13 03707 g007
Figure 8. Kinetics of the SFO selective deoxygenation over the most active catalyst (58Ni2CuAl). (Reaction conditions: 310 °C, 40 bar hydrogen pressure, hydrogen flow rate = 100 mL/min (STP), reactant volume to catalyst mass ratio = 100 mL/1 g).
Energies 13 03707 g008
Figure 9. Evaluation parameters obtained for the SDO of SFO over the catalysts studied at reaction time equal to 9 h (Reaction conditions: 310 °C, 40 bar hydrogen pressure, hydrogen flow rate = 100 mL/min (STP), reactant volume to catalyst mass ratio = 100 mL/1 g).
Energies 13 03707 g009
Figure 10. Composition of the liquid product in n-alkanes with odd and even numbers of carbon atoms obtained over the catalysts studied at reaction time equal to 9 h (Reaction conditions: 310 °C, 40 bar hydrogen pressure, hydrogen flow rate = 100 mL/min (STP), reactant volume to catalyst mass ratio = 100 mL/1 g).
Energies 13 03707 g010
Table 1. BET Specific Surface Area (SSABET), Specific Pore Volume (SPV), and Mean Pore Diameter (MPD) of the catalysts studied.
CatalystSSABET (m2/g)SPV (cm³/g)MPD (nm)
60NiAl2470.304.84
59Ni1CuAl2850.436.03
58Ni2CuAl1920.336.91
55Ni5CuAl2300.335.74
Table 2. Quantitative XPS results and comparison with the respective calculated nominal atomic compositions in the bulk.
CatalystAverage Atomic Proportions (XPS) 1Ni/Al (Nominal)Cu/Al (Nominal)Cu/Ni (Nominal)Cu/Ni (XPS) 2
60NiAlAl:Ni = 1:1.241.30---
59Ni1CuAlAl:Ni:Cu = 1:1.51:0.0121.280.0200.01570.0079
58Ni2CuAlAl:Ni:Cu = 1:1.70:0.0501.260.0400.03190.0294
55Ni5CuAlAl:Ni:Cu = 1:1.82:0.2321.190.1000.08400.1270
(1) Estimated uncertainty ±10% on the stated Ni and Cu values. (2) Estimated uncertainty ±20% on the stated ratios.