Abstract
The previous study, where the void fraction predictability of three different thermal-hydraulic system codes was assessed against PSBT (PWR Subchannel and Bundle Test) benchmark data, indicated a general overprediction tendency of all system codes, especially in bundles. Because all codes have been utilized for best-estimate analyses, it is necessary to conduct further assessments in order to find the root cause of the overprediction. A further assessment has been performed using two thermal-hydraulic system codes, TRACE V5.0 patch 5 and MARS-KS 1.4, and the assessment has been carried out for both one- and multi-dimensional components. The results indicate that there is no significant difference in the predictability of the void fraction between one- and multi-dimensional components. In addition, it is found that the turbulent mixing model implemented for the multi-dimensional component of MARS-KS does not play an important role in the prediction of void distribution. Meanwhile, TRACE reveals a significant overprediction due to much less crossflow calculation compared to MARS-KS. By conducting an additional analysis with the modified one-dimensional models, it is clearly confirmed that crossflow significantly affects the void distribution. Therefore, it is concluded that the model for the thermal hydraulic mixing by crossflow in each system code should be improved in order to predict the void distribution in bundles appropriately.
1. Introduction
Two-phase flow is a prevailing condition, which applies to a wide range of industrial applications [1]. Especially in the nuclear field, the most relevant application is the boiling water reactor, in which a phase change of flowing liquid directly occurs within the reactor core. In addition, in a pressurized water reactor, the relevance exists to heat exchangers, such as steam generators [2]. However, it is well known that the characteristics of two-phase flow depend on the flow regime, which differs depending on flow conditions and geometry [3,4,5]. Conventionally, the void fraction is employed to distinguish the transition between the specified regimes. As depicted in Figure 1, it is applied as one of the criteria for flow regime prediction, and this form of flow map is generally utilized in the best-estimate system analysis codes in the nuclear field. Therefore, the precise prediction of the void fraction has great importance in the best-estimate safety analysis methodology since additional conservatism could be induced by the inaccurate prediction of the void fraction, which plays a negative role from a coolability point of view.
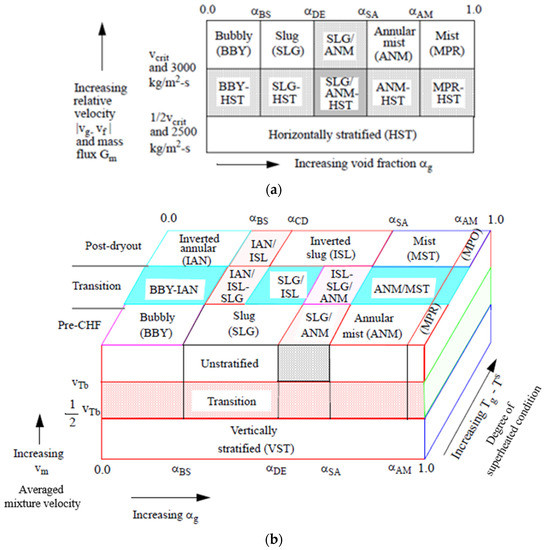
Figure 1.
Schematic of flow regime map in MARS-KS [6]: (a) horizontal flow regime; (b) vertical flow regime.
In the previous study [7], the void fraction predictability of three different best-estimate system analysis codes was assessed against the experimental data from the NUPEC (Nuclear Power Engineering Corporation) test facility used for the OECD/NRC PSBT benchmark [8]. The assessment was performed by comparing the result from one-dimensional components in each system code. The results showed that all codes generally predicted the void fraction greater than the experiment. Especially in the case of TRACE V5.0 Patch 5 [9], a significant overprediction tendency in bundles was revealed, especially compared to MARS-KS 1.4 [10] and RELAP5/MOD3.3 Patch 5 [11]. Both MARS-KS and RELAP5 showed almost identical predictions, but they also showed an overprediction tendency at low void conditions. The general overprediction tendency of the system codes was also illustrated from the benchmark results [12]. Because all codes were utilized for the best-estimate safety analysis for nuclear reactor systems, it is necessary to figure out the root cause of the overprediction and to improve the predictability of the void distribution.
Meanwhile, as the system codes were improved with the multi-dimensional capacity for more realistic analyses of complex components, such as a reactor pressure vessel, it was decided that the follow-up study should be expanded to include an assessment with multi-dimensional components in the codes. Thus, it is of interest in this study to figure out the characteristics of one- and multi-dimensional components in the prediction of void distribution and to find out the root cause of the systematic overprediction in void fraction by the system codes.
In this study, a series of assessments on void distribution predictability of the system codes was performed using one- and multi-dimensional components in order to figure out the root cause of the overprediction in void fractions by the system codes. Because RELAP5 does not have the multi-dimensional component, MARS-KS and TRACE have been employed for the assessment. The results from both codes are analyzed both physically and statistically.
2. Materials and Methods
2.1. Review of NUPEC Test Facility
Figure 2 depicts the NUPEC test facility, where the bundle void measurement tests were performed. The test loop was a high-pressure and high-temperature recirculation loop, of which the design pressure and temperature were 19.2 MPa and 635.15 K, respectively, which covered PWR (Pressurized Water Reactor) operating conditions. Once the coolant flowed into the heated section of the bundle, which had an active heated length of 3.658 m, the coolant was electrically heated from the heater rods, and the phase change occurred. At three different locations in the heated section, which consisted of a lower (2.216 m), middle (2.669 m), and upper point (3.177 m), respectively, the void fraction was measured within four central subchannels of the bundle. The steady-state bundle test consisted of three different test series, which were distinguished by test assembly ID, namely B5, B6, and B7, respectively. As listed in Table 1, the test series B5 and B6 utilized an identical 5 × 5 assembly. However, in the case of B7, the assembly contained a thimble rod, which described the guide tube at the center of the test section. The uniform axial power shape was applied to B5, but B6 and B7 used a cosine axial power profile. Each assembly was equipped with three different types of spacer grids, which consisted of a simple spacer grid, a spacer grid with no mixing vane, and with mixing vane, respectively. A more detailed description of the specification of the test facility is available in Reference [8].
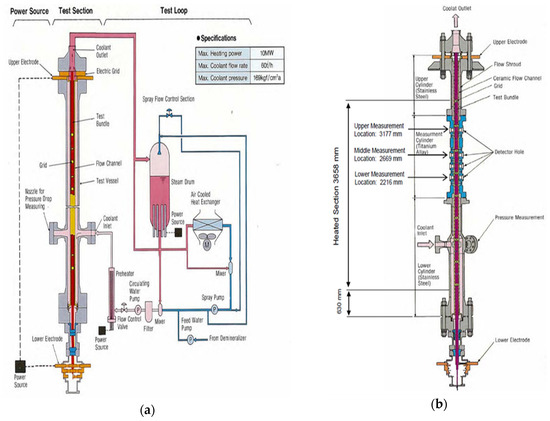
Figure 2.
NUPEC test facility [8]: (a) whole scheme of the test recirculation loop; (b) scheme of the test section where bundle void measurement tests were performed.

Table 1.
Specification of the bundle test section [8].
2.2. Multi-Dimensional Modeling
2.2.1. Common Features for Consistent Modeling
The test section of interest was modeled by 36 subchannels as depicted in Figure 3. In total, 864 (6 × 6 × 24) hydraulic volumes were modeled for the heated section by using the multi-dimensional component of each system code. As with the one-dimensional model, instead of modeling the actual shape of the spacer grid, additional pressure loss was modeled for each specific location by giving the pressure loss coefficient provided by the specification [8]. In addition, the power condition in each subchannel was implemented by the heat structure components, which gave an equivalent heat condition according to the equivalent power fraction within the subchannel. With the connection to additional hydraulic volumes upstream and downstream, which were modeled by the multi-dimensional component, the test section of interest was connected to the common boundary conditions. Whole nodalization for each system code is depicted in Figure 4. The detailed description of the model of each system code is given in the following sections.
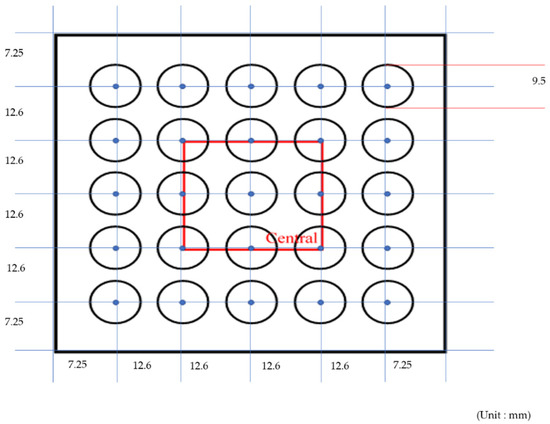
Figure 3.
Cross-sectional view of nominal bundle test section.
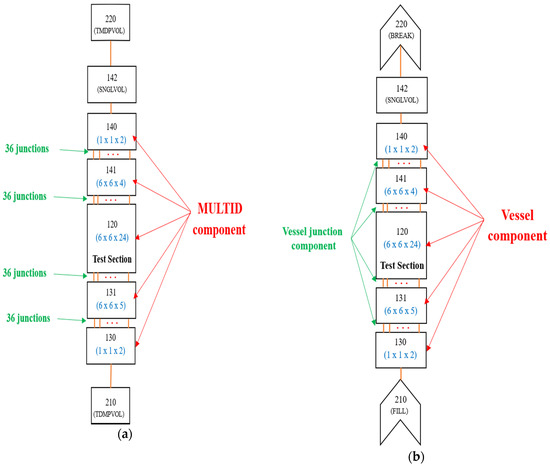
Figure 4.
Nodalization scheme of multi-dimensional model of each system code: (a) multi-dimensional model of MARS-KS; (b) multi-dimensional model of TRACE.
2.2.2. Multi-Dimensional Model of MARS-KS
For modeling the heated section, the multi-dimensional component, namely MULTID, was employed. The connections to the heated sections upstream and downstream were modeled by MULTIPLE JUNCTION components. The system pressure and inlet flow boundary conditions were modeled by TIME DEPENDENT VOLUME and TIME DEPENDENT JUNCTION components, respectively. The MULTID has the capability to model the turbulent stress and energy mixing between channels, and these are proportional to the square of a user-defined Prandtl mixing length. The required mixing length is given by Equation (1), which is recommended by the user guide [13] as the reference correlation for the channel mixing length:
where L is channel half-width, and y is given by the range from 0 to L. In this study, the maximum value of mixing length was utilized in the reference model. In addition, a sensitivity study without the mixing length term was conducted, and the results will be shown in the following section.
2.2.3. Multi-Dimensional Model of TRACE
In the case of TRACE, the VESSEL component was employed to model the heated section. As with the multi-dimensional model of MARS-KS, the additional hydraulic volumes, which were modeled by VESSEL component as well, were connected to each upstream and downstream segment of the heated section, respectively. Inter-connections between the heated section and the additional volumes were given by VESSEL JUNCTION components. The system pressure and inlet flow boundary conditions were given by BREAK and FILL components, respectively. Since TRACE has no additional turbulent model as MARS-KS, only diversion crossflows were implemented between channels.
3. Results
3.1. Model Comparison of Each System Code
In total, 219 steady-state bundle test cases were employed for the assessment. Figure 5 shows the comparison of results from the one- and multi-dimensional models of each system code by plotting the calculated void fraction with respect to the measured value. The results indicated that each system code showed no significant difference in the void prediction from the one-and multi-dimensional models. In fact, the multi-dimensional models generally showed a slightly higher void fraction than the one-dimensional models, but the difference was negligible. Even though the multi-dimensional model of MARS-KS simulated the additional turbulent mixing, no significant difference from the one-dimensional model was captured. Therefore, further assessment was made to evaluate the sensitivity of the mixing length. The results with the turbulent mixing length model were compared with the additional calculations without the model. Figure 6, where the comparison is depicted, revealed that no significant difference was observed in the void predictions from the two calculations. Furthermore, this was clearly supported by the statistical results by one-sample t-test, as listed in Table 2. For the statistical comparison, absolute error against the experimental data was calculated. In total, 657 error samples for each model were applied to the statistical test in order to assess the prediction quantitatively with respect to the allowed measurement error range, 2σ. In turn, the results were compared with each other. A hypothesis test was performed and divided into two categories based on a void fraction of 30%. This division was made due to the difference in the prediction tendency with respect to the condition, beyond which the general prediction tendency of the code showed underprediction, whereas an overprediction tendency was captured at low void regions less than 30%. The results indicated that there was no significant difference in the prediction capability, which was supported by the almost identical statistical values between the models. This means that the turbulent mixing model in MARS-KS does not play an important role in predicting the void fraction in bundles. This is because the turbulent mixing model of MARS-KS applied the same equal mass method [14] used for single-phase flow. Thus, the code cannot model direct mass and energy exchange between channels under two-phase conditions. Therefore, the model is not appropriate to give effective influence to the void prediction.
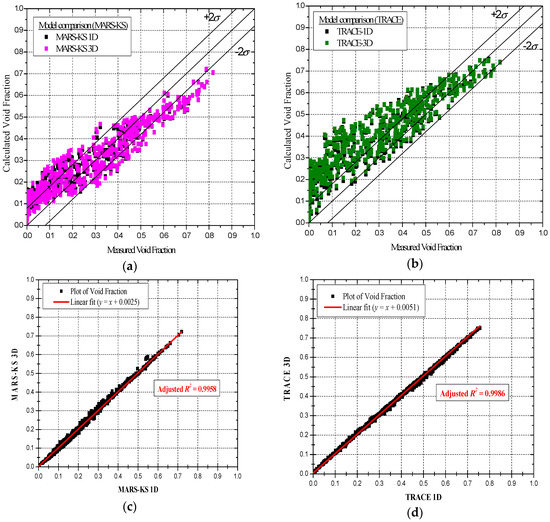
Figure 5.
Model comparisons: (a) Calculation results of MARS-KS against experimental data; (b) calculation results of TRACE against experimental data; (c) linear fit of the 3D model of MARS-KS against the 1D model of itself; (d) linear fit of the 3D model of TRACE against the 1D model of itself.
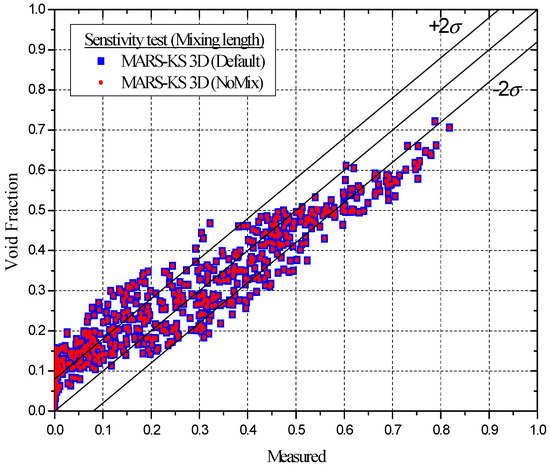
Figure 6.
Model comparison of MARS-KS for sensitivity check to mixing length.
Table 2.
Results of one-sample t-test for assessing model predictions of MARS-KS.
3.2. Code-to-Code Comparison
Figure 7 depicts the code-to-code comparison of one- and multi-dimensional results by both codes, respectively. The results clearly showed that TRACE predicted high void fractions compared to MARS-KS in both one- and multi-dimensional cases. As listed in Table 3, the results of the one-sample t-test based on absolute error samples of each code against the measured data also supported the significant difference in the void prediction between the codes. The negative t-values of MARS-KS for all categories proved that its prediction did not exceed the allowed measurement error, 2σ, generally. However, as TRACE showed positive t-values significantly, this supported that its prediction generally exceeded the allowable range. In other words, this meant that TRACE showed poor prediction capability compared to MARS-KS. It was found that such a significant overprediction tendency of TRACE came from the difference in crossflow calculation. As depicted in Figure 8, it was clearly confirmed that TRACE generally calculated much less vapor crossflow compared to MARS-KS for all test cases. Moreover, in the multi-dimensional cases, TRACE calculated the net vapor inflow to the measuring sections, whereas MARS-KS generally calculated significant vapor outflow from the measuring sections. As the accompanying liquid crossflow showed no significant difference, the difference in the void fraction prediction was totally attributable to the vapor crossflow. From these, it was clearly identified that TRACE had the tendency to keep more vapor in the central channel with much less vapor crossflow. Thus, the higher void fraction in the measuring section was the result.
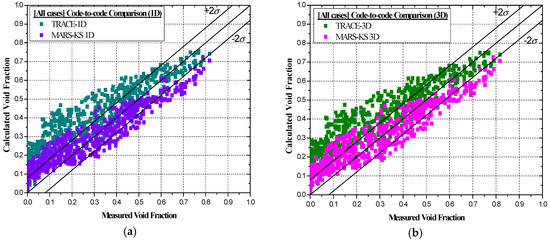
Figure 7.
Code comparisons: (a) 1D void predictions; (b) 3D void predictions.
Table 3.
Results of one-sample t-test for assessing code predictions.
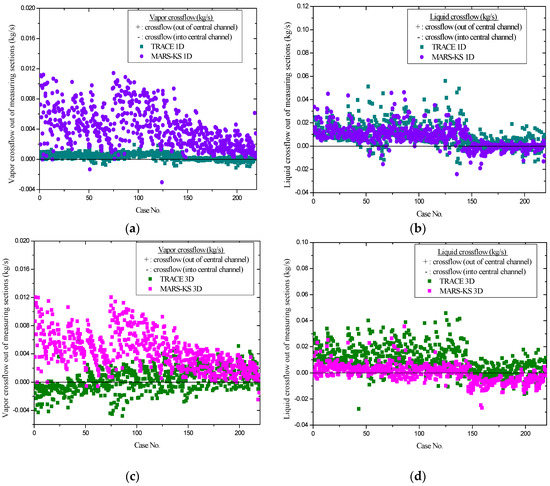
Figure 8.
Code comparisons: (a) 1D vapor crossflow; (b) 1D liquid crossflow; (c) 3D vapor crossflow; (d) 3D liquid crossflow.
3.3. Influence of Crossflow-to-Code Predictions
As it was found that there was a significant difference in crossflow calculations between both codes, and the difference made TRACE predict higher void fractions compared to MARS-KS, crossflow was considered as the root cause of the overprediction tendency. Therefore, an additional evaluation of the sensitivity against crossflow was conducted in order to clearly identify the influence of crossflow on each code prediction. For this, a simple modification of the one-dimensional model of each code, which was convenient to modify, was made as depicted in Figure 9. The modification was made by deleting crossflow junction connections and giving averaged mass flow conditions to the central measuring channel and peripheral channel, respectively. Except for test series B7, of which the averaged central mass flow fraction was 13%, the nominal mass flow condition for the central channel was given as 15% of total mass flow. The calculated result of each modified model was compared with the previous one-dimensional results of each system code, as depicted in Figure 10. Especially in the case of MARS-KS, the influence of crossflow was clearly captured, as the results showed that the modified model predicted higher void fractions compared to the default model when the crossflow was disabled. Moreover, the comparison of the modified model showed higher void fractions from MARS-KS compared to TRACE. In addition, in the case of TRACE, there was no drastic change by the crossflow because of negligible crossflow even with the default model. From these, it was clearly concluded that crossflow was the root cause of the overpredictions. Thus, further improvement to the crossflow model is necessary in order to reduce the significant overpredictions of TRACE and to improve the predictions of MARS-KS as well. For the improvement, additional constitutive models should be employed to improve the prediction of two-phase crossflow. This could be done by employing a turbulent mixing model based on the Equal Volume and Void Drift (EVVD) method, which is adopted by state-of-the-art subchannel analysis codes, in order to enhance two-phase crossflow [15]. The EVVD method enables direct mass and energy mixing between channels, by which void drift from a higher void channel to a lower void channel is induced by not only inter-channel void difference but also net liquid flow from low void to high void. Therefore, it is expected that this model will enable the enhancement of two-phase crossflow for both codes by modeling additional net mass and energy exchanges directly in the field equation of each code.
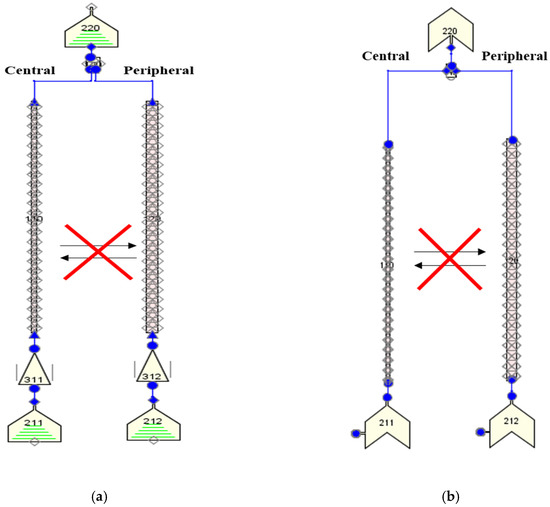
Figure 9.
Modified one-dimensional model for crossflow influence test: (a) nodalization of MARS-KS; (b) nodalization of TRACE.
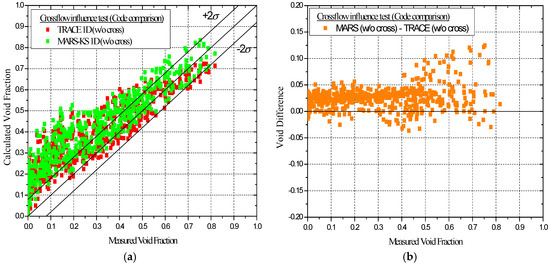
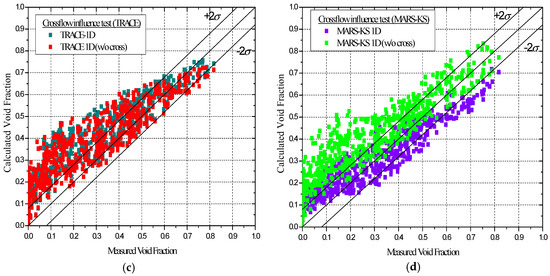
Figure 10.
Comparisons for checking influence of crossflow-to-code predictions: (a) code comparison of modified models, in which the crossflows are disabled; (b) void difference between modified models of MARS-KS and TRACE; (c) model comparison of TRACE; (d) model comparison of MARS-KS.
4. Conclusions
As a follow-up study, a further assessment of void fraction predictability of the system codes, MARS-KS 1.4 and TRACE V5.0, was performed with one- and multi-dimensional models, mainly to find the root cause of overprediction tendencies in bundle cases identified by the previous study. In total, 219 steady-state bundle test cases from the OECD/NRC PSBT benchmark were utilized for the assessment. From the model comparison of each system code, it was found that each code showed no significant difference in void prediction between one- and multi-dimensional models. In the case of MARS-KS, because the multi-dimensional model cannot implement direct mass and energy exchange due to turbulence, no clear difference emerged when compared to the one-dimensional model of itself. Therefore, it was concluded that the turbulent mixing model of MARS-KS is not appropriate to cover two-phase mixing flow within the bundle. Meanwhile, as TRACE showed significant void predictions due to fewer crossflow calculations compared to MARS-KS, crossflow was considered as the root cause of the overprediction tendency. From the additional assessment with the modified one-dimensional models, it was clearly confirmed that crossflow significantly affects the code predictions, and thus crossflow is the root cause of the overpredictions in the bundle cases. From these, it was concluded that further improvement of the crossflow model is necessary in order to predict the void fraction more realistically. As state-of-the-art subchannel codes adopt the Equal Volume and Void Drift (EVVD) method as the turbulent mixing model to improve the inter-channel crossflow, this study concludes that an improvement should be made with the application of the EVVD method to model the direct net mass and energy interchanges between channels under two-phase flow conditions. Therefore, as a future work, modification of the crossflow model will be made by applying the EVVD method to both one- and multi-dimensional solutions of each system code, respectively.
Author Contributions
Conceptualization, funding acquisition, project administration, resources, and supervision, T.K.; methodology and investigation, Y.L. and T.K.; formal analysis, validation, visualization, writing—original draft preparation, and writing—review and editing, Y.L. All authors have read and agreed to the published version of the manuscript.
Funding
This work was supported by Incheon National University (International Cooperative) Research Grant in 2018.
Conflicts of Interest
The authors declare no conflicts of interest.
References
- Kalaga, D.V.; Yadav, A.; Goswami, S.; Bhusare, V.; Pant, H.J.; Dalvi, S.V.; Joshi, J.B.; Roy, S. Comparative analysis of liquid hydrodynamics in a co-current flow-through bubble column with densely packed internals via radiotracing and Radioactive Particle Tracking (RPT). Chem. Eng. Sci. 2017, 170, 332–346. [Google Scholar] [CrossRef]
- Breeze, P. Nuclear Power. In Nuclear Power Generation Technologies. 2019, pp. 399–429. Available online: https://www.sciencedirect.com/science/article/pii/B9780081026311000171?via%3Dihub (accessed on 16 July 2020). [CrossRef]
- Wu, B.; Firouzi, M.; Mitchell, T.; Rufford, T.E.; Leonardi, C.; Towler, B. A critical review of flow maps for gas-liquid flows in vertical pipes and annuli. Chem. Eng. J. 2017, 326, 350–377. [Google Scholar] [CrossRef]
- Schlegel, J.P.; Sawant, P.; Paranjape, S.; Ozar, B.; Hibiki, T.; Ishii, M. Void fraction and flow regime in adiabatic upward two-phase flow in large diameter vertical pipes. Nucl. Eng. Des. 2009, 239, 2864–2874. [Google Scholar] [CrossRef]
- Liu, H.; Hibiki, T. Flow regime transition criteria for upward two-phase flow in vertical rod bundles. Int. J. Heat Mass Transf. 2017, 108, 423–433. [Google Scholar] [CrossRef]
- Korea Atomic Energy Research Institute. MARS Code Manual; Volume V: Models and Correlations; KAERI/TR-3872/2009; Korea Atomic Energy Research Institute: Daejeon, Korea, 2009. [Google Scholar]
- Lee, Y.S.; Kim, T.W. Assessment of void fraction predictability of system codes in subchannels. Kerntechnik 2018, 83, 414–425. [Google Scholar] [CrossRef]
- Rubin, A.; Schoedel, A.; Avramova, M.; Utsuno, H.; Bajorek, S.; Velazquez-Lozada, A. OECD/NRC Benchmark Based on NUPEC PWR Subchannel and Bundle Tests (PSBT); Volume 1: Experimental Database and Final Problem Specifications. OECD/NEA Nuclear Science Committee, 2012. Available online: http://www.oecd-nea.org/globalsearch/download.php?doc=77653 (accessed on 16 July 2020).
- United States Nuclear Regulatory Commission. TRACE V5.0 Theory Manual: Field Equations, Solution Methods, and Physical Models; ML071000097; United States Nuclear Regulatory Commission: Washington, DC, USA, 2012.
- Korea Atomic Energy Research Institute. MARS Code Manual; Volume I: Code Structure, System Models, and Solution Methods; KAERI/TR-2812/2004; Korea Atomic Energy Research Institute: Daejeon, Korea, 2009. [Google Scholar]
- United States Nuclear Regulatory Commission. RELAP5/MOD3.3 Code Manual; Volume I: Field Equations, Solution Methods, and Physical Models; NUREG/CR-5535/Rev P5; United States Nuclear Regulatory Commission: Washington, DC, USA, 2016.
- Nuclear Energy Agency. International Benchmark on Pressurised Water Reactor Sub-Channel and Bundle Tests; Volume II: Benchmark Results of Phase I–Void Distribution. NEA/NSC/R(2015)4. 2016. Available online: https://www.oecd-nea.org/science/docs/2015/nsc-r2015-4.pdf (accessed on 16 July 2020).
- Korea Institute of Nuclear Safety. MARS-KS Code Manual; Volume II: Input Requirements; KINS/RR-1282 Rev.1; Korea Institute of Nuclear Safety: Daejeon, Korea, 2016. [Google Scholar]
- Todreas, N.E.; Kazimi, M.S. Subchannel Analysis. In Nuclear Systems II: Elements of Thermal Hydraulic Design. Massachusetts Institute of Technology, 1990; pp. 246–251. Available online: http://www.gammaexplorer.com/wp-content/uploads/2014/03/Nuclear-Systems-II-Elements-of-Thermal-Hydraulic-Design-Todreas.pdf (accessed on 16 July 2020).
- Mao, H.; Yang, B.W.; Wang, S. A Review of Void Drift Models in Subchannel Analysis. Nucl. Sci. Eng. 2018, 193, 33–45. [Google Scholar] [CrossRef]


© 2020 by the authors. Licensee MDPI, Basel, Switzerland. This article is an open access article distributed under the terms and conditions of the Creative Commons Attribution (CC BY) license (http://creativecommons.org/licenses/by/4.0/).