Article

Analysis of Torque Ripples of an Induction Motor Taking into Account a Inter-Turn Short-Circuit in a Stator Winding

Institute of Electrical Engineering and Electronics, Division of Mechatronics and Electrical Machines, Poznan University of Technology, ul. Piotrowo 3a, 60-965 Poznań, Poland
*
Author to whom correspondence should be addressed.
Energies 2020, 13(14), 3626; https://doi.org/10.3390/en13143626
Submission received: 9 June 2020 / Revised: 9 July 2020 / Accepted: 11 July 2020 / Published: 14 July 2020

Abstract

:
Despite the increasing popularity of permanent magnet synchronous machines, induction motors (IM) are still the most frequently used electrical machines in commercial applications. Ensuring a failure-free operation of IM motivates research aimed at the development of effective methods of monitoring and diagnostic of electrical machines. The presented paper deals with diagnostics of an IM with failure of an inter-turn short-circuit in a stator winding. As this type of failure commonly does not lead immediately to exclusion of a drive system, an early stage diagnosis of inter-turn short-circuit enables preventive maintenance and reduce the costs of a whole drive system failure. In the proposed approach, the early diagnostics of IM with the inter-turn short-circuit is based on the analysis of an electromagnetic torque waveform. The research is based on an elaborated numerical field–circuit model of IM. In the presented model, the inter-turn short-circuit in the selected winding has been accounted for. As the short-circuit between the turns can occur in different locations in coils of winding, computations were carried out for various quantity of shorted turns in the winding. The performed analysis of impact of inter-turn short-circuit on torque waveforms allowed to find the correlation between the quantity of shorted turns and torque ripple level. This correlation can be used as input into the first layer of an artificial neural network in early and noninvasive diagnostics of drive systems.

1. Introduction

Due to their simple mechanical design, low cost, and robustness, induction machines are most often used in commercial applications [1,2,3,4]. Despite design efforts aimed to increase the reliability of IM, failures still occur. As the initial stages of failures may not have a direct effect on operation of the machine their detection is difficult [5,6,7]. However, they may spread in the interior of the machine and in consequence may lead to a stoppage of a technological process in a factory [2,8,9,10]. Therefore, the diagnostics of electric motors and the detection of failures at their early stage plays an important role in industrial applications [11,12].
The review of the literature shows that the most often appearing failures of induction motors is due to damages in a stator circuit [9,11,13,14]. The most common failures in the stator’s circuit concerns inter-turn short-circuits that account for over 30% of all failures. Inter-turn short-circuits occur as a consequence of damage to the insulation of a sole coil turn [15]. Damage to the insulation can be caused by a flow of current with an intensity exceeding rated values, which leads to release of energy in a form of heat as well as by a mechanical stress. In addition, ubiquitously used frequency converters such as inverters that use fast switching PWM also affect faster degradation of the insulation [16,17]. The assessment of the state of the insulation takes place by means of various dielectric measurements such as that of the dissipation factor, capacitance, or insulation resistance [18]. The most popular diagnostics methods for testing the insulation condition are as follows; a partial discharge test, a polarization index calculation, a dissipation factor, and a power factor tip-up [19]. The methods listed above are based on offline diagnostics and require the experience of a diagnostician as well as a comprehensive measurement system [16].
There are lot of publications in the literature related to faults occurred in the stator winding of induction motor. Most of them only apply to an analysis an impact of the inter-turn short-circuit on current of stator windings. This approach requires analysis of three signals at the same time. In addition, the impact of a small amount of shorted turns on phase currents for a loaded motor can be difficult to observe. However, the progressive damage process may affect torque waveforms. Despite the fact that measuring of the torque waveforms is a very difficult task, the progress in field of sensors will soon allow such measurements to be made in easy way. Therefore, this article focuses on presenting the results of simulation tests, which take into account short-circuits that result in torque waveforms. The analysis was carried out for a motor loaded at an external torque of 0 Nm as well as 15 Nm. These two values correspond to no-load and rated load, respectively. Based on the results of the analysis, the torque ripple factor was determined.
Based on a review of the latest developments in the field of electric motor diagnostics, two main approaches can be favored. The first approach is based on analytical calculations, while the second approach uses numerical methods, e.g., the finite element method or the finite difference method [20]. The most frequently used diagnostic signals include motor phase current waveforms, vibroacoustic signals, axial flux or supply voltage waveforms [21,22]. The above-mentioned diagnostic signals are widely used in diagnostics of many motors failures, especially mechanical damages such as a shaft misalignment or bearing failures. Nevertheless, as mentioned in the previous paragraph, failures in the electrical circuit, such as inter-turn short-circuits in their early stage, do not have a significant impact on the waveforms of the above-mentioned diagnostic quantities. Therefore, the torque waveforms of the machine can be used for early diagnostics of stator winding of electric motors, despite the difficulties associated with obtaining as the diagnostic signal [23].
Many papers describe approaches that do not consider the impact of short-circuits in the stator circuit on the torque waveforms, or they are based on the short-circuit modeling using either analytical calculations. In the presented paper, the authors propose the analysis of the inter-fault short-circuits using the field–circuit model of the machine. The use of such model allows for comprehensive analysis of the inter-turn short-circuits, taking into account nonlinear phenomena occurring during motor operation in an emergency fault condition. On the basis of the developed field–circuit model, authors managed to determine a torque ripple coefficient for different numbers of shorted turns.
In the following paper, the authors present parameters of the considered motor and the method of modeling inter-turn short-circuits using a field–circuit model of electromagnetic phenomena. Then, an analysis of the obtained torque waveforms of a squirrel cage motor for various degrees of stator winding failures is presented. The paper also presents the influence of the inter-turn short-circuits on the distribution of the magnetic field in the machine. Finally, the method for determining the torque ripple coefficient and conclusions are presented.

2. Stator Winding Failure—Inter-Turn Short-Circuit Modeling

Modeling of winding short-circuits on real object requires building a dedicated stator winding for each case of damage. As the short-circuits can occur in different locations in the coil and can have different impact on the current or torque waveforms, the number of cases to be studied is high. To mitigate the discussed disadvantage of experimental-based methods in the proposed approach, the advanced computer simulation technique based on Finite Element Method (FEM) has been applied. Development of the precise numerical model of the electromagnetic field inside the IM allows for calculation of waveforms of the rotational speed, torque, and for any type of fault. It is also possible to study different operating states of the machine.

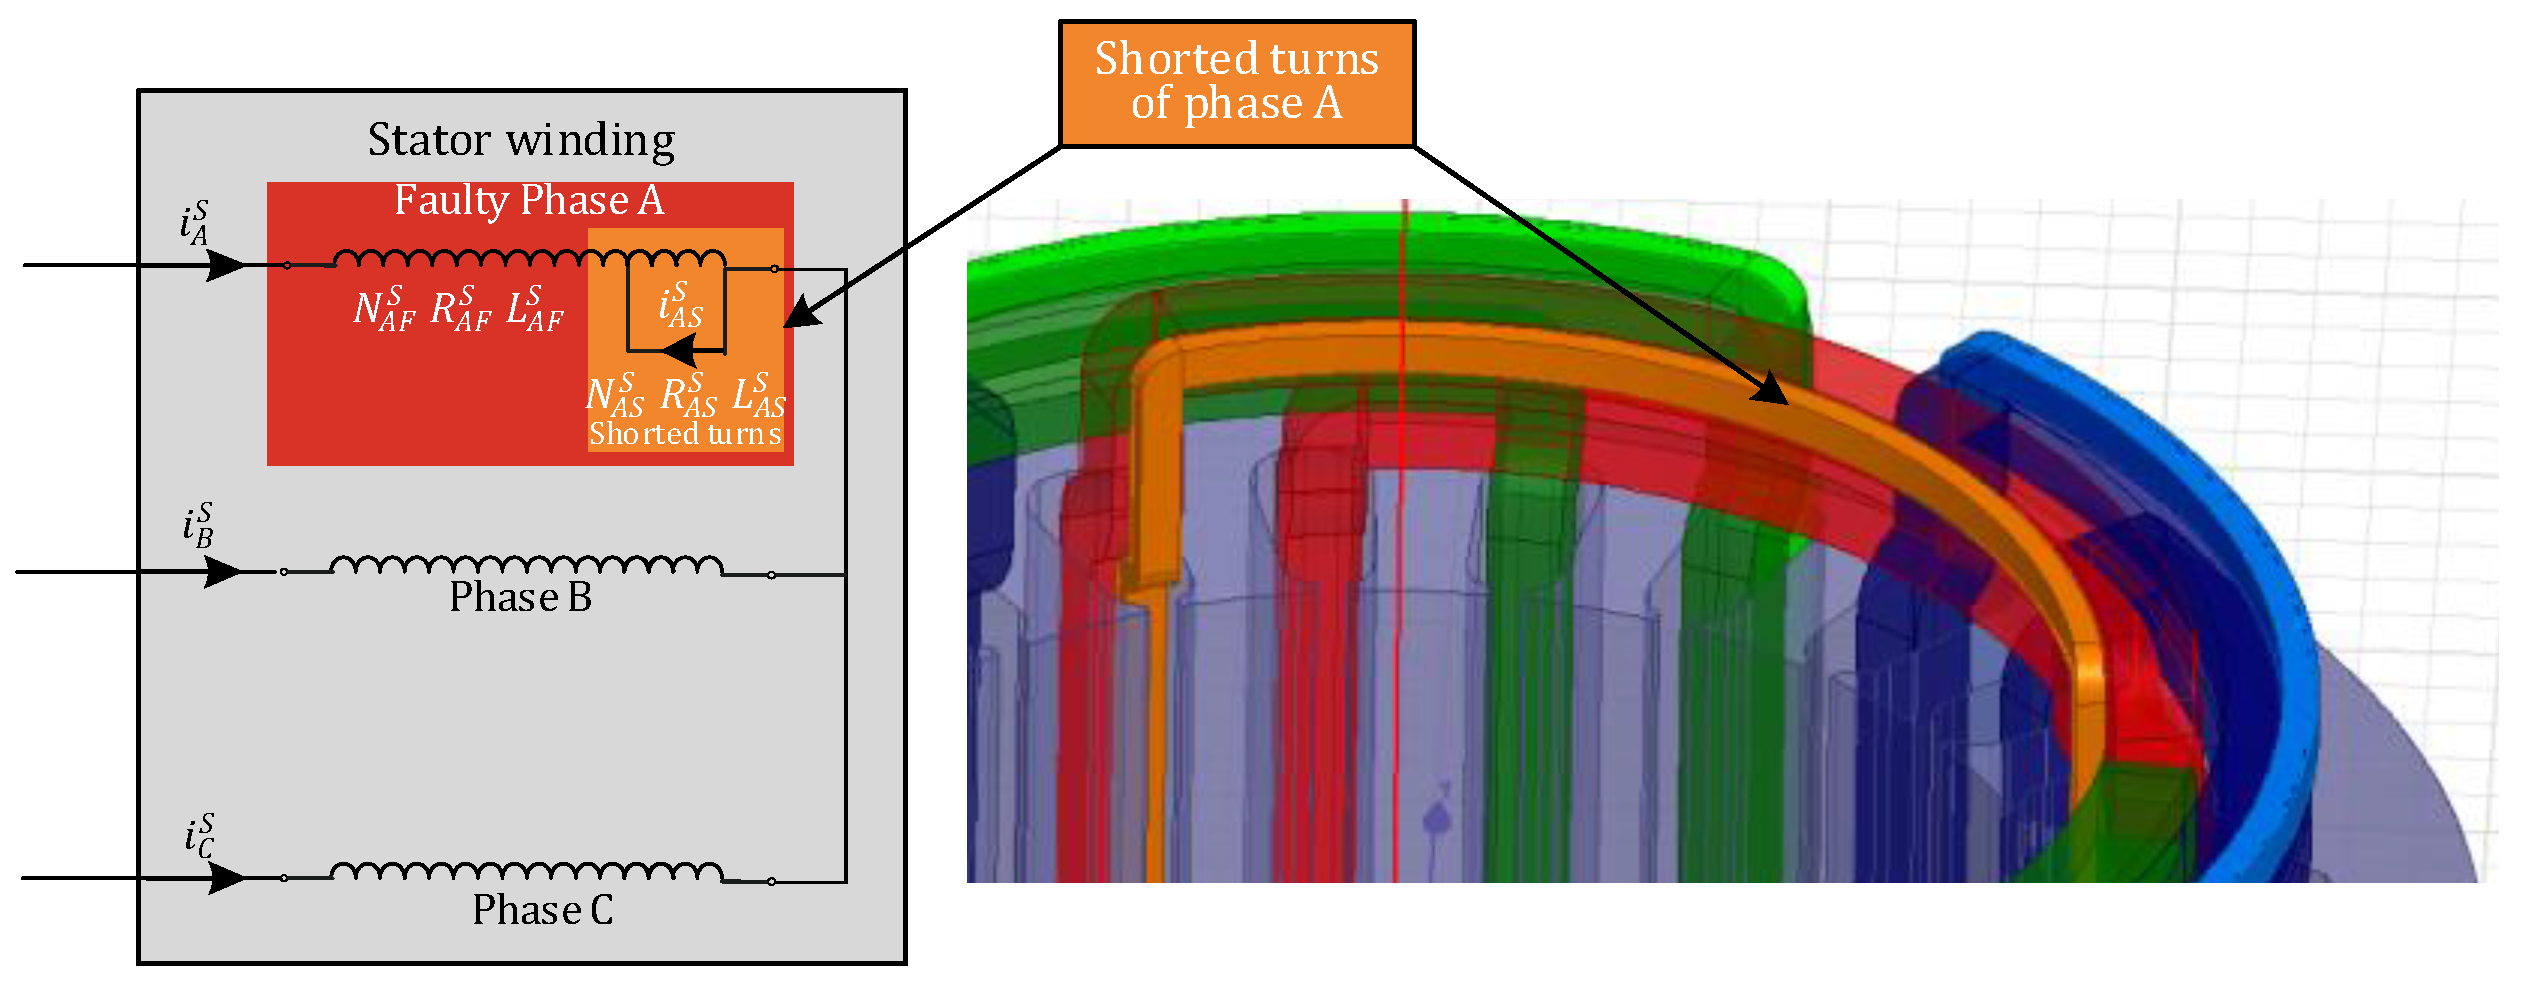
2.1. Method of Modeling Inter-Turn Short-Circuit

When an inter-turn short-circuit occurs in the stator winding, the winding can be divided into two different sections (Figure 1). The first section regards the shorted part of the winding, while the second regards the unshorted turns.
For better understanding of the presented issue, the individual motor phases are highlighted by three different colors. For phase A it is red, for phase B green, and for phase C blue. In phase A, the shorted part of the winding is marked in orange.
The phase windings of the stator can be described by the three lumped parameters: the number of turns N, the resistance R, and the inductance L. The shorted part of the winding in phase A is described with N A F S , R A F S , and L A F S , where upper index “S” relates to the stator, lower index “A” relates to the phase A, and lower index “F” state for faulty, i.e., the unshorted part of winding. While, in the case of the shorted part, it is N A S S , R A S S , and L A S S , where upper index “S” relates to stator, lower index “A” relates to phase A, and lower index “S” is the part of the winding with shorted turns.
The damage ratio ( k f ) of stator winding can be defined as the ratio of the number of shorted turns to the nominal number of turns [24], and can be calculated as follows,
k f = N S N p h  
where N S is the number of shorted turns and N p h is the nominal number of turns.
In case of damage in stator, the phase A damage ratio can be written as follows,
k A S = N A S S N N S
where N A S S is the number of shorted turns and N N S is the nominal number of turns.
The value of resistance R A F S as well as inductance L A F S of unshorted part of winding (faulty) can be expressed based on its nominal values ( R A S , L A S ) then calculated by following formula.
R A F S = ( 1 k A S ) R A S L A F S = ( 1 k A S ) 2 L A S
In the same way, the lumped parameters of the shorted part can be described as
R A S S = ( k A S ) R A S L A S S = ( k A S ) 2 L A S
After rotor parameters were referred to the stator side, a system of voltage equations with representation of the squirrel cage is the three phase system. For the circuit of stator and rotor, the system of equations can be written in the following matrix form,
U S = i S R S + L S S d d t ( i S ) + d d t ( L S R i S ) U R = i R R R + L R R d d t ( i R ) + d d t ( L S R i R )  
where vectors of phase voltages and currents are as follows,
U S = [ U A F S U A S S U B S U C S ] ,   U R = N B R N N S   [ U A R U B R U C R ] ,   i S = [ i A F S i A S S i B S i C S ]   , i R = N B R N N S [ i A R i B R i C R ]
where N B R is the nominal number of bars in rotor.
The parameters of machine like stator winding inductance and resistance can be written in the following matrix form:
R S = [ R A F S R A S S 0 0 R A S S R A S S 0 0 0 0 R B S 0 0 0 0 R C S ] ,   R R = N N S N B R [ R A R 0 0 0 R B R 0 0 0 R C R ]
where R A F S , R A S S , R B S   , and R C S are the resistances of the stator winding, and R A R , R B R , and R C R are the resistances of the rotor winding.
L S S = [ L A F S ( L A S S + M A F A S ) M A F B + M A S B M A F C + M A S C ( L A S S + M A F A S ) L A S S M A S B M A S C M A F B M A S B L B S M B C M A F C M A S C M B C L C S ] .
L S R = N N S N B R [ M A F S R cos ( θ ) M A F S R cos ( θ + 2 π / 3 ) M A F S R cos ( θ 2 π / 3 ) M A S S R cos ( θ + γ A S ) M A S S R cos ( θ + γ A S + 2 π / 3 ) M A S S R cos ( θ + γ A S 2 π / 3 ) M B S R cos ( θ 2 π / 3 ) M B S R cos ( θ ) M B S R cos ( θ + 2 π / 3 ) M C S R cos ( θ + 2 π / 3 ) M C S R cos ( θ 2 π / 3 ) M C S R cos ( θ ) ]
where L A F S , L A S S , L B S , and L C S are the self-inductances of winding, M S R   is the mutual inductance between stator and rotor, θ is the angle of rotor position, and γ is the angle between shorted coil and stator winding coil.
The rotor resistance R R can be expressed as a sum of the rotor bar resistance R b a r R and the end ring resistance R r i n g R ,
R A R = R B R = R C R = R R = 1 p ( R b a r R + R r i n g R )
Equations of stator and rotor must be supplemented by mechanical equilibrium equation. The equation of mechanical equilibrium is expressed in the following form,
J d ω dt = T e T L .
where T e = [ i S ] T L S R Θ i R   is the electromagnetic torque, TL is the load torque, ω is the angular speed, and J is the inertia moment of moving mass.
To calculate the values of winding inductance in Equations (3)–(11), i.e., the healthy part and the faulty one, it is preferable to use a field model of machine. In this approach, the inductance values are calculated based on the magnetic field distribution. The calculations are realized in two steps. In the first step, the linkage fluxes with phase windings were calculated. In the second step, the inductances were calculated on the basis of linkage fluxes and the phase currents.

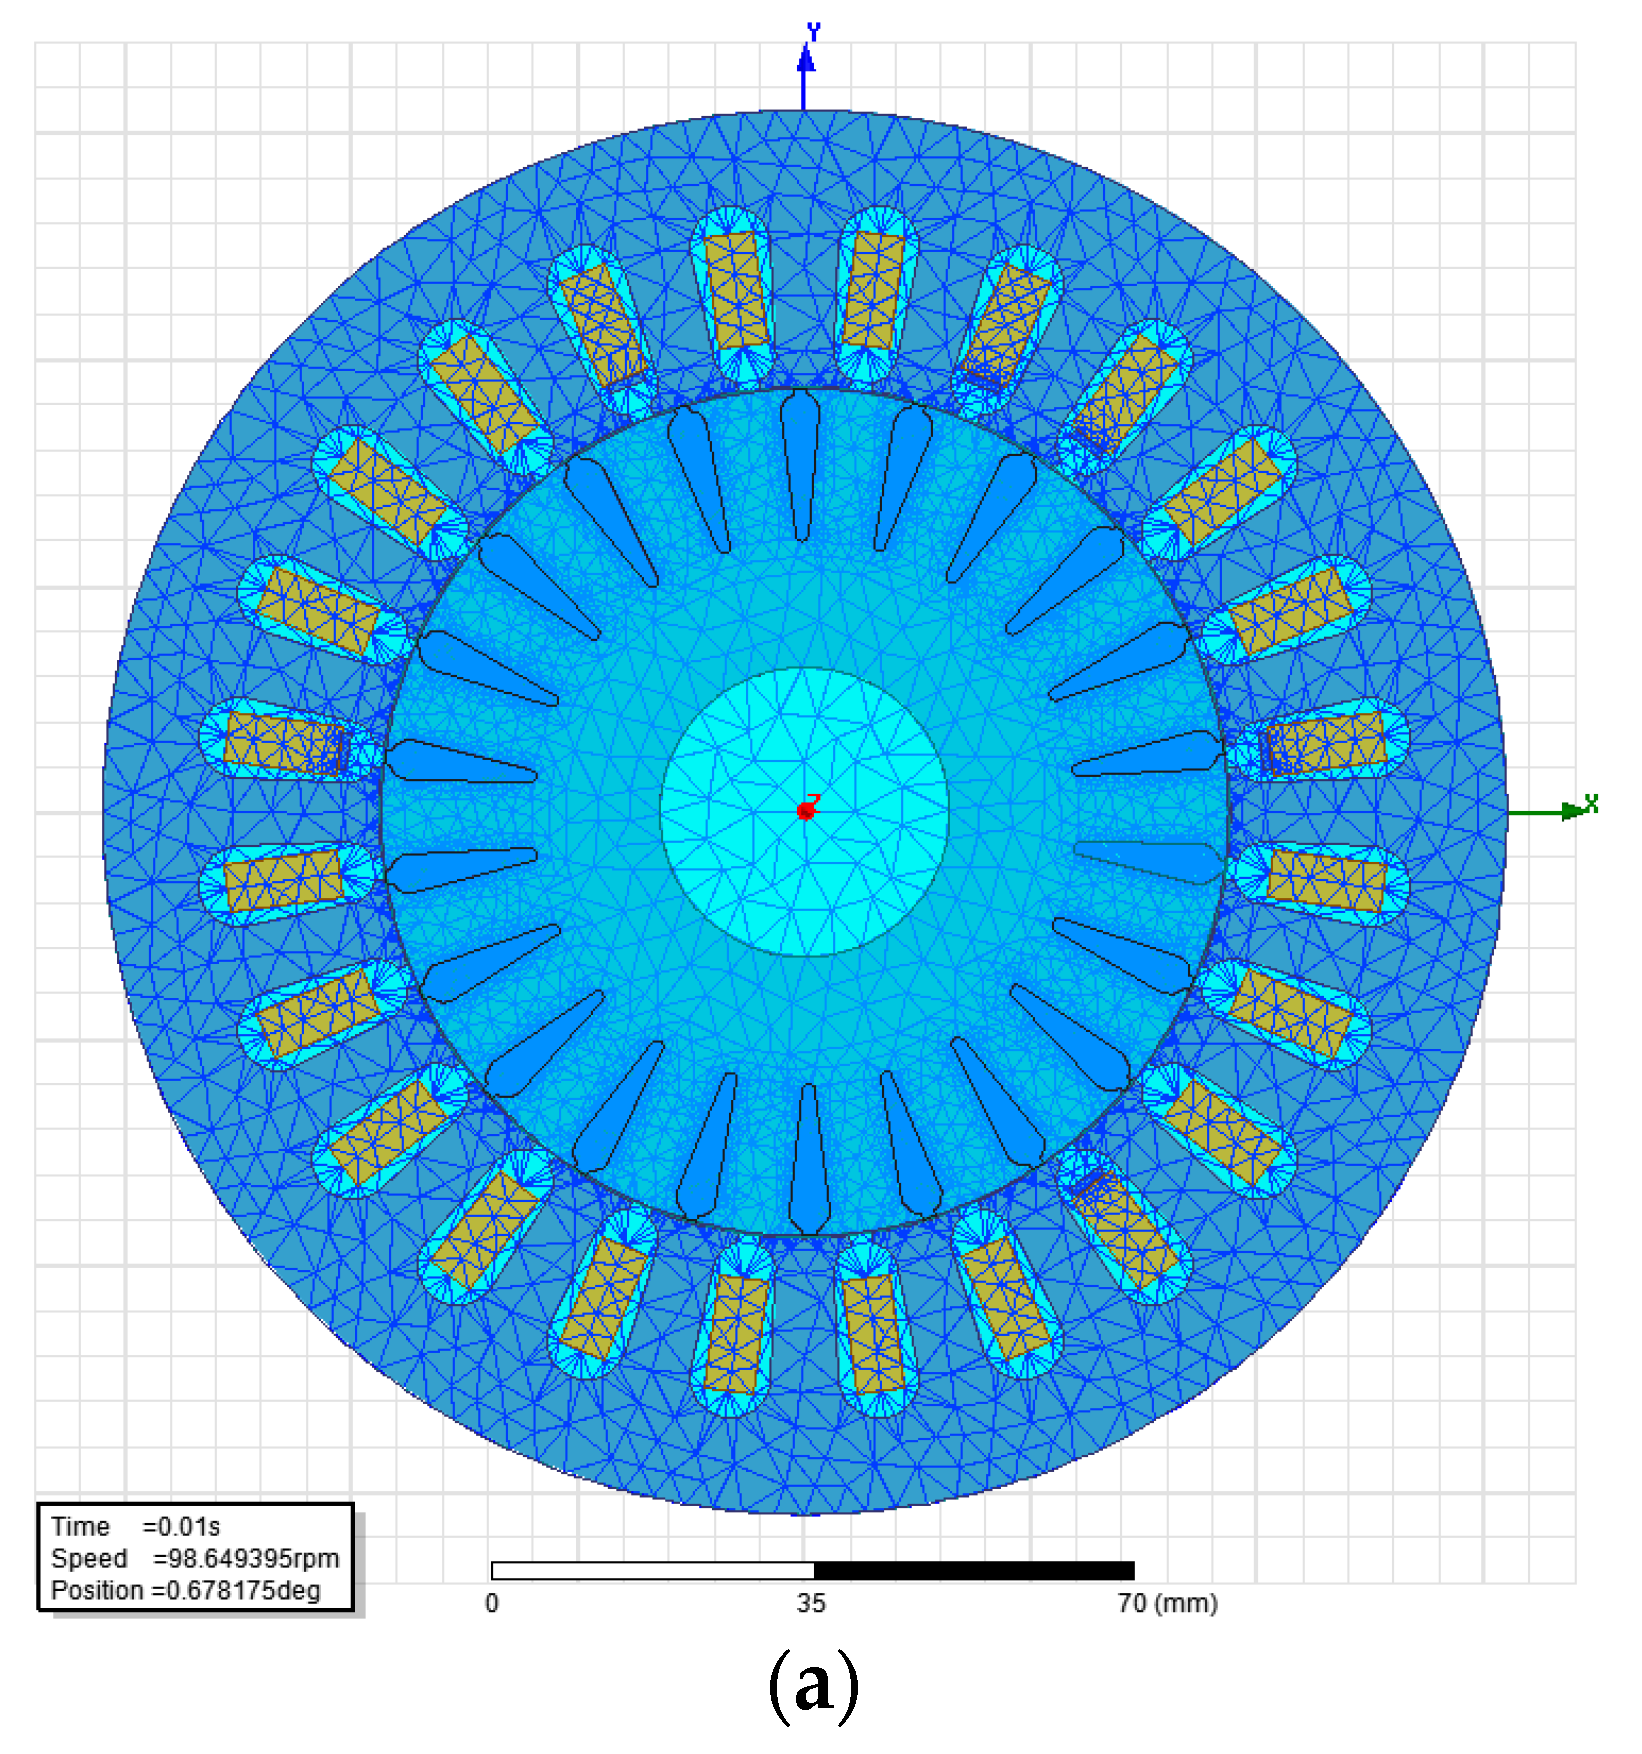
2.2. Field–Circuit Model of the Induction Motor

The field–circuit model of machine includes the field equations, which describe the electromagnetic field distribution, as well as the circuit equations, which describe the windings connections and the supply system. The magnetic field distribution using magnetic vector potential A may be described by following equation,
× ( ν × A ) = J J = σ ( d d t A + V )
where ν is the magnetic reluctivity, J is the current density vector,   σ is the conductivity, and V is the electric scalar potential.
Basically, in the case of voltage-excited fields in devices with nonlinear elements (stator and rotor cores), currents in windings are not known in advance. Therefore, the value of current density vector J is not known. Therefore, the electric equations of the device windings should also be considered. A set of equations can be written as Equation (5). Moreover, these equations are coupled through the electromagnetic torque to the equation of motion (11).

3. Selected Results of the Torque Calculation

The field–circuit model of IM presented above was used to calculate torque waveforms. The field–circuit motor model has been developed in the Ansys Maxwell environment. The structure of the magnetic circuit and applied FE mesh is shown in Figure 2a, while the applied electric circuit, considering the inter-turn short-circuit, is presented in Figure 2b. Using the developed model, the torque waveforms of the IM were calculated for different values of k A S . Calculations were carried out for a general purpose squirrel IM. Its rated parameters are shown in Table 1.
The calculations take into account that the magnetic circuit is nonlinear, i.e., in the model, there is assigned a nonlinear magnetization characteristic to domains representing the stator and rotor cores. The rotor cage is made of aluminum. The supply phase voltages are sinusoidal and displaced by the angle of 2 3 π . In every phase winding there are four coils, and the number of turns in every phase is 220 and the number of turns per phase is 220. Taking in to account the documentation of the presented motor, the field model of the machine was developed. Calculations were performed for the number of shorted turns from 0 to 55. The machine failure level was adjusted by changing the parameter N A S S . In the rest of article, we will use the designation Nf instead of N A S S .

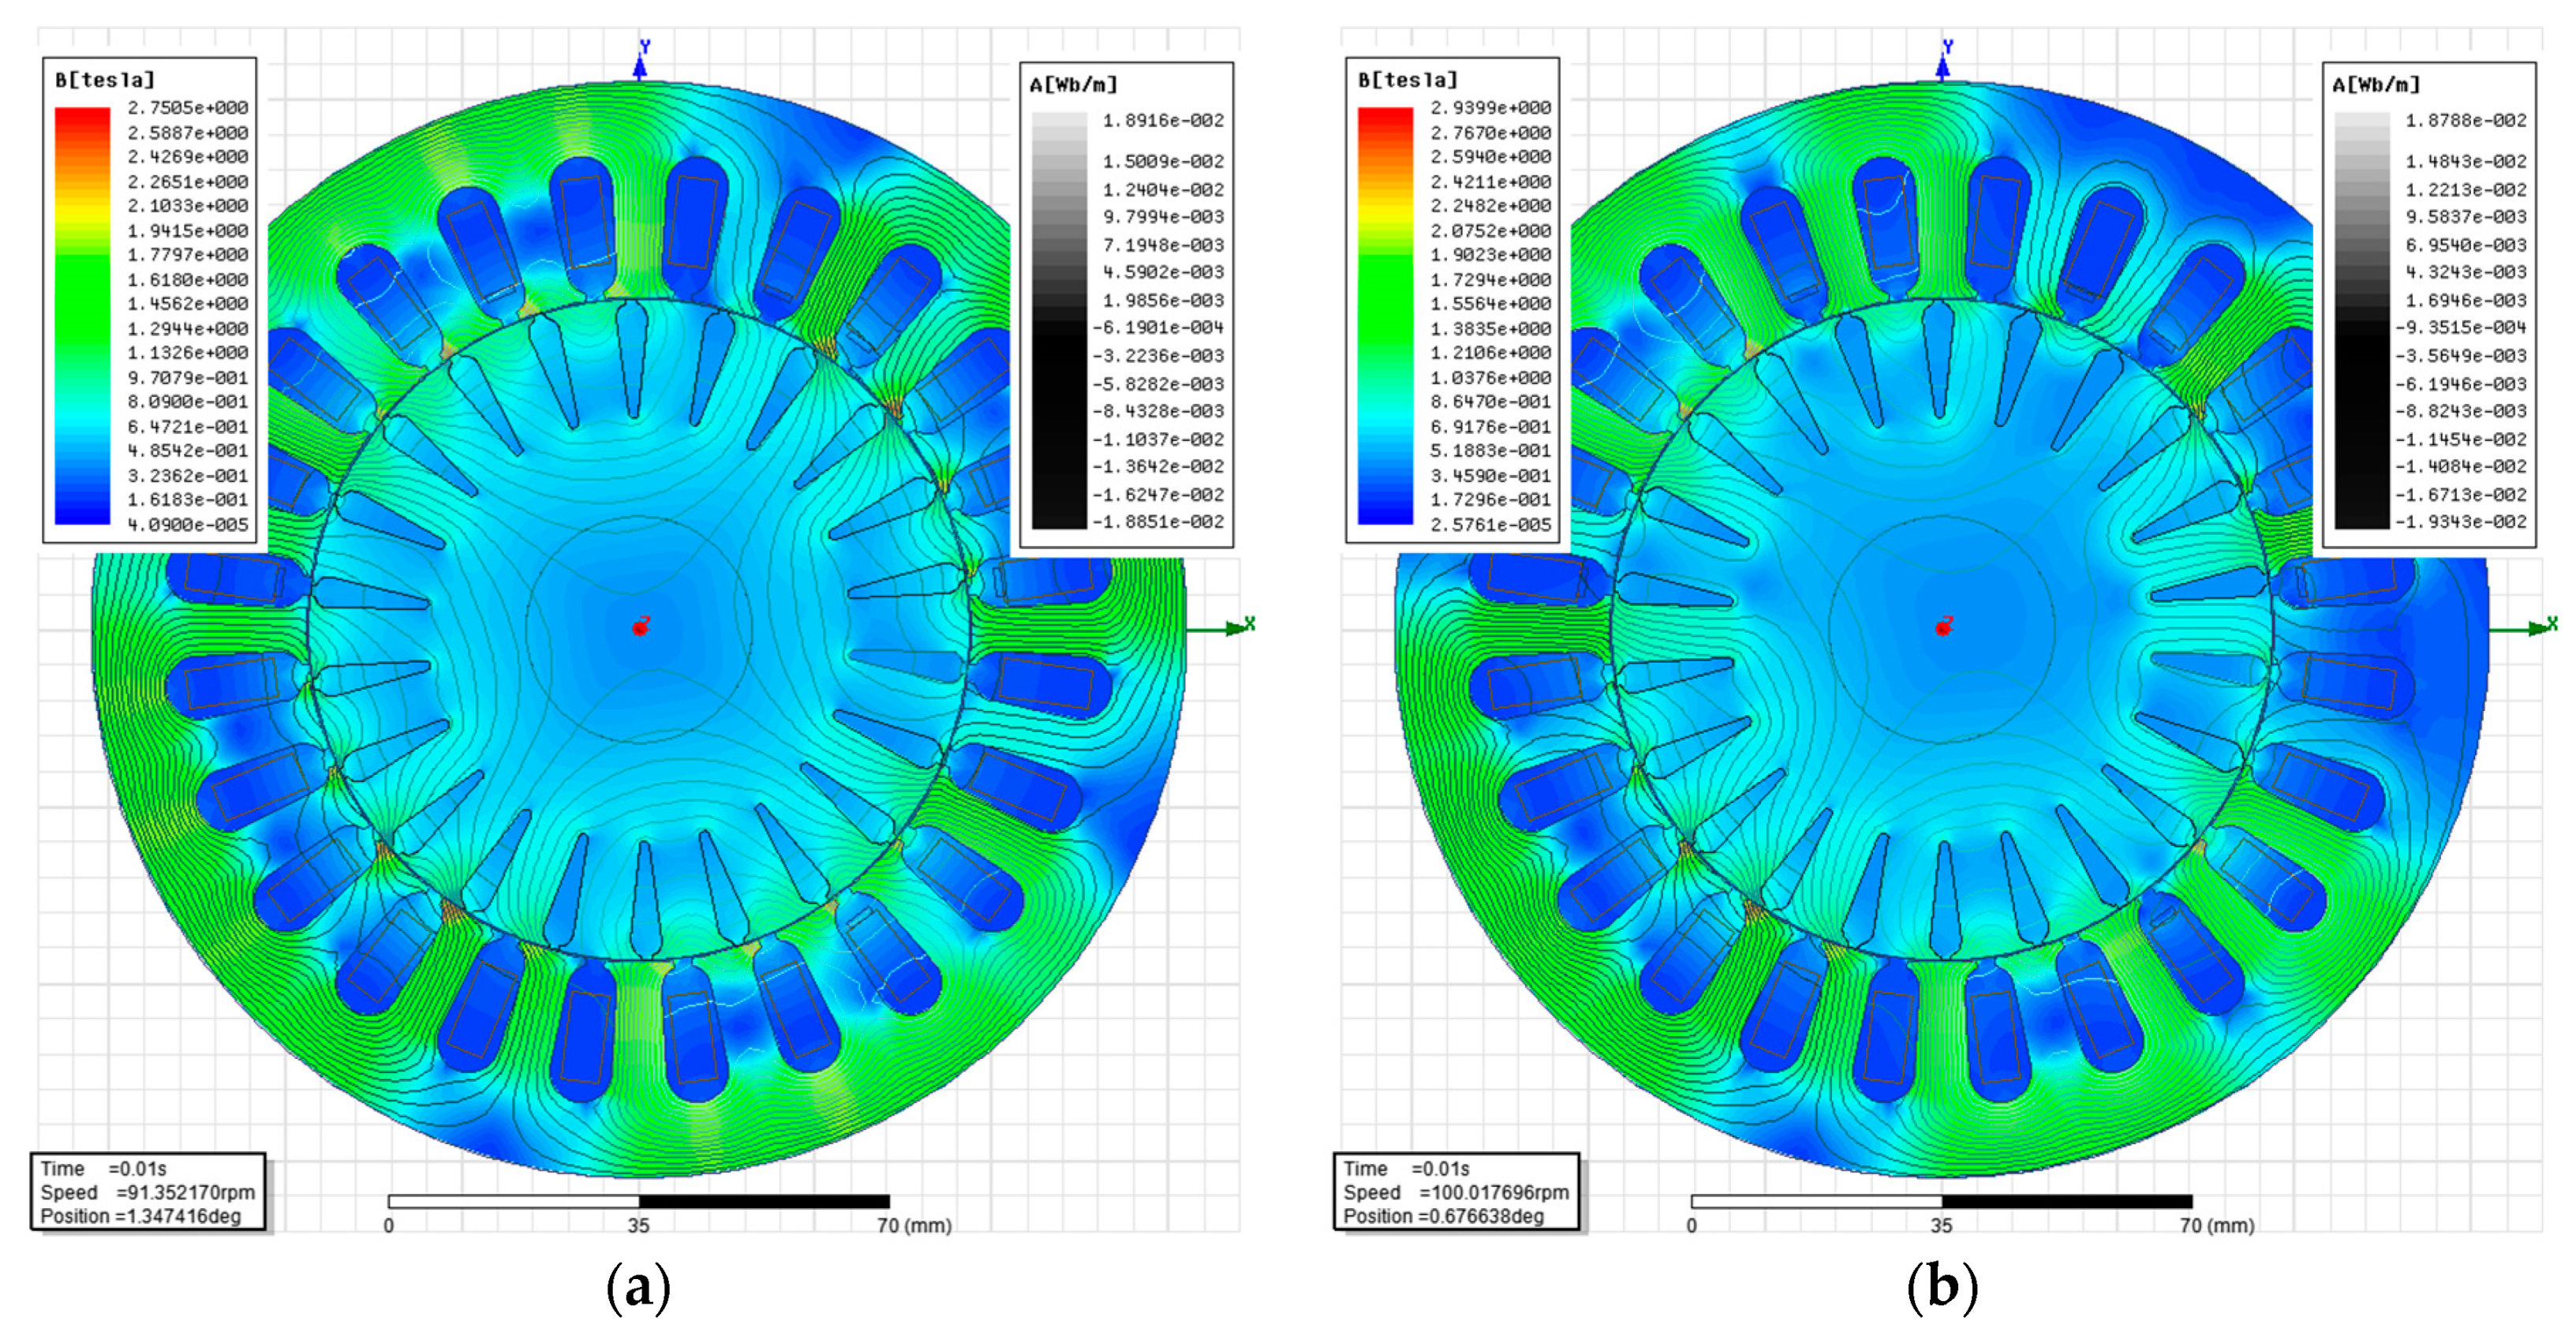
3.1. Magnetic Field Distribution

Due to long computation time of calculation of 3D magnetic field distribution, further research was performed using simplified 2D model of the machine. Mesh parameters of the FEM model are shown in Table 2.
The distributions of magnetic flux lines and density in the cross section of the magnetic circuit of the machine in the case of (a) Nf = 1 turn and (b) Nf = 40 turns are shown in Figure 3a,b, respectively. It can be observed that at time 0.01 s after switching on the power supply, the angle of rotor position is equal to 1.347 deg in case of Nf = 1 turn, and the angle of rotor position is equal to 0.677 deg in case of Nf = 40 turns.

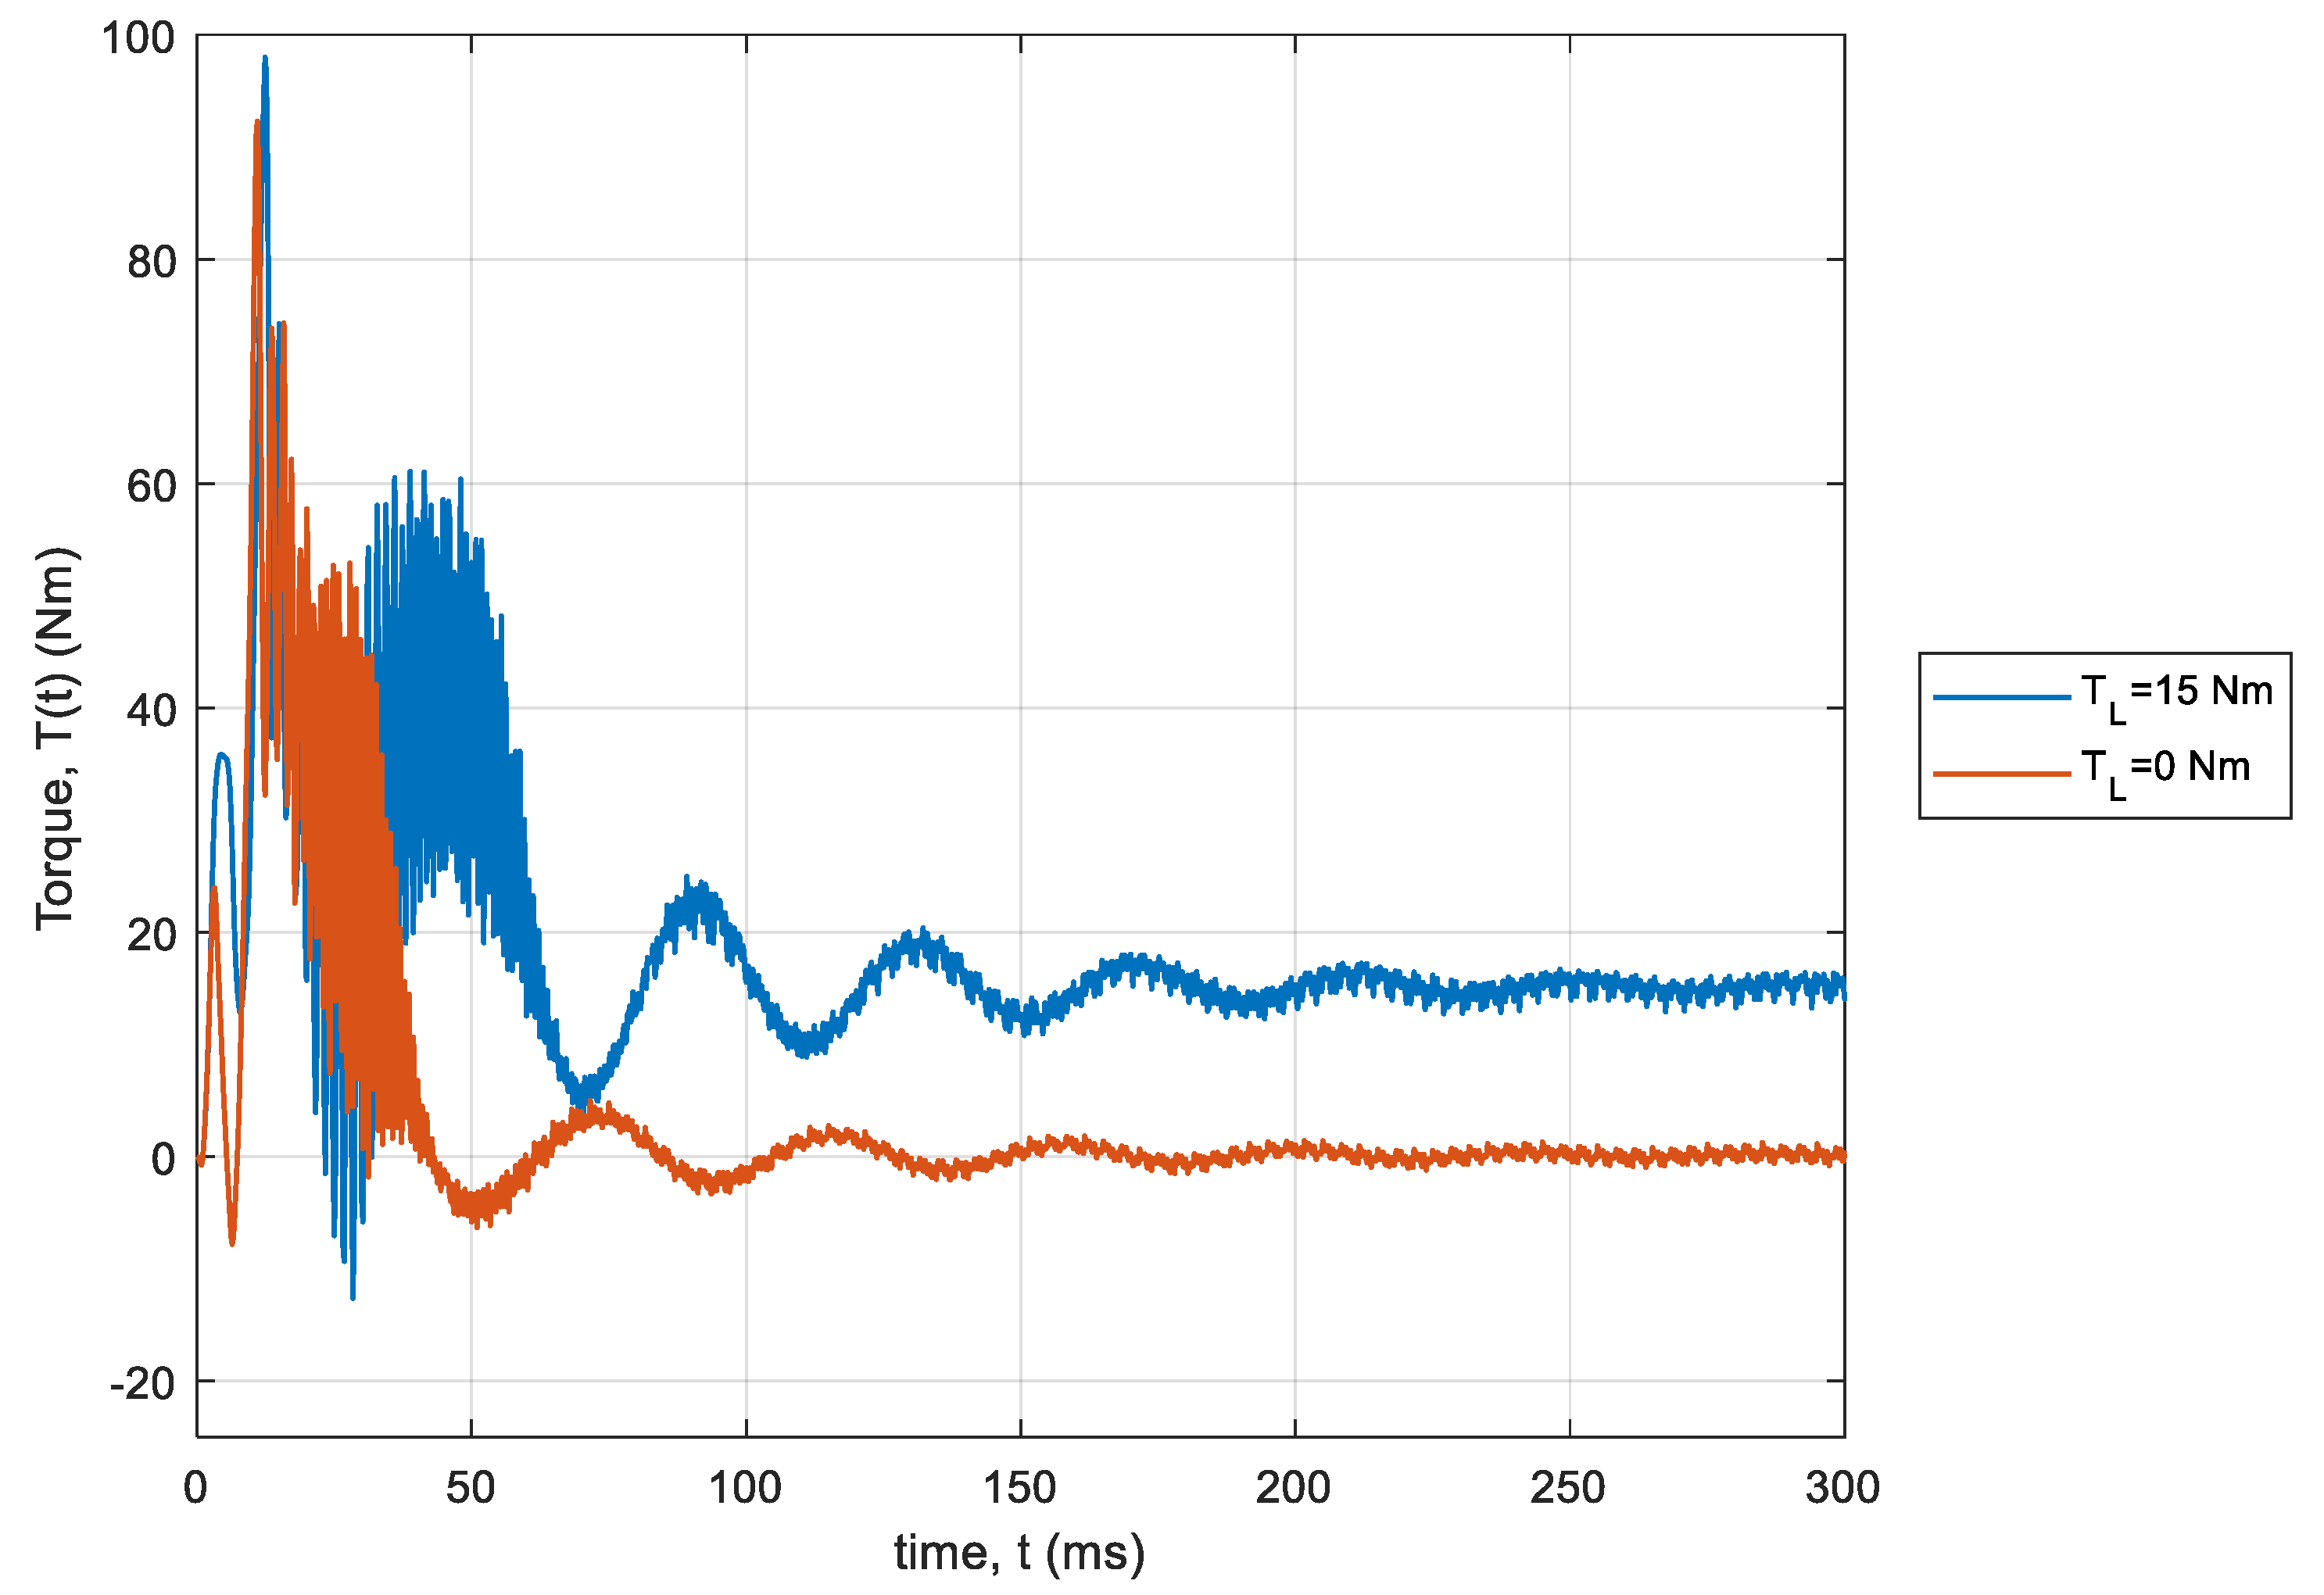
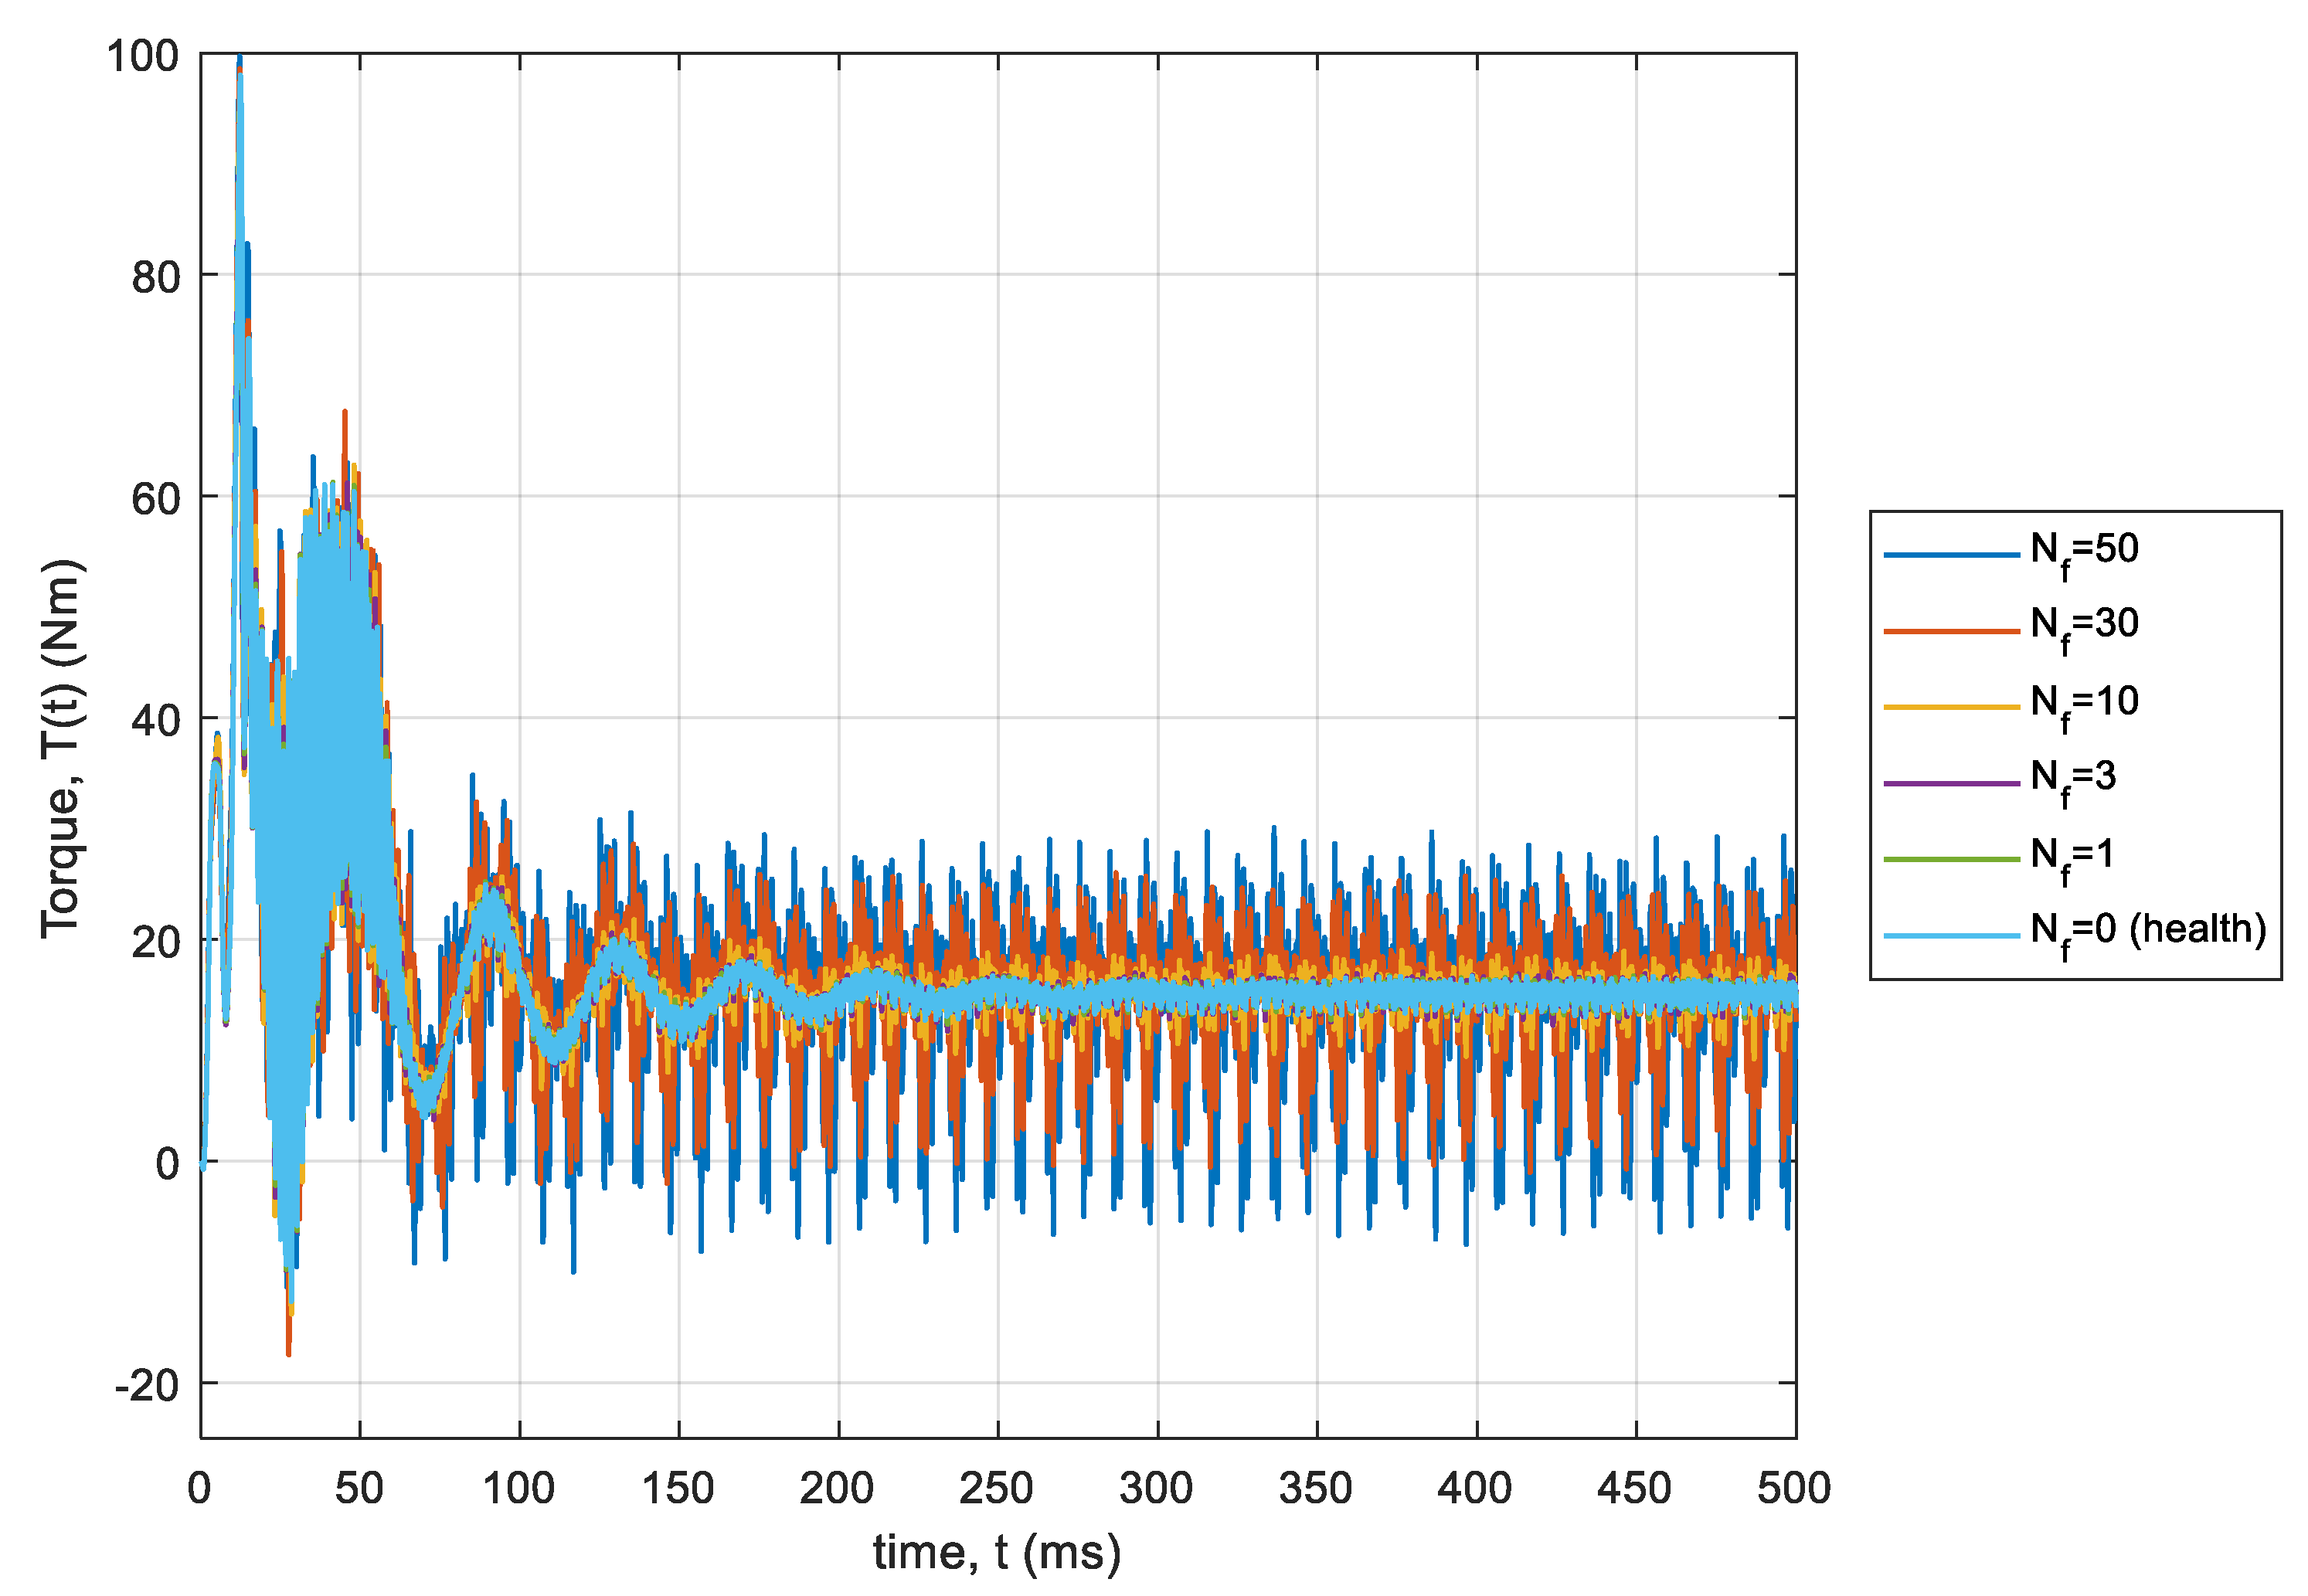
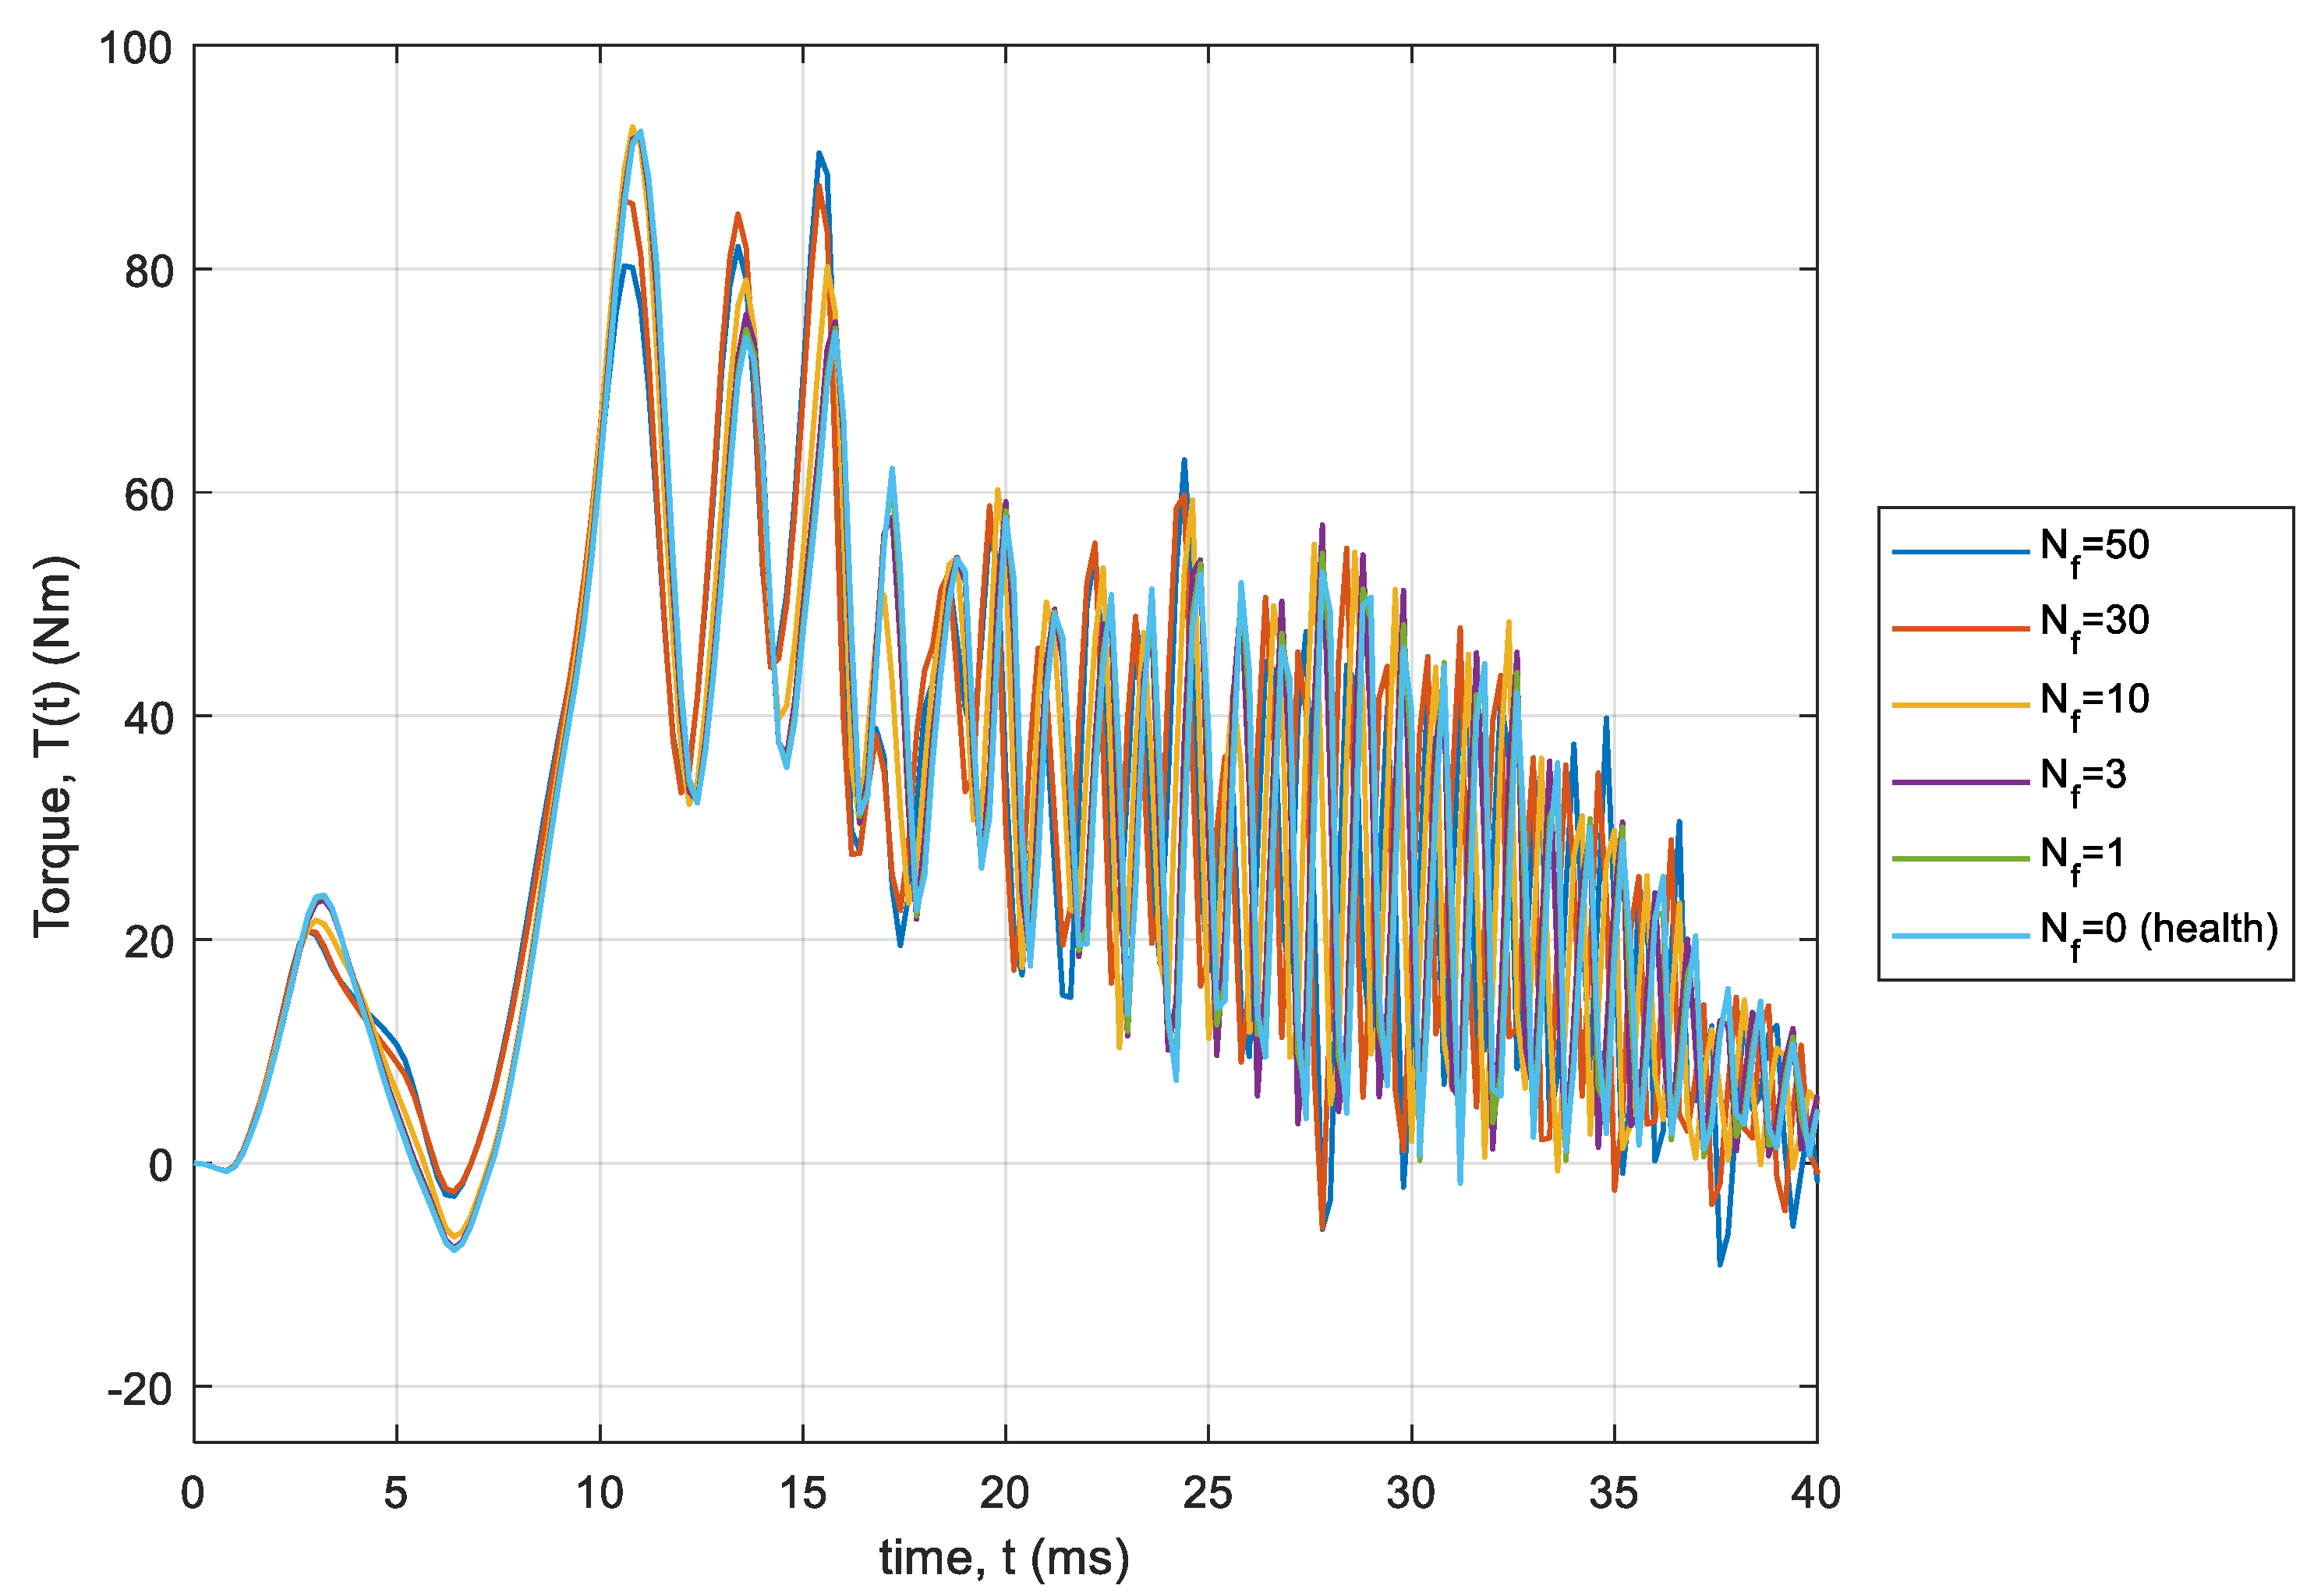
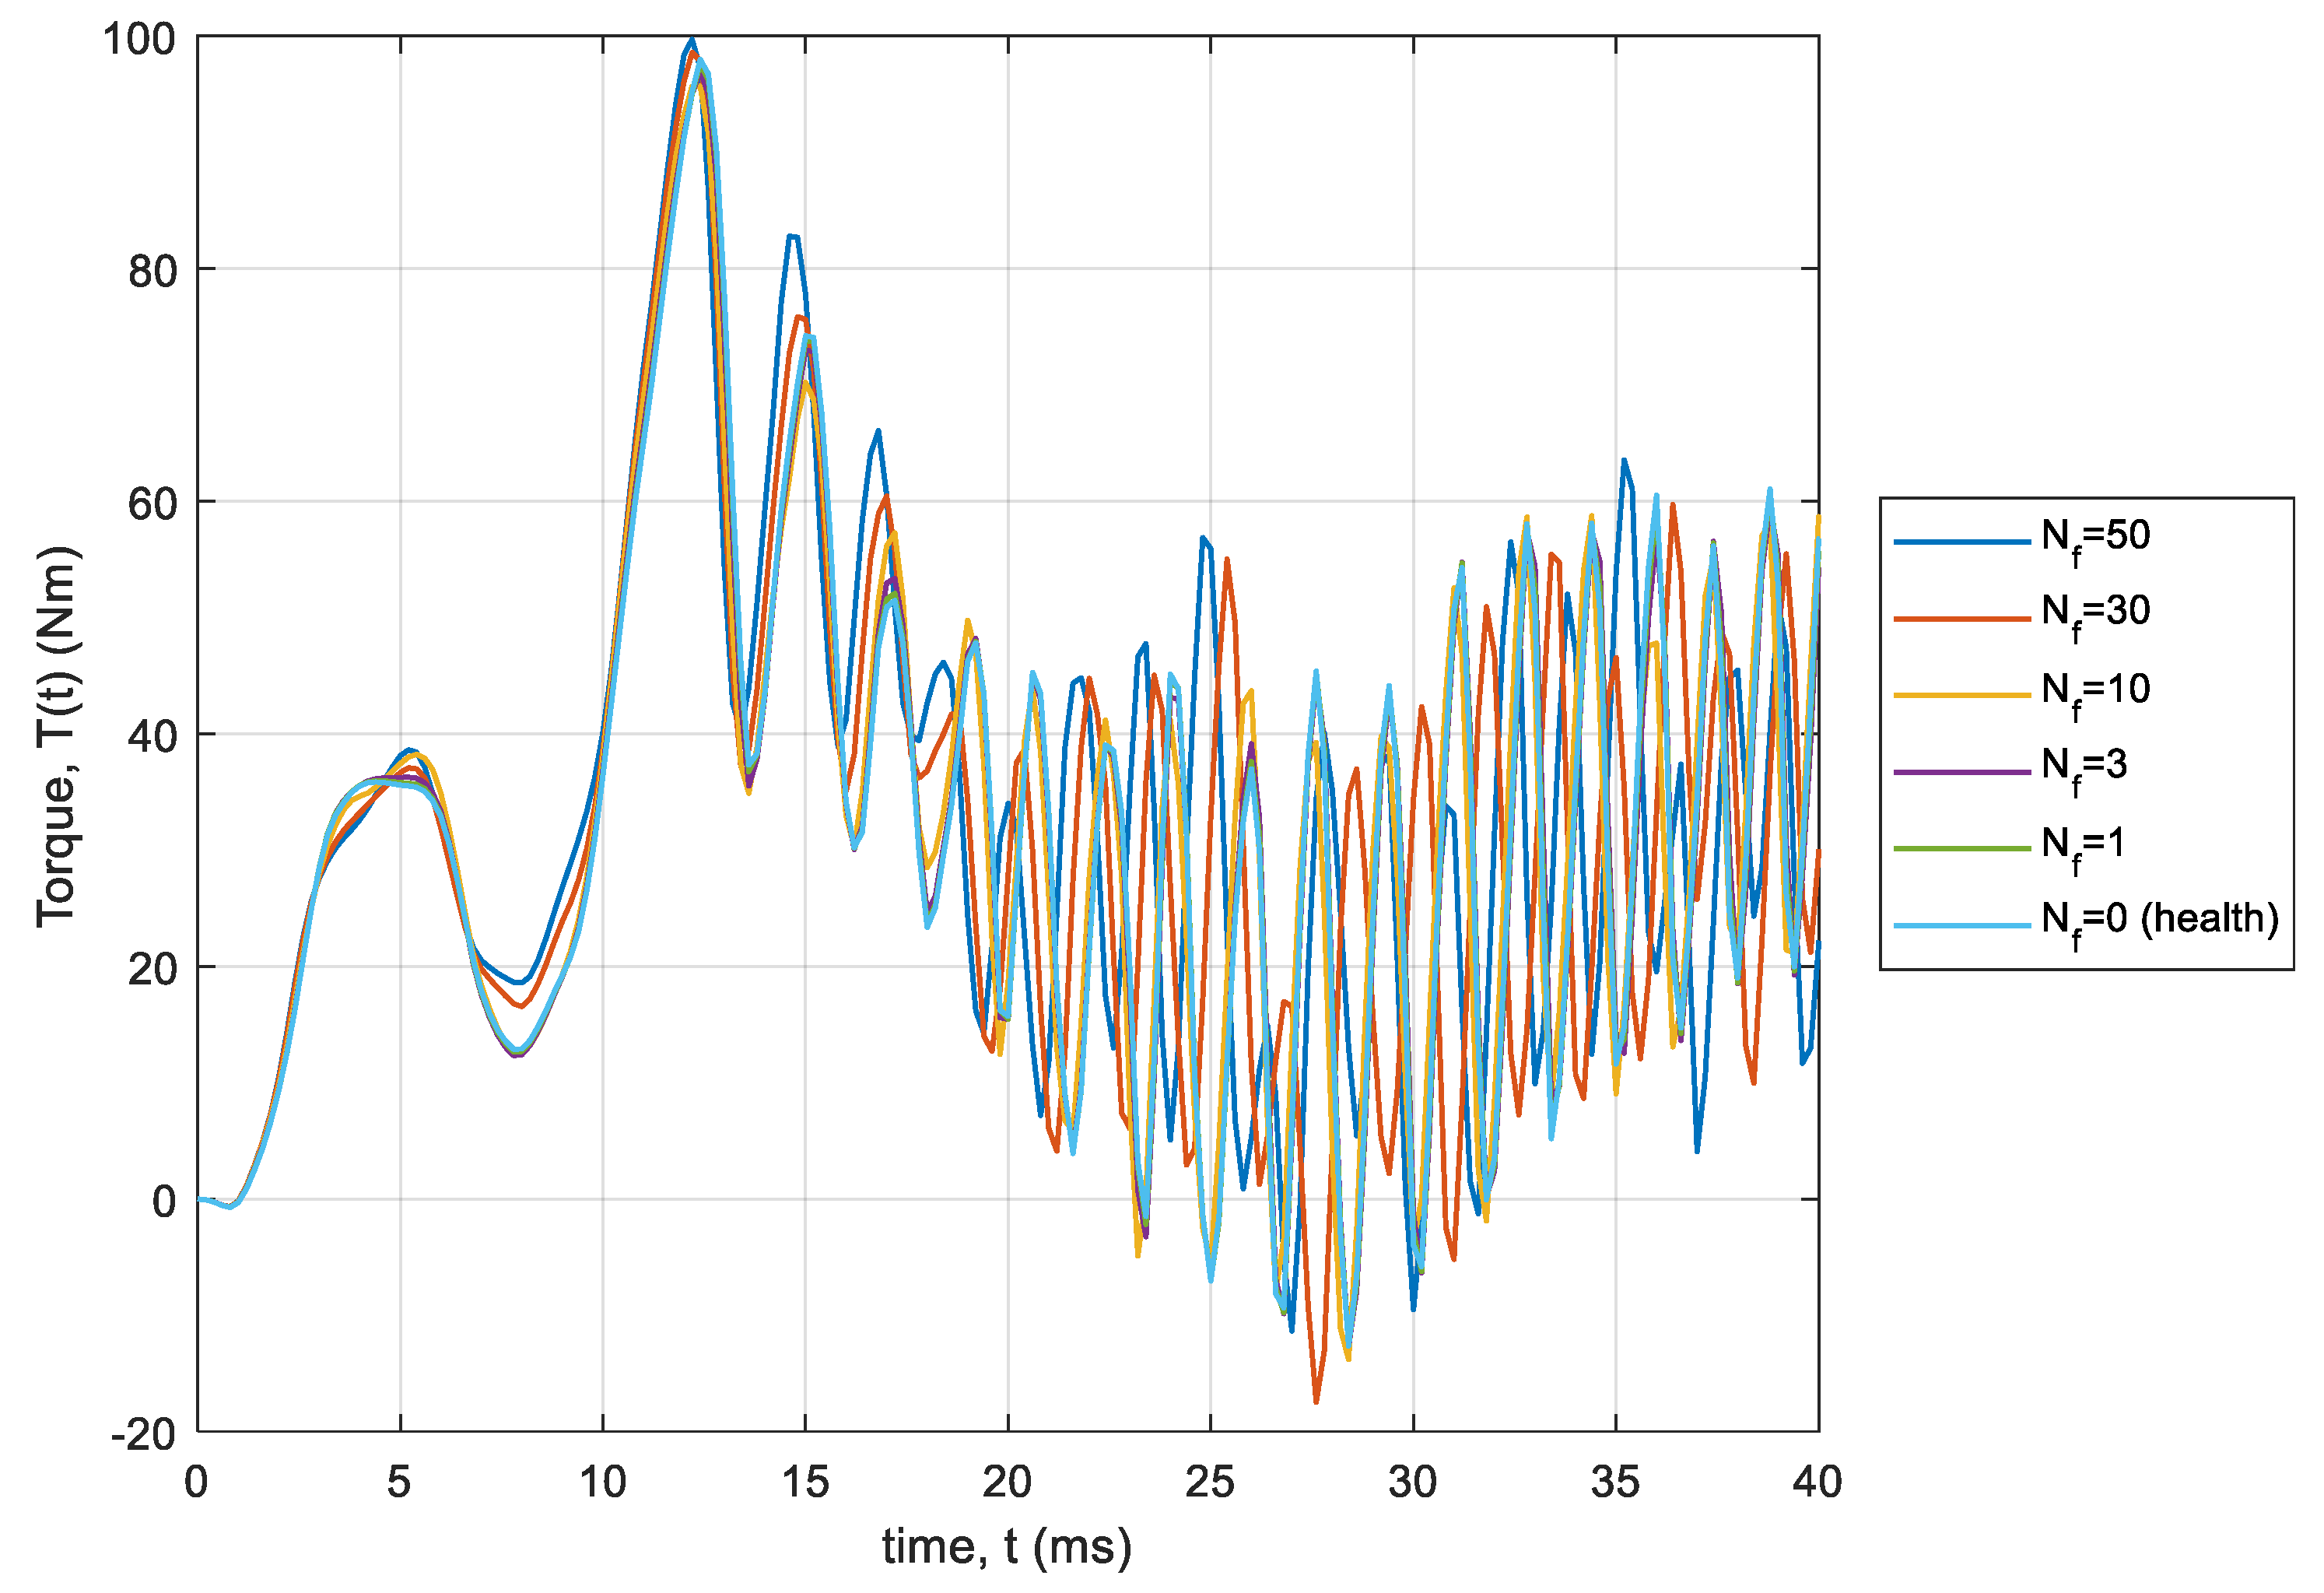
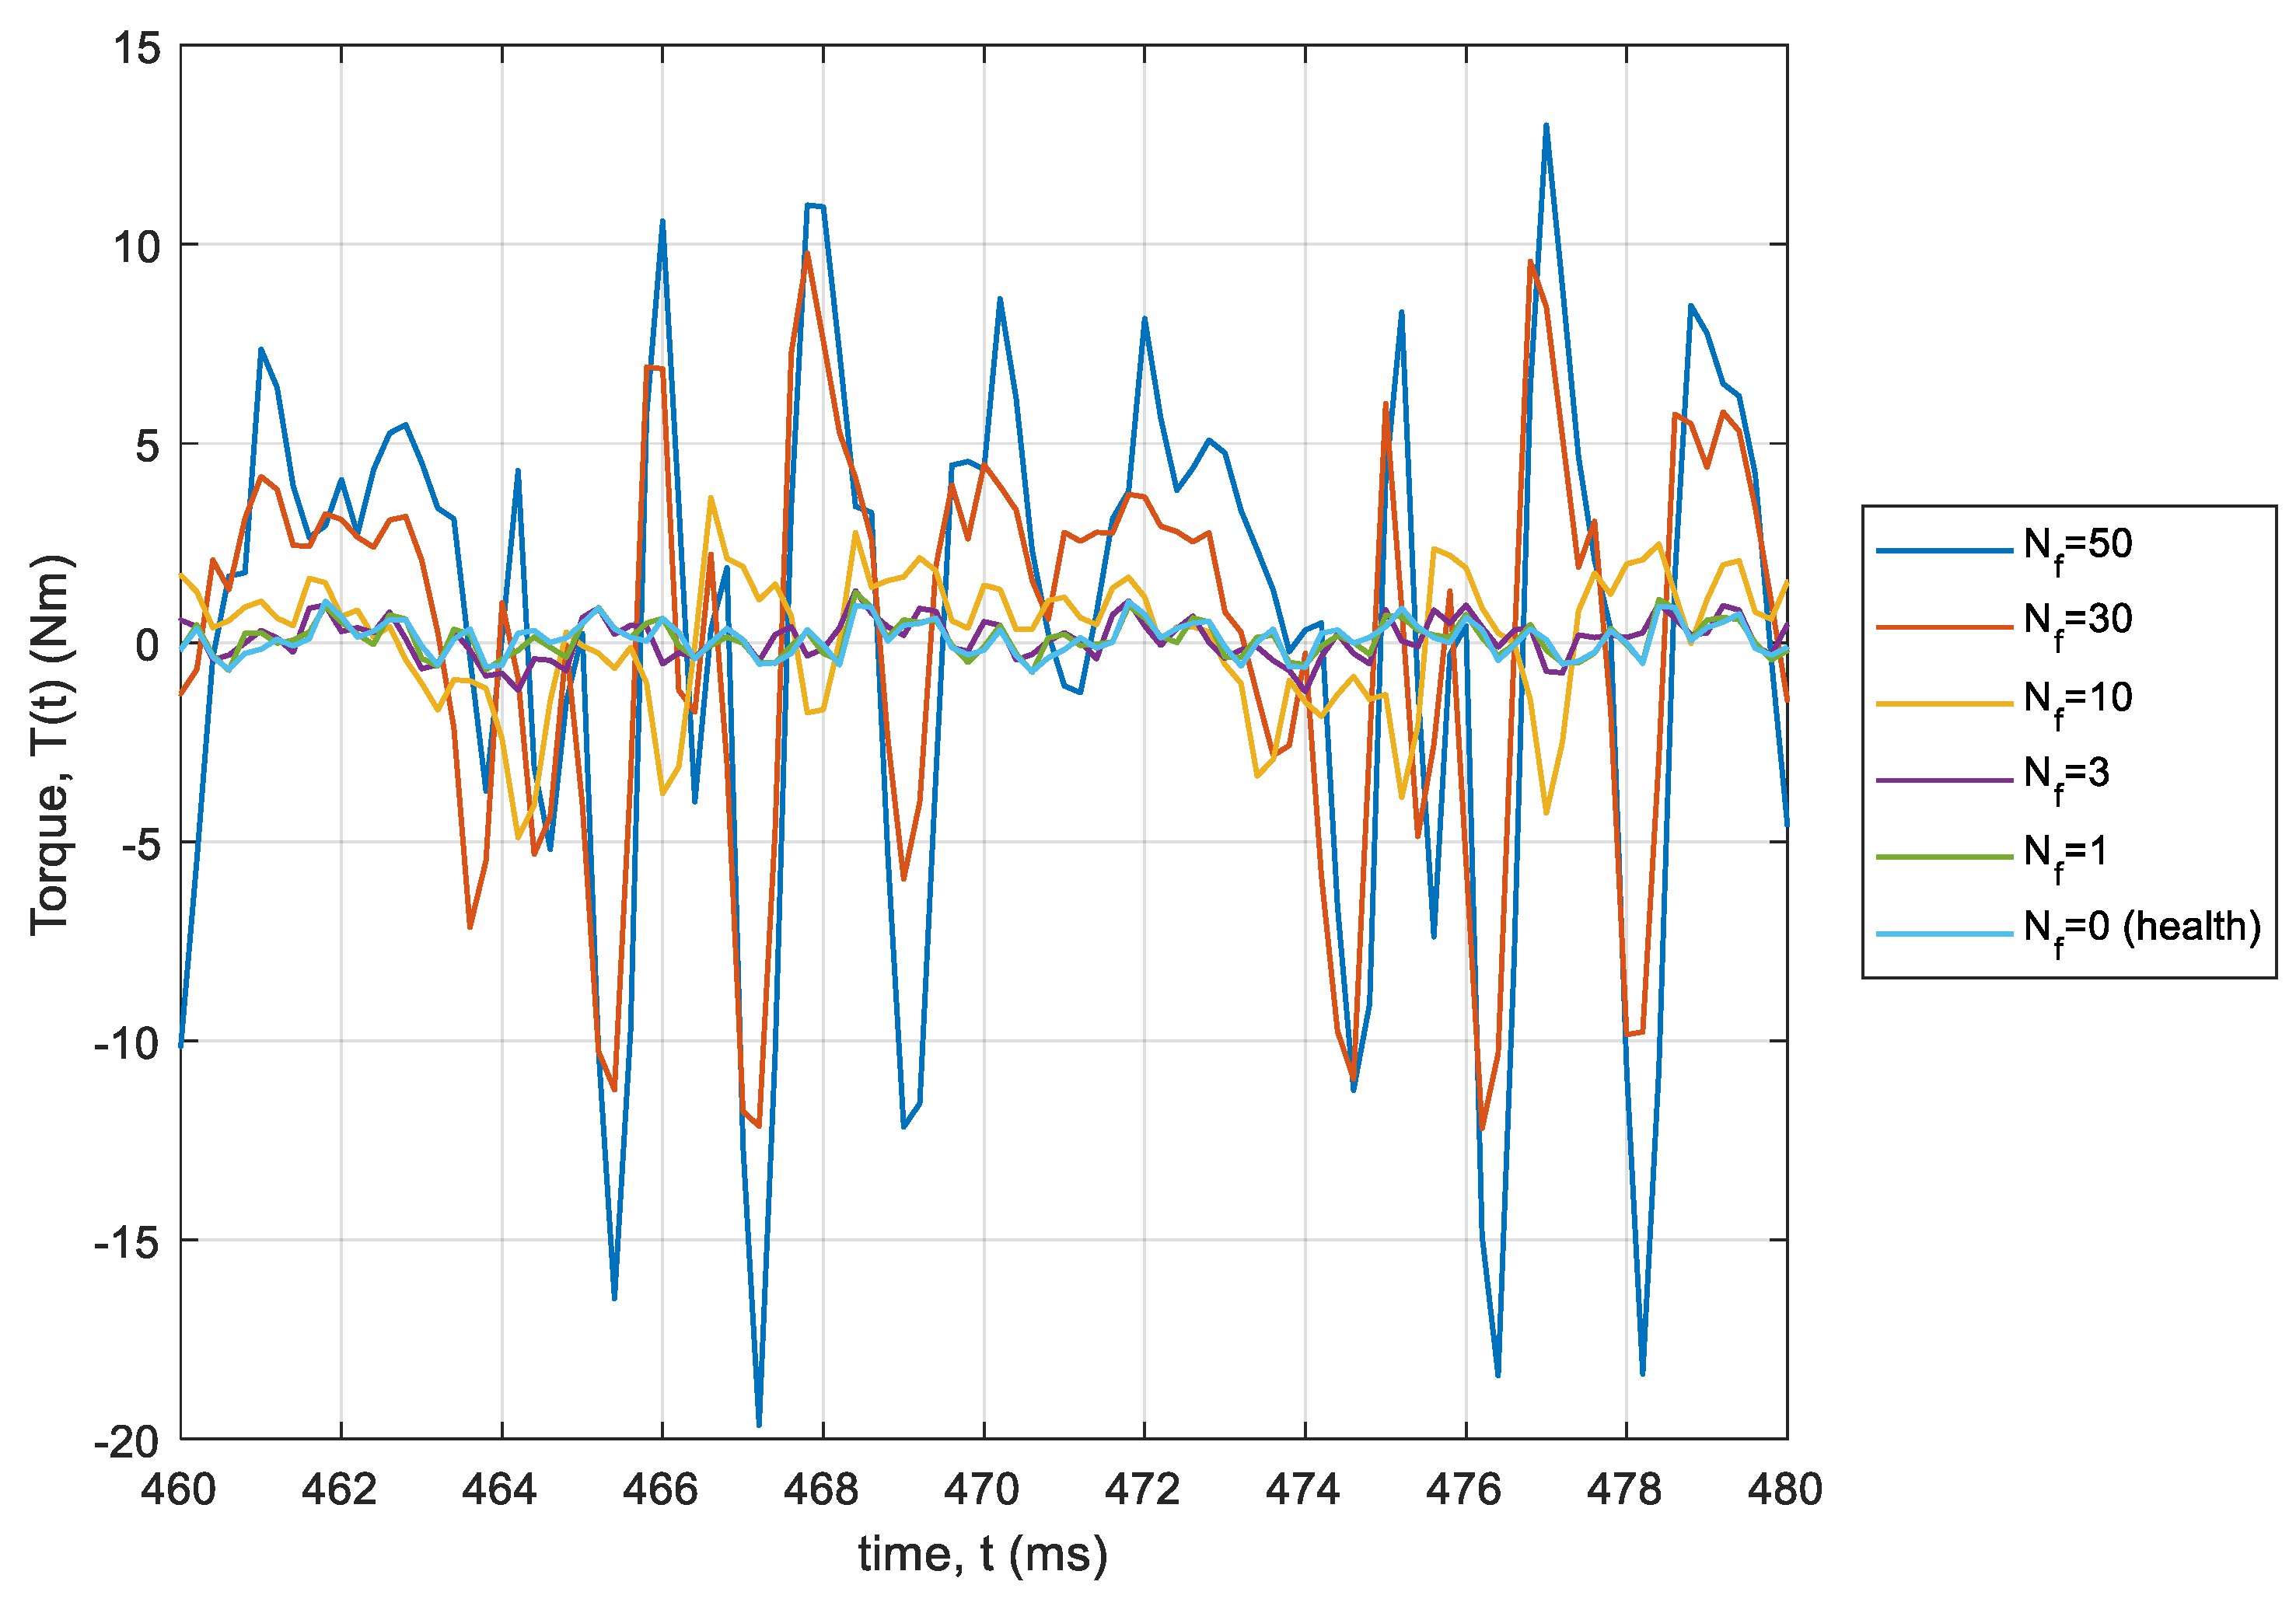
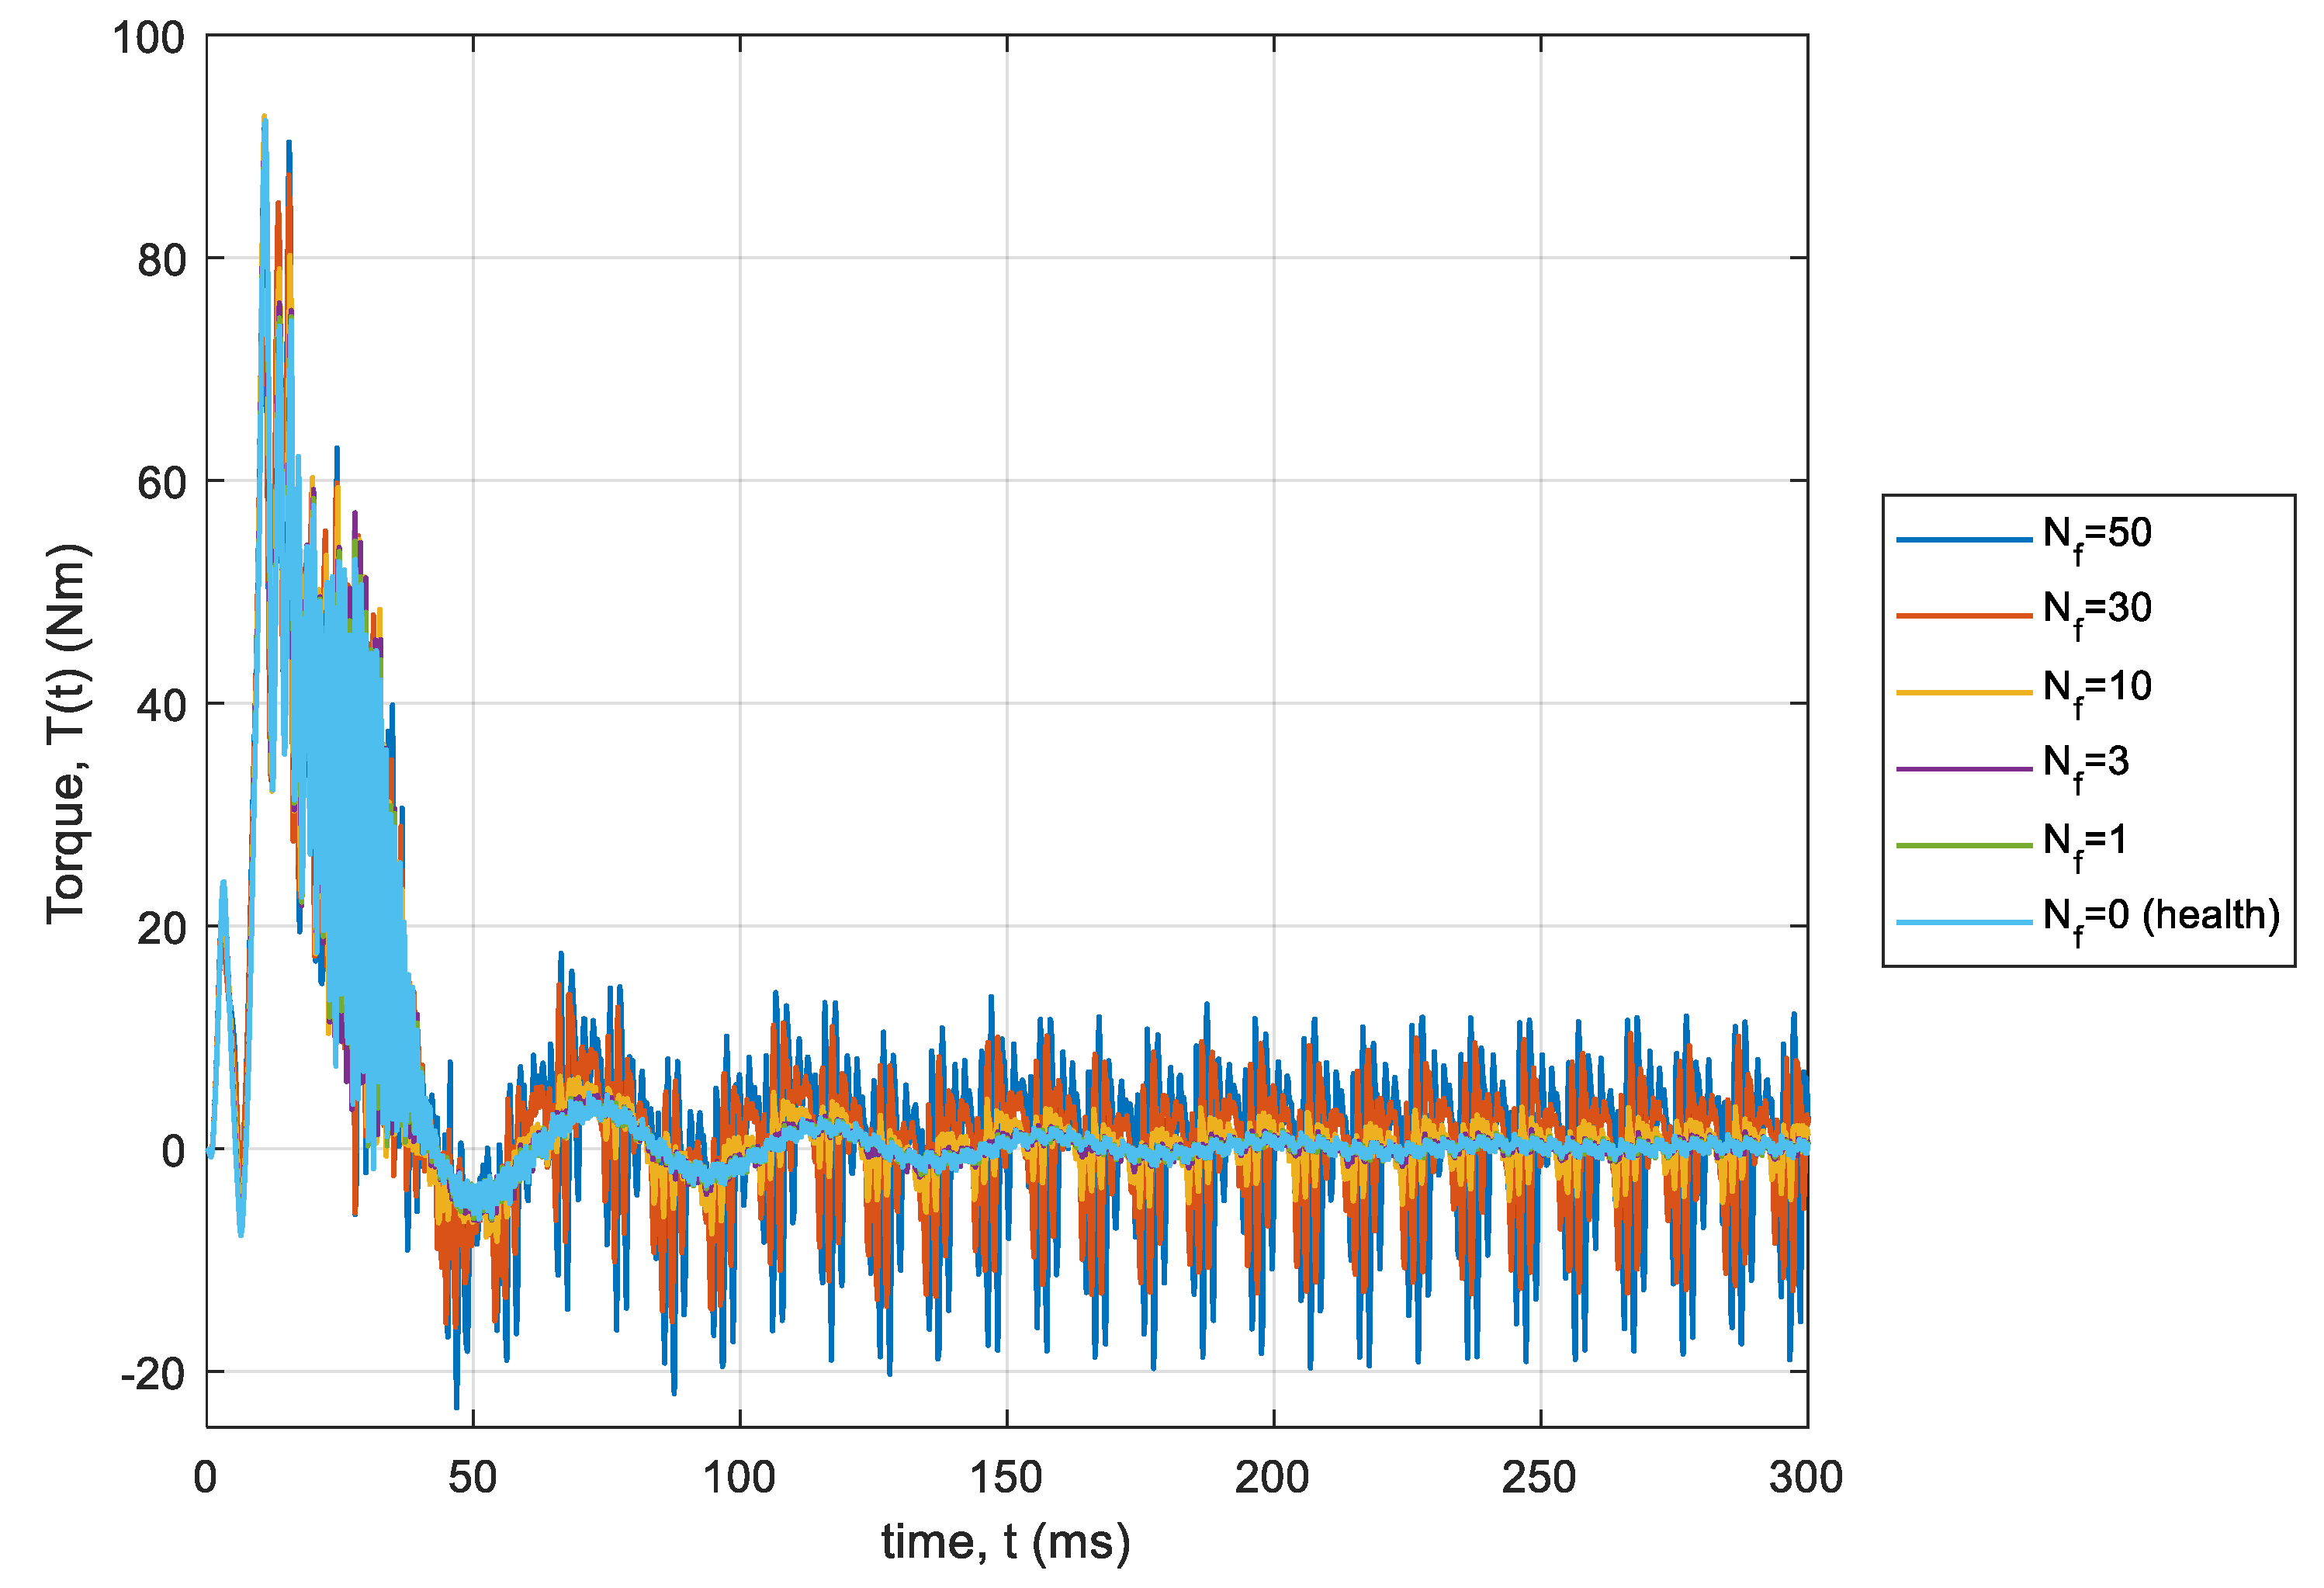
3.2. The Torque Waveforms at Steady State of the Machine

In the first part of the simulation tests, a set of torque waveforms for healthy and unloaded motor was determined and then simulations for a motor loaded at 15 Nm torque were performed. The time step was equal to 0.2 ms, that is, the calculations were made 100 times during one supply voltage period. The waveforms of the obtained torque are shown in Figure 4.
In the second part of the simulation tests, the torque waveforms were calculated for the following number of shorted turns; Nf = {1, 2, 3, 10, 20, 30, 40, 50, 55} in phase A of stator winding, again at no external load as well as at load torque equal to 15 Nm. In the simulations, the motor start-up process was considered. Figure 5 and Figure 6 show the obtained torque waveforms from the time of switching on the supply voltage to the time of reaching the electromechanically steady state. It has been assumed that this state is reached after 500 ms from the moment of switching on the voltage. The waveforms as well as peak values of the electromagnetic torque during the first period of start-up process, i.e., from 0 to 40 ms, at no-load and rated load conditions are shown in Figure 7 and Figure 8, and Table 3, respectively. Additionally, the torque waveforms in a steady state, i.e., 460–580 ms, are presented in Figure 9 and Figure 10.
One of the most important factors for drive systems in case of a machine failure is the peak value of the machine torque waveform. The simulations show that the peak value of the torque waveforms for the motor without external load is 92.689 Nm and occurs in case when the motor has 10 shorted turns in stator winding. This value is 100.41% of the peak torque value for a healthy motor. It can be concluded that the influence of the shorted turns during the start of machine without external torque can be neglected.
The highest peak value of torque waveforms for a motor loaded with nominal load torque was observed at 50 shorted turns and amounts to 99.702, which is 101.76% of the torque value for the motor without failure. In conclusion it can be stated that the influence of the shorted turns during the start of the machine at rated torque can be omitted, because the peak value of torque has slightly increased in the relation to healthy machine.

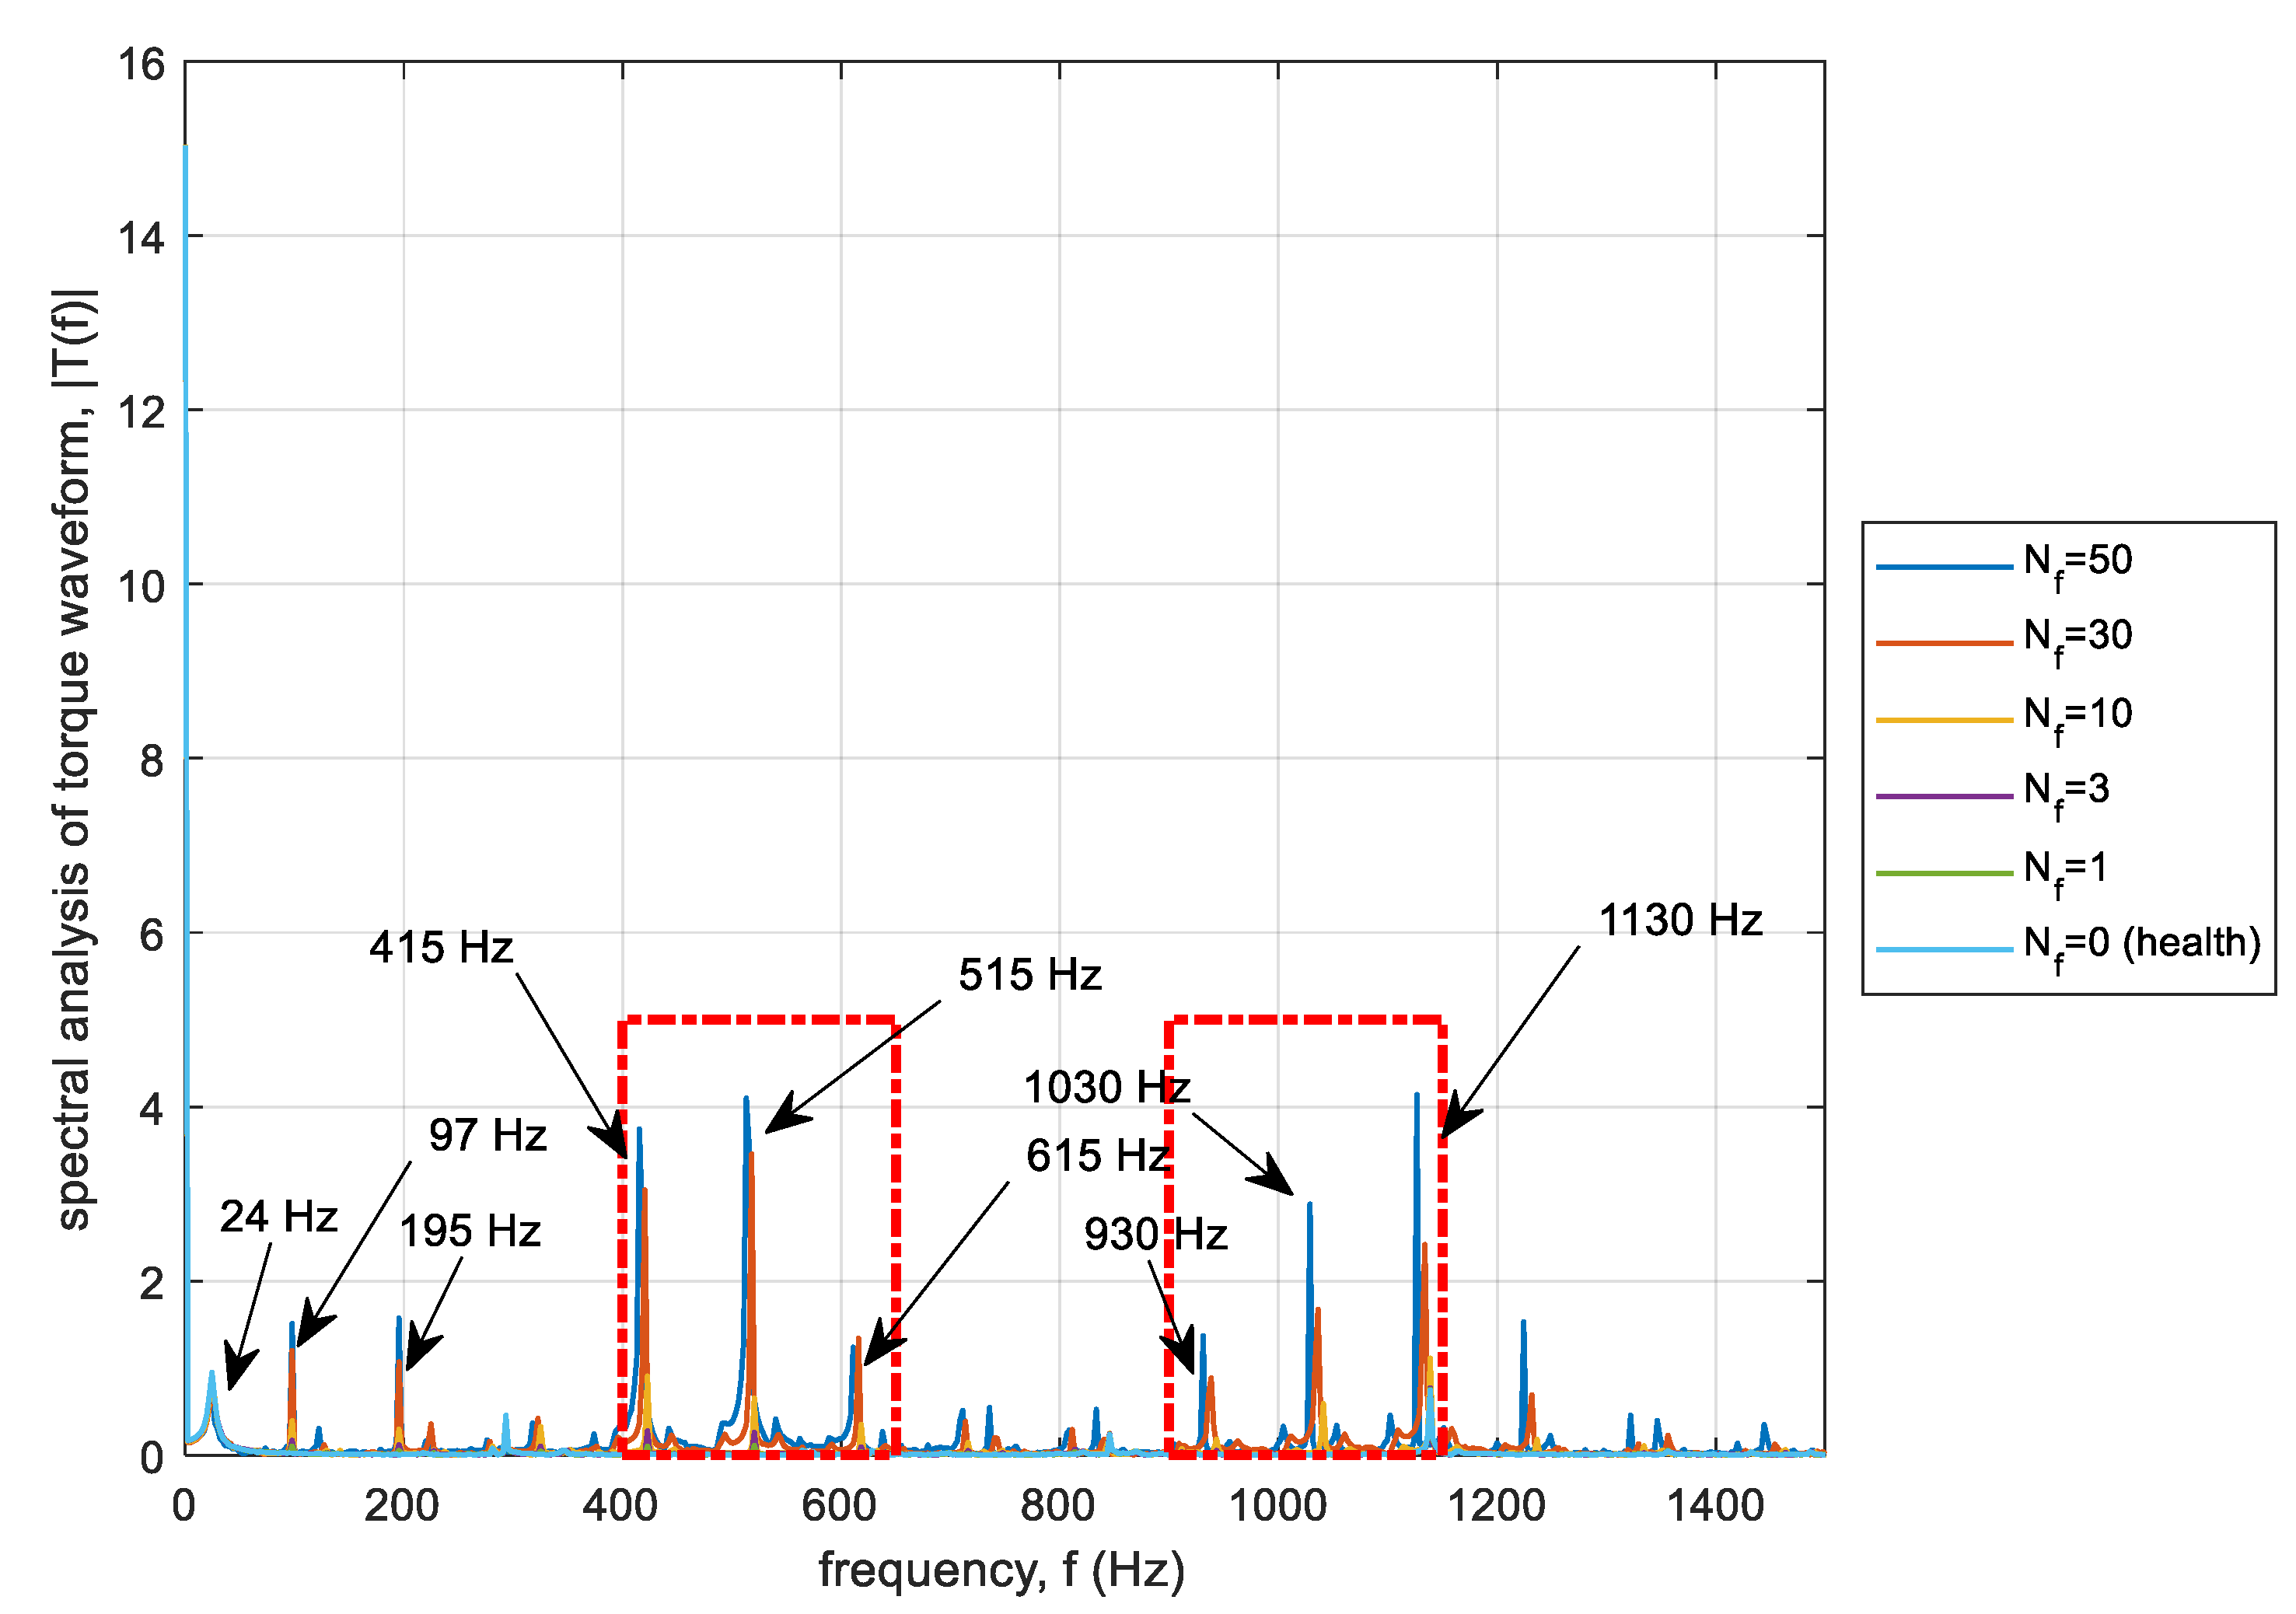
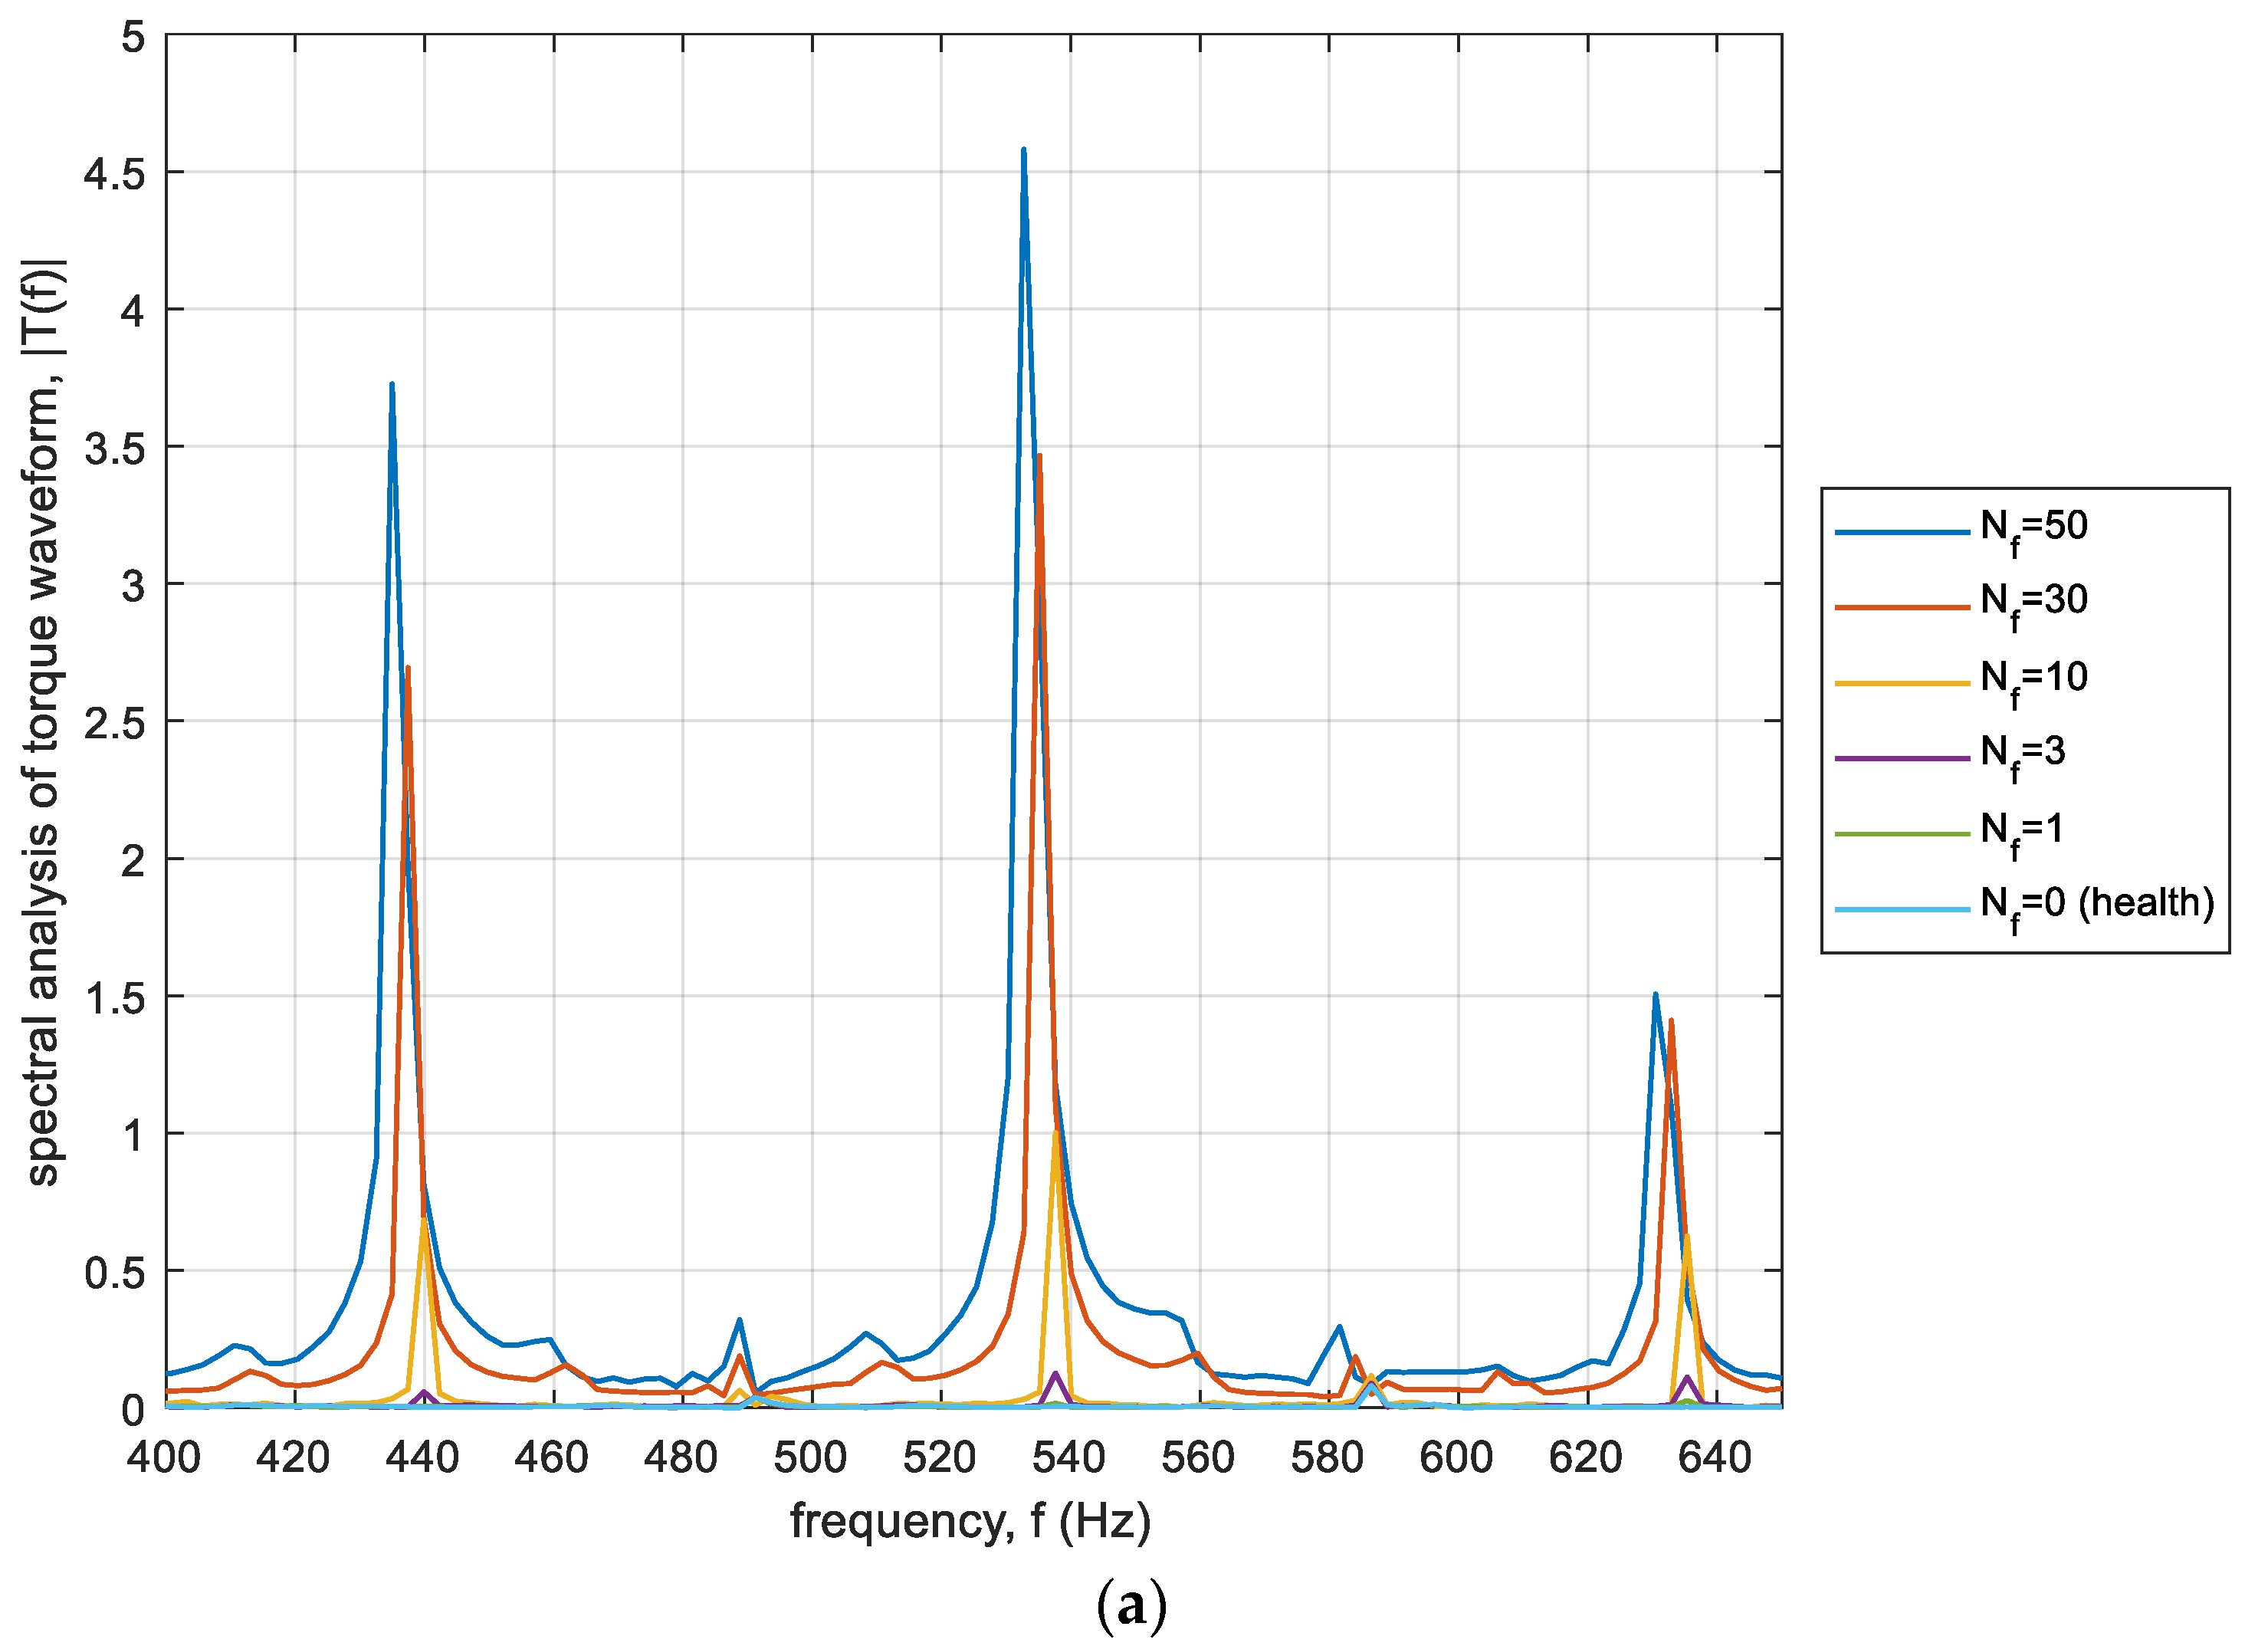
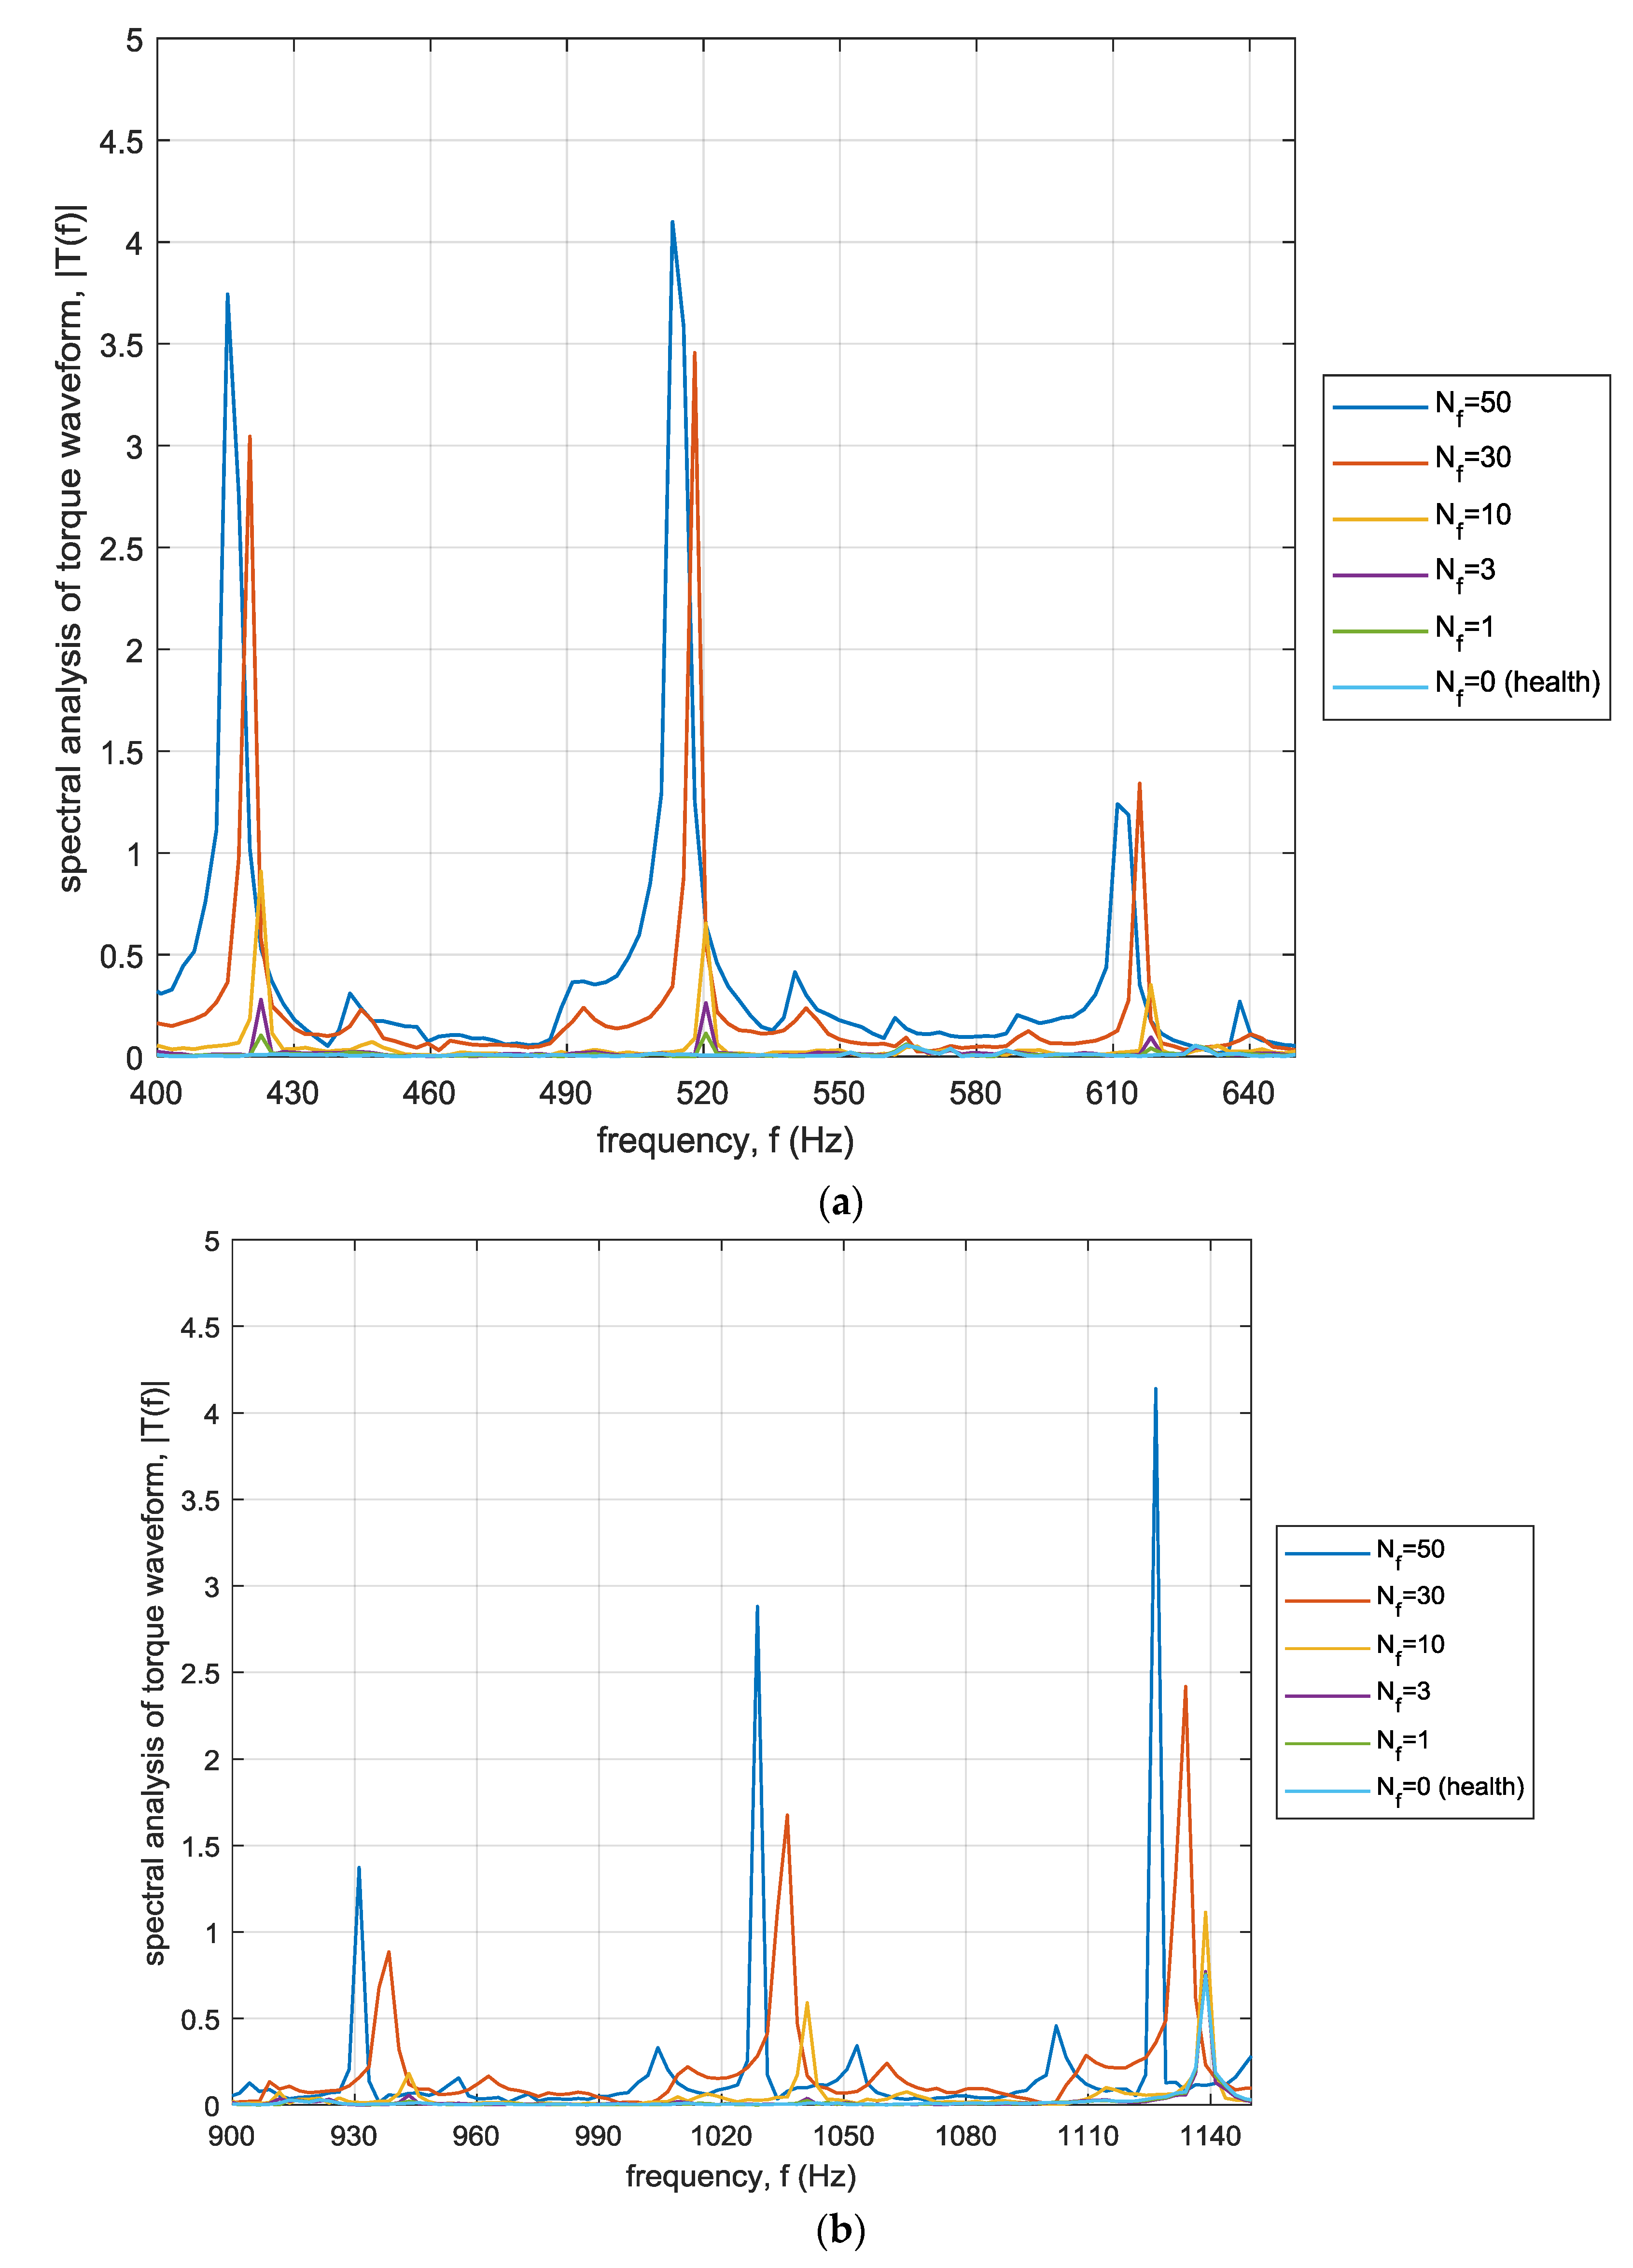
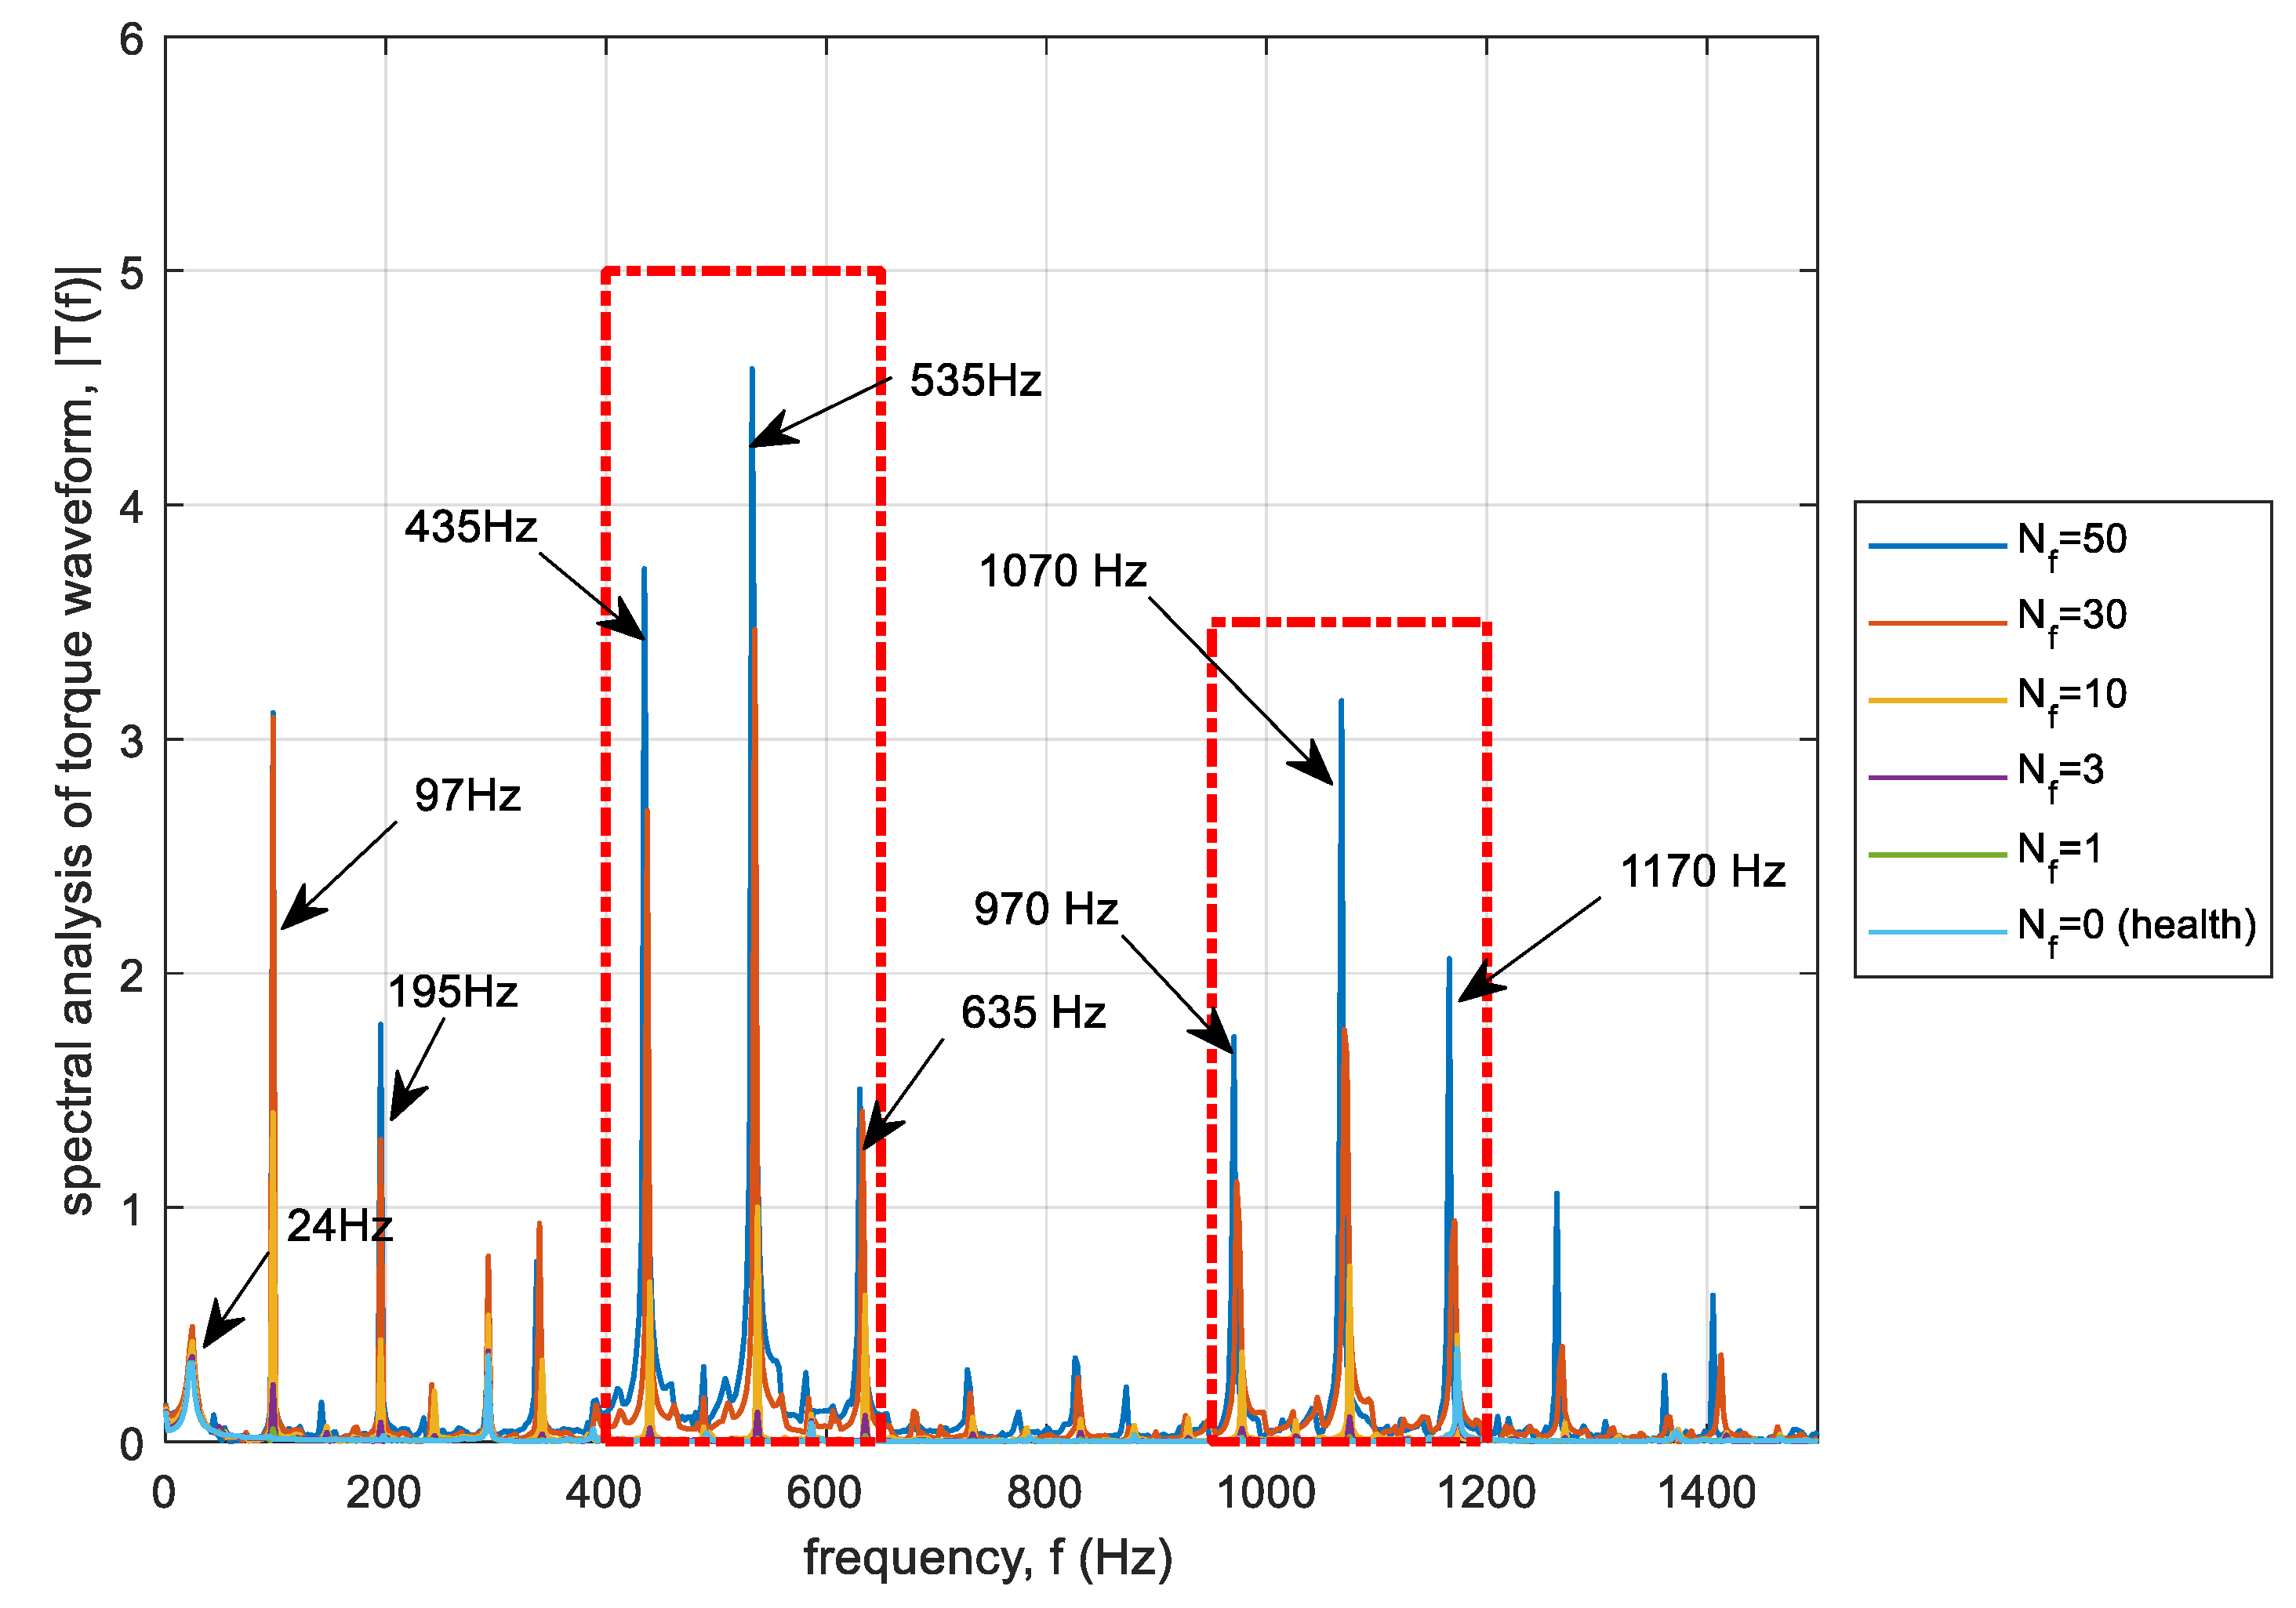
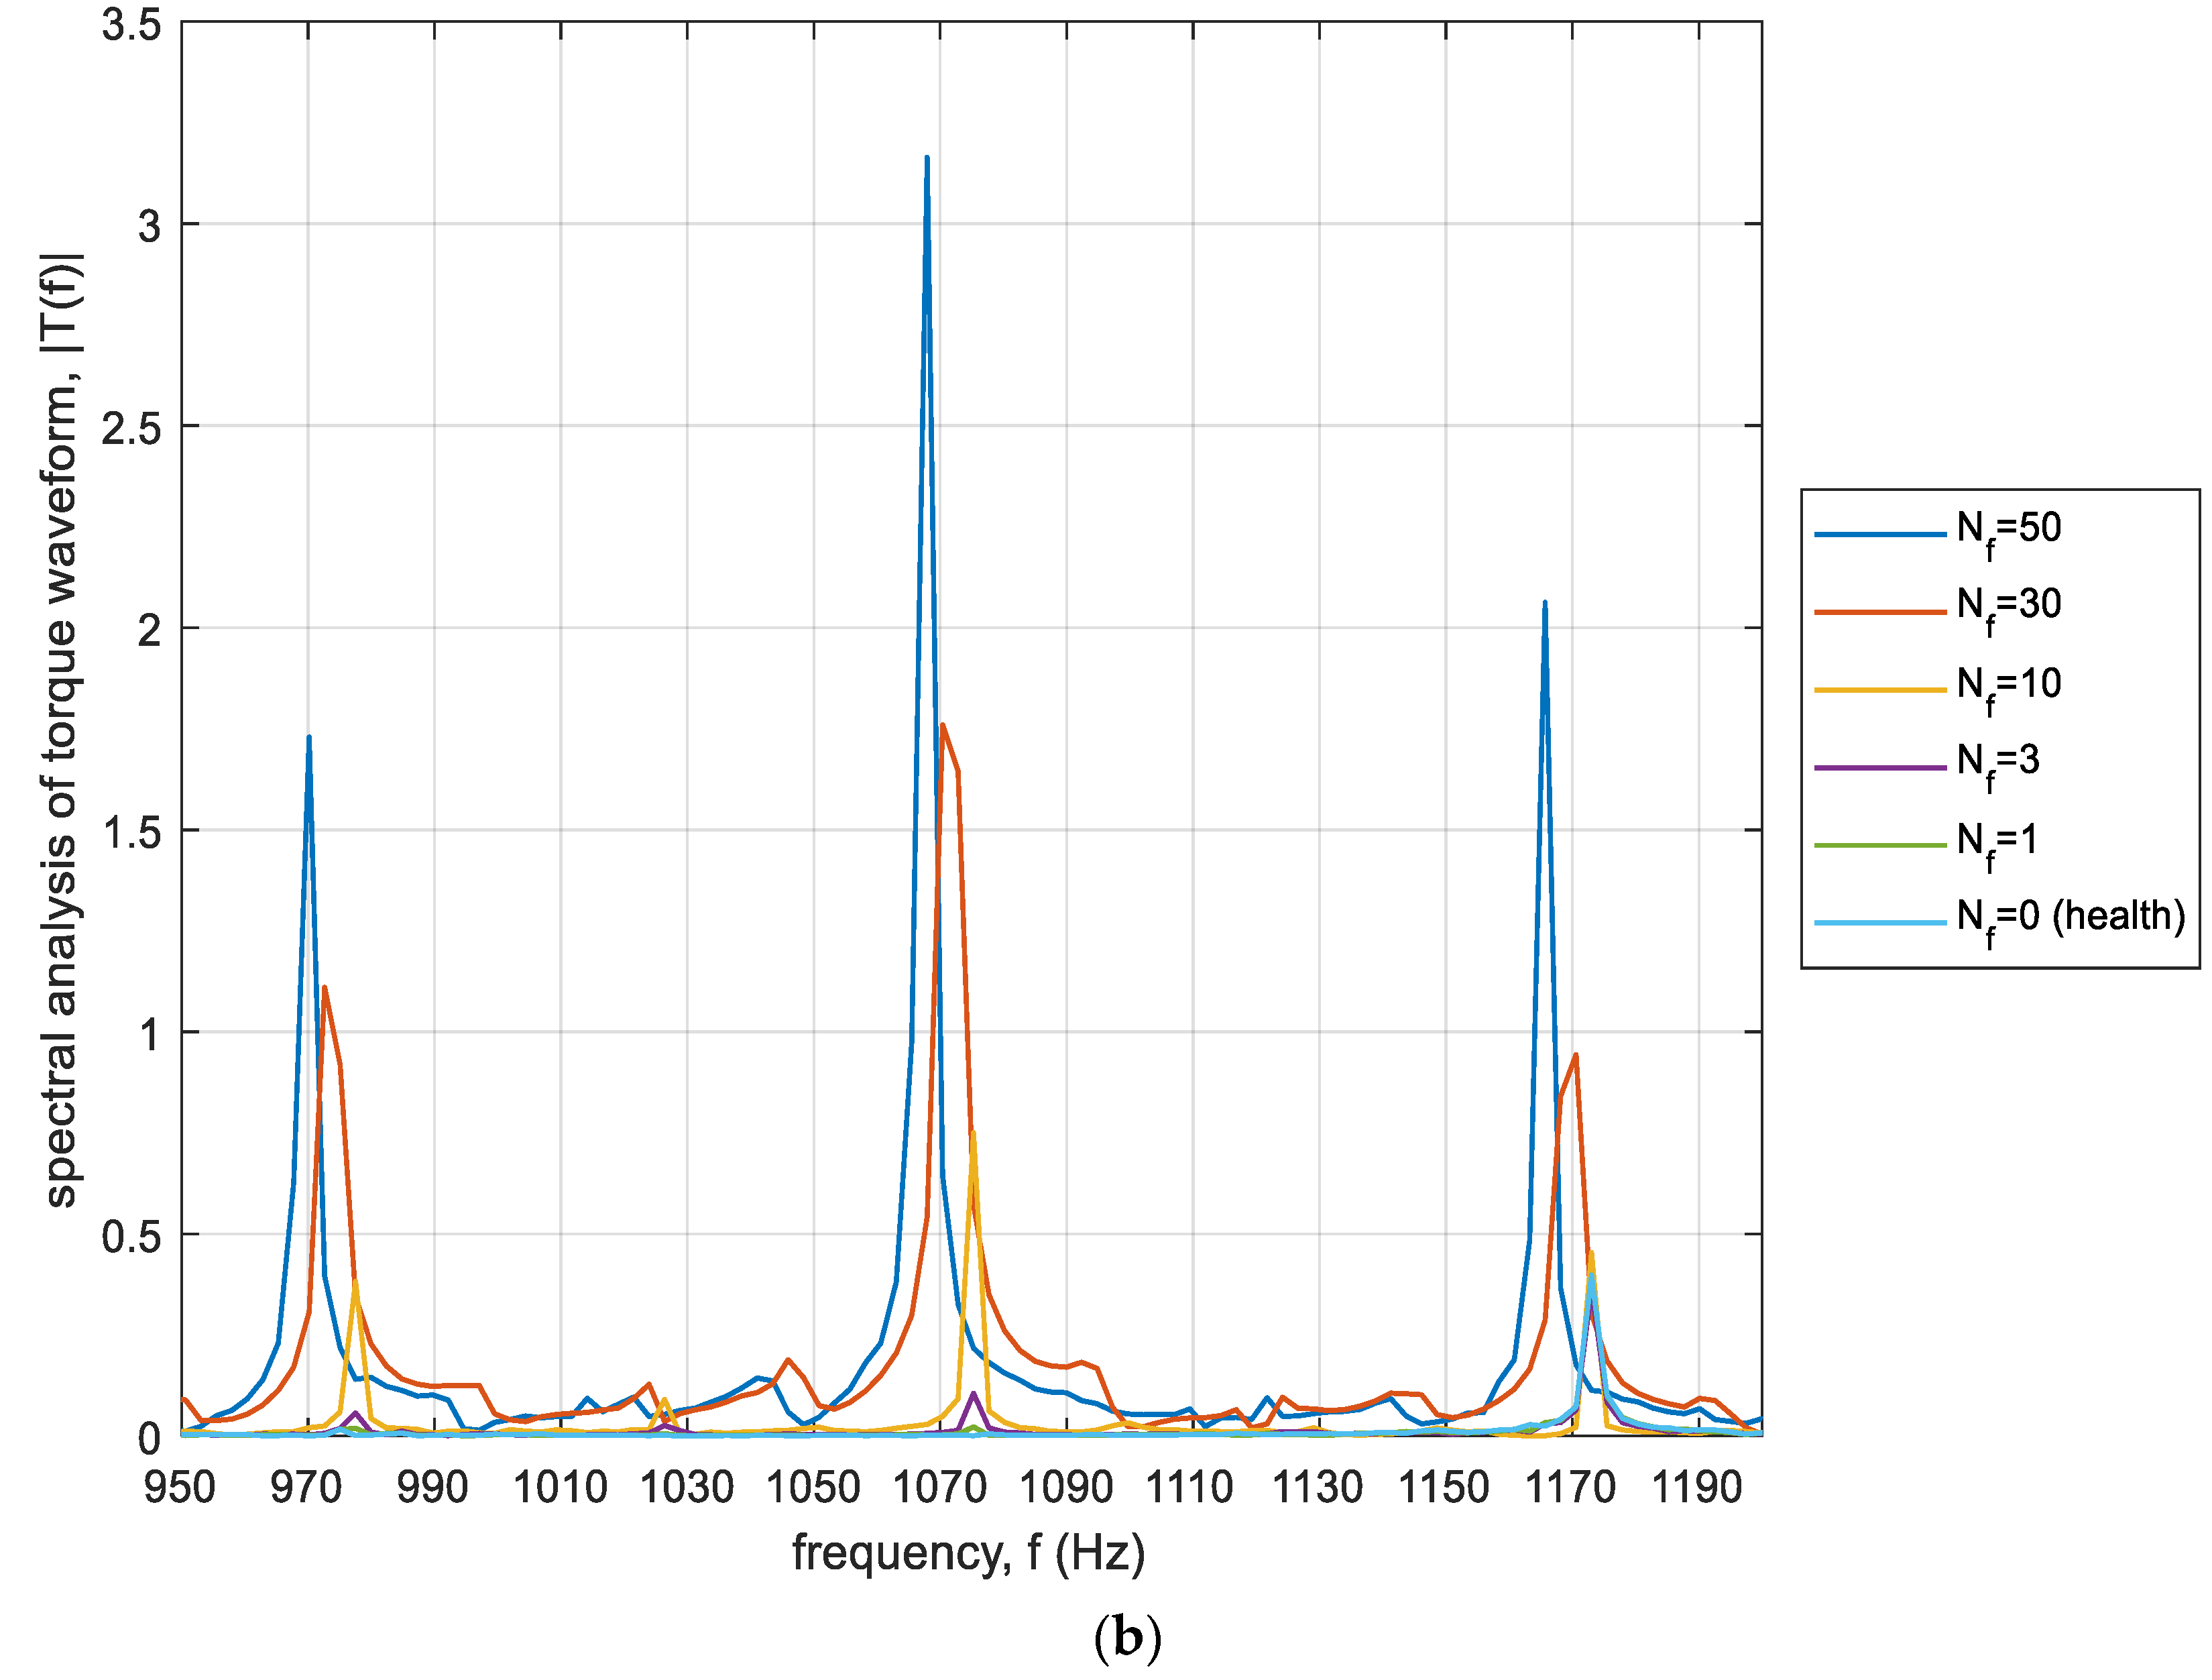
3.3. Torque Analysis—Signal Spectrum

During the analysis of stationary torque waveforms of the machine, spectral analysis using Fourier transform was used. The results of analysis at no external load as well as at load torque equal to 15 Nm are shown in Figure 11 and Figure 12, respectively. Two ranges of a spectrum limited by a dash-dot line marked in Figure 11 and Figure 12 were magnified. The spectral analysis limited in frequency is shown in Figure 13 and Figure 14.
It can be noticed that the inter-turn short-circuit in the stator winding generates the additional harmonics of the electromagnetic torque of IM. For the no-load test (TL = 0 Nm), the following harmonics can be found, f(TL = 0 Nm)={24, 97, 195, 435, 535, 635, 970, 1070, 1170}Hz. In case of rated load torque, the constant value can be observed as well as the following harmonics, f(TL = 15 Nm)={24, 97, 195, 415, 515, 615, 930, 1030, 1130}Hz. Among the set of harmonics, the second and the fourth harmonics of supply voltage can be observed. These harmonics are well known in the diagnostics of electrical machines [15].
Based on the obtained results of spectral analysis, it can be concluded that the occurrence of failure, like inter-turn short-circuit in stator winding, even for a small number of shorted turns has a significant impact on the torque waveforms. There are additional torque oscillations in the waveforms. The significant impact of inter-turn short circuits on the torque ripple allowed the determination of the coefficient describing the relationship between the level of torque ripple and the level of failure.

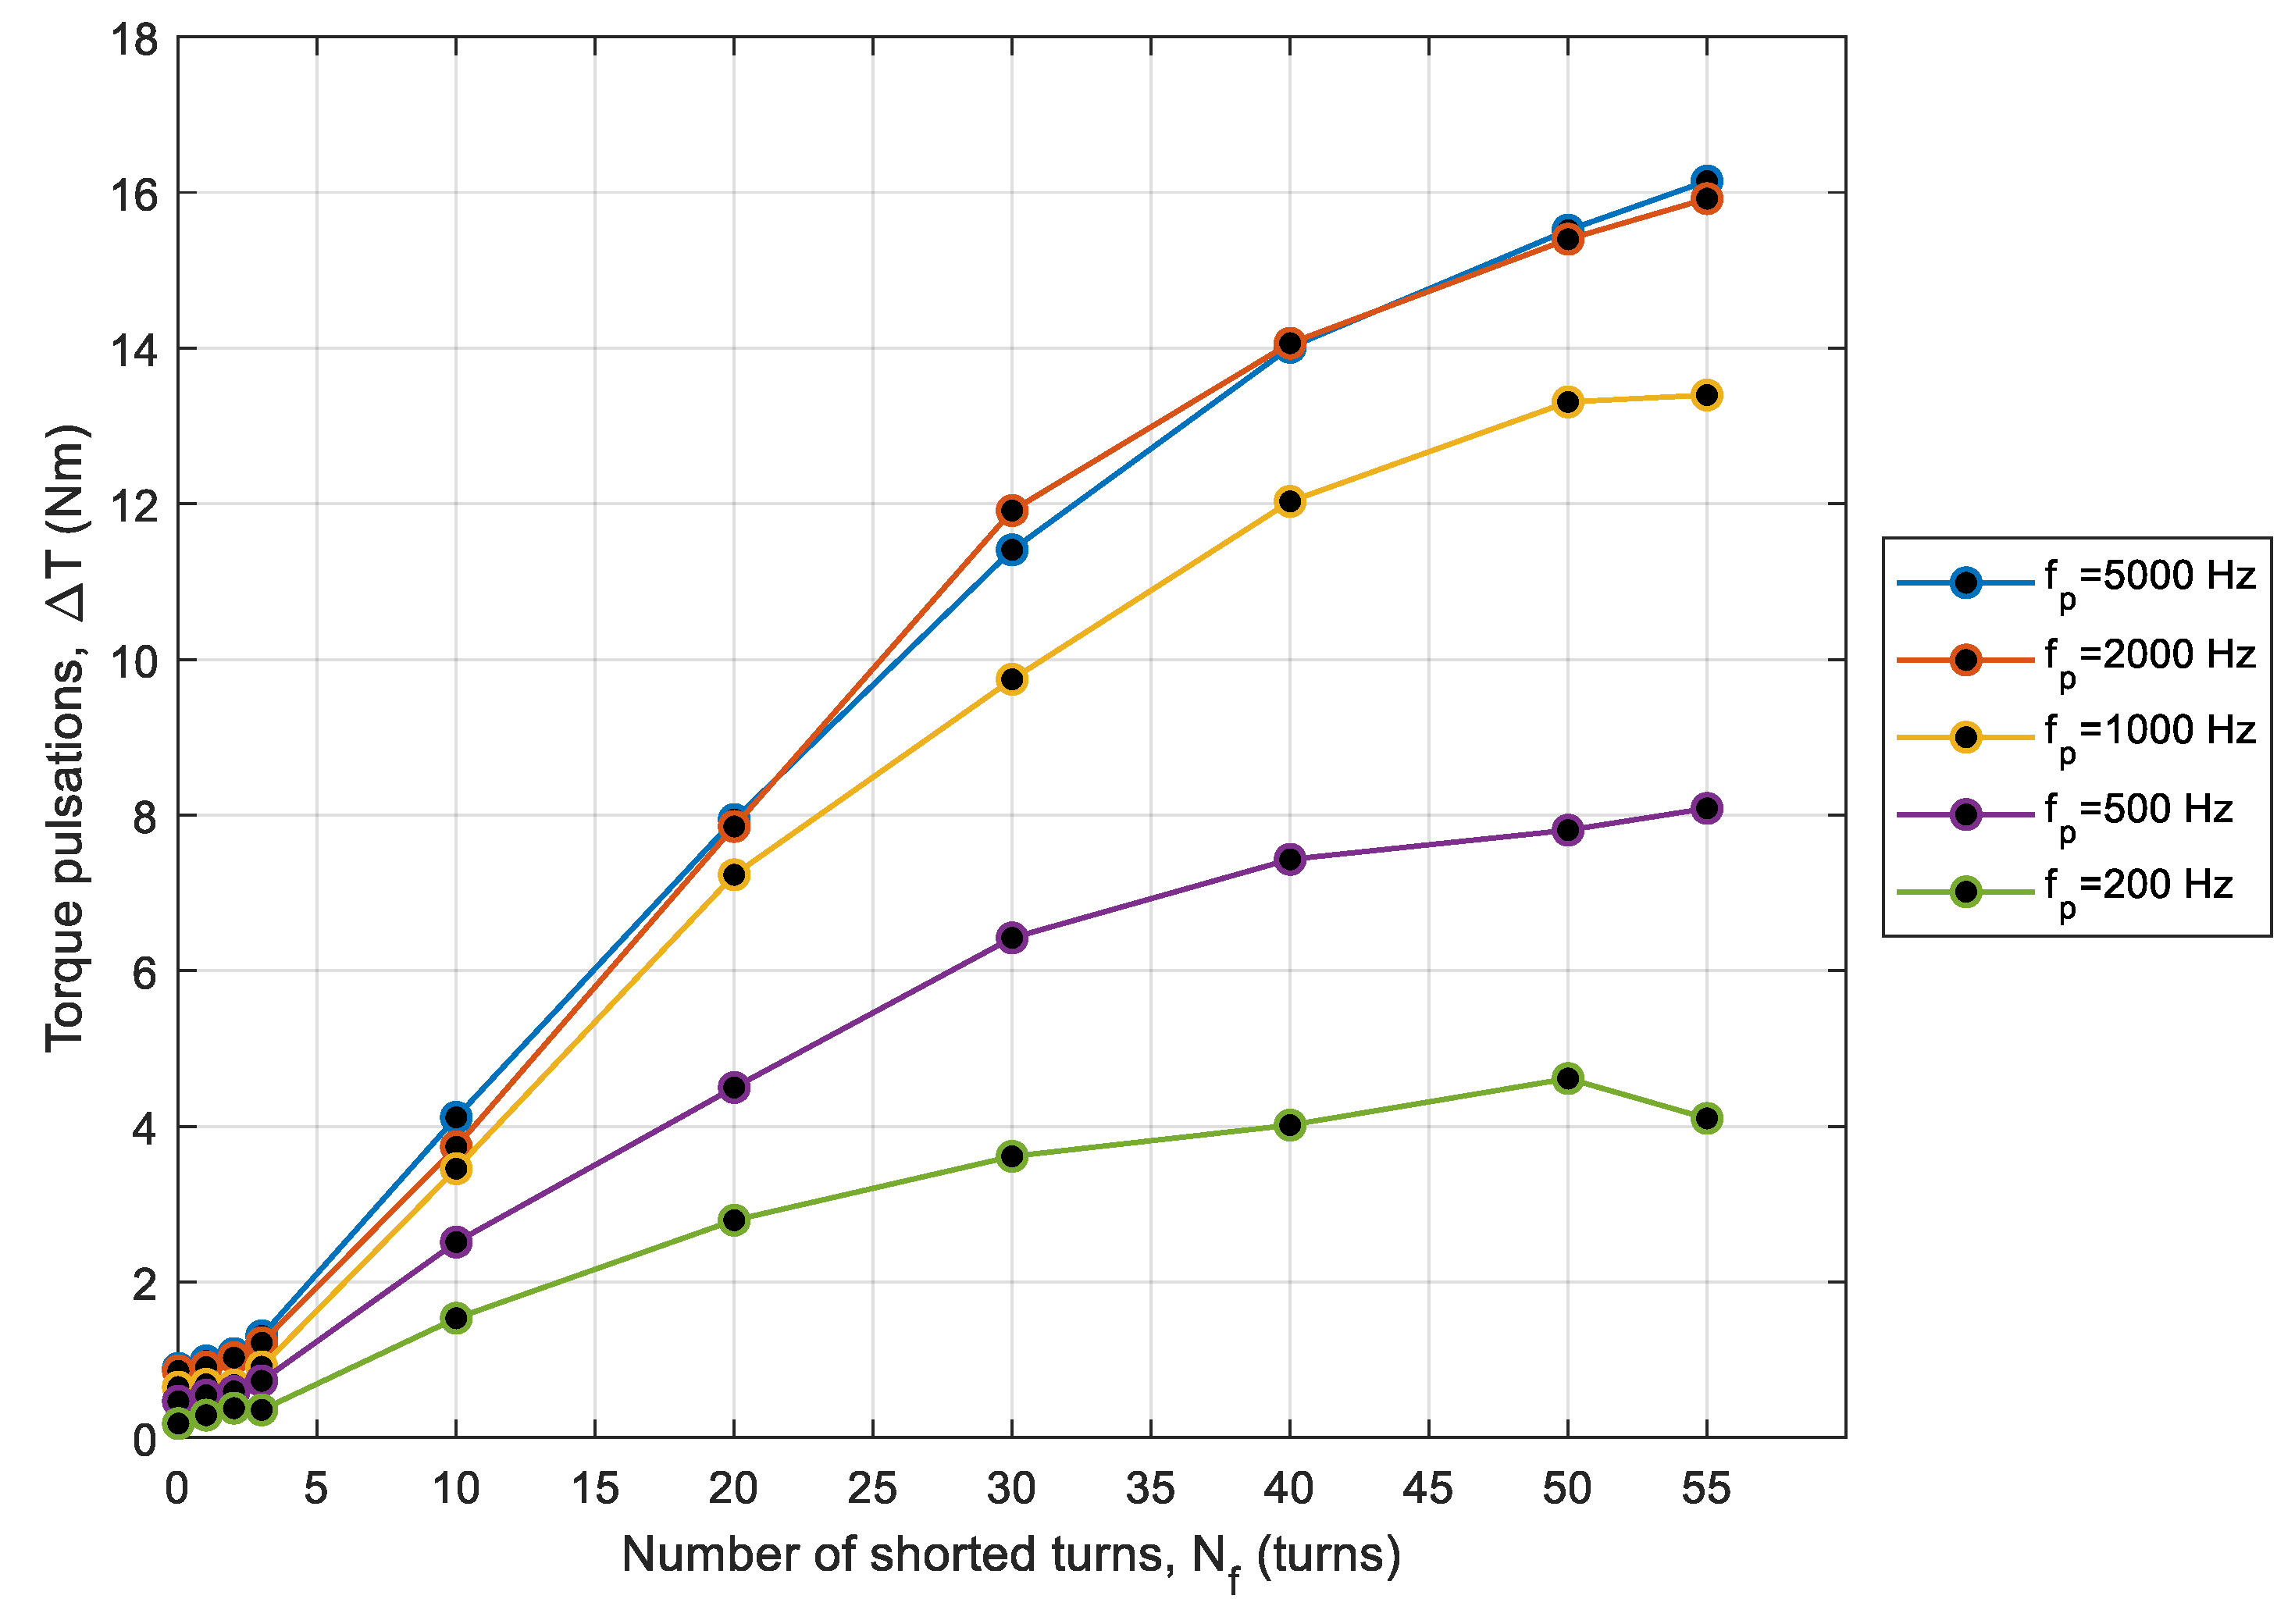
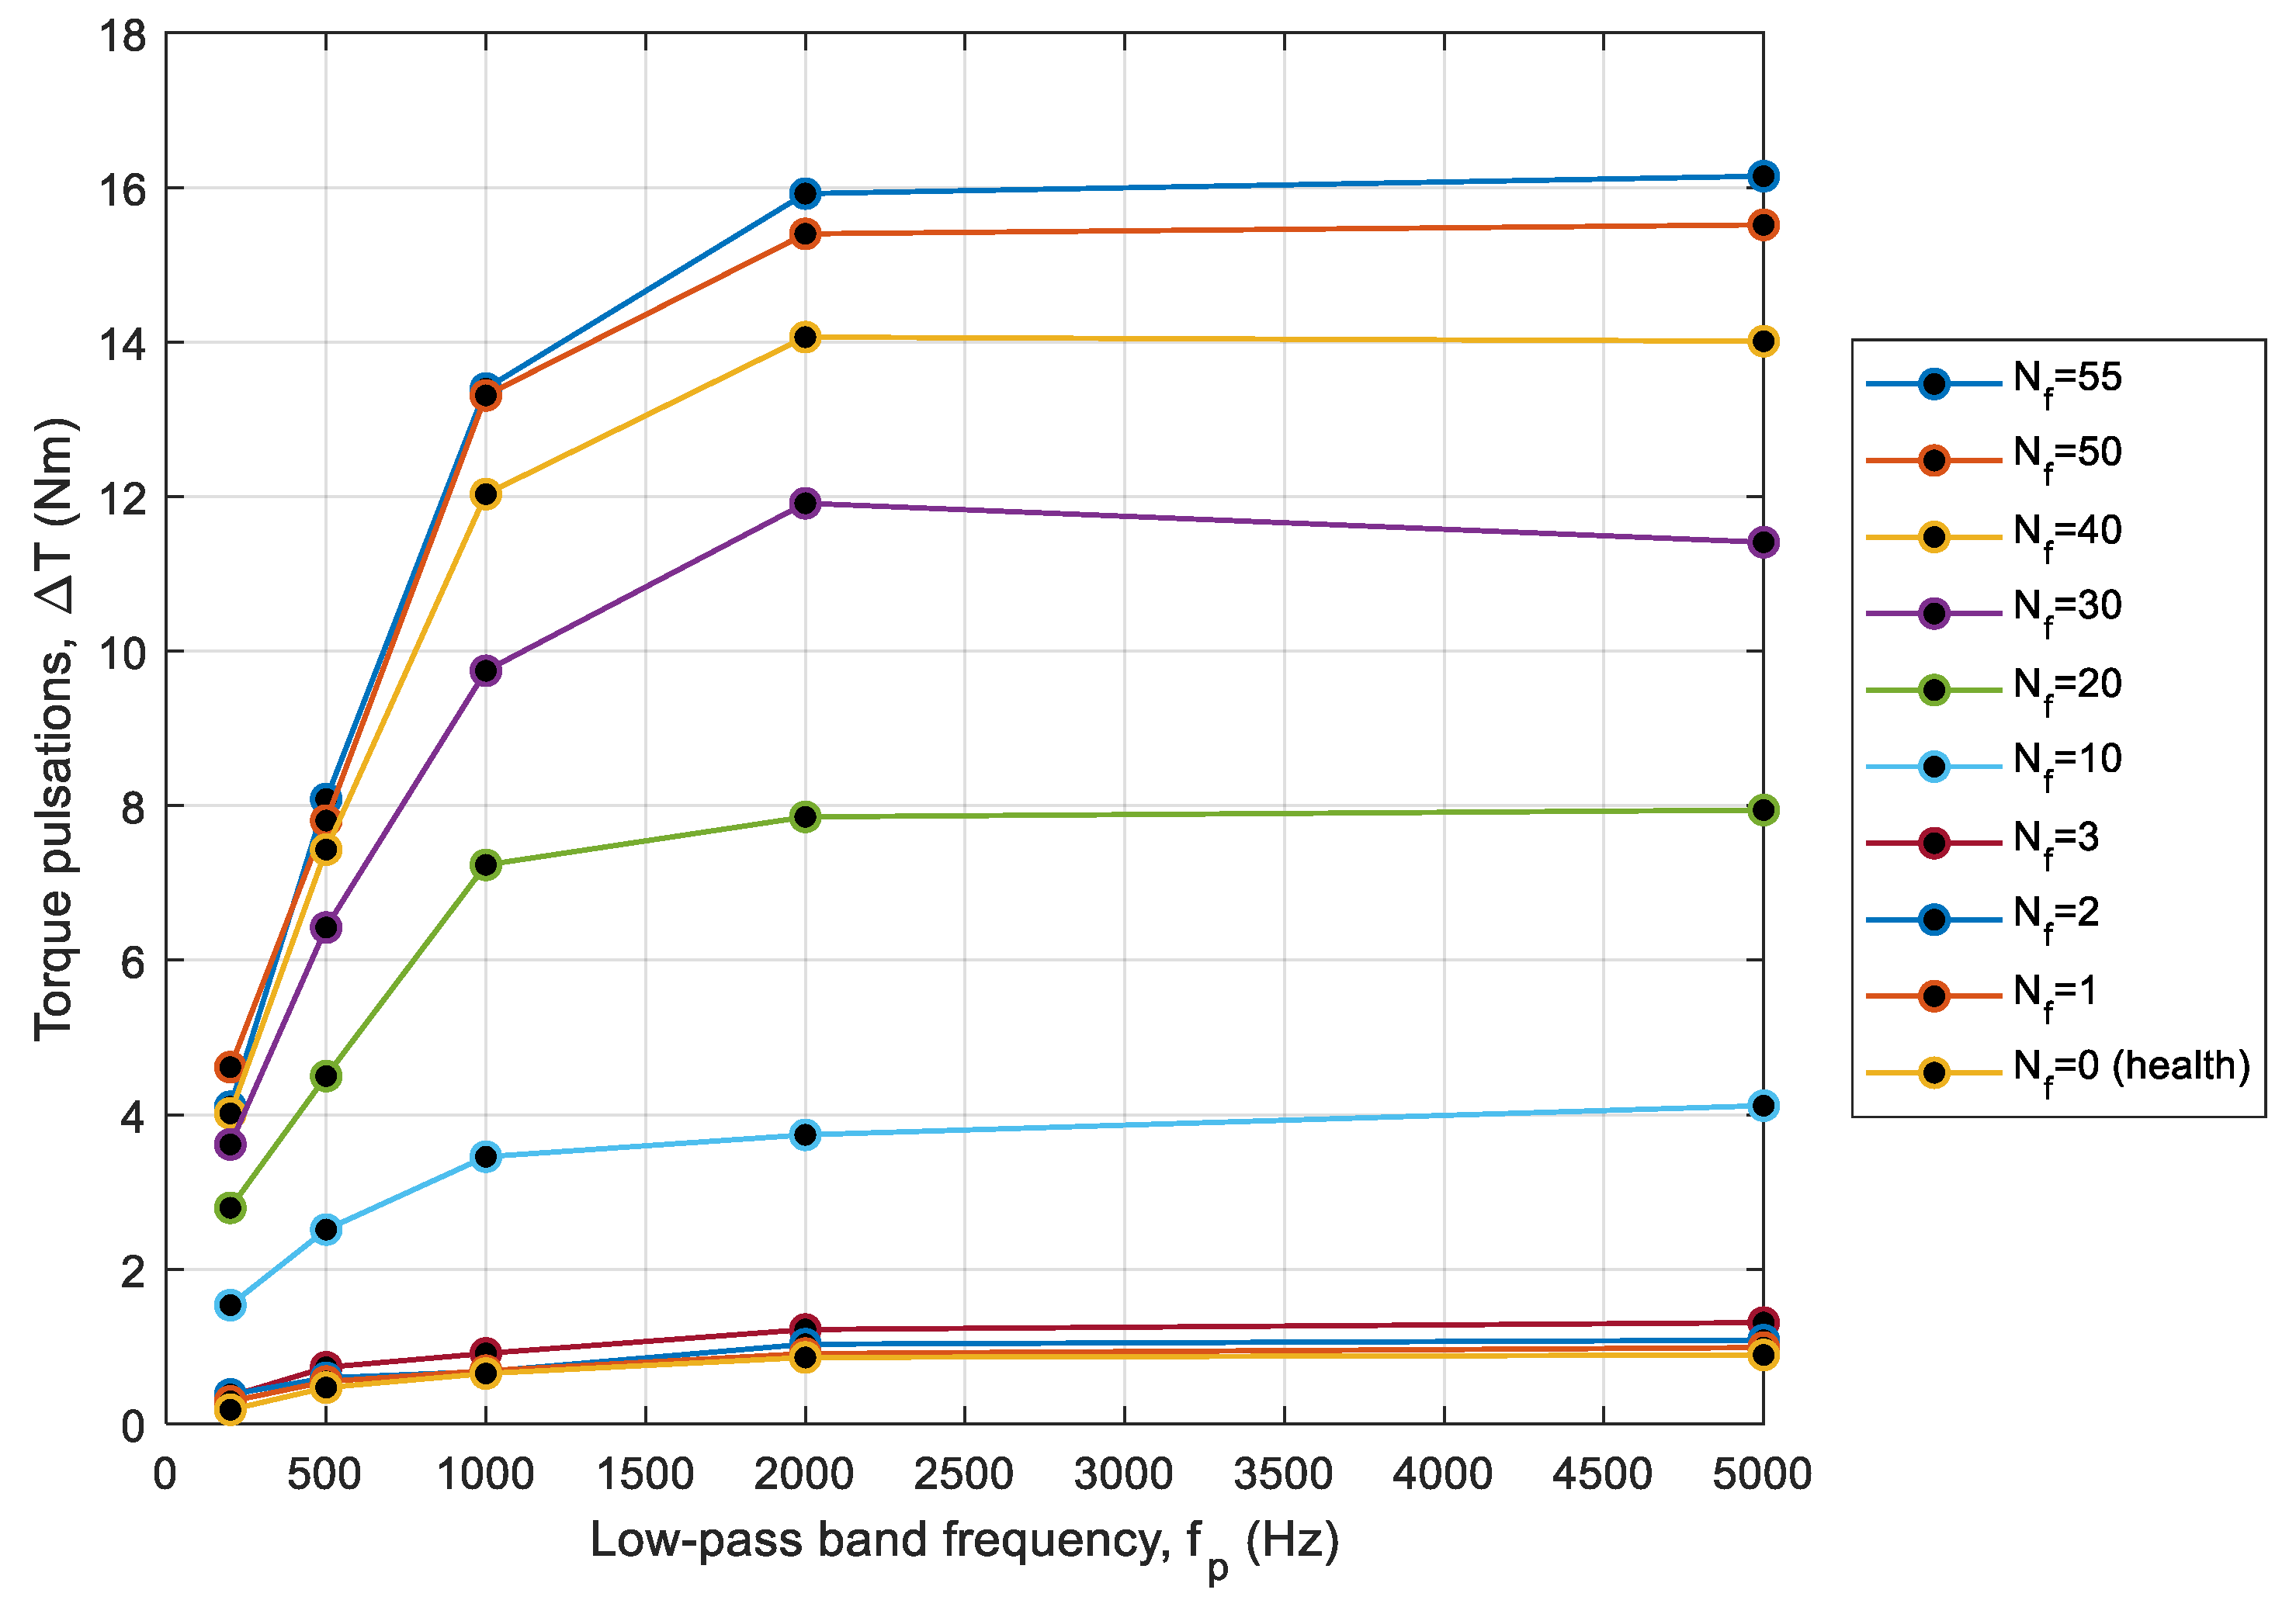
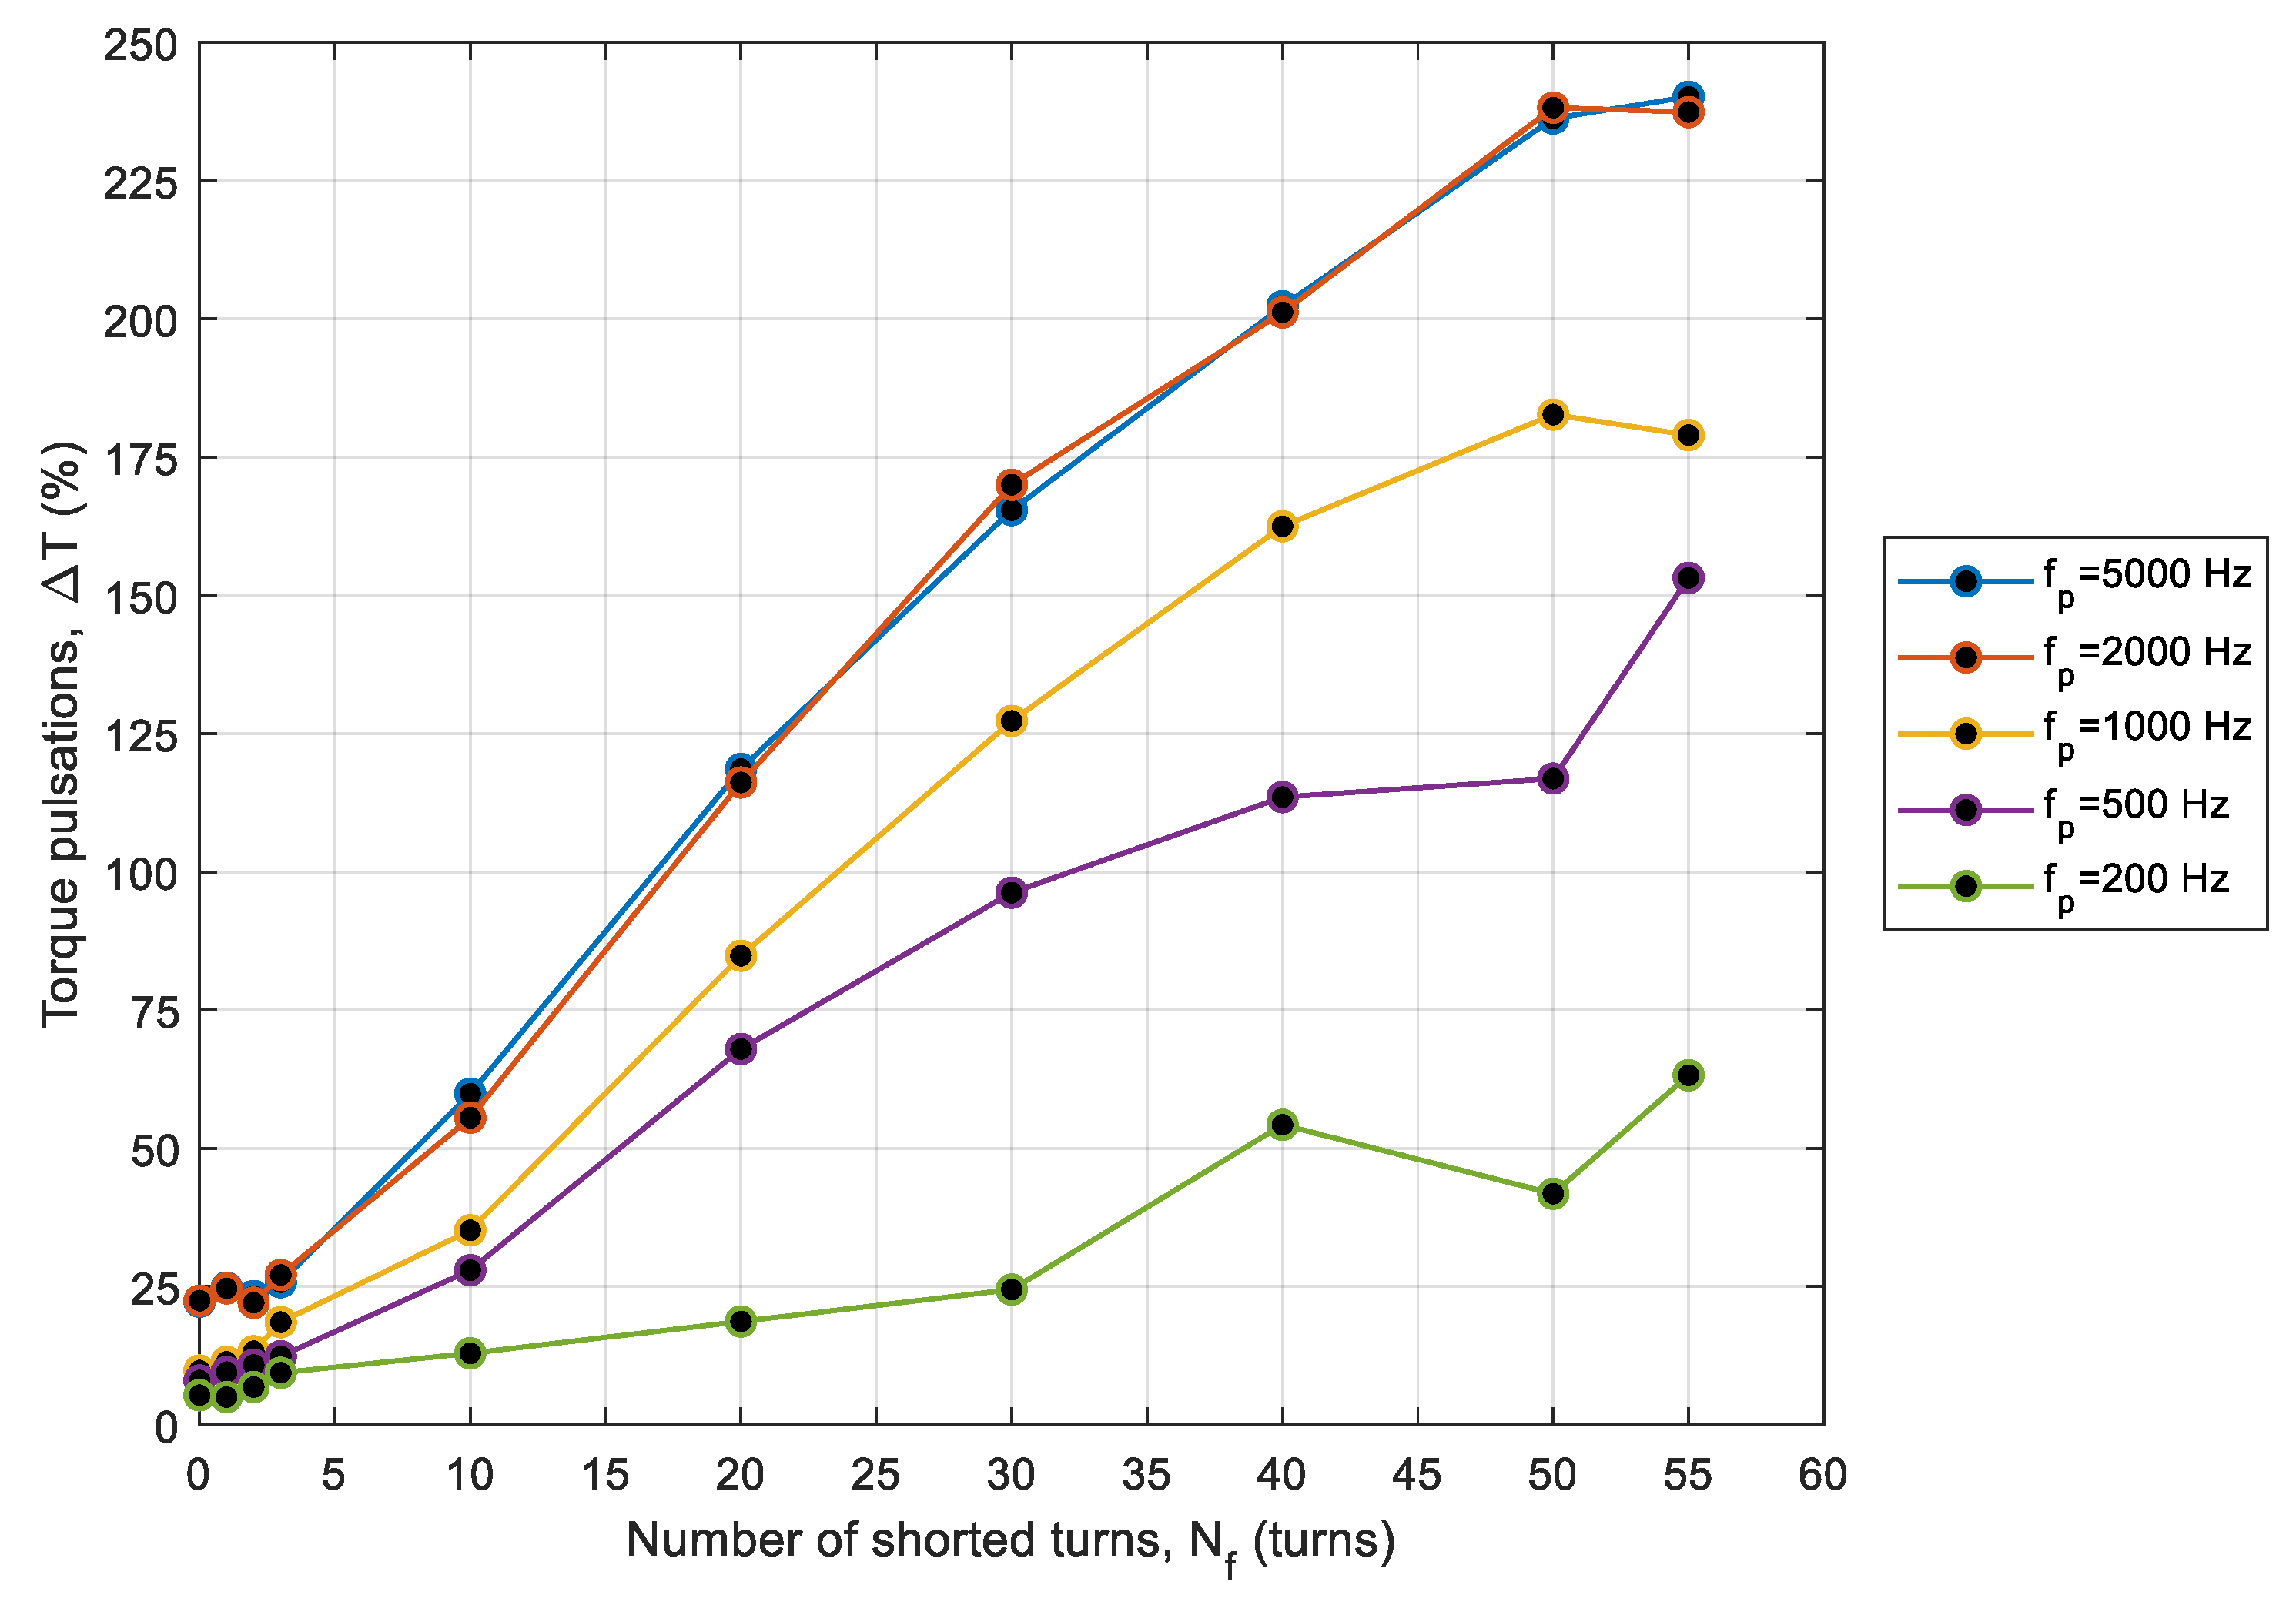
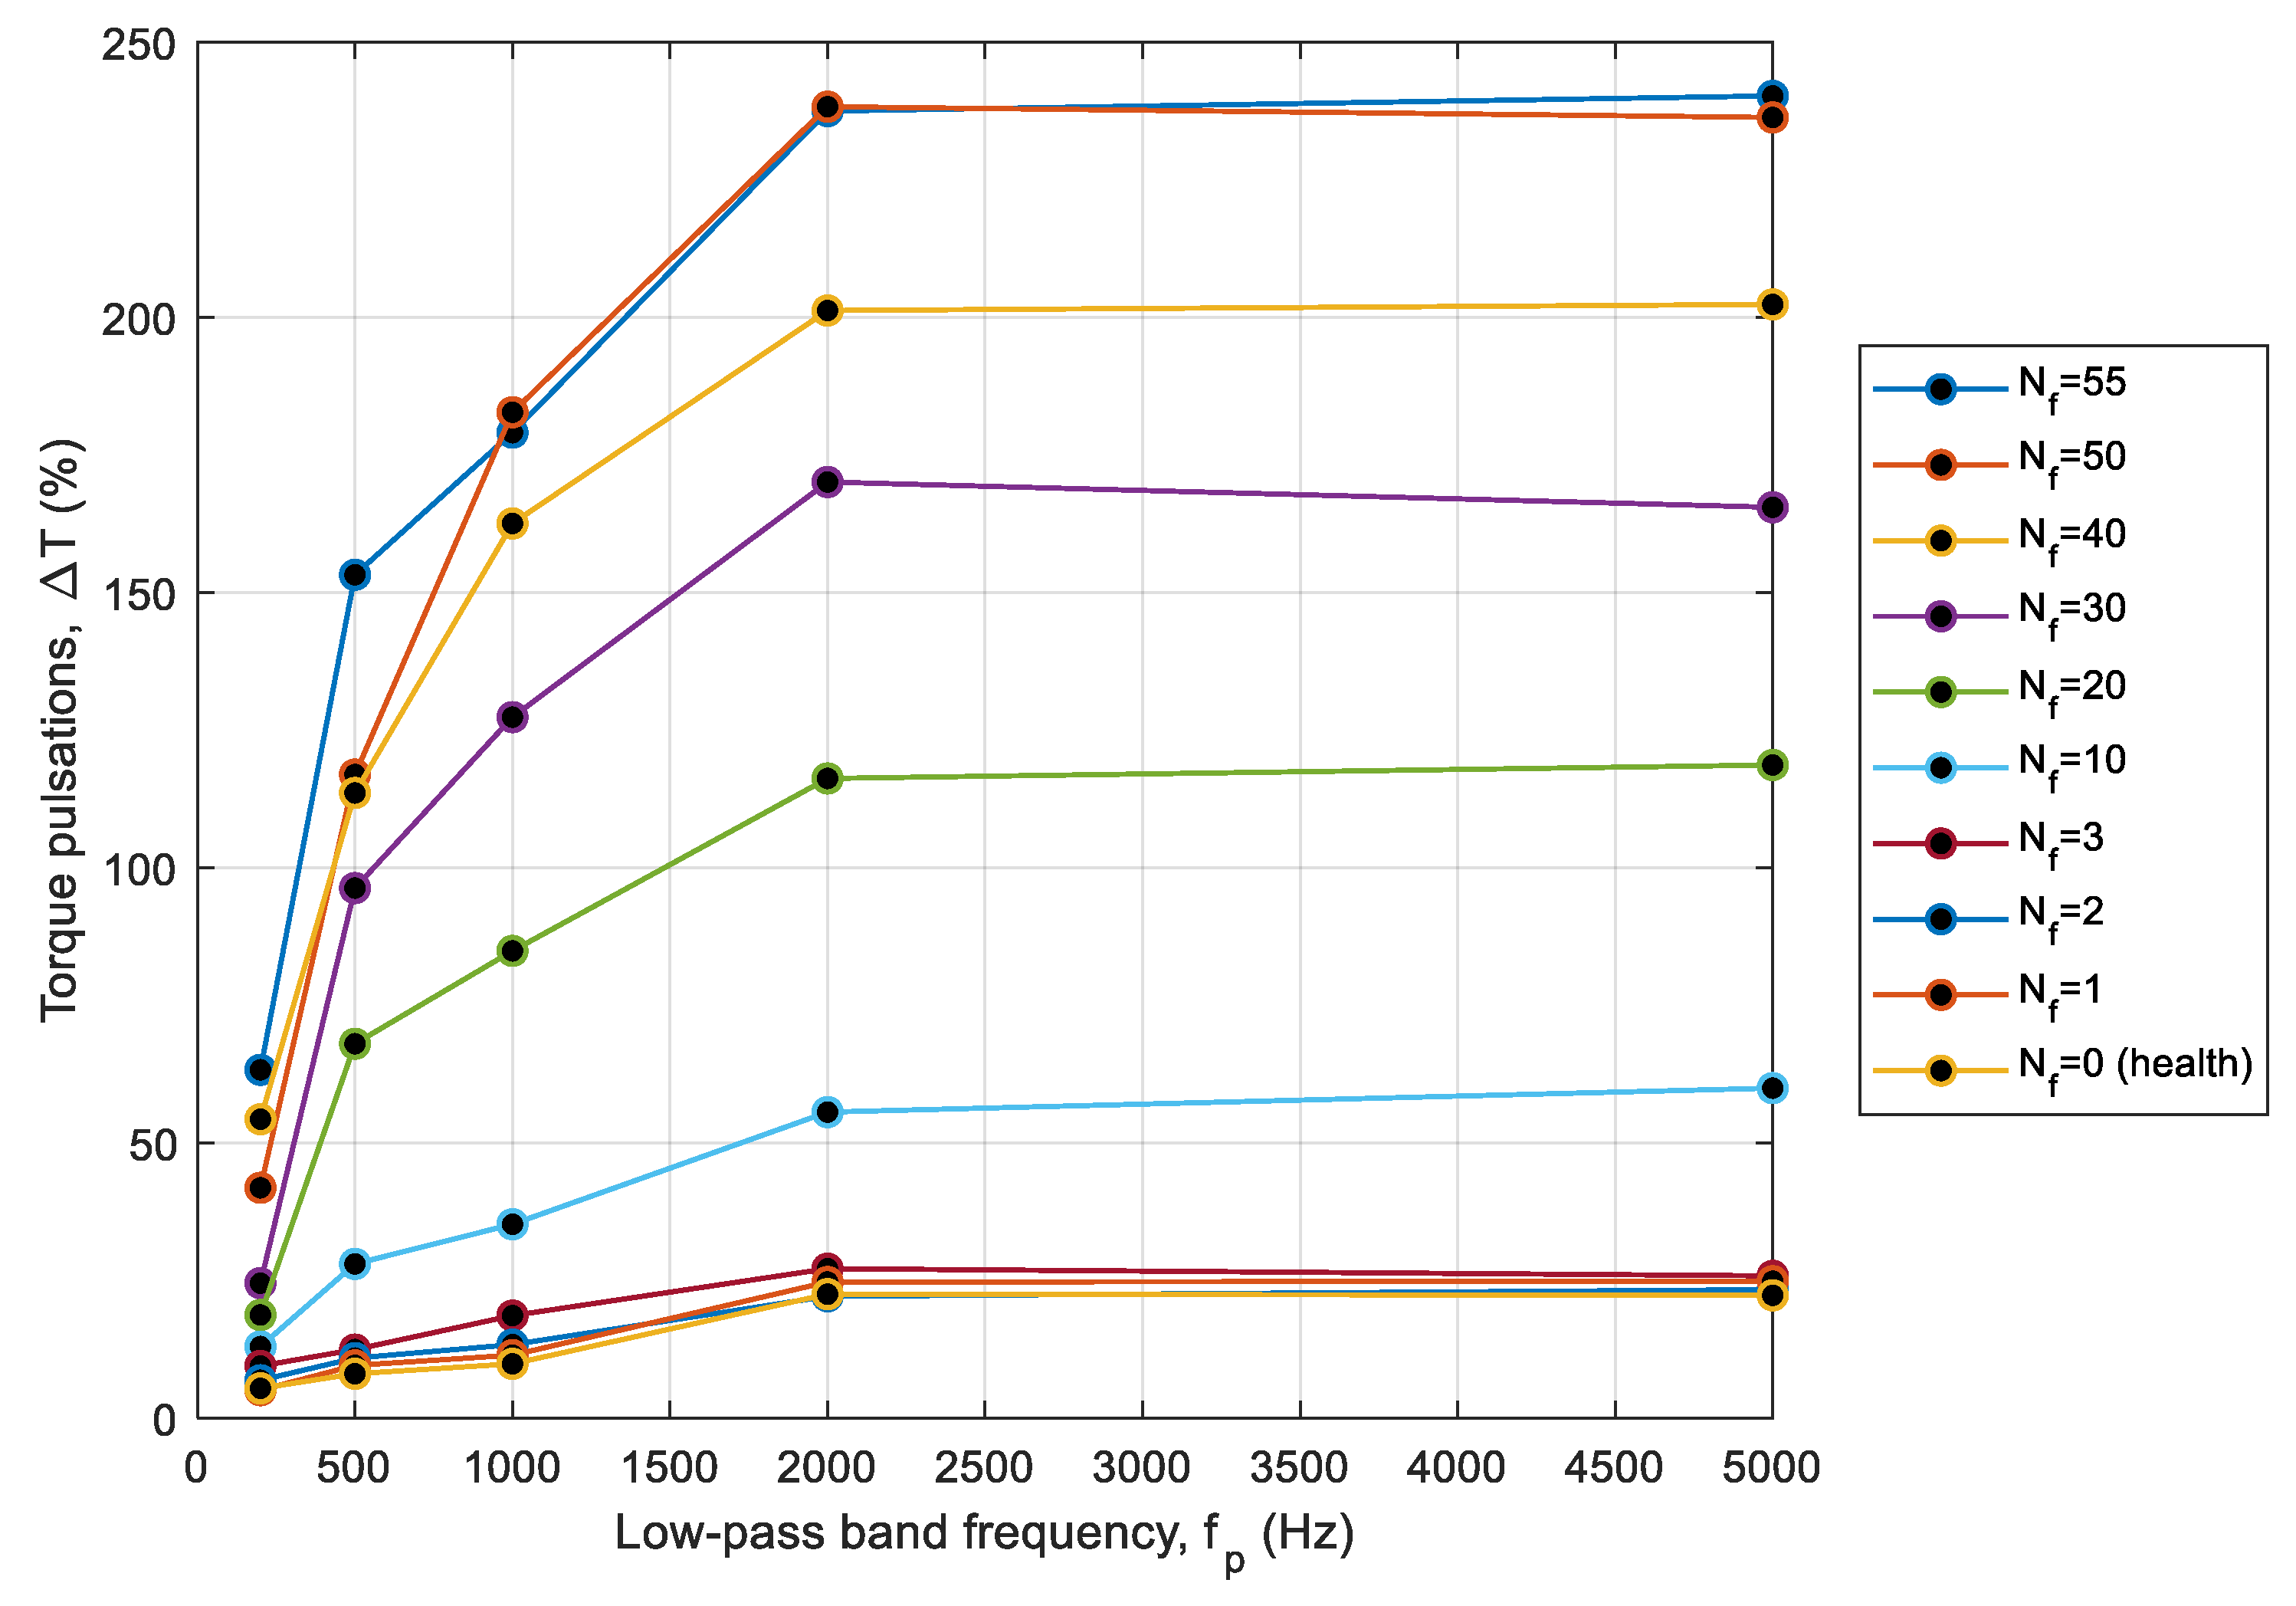
3.4. Torque Ripple Factor

As can be seen in Figure 5, as well as in Figure 6, there are ripples in the torque waveforms. One can observed that the value of the ripples depends on the number of shorted turns. If the motor operating without additional load is considered, then the average torque value oscillates around zero for the steady state. In this case, the torque ripples for a steady state can be calculated as follows.
T = T m a x   T m i n 2
Calculations of the ripple factor were performed after passing the waveforms of torque through the low-pass filter with the frequency fp = {5000, 2000, 1000, 500, 200} Hz. The characteristics which define the relationship between the torque ripple, number of the shorted turns, and filter frequency for the motor without additional external load are shown in Figure 15 and Figure 16. Based on the obtained characteristics, it can be seen that the torque ripples depend almost linearly on the number of shorted turns.
If the motor operates with rated load torque at steady state, the torque ripples can be calculated as follows.
T = T m a x   T m i n T a v 100 %
Calculations of the ripple factor were performed after passing the waveforms of torque through the low-pass filter with the frequency fp = {5000, 2000, 1000, 500, 200} Hz. The characteristics which define the relationship between the torque ripple, number of the shorted turns, and filter frequency for the motor with external load are shown in Figure 17 and Figure 18. Based on the obtained characteristics, it can be seen that the torque ripples also depend almost linearly on the number of shorted turns.
Using the obtained results, a determination coefficient describing the correspondence of calculations to the linear equation was determined. The developed coefficient can be expressed as follows,
R 2 = i = 1 n ( Δ T ^ i Δ T ¯ ) 2 i = 1 n ( Δ T i Δ T ¯ ) 2
where Δ T ^ i is the interpolated value of ripples, Δ T ¯ is the mean value of ripples, and Δ T i is the calculated value of ripples.
The R2 coefficient can take values from 0 to 1. The level of fit of the calculations to the linear equation was determined for the following ranges; 0.0–0.5: low fit; 0.5–0.6: average fit; 0.6–0.8: satisfactory fit; 0.8–0.9: fine fit; and 0.9–1.0: excellent fit.
The coefficient of determination for a load torque equal to 0 Nm was 0.9895, where the linear equation of torque ripple can be described as ΔT = 0.3273 Nf + 1.5847, while the value of the coefficient for a load torque equal to 15 Nm was 0.9885, where the linear equation is: ΔT = 4.304 Nf + 21.079. It can be seen that the value of the R2 coefficient take the value in the range of 0.9 to 1.0, which allows to determine the relationship between the torque ripple and the number of shorted turns as linear.

4. Summary

The appearance of a short circuit between turns results in a division of the winding into two parts. As a result of the superposition of magnetomotive force of the phase winding and magnetomotive force of the shorted coil, the magnetic field distribution is the machine becomes asymmetric. One of the symptoms of the asymmetrical magnetic field is the torque ripples. In order to calculated torque waveforms, the field–circuit model of induction machine taking into account inter-turn short-circuit in stator winding was elaborated. In this paper, the results of the spectral analysis of the obtained torque waveforms were presented and discussed. The torque ripples at steady-state operation were analyzed. An increasing of torque ripple level was observed according to increasing the number of shorted turns. Based on the calculations of the pulsation factor for different low-pass filter frequency values, one can observe that the pulsation factor decreases as the filter frequency decreases. These calculations can be helpful during designing measurement systems for recording torque waveforms.
Furthermore, based on the obtained results, it can be seen that the relationship between the value of the torque ripples factor and the number of shorted turns can be treated as linear. This allows the use of an artificial neural network (ANN) to classify machine failures based on torque ripples factor level. The results of the spectral analysis of torque waveforms can be used as an input vector to the training process of artificial neural network used as classifier in online diagnosis of the IM. The response of the ANN may concern the assessment of the technical condition of the motor.

Author Contributions

Investigation, W.P. and K.G.; Methodology, W.P. and K.G.; Supervision, W.P.; Validation, K.G.; Visualization, W.P.; Writing—original draft, W.P. and K.G. All authors have read and agreed to the published version of the manuscript.

Funding

This research was supported by statutory funds of the Faculty of Control, Robotics and Electrical Engineering of the Poznan University of Technology.

Conflicts of Interest

The authors declare no conflicts of interest.

References

  1. Rajput, S.; Bender, E.; Averbukh, M. Simplified algorithm for assessment equivalent circuit parameters of induction motors. IET Electr. Power Appl. 2020, 14, 426–432. [Google Scholar] [CrossRef]
  2. Morsalin, S.; Mahmud, K.; Mohiuddin, H.; Halim, M.R.; Saha, P. Induction Motor Inter-turn Fault Detection Using Heuristic Noninvasive Approach by Artificial Neural Network with Levenberg Marquardt Algorithm. In Proceedings of the Informatics, Electronics & Vision (ICIEV), International Conference, Dhaka, Bangladesh, 23–24 May 2014; pp. 1–6. [Google Scholar]
  3. Patel, R.K.; Giri, V.K. Condition monitoring of induction motor bearing based on bearing damage index. Arch. Electr. Eng. 2017, 66, 105–119. [Google Scholar] [CrossRef] [Green Version]
  4. Sobański, P.; Orłowska-Kowalska, T. Detection of single and multiple IGBTs open-circuit faults in a field-oriented controlled induction motor drive. Arch. Electr. Eng. 2017, 66, 89–104. [Google Scholar] [CrossRef]
  5. Chen, Y.; Zhao, X.; Yang, Y.; Shi, Y. Online Diagnosis of Inter-turn Short Circuit for Dual-Redundancy Permanent Magnet Synchronous Motor Based on Reactive Power Difference. Energies 2019, 12, 510. [Google Scholar] [CrossRef] [Green Version]
  6. He, Y.L.; Ke, M.Q.; Tang, G.J.; Jiang, H.C.; Yuan, X.H. Analysis and simulation on the effect of rotor interturn short circuit on magnetic flux density of turbo-generator. J. Electr. Eng. Elektrotech. Cas 2016, 67, 323–333. [Google Scholar] [CrossRef] [Green Version]
  7. Wu, Y.C.; Li, Y.G. Diagnosis of Rotor Winding Inter-turn Short-Circuit in Turbine Generators Using Virtual Power. IEEE Trans. Energy Convers. 2015, 30, 183–188. [Google Scholar]
  8. Broniera, P.J.; Gongora, W.S.; Goedtel, A.; Godoy, W.F. Diagnosis of Stator Winding Inter-turn Short Circuit in Three-Phase Induction Motors by Using Artificial Neural Networks, Diagnostics for Electric Machines, Power Electronics and Drives (SDEMPED). In Proceedings of the 9th IEEE International Symposium, Valencia, Spain, 27–30 August 2013; pp. 281–287. [Google Scholar]
  9. Pietrowski, W.; Górny, K. Detection of inter-turn short-circuit at start-up of induction machine based on torque analysis. Open Phys. 2017, 15, 851–856. [Google Scholar] [CrossRef] [Green Version]
  10. Pietrowski, W.; Górny, K. Wavelet analysis of torque at start-up of an induction machine under inter-turn short-circuit. In Proceedings of the 2017 International Symposium on Electrical Machines (SME 2017), Nałęczów, Poland, 18–21 June 2017; pp. 1–4. [Google Scholar]
  11. Wolkiewicz, M.; Tarchała, G.J.; Orłowska-Kowalska, T.; Kowalski, C.T. Online stator interturn short ciruits monitoring in the DFOC induction-motor drive. IEEE Trans. Ind. Electron. 2016, 63, 2517–2528. [Google Scholar] [CrossRef]
  12. Huang, B.; Feng, G.; Tang, X.; Xi Gu, J.; Xu, G.; Cattley, R.; Gu, F.; Ball, A.D. A Performance Evaluation of Two Bispectrum Analysis Methods Applied to Electrical Current Signals for Monitoring Induction Motor-Driven Systems. Energies 2019, 12, 1438. [Google Scholar] [CrossRef] [Green Version]
  13. Zoeller, C.; Wolbank, T.M.; Vogelsberger, M.A. Influence of Voltage Excitation and Current Sensors on Monitoring of Stator Winding Insulation based on Transient Current Step Response. In Proceedings of the IEEE Energy Conversion Congress and Exposition (ECCE), Montreal, QC, Canada, 20–24 September 2015; pp. 2854–2861. [Google Scholar]
  14. Bouzid, M.B.; Champenois, G. Neural Network Based Method for the Automatic Detection of the Stator Faults of the Induction Motor. In Proceedings of the Electrical Engineering and Software Applications (ICEESA), International Conference, Hammamet, Tunisia, 21–23 March 2013; pp. 1–7. [Google Scholar]
  15. Sellami, T.; Berriri, H.; Jelassi, S.; Darcherif, A.M.; Mimouni, M.F. Short-Circuit Fault Tolerant Control of a Wind Turbine Driven Induction Generator Based on Sliding Mode Observers. Energies 2017, 10, 1611. [Google Scholar] [CrossRef] [Green Version]
  16. Zoeller, C.; Wolbank, T.M.; Vogelsberger, M.A. Online Insulation Condition Monitoring of Traction Machines using Inverter Induced Voltage Injection. In Proceedings of the IECON 2015—41st Annual Conference of the IEEE Industrial Electronics Society, Yokohama, Japan, 9–12 November 2015; pp. 2456–2462. [Google Scholar]
  17. Williamson, S.J.; Wrobel, R.; Yon, J.; Booker, J.D.; Mellor, P.H. Investigation of Equivalent Stator-Winding Thermal Resistance during Insulation System Ageing. In Proceedings of the IEEE 11th International Symposium on Diagnostics for Electrical Machines, Power Electronics and Drives (SDEMPED), Tinos, Greece, 29 August–1 September 2017; pp. 550–556. [Google Scholar]
  18. Zoeller, C.; Vogelsberger, M.A.; Fasching, R.; Grubelnik, W.; Wolbank, T.M. Evaluation and Current-Response-Based Identification of Insulation Degradation for High Utilized Electrical Machines in Railway Application. IEEE Trans. Ind. Appl. 2017, 53, 2679–2689. [Google Scholar] [CrossRef]
  19. Cabanas, M.F.; Norniella, J.G.; Melero, M.G.; Rojas, C.H.; Cano, J.M.; Pedrayes, F.; Orcajo, G.A. Detection of stator winding insulation failures: On-line and off-line tests. In Proceedings of the 2013 IEEE Workshop on Electrical Machines Design Control and Diagnosis (WEMDCD), Paris, France, 11–12 March 2013; pp. 210–219. [Google Scholar]
  20. Maraaba, L.; Al-Hamouz, Z.; Abido, M. An Efficient Stator Inter-Turn Fault Diagnosis Tool for Induction Montors. Energies 2018, 11, 653. [Google Scholar] [CrossRef] [Green Version]
  21. Leite, V.C.M.N.; Borges da Silva, J.G.; Veloso, G.F.C.; Borges da Silva, L.E.; Lambert-Torres, G.; Bonaldi, E.L.; de Oliveira, L.E.D.L. Detection of Localized Bearing Faults in Induction Machines by Spectral Kurtosis and Envelope Analysis of Stator Current. IEEE Trans. Ind. Electron. 2015, 62, 1855–1865. [Google Scholar] [CrossRef]
  22. Glowacz, A.; Głowacz, Z.; Glowacz, W.; Carletti, E.; Kozik, J.; Korenciak, D.; Gutten, M.; Khan, F.; Irfant, M. Fault Diagnosis of Three Phase Induction Motor Using Current Signal, MSAF-Ratio15 and Selected Classifiers. Arch. Metall. Mater. 2017, 62, 2413–2419. [Google Scholar] [CrossRef]
  23. da Silva, A.M.; Povinelli, R.J.; Demerdash, N.A.O. Rotor Bar Fault Monitoring Method Based on Analysis of Air-Gap Torques of Induction Motors. IEEE Trans. Ind. Inform. 2013, 9, 2274–2283. [Google Scholar] [CrossRef] [Green Version]
  24. Arkan, M.; Kostic-Perovic, D.; Unsworth, P.J. Modelling and simulation of induction motors with inter-turn faults for diagnostics. Electr. Power Syst. Res. 2005, 75, 57–66. [Google Scholar] [CrossRef]
Figure 1. Illustration of the inter-turn short-circuit in the phase A of stator winding.
Energies 13 03626 g001
Figure 2. Field–circuit model of induction machine: (a) magnetic circuit and (b) electric circuit.
Energies 13 03626 g002aEnergies 13 03626 g002b
Figure 3. Magnetic field distributions at time equal to 10ms, load torque TL=TN, and number of shorted turns: (a) Nf = 1 and (b) Nf = 40.
Energies 13 03626 g003
Figure 4. Torque waveforms of a healthy motor at TL = 0 Nm and TL = 15 Nm.
Energies 13 03626 g004
Figure 5. Torque waveforms of a faulty (Nf = 1–50) as well healthy (Nf = 0) motor without external torque (TL = 0 Nm).
Energies 13 03626 g005
Figure 6. Torque waveforms of a faulty (Nf = 1 – 50) as well as a healthy (Nf = 0) motor at rated torque (TL = 15 Nm).
Energies 13 03626 g006
Figure 7. Torque waveforms during first period of start-up process at TL = 0 Nm.
Energies 13 03626 g007
Figure 8. Torque waveforms during first period of start-up process at TL = 15 Nm.
Energies 13 03626 g008
Figure 9. Torque waveforms at steady state (time: 460–480 ms) and TL = 0 Nm.
Energies 13 03626 g009
Figure 10. Torque waveforms at steady state (time: 460–480ms) and TL = 15 Nm.
Energies 13 03626 g010
Figure 11. Spectral analysis of the torque waveform of a faulty motor, at TL = 0 Nm.
Energies 13 03626 g011
Figure 12. Spectral analysis of the torque waveform of a faulty motor, at TL = 15 Nm.
Energies 13 03626 g012
Figure 13. Spectral analysis of the torque waveform of a faulty motor limited in frequency: (a) 400–650 Hz and (b) 950–1200 Hz, at TL = 0 Nm.
Energies 13 03626 g013aEnergies 13 03626 g013b
Figure 14. Spectral analysis of the torque waveform of a faulty motor limited in frequency: (a) 400–650 Hz and (b) 900–1150 Hz, at TL = 15 Nm.
Energies 13 03626 g014
Figure 15. Torque ripple factor as a function of shorted turns Nf in the case of a faulty motor, at TL = 0 Nm.
Energies 13 03626 g015
Figure 16. Torque ripple factor as a function of low-pass filter frequency fp in the case of a faulty motor, at TL = 0 Nm.
Energies 13 03626 g016
Figure 17. Torque ripple factor as a function of shorted turns Nf in the case of a faulty motor, at TL = 15 Nm.
Energies 13 03626 g017
Figure 18. Torque ripple factor as a function of low-pass filter frequency fp in the case of a faulty motor, at TL = 15 Nm.
Energies 13 03626 g018
Table 1. Rated parameters of the motor.
ParameterValue
Mechanical power2.2 kW
Supply voltage380 V
Efficiency82%
Speed1410 rpm
Torque15 Nm
Frequency50 Hz
Core loss37 W
Stator slots36
Rotor slots24
Table 2. Mesh parameters of the FEM model.
Num ElementsMin Edge LengthMax Edge LengthRMS Edge LengthMin Elem. AreaMax Elem. AreaMean Elem. Area
Band6270.0001250.00197470.0008542151.48933 × 10−81.59494 × 10−76.82612 × 10−8
Shaft960.003121450.006138750.004589315.9426 × 10−61.46274 × 10−58.32385 × 10−6
Outer Region17370.0001250.005894170.002165092.24777 × 10−84.85527 × 10−61.0943 × 10−6
Stator21610.0004084650.006148340.003270342.03949 × 10−71.50488 × 10−53.89616 × 10−6
Coil330.0008972140.003403840.002394949.34699 × 10−73.15461 × 10−62.03934 × 10−6
Rotor63000.0002731260.005822020.001407774.81107 × 10−81.03163 × 10−57.93901 × 10−7
Bar4530.0002731260.0006991280.0004986024.60133 × 10−81.81518 × 10−71.06182 × 10−7
Bar_Separate4990.0002731260.0006991280.0004733524.60133 × 10−81.81518 × 10−79.6394 × 10−8
Coil Shorted70.00080.0020.001189644 × 10−71 × 10−65.71429 × 10−7
Table 3. Peak values of the torque during start-up.
NfTL = 0 NmTL = 15 Nm
5590.58999.471
5090.36599.702
4089.14899.567
3087.41098.583
2091.72796.986
1092.68995.689
391.93897.009
292.07697.286
192.22097.599
092.30597.974

