Abstract
Power quality assessment is a complex measurement task, requiring the usage of a system with suitable metrological properties. This complex measurement task in the real power grid is performed with the use of power quality analysers that measure and record the parameters determining the power quality. The paper presents selected research results for a class A power quality analyser in the specially prepared measurement system containing measuring instruments calibrated by the Main Office of Measures. The measurement results were completed with a presentation of the uncertainty budget. The influence of the phenomenon of spectrum leakage on metrological properties of the tested power quality analyser was considered in the paper. To assess this influence, the simulation studies with the use of MATLAB and the experimental studies were carried out for selected test signals. The Metrological interpretation of the research results is presented in the paper.
1. Introduction
To assess power quality, we use a set of standard and complementary quantities contained in documents [1,2]. Among them, there are two measures of harmonic content: amplitude spectrum—i.e., a set of values of particular harmonics—as well as Total Harmonic Distortion (THD). The measurement of harmonic content is carried out using the Fast Fourier Transform (FFT) algorithm. This algorithm assumes the stationariness of the measured signals. Thus, the algorithm assumes that the measured voltage and current are periodic signals with a constant period T. In the real power grid, these measured signals are non-stationary. Thus, to perform a correct FFT analysis, it is necessary to measure the harmonic content for short measurement periods in which the waveform is stationary. However, in the case of an incorrect adjustment of the measurement window (e.g., when the synchronization is lost), a spectrum leakage phenomenon occurs, which can disturb the evaluation of the tested signals. Incorrect adjustment of the measurement window is a situation in which the duration of the measurement window is not a total multiple of the fundamental period of the measured signal. These measures of harmonic content, as well as other quantities used in power quality assessment, are measured with power quality analysers. The measurement results, registered with those devices, make it possible to diagnose the state of power network—e.g., through detecting disturbing loads. The discussion of these topics can be found, among others, in scientific papers [3,4,5,6,7,8,9,10]. Taking into account the possible applications of power quality analysers, it is very important to evaluate the inaccuracy of measurement results obtained using these analysers. The problem of measurement error evaluation of harmonics content using Fourier series was described, among others, in [11]. The measurement result is complete when it contains both the value of quantity measured and the uncertainty of measurement result connected with this value. It is assumed, according to document [12], that the measurement uncertainty is a non-negative parameter characterising the dispersion of the quantity values, assigned to the measure and, calculated on the basis of the information obtained.
The measurement results were completed with a presentation of the uncertainty budget. The carried-out research also allowed for the metrological assessment of the effect of the spectral leakage phenomenon on the measurement of harmonic content by the class A power quality analyser. The proposed solution was compared with the methods of reducing the effects of spectrum leakage recommended by the standard [13]. The metrological analysis of obtained measurement results allowed for the drawing of final conclusions.
The original contributions of the paper include the metrological assessment of the content of higher harmonics measurement accuracy by class A power quality analysers with the use of a proprietary measuring stand containing instruments calibrated by the Main Office of Measures. The proposed approach and the prepared measurement stand enable the testing of power quality analysers, considering the phenomenon of “spectrum leakage” and can be used for serial testing of the accuracy of harmonics measurements with different power quality analysers by the institutions associated with measurements and technical inspections.
2. Measuring System for Testing Power Quality Analyser
The paper presents a measuring system for the evaluation of metrological properties of a power quality analyser. Research on the selected PQ-Box 100 analyser was conducted on a constructed measuring system, presented in Figure 1.
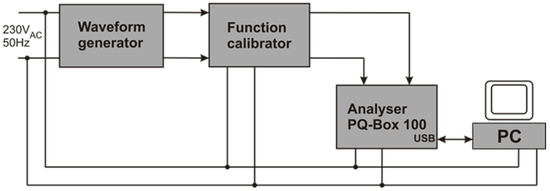
Figure 1.
Diagram of measuring system for testing power quality analyser PQ-Box 100.
In the measuring system presented in Figure 1, a waveform generator allows us to set a certain shape of waveform and control the operation of function calibrator. The calibrator generates a signal with a shape set from the generator, and with certain root mean square (RMS) values of voltage. The waveform generator used in measurements was calibrated in the Main Office of Measures, where its accuracy was verified.
The value of the limiting error of frequency reproduction, given in the calibration certificate, together with the uncertainty of its determination, for triangle waveform is equal to . The function calibrator generates a voltage signal with a shape set from the generator. The value of the limiting error for the considered values of signal is equal to , where denotes the indicated value, and denotes the value of measurement range. The signal generated in that way is then transmitted to the tested analyser. Because the tests are very time-consuming, only selected values were verified: the RMS of voltage and the distribution of harmonic components [14].
Connecting an analyser with the PC computer through the USB 2.0 interface allows for the transmission of measurement data. Software attached to the analyser supports a detailed analysis of registered measurement results, their statistical processing, as well as visualisation in diagrams. One of the testing functions was periodic signal , which can be presented as a trigonometric Fourier series, according with the generally known dependencies. Representation of signal , in the expansion of function in the Fourier series, refers to an infinitely large number of components. In practice, it is impossible—and we use a finite number of components. In measurement practice of power systems, usually first dozen components are used. In the considered case, the measurements are limited to a harmonic of 50-th order. The measurements were carried out for voltages in all three phases; however, due to the repeatability of results, the results were presented only for a selected phase . In all measurements the measurement errors were determined as a difference between the measurement result and the value of reference quantity. Different testing signals were used to evaluate the difference of measurement of the RMS of voltage and harmonics content with a selected power quality analyser. The investigated power quality analysers are calibrated in two stages.
The first stage consists in calibrating the meter with a distorted signal, and with a given RMS. The other stage consists in calibrating the meter with a sinusoidal signal with the same RMS as the distorted signal. Two types of distorted waveforms were used in the tests:
- Triangle waveform—its expansion in the Fourier series is presented with dependence (1):where denotes signal amplitude, , T—testing signal period;
- Waveform composed of a sum of two signals: basic harmonic and a selected higher harmonic.
Calibrating a meter with sinusoidal signal for which an expected value of harmonics content is equal to zero, aimed at testing the so-called “zero” of the analyser for a distorted function composed of a sum of two signals—basic harmonic and a selected higher harmonic. The basic harmonic value had an RMS equal to 230, and the value of higher harmonic 18.4, which is 8% of the value of basic harmonic. The RMS of such a testing signal was equal to 230.7.
Table 1 presents examples of the research results for a testing signal distorted with one harmonic component. Similarly, as in case of other input functions, because of the repeatability of results, the results presented here refer to the phase of the analyser. Table 2 presents a summary of measurement results of the investigated analyser for input functions with sinusoidal signals for phase . Table 3 summarizes the obtained exemplary results of measuring the percentage of particular odd harmonics in triangle input function. The value of distortion factor, calculated from expression (1), is equal to THD = 12.114%. The measurements are presented for selected phase . Measurement uncertainty of the investigated analyser, presented in the last columns of Table 1, Table 2 and Table 3 was evaluated according to the uncertainty propagation law. The following factors were considered: measurement standard uncertainty of difference of measurement result and the value of reference quantity for distorted and sinusoidal signal, measurement standard uncertainty connected with the resolution of analyser for both signal and standard uncertainty connected with the limiting error of reference standard.

Table 1.
Summary of measurement of THD signal distorted with one harmonic component.
Table 2.
Summary of measurement results for sinusoidal signal for f = 50 .
Table 3.
Summary of measurement of percentage of particular harmonics in distorted signal with THD = 12.114%.
All the measurements were repeated many times—minimum 10 times,—in order to define the scatter of measurement results, and to eliminate possible excessive errors. In order to determine the value of measurement result uncertainty, it is necessary to correctly define the measurement equation, which should take into account all the factors influencing the final measurement result.
When the analyser is calibrated with distorted signal, with a given RMS, the equation for measurement error takes the form given with dependence (2):
where:
- —value of the quantity measured by the investigated analyser;
- —reference value for a given signal;
- —value connected with the resolution of the indications of measurement device during the measurement of distorted signal;
- —value connected with the limiting error of reference standard during the measurement of distorted signal.
For calibrating the analyser with sinusoidal signal, with the same RMS as for the distorted signal, the equation for measurement error takes the form given with dependence (3):
where:
- —value of the quantity measured by the investigated analyser;
- —reference value;
- —value connected with the resolution of the indications of measurement device during the measurement of sinusoidal signal;
- —value connected with the limiting error of reference standard during the measurement of sinusoidal signal.
The is the value connected with the resolution of the indication of measurement device. This value must be added to the value of measurement error. While the is the value connected with the limiting error of reference standard. This value is known and given by the laboratory of Main Office of Measures in the calibration certificate together with the uncertainty of its determination. Therefore, this value must be subtracted from the value of measurement error.
As mentioned before, the final record of measurement result should contain both the value of quantity measured and the measurement result of uncertainty connected with this value. Often, the measurement uncertainty contains a several components. Some components can be determined with method A for determining measurement uncertainty, consisting in the calculation of the component value of measurement uncertainty by means of statistical analysis of the measured values obtained in defined measurement conditions. Other components, whose values can be determined with method B for determining the measurement result uncertainty, could be characterised with standard deviation, determined from the probability density function based on experience or other information. A detailed description of determining uncertainty with method A or method B, can be found in document [15]. The combined standard uncertainty of measurement of determining the measurement error of analyser for distorted signals is given with dependence (4):
where:
- —denote sensitivity coefficients;
- —denotes value connected with the limiting error of reference standard, which is determined as a geometric sum of values and .
The values of sensitivity coefficients were determined as the partial derivatives of measurement function in regard to particular variables given with Equation (4). After carrying out the calculations, we got an expression for the value of combined uncertainty :
When estimating the measurement uncertainty of investigated analyser, the following factors should be taken into account:
- Measurement standard uncertainty of difference in measurement result and the value of reference quantity for distorted signal ;
- Measurement standard uncertainty connected with the resolution of analyser indications during distorted signal measurement ;
- Measurement standard uncertainty of difference in measurement result and the value of reference quantity for sinusoidal signal . Because the expected value is equal to zero, randomization is done on a random variable with measurement uncertainty . Measurement standard uncertainty, with normal distribution assumed, according to the uncertainty propagation law, is given with Equation (6):Uncertainty determined in that way is associated with the instability of indications of the investigated analyser for sinusoidal signal. Combined standard uncertainty of measuring distorted signal is expressed with dependence (7):
- Measurement standard uncertainty connected with the resolution of analyser indications during the measurement of sinusoidal signal ;
- Standard uncertainty connected with the limiting error of reference standard .
Standard uncertainties associated with the resolution of analyser indications, with rectangular distribution assumed, can be determined from Formula (8):
where defines the resolution of investigated analyser.
All the components of expanded uncertainty listed above were determined and included in the final uncertainty budget. The expanded uncertainty of measurement result was determined according to recommendations contained in document [16]. Its value was determined based on the uncertainty propagation law, and the analysis took into account the scatter of measurement results, resolution of investigated analyser, as well as inaccuracy of calibrator and the waveform generator. The given uncertainty values constitute the expanded uncertainty with assumed confidence level equal to ≈95% and coverage factor k = 2. The developed uncertainty budget takes into account all identified component uncertainties estimated with methods A and B, and also those with values estimated as zero. Such information means that a given component of uncertainty was analysed, and assuming its zero value is justified with measurement conditions [17]. Table 4 presents an example of uncertainty budget for a waveform composed of a sum of two signals: basic harmonic and selected higher harmonic. When all the components were taken in the uncertainty budget, it was possible to determine which component uncertainties had the biggest participation in combined uncertainty—i.e., to indicate directions for improving the measurement, which would lead to a considerable decrease in combined uncertainty. In order to assure measurement traceability, the calibration results were referred to reference standards of the Main Office of Measures (GUM):
Table 4.
Uncertainty budget for signal with selected higher harmonics.
- Units of measure of electric voltage by using calibrators;
- National standard of units of time and frequency measures, maintained in GUM using a frequency generator.
3. The Phenomenon of Spectrum Leakage
According to the standard [13], the discrete Fourier transformation (DFT) is applied to analyse the harmonics. This is a Fourier transformation changing a signal into the form of a sequence of samples from the domain of time into the domain of frequency. However, the implementation of the DFT algorithm is not sufficiently fast. Therefore, an algorithm of fast Fourier transformation (FFT) is commonly applied. In order to carry out a full Fourier analysis using the DFT or FFT algorithm, an infinite number of samples of measured signals is necessary. Then, it is possible to find the whole spectrum of the considered signal. However, the observation is finite, so the number of samples is also finite. This fact results in the analysis of a finite value of the frequency of the considered signal. According to the recommendations of standard [2], the frequency analysis of voltage is carried out for the first 40 harmonics. Thus, a finite number of samples is sufficient. The process of signal sampling is controlled by the signal acquisition block together with an A/D converter. Theoretically, it is a product of the examined function and a comb function, which is a Dirac delta function. The process of selecting a finite number of samples is controlled by time windows. The notion of time window should be understood as function w(n) that describes the method of taking signal samples with a finite interval of values different from zero. Assuming that a certain signal u(n) is observed, a result of the observation, using a time window, is a signal g(n) given with Equation (9):
Spectrum leakage phenomenon is strictly related to the time window—i.e., to the window in which the measurement is done. It occurs when the duration of the measuring window is not a total multiplicity of the period of the considered signal. Further, part of the paper presents the influence of applied measuring window onto the spectrum leakage phenomenon. The measurements were carried out in a designed and constructed measuring system, shown in Figure 1. A simplest measuring window—i.e., a rectangular window, was considered; it is applied in a majority of power quality analysers, and it is recommended by the standard [13]. Rectangular window is given with Equation (10):
where N denotes a finite number of samples.
The spectrum of function w(n) presented above is an interpolation function sinc(t)—sinus cardinalis—defined by Equation (11):
The transform of the product of two functions in the domain of time is a convolution of those functions in the domain of frequency. The effect of such operation is that side lobes occur in the considered signal. When the duration of measuring window is not a total multiple of the period of the primary signal considered, as a result of the occurrence of the side lobes of the considered signal, the spectral lines will be extended. This effect is named spectrum leakage phenomenon. In order to illustrate the spectrum leakage phenomenon, we are going to consider a sinusoidal signal. The result of discrete Fourier transformation can be identified with the sampling of continuous convolution of the considered signal spectrum and the measuring window. The sinusoidal signal spectrum with a frequency of is composed of two spectral lines in values . The convolution spectra of sinusoidal and rectangular signals with duration equal to the total multiple of the period of considered signal are presented in Figure 2. In such a case, a non-zero sample of the convolution spectrum for a frequency is equal to the fundamental frequency of the signal. The remaining samples will be taken in the zeros of the sinc(t) function. When the window is not an total multiple of the examined signal period, the spectrum convolution samples will be taken in different values of the sinc(t) function, which is presented in Figure 3. In the situation shown in Figure 3, the phenomenon defined as spectrum leakage occurs; its consequence is a strong disturbance at the window edge, and in practice the spectrum leakage causes changes in values and displacements of higher harmonics. Moreover, spectral lines, being subharmonics and interharmonics, can appear.
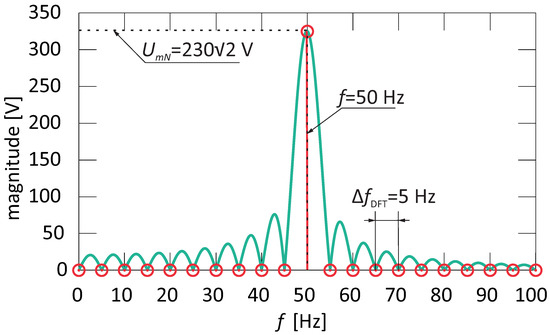
Figure 2.
Convolution spectrum of sinusoidal signal with frequency f = 50 and rectangular signal with duration equal to a total multiple of sinusoidal period, ( = 5).
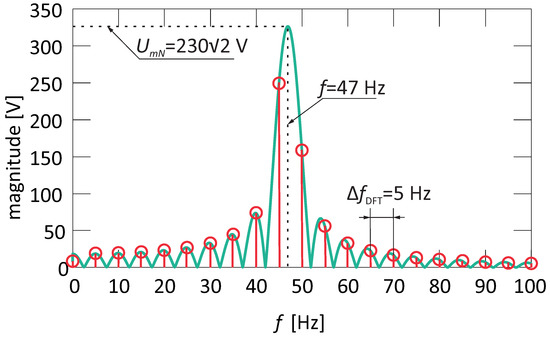
Figure 3.
Convolution spectrum of sinusoidal signal with frequency f = 50 and rectangular signal with duration equal to not a total multiple of sinusoidal period, ( = 5).
In order to minimalize this effect, it is possible to apply measuring windows different than rectangular, which will ensure signal suppression at the window edge. The problem of determining the values of harmonics and related errors, for different values of frequency f, is a complex measurement task. The raised issues are discussed in a number of publications [18,19,20,21,22,23]. In the publications [24,25,26,27,28,29] the authors describe methods for improving the FFT algorithm when thefrequency changes, with the use of the developed algorithms, while in the publications [30,31,32] the authors present their own approach to solving the problem—i.e., they propose to use a “Flat Top” window in FFT analysis instead of using a basic rectangular window. The publications [33,34] present a method for analysing harmonics for selected time windows, with the use of Matlab.
4. The Examples of Time Windows
As pointed out before, standard [13] recommends a rectangular window synchronized with voltage slope measuring for discrete Fourier transform DFT with time =10/, in the systems for which value is equal to 50. The Hanning window should be used only in the case of lost synchronization. However, in practice, different types of time windows are applied, with non-zero values for finite numbers of samples, where n denotes the number of a sample (n = 0, 1, …, ). Time windows are examined, and their successive samples are multiplied with successive samples of the analysed signal, according to Equation (9). Because the shape of their spectrum strongly influences the properties of the performed analysis, they are frequently named spectrum windows. Definitions and parameters for a few selected time windows are shown in publications [35,36]. In the present paper, the authors limit themselves to present the following windows:
Figure 4 presents the shapes and spectra of selected time windows. The effect of the spectrum leakage phenomenon on power quality measurement for selected time windows, and for an example of class B analyser, is presented in publication [37].
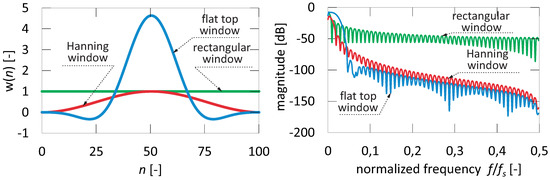
Figure 4.
Shapes (on left) and spectra (on right) of windows: rectangular, Hanning and flat top.
5. Experimental Research on Influence of the Spectrum Leakage
During the experiments, higher harmonics of voltage were measured, including the spectrum leakage in the range of acceptable power frequency changes. A three-phase class A analyser PQ-Box 100 was subjected to research in a designed and constructed measuring system presented in Figure 1. Higher harmonics were measured for triangle testing signal described with Equation (1). The research was carried out for the following frequency values of the considered signal: (47 and 52)—extreme acceptable frequency voltage values in a power grid per annum—and (49.9 and 50.1)—extreme values of voltage frequency deviation in practice, presented in Figure 5.
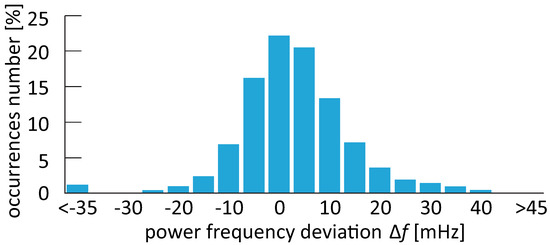
Figure 5.
Power frequency deviations in year 2018 [38].
According to the presented description of spectrum leakage phenomenon, the effect will occur when the measuring window is not matched to the period of the considered signal. According to [13], it is recommended to use a measuring window equal to 200. In such a case, the negative phenomenon will not occur. However, the power frequency is not constant. The measurements carried out aim at determining the influence of spectrum leakage regarding the changes in voltage frequency of the power grid which the service provider allows over the year. To describe the problem of spectrum leakage, in the process of power quality evaluation, errors were determined in relation to individual measure and total measure, characterizing higher harmonics. In the case of individual measure, a relative error given by Equation (14) was used:
where: is the RMS of particular harmonics determined by the analyser, and is the RMS determined from the expansion of the function into a trigonometric Fourier series. In the case of total measure, a relative error given by Equation (15) was used:
where: is the value of THD factor determined by the analyser, and is the value of THD factor determined on the basis of the expansion of the function into a trigonometric Fourier series.
The measurement results obtained for the higher harmonics of this function were very similar (with an accuracy of device resolution), regardless of signal frequency changes in the range of 47 to 52 . Therefore, in the present paper only the measurement results for the frequencies of 47, 50 and 52 are included.
Based on the determined error values, the characteristics of were presented in a diagram, depending on the frequency of the considered signal, in Figure 6 and Figure 7, respectively.
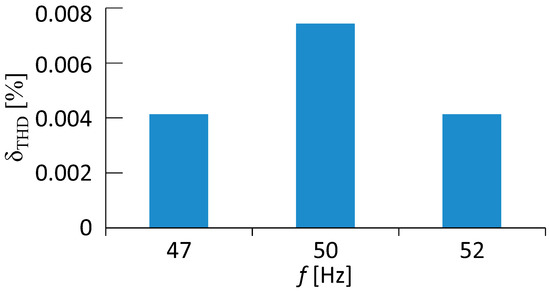
Figure 6.
Error value distributions depending on the examined signal frequency f.
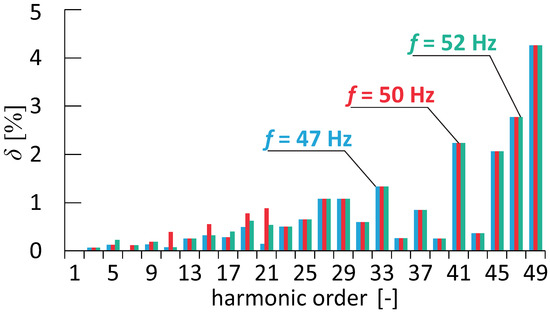
Figure 7.
Error value distributions of particular odd harmonics for different frequency values, where blue bars are the results for voltage with a fundamental frequency of 47; red bars are the results for a voltage with a fundamental frequency of 50; green bars are the results for a voltage with a fundamental frequency of 52.
Based on the measurement results, it is possible to formulate a conclusion that the considered analyser PQ-Box 100 during the measuring of higher harmonics is indifferent to the frequency variations of considered signal in the given range. However, when applying even the algorithm given in standard [13], the effects of spectrum leakage should be noticeable. It is the subject of simulation research described in the next chapter of the paper. On this basis, we can conclude that the measuring device has an additional algorithm implemented, which makes it possible to avoid the effects of an unmatched measuring window.
In order to confirm the above argument, additional research was carried out. The frequency of the considered signal was decreased by 1, until the effect of spectrum leakage was visible. For this purpose, an online measurement was applied with the use of a PC. Online measurement is the analyser measurement mode, allowing us to view the measured parameters in the real time. In this mode, it is possible to perform a detailed analysis of many parameters measured by the power quality analyser, which are not registered in offline mode and are not saved in the memory of the measuring and recording device. The noted threshold value of the frequency was 41. Up to this value, inclusive, the spectrum of the considered signal was unchanged. In contrast, when the signal frequency amounted to 40, the analyser did not measure the frequency correctly, and the effect of spectrum leakage became visible. The described situation was repeated when the frequency of the considered signal was increased. The upper limit was the frequency value equal to 70. It can be concluded that the algorithm eliminating the effect of not matched window is directly related to the measurement of signal frequency by the analyser. During the online research, the sinusoidal signal spectrum observed on a PC, with a frequency change in a range of 41 to 70, was always composed of one spectral line for frequency f equal to 50. An example of screen for the given situation is presented in Figure 8, where a single spectral line is visible for f = 50, although the considered signal is a sinusoidal signal with the frequency equal to 41 and the RMS equal to 30.
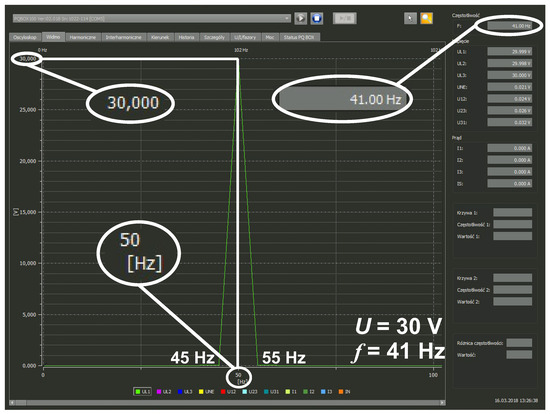
Figure 8.
Online measurement screen of signal spectrum with voltage value U = 30, and frequency f = 41 (no visible spectrum leakage effect).
When the above mentioned threshold value 41 or 70 is exceeded, the analyser does not detect the frequency of the considered signal, and the effect of spectrum leakage is visible in the spectrum observed online. A few such cases occurred randomly as a result of research repeated many times. The highest spectral line occurred at the frequency of f = 50 for signal frequency equal to 40 or 71, at the frequency of f = 30 for signal frequency equal to 40, or at the frequency of f = 85 for signal frequency equal to 71. It must be pointed out, however, that, in real power grids, substantial deviations from the nominal frequency value do not occur. Figure 9 and Figure 10 present examples of two cases of such measurements.
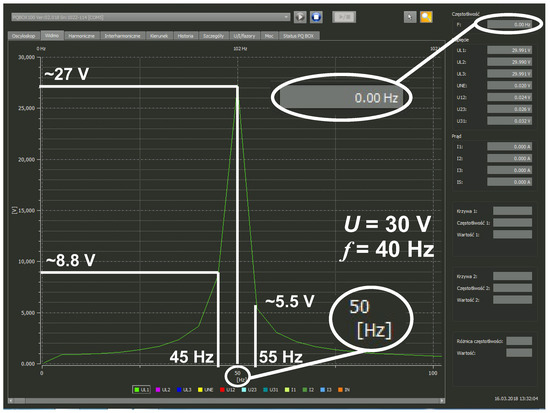
Figure 9.
Online measurement screen of signal spectrum with voltage value U = 30, and frequency f = 40 (visible spectrum leakage effect—case I).
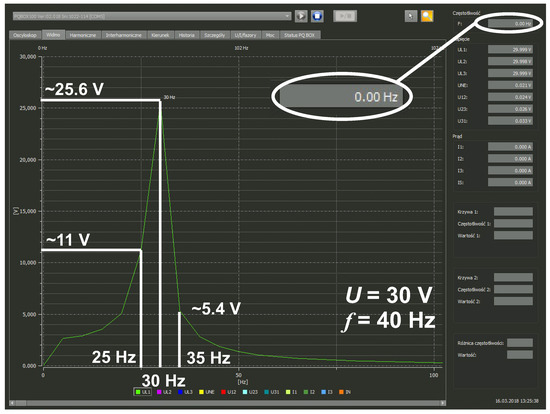
Figure 10.
Online measurement screen of signal spectrum with voltage value U = 30, and frequency f = 40 (visible spectrum leakage effect—case II).
Reassuming, it must be concluded that, during the measurement of higher harmonics, the considered analyser is indifferent to the spectrum leakage phenomenon in the range of acceptable frequency changes per annum. Moreover, the research indicates that there is an algorithm, implemented in the device, correcting the effect of the unmatched window on the measurement result. Despite some attempts to obtain information about the applied software from the manufacturer of the device, the manufacturer has not made available the detailed data, invoking trade secret.
6. Simulation Research on Influence of the Spectrum Leakage
For the purpose of present paper, simulations were carried out for the triangle signal, which was used in the measurement part, for the same frequency values. In order to evaluate the quality of eliminating the spectrum leakage, the time windows described in the paper were selected—the Hanning window and the flat top window. In practice, according to the standard [13], the effects of spectrum leakage are minimised through subgrouping the harmonics of the h-th order, according to Equation (16):
where: is RMS of the h-th subgroup, and is the RMS of k-th DFT result.
Therefore, the solutions proposed by the authors are compared with the subgroup method. The methods were compared using a simulation software developed in the Matlab environment. Figure 11 presents the simulation results depicting the value of error in the function of odd harmonics, for the considered values of frequency f. Because of significant differences in the values of error for particular windows, the vertical axis was divided, as if “dissected” in the diagrams, for better visualisation of the differences.
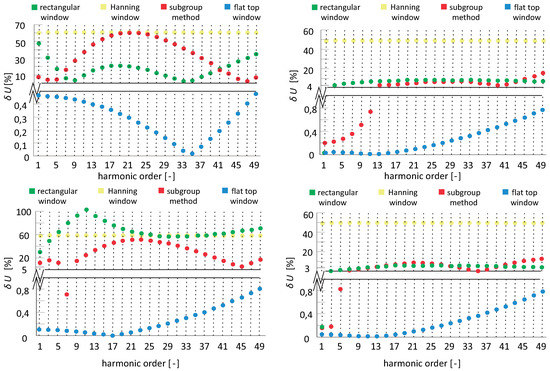
Figure 11.
Dependence of relative error on the function of harmonic order, for frequencies: f = 47 (top left), f = 49.9 (top right), f = 52 (bottom left), f = 50.1 (bottom right).
Analysing the results obtained for the triangle signal, we can conclude that due to the fact that successive harmonics decrease in inverse proportion to the order square, the measurement error of higher harmonics takes significant values and is many times bigger than for other functions analysed by the authors. Based on the obtained simulation results, it is possible to formulate a conclusion that, because of its properties, the flat top window eliminates the negative effects of spectrum leakage in the best way among all the discussed methods. The other proposed windows, because of low accuracy regarding typical frequency changes, are useless in practical applications from the point of view of power quality evaluation.
7. Conclusions
The paper presents a measuring stand dedicated to investigate a measurement and settlement system; a lot of research on RMS of voltage and THD was carried out in this stand, with the use of selected testing signals. The metrological analysis of obtained measurement results allowed for the drawing of final conclusions. The determined values of measurement uncertainty for examples of testing signals of PQ-Box 100 analyser are smaller than the uncertainty values declared by the manufacturer, defined in [2]. The results of experimental and simulation research was presented in the paper, concerning the problem of spectrum leakage in the process of power quality evaluation. Matlab software was applied to simulation research. A triangle testing signal with a known function description was examined, for which it was possible to analytically determine particular harmonics, using an expansion of the function into the trigonometric Fourier series. For that reason, it was possible to determine errors resulting from the phenomenon of spectrum leakage. The paper refers to the frequency values possible in power grids in the process of power energy quality evaluation. Based on the research carried out with the PQ Box 100 analyser, it is possible to conclude that there are no effects of the spectrum leakage phenomenon which is characterized with errors of measuring the higher harmonics. For acceptable frequency deviations of the considered signal, the device always indicated approximately the same results, which differed from the accurate values by an error at the level of measuring device resolution. The simulation results indicate that, for the considered analyser, an additional algorithm was applied causing a limitation in the results of spectrum leakage. To this end, the behaviour of the measuring device was tested online for significant frequency deviations from the value of f = 50. That way, a relation between the frequency measurement by the device and the accuracy of measuring higher harmonics was observed. Regretfully, the manufacturer does not share any information about the algorithm reducing the effects of spectrum leakage phenomenon.
With the use of Matlab, simulations were done for different time windows available in the literature; the simulations were then compared with the subgroup method. The research and simulation results indicate a negative effect of the spectrum leakage phenomenon in the process of power quality evaluation, when using a rectangular window and subgroup method. A consequence of this phenomenon is a significant increase in the values of errors when measuring higher harmonics. The number of errors increases when the order of harmonic increases. Moreover, the value of the basic harmonic decreases. Consequently, it can give rise to a wrong interpretation of the considered signal.
Author Contributions
All authors contributed in the preparation of this manuscript. Conceptualization, P.K. and P.O.; methodology, P.K. and P.O.; software, P.K.; validation, P.K. and P.O.; formal analysis, P.O.; investigation, P.K. and P.O.; resources, P.K. and P.O.; data curation, P.K. and P.O.; writing—original draft preparation, P.K. and P.O.; funding acquisition, K.W. All authors have read and agreed to the published version of the manuscript.
Funding
This research received no external funding.
Conflicts of Interest
The authors declare no conflict of interest.
References
- Decree of Ministry of Economy on Detailed Conditions of Power System Operation. 2007. Available online: http://isap.sejm.gov.pl/isap.nsf/DocDetails.xsp?id=wdu20070930623 (accessed on 13 October 2020).
- Standard IEC 61000-4-30:2015. Testing and Measurement Techniques—Power Quality Measurement Methods; International Electrotechnical Commission: Geneva, Switzerland, 2015. [Google Scholar]
- Otomanski, P. The applications of the Power Quality Analyser to determine of parameters describing electric power quality. In Proceedings of the 6th International Conference on Measurement—MEASUREMENT 2007, Smolenice, Slovakia, 20–24 May 2007; pp. 288–291. [Google Scholar]
- Otomanski, P.; Wiczynski, G. Search for disturbing loads in power network with the use of voltage and current fluctuation. In Proceedings of the 2010 International School on Nonsinusoidal Currents and Compensation, Lagow, Poland, 15–18 June 2010; pp. 197–200. [Google Scholar]
- Otomanski, P.; Wiczynski, G. The usage of voltage and current fluctuation for localization of disturbing loads supplied from power grid. Prz. Elektrotech. 2011, 87, 107–111. [Google Scholar]
- Kuwalek, P. The Application of Kernel Density Estimation for Aided the Process of Locating Sources of Voltage Fluctuations. Prz. Elektrotech. 2019, 95, 70–74. [Google Scholar]
- Kuwalek, P. AM Modulation Signal Estimation Allowing Further Research on Sources of Voltage Fluctuations. IEEE Trans. Ind. Electron. 2020, 67, 6937–6945. [Google Scholar] [CrossRef]
- Kuwalek, P. Estimation of Parameters Associated with Individual Sources of Voltage Fluctuations. IEEE Trans. Power Deliv. 2020. [Google Scholar] [CrossRef]
- Wiczynski, G. Determining location of voltage fluctuation source in radial power grid. Electr. Power Syst. Res. 2020, 180, 106069.1–106069.10. [Google Scholar] [CrossRef]
- Wiczynski, G. Voltage-Fluctuation-Based Identification of Noxious Loads in Power Network. IEEE Trans. Instrum. Meas. 2009, 58, 2893–2898. [Google Scholar] [CrossRef]
- Kuwalek, P.; Otomanski, P. Applications of Fourier series to determine the measurements error of harmonics with selected power quality analysers. In Proceedings of the 2017 11th International Conference on Measurement, Smolenice, Slovakia, 29–31 May 2017; pp. 15–18. [Google Scholar]
- International Vocabulary of Metrology—Basic and General Concepts and Associated Terms (VIM); 2008 JCGM 100; BIPM: Sèvres, France, 2008.
- Standard IEC 61000-4-7. Testing and Measurement Techniques—General Guide on Harmonics and Interharmonics Measurements and Instrumentations, for Power Supply Systems and Equipment Connected Thereto; International Electrotechnical Commission: Geneva, Switzerland, 2009. [Google Scholar]
- Otomanski, P.; Zazula, P. Experimental verification of metrological properties of power quality analyser. In Proceedings of the 10th International Conference on Measurement, Bratislava, Slovakia, 25–28 May 2015; pp. 35–38. [Google Scholar]
- Evaluation of Measurement Data—Guide to the Expression of Uncertainty in Measurement; JCGM 100:2008; BIPM: Sèvres, France, 2008.
- EA-4/02 M:2013 Evaluation of the Uncertainty of Measurement in Calibration; European Cooperation for Accreditation: Amsterdam, The Netherlands, 2013.
- Skubis, T. Basics of Metrological Analysis of Measurement Results; Silesian University of Technology Academic Press: Gliwice, Poland, 2004. [Google Scholar]
- Bartman, J.; Kwiatkowski, B. The influence of measurement methodology on the accuracy of electrical waveform distortion analysis. Meas. Sci. Rev. 2018, 18, 72–78. [Google Scholar] [CrossRef]
- Antic, B.M.; Mitrovic, Z.L.; Vujicic, V.V. A method for harmonic measurement of real power grid signals with frequency drift using instruments with internally generated reference frequency. Meas. Sci. Rev. 2012, 12, 277–285. [Google Scholar] [CrossRef][Green Version]
- Szolik, I.; Kovac, K.; Smiesko, V. Influence of noncoherent sampling upon an error of power quality parameters measurement. Meas. Sci. Rev. 2005, 5, 35–38. [Google Scholar]
- Szolik, I.; Kovac, K.; Smiesko, V. Influence of digital signal processing on precision of power quality parameters measurement. Meas. Sci. Rev. 2003, 3, 35–38. [Google Scholar]
- Mindykowski, J.; Tarasiuk, T. Problems of power quality in the wake of ship technology development. Ocean Eng. 2015, 107, 108–117. [Google Scholar] [CrossRef]
- Kitzig, J.P.; Schlaghecke, S.; Bumiller, G. Accuracy of power quality measurement based on interpolated sampling. In Proceedings of the 2018 IEEE PES Innovative Smart Grid Technologies Conference Europe (ISGT-Europe), Sarajevo, Bosnia-Herzegovina, 21–25 October 2018; pp. 1–6. [Google Scholar]
- Shen, T.; Li, H.; Zhang, Q.; Li, M. A novel adaptive frequency estimation algorithm based on interpolation FFT and improved adaptive notch filter. Meas. Sci. Rev. 2017, 17, 48–52. [Google Scholar] [CrossRef]
- Petrovic, P. Frequency and parameter estimation of multi-sinusoidal signal. Meas. Sci. Rev. 2001, 12, 175–183. [Google Scholar] [CrossRef]
- Shuai, Z.; Zhang, J.; Tang, L.; Teng, Z.; Wen, H. Frequency shifting and filtering algorithm for power system harmonic estimation. IEEE Trans. Ind. Inform. 2019, 15, 1554–1565. [Google Scholar] [CrossRef]
- Jin, T.; Chen, Z.; Flesch, R.C.C. A novel power harmonic analysis method based on Nuttall-Kaiser combination window double spectrum interpolated FFT algorithm. J. Electr. Eng. 2017, 68, 435–443. [Google Scholar] [CrossRef]
- Zhang, J.; Wen, H.; Teng, Z.; Martinek, R.; Bilik, P. Power system dynamic frequency measurement based on novel interpolated STFT algorithm. Power Eng. Electr. Eng. 2017, 15, 365–375. [Google Scholar] [CrossRef]
- Fu, Z.; Wang, J.; Ou, Z.; Yhou, G.; Bai, F.; Yhao, X. The VPF harmonic analysis algorithm based on quasi-synchronous DFT. Open Electr. Electron. Eng. J. 2017, 11, 117–124. [Google Scholar] [CrossRef][Green Version]
- Deng, J.; Lam, C.S.; Wong, M.C.; Sin, S.W.; Martins, R.P. Instantaneous power quality indices detection under frequency deviation environment. IET Sci. Meas. Technol. 2019. [Google Scholar] [CrossRef]
- Kamble, S. Estimation of various PQ indices at point of common coupling using empirical wavelet transform. IET Sci. Meas. Technol. 2019, 13, 862–873. [Google Scholar] [CrossRef]
- Jain, S.K. Algorithm for dealing with time-varying signal window for harmonics estimation. IET Sci. Meas. Technol. 2015, 9, 1023–1031. [Google Scholar] [CrossRef]
- Zhongyu, H.; Qiang, Y.; Songlin, H. Harmonic analysis of power system based on Matlab. In Proceedings of the 4th Conference MACMC 2017, Xi’an, China, 27–29 November 2017; pp. 621–624. [Google Scholar]
- Wen, H.; Teng, Z.; Wang, Y.; Hu, X. Spectral correction approach based on desirable sidelobe window for harmonic analysis of industrial power system. IEEE Trans. Ind. Electron. 2013, 60, 1001–1010. [Google Scholar] [CrossRef]
- Zielinski, T.P. Digital Signal Processing; Faculty of Electrical Engineering, Automatics, Computer Science and Electronics of the AGH University of Science and Technology: Kraków, Poland, 2002. (In Polish) [Google Scholar]
- Kuwalek, P. The Problem of Spectrum Leakage in the Measurement of Harmonics. ITM Web Conf. 2019, 28, 01044. [Google Scholar] [CrossRef]
- Kuwalek, P.; Otomanski, P. The effect of the phenomenon of “Spectrum Leakage” on the measurement of power quality parameters. In Proceedings of the 2019 12th International Conference on Measurement, Smolenice, Slovakia, 27–29 May 2019; pp. 70–73. [Google Scholar]
- Polish Power System PSE. Distribution of Hourly Frequency Deviations—Report for 2018; Polish Power System PSE: Warsaw, Poland, 2019. [Google Scholar]


© 2020 by the authors. Licensee MDPI, Basel, Switzerland. This article is an open access article distributed under the terms and conditions of the Creative Commons Attribution (CC BY) license (http://creativecommons.org/licenses/by/4.0/).