Abstract
As a critical transportation infrastructure, with a high flow of people and high-energy consumption in China, coach stations have great potential in energy saving and CO2 emission reduction. In this paper, the building information and energy consumption data of 29 coach stations in five climate regions of China were obtained by field investigations. The annual total comprehensive building energy consumption was 31.37–128.08 kWh/(m2·a). The annual total CO2 emissions from building operation in the coach stations was 17.01–134.77 kgCO2/(m2·a). The heating, ventilation and air conditioning (HVAC) system was the largest energy using and CO2 emissions sector: 30.42–72.47% of the energy consumption and 30.42–83.93% of the CO2 emissions were generated by HVAC system. The energy consumption and CO2 emission level of coach stations and that of other kinds of public buildings were compared. Results showed that the energy consumption and CO2 emission levels of coach stations investigated were relatively low, mainly because the passenger thermal comfort was scarified. Based on the investigation data, energy consumption analysis models of coach stations in five regions were established by simulation when the passenger thermal comfort was met. The potentials of energy saving and CO2 emission reduction were studied from forms of the HVAC system, heat recovery and natural illumination.
1. Introduction
As the second-largest energy consumer and the largest CO2 emitter, China faces great challenges in energy saving and emission reduction [1,2]. According to the “13th Five-Year Comprehensive Work Plan for Energy Saving and Emission Reduction” in China, by 2020, the annual total energy consumption per 10,000 yuan of the Gross Domestic Product (GDP) should be reduced by 15%. In addition, the CO2 emission intensity in 2020 should be reduced by 40–45% [3]. For these purposes, as the two major energy-using and emission sectors, the transportation and building industry have been regarded as priorities of energy saving and emission reduction by the government [4,5]. In the transportation industry, highway passenger transportation takes up a pivotal role [6]. From 2010 to 2017, the mileage of highway constructed in China has increased by 20%. At the end of 2017, the annual passengers of highway transportation reached 14.57 billion people, which took up 80% of the total; moreover, the revenue passenger kilometers exceeded 976 billion person–kilometers [7]. With the development of highway passenger transportation, the number of coach stations has increased rapidly in recent years, and will increase by at least 50% in the next few years [8]. As large transportation hub buildings for passengers to rest and wait for coaches, coach stations are both important infrastructures for highway passenger transportation and large public buildings in the building industry, which have higher occupancy, higher energy consumption, and CO2 emissions than other kinds of public buildings. Moreover, most of the coach stations in China were built 10–20 years ago; the heat insulation performance of the building envelope is poor, since the earlier energy saving design standards were followed. The energy efficiency level of HVAC (Heating, Ventilation and Air Conditioning) equipment is low, resulting in high-energy consumption and CO2 emissions from the building operations of coach stations. Therefore, it is urgent for the government to understand the status and structure of energy consumption and the operating conditions of equipment in the stations in order to realize the targets of energy saving and CO2 emission reduction. Because of the large space, high window-to-wall ratio, large demand of fresh air, and different operation strategies, the energy consumption structure and CO2 emission levels of coach stations are different from other kinds of public buildings, indicating that energy saving measures and emission reduction should be studied based on the characteristics of coach stations.
Related research on energy consumption of coach stations were mainly qualitative analyses on influencing factors and establishment of energy consumption assessment systems. Eighteen influencing factors of the energy consumption of coach stations were analyzed by analytic hierarchy processes with group decisions; the weights of each factor were then calculated and ranked to determine the evaluation indices [9]. For establishing green coach station assessment systems, seven evaluation indices, concerning energy saving, water saving, and operation were selected [10]. Research on quantitative analysis of energy consumption of coach stations was not abundant. Based on the questionnaire, concerning the investigation of coach stations in five climate regions of China, the values, 20% above and below average total energy consumption per 100 passengers of each region, were selected as common (and excellent) indicators of energy consumption assessment, respectively [6]. There have been few studies focused on energy consumption structure and energy saving analysis of coach stations compared with other types of public buildings.
Most research on the energy consumption of public buildings was based on detailed field investigations on energy consumption of each energy-using sector. The annual total energy consumption of airport terminals and railway stations was 206.3 and 115.7 kWh/(m2·a), respectively [8]. The sub-item annual power consumption of eight railway stations in different climate regions in China were obtained, results showed that the HVAC system was the largest energy-using sector. The energy saving potential was analyzed from climate characteristics, natural lighting, and natural ventilation [11]. It was indicated that more than 40% of the total energy consumption was expended by air conditioning systems for airport terminals in China [12]. Energy consumption data of 29 airport terminals in Greece were obtained; comparison of energy consumption levels was conducted between airport terminals and other types of public buildings. The energy conservation potential was analyzed on three airport terminals, among them, in detail, around the premise that indoor environmental quality was met [13].
The energy saving potential of the public buildings were mainly studied on the HVAC system [14,15] and lighting system [16,17]. Energy saving effect under different forms of air conditioning systems, lighting power, and heat transfer coefficient of the envelope was studied by simulation, based on energy consumption data of public buildings in Tianjin [18]. According to the benchmarking index system established by H. Li, et al. [19], the energy saving measures were developed mainly from reasonable ventilation cooling load and improvement of air conditioning system energy performance.
The vehicle exhaust and the building operation are the main sources of CO2 emissions in coach stations. Research of the vehicle emissions in transportation terminals was most concentrated on pollutant emissions of vehicle exhaust and its negative effects on the indoor environment of the terminals [20,21]. According to research on a coach station with 30,000 daily passengers in cold region of China, annual pollutant emissions (CO and PM2.5) from vehicle exhaust were 0.43t/a in the coach station [22]. In a coach station, in a hot summer and cold winter region in China, the CO2 emissions from building operations accounted for 47.25% of the total CO2 emissions [23]. It is indicated that the CO2 emissions from building operations are the critical part of the total CO2 emissions in the transportation terminals.
Research on CO2 emissions from the building operation in other kinds of public buildings were abundant. The CO2 emissions of the public buildings are mostly calculated by using CO2 emission factors of each energy type, based on the investigation results of the energy types and quantities used in the buildings. The CO2 emission intensity of all kinds of public buildings were 51 kgCO2/(m2·a) on average in China in 2020, excluding the CO2 emissions of heating in northern cites [24]. The HVAC system and lighting system were the two largest parts of CO2 emissions for building operations [25]. More than 30 measures and strategies of CO2 emission reduction in commercial buildings were summarized in [26], half of which were related to the HVAC system and lighting system. Moreover, there was a positive correlation between CO2 emissions and energy consumption, indicating that the measures of CO2 emission reduction and energy saving can complement each other.
In this paper, the energy consumption and CO2 emissions from building operations in coach stations were investigated and analyzed. The potentials of energy saving and CO2 emissions reduction were studied, which fills in the gap in the energy consumption and CO2 emissions data of coach stations in China and provides data support for energy saving and CO2 emission reduction of various transportation hub buildings. Twenty-nine coach stations in five climate regions of China were investigated. Detailed information of building instruction, HVAC systems, energy consumption, and CO2 emissions were obtained. Energy consumption and CO2 emission levels of coach stations were compared with that of other kinds of public buildings. Thermal environment tests were conducted in waiting halls of three coach stations in the hot summer and warm winter, severe cold, and cold regions. According to the field investigation data, energy consumption analysis models of coach stations in five climate regions were established by simulation when the passenger thermal comfort was met, then the annual energy consumption and CO2 emissions were analyzed. The potentials of energy saving and CO2 emissions reduction of coach stations were studied from forms of the HVAC system, heat recovery, and natural illumination.
2. Energy Consumption Investigation
2.1. Basic Information
Field investigation was conducted on 29 coach stations in five regions, including the severe cold region, cold region, hot summer and cold winter region, hot summer and warm winter region, and mild region of China, as shown in Figure 1 [27]. The climate regions are divided based on the average temperature in the coldest and hottest month. The thermal performance of the buildings should meet the requirements for each climate region. In severe cold and cold regions, the average temperature of the coldest month is below 0 °C, and the average daily temperature for more than 3 months is less than 5 °C. Therefore, the heating in winter must be ensured, while the air conditioning in summer is mainly considered in some areas of a cold region. In hot summer regions, the average temperature of the hottest month is above 25 °C, indicating that the heat protection in summer is of vital importance. The heating in winter is generally not considered in hot summer regions because the average temperature of the coldest month is above 0 °C. Due to the comfortable climate and relatively small annual temperature range, the heat protection of the buildings in the mild region can be ignored.
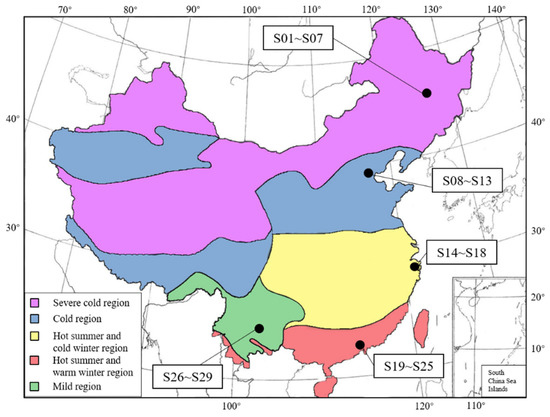
Figure 1.
Climate regions of coach stations investigated.
The investigation on coach stations included the following four aspects: (a) basic information about building construction, including building age, area, and envelope parameters, etc.; (b) operation information, including annual passengers and operating time, etc.; (c) energy bills, including categories of energy used in the station and the monthly and annual energy consumption; (d) information of lighting and electrical equipment, especially in a waiting hall, office room, and equipment room. Coach stations in China usually have two or three floors. External walls of coach stations investigated mainly use glass curtain walls. The coach stations are open all year round with an average operating time of 11 hours per day, and the annual passengers are about 1.14 million people. Due to the high frequency of departures and long operating times, the density of people in coach stations is high; hence, HVAC systems are of particular importance to ensure the indoor environment. Detailed information about annual passengers, building areas, and HVAC systems of coach stations investigated are listed in Table 1. In the severe cold region, the forms of heat sources are all district heating; the heating systems are mainly radiators and radiant floor heating systems. The air-conditioners are rarely equipped; the waiting halls of these stations are only ventilated by electric fans in the summer. In the cold region, centralized air conditioners are used for air conditioning and heating in most stations. However, heating systems are seldom operated in winter in some coach stations of the cold region. In hot summer regions, only equipment for air conditioning are installed. Centralized air-conditioners are mainly used in the waiting halls and split air-conditioners in the office rooms. In the hot summer and cold winter region, the cold sources used in the coach stations are various. In the hot summer and warm winter region, only water-cooled chillers and split air-conditioners are used as the cold sources in the coach stations. There are no HVAC systems equipped in coach stations of mild regions because of the comfortable climate conditions.

Table 1.
Information of coach stations.
2.2. Energy Consumption and CO2 Emissions
Various types of energy consumption consumed in coach stations are converted to equivalent electricity consumption, according to GB/T 34913-2017 [28]. The CO2 emissions from building operations in coach stations are calculated by Equation (1) [29].
where CM is annual total CO2 emissions (tCO2), Ei is the consumption of the ith energy type (t, m3 or GJ), EFi is CO2 emission factor of ith energy type (tCO2/t, tCO2/m3, or tCO2/GJ), i is the number of energy type. Since the main forms of energy used in coach stations investigated are natural gas, municipal hot water, and electricity, the CO2 emission factor of each energy type is introduced as Equations (2) and (3).
where EFhw is CO2 emissions factor of municipal hot water (tCO2/GJ), FCi is the consumption of ith energy type for heating in 2017 (t or 104m3), is CO2 emission factor of ith energy type (tCO2/t or tCO2/104m3), HG is the heating capacity of heating system in 2017 (1010kJ), i is number of energy type, EFe is CO2 emissions factor of electricity (tCO2/kWh), EFgrid,OM is operating margin emission factor (tCO2/kWh), EFgrid,BM is build marginal emission factor (tCO2/kWh). The CO2 emission factor of natural gas can be obtained from [30].
The annual total comprehensive energy consumption and CO2 emissions per unit area are shown in Figure 2. The annual average comprehensive energy consumption is 79.03, 58.21, and 39.51 kWh/(m2·a) in severe cold and cold regions, hot summer regions, and mild region, respectively. The HVAC system is the largest energy-using part in coach stations, which takes up 30.42–72.47% of the total energy consumption. In the severe cold region, the energy consumption of heating systems is 53.49 kWh/(m2·a) on average, which takes up 62% of the total energy consumption. The energy consumption of air conditioning systems is 4.91 kWh/(m2·a), which is 61.5% lower than that in the cold region, because the air-conditioners rarely operate in the coach stations of the severe cold region. In the cold region, the heating energy consumption intensity is relatively low because heating devices are not opened in some stations in winter. In the hot summer and warm winter region, the air conditioning energy consumption is 24.75 kWh/(m2·a) on average, which is 33.5% higher than that in the hot summer and cold winter region. Compared with severe cold and cold regions, the air conditioning energy consumption in hot summer regions is 1.3 times higher. In the mild region, there is only energy consumption of lighting and electrical equipment; hence, the average total energy consumption is only half of that in other regions. The lighting energy consumption intensity of coach stations varies from 0.7 to 23.24 kWh/(m2·a) in different regions. For severe cold regions and hot summer and cold winter regions, average lighting energy consumption is only 2.23 and 3.83 kWh/(m2·a), mainly because the average operating time of lighting system is no more than 6 hours, and the lighting utilization rate is low.
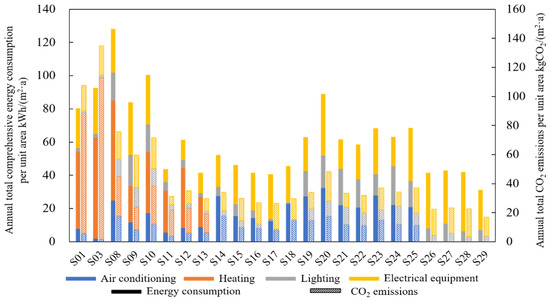
Figure 2.
Energy consumption and CO2 emissions of coach stations investigated in five regions.
The annual total CO2 emission intensity of building operations in coach stations investigated is between 17.01 and 134.77 kgCO2/(m2·a). It can be seen that the CO2 emissions are positively related to energy consumption. The CO2 emissions of the HVAC system takes up 30.42–83.93% of the total CO2 emissions in the coach stations, indicating that the HVAC system is also the largest CO2 emissions sector. In severe cold regions, the CO2 emissions of heating systems are 97.35 kgCO2/(m2·a), which is 4 times higher than that in cold region. In hot summer regions, the CO2 emissions of air conditioning systems are around 13 kgCO2/(m2·a) on average, which is 68.7% than that in severe cold and cold regions. In the mild region, the annual total CO2 emissions of the coach stations are all at low levels, with an average of 21.39 kgCO2/(m2·a). In addition, the annual average CO2 emissions per passenger of building operations in the coach stations investigated are 0.32 kgCO2/(capita·a), which are 11.37% lower compared with the CO2 emissions per passenger of vehicle exhaust in the coach station mentioned in [23]. It is indicated that the CO2 emissions from building operations account for about 42% of the total CO2 emissions in the coach stations investigated.
The comparisons of energy consumption and CO2 emissions between coach stations and other kinds of public buildings are conducted, which focus on severe cold, cold, and hot summer regions in China, as shown in Figure 3 [31,32,33,34]. The total energy consumption intensity of coach stations is much lower than other types of public buildings, even 25% less than that of office buildings. Moreover, the total energy consumption intensity of coach stations is nearly 60% lower than that of railway stations and airport terminals, which are also large transportation hub buildings. In addition to low energy consumption levels, the energy consumption structure of coach stations is quite different from other kinds of public buildings. The ratio of lighting energy consumption is 13% in coach stations, while it is more than 30% in other kinds of public buildings with higher indoor illuminance requirements. The ratio of energy consumption of electrical equipment in coach stations is 37%, which is higher than other kinds of public buildings, mainly because there are all kinds of electrical equipment with large quantities and stable energy consumption throughout the year in the coach stations, such as security check devices, elevators, electrical water heaters, and office equipment. In severe cold and cold regions, the heating energy consumption of coach stations is 33.27% less than that of railway stations. The air conditioning energy consumption of coach stations in hot summer regions is about 80% lower than that in railway stations and airport terminals. The CO2 emissions of coach stations are also at low levels because of the relative low energy consumption. The CO2 emission intensity of coach stations is 43.51 kgCO2/(m2·a), which is 32% lower than the average level of public buildings in China. Compared with airport terminals and railway stations, the CO2 emissions intensity of coach stations is 60% lower. According to the investigation results and the comparison above, it can be concluded that the energy consumption and CO2 emission levels of HVAC systems in coach stations are relatively low, which can be explained by the quite low installation and utilization rate of related equipment. In the circumstances, thermal environment tests were conducted on waiting halls of coach stations to study whether thermal comfort met the basic requirements of passengers.
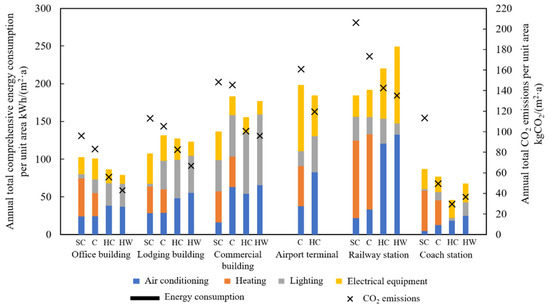
Figure 3.
Energy consumption and CO2 emissions of public buildings in five regions. Notes: SC means severe cold region, C means cold region, HC means hot summer and cold winter region, and HW means hot summer and warm winter region.
2.3. Thermal Environment Tests
S01, S08, and S19 were selected as the representative stations to conduct thermal environment tests in the summer in the severe cold region, cold region and hot summer and warm winter region, respectively. The indoor and outdoor temperature and relative humidity were tested by temperature and humidity recorder (measurement range: −40–70 °C ±0.1 °C, 0–100%RH ±1%RH). The air velocity was tested by a hot-wire anemometer (measurement range: 0–50 m/s ±0.015 m/s). The indoor and outdoor thermal environment parameters of these stations during the testing period are shown in Table 2. The passenger thermal comfort was investigated by questionnaire, the American Society of Heating Refrigerating and Airconditioning Engineer (ASHRAE) 7-point scale of thermal sensation was used to measure passenger thermal sensation.
Table 2.
Indoor and outdoor environment parameters.
The influences of both indoor air temperature and mean radiant temperature on passenger thermal comfort are considered in the operative temperature. The operative temperature can be calculated as the following equations:
where (°C) is operative temperature, (°C) is indoor air temperature, (°C) is mean radiant temperature, is air velocity related factor, which is 0.5 when indoor air velocity is 0–0.2 m/s, 0.6 when indoor air velocity is 0.2–0.6 m/s, 0.7 when indoor air velocity is 0.6–1.0 m/s, is 0.5 in this paper according to the air velocity measurement results, (°C) are the wall temperatures in the test area, which were tested by infrared thermometer (measurement range: −40–800 °C ±1.0 °C). Combined with the results of passenger thermal sensation votes, the linear relationship between operative temperature and mean thermal sensation (MTS) can be obtained. The thermal neutral temperature, which represents the temperature when the passengers just feel thermal comfort (MTS = 0), is calculated as 27.7 °C, 28 °C and 26.4 °C in S01, S08, and S19, respectively.
Results show that in the severe cold region, the average thermal sensation votes are 0.66 in S01, which is beyond the comfort range of −0.5–+0.5. The thermal neutral temperature of S01 is less than the average operative temperature, indicating that the waiting hall is warm. In addition, the indoor air temperature of S01 is even higher than outdoor air temperature, which indicates that it is necessary to open the air-conditioners to meet the passenger thermal comfort. The similar results are shown in hot summer and warm winter regions. As shown in Figure 4, 25.71% of passengers feel warm in S19, and the thermal neutral temperature is less than the average operative temperature. In the cold region, the passengers who feel neutral in S08 account for 65.71%, the average thermal sensation votes are within the comfort range, indicating that the passengers in S08 are mostly comfort. However, the air conditioning energy consumption intensity of S08 is the largest among the coach stations investigated in the cold region, which is around two times of the average energy consumption of these coach stations. As a result, the thermal comfort of passengers in other stations with lower energy consumption of air conditioning systems cannot be ensured to a largely extent. Overall, the energy consumption level of coach stations is low because the passenger thermal comfort is sacrificed. Therefore, the energy consumption analysis models of coach stations should be established to show the actual energy consumption when the thermal comfort is met.
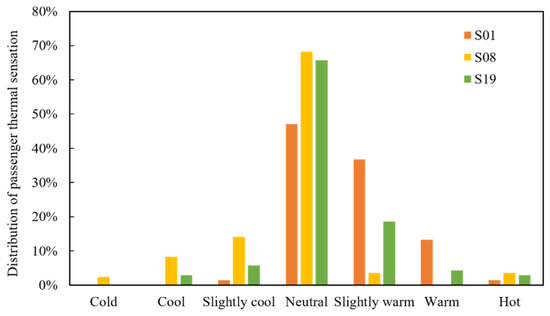
Figure 4.
Passenger thermal sensation in waiting hall.
3. Energy Consumption Simulation Analysis
Based on the field investigation data, the energy consumption analysis models of coach stations in five regions are necessary to be established by simulation when the passenger thermal comfort is met, the annual energy consumption and CO2 emissions are analyzed. The potentials of energy saving and CO2 emission reduction of coach stations were studied from forms of the HVAC system, heat recovery, and natural illumination. The eQUEST (the Quick Energy Simulation Tool) is used to establish the energy consumption models and conduct the energy consumption simulation. By inputting the parameters of weather data and the building envelope, the load of the building can be calculated. Then, according to the indoor thermal disturbance parameters, indoor air design temperatures and HVAC system forms, the energy consumption of the building throughout the year can be calculated.
3.1. Energy Consumption Analysis Model
3.1.1. Building Description
The architectural appearance of the coach stations is shown in Figure 5. The building area of the station is 5400 m2. The ground floor includes waiting hall and ticket lobby, and the second floor is for office. The daily operating time is from 6:00 to 17:00. The parameters of lighting, electrical equipment, and occupancy are shown in Table 3 and Figure 6. The indoor design temperature is set as 18 °C in winter and 26 °C in summer to meet the basic thermal comfort of passengers in coach stations. Five cities are selected as the representatives of different regions; related information is listed in Table 4. The supply and return water temperature of the water-cooled chiller is 7/12 °C in the first four regions, and that of the gas fired boiler is 75/50 °C and 55/45 °C for the severe cold region and cold region, respectively. The fresh air volume is set as 30 m3/(capita·h) in office rooms and 10 m3/(capita·h) in waiting halls.
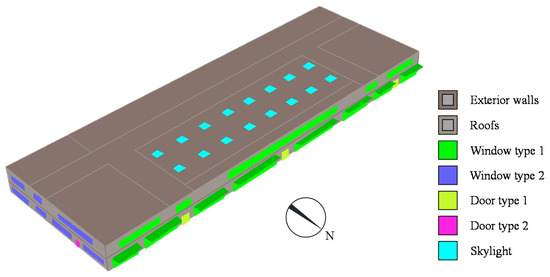
Figure 5.
Architectural appearance.
Table 3.
Occupancy, lighting and electrical equipment power density.
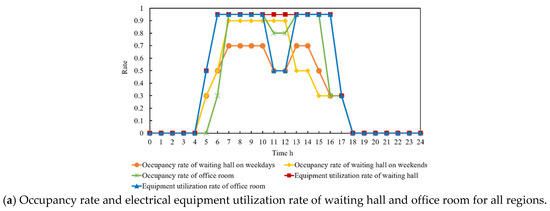
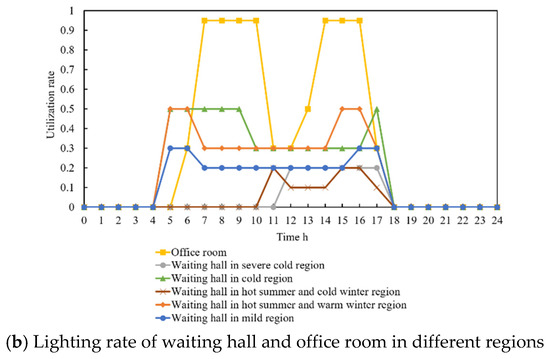
Figure 6.
Occupancy rate, lighting and electrical equipment utilization rate.
Table 4.
Information of representative cities and HVAC systems in different regions.
3.1.2. Energy Consumption and CO2 Emissions Analysis
The annual energy consumption and CO2 emissions of coach stations in five regions when the passenger thermal comfort is met are shown in Figure 7. The air conditioning energy consumption includes the energy consumption of chiller, heat rejection, fans, and pumps in air conditioning period. The heating energy consumption includes the energy consumption of fans, pumps, and natural gas. The annual total comprehensive energy consumption intensity is 118.83, 108.00, 59.19, 88.91, and 41.08 kWh/(m2·a) in severe cold, cold, hot summer and cold winter, hot summer and warm winter and mild regions, respectively. In severe cold and cold regions, about 80,000 m3 natural gas is used annually in the severe cold region for heating, which is more than two times used in the cold region. The air conditioning energy consumption of coach stations in the severe cold region is 59.43% lower than that in the cold region, because the air conditioning period of the severe cold region is only from July to August. The monthly energy consumption is stable in hot summer regions during the air conditioning period. The annual total air conditioning energy consumption is 25.61 kWh/(m2·a) in the hot summer and cold winter region, and 45.69 kWh/(m2·a) in the hot summer and warm winter region. Lighting energy consumption of mild region is relatively low, due to the long sunshine duration is and the high solar radiation intensity in Kunming. For severe cold region and hot summer and cold region, lighting energy consumption is only 4.69 and 5.09 kWh/(m2·a), due to the short operating time. The annual total CO2 emissions of coach stations range from 22.27 to 67.83 kgCO2/(m2·a). The variation trend of CO2 emissions is the same as that of energy consumption throughout the year in each region. The CO2 emissions from natural gas consumption account for 50% and 20% in severe cold and cold regions, respectively. Besides, CO2 emissions are only contributed by electricity consumption in other regions.
Figure 7.
Annual energy consumption and CO2 emissions of coach stations in five regions: (a) severe cold region; (b) cold region; (c) hot summer and cold winter region; (d) hot summer and warm winter region; (e) mild region.
The comparison between energy consumption simulation and investigation results is shown in Figure 8. For severe cold, cold, and hot summer and warm winter region, the simulation results under actual thermal environment in summer are used to verify the reliability of the energy consumption analysis models. The mean relative errors of sub-item energy consumption between investigation and simulation results under actual thermal environment except heating are less than 13%, which can be acceptable. The investigation results of heating energy consumption in severe cold region and cold region is 30.43% and 24.03% lower than simulation results, respectively, indicating that the passenger thermal comfort requirements in coach stations is probably not met in winter. The simulation results of air conditioning energy consumption are higher than investigation results in coach stations of severe cold region, cold region and hot summer and warm winter region, which are in agreement with the results of thermal environment tests in summer. Similarly, the annual total CO2 emissions of coach stations obtained by investigation and simulation are compared with each other, as shown in Figure 9. The simulation results are consistent with the investigation results except in the severe cold region, because the CO2 emission factors of municipal hot water used in coach stations investigated is much higher than that of natural gas used in the simulation. If the heat source in the simulation is changed to municipal hot water with same heat (3456 GJ), the CO2 emissions intensity of heating is 118 kgCO2/(m2·a), which is 24% higher than that in coach station investigated, meaning that the simulation results are reasonable.
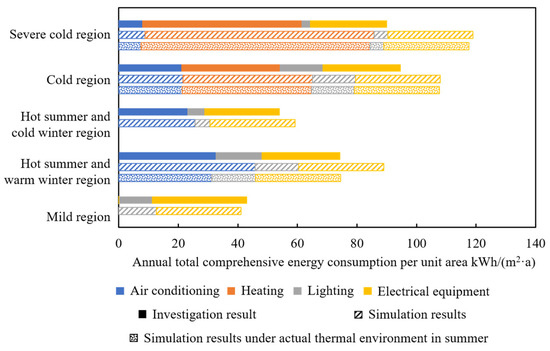
Figure 8.
Comparison between simulation and investigation results of energy consumption in five regions.
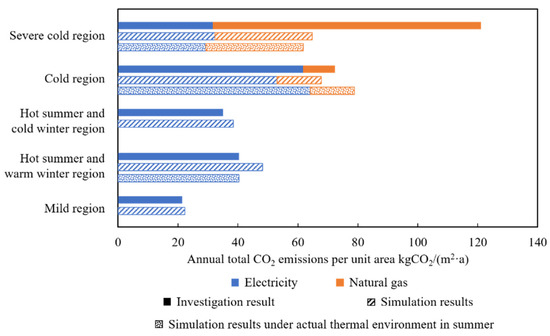
Figure 9.
Comparison between simulation and investigation results of CO2 emissions in five regions.
3.2. Potentials of Energy Saving and CO2 Emission Reduction
3.2.1. Forms of HVAC System
The energy consumption and CO2 emissions of the coach stations with two kinds of heating system were compared, including radiators and radiant floor heating systems. For the cold region and hot summer regions, the energy consumption and CO2 emissions of the coach stations with variable air volume (VAV) system and FCU were compared with that of CAV system. Under the premise of meeting the same requirement of indoor thermal comfort, the indoor air design temperature for radiant floor heating system can be set 2 °C lower than that for radiator. Therefore, the indoor design temperature was set as 16 °C when using radiant floor heating system, 18 °C when using radiator.
The monthly energy consumption and CO2 emissions with different HVAC systems are shown in Figure 10. It is indicated that the application of radiant floor heating system in severe cold region, VAV and FCU in other three regions shows obvious energy saving and CO2 emission reduction effects. As shown in Table 5, the annual natural gas consumption can be reduced by 11.36% with radiant floor heating system, resulting in a reduction of 20 tCO2 emissions a year. Although the pump energy consumption of the radiant floor heating system increases compared with the radiator system, the energy consumption and CO2 emissions of heating system decreases by 7% and 4.21%, respectively. Moreover, for large-scale buildings such as coach stations, the passenger thermal comfort in the waiting halls with radiant floor heating system is superior than that with radiators, because the comfortable temperature gradient can be met in the people activity area with radiant floor heating system.
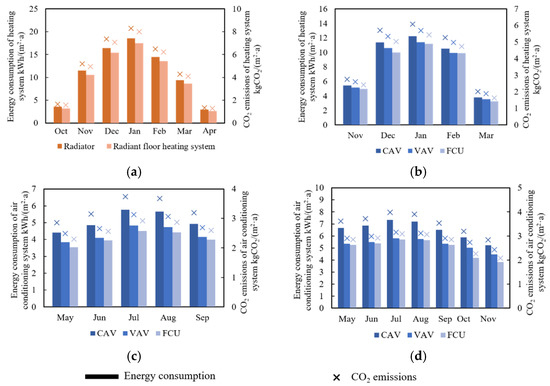
Figure 10.
Energy consumption and CO2 emissions with different HVAC systems: (a) severe cold region; (b) cold region; (c) hot summer and cold winter region; (d) hot summer and warm winter region.
Table 5.
Energy consumption and CO2 emissions with different forms of heating system.
The detailed energy consumption and CO2 emissions of coach stations with different air conditioning systems in the cold region and hot summer regions are shown in Table 6. In the cold region, the energy consumption of HVAC system with VAV system and FCU can be reduced by 4.32% and 12.13%, compared with that of CAV system. The CO2 emissions from electricity consumption of HVAC system when using FCU decrease by 29.24%. In hot summer regions, the energy consumption and CO2 emissions of air conditioning both can be reduced by more than 15%. The energy consumption of air conditioning system decreases by 15.47% and 19.05% when using the VAV system and FCU in the hot summer and cold winter region, 24.03% and 31.62% in the hot summer and warm winter region. Although the pump energy consumption slightly increases when using FCU, the energy consumption of HVAC system decreases greatly, because the fan energy consumption can be reduced by around 54% compared with the CAV system. In addition, with the low energy consumption and the flexibility of arrangement, FCU is especially suitable for using in the office area of the stations and the waiting halls of smaller-scale coach stations.
Table 6.
Energy consumption and CO2 emissions with different forms of HVAC system. (VAV means Variable Air Volume).
3.2.2. Heat Recovery
A large amount of fresh air is required to ensure the indoor environment quality because of high occupancy of waiting halls in coach stations. According to our investigation results, the fresh air load takes up around 30–60% of the total load. Hence, there will be considerable energy saving and CO2 emission reduction effects if the heat recovery unit is used in HVAC system to pre-cool or preheat fresh air with the heat of exhaust air. The enthalpy plate and wheel heat recovery unit were added in the HVAC system of coach station models in the severe cold, cold, hot summer and cold winter, hot summer and warm winter region for analysis of energy saving and CO2 emission reduction potential.
In the severe cold and cold region, the energy savings and CO2 emission reduction effects when using heat recovery in winter are greater than in summer. As shown in Figure 11a,b—the energy consumption and CO2 emissions of the heating system in severe cold and cold region drop dramatically by using heat recovery unit, especially during the months with low outdoor air temperature. The heating energy consumption in the cold region decreases by 29.42% and 21.05% when using the wheel and plate heat recovery unit, respectively. In the severe cold region, the energy reduction rate of heating system is 28.76% and 20.57% for using the wheel and plate heat recovery unit. The CO2 emissions of the heating system decrease linearly with the decrease of energy consumption, which can be reduced to 9.2 and 5.4 kgCO2/(m2·a) when using wheel heat recovery in the severe cold and cold region, respectively. In hot summer regions, the energy consumption and CO2 emissions of air conditioning system both decrease greatly, as shown in Figure 11c,d. The energy saving and CO2 emission reduction rates with the heat recovery unit in coach stations of the severe cold and cold regions are higher than that in hot summer regions, mainly because the enthalpy differences between indoor and outdoor air in hot summer regions are far less than that in the severe cold and cold regions.
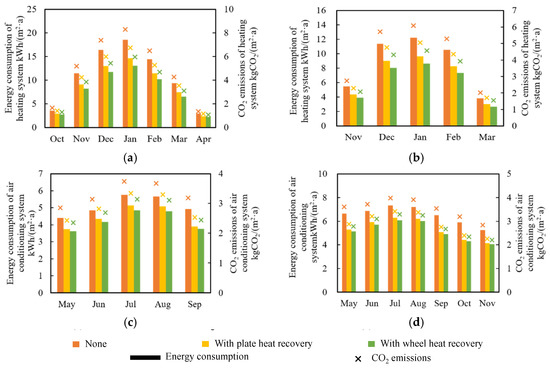
Figure 11.
Energy consumption and CO2 emissions with different heat recovery units: (a) severe cold region; (b) cold region; (c) hot summer and cold winter region; (d) hot summer and warm winter region.
Moreover, the negative effects of increased fan energy consumption can be eliminated by the decreased energy consumption of chillers, heat rejections, and gas fired boilers. In particular, in coach stations of the severe cold region, the total energy consumption drops by 18.24% with wheel heat recovery, although the fan energy consumption increases by 53.7%, as shown in Table 7. It can be seen that the fan energy consumption of plate heat recovery is 6.75% higher than that of wheel heat recovery. The energy saving rate of plate heat recovery is 3.50% less than that of wheel heat recovery, since the effectiveness of plate heat recovery is low.
Table 7.
Fan energy consumption with different type of heat recovery.
The economic analysis of plate and wheel heat recovery is conducted based on the methods of life cycle cost (LCC). The annual operation cost savings and payback periods of the heat recovery units are calculated as shown in Table 8, compared with the CAV system without heat recovery units. It is indicated that the payback periods of heat recovery units are both less than 5 years, which shows great energy efficiency. Due to the remarkable effect of heat recovery in heating period, the payback period in the severe cold region is less than 3 years. In hot summer regions, the payback period is around 4 years. Although the cost savings of wheel heat recovery is higher than that of plate heat recovery, the payback period of wheel heat recovery is generally longer than that of plate heat recovery, due to the large size, high initial investment, and high maintenance costs for wheel heat recovery unit.
Table 8.
Annual operation cost savings and payback period of heat recovery units.
3.2.3. Natural Illumination
Natural illumination technology combines the natural lighting with the artificial lighting through reasonable control methods; the lamps can be dimmed or turned off when indoor illuminance reaches or exceeds the set value. The reduction of lighting energy consumption by natural illumination also influences the energy consumption of air conditioning and heating indirectly [16]. Therefore, the sub-item energy consumption of the coach stations with different lighting control methods were studied, when the illuminance of the horizontal plane, 0.75 m away from the ground, reached 300lx.
As shown in Table 9, the lighting energy consumption declines dramatically in both five regions when natural illumination is conducted, the discrete step control with two levels and three levels show significant energy saving effects compared with continuous dimming control. The energy saving rate of lighting system is 61.79–81.19% with discrete step control in five climate regions. Because the usage of natural illumination reduces the utilization rate of lamps indoors, the air conditioning energy consumption decreases slightly, while heating energy consumption increases by 0.96% and 1.47% in the severe cold and cold regions, respectively. Although the decrease of lighting energy consumption eliminates the negative effect of natural illumination on heating, the energy saving rates of total energy consumption in the severe cold and cold region are still lower than that in other regions, mainly because there is no negative effect in remaining regions. The increased heating energy consumption also has a little effect on total CO2 emissions. The annual total CO2 emissions can be reduced by 2.88% and 11.23% with discrete step control in the severe cold and cold regions, respectively. In hot summer regions, the energy consumption of air conditioning and lighting both decreases. The total energy consumption and CO2 emissions in hot summer and warm winter region can be both reduced by 13.01%, which is slightly higher than that in the hot summer and cold winter region. Because the energy consumption in mild region only contains lighting and electrical equipment, the annual total energy consumption and CO2 emissions decline markedly, with the reduction rate of 24.08%. It is indicated that, on the basis of meeting the required indoor illuminance in coach stations, the natural illumination with the discrete step control can be applied to the lighting systems for better energy saving and emission reduction effect, especially in the waiting halls with large areas of glass curtain walls.
Table 9.
Annual total energy consumption and CO2 emissions with different lighting control method.
4. Conclusions
According to investigations on 29 coach stations in five regions of China, the status and structure of energy consumption and CO2 emissions of coach stations were analyzed. Thermal environments of waiting halls in three coach stations were tested. Based on the energy consumption simulation, annual energy consumption and CO2 emissions in coach stations were analyzed when passenger thermal comfort was met, then the potentials of energy saving and CO2 emission reduction of coach stations were studied. The main conclusions were summarized as follows:
- (1)
- The annual total comprehensive energy consumption of coach stations was 41.55–128.08 kWh/(m2·a) in severe cold and cold region, 40.66–88.99 kWh/(m2·a) in hot summer regions, and 31.37–43.04 kWh/(m2·a) in mild region. The annual total CO2 emissions from building operation in coach stations were between 17.01 and 134.77 kgCO2/(m2·a). Results showed that 48% of the energy consumption and 49% of the CO2 emissions were generated by HVAC system in coach stations;
- (2)
- Due to the low installation and utilization rate of HVAC system, the energy consumption and CO2 emission intensity in coach stations were relatively lower compared with other kinds of public buildings. Therefore, the passenger thermal comfort in coach stations was affected, according to the thermal environment test results. In this regard, the management department should supervise the installation and utilization of temperature control devices in coach stations, and improve the passenger complaint mechanism for thermal environments;
- (3)
- For the severe cold region, the effects of energy saving and CO2 emission reduction with radiant floor heating system were superior than with radiators. For cold region and hot summer regions, VAV systems and FCU are both recommended for air conditioning in summer. The energy consumption and CO2 emissions of HVAC system can be reduced by about 21% with VAV system and 27% with FCU in coach stations of hot summer regions;
- (4)
- Exhaust heat recovery was also an effective measure to reduce the energy consumption and CO2 emissions in coach stations, especially during the heating period in the severe cold and cold regions, the energy consumption and CO2 emissions of heating system both can be reduced by 25% when using wheel heat recovery unit. The payback periods of the heat recovery units are both less than 5 years, indicating that the energy saving and economic benefits can be achieved with heat recovery;
- (5)
- By conducting natural illumination with the discrete step control, the lighting energy consumption can be reduced at least 60% in coach stations.
Author Contributions
Conceptualization and Methodology, X.Z., S.Y., H.Z., Y.W.; Investigation, Software and Validation, B.X.; Investigation, X.Z., L.S. All authors have read and agreed to the published version of the manuscript.
Funding
This work was supported by National Key R&D Program of China (grant number 2018YFC0705000).
Conflicts of Interest
The authors declare no conflicts of interest.
References
- Yan, J.; Su, B. What drive the changes in China’s energy consumption and intensity during 12th Five-Year Plan period? Energy Policy 2020, 140, 111383. [Google Scholar] [CrossRef]
- Yang, F.; Chou, J.; Dong, W.; Sun, M.; Zhao, W. Adaption to climate change risk in eastern China: Carbon emission characteristics and analysis of reduction path. Phys. Chem. Earth Parts A/B/C 2020, 115, 102829. [Google Scholar] [CrossRef]
- State Council of the People’s Republic of China. Notice of the Comprehensive Work Plan for Energy Saving and Emission Reduction during the 13th Five-Year Plan issued by the State Council. Available online: http://www.gov.cn/zhengce/zhengceku/2017-01/05/content_5156789.htm (accessed on 3 April 2020).
- Li, Y.; Du, Q.; Lu, X.; Wu, J.; Han, X. Relationship between the development and CO2 emissions of transport sector in China. Transp. Res. Part D 2019, 74, 1–14. [Google Scholar] [CrossRef]
- Zhang, Y.; Yan, D.; Hu, S.; Guo, S. Modelling of energy consumption and carbon emission from the building construction sector in China, a process-based LCA approach. Energy Policy 2019, 134, 110949. [Google Scholar] [CrossRef]
- Yang, T. Study on the energy efficiency classification method of highway passenger stations based on climatic divisions. In AIP Conference Proceedings; AIP Publishing LLC: Melville, NY, USA, 2018; Volume 1971, p. 030016. [Google Scholar] [CrossRef]
- National Bureau of Statistics of China. China Statistical Yearbook-2018. Available online: http://www.stats.gov.cn/tjsj/ndsj/2018/indexch.htm (accessed on 29 October 2019).
- Lin, L.; Liu, X.; Zhang, T.; Liu, X. Energy consumption index and evaluation method of public traffic buildings in China. Sustain. Cities Soc. 2020, 57, 102132. [Google Scholar] [CrossRef]
- Fan, L.; Tian, X.; Wang, S. Study on the Factors of Energy Consumption of Highway Transport Passenger Station, Proceedings of the 2013 the International Conference on Remote Sensing, Environment and Transportation Engineering (RSETE 2013), Nanjing, China, 26 July 2013; Atlantis Press: Paris, France, 2013. [Google Scholar] [CrossRef]
- Sun, Q.; Sun, Y.; Sun, L. Evaluation on green grade of bus terminal based on cloud matter element model. J. Arid Land Resour. Environ. 2018, 32, 81–86. [Google Scholar] [CrossRef]
- Liu, Y.; Peng, C.; Yan, D. Indoor environment status and energy saving design investigation of railway stations. Heat. Vent. Air Cond. 2011, 41, 51–57. [Google Scholar] [CrossRef]
- Liu, X.; Liu, X.; Zhang, T.; Li, L. An investigation of the cooling performance of air-conditioning systems in seven Chinese hub airport terminals. Indoor Built Environ. 2019. [Google Scholar] [CrossRef]
- Balaras, C.A.; Dascalaki, E.; Gaglia, A.; Droutsa, K. Energy conservation potential, HVAC installations and operational issues in Hellenic airports. Energy Build. 2003, 35, 1105–1120. [Google Scholar] [CrossRef]
- Jing, R.; Wang, M.; Zhang, R.; Li, N.; Zhao, Y. A study on energy performance of 30 commercial office buildings in Hong Kong. Energy Build. 2017, 144, 117–128. [Google Scholar] [CrossRef]
- Wang, J.C. A study on the energy performance of school buildings in Taiwan. Energy Build. 2016, 133, 810–822. [Google Scholar] [CrossRef]
- Li, X.L.; Li, H.; Gao, J.P. Impact Analysis to Building Energy Consumption of Daylighting Combined Lighting Control. Appl. Mech. Mater. 2013, 260, 202–208. [Google Scholar] [CrossRef]
- Lowry, G. Energy saving claims for lighting controls in commercial buildings. Energy Build. 2016, 133, 489–497. [Google Scholar] [CrossRef]
- Ma, H.; Li, C.; Lai, J.; Yang, F.; Li, Z. Investigation on energy consumption of public buildings in Tianjin. Energy Procedia 2019, 158, 3427–3432. [Google Scholar] [CrossRef]
- Li, H.; Li, X. Benchmarking energy performance for cooling in large commercial buildings. Energy Build. 2018, 176, 179–193. [Google Scholar] [CrossRef]
- Li, S.; Chen, S.; Zhu, L.; Chen, X.; Yao, C.; Shen, X. Concentrations and risk assessment of selected monoaromatic hydrocarbons in buses and bus stations of Hangzhou, China. Sci. Total Environ. 2009, 407, 2004–2011. [Google Scholar] [CrossRef]
- Morales Betancourt, R.; Galvis, B.; Rincón-Riveros, J.M.; Rincón-Caro, M.A.; Rodriguez-Valencia, A.; Sarmiento, O.L. Personal exposure to air pollutants in a Bus Rapid Transit System: Impact of fleet age and emission standard. Atmos. Environ. 2019, 202, 117–127. [Google Scholar] [CrossRef]
- Qiu, Z.; Li, X.; Hao, Y.; Deng, S.; Gao, H.O. Emission inventory estimation of an intercity bus terminal. Environ. Monit. Assess. 2016, 188, 367. [Google Scholar] [CrossRef] [PubMed]
- Zhou, S. The Analysis on The Method of Carbon Emission Quantification of Buildings and Road Traffic in Major Railway Passenger Station Area with Wuchang Railway Station as An Example. Master’s Thesis, Wuhan University of Technology, Wuhan, China, 2016. [Google Scholar]
- Building Energy Conservation Research Center of Tsinghua University. 2020 Annual Report on China Building Energy Efficiency; China Architecture & Building Press: Beijing, China, 2020. [Google Scholar]
- Zhang, X.; Wang, F. Hybrid input-output analysis for life-cycle energy consumption and carbon emissions of China’s building sector. Build. Environ. 2016, 104, 188–197. [Google Scholar] [CrossRef]
- Lu, M.; Lai, J. Review on carbon emissions of commercial buildings. Renew. Sustain. Energy Rev. 2020, 119, 109545. [Google Scholar] [CrossRef]
- Ministry of Housing and Urban-Rural Development of the People’s Republic of China. Design Standard for Energy Efficiency of Public Buildings; GB50189-2015; China Architecture & Building Press: Beijing, China, 2015.
- Standardization Administration of the People’s Republic of China. Classification and Presentation of Civil Building Energy Use; GB/T 34913-2017; China Architecture & Building Press: Beijing, China, 2017. [Google Scholar]
- Ministry of Housing and Urban-Rural Development of the People’s Republic of China. Standard for Building Carbon Emission Calculation; GB/T51366-2019; China Architecture & Building Press: Beijing, China, 2019.
- International Organization for Standardization. Greenhouse Gases—Part 1: Specification with Guidance at the Organization Level for Quantification and Reporting of Greenhouse Gas Emissions and Removals; ISO 14064-1:2018; ISO Copyright Office: Geneva, Switzerland, 2018. [Google Scholar]
- Fu, K.; Deng, Z. Current situation of energy consumption in Guangzhou railway station and analysis on the potential of energy conservation. J. Sustain. Dev. 2009, 2, 117–120. [Google Scholar] [CrossRef][Green Version]
- Guo, J.; Hao, X. Analysis on Energy Consumption of 25 Large Scale Public Buildings in Beijing. Build. Sci. 2012, 28, 38–41. [Google Scholar] [CrossRef]
- Qu, Y.; Zhang, Z.; Wang, H.; Yang, F. Energy Consumption Analysis of Public Buildings Located in the Severe Cold Region. Procedia Eng. 2017, 205, 2111–2117. [Google Scholar] [CrossRef]
- Building Energy Conservation Research Center of Tsinghua University. China Building Energy Use 2018; China Architecture & Building Press: Beijing, China, 2018. [Google Scholar]
© 2020 by the authors. Licensee MDPI, Basel, Switzerland. This article is an open access article distributed under the terms and conditions of the Creative Commons Attribution (CC BY) license (http://creativecommons.org/licenses/by/4.0/).