Improving Fuel Economy and Engine Performance through Gasoline Fuel Octane Rating

 ,
,
Abstract
:1. Introduction
2. Materials and Methods
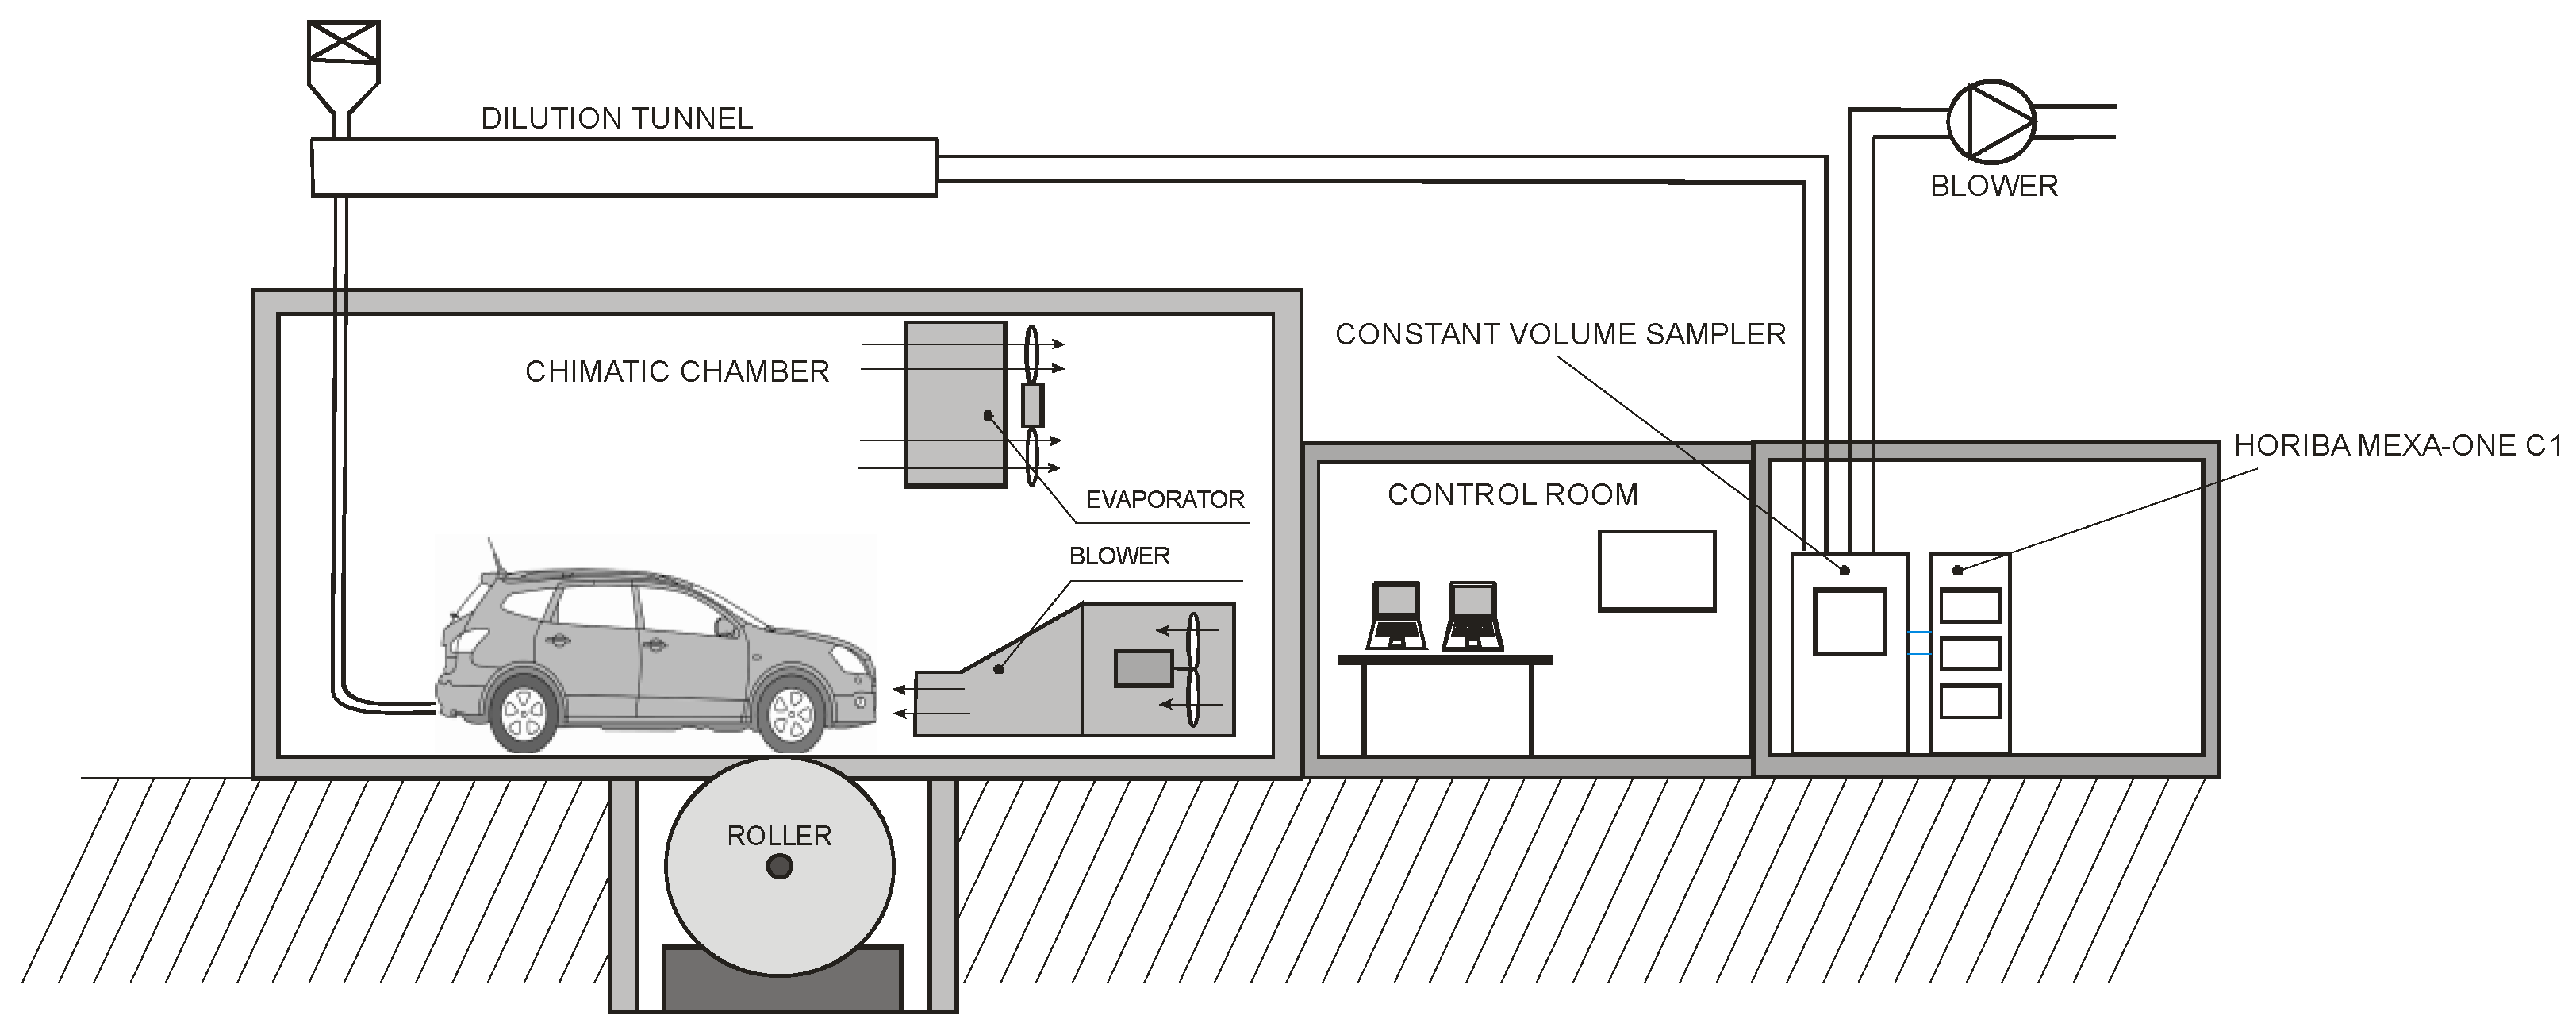
2.1. Experimental Setup
2.2. Fuels
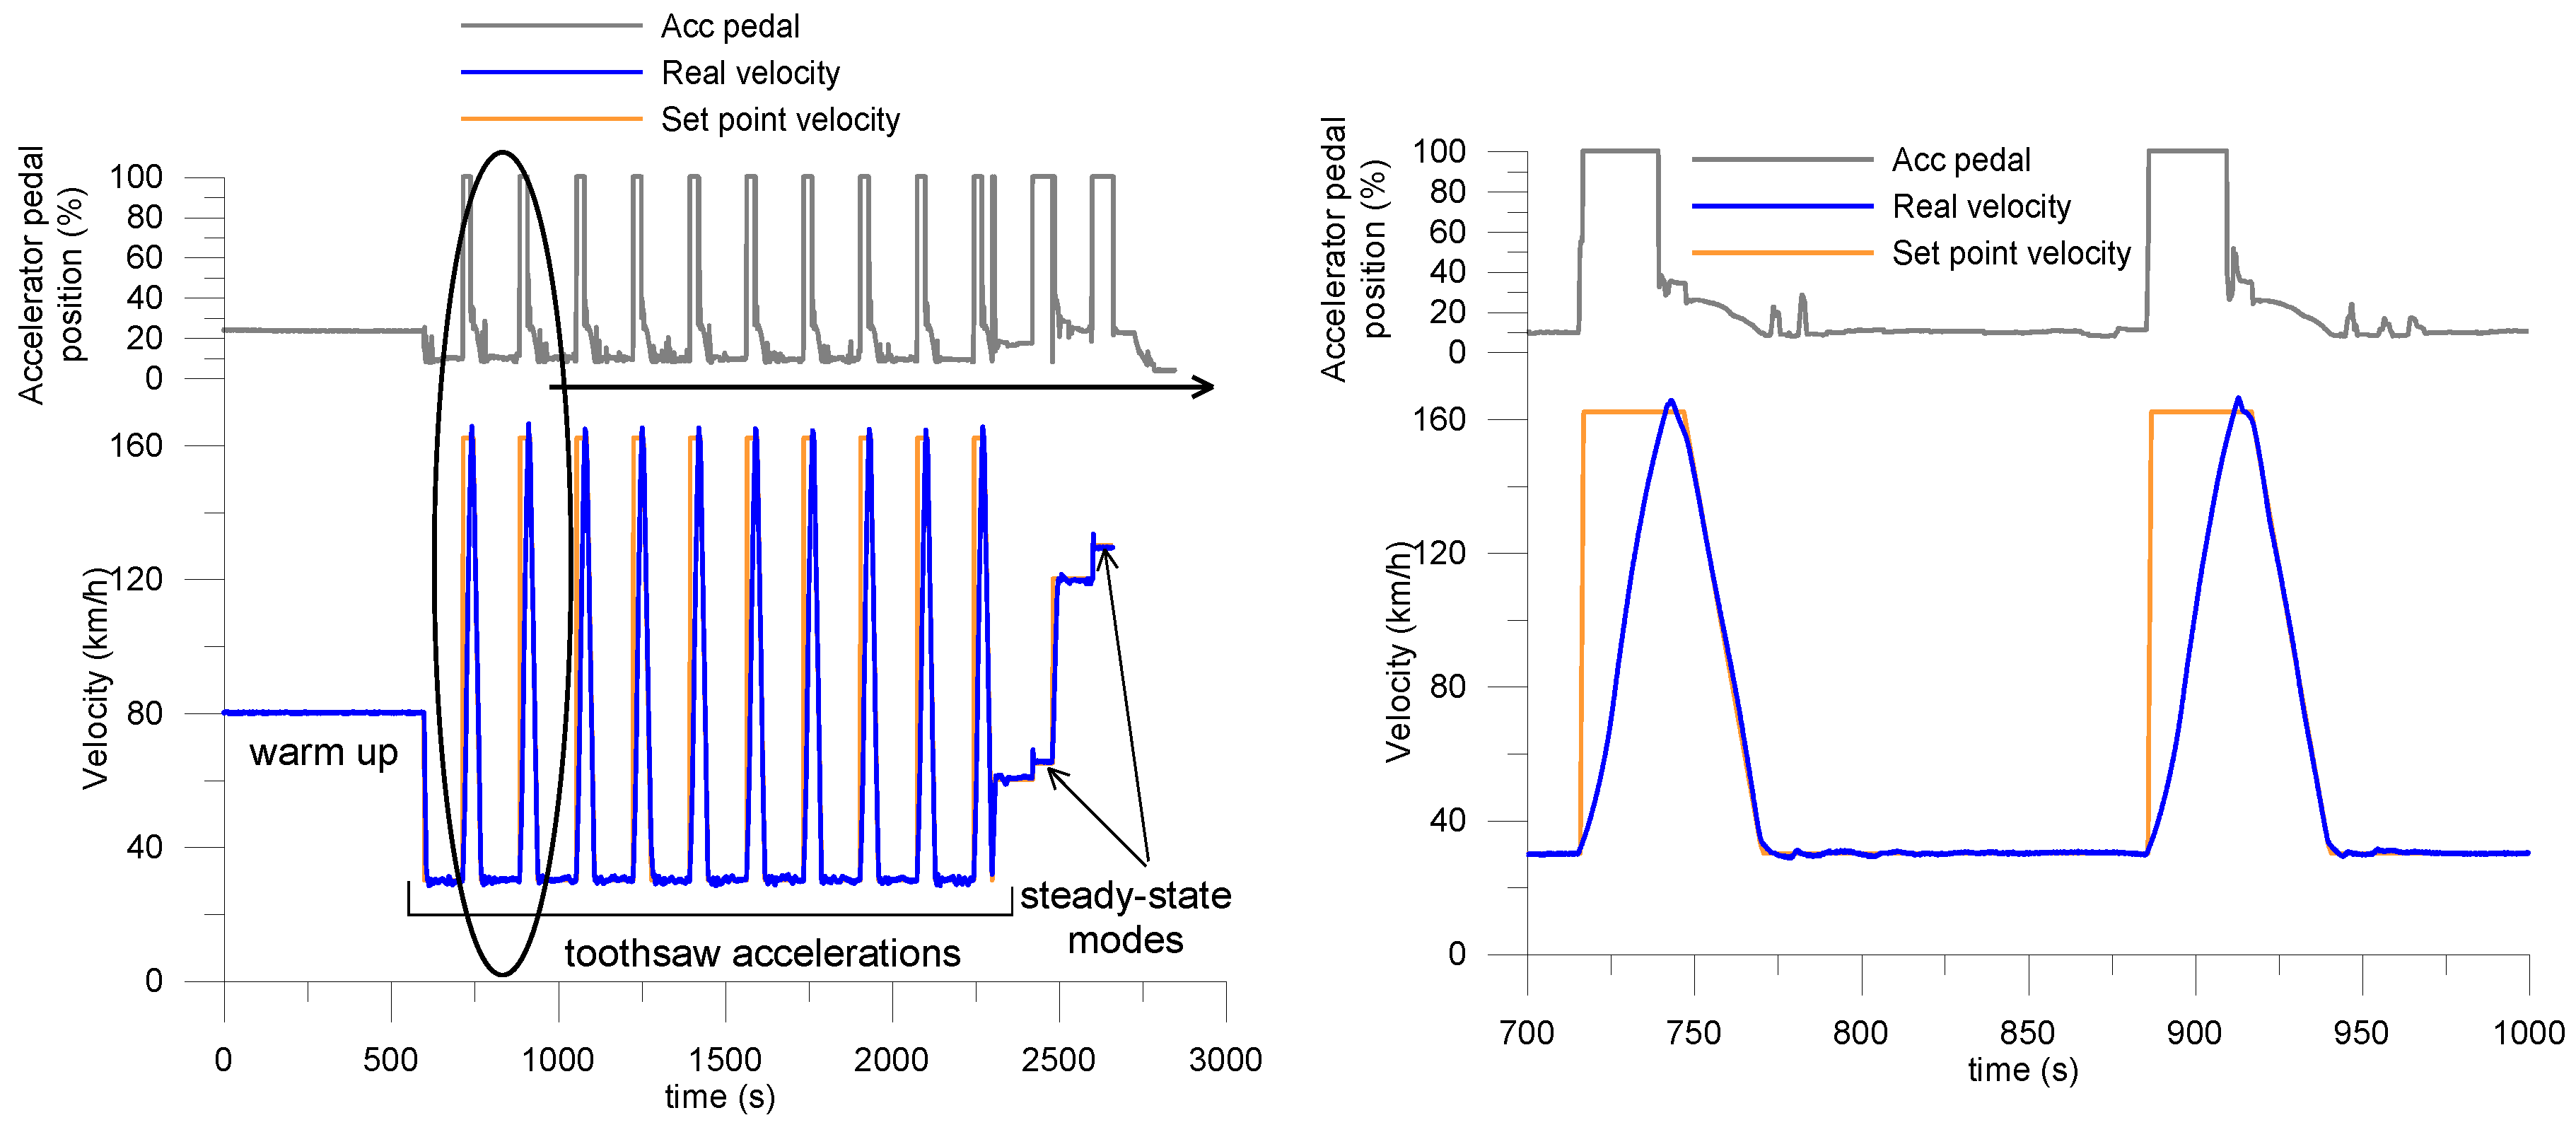
2.3. Test Protocol
3. Results and Discussion
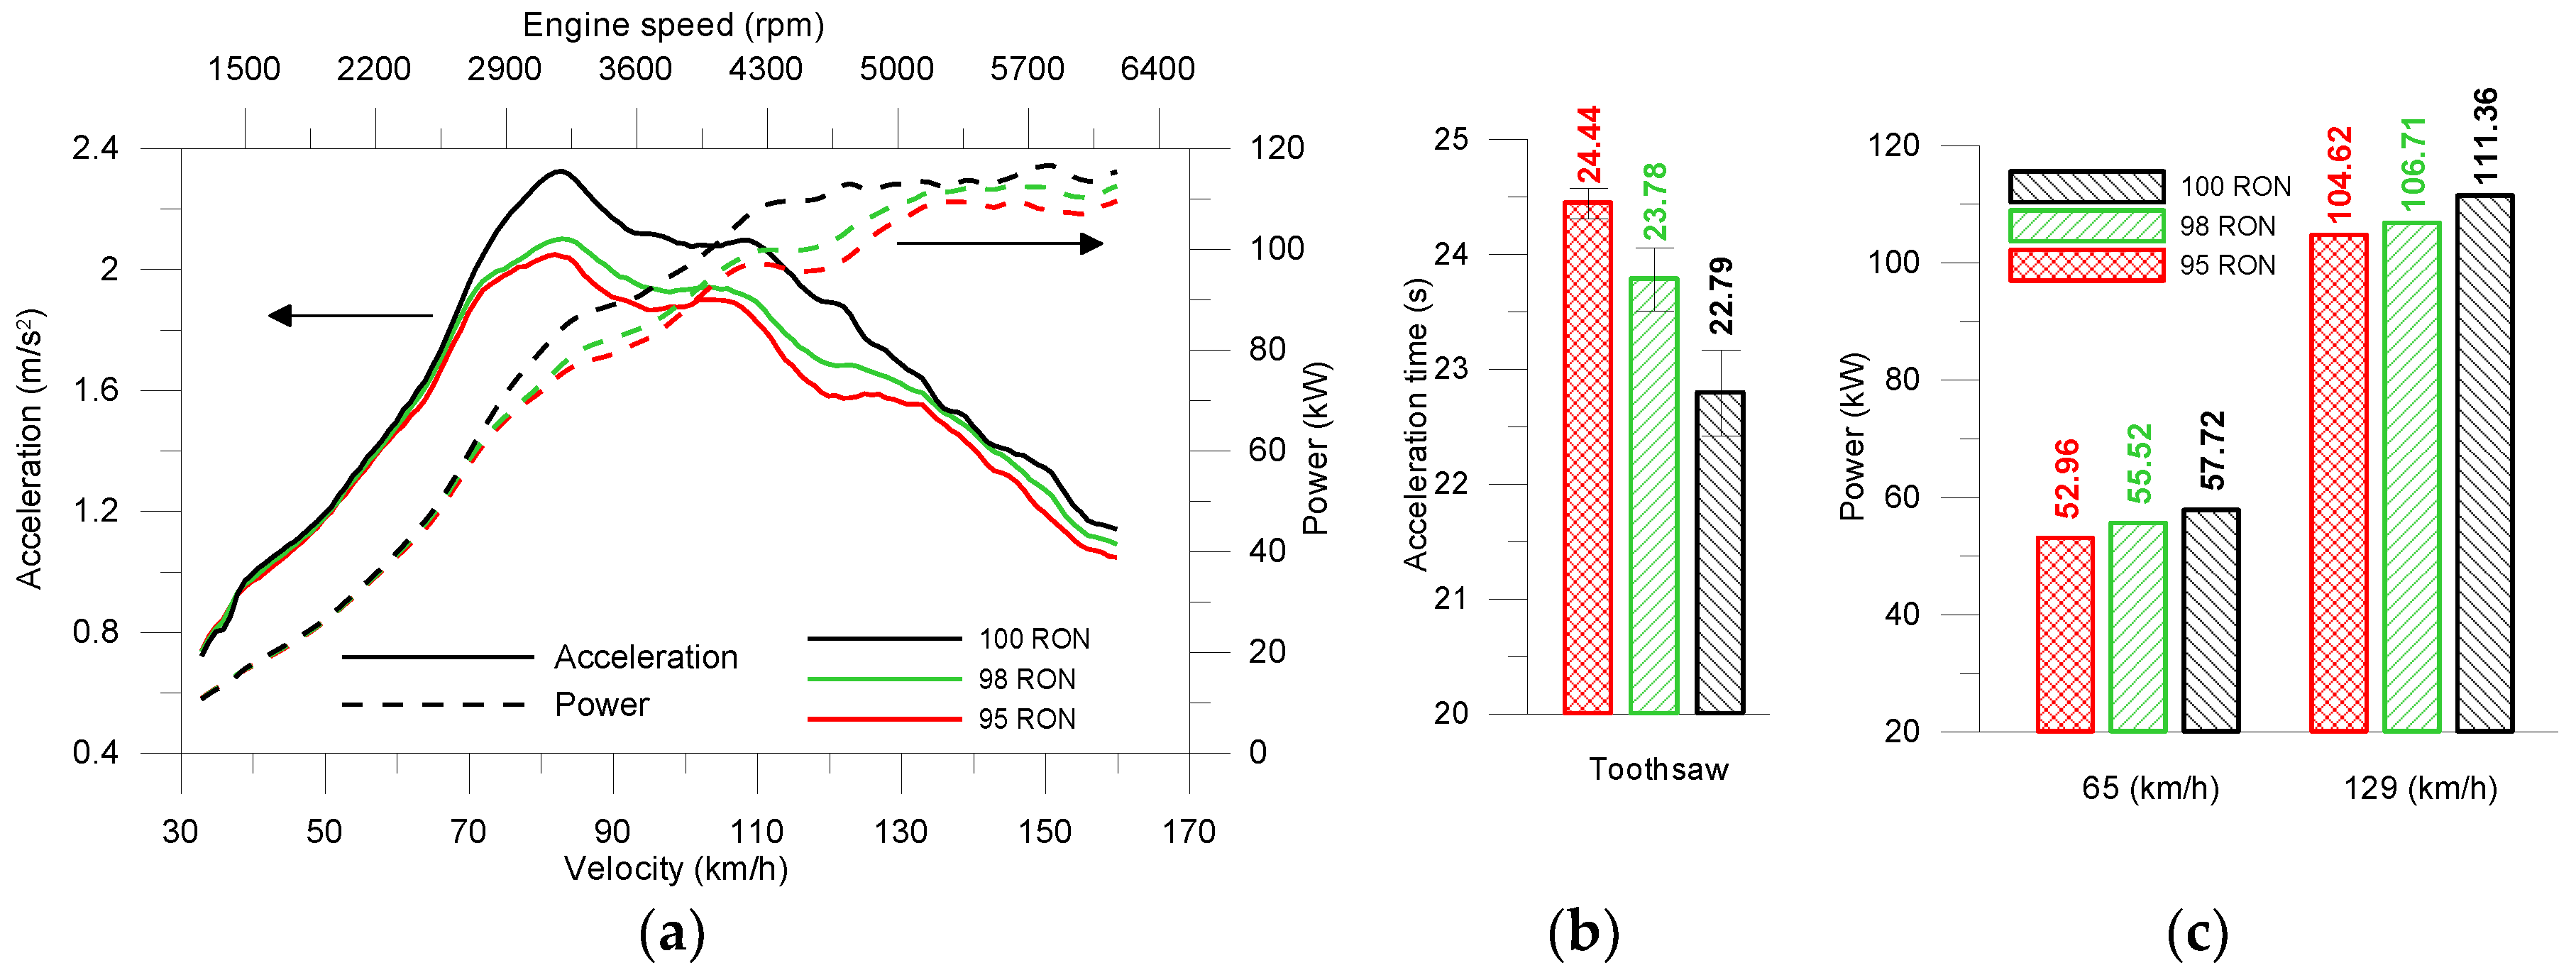
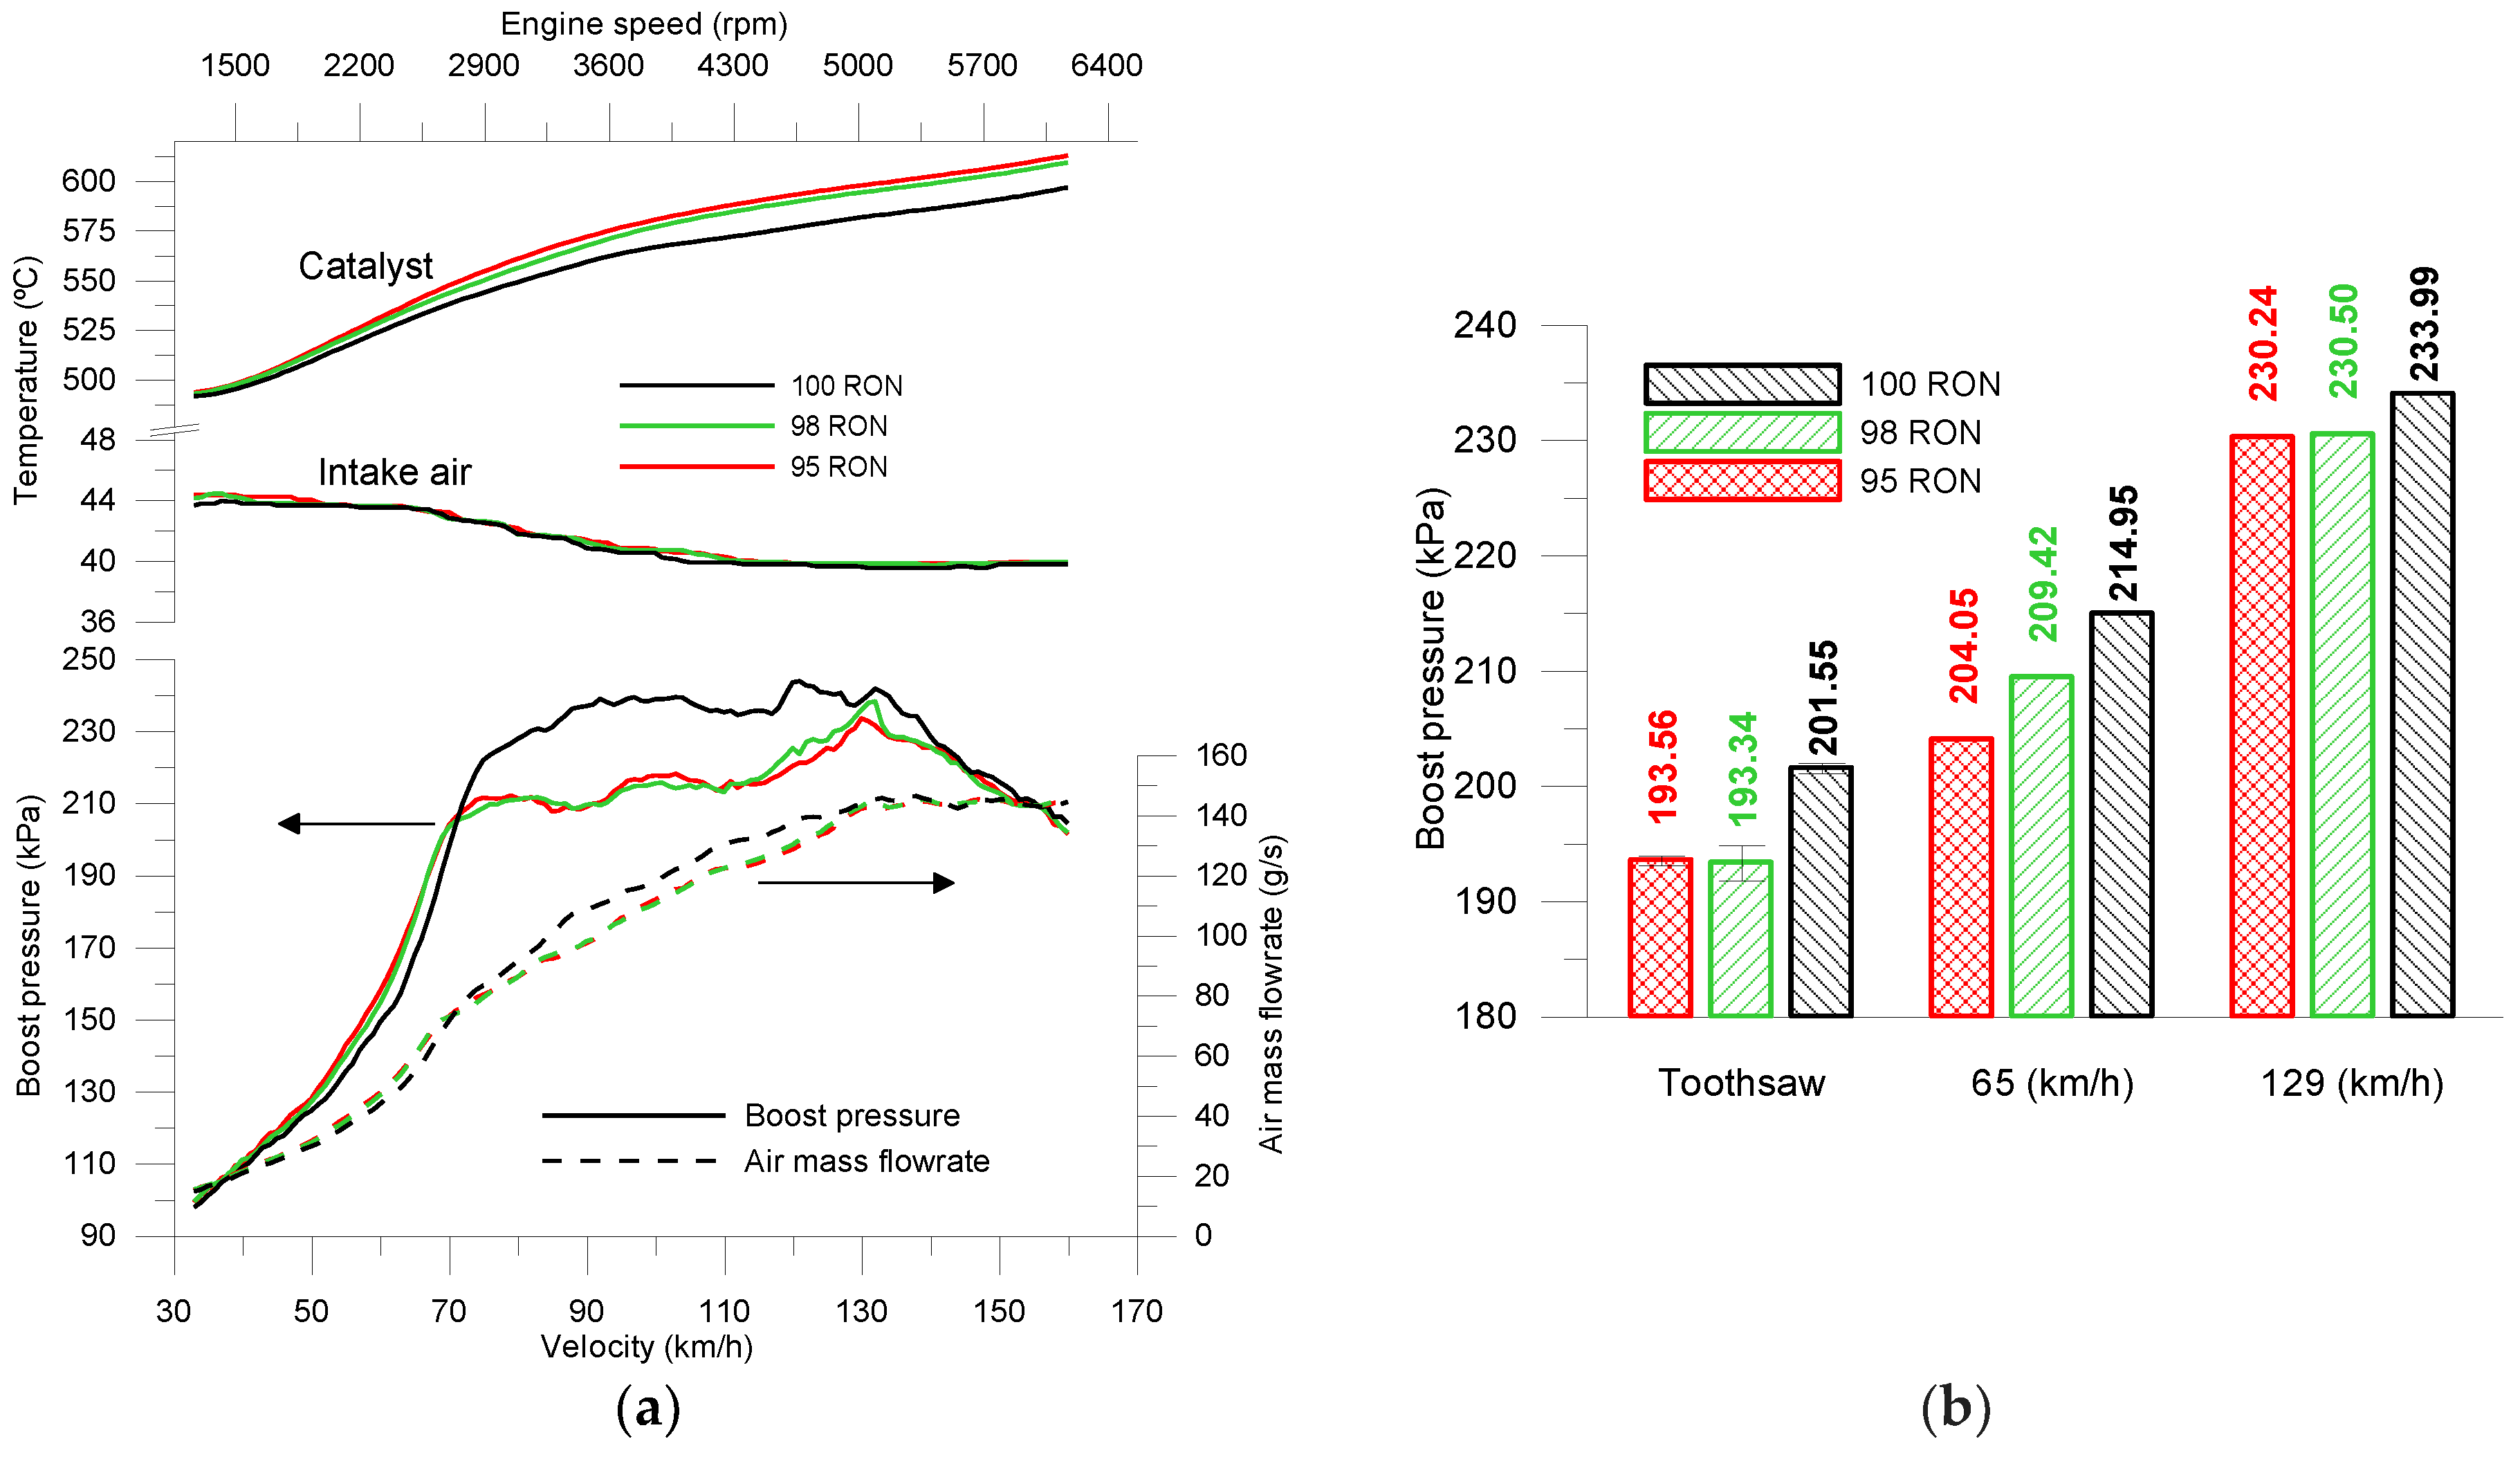
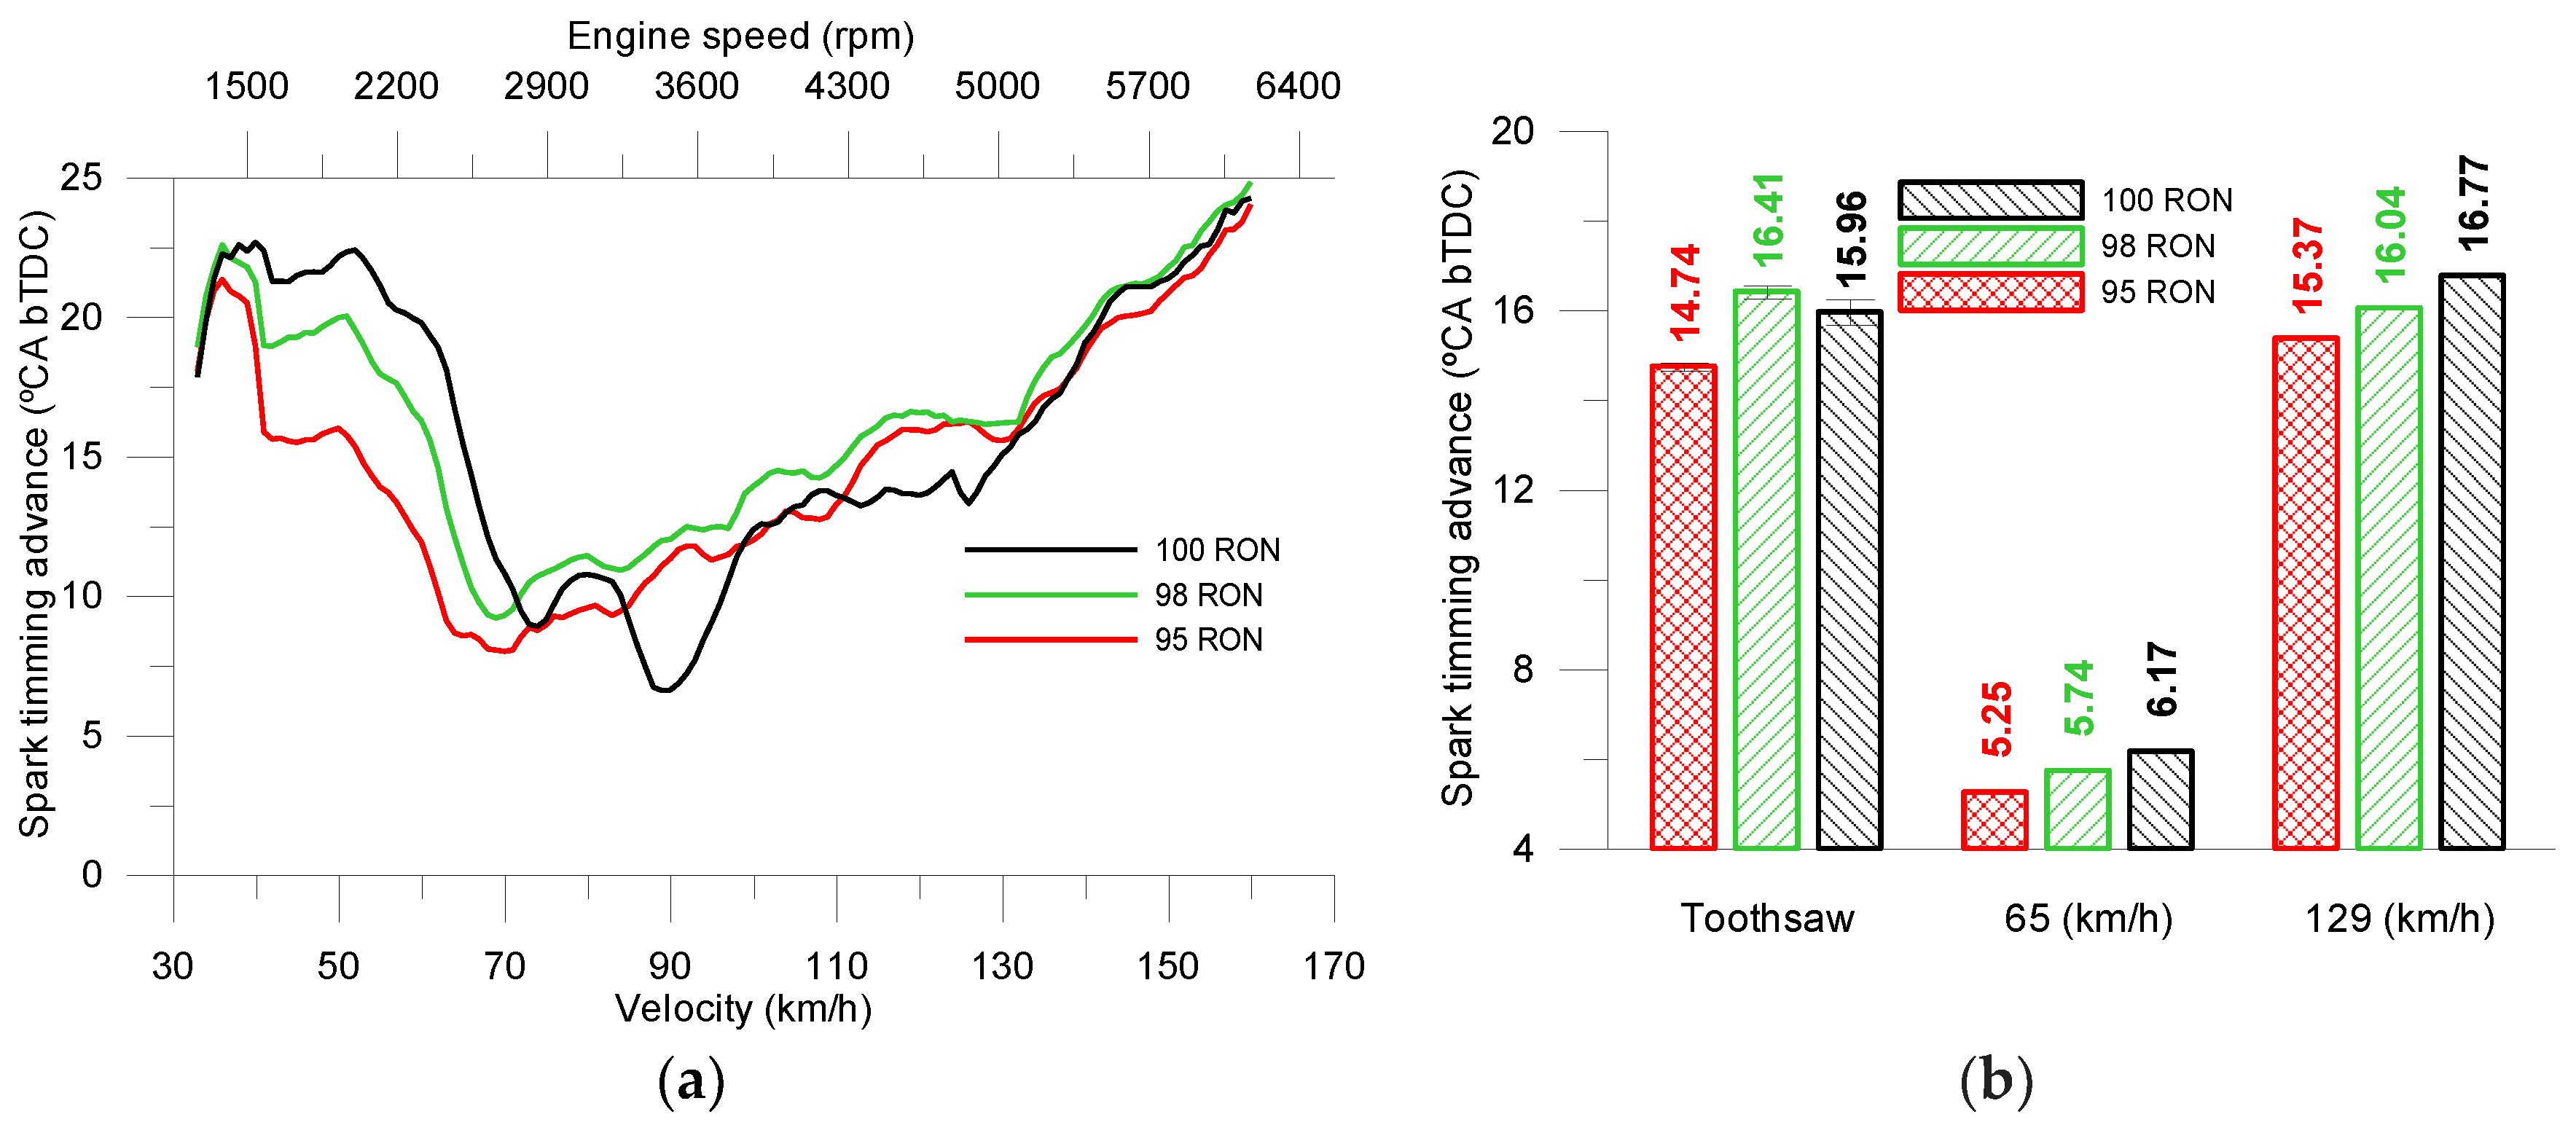
3.1. Power Output and Acceleration
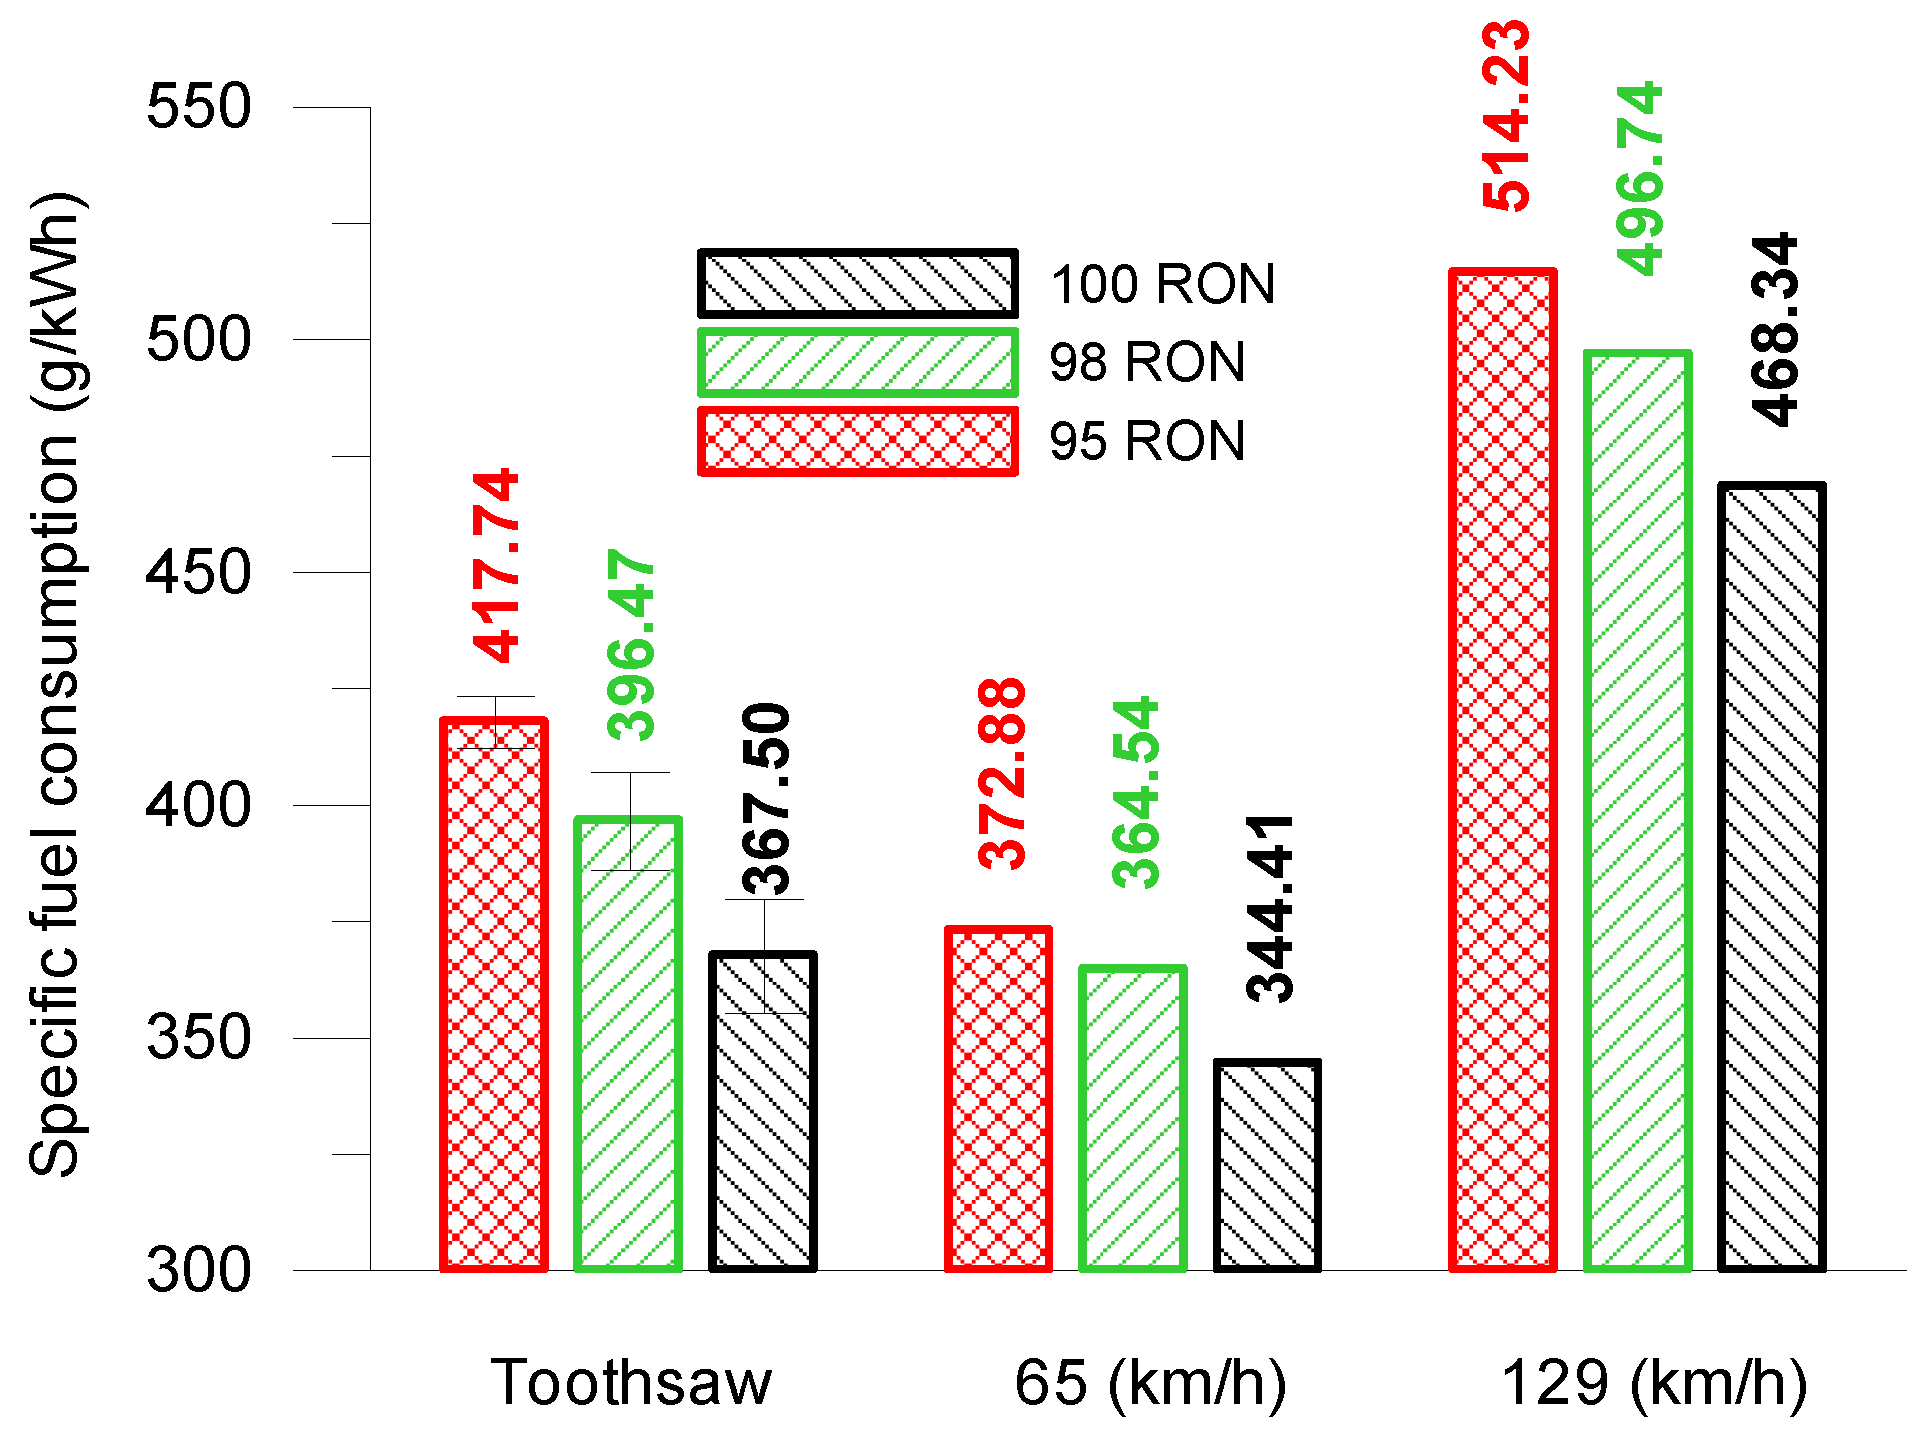
3.2. Specific Fuel Consumption
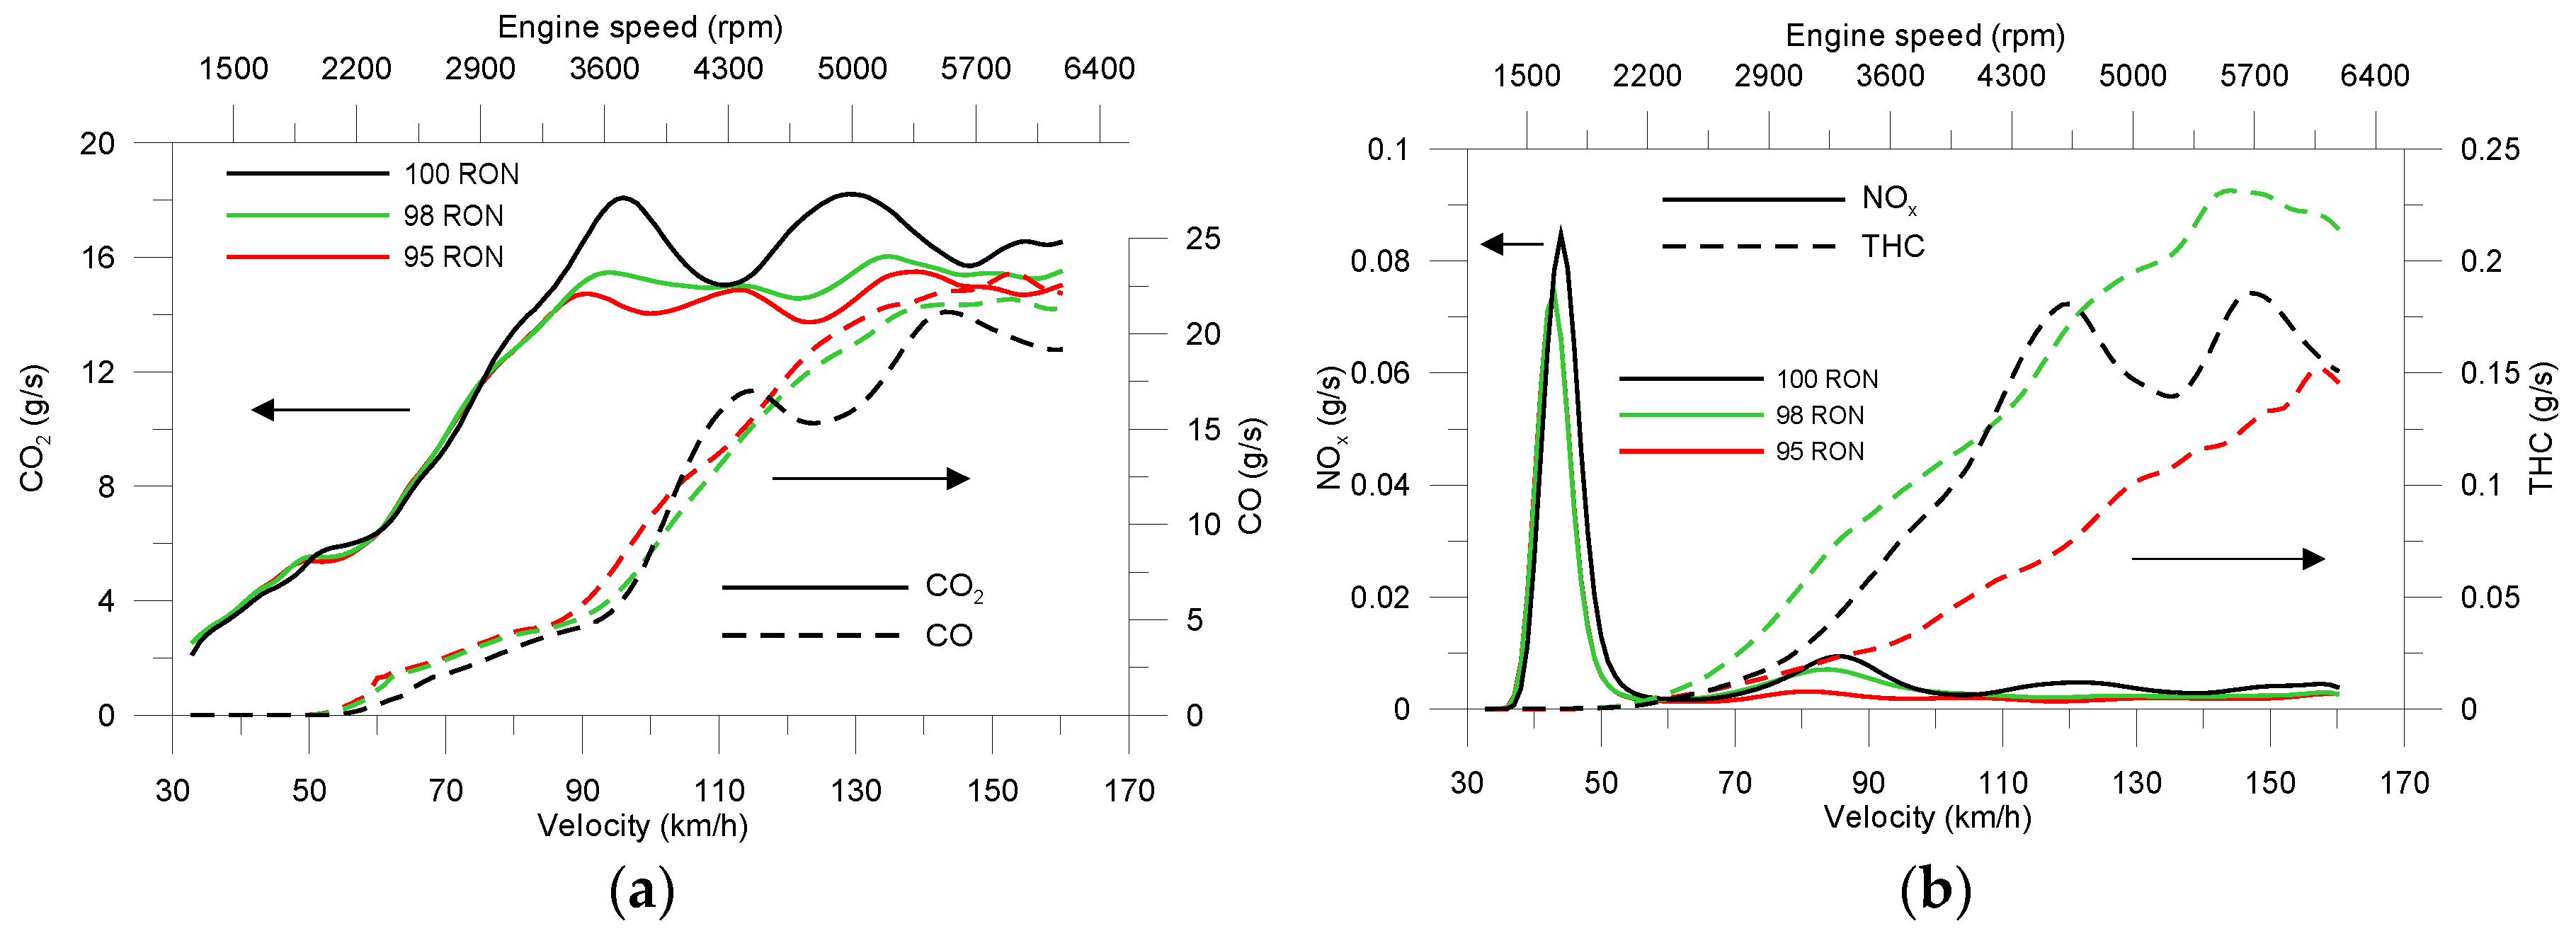
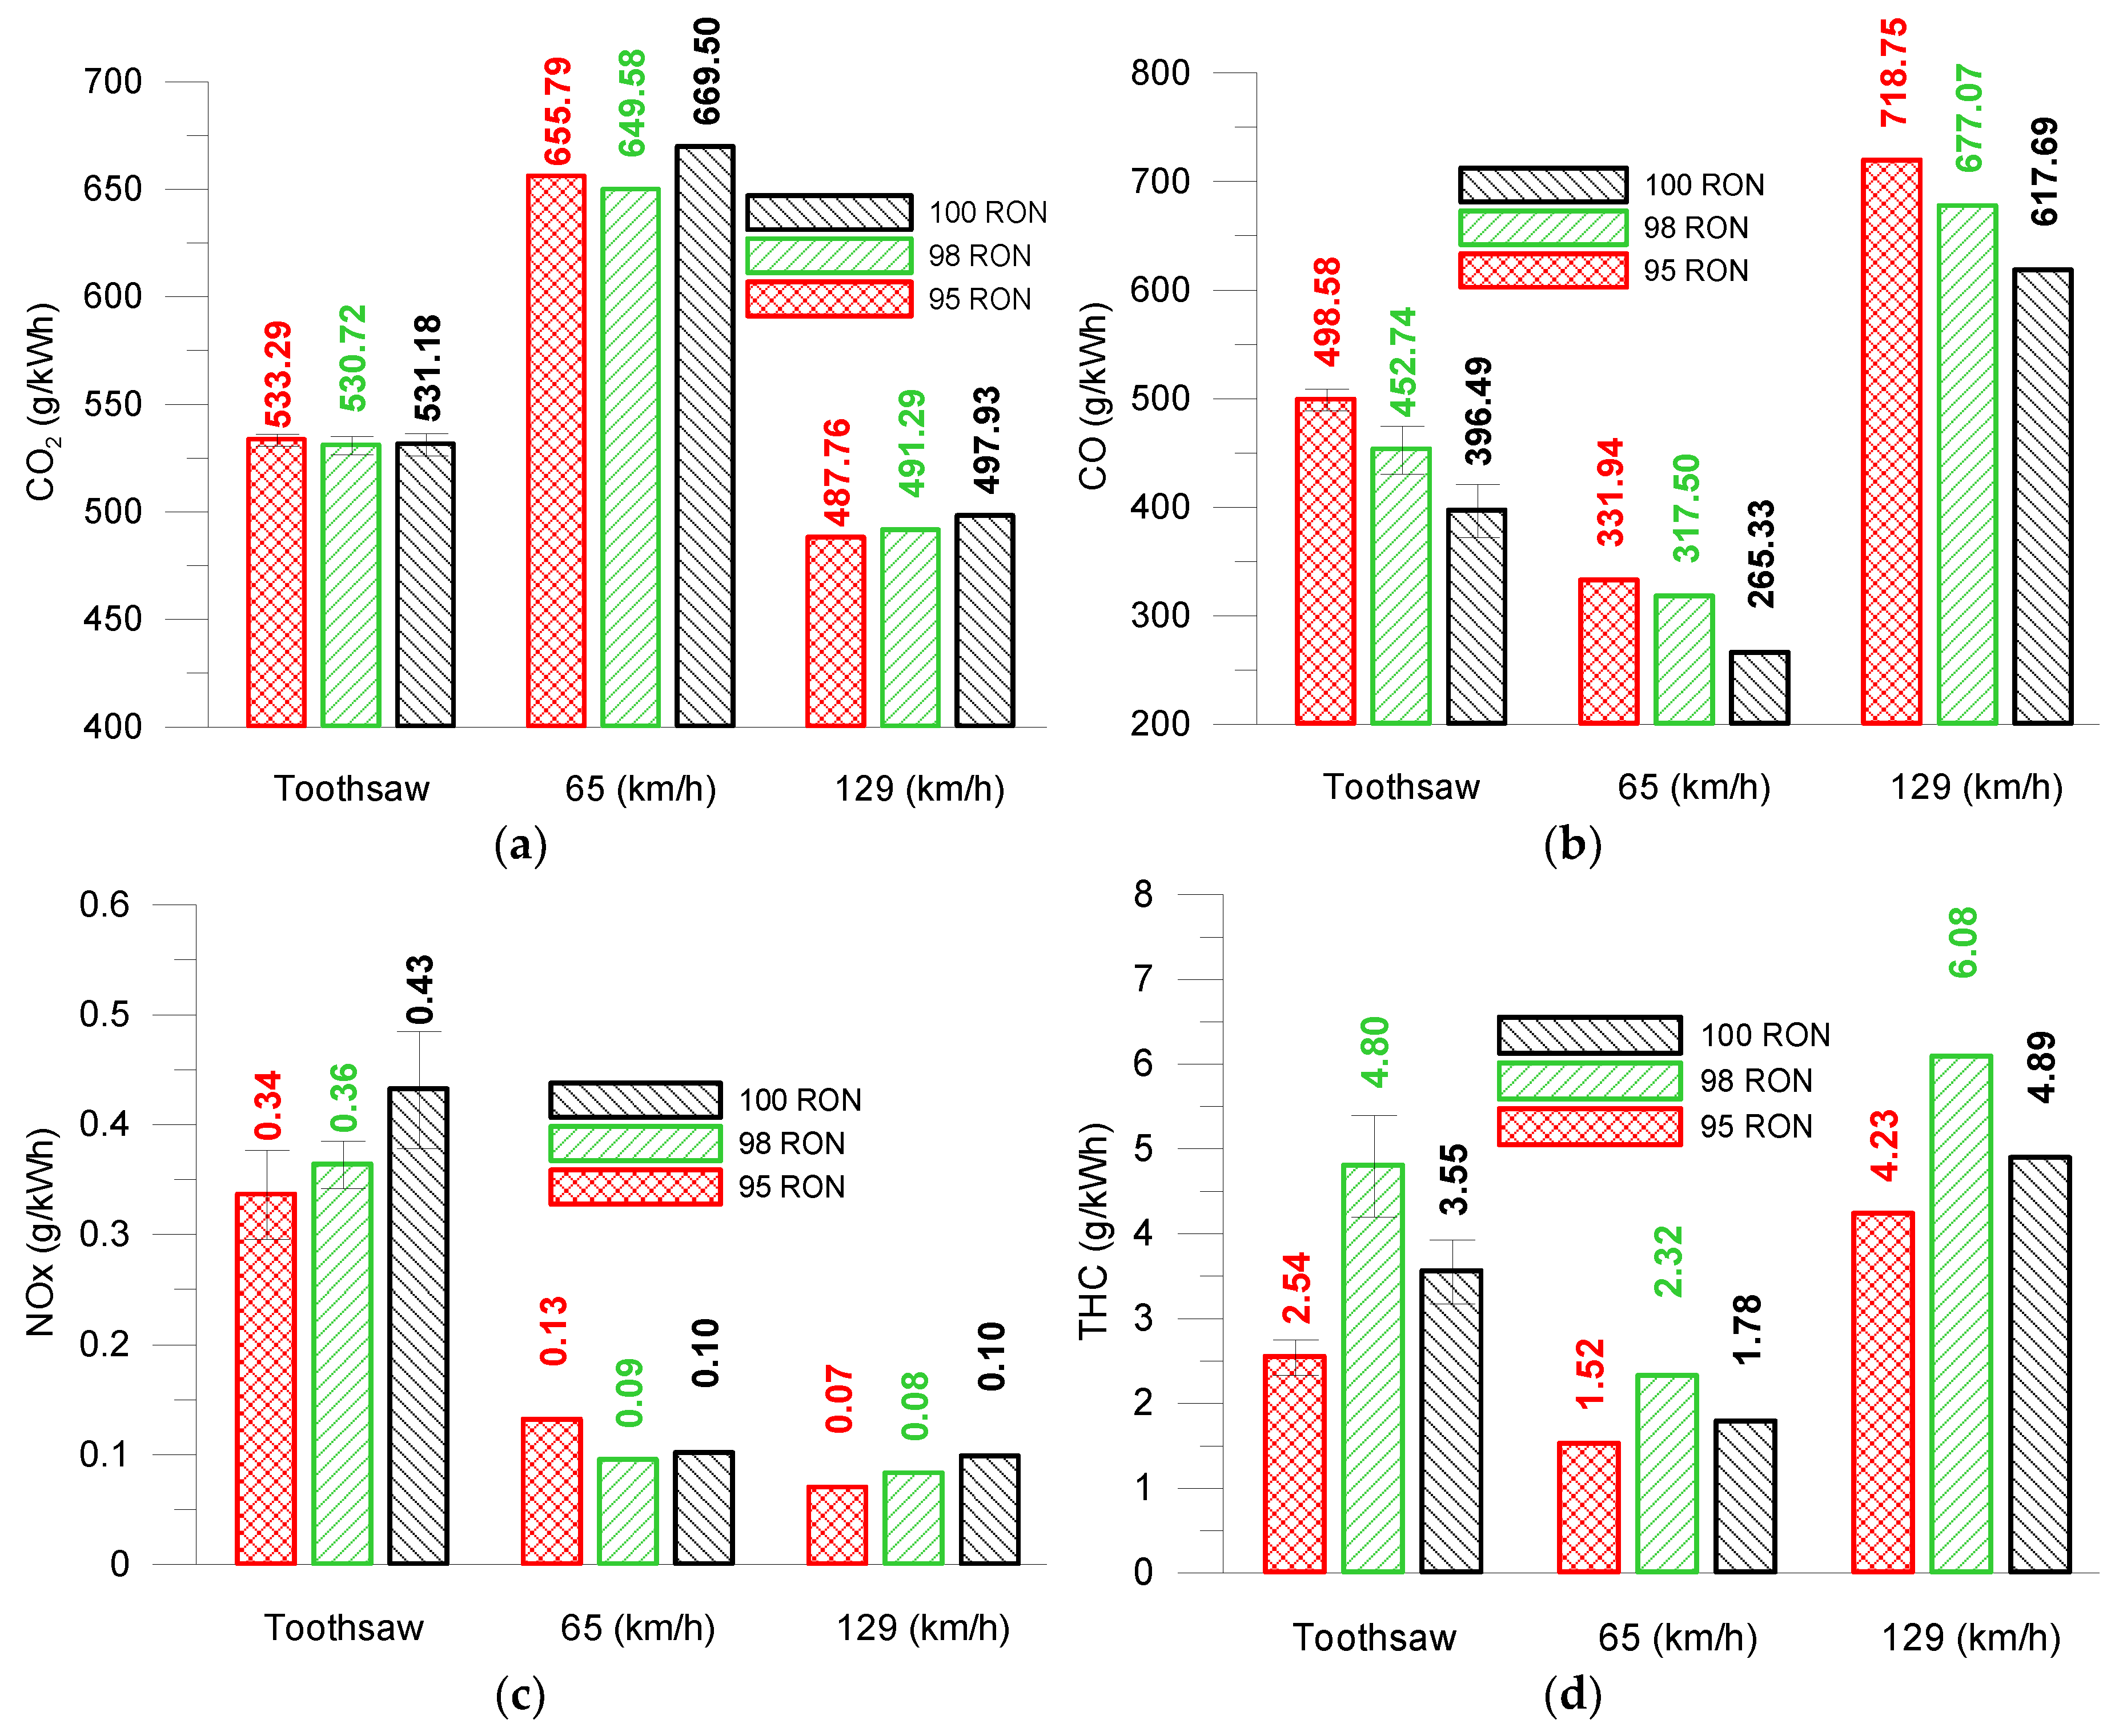
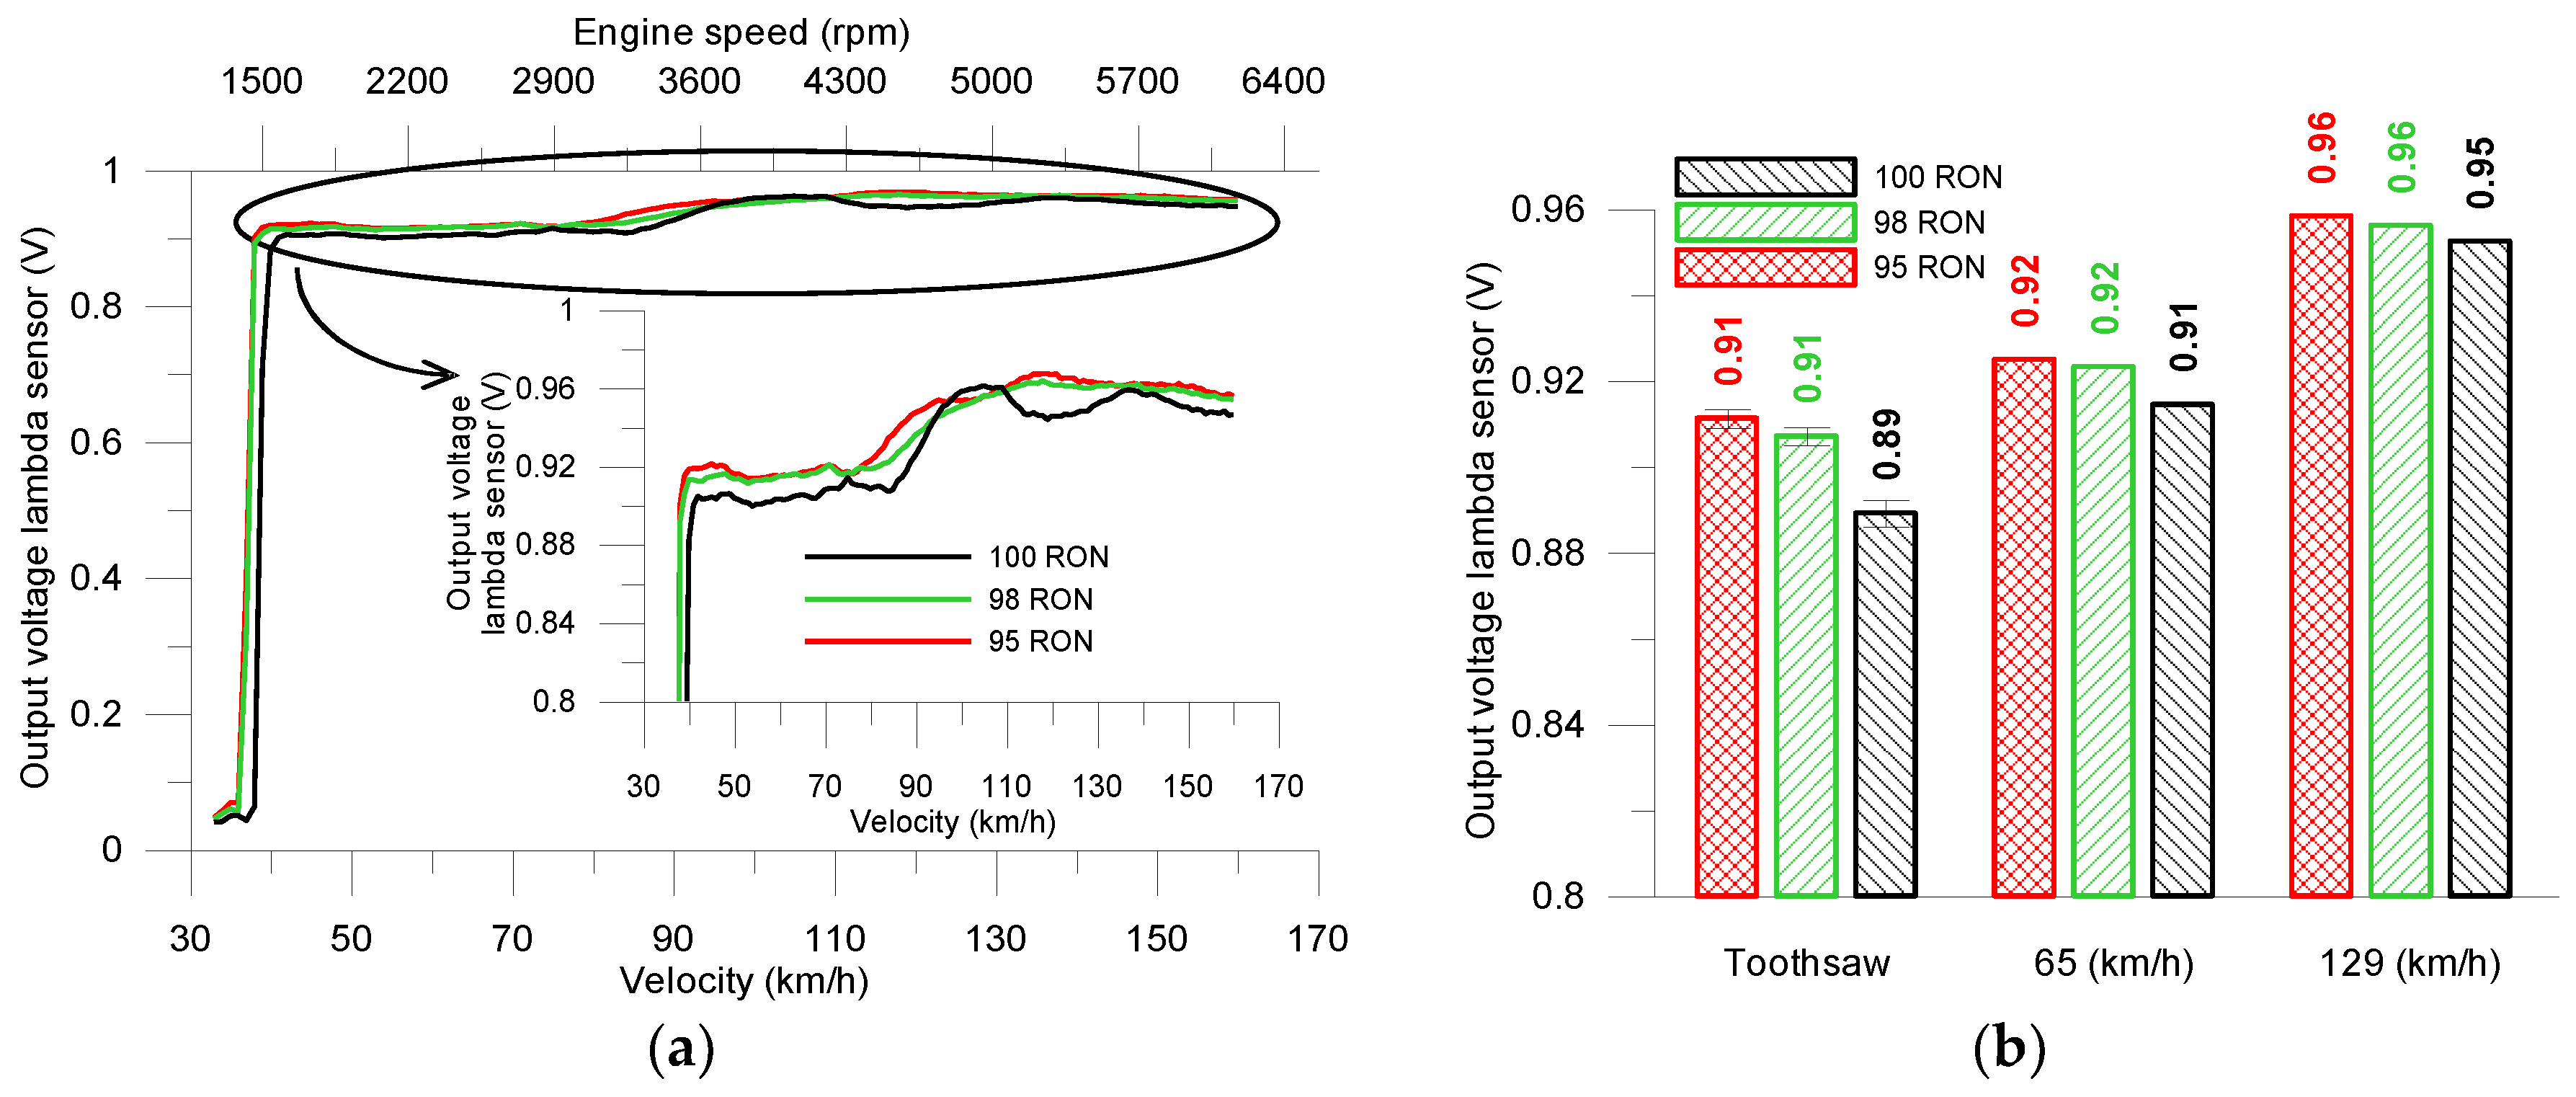
3.3. Gaseous Emissions
4. Conclusions
Author Contributions
Funding
Conflicts of Interest
References
- European Commission. A European Green Deal: Striving to be the First Climate-Neutral Continent. 2019. Available online: https://ec.europa.eu/info/strategy/priorities-2019-2024/european-green-deal_en (accessed on 6 July 2020).
- European Environment Agency. Greenhouse Gas Emissions from Transport in Europe. 2019. Available online: https://www.eea.europa.eu/data-and-maps/indicators/transport-emissions-of-greenhouse-gases/transport-emissions-of-greenhouse-gases-12 (accessed on 6 July 2020).
- Knuutila, L. Blending Strategies and Process Modification for the Future Gasoline Production. Master’s Thesis, Programme in Advance Energy Solutions. Aalto University, Espoo, Finland, 2019. [Google Scholar]
- Kalghatgi, G. Developments in internal combustion engines and implications for combustion science and future transport fuels. Proc. Combust. Inst. 2015, 35, 101–115. [Google Scholar] [CrossRef]
- Williams, J.; Hamje, H. Testing and Modelling the Effect of High Octane Petrols on an Adapted Vehicle; Technical Report No. 8/20; Concawe: Brussels, Belgium, 2020; Available online: https://www.concawe.eu/wp-content/uploads/Rpt_20-8.pdf (accessed on 6 July 2020).
- Stradling, R.; Williams, J.; Hamje, H.; Rickeard, D. Effect of Octane on Performance, Energy Consumption and Emissions of Two Euro 4 Passenger Cars. Transp. Res. Procedia 2016, 14, 3159–3168. [Google Scholar] [CrossRef] [Green Version]
- Kalghatgi, G. Knock onset, knock intensity, superknock and preignition in spark ignition engines. Int. J. Engine Res. 2017, 19, 7–20. [Google Scholar] [CrossRef] [Green Version]
- Pan, J.; Shu, G.; Wei, H. Interaction of Flame Propagation and Pressure Waves during Knocking Combustion in Spark-Ignition Engines. Combust. Sci. Technol. 2014, 186, 192–209. [Google Scholar] [CrossRef]
- Kalghatgi, G.T.; Bradley, D. Pre-ignition and ‘super-knock’ in turbo-charged spark-ignition engines. Int. J. Engine Res. 2012, 13, 399–414. [Google Scholar] [CrossRef]
- Hamilton, L.J.; Rostedt, M.G.; Caton, P.A.; Cowart, J.S. Pre-Ignition Characteristics of Ethanol and E85 in a Spark Ignition Engine. SAE Int. J. Fuels Lubr. 2008, 1, 145–154. [Google Scholar] [CrossRef]
- Dahnz, C.; Han, K.-M.; Spicher, U.; Magar, M.; Schiessl, R.; Maas, U. Investigations on Pre-Ignition in Highly Supercharged SI Engines. SAE Int. J. Engines 2010, 3, 214–224. [Google Scholar] [CrossRef]
- Manz, P.W.; Daniel, M.; Jippa, K.N. Pre-ignition in highly charged turbo-charged engines. Analysis procedure and results. In Proceedings of the 8th International Symposium on Internal Combustion Diagnostics, Baden-Baden, Germany, 10–11 June 2008. [Google Scholar]
- Wang, Z.; Liu, H.; Song, T.; Qi, Y.; He, X.; Shuai, S.; Wang, J. Relationship between super-knock and pre-ignition. Int. J. Engine Res. 2014, 16, 166–180. [Google Scholar] [CrossRef]
- Ceschini, L.; Morri, A.; Balducci, E.; Cavina, N.; Rojo, N.; Calogero, L.; Poggio, L. Experimental observations of engine piston damage induced by knocking combustion. Mater. Des. 2017, 114, 312–325. [Google Scholar] [CrossRef]
- Bi, F.; Ma, T.; Wang, X. Development of a novel knock characteristic detection method for gasoline engines based on wavelet-denoising and EMD decomposition. Mech. Syst. Signal Process. 2019, 117, 517–536. [Google Scholar] [CrossRef]
- Feng, D.; Buresheid, K.; Zhao, H.; Wei, H.; Chen, C. Investigation of lubricant induced pre-ignition and knocking combustion in an optical spark ignition engine. Proc. Combust. Inst. 2019, 37, 4901–4910. [Google Scholar] [CrossRef]
- Shao, J.; Rutland, C.J. Modeling Investigation of Different Methods to Suppress Engine Knock on a Small Spark Ignition Engine. J. Eng. Gas Turbines Power 2015, 137, 061506. [Google Scholar] [CrossRef]
- Lim, G.; Lee, S.; Park, C.; Choi, Y.; Kim, C. Effect of ignition timing retard strategy on NOx reduction in hydrogen-compressed natural gas blend engine with increased compression ratio. Int. J. Hydrogen Energy 2014, 39, 2399–2408. [Google Scholar] [CrossRef]
- Szybist, J.; Foster, M.; Moore, W.R.; Confer, K.; Youngquist, A.; Wagner, R.M. Investigation of Knock Limited Compression Ratio of Ethanol Gasoline Blends. SAE Paper 2010. [Google Scholar] [CrossRef]
- Grandin, B.; Denbratt, I.; Bood, J.; Brackmann, C.; Bengtsson, P.-E.; Gogan, A.; Mauss, F.; Sundén, B. Heat Release in the End-Gas Prior to Knock in Lean, Rich and Stoichiometric Mixtures with and without EGR. SAE Paper 2002. [Google Scholar] [CrossRef]
- Wei, H.; Zhu, T.; Shu, G.; Tan, L.; Wang, Y. Gasoline engine exhaust gas recirculation—A review. Appl. Energy 2012, 99, 534–544. [Google Scholar] [CrossRef]
- Grandin, B.; Ångström, H.-E. Replacing Fuel Enrichment in a Turbo Charged SI Engine: Lean Burn or Cooled EGR. SAE Paper 1999. [Google Scholar] [CrossRef]
- Wang, Z.; Liu, H.; Reitz, R.D. Knocking combustion in spark-ignition engines. Prog. Energy Combust. Sci. 2017, 61, 78–112. [Google Scholar] [CrossRef]
- Zhen, X.; Wang, Y.; Xu, S.; Zhu, Y.; Tao, C.; Xu, T.; Song, M. The engine knock analysis—An overview. Appl. Energy 2012, 92, 628–636. [Google Scholar] [CrossRef]
- Li, T.; Yin, T.; Wang, B.; Qiao, X. Determination of Knock Limited Spark Advance in Engine Cycle Simulation. In Proceedings of the International Symposium on Diagnostics and Modeling of Combustion in Internal Combustion Engines, Okayama, Japan, 25–28 July 2017; Japan Society of Mechanical Engineers: Tokyo, Japan, 2017; p. A103. [Google Scholar]
- Shen, Y.T.; Wang, J.Z.; Shuai, S.J.; Wang, J.X. Effects of octane number on gasoline engine performance. Chin. Int. Combust. Engine Eng. 2008, 29, 52–56. [Google Scholar]
- Shuai, S.-J.; Wang, Y.; Li, X.; Fu, H.; Xiao, J. Impact of Octane Number on Fuel Efficiency of Modern Vehicles. SAE Int. J. Fuels Lubr. 2013, 6, 702–712. [Google Scholar] [CrossRef]
- European Automobile Manufacturers Association (ACEA); European Medicines Agency; JAMA. Worldwide Fuel Charter: Gasoline and Diesel Fuel, 6th ed. 2019. Available online: https://www.acea.be/uploads/publications/WWFC_19_gasoline_diesel.pdf (accessed on 6 July 2020).
- European Commission. Regulation 2017/1151 of 1 June 2017 supplementing Regulation (EC) No 715/2007 (…) to emissions from light passenger and commercial vehicles (Euro 5 and Euro 6) (…). Off. J. Eur. Union 02017R1151, 1-839. 2017. [Google Scholar]
- Han, Z.; Wang, J.; Yan, H.; Shen, M.; Wang, J.; Wang, W.; Yang, M. Performance of dynamic oxygen storage capacity, water–gas shift and steam reforming reactions over Pd-only three-way catalysts. Catal. Today 2010, 158, 481–489. [Google Scholar] [CrossRef]


| Carbon Monoxide Module | |
| Measurement method | Non-dispersive infrared (NDIR) |
| Range | 0–5000 ppm |
| Accuracy | 3% (of measured value) |
| Carbon Dioxide Module | |
| Measurement method | Non-dispersive infrared (NDIR) |
| Range | 0–1000 ppm |
| Accuracy | 3.1% (of measured value) |
| Nitrogen Oxides Module | |
| Measurement method | Chemiluminescence (CLD), vacuum |
| Range | 0–5000 ppm |
| Accuracy | 2.7% (of measured value) |
| Total hydrocarbon module | |
| Measurement method | Flame ionization detector (FID) |
| Range | 0–60,000 ppm |
| Accuracy | 2.7% (of measured value) |
| Emission Regulation | Euro 6b |
|---|---|
| Engine type | SI-IDI, turbocharged, intercooler |
| Compression ratio | 8.8:1 |
| Power @ 5800 rpm | 152 kW |
| Torque @ 1.900–5.800 rpm | 280 Nm |
| Displacement | 1.598 cm3 |
| Bore | 79 mm |
| Stroke | 81.5 mm |
| Gearbox | Manual |
| Valves per cylinder | 4 |
| Octane number (RON) recommended 1 | 100 |
| Total gear ratio (km/h each 1000 rpm) | |
| 1st | 7.2 |
| 2nd | 12.7 |
| 3rd | 20.3 |
| 4th | 28.6 |
| 5th | 35.7 |
| 6th | 44.6 |
| Test | Method | Units | 95 RON | 98 RON | 100 RON |
|---|---|---|---|---|---|
| Research Octane Number | ASTM* D 2699-18a | – | 96.1 | 98.1 | 99.7 |
| Motor Octane Number | ASTM D 2700-18a | – | 85.1 | 87.4 | 87.8 |
| Density 15 °C | ASTM D 4052-18 | kg/m3 | 733 | 735 | 737 |
| Vapor pressure (DVPE) | ASTM D 5191-15 | kPa | 67.1 | 72.5 | 71.9 |
| Vapor Lock Index | EN 228 | – | 903 | 949 | 951 |
| Sulphur | ASTM D 4294-16e1 | mg/kg | 9 | 10 | 10 |
| Lead | EN 237:2005 | mg/L | <5.0 | <5.0 | <5.0 |
| Existent Gums | ASTM D 381-12 (2017) | mg/100 mL | <0.1 | <0.1 | <0.1 |
| Distillation | |||||
| Evaporated 70 °C (E70) | ASTM D 86-17 | % v/v | 33.1 | 32.0 | 33.2 |
| Evaporated 100 °C (E100) | % v/v | 56.3 | 55.9 | 57.2 | |
| Evaporated 150 °C (E150) | % v/v | 82.7 | 82.6 | 83.8 | |
| Final Boiling Point | °C | 194.8 | 191 | 198.0 | |
| Residue | % v/v | 1.0 | 1.1 | 1.0 | |
| Hydrocarbons | |||||
| Olefins | EN ISO 22854:2016 | % v/v | 13.0 | 11.1 | 11.1 |
| Aromatics | % v/v | 27.9 | 24.4 | 24.4 | |
| Benzene | % v/v | 0.5 | 0.7 | 0.7 | |
| Oxygen | % m/m | 2.4 | 2.4 | ||
| Methanol | % v/v | <0.1 | <0.1 | <0.1 | |
| Ethanol | % v/v | 1.2 | 0.7 | 0.7 | |
| Isopropyl alcohol | % v/v | <0.5 | <0.5 | <0.5 | |
| ETBE | % v/v | 7.48 | 13.5 | 13.5 | |
| Other oxygenated compounds | % v/v | <0.1 | <0.1 | <0.1 |
© 2020 by the authors. Licensee MDPI, Basel, Switzerland. This article is an open access article distributed under the terms and conditions of the Creative Commons Attribution (CC BY) license (http://creativecommons.org/licenses/by/4.0/).
Share and Cite
Rodríguez-Fernández, J.; Ramos, Á.; Barba, J.; Cárdenas, D.; Delgado, J. Improving Fuel Economy and Engine Performance through Gasoline Fuel Octane Rating. Energies 2020, 13, 3499. https://doi.org/10.3390/en13133499
Rodríguez-Fernández J, Ramos Á, Barba J, Cárdenas D, Delgado J. Improving Fuel Economy and Engine Performance through Gasoline Fuel Octane Rating. Energies. 2020; 13(13):3499. https://doi.org/10.3390/en13133499
Chicago/Turabian StyleRodríguez-Fernández, José, Ángel Ramos, Javier Barba, Dolores Cárdenas, and Jesús Delgado. 2020. "Improving Fuel Economy and Engine Performance through Gasoline Fuel Octane Rating" Energies 13, no. 13: 3499. https://doi.org/10.3390/en13133499
APA StyleRodríguez-Fernández, J., Ramos, Á., Barba, J., Cárdenas, D., & Delgado, J. (2020). Improving Fuel Economy and Engine Performance through Gasoline Fuel Octane Rating. Energies, 13(13), 3499. https://doi.org/10.3390/en13133499