Abstract
A spark plug calorimeter is introduced for quantifying the thermal energy delivered to unreactive gas surrounding the spark gap during spark ignition. Unlike other calorimeters, which measure the small pressure rise of the gas above the relatively high gauge pressure or relative to an internal reference, the present calorimeter measured the differential rise in pressure relative to the initial pressure in the calorimeter chamber. By using a large portion of the dynamic range of the chip-based pressure sensor, a high signal to noise ratio is possible; this can be advantageous, particularly for high initial pressures. Using this calorimeter, a parametric study was carried out, measuring the thermal energy deposition in the gas and the electrical-to-thermal energy conversion efficiency over a larger range of initial pressures than has been carried out previously (1–24 bar absolute at 298 K). The spark plug and inductive ignition circuit used gave arc-type rather than glow-type discharges. A standard resistor-type automotive spark plug was tested. The effects of spark gap distance (0.3–1.5 mm) and ignition dwell time (2–6 ms) were studied for an inductive-type ignition system. It was found that energy deposition to the gas (nitrogen) and the electrical-to-thermal energy conversion efficiency increased strongly with increasing gas pressure and spark gap distance. For the same ignition hardware and operating conditions, the thermal energy delivered to the gap varied from less than 1 mJ at 1 atm pressure and a gap distance of 0.3 mm to over 25 mJ at a pressure of 24 bar and a gap distance of 1.5 mm. For gas densities that might be representative of those in an engine at the time of ignition, the electrical-to-thermal energy conversion efficiencies ranged from approximately 3% at low pressures (4 bar) and small gap (0.3 mm) to as much as 40% at the highest pressure of 24 bar and with a gap of 1.5 mm.
1. Introduction
Spark ignition engines rely on the thermal energy deposited by the spark plasma into the in-cylinder gases to initiate combustion each engine cycle. The thermal energy density must be sufficient to initiate and sustain the nascent flame kernel until the chemical heat release from the flame kernel is enough to create a self-sustaining pre-mixed turbulent flame that propagates throughout the combustion chamber on a millisecond time scale. The reliability of the ignition process depends on many factors including fuel type, fuel–air mixture ratio, mixture homogeneity, dilution (e.g., exhaust gas recirculation (EGR) level), residual fraction, in-cylinder bulk flows and turbulence, spark plug geometry, spark timing and duration, and the characteristics of the electrical energy delivery [1]. These factors can impact the amount of thermal energy deposition to the gas from the plasma and its distribution in the vicinity of the spark gap. High dilution rates and lean mixtures pose especially challenging conditions for achieving reliable combustion initiation that minimizes cycle-to-cycle variation.
Ever more detailed ignition submodels that couple to engine computational fluid dynamics (CFD) simulation codes such as Converge CFD® are being developed [2,3,4]. They are increasingly based on spatially-resolved spark gap physics and can include coupling to dynamic ignition circuit models. Validation of the electrical-to-thermal energy conversion and gas-to-electrode heat transfer rates is needed for these models.
For the above reasons, it is important to understand the characteristics of the thermal energy deposition from the engine spark plasma to the gases. Many fundamental studies of spark breakdown behavior have been conducted. Some of these studies are summarized in Meeks [5]. A wealth of information and data characteristic of the behavior of spark ignition systems of the type used in engines can be found in Maly [6]. By measuring the ignition voltage and current characteristics at the spark plug, it is possible to determine the electrical energy delivered to the spark gap [7], but that does not quantify the thermal energy deposited in the gas in the gap that is responsible for flame initiation. For this purpose, spark plug calorimeters have been developed that will measure the thermal energy deposition. These calorimeters measure the pressure rise of the gas in a small chamber in which the spark plug is located to determine the thermal energy input to the gas.
This work reports on the development of a spark plug calorimeter that uses very sensitive interchangeable pressure sensors to measure the differential pressure rise of the chamber gases relative to the initial chamber pressure and is designed to function at very high pressures (>20 bar). The calorimeter was then used to investigate the thermal energy deposition and efficiency of electrical-to-thermal energy conversion of arc-type spark plug discharges for an inductive ignition system for different pressures, gap distances and dwell times.
High pressure measurements are of increasing interest due to the current push by many engine manufacturers to develop ever higher brake mean effect pressure (BMEP) engines that rely on increasingly high boost pressures. Most previous studies that have used spark calorimeters have relied upon pressure sensors that measured the spark plug chamber gauge pressure relative to the ambient atmospheric pressure or are designed for use at high pressures and measure relative to an internal reference. By measuring the differential chamber pressure relative to the initial pressure, more sensitive measurements with a higher dynamic range are possible.
Several studies that used spark plug calorimeters are found in the literature. Roth et al. [8] first introduced the measurement of spark energy delivered to the gas with both constant-volume and constant-pressure calorimeters. They performed a fundamental study of the effects of the electrode diameter, gap distance, and thermal diffusivity of the gas on the electrical-to-thermal energy conversion efficiency with monatomic gases. They found that more of the electrical energy from the spark was lost to the electrodes with larger electrode diameter, shorter gap distance, and gases with larger thermal diffusivity. Merritt [9] was first to create a spark calorimeter consisting of two chambers and a differential pressure transducer. It was constructed of plastic and was used to measure spark energy thermal deposition at atmospheric pressure. The extra reference volume was said to eliminate the short-term fluctuations in atmospheric pressure. This differential pressure sensing concept for a spark calorimeter was adopted by Franke and Reinmann [10]. They measured the energy delivered to the gas comparing five different ignition systems that included both capacitive and inductive ignition types at pressures up to 16 bar; all of the systems delivered breakdown followed by glow discharges, without a discernable arc phase. The mean electrical-to-thermal energy conversion efficiency increased from 5% to 50% as the pressure varied from 1 to 16 bar, and for a given level of delivered electrical energy, the efficiency increased as the duration of the discharge increased.
While the concept of a spark plug calorimeter based on differential pressure measurement is the same here as that presented by Franke and Reinmann, the present paper goes beyond their work in several significant ways, both in terms of the experimental technique and the conditions analyzed. With respect to the calorimeter design, one difference is that in this study we used inexpensive and easily changeable solid-state semiconductor pressure sensors with different sensitivities such that we could exchange them to adapt to different expected pressure rises, allowing us to maximize the dynamic range of the measurements. Another novel feature of this calorimeter is the system that allowed the pressure sensor to be calibrated at high pressure for very small pressure differentials. The relatively small calorimeter volume resulted in greater pressure rises for a given thermal energy deposition, further increasing the potential accuracy of the measurements.
With respect to the differences in experimental conditions, the present study extended the pressure range of the measurements by 50% relative to that of the study by Franke and Reinmann. This is especially significant for application to advanced natural gas engines under development by various engine manufacturers. These engines are designed for ever higher boost conditions and high BMEPs that result in ever higher gas densities at the time of ignition. In addition, this study is primarily focused on arc-type discharges. Franke and Reinmann stated that “In this experiment, no transition to arc mode has been observed”, implying that they believed that the plasma discharges that they observed were in the glow regime. Further, in this study, we present empirically-based analytical expressions for how differential or incremental changes in thermal energy deposition scale with changes in either gap distance or gas pressure.
Other spark calorimeter studies found in the literature used calorimeters that measured the chamber pressure relative to the outside ambient pressure, a simpler method, but one that compromises sensitivity and dynamic range, particularly at high initial pressures. Teets and Sell [11] used such a calorimeter to study the thermal energy deposition characteristics of three different ignition systems that included an inductive system, a plasma jet ignitor and an ultra-short pulse ignitor. Measurements were to pressures up to 7 bar. They found conversion efficiencies varied from 5% to 65%, increasing with pressure and gap distance. They found that electrical-to-thermal energy conversion efficiency decreased as the delivered electrical energy increased, and also found the efficiency of the ultra-short pulse system higher than the inductive system.
Verhoeven [12] took a different approach to measure thermal energy deposition to the gas from a spark plasma, using an optical holographic technique. Uncertainties associated with the technique were greater than for calorimeters, but it had the advantage of allowing measurements in flowing gases. However, the flow measurements were only made at a pressure of 1 atm. They found that with a cross-flow velocity of 5 m/s, energy deposition efficiency was approximately three-fold that for a quiescent gas.
In a limited study, Abidin et al. [13] investigated the effect of dwell time, gap distance, and pressure on the breakdown voltage and the electrical-to-thermal energy conversion efficiency using a standard spark calorimeter. The electrical-to-thermal efficiency increased with larger gap distance, shorter dwell time, and higher pressure. However, the highest pressure investigated was 9 bar. Alger et al. [14] used a spark calorimeter to measure the energy delivered to the gas while investigating the effect of spark plug design on the initial flame kernel development. They found typical electrical-to-thermal energy conversion efficiencies of approximately 20% and found that spark plugs with high internal resistances had higher thermal energy depositions, which resulted in faster flame kernel development.
In this study, a spark plug calorimeter was used to measure the thermal energy delivered to the nitrogen gas surrounding the spark gap during spark ignition. Unlike most other spark plug calorimeters, which measure the small pressure rise of the gas above the relatively high gauge pressure or relative to an internal reference, the present calorimeter measured the differential rise in pressure relative to the initial pressure in the calorimeter chamber. Using this calorimeter, a study was carried out, measuring the thermal energy deposition in the gas and the electrical-to-thermal energy conversion efficiency over a larger range of initial pressures than has been carried out previously. The measurements were made at pressures up to 24 bar. A pressure of 24 bar at the ambient temperature at which the measurements were made (approximately 22 °C) results in gas densities equivalent to approximately 50 bar for a gas temperature at the time of ignition of 600 K or 70 bar at 900 K. The spark plug and inductive ignition circuit used gave arc-type rather than glow-type discharges. For example, for a reasonable intercooler exit temperature of 350 K, with this also taken as the intake temperature, and assuming a compression ratio of 10 while assuming polytropic compression with a typical polytropic exponent of 1.33, yields a TDC temperature of approximately 750 K. An ignition timing at or near TDC is often utilized in modern SI engines to enhance catalyst heating after startup.
2. Calorimeter Design
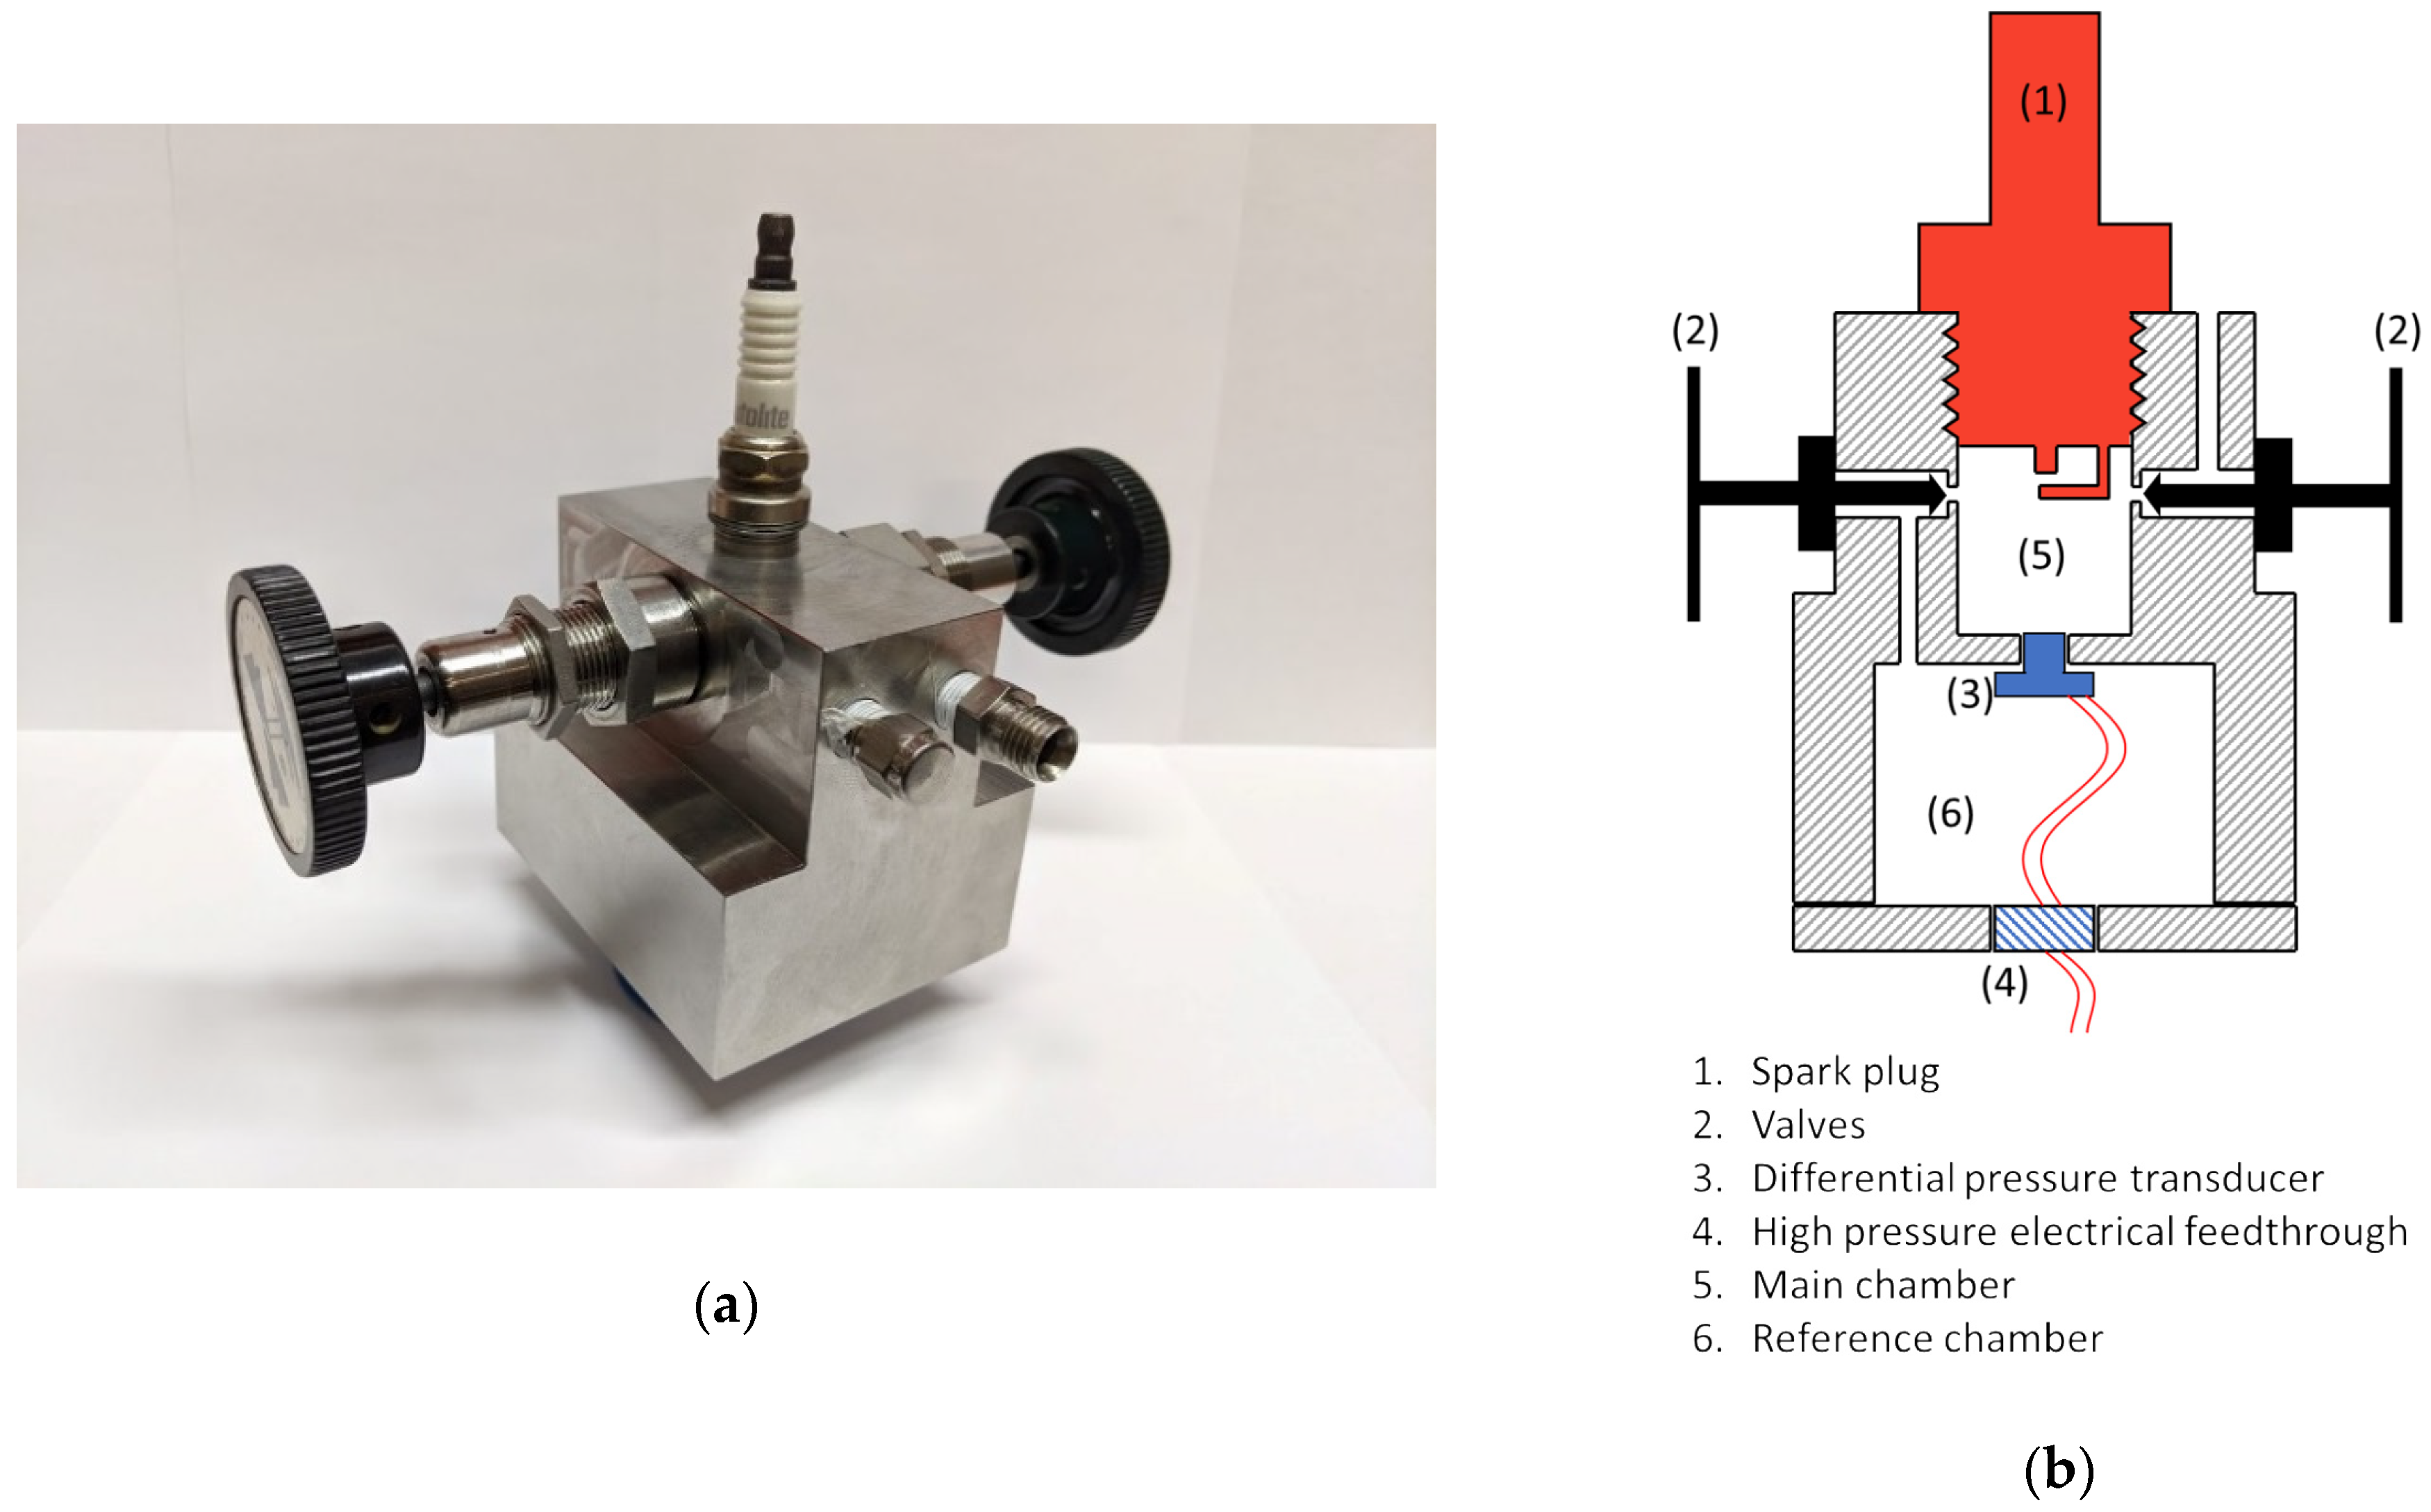
A photo of the calorimeter is shown in Figure 1a, along with a cross-sectional drawing shown in Figure 1b. It was machined from stainless steel in two pieces and accommodates a 14 mm spark plug. The calorimeter has two chambers, a small cylindrical chamber into which the spark plug is inserted and a second chamber in which the chip-based pressure sensor is located. The pressure sensor is mounted through a small hole that connects the two chambers. Two valves are used. One valve is used to fill the two chambers with gas (with both valves open). That valve is then closed to stop the flow of gas into the chambers. The second valve is then closed, which isolates the two chambers except for the small hole between them into which the pressure sensor entrance passage is sealed. The spark plug chamber is cylindrical in shape, with a diameter of 12.8 mm, a height of 9.5 mm, and a volume of 1.8 cm3. The pressure sensor is sealed within the second cavity of the calorimeter. A high pressure electrical feedthrough is passed the necessary wires for signal and power source to the outside.
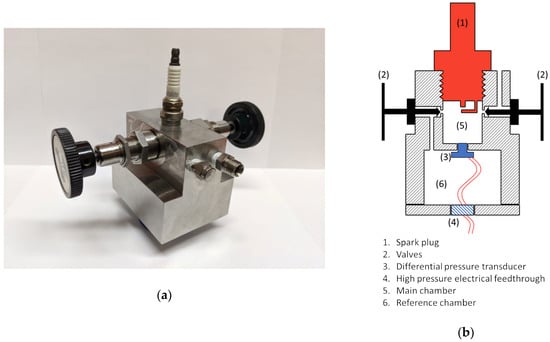
Figure 1.
(a) Photo of spark calorimeter; (b) section drawing of the calorimeter.
The pressure sensors used were board mounted integrated silicon pressure sensors. Two types were used for the measurements presented here—one with a 3.9 kPa pressure range and another with a 10 kPa pressure range—depending on the expected pressure levels. The model numbers of the two sensors available from Freescale (USA) were NXP MP3V5004GC6U and MP3V5010GC6U for the 3.9 and 10 kPa sensors respectively. The 1/e response time of the sensors was approximately 0.2 ms. This was fast enough to quantify the trends in the cumulative energy deposition of an ignition event, but was not fast enough to resolve the thermal energy deposition associated with the breakdown process, which occurs on a submicrosecond time scale.
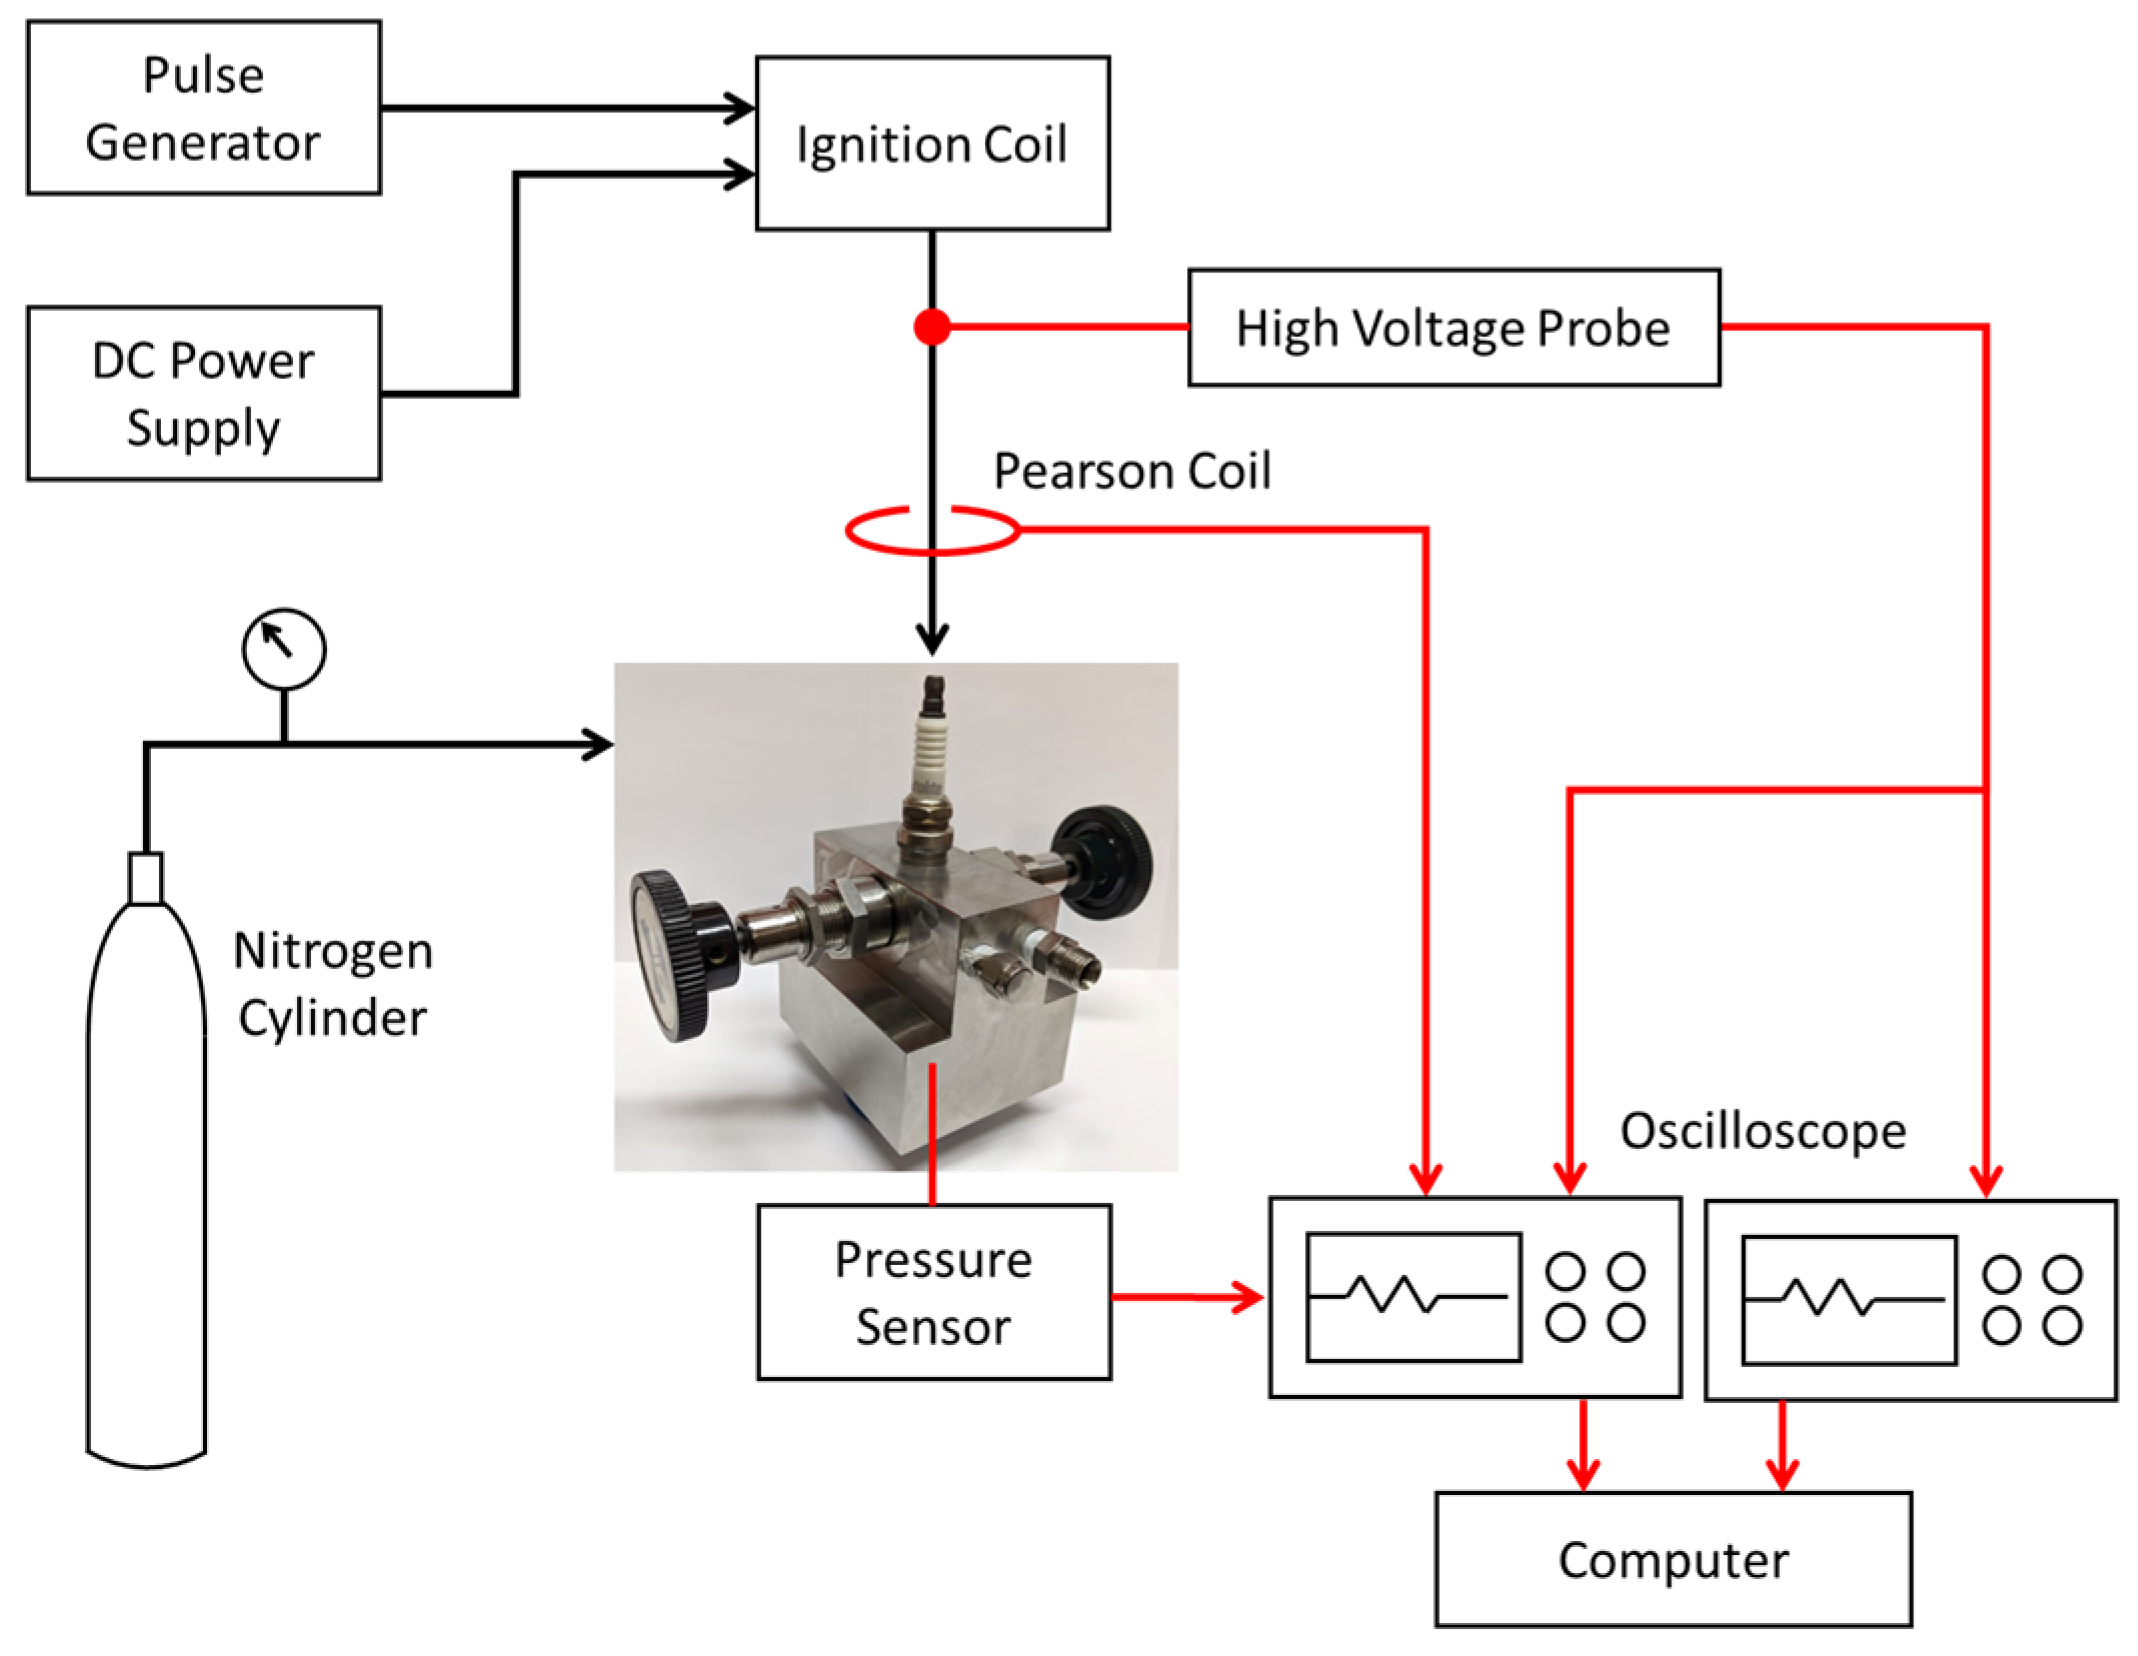
Figure 2 shows a schematic of the calorimeter experimental setup. For the measurements, the calorimeter was pressurized with nitrogen gas to the desired level. The charging pressure was measured using precision Bourdon tube pressure gauges. Time-resolved measurements of spark plug voltage and current were taken to determine the electrical energy delivered to the spark plug. A Tektronix Model P6015A high voltage probe measured the breakdown and follow-on voltages at the top of the spark plug. The current-dependent resistance of the plug was determined and the IR voltage subtracted from the voltage measured at the top of the plug to obtain the gap voltage. A Pearson Model 110 current sensor was used to measure the discharge current. The voltage, current, and pressure sensor signals were recorded using a 100 MHz 4-channel Tektronix oscilloscope. Breakdown voltages were recorded separately since a faster time-base setting was needed to resolve these very short duration events.
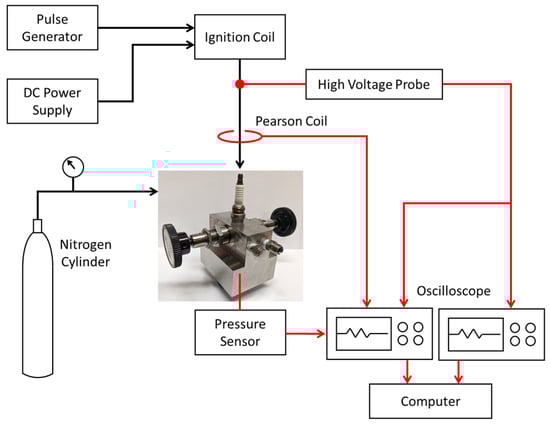
Figure 2.
Schematic of calorimeter setup.
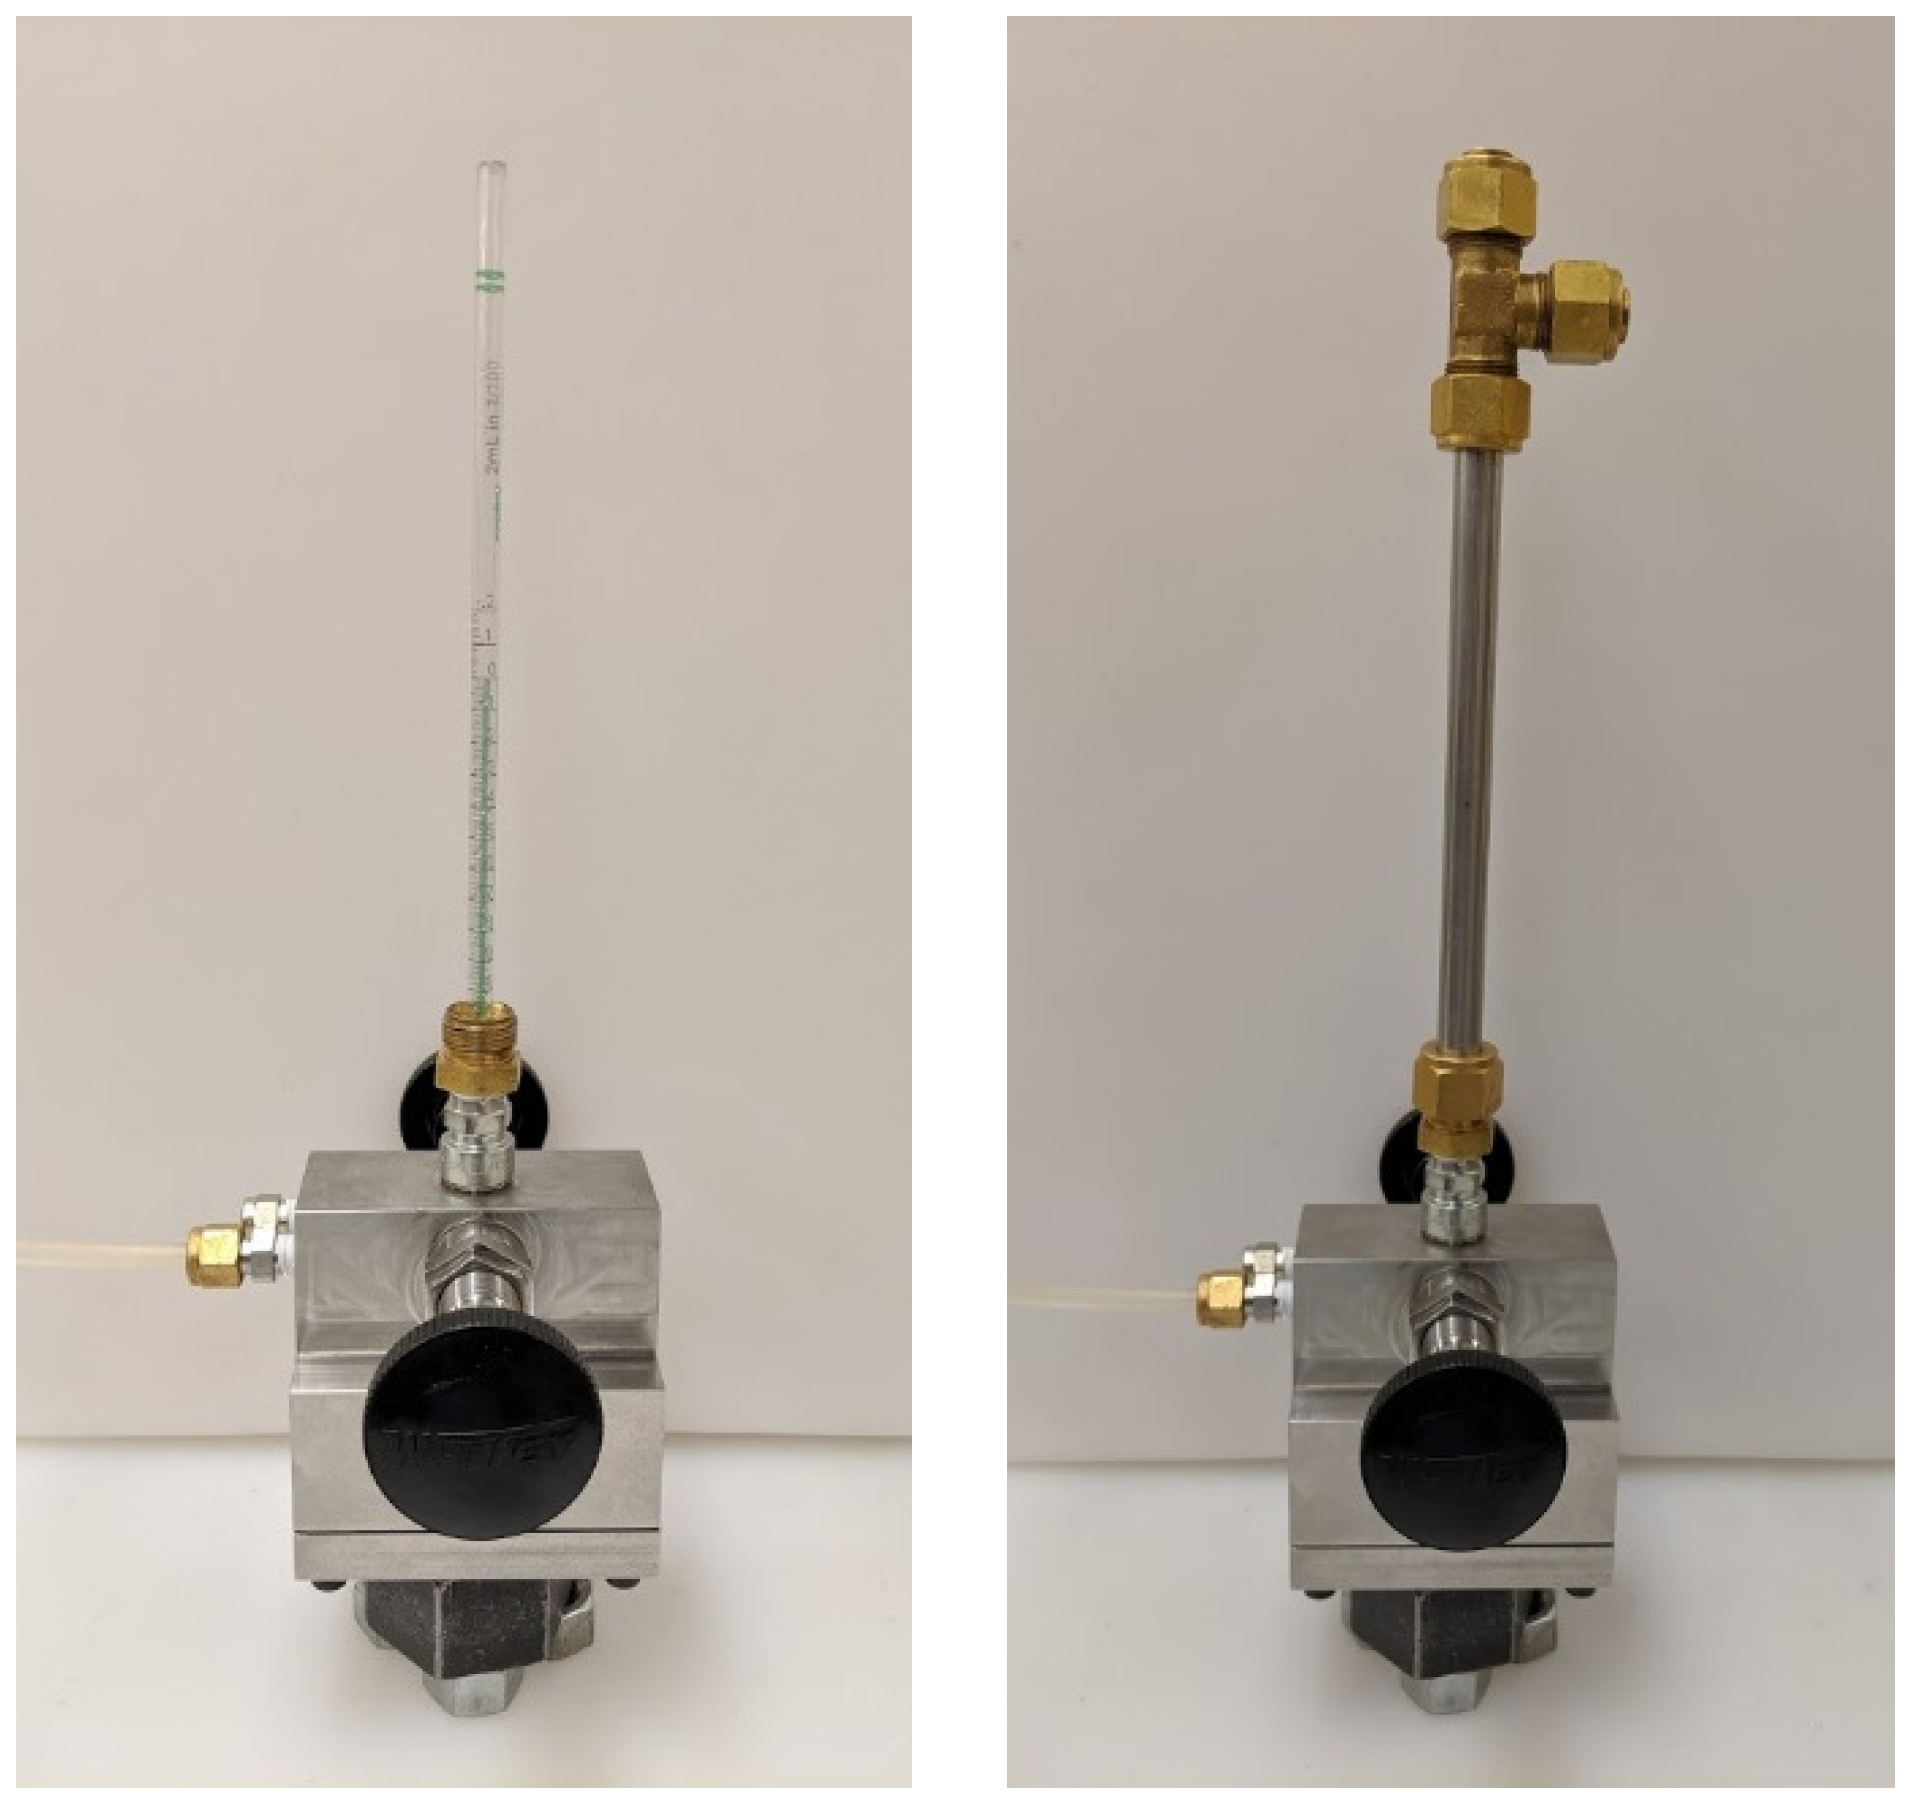
The chip-based sensors used to measure the change in chamber pressure that resulted from the spark discharge were intended, by the manufacturer, to measure small differential pressures relative to the ambient barometric pressure. Since the intention was to make measurements at high pressure, the sensors needed to be tested for their response at high pressure. To do this, a calibration procedure was developed that tested the pressure sensors in situ. The calibration device is depicted in Figure 3. A glass pipette was inserted through the spark plug hole and coupled to the passage tube of the pressure sensor with a short piece of plastic tubing. The pipette was then filled with water to a water column height that gave the desired pressure differential, the pipette thus acting as a manometer. A closed-end stainless steel tube was then fit over the pipette and secured with tube fittings. The two chambers of the calorimeter were when charged with nitrogen to the same gas pressure; the difference in pressure between the two chambers at the pressure sensor was the pressure imposed by the vertical column of water. This method allowed the pressure sensors to be calibrated for different high initial pressures and provided pressure measurements relative to the initial pressure.
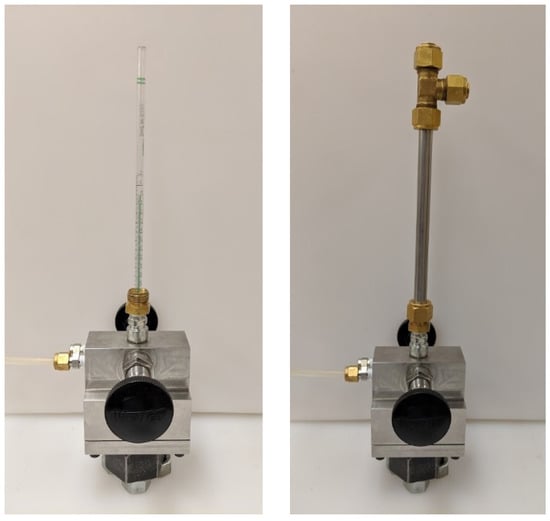
Figure 3.
Photo of calorimeter with calibration tube attached.
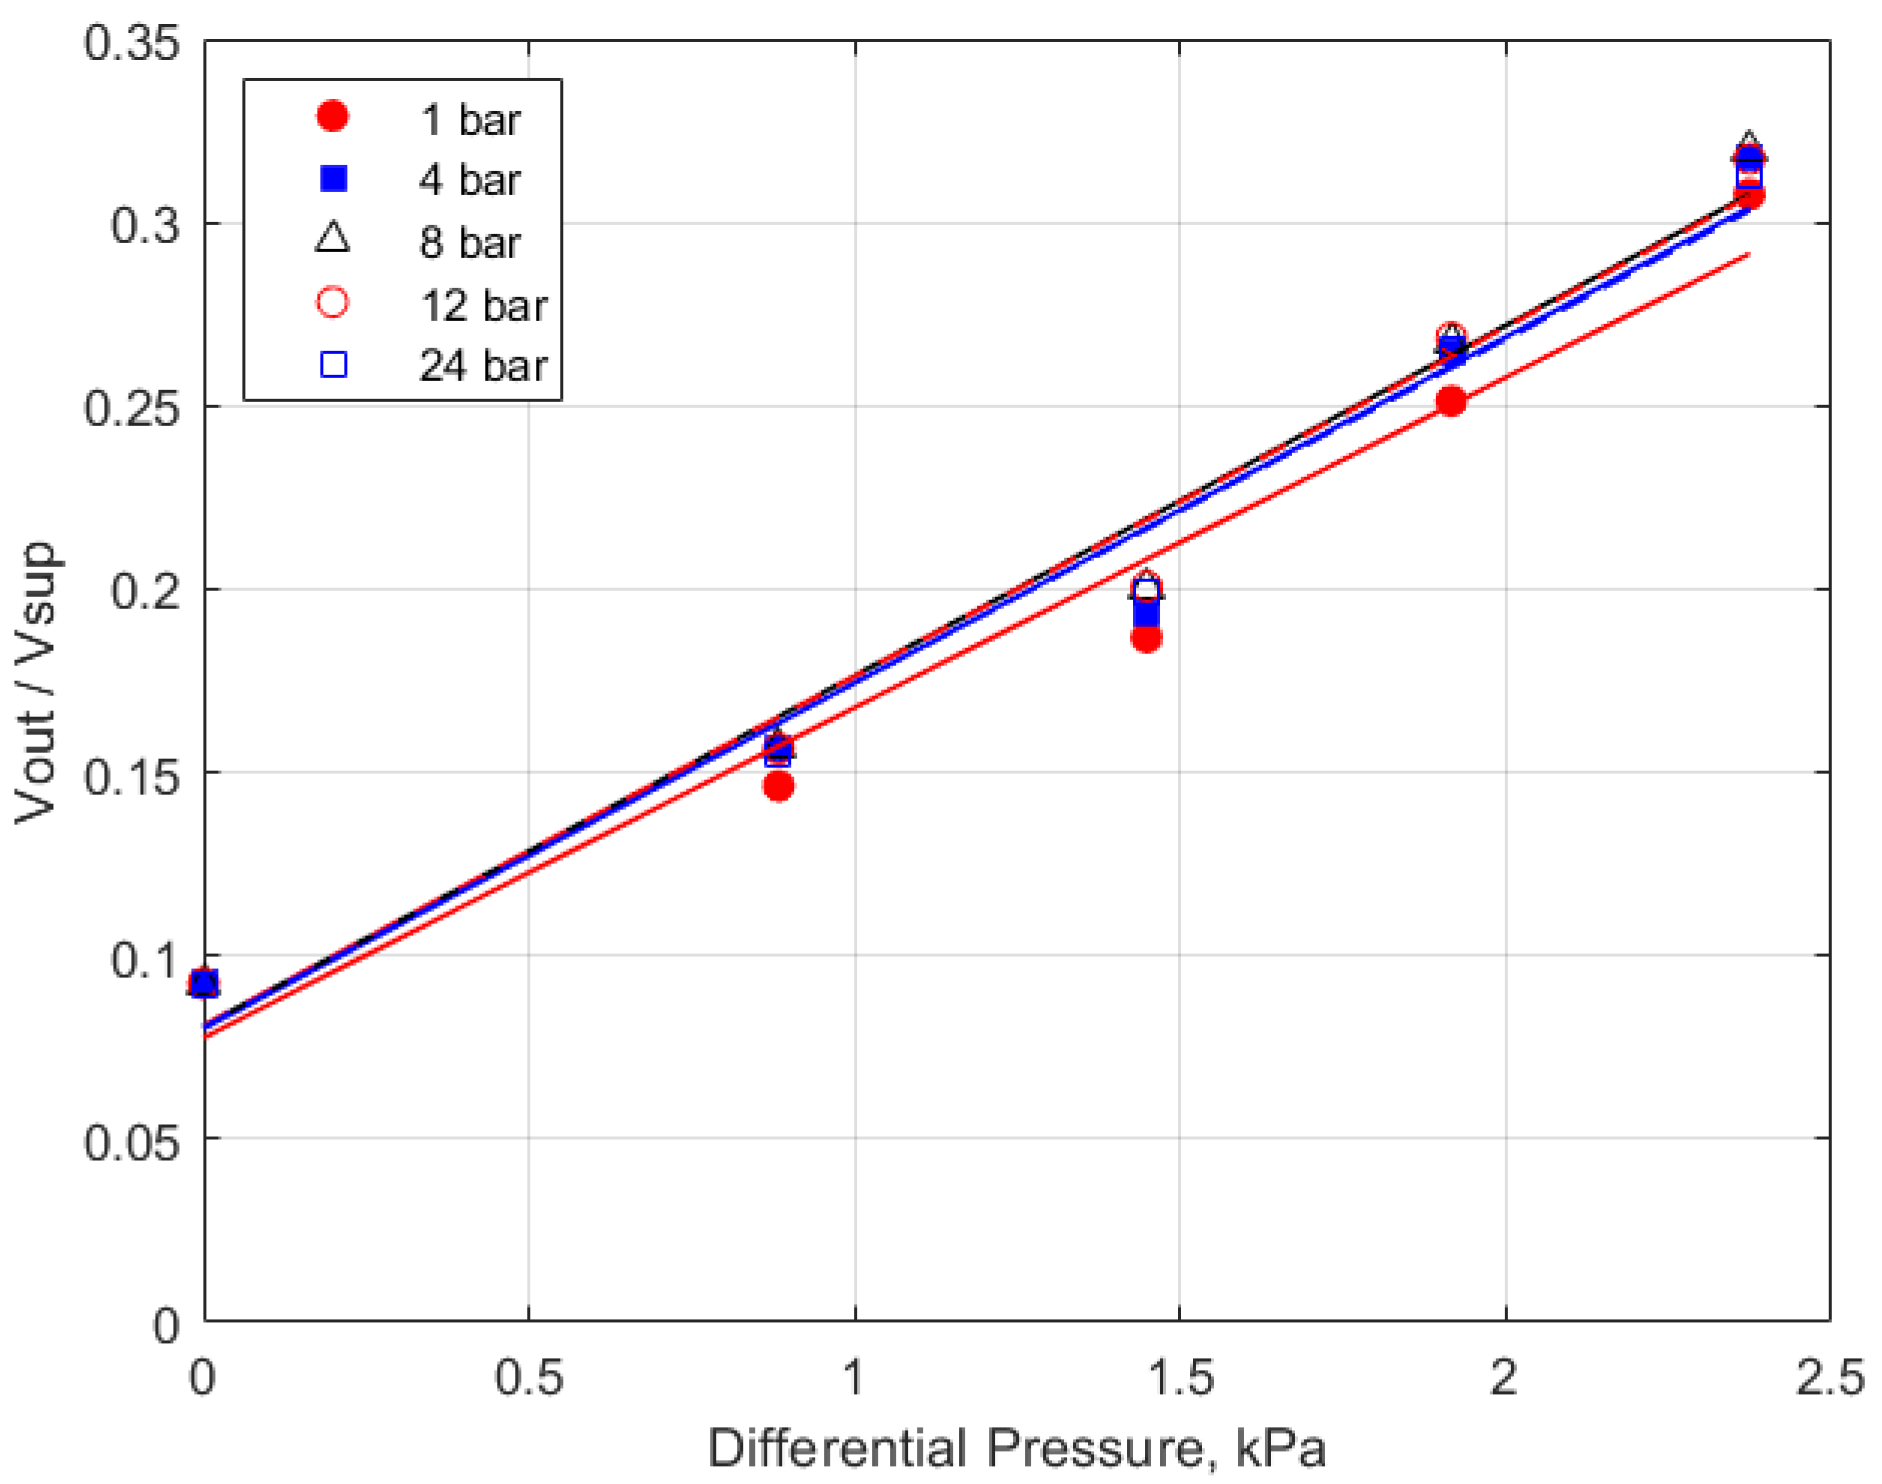
The calibration data for the 10 kPa range sensor is shown in Figure 4, which shows the measured voltage output of the pressure sensor versus the differential pressure imposed by the water column height for initial total gas pressures from 1 atm to 24 bar. The response of the pressure sensor is shown over the measured range; there was no systematic differential response to the initial pressure. The scatter/reproducibility of the calibration data provides an estimate of the uncertainty in the accuracy of the pressure measurements of less than ± 0.3 kPa.
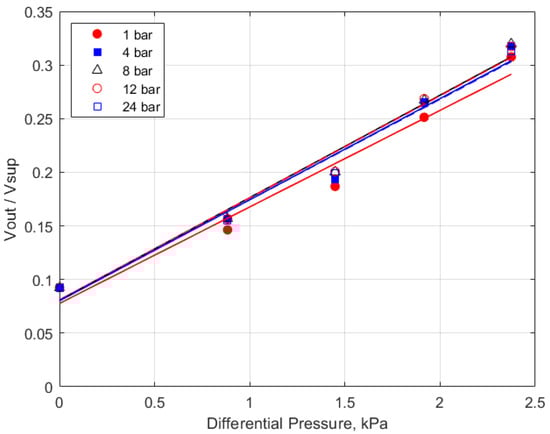
Figure 4.
Calibration graph for the differential pressure sensor.
3. Results and Discussion
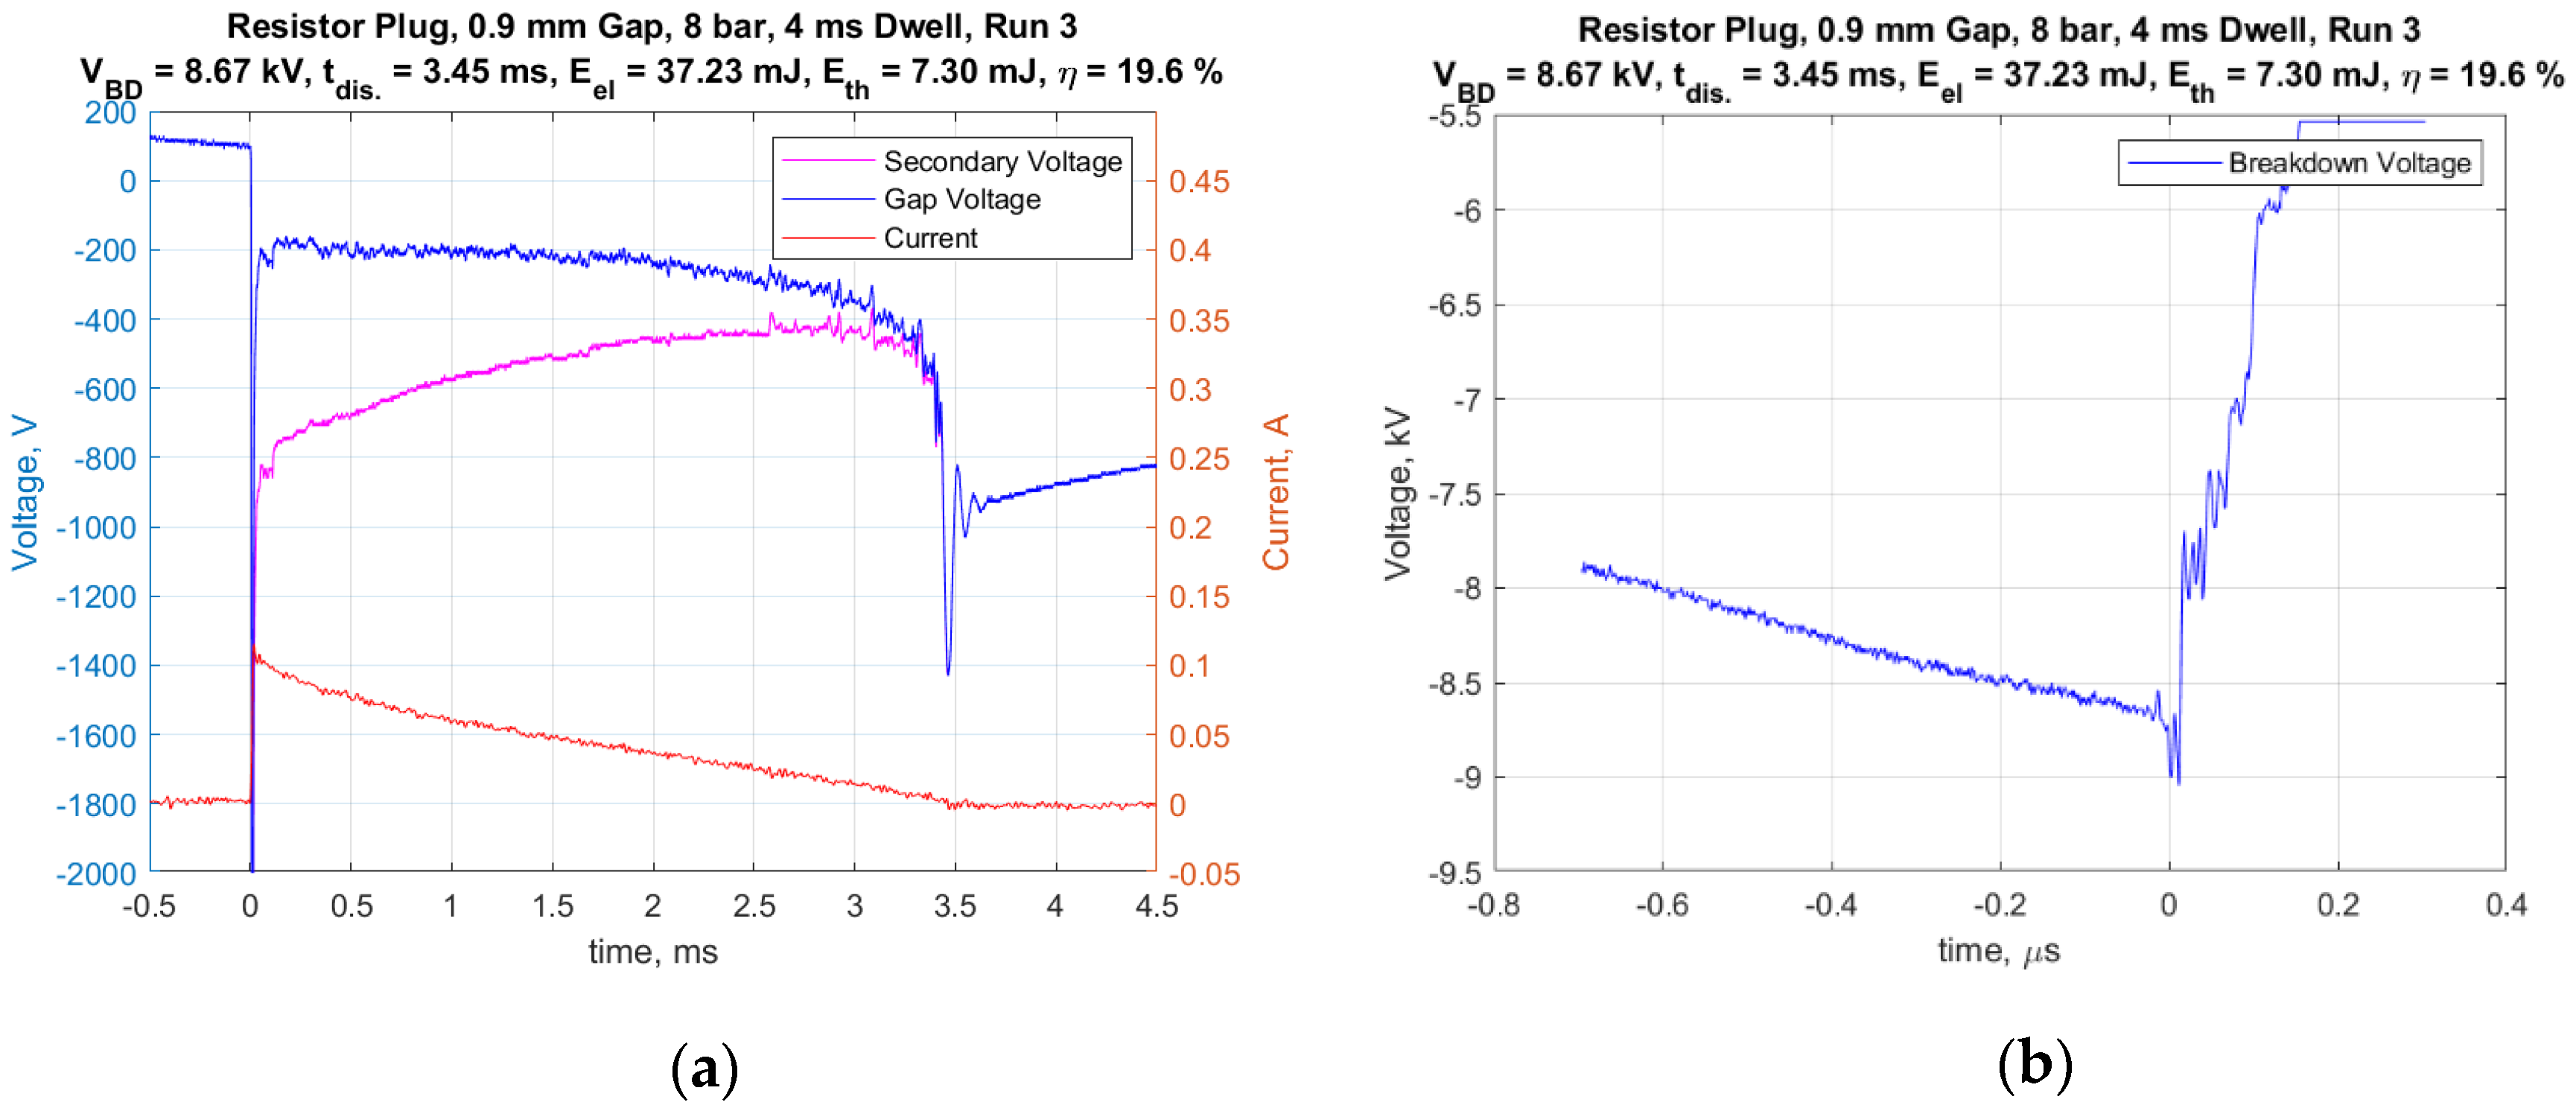
A standard representative 14 mm automotive spark plug (Champion RS12YC) was used for all of the tests. The center electrode (cathode) had a diameter of 2.5 mm and the width of the J-type ground strap was also 2.5 mm. It had a nominal internal resistance of 6.1 kohms. The inductive-type ignition coil had a secondary inductance value of 30 H. The default dwell time used was 4 ms. However, the effect of dwell times of 2 and 6 ms were studied as well. Figure 5a presents an example of the measured current delivered to the spark plug and a voltage trace corrected for the voltage drop across the internal resistor, and thus, represents the gap voltage. The integrated product of the corrected gap voltage and the current was used to calculate the electrical energy delivered to the gap. These representative traces were for conditions of 8 bar absolute gas pressure, with a 0.9 mm gap and a dwell time of 4 ms. Figure 5b shows a typical voltage trace having a short time scale as used to measure the breakdown voltage. The breakdown voltage for this trial was 8.67 kV and the spark duration was 3.45 ms.
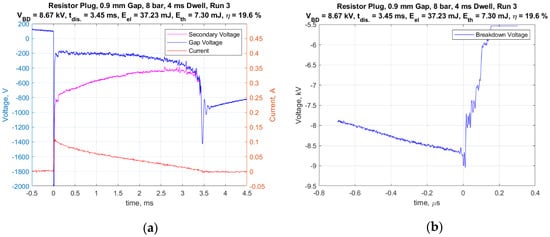
Figure 5.
(a) Current and voltage vs. time for entire discharge duration and (b) voltage vs. time for breakdown.
It is interesting to note that for all gas pressures above 1 atm, the ignition system produced an arc-type discharge, whereas for 1 atm pressure and the smallest spark gap of 0.3 mm, an arc to glow transition occurred immediately following breakdown. This was readily distinguished by the level of the relatively flat voltage profile following breakdown. The arc discharges were in a range of approximately 100–300 volts, whereas glow discharges were in the range of approximately 400–500 volts. For all of the measurements, the peak current following breakdown was approximately 100 mA and decreased nearly linearly with time, but with different spark durations.
Figure 6a shows an example of recorded pressure traces for different initial gas pressures ranging from 1 to 24 bar. In general, the pressure rise was very rapid during the early part of the discharge, consistent with the high current levels during that period and representative of the large energy deposition during the breakdown process and shortly thereafter.
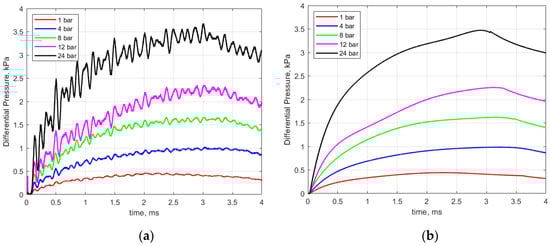
Figure 6.
(a) Recorded pressure rise vs. time for different initial gas pressures and (b) smoothed pressure traces used for analysis. Gap distance 0.9 mm; dwell 4 ms.
As seen in Figure 6a, there is a periodic ringing superimposed upon the pressure signal. For the 1 atmosphere case, this sinusoidal pressure variation superimposed on the signal has a frequency of approximately 2.4 kHz. Considerable effort was made to understand the cause of this. It was initially attributed to an acoustic mode excited in the short (4 mm in length) passage tube that was part of the pressure sensor. To test for this, the passage tube was cut off and a new holder for the pressure sensor was machined to fit and seal the new sensor geometry. Subsequent tests revealed that the ringing remained but that it occurred at an increased frequency of approximately 6.1 kHz. At this point, a more detailed acoustic analysis was performed that considered possible acoustic modes associated with the calorimeter chamber and also considered the system response of the pressure transducer.
The calorimeter chamber is to first order a right circular cylinder with rigid acoustic boundary conditions and is the largest acoustic cavity in the system, and hence must exhibit the lowest acoustic cavity resonance frequency. Given the aforementioned dimensions, and considering the 1 atmosphere case and room temperature, the lowest-order resonance frequency is for approximately one-half wavelength acoustic fluctuations standing in the largest spatial dimension (12.8 mm), which yields a resonance frequency of approximately 13.4 kHz. All other acoustic standing wave modes must be higher in frequency. For example, the next largest dimension is the length of the calorimeter chamber, which at 9.5 mm yields approximately 18 kHz for the lowest-order resonance frequency. These frequencies are significantly higher than the fluctuations observed in the experimental data, and hence the observed ringing should not be attributed to acoustic standing wave modes in the system. To verify this, a spark plug and the pressure sensor were placed close together outside of the calorimeter, and operated in free space. A spark discharge was measured and the ringing in the pressure signal was still observed.
Below the lowest-order standing wave modal frequency, acoustic lumped-parameter behavior can occur and the pressure sensor contains elements that form a Helmholtz resonator. The air inside the passage tube acts as an acoustic mass, and the air inside the cavity within the sensor acts as an acoustic compliance. Together, these form a simple harmonic oscillator, which can be excited by a broadband source of energy, such as the shock generated by the spark [15]. Examination of both the sensor’s specification sheet and the sensor itself yielded estimates of the dimensions of the structures required for the calculation of the Helmholtz resonance frequencies using
where c = 343 m/s is the speed of sound at room conditions, S is the inner area of the passage tube, and V is the volume of the cavity. The effective length of the passage tube is L′ = L + 1.4a, where L is the actual length of the passage tube and a is its inner radius [16]. For the case with the passage tube attached, the predicted Helmholtz resonance frequency is 2.4 kHz and the observed frequency was 2.1 kHz. With the passage tube removed, L = 0, and the appropriate effective length is L′ = 1.7a [16]. The predicted Helmholtz resonance frequency is 6.4 kHz and the observed frequency was 6.1 kHz. Both observations match the predictions within the uncertainty of the estimate of the dimensions, hence the observed fluctuations appear to be an artifact due to Helmholtz resonator behavior of the sensor.
The tabulated sensor design specifications include a first-order system time constant of 0.45 ms, which in turn yields a low-pass system response with an upper band limit of approximately 350 Hz, hence the sensor is not designed to accurately measure the effects of the initial shock, nor dynamic pressure fluctuations above approximately 350 Hz. Before performing the analyses relating the pressure rise to the thermal energy deposition, the pressure curves were smoothed to remove the Helmholtz resonator artifacts, as shown in Figure 6b.
The thermal energy deposition to the chamber gas was derived from the measured pressure rise using Equation (2) [13]. Of the electrical energy delivered to the gap, a portion is retained as thermal energy within the gas with the remainder lost as heat transfer, primarily to the electrodes. Equation (2) expresses the effect of the retained thermal energy of the gas on the rise in pressure assuming chemical and thermal equilibrium and using the simplifying assumptions of constant specific heat and ideal gas behavior.
In Equation (2), V is the chamber volume, ΔP is the maximum pressure rise and γ is the ratio of specific heats of nitrogen. The relative contributions of possible heat loss mechanisms are not clear. The difference in temperature between the plasma/gas and the spark plug surfaces will contribute to thermal heat transfer, while there may also be Ohmic losses along the surfaces of the electrodes. To be representative of an engine, the heat losses should reflect the sources of loss in an engine, and not for example, due to heat loss to the walls of the calorimeter. A small decrease in chamber pressure was sometimes observed toward the end of the spark discharge process (e.g., Figure 6) indicating continued heat transfer. It is likely that this thermal heat transfer was to the spark plug electrodes and not to the chamber walls over this period since an estimate of molecular thermal diffusion to the chamber walls yields a characteristic time of 100 s of milliseconds. In this study, we defined the amount of thermal energy delivered to the gas to be that reflected by the maximum of the measured pressure rise. Over the short duration of the spark, the gas is not in thermal equilibrium, as temperature gradients exist. As a result, the application of Equation (2) implies a spatial mass average of the thermal contributions to the pressure of the different temperature layers. This should be valid because of the linear relationship between mass, temperature and the pressure as given by the ideal gas law and the linear relationship between thermal energy and temperature inherent in the constant specific heat assumption. In addition, during the spark discharge, not all of the gas exists as N2 since there is dissociation of the nitrogen in the spark plasma; however, only a small fraction of the gas is so affected and equilibrium processes will have largely returned this gas to N2 by the time the spark event has ended.
The measured spark breakdown voltages as functions of the initial gas pressure and spark gap are shown in Figure 7 and Figure 8 for a dwell time of 4 ms. Each data point represents an average of five measurements.
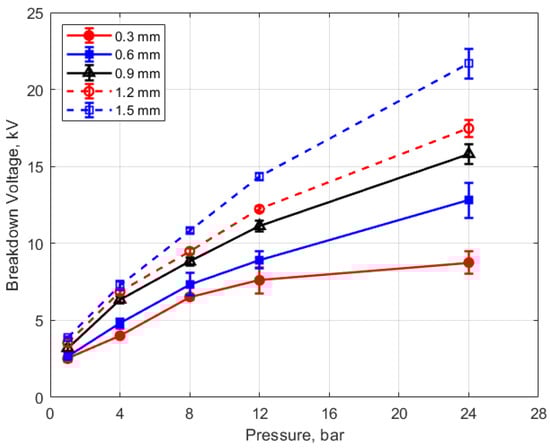
Figure 7.
Breakdown voltage vs. initial pressure for different gaps, for a dwell time of 4 ms.
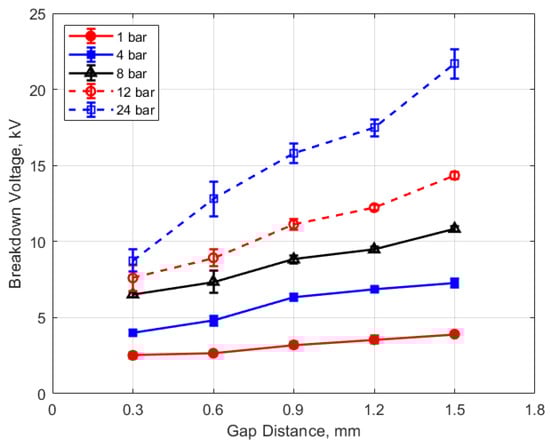
Figure 8.
Breakdown voltage vs. gap for different pressures, for a dwell time of 4 ms.
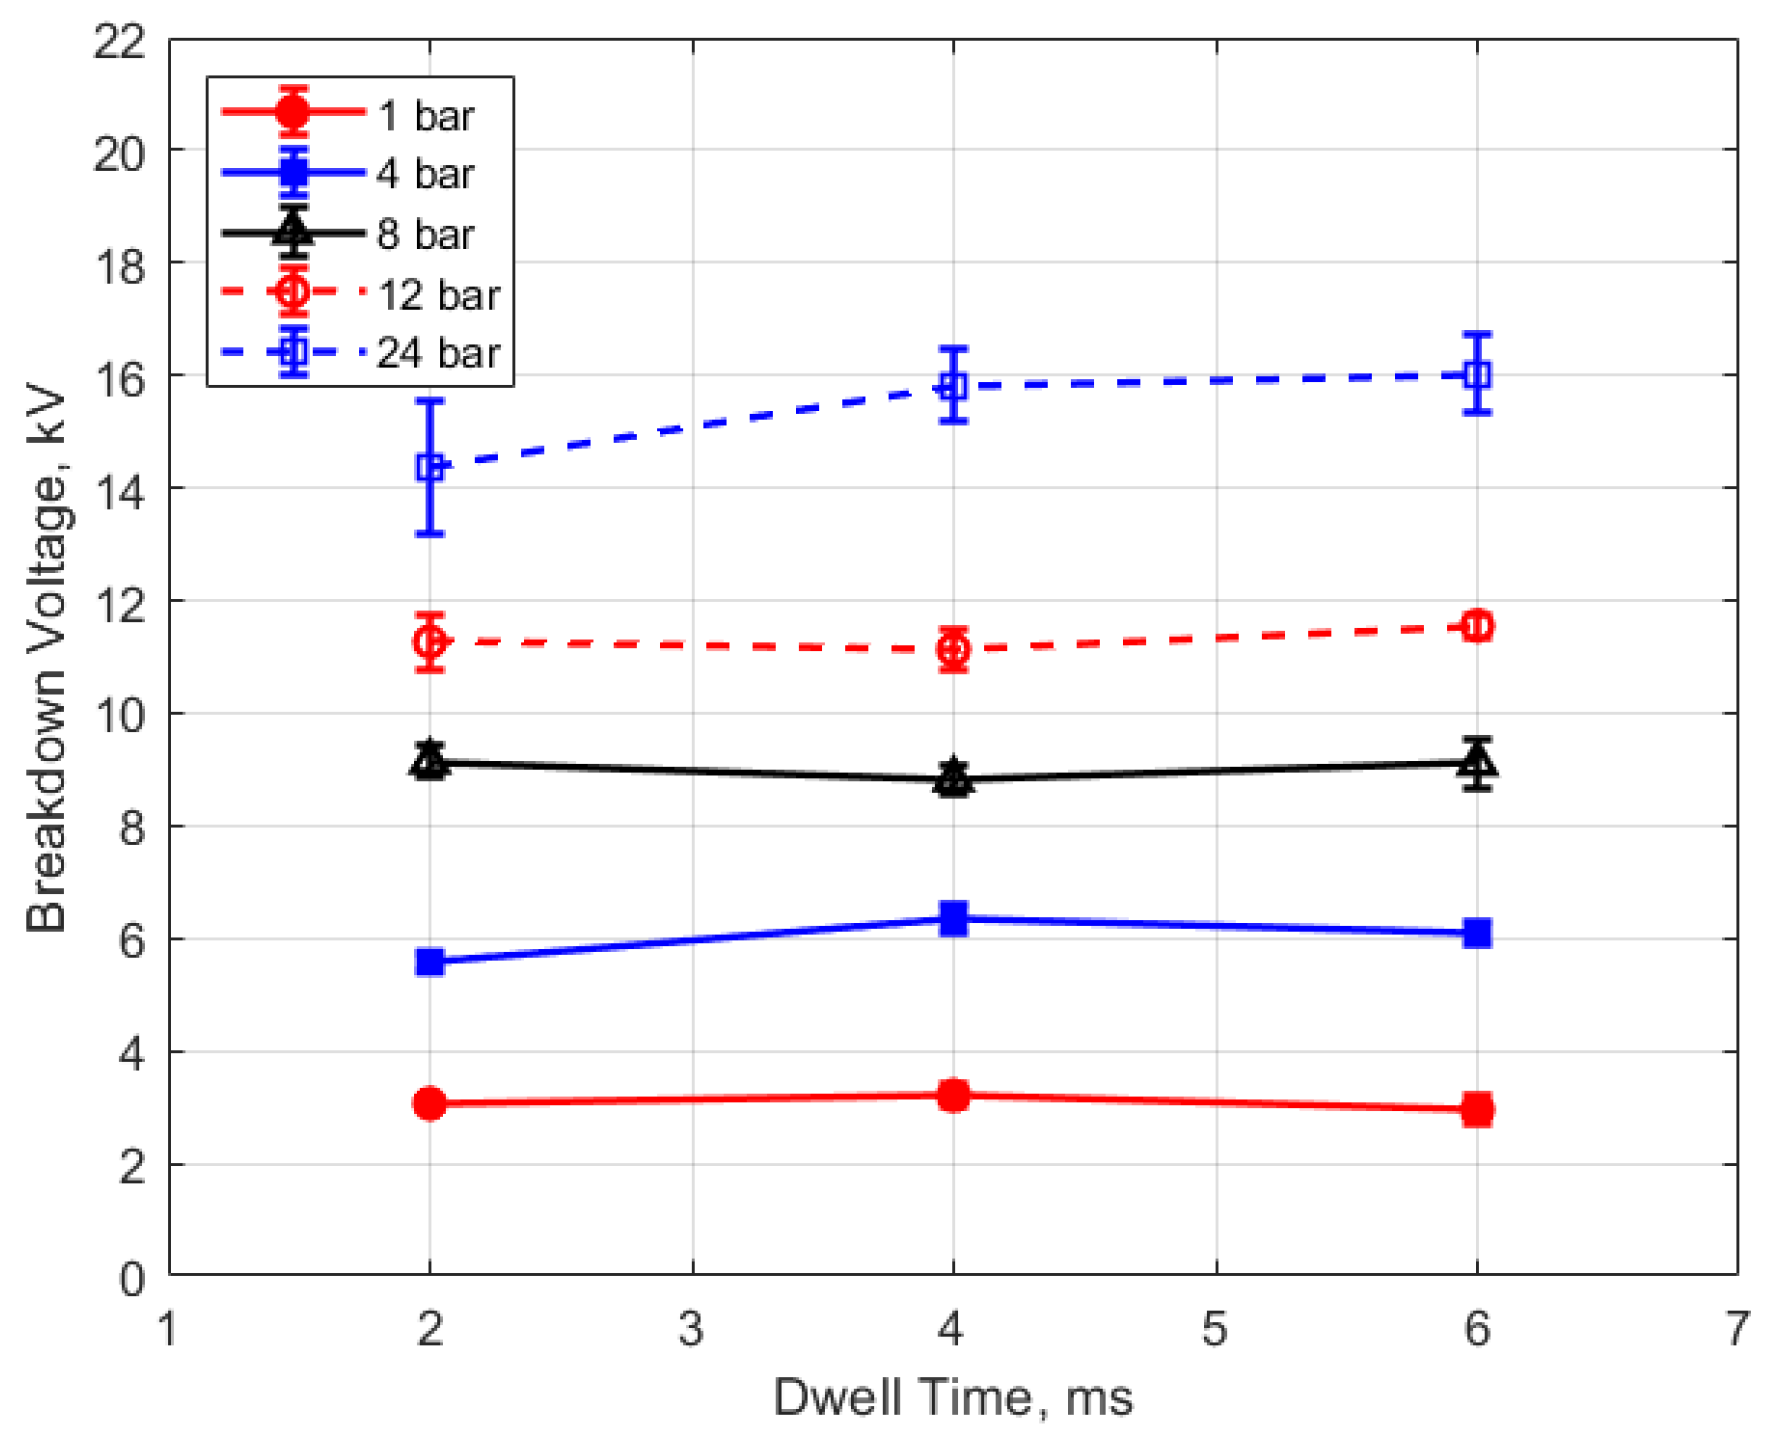
As expected, the breakdown voltage increases with both the gas pressure and the gap distance, but it is interesting to note that the breakdown voltage was not directly proportional to either of these variables even though linear relationships are predicted by Paschen’s law [5]. In the case of gas pressure, the breakdown voltage increased at a rate that diminished as the gas pressure increased. While the trend was closer to a linear increase for a changing spark gap, there was a considerable zero offset for the breakdown voltage at all of the pressures for the data extrapolated back to zero gap. In Figure 9 and Figure 10, the of effect dwell time on breakdown voltage is shown. There was no appreciable effect of either gap distance or gas pressure on the breakdown voltage within the uncertainty of the measurements over the dwell times ranging from 2 to 6 ms; however, a very slight increase in breakdown voltage with increasing dwell time is suggested from Figure 9. Since a longer dwell time results in more energy stored in the secondary coil and since the energy stored in an inductor follows Equation (3),
where L is the coil inductance and I is the current, it follows that the current will be greater in the inductor at higher energies. It may be the case that for the higher secondary currents associated with greater stored energies, the electric field in the gap rises slightly faster prior to breakdown, resulting in a higher voltage at the gap before the actual breakdown occurs.
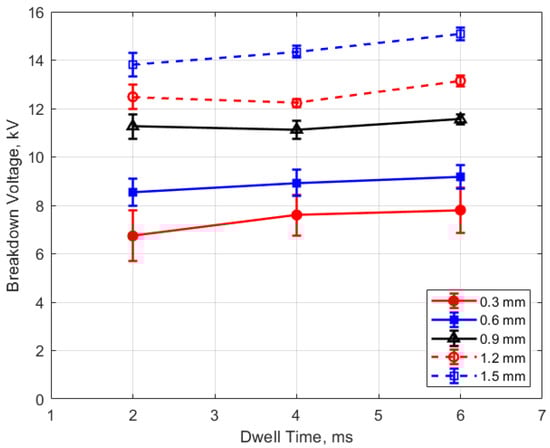
Figure 9.
Breakdown voltage vs. dwell for different gaps, for a pressure of 12 bar.
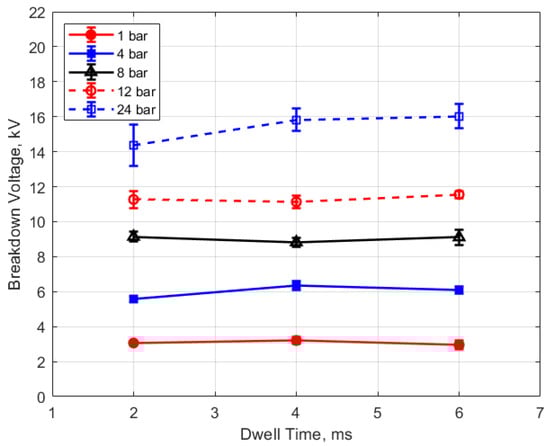
Figure 10.
Breakdown voltage vs. dwell for different pressures, for a 0.9 mm gap.
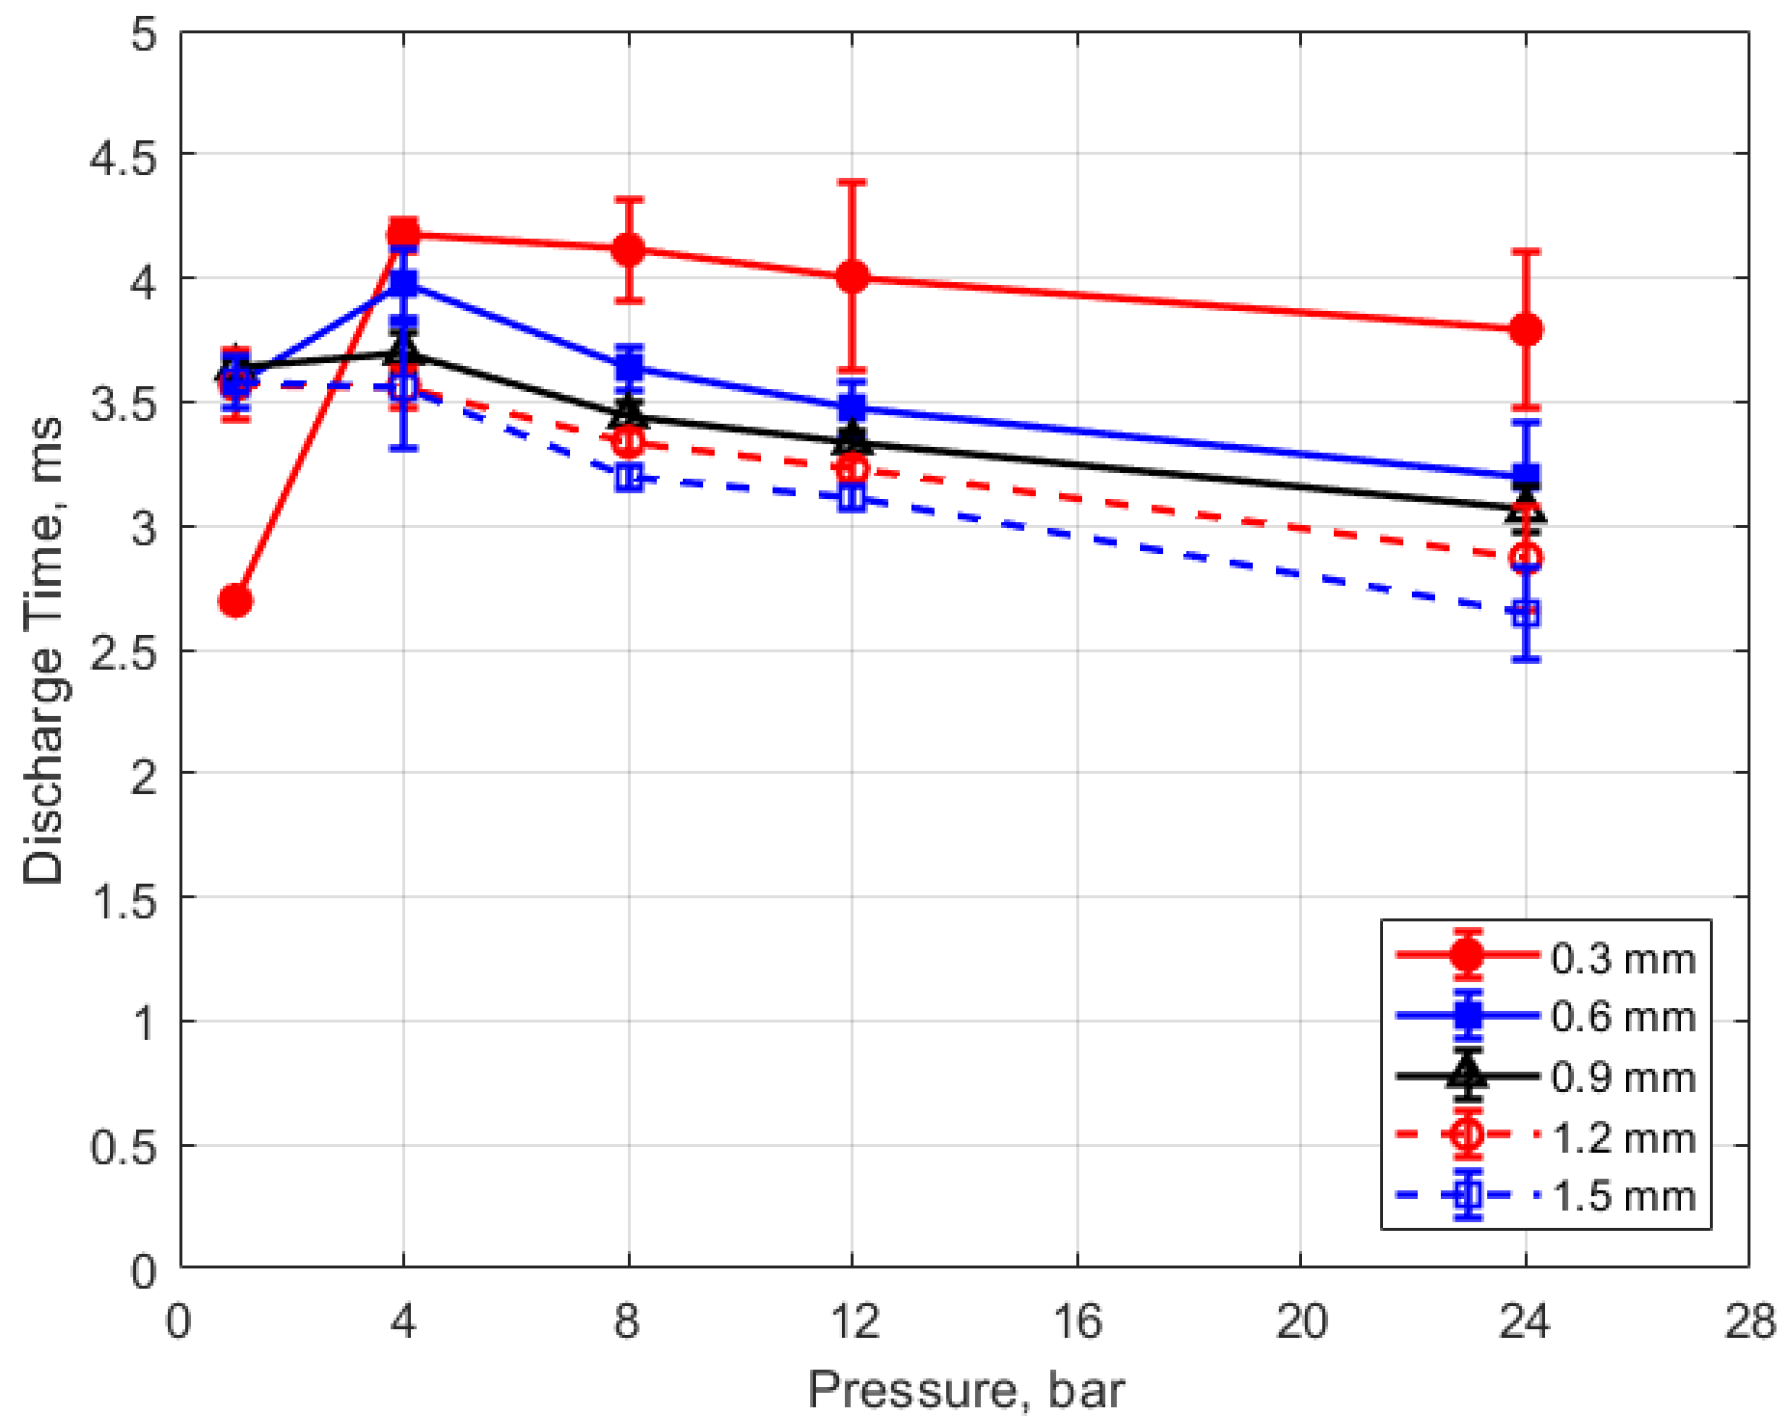
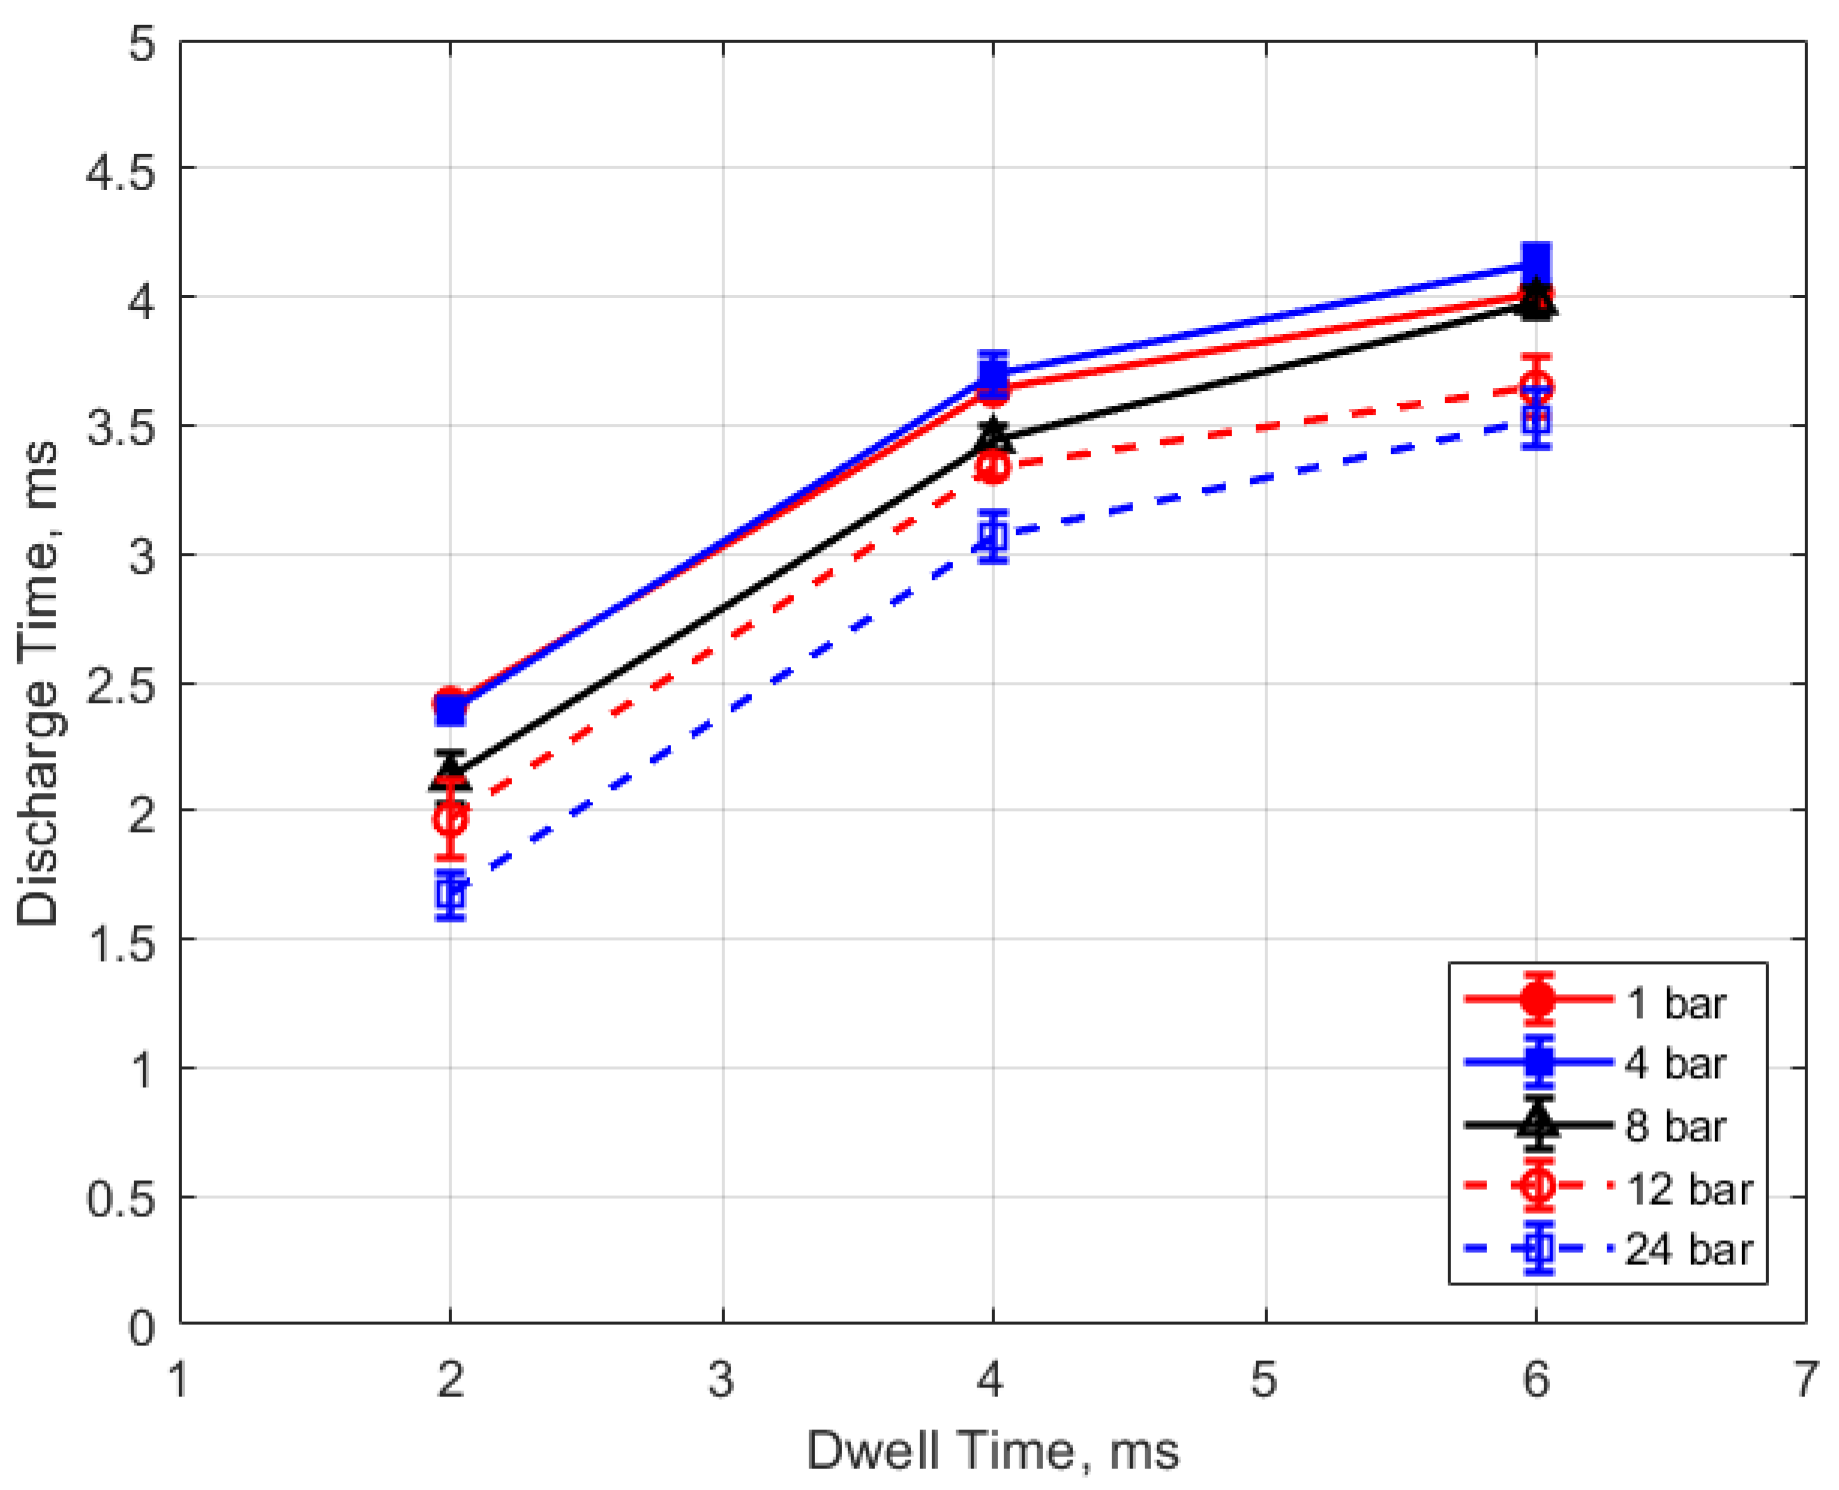
The discharge time or spark duration as a function of gas pressure, gap distance, and dwell time is given in Figure 11, Figure 12, Figure 13 and Figure 14. As seen in Figure 11, the spark duration is a weak function of gas pressure, but generally decreases with increasing pressure. The exceptions to this were the measurements at 1 atm, which show a shorter spark duration. This was associated with the glow-type discharge that was mentioned previously. The discharge times were in the range of approximately 3–4 ms. Figure 12 shows that the discharge times tended to shorten slightly as the gap distance increased; however, there is an exception for the 1 atm measurements. Figure 13 and Figure 14 show that spark duration increased with dwell time as more electrical energy was delivered to the gap, with the increase weaker from 4 to 6 ms than from 2 to 4 ms.
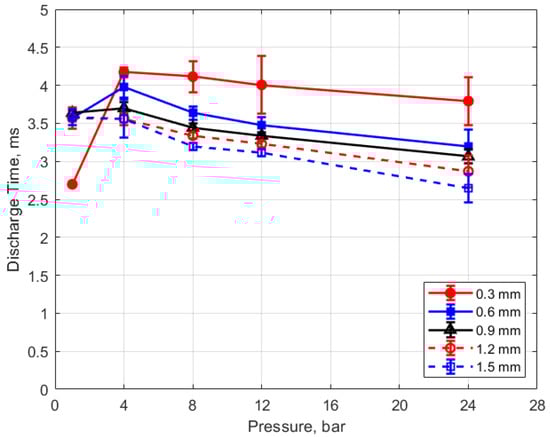
Figure 11.
Discharge time vs. pressure for different gaps, for a dwell time of 4 ms.
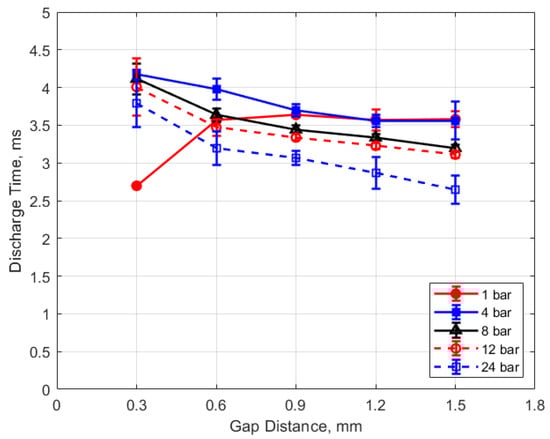
Figure 12.
Discharge time vs. gap for different pressures, for a dwell time of 4 ms.
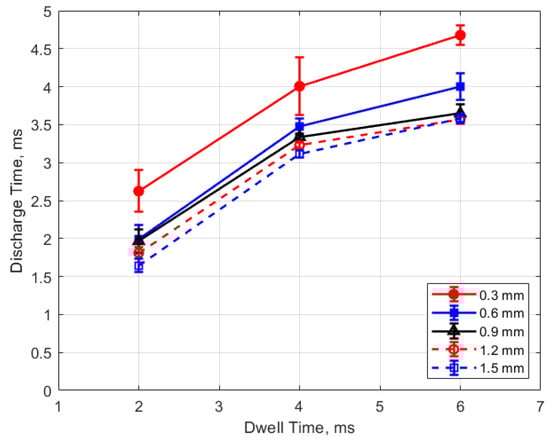
Figure 13.
Discharge time vs. dwell for different gaps, for a pressure of 12 bar.
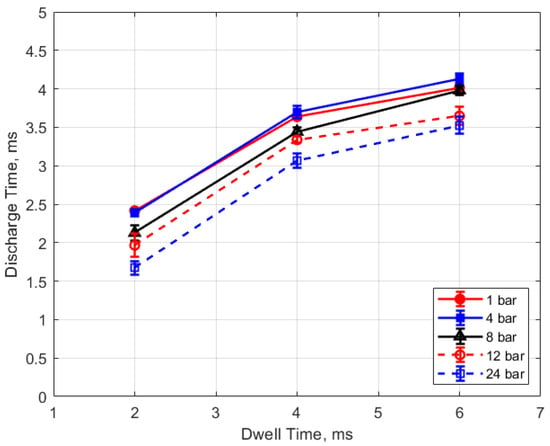
Figure 14.
Discharge time vs. dwell for different pressures, for a 0.9 mm gap.
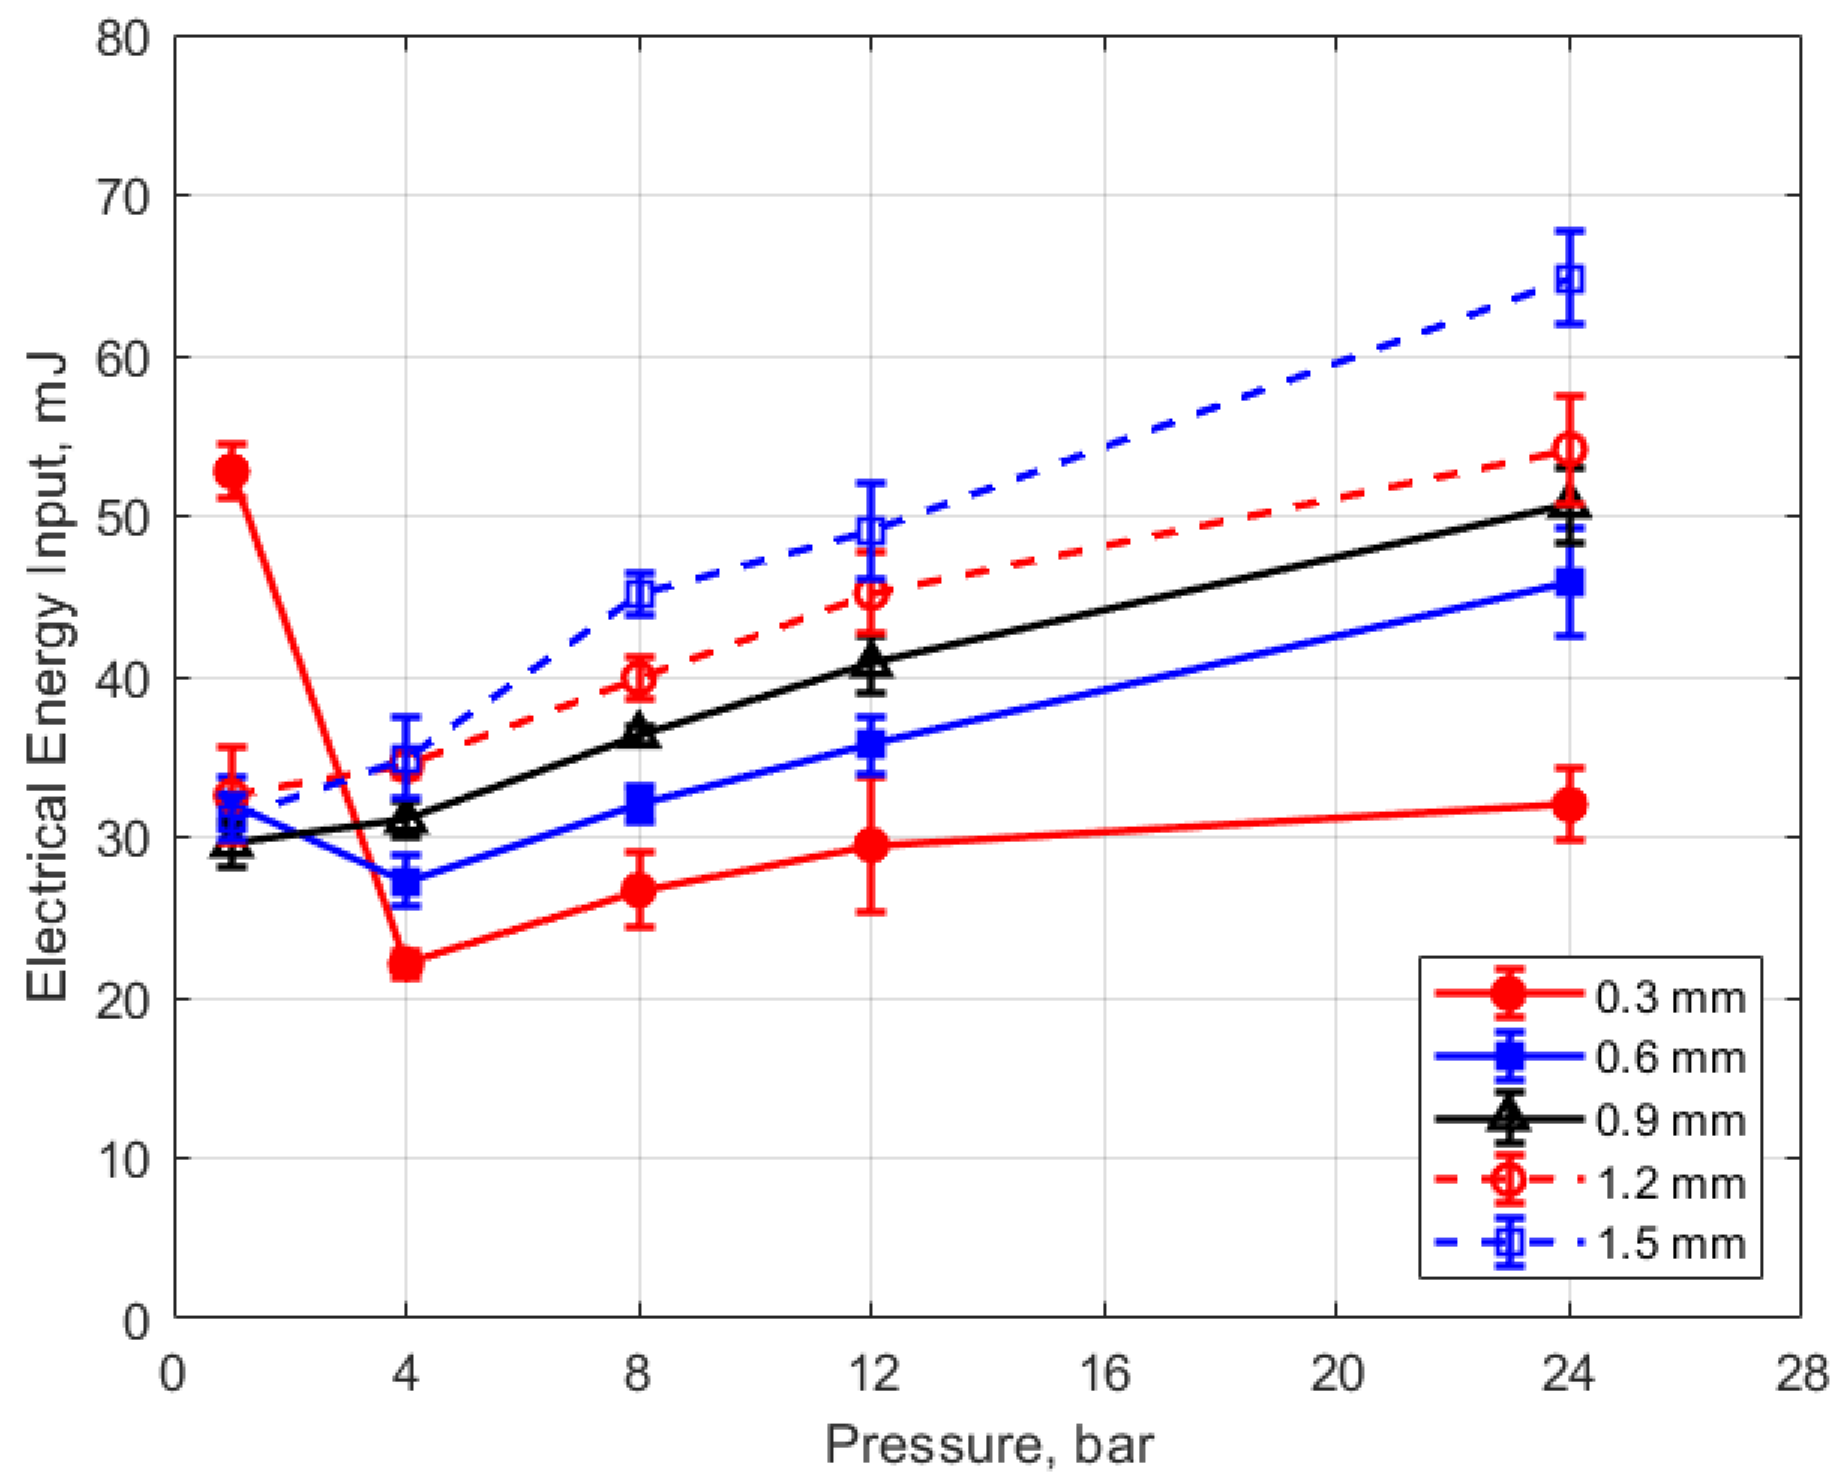
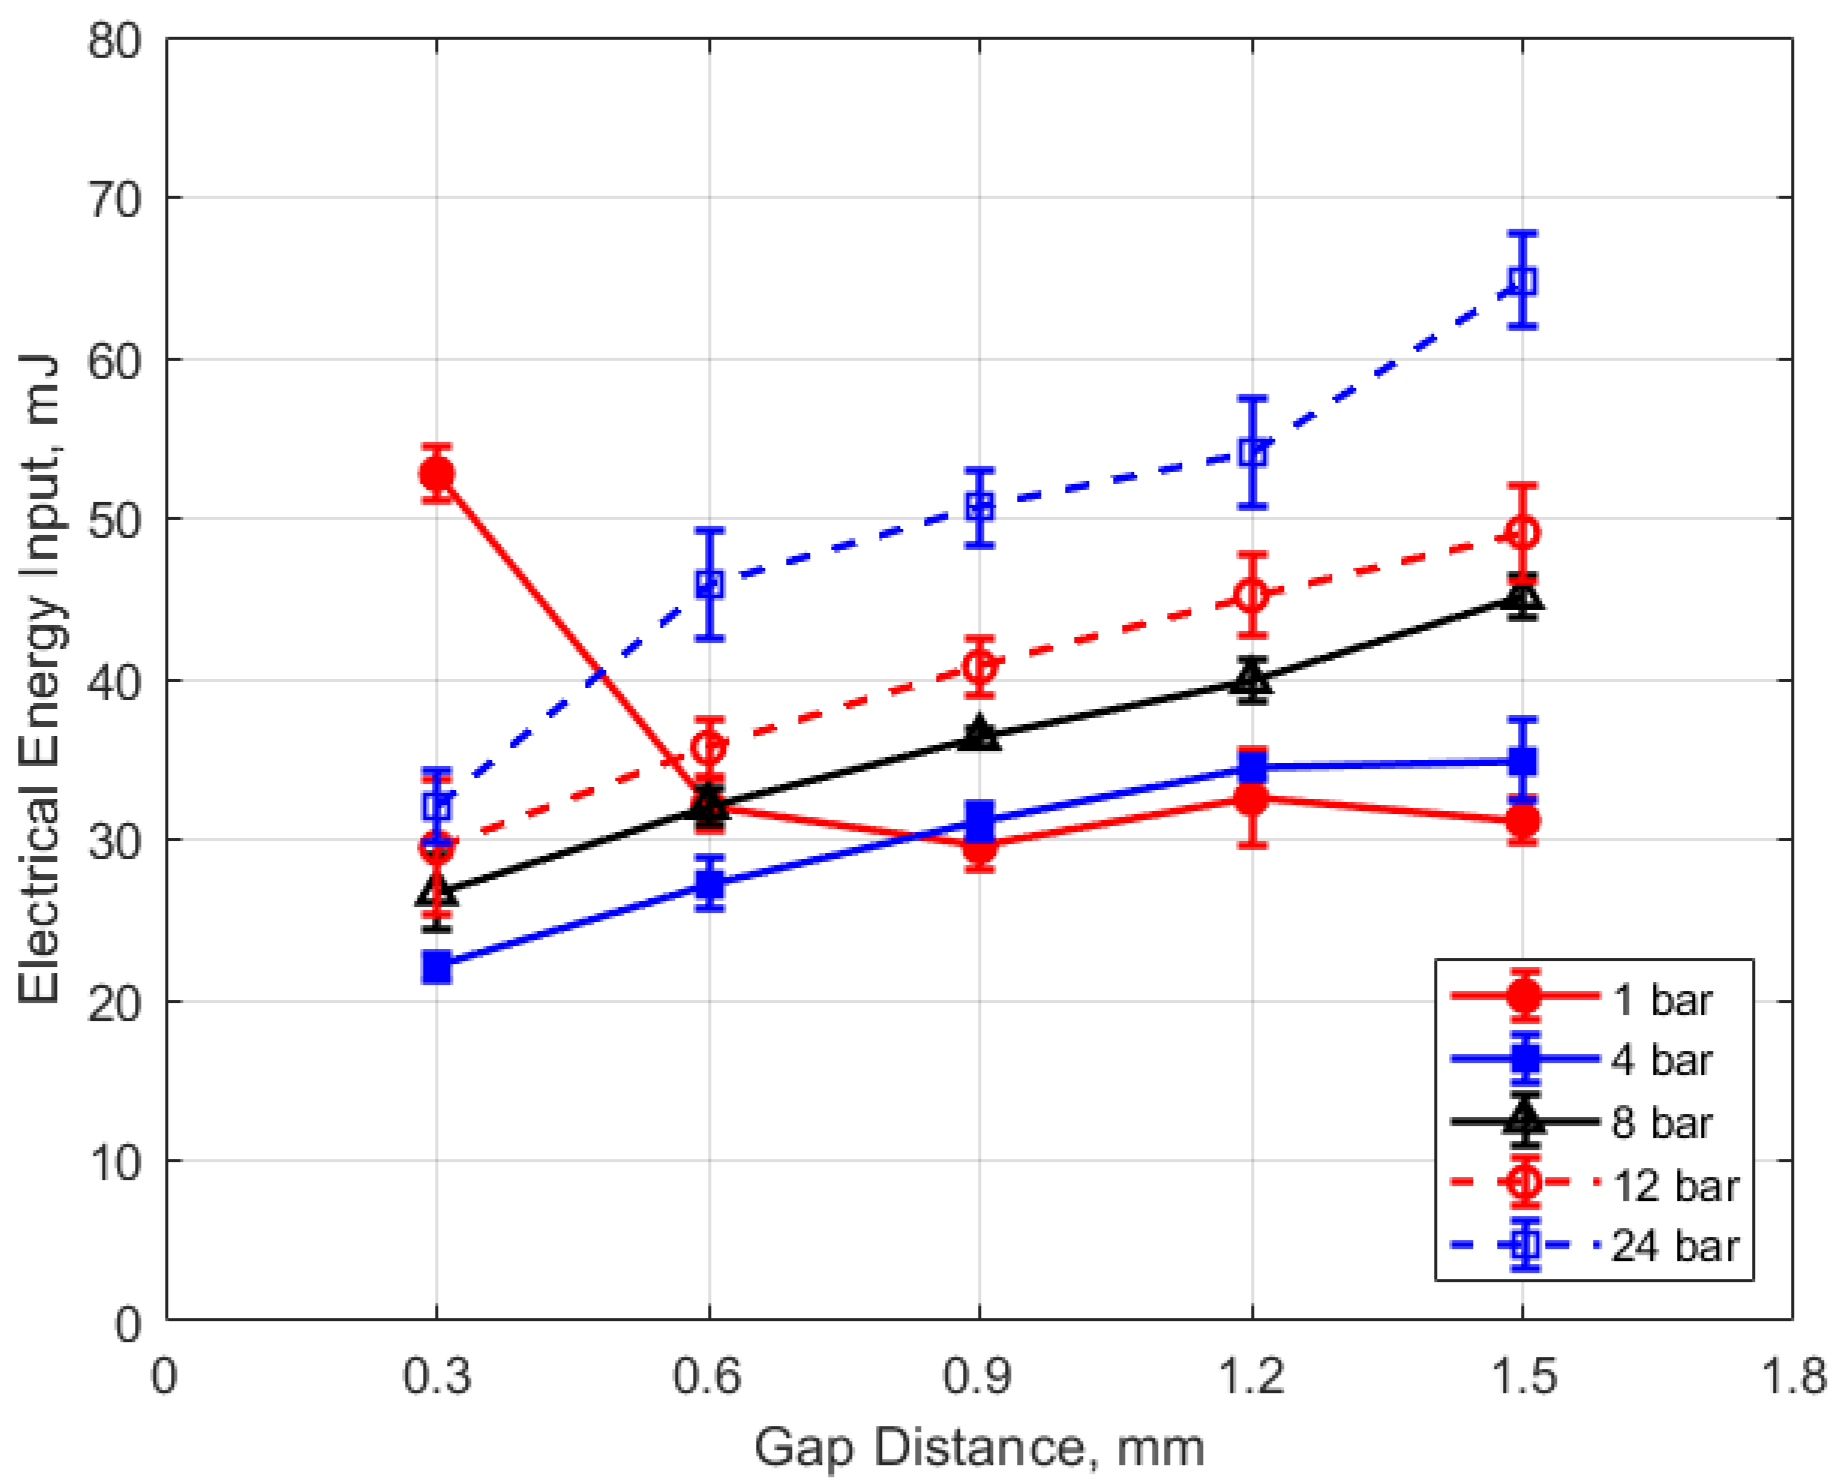
Figure 15, Figure 16, Figure 17 and Figure 18 show the calculated electrical energy delivered to the gap based on the measured current traces and the corrected traces of gap voltage. From Figure 15 and Figure 16, it can be seen that the electrical energy delivered to the gap generally increased, both with increasing gas pressure and with gap distance. As both the gas pressure and gap distance increase, the breakdown voltage increases as well; increasing the peak voltage in the secondary side of the ignition circuit will lead to greater electrical energy storage according to the secondary circuit and spark plug capacitance (typically on the order of 15 pF [10]). Both higher gas pressure and larger gap result in a greater gap resistance and in a more thermally isolated gap region since molecular diffusivities scale as the square of the characteristic diffusion distance. It is interesting that electrical energy delivered to the gap increased as these two parameters increased even though spark duration decreased. The relatively high electrical energy delivery for the case of 1 atm gas pressure and the smallest gap of 0.3 mm was a consequence of the high glow voltage relative to the arc voltages; the current traces were similar for arc and glow.

Figure 15.
Electrical energy input vs. pressure for different gaps, for a dwell time of 4 ms.
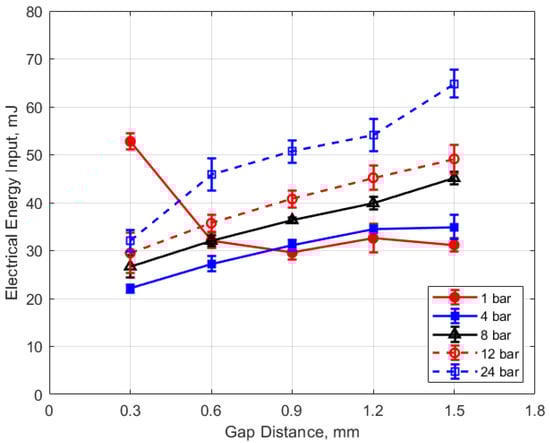
Figure 16.
Electrical energy input vs. gap for different pressures, for a dwell time of 4 ms.
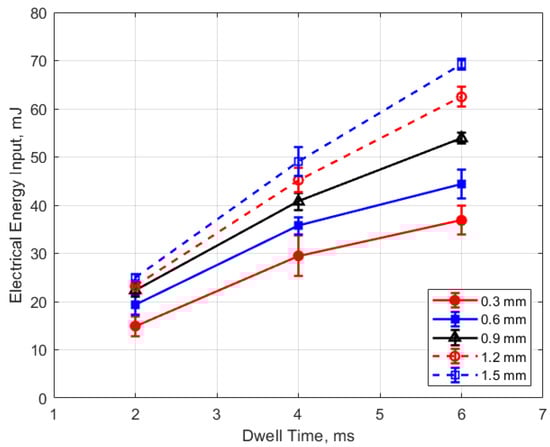
Figure 17.
Electrical energy input vs. dwell for different gaps, for a pressure of 12 bar.
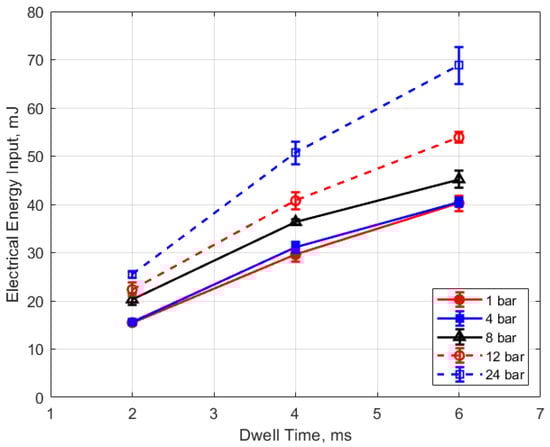
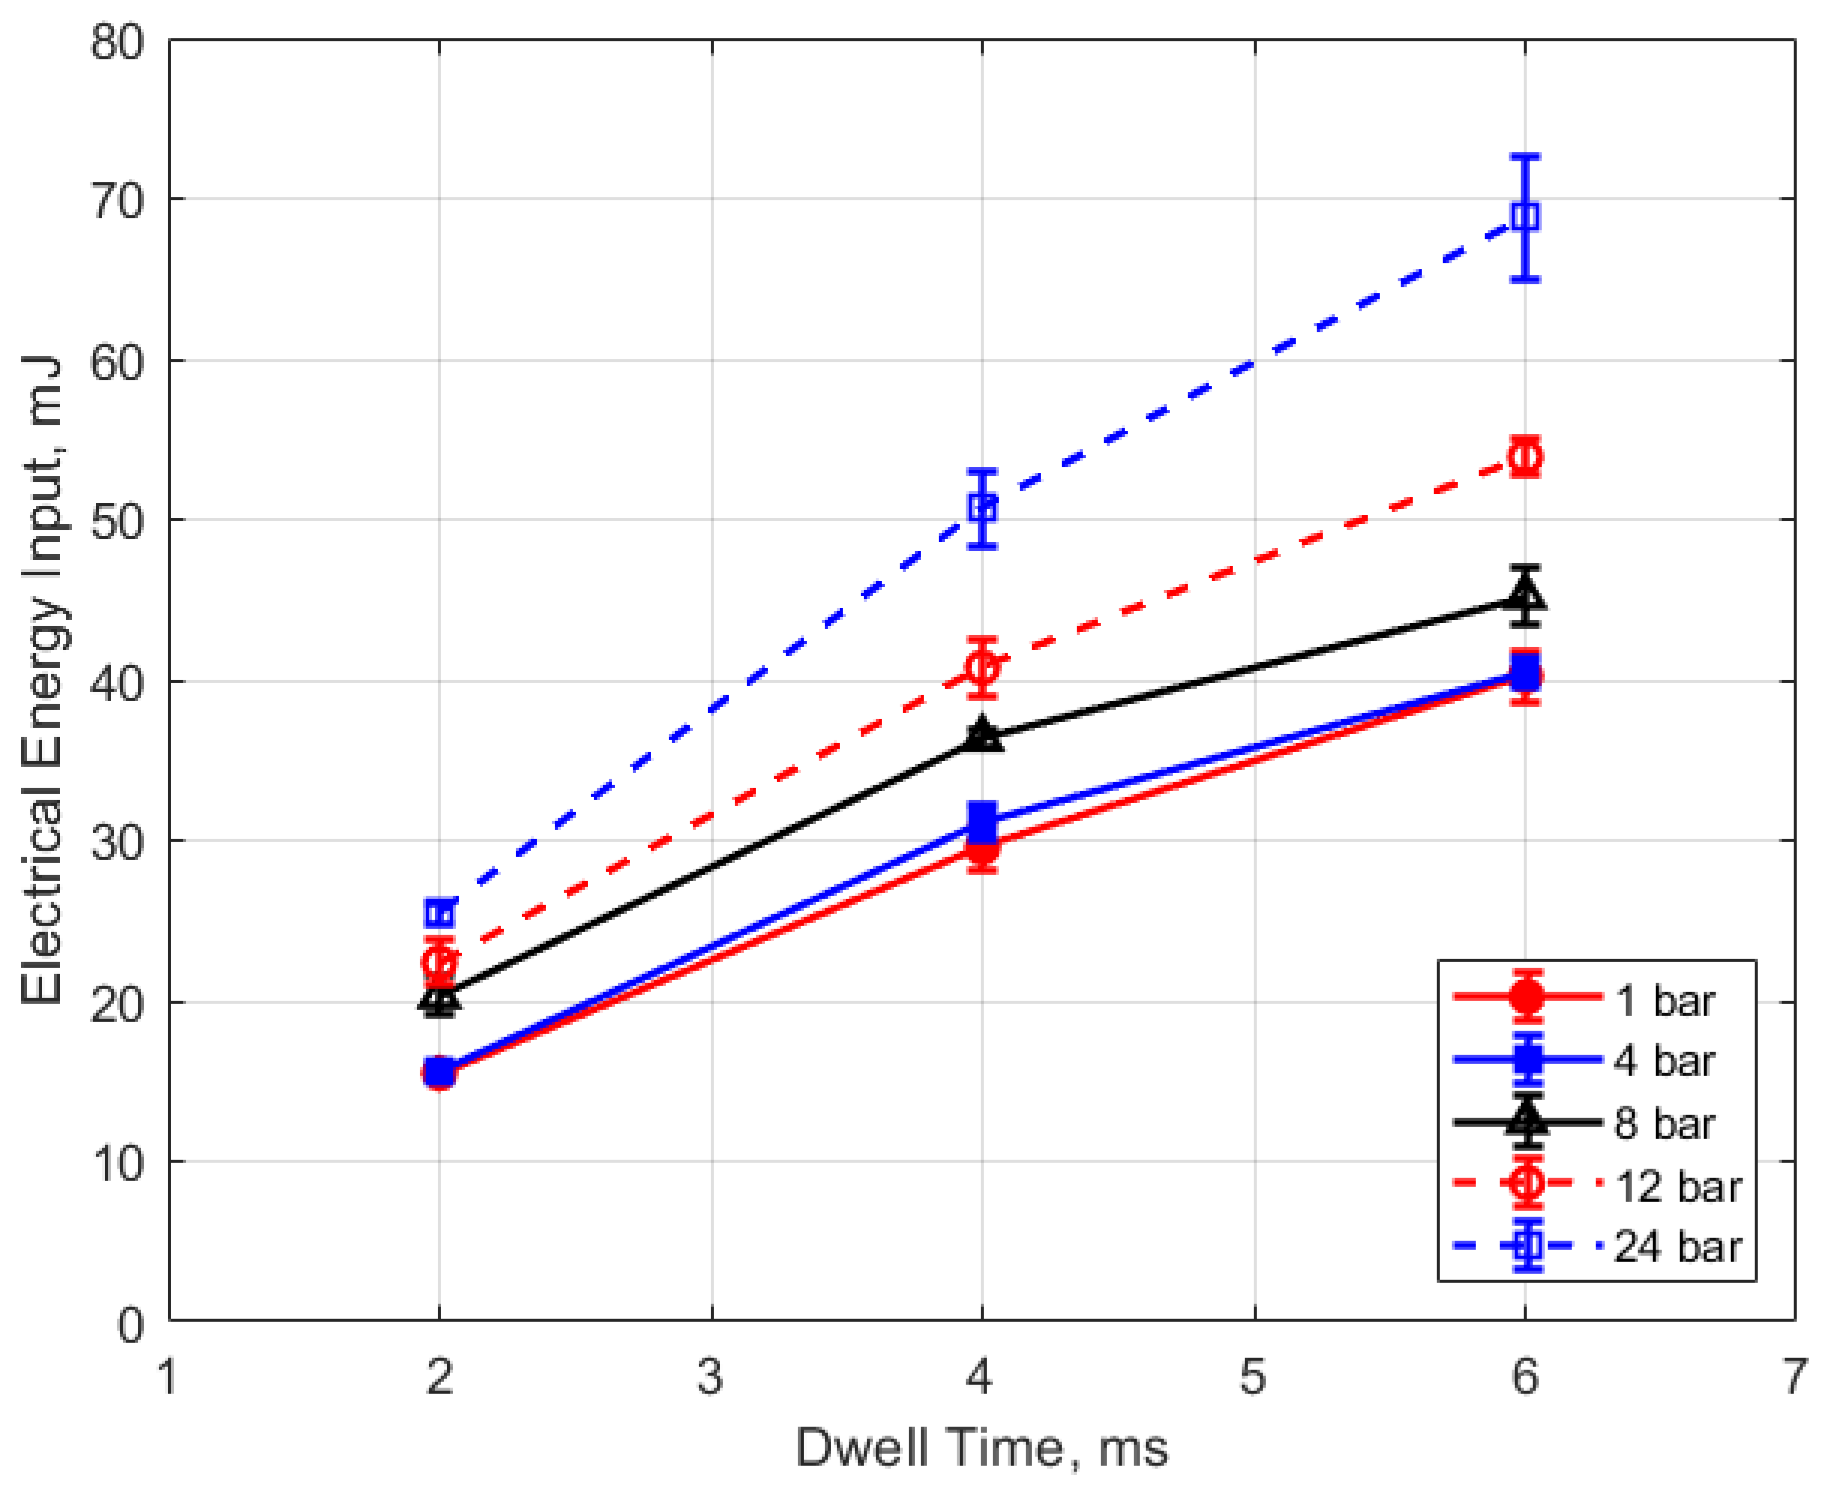
Figure 18.
Electrical energy input vs. dwell for different pressures, for a 0.9 mm gap.
The electrical energy delivered to the gap as a function of dwell time is shown in Figure 17 and Figure 18. As expected, a longer dwell time leads to greater electrical energy storage in the secondary side of the coil and, consequently, more energy delivered to the gap. It is interesting to note the range of delivered electrical energy to the gap as parameters changed; delivered energies ranged from approximately 15 to 70 mJ. The literature shows minimum ignition energies for stoichiometric hydrocarbon-air mixtures that are in the range of 0.3–2 mJ [17].
The thermal energy deposition to the gas is depicted in Figure 19, Figure 20, Figure 21 and Figure 22. The quantity of thermal energy delivered to the gas and its distribution in the vicinity of the spark gap is important for flame initiation, particularly for conditions for which the development of a strong flame kernel is challenging, such as in lean, highly dilute and inhomogeneous mixtures and where fluid motion near the gap can strongly convect both the spark plasma and the developing flame kernel.
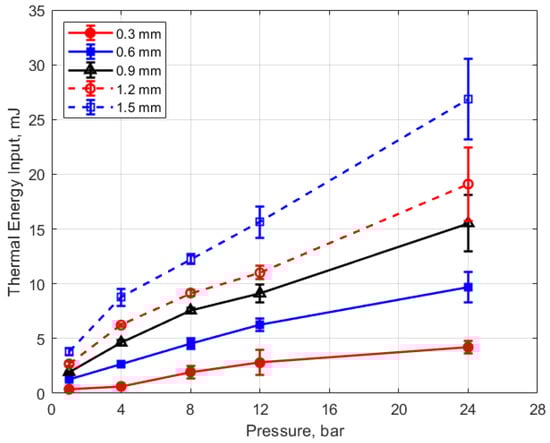
Figure 19.
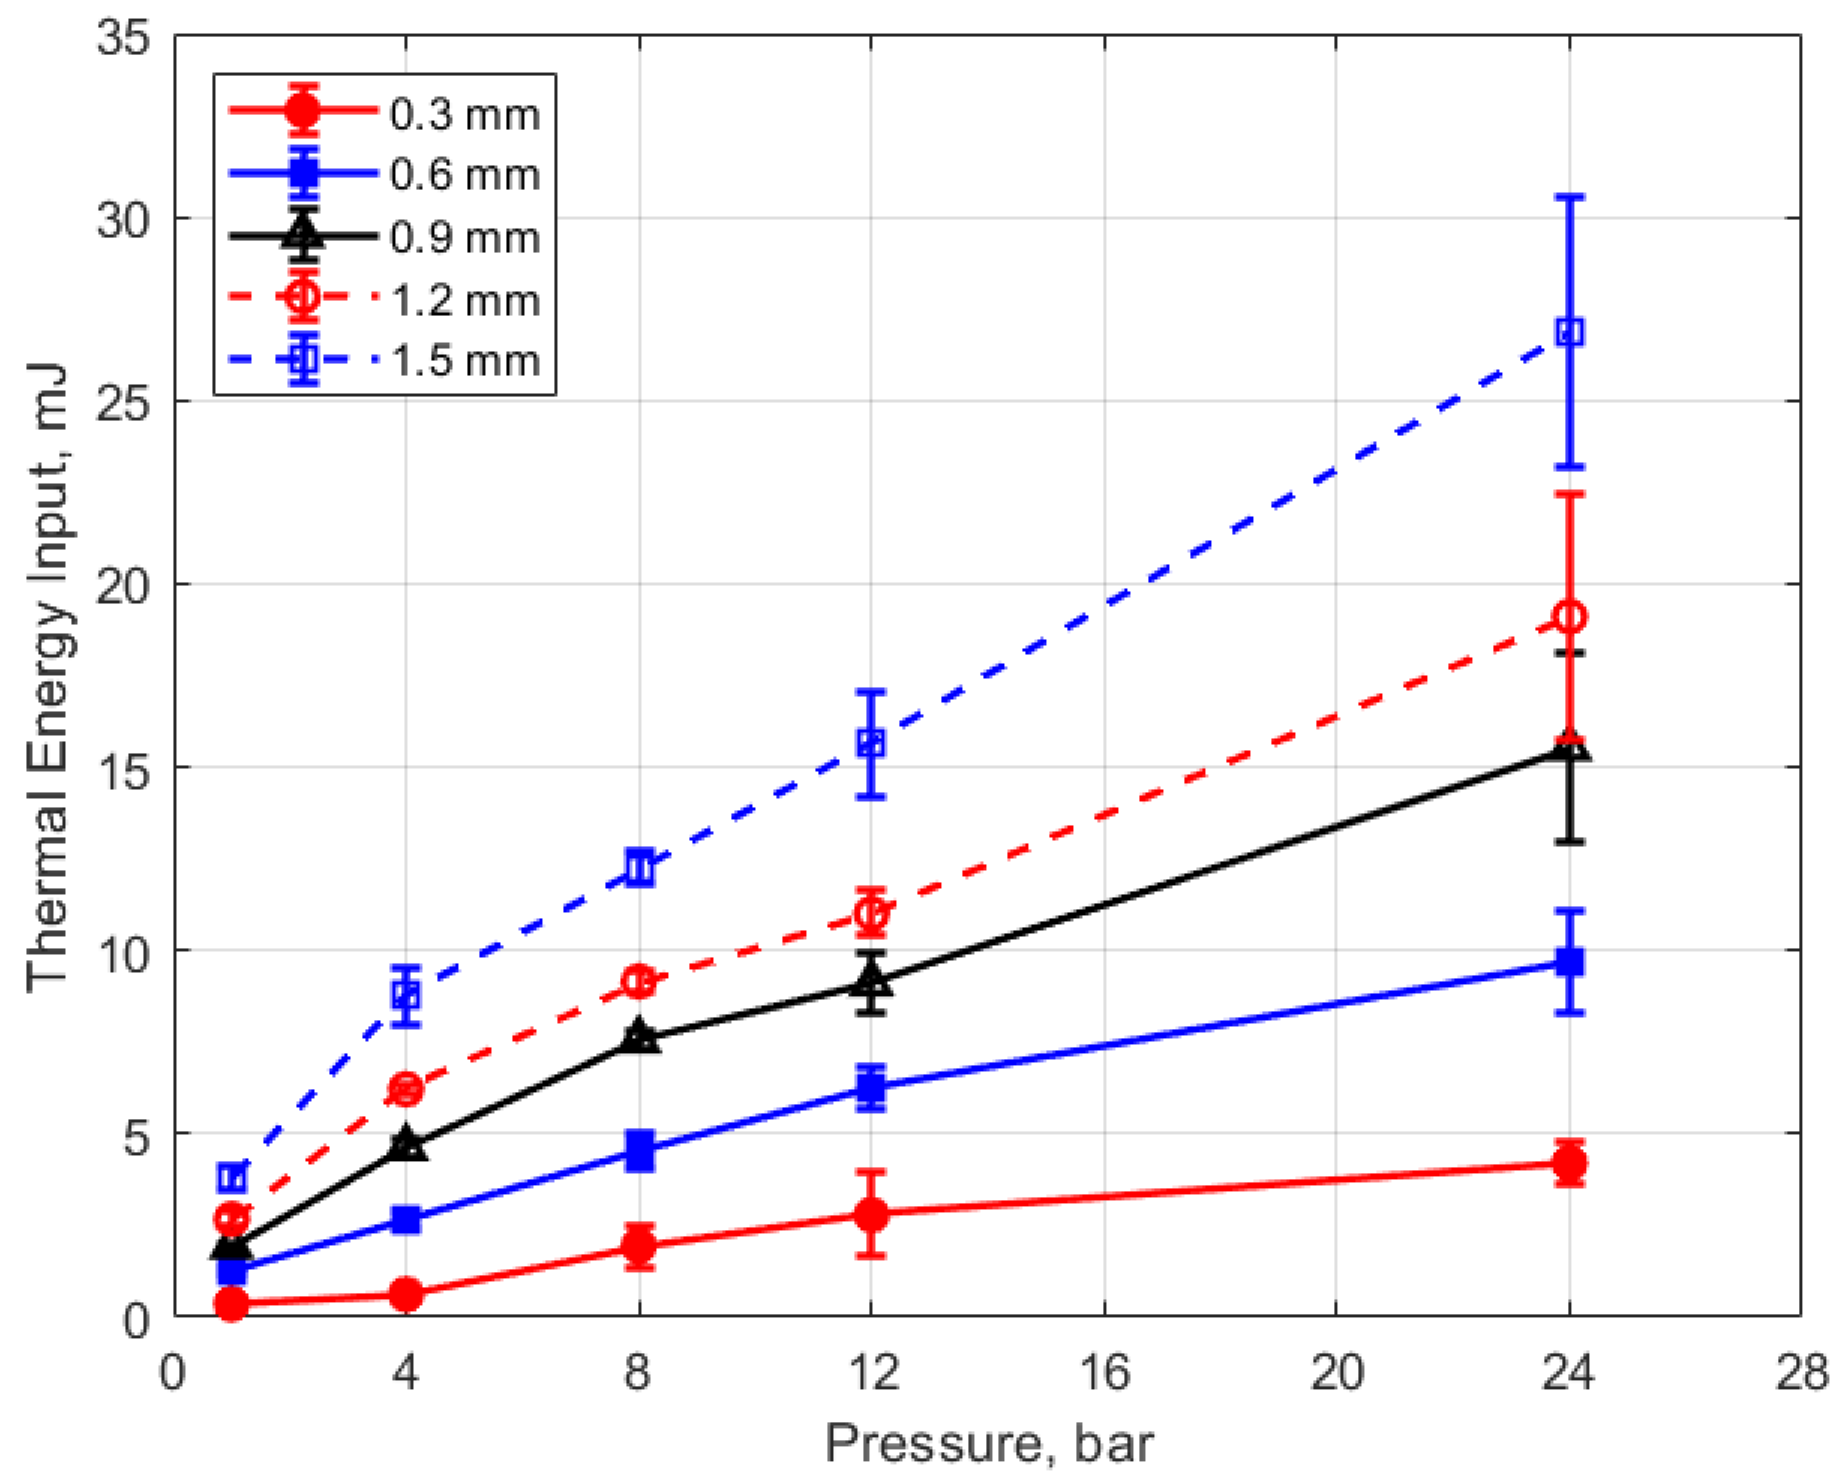
Thermal energy input vs. pressure for different gaps, for a dwell time of 4 ms.
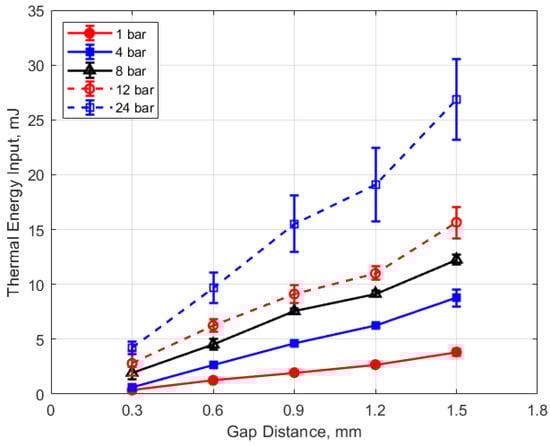
Figure 20.
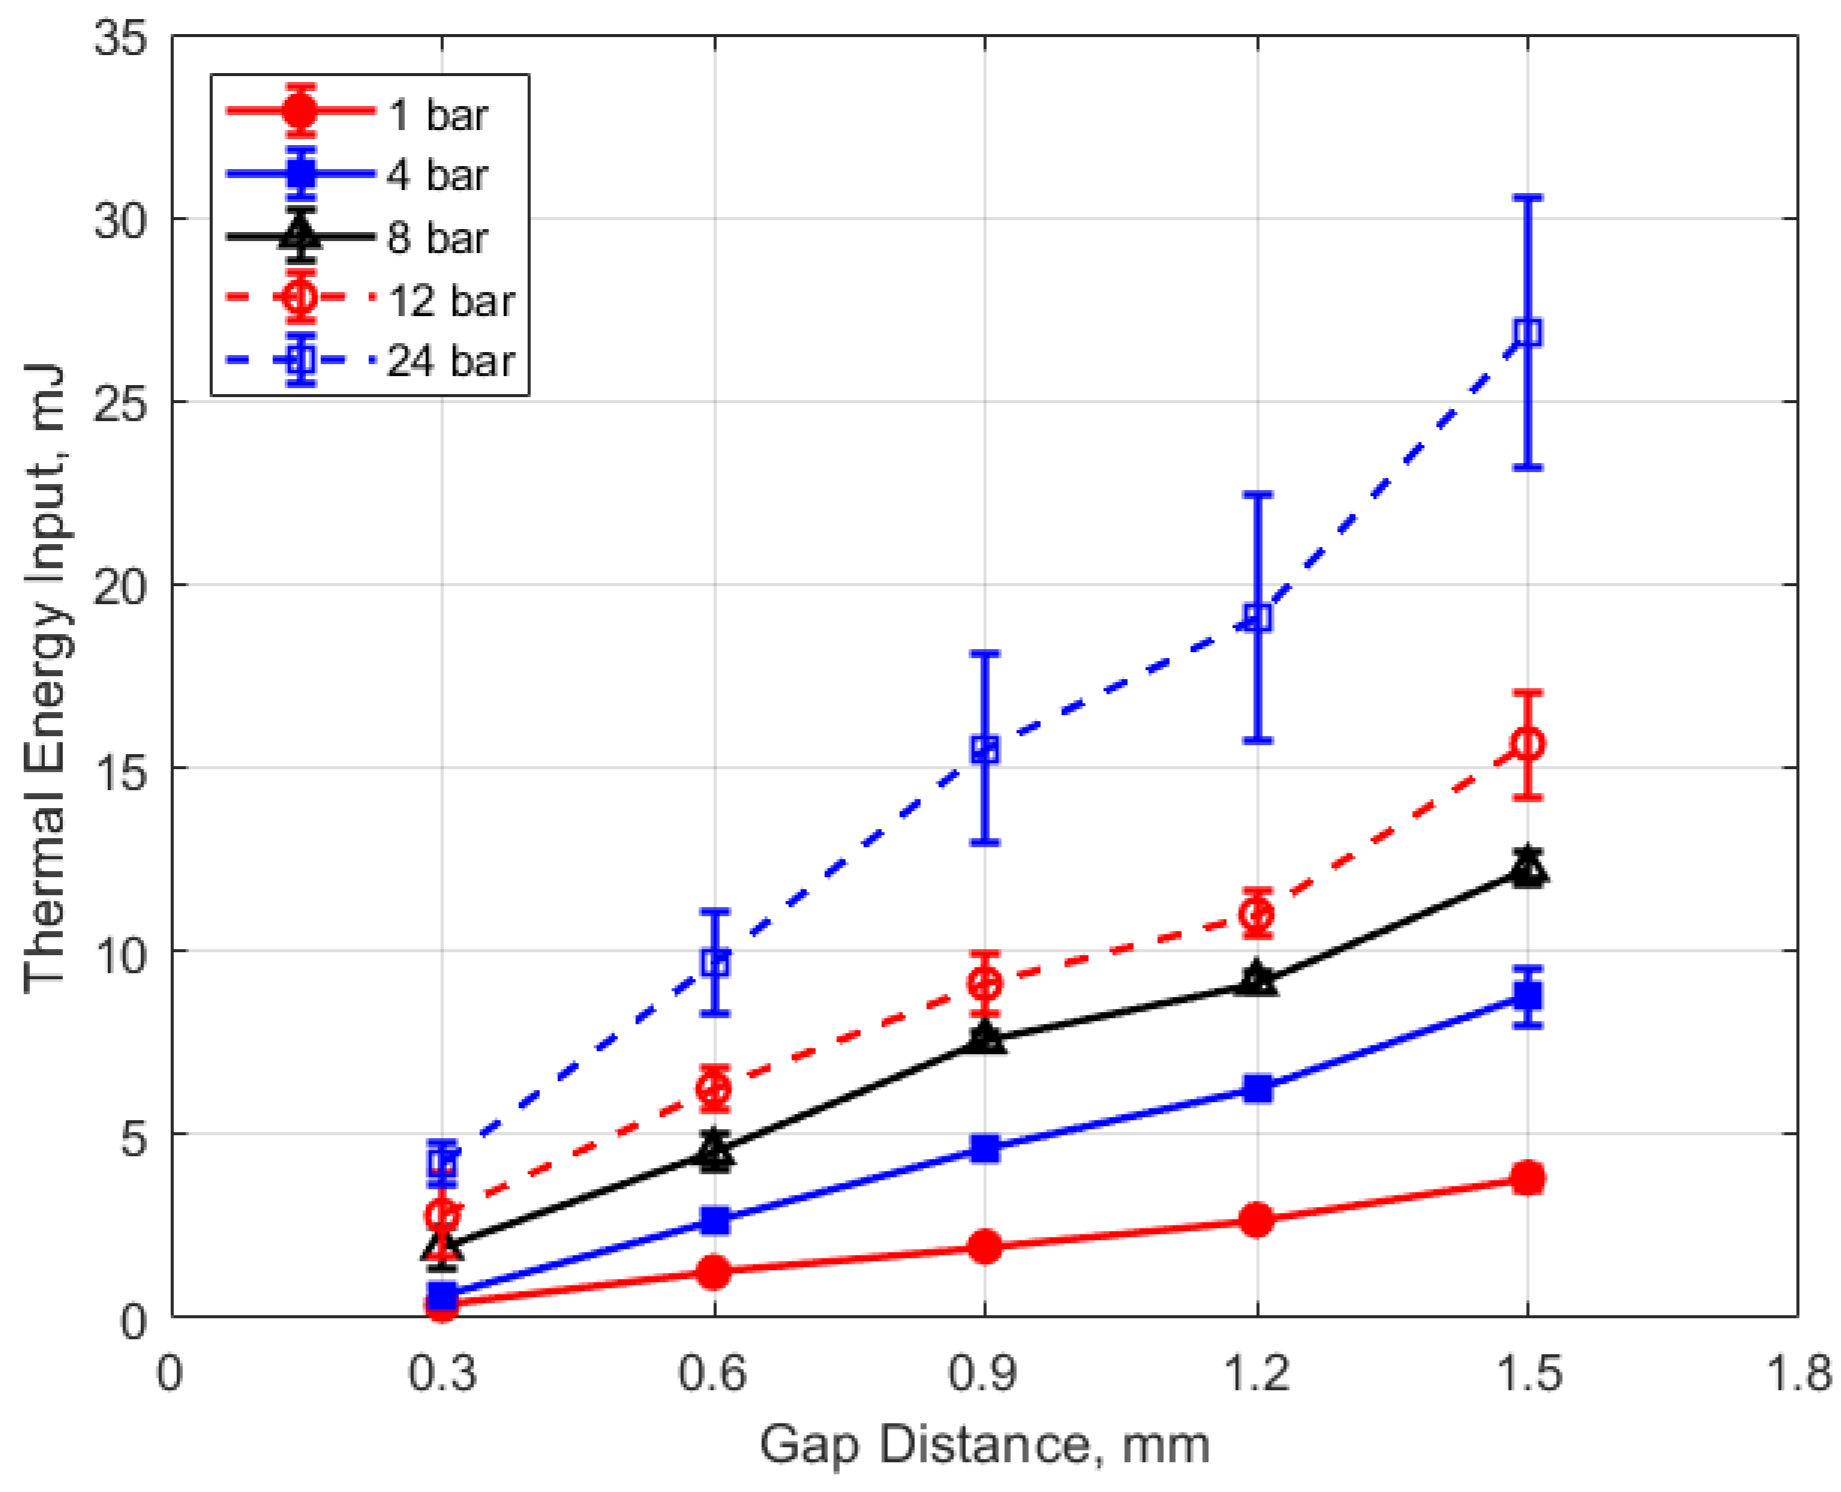
Thermal energy input vs. gap for different pressures, for a dwell time of 4 ms.
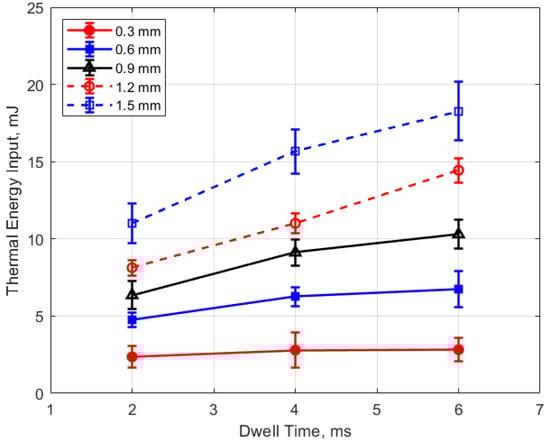
Figure 21.
Thermal energy input vs. dwell for different gaps, for a pressure of 12 bar.

Figure 22.
Thermal energy input vs. dwell for different pressures, for a 0.9 mm gap.
Figure 19 shows the thermal energy deposition versus gas pressure as a function of gap distance and for a dwell time of 4 ms. The thermal energy delivered to the gas is seen to increase monotonically with increasing pressure. If one considers the results for the different gap distances, the normalized change in thermal energy deposition with pressure is similar for all of them; that is
where E is the thermal energy to the gas in mJ and P is the gas pressure in bar. For the pressures shown, the value of the constant in Equation (4) is in the range of 0.2–0.4 mJ/bar, with an average close to 0.3 mJ/bar. Using this average value of 0.3 mJ/bar and rearranging Equation (4) as a differential, one obtains the following relationship for the differential change in the normalized thermal energy deposition with gas pressure that is independent of gap distance.
It would require more investigation to determine the validity of Equation (5) for different spark plug geometries and internal resistances, the type of ignition circuit, dwell times, and of course, gap fluid motion, but it may provide an approximate scaling rule in the absence of other data. It may be more appropriate to express this relationship in terms of gas density rather than pressure through their relationship via the ideal gas law.
Figure 20 shows the thermal energy deposition versus gap distance as a function of initial absolute gas pressure. Thermal energy deposition increased monotonically with gap distance for the entire range of gas pressures. Differences in gap electrical resistance and differences in heat transfer to the electrodes are probably responsible for these trends. As the gap distance increases, the positive column portion of the spark plasma increases proportionally, along with its electrical resistance. Molecular thermal diffusivities increase as the square of the characteristic heat transfer length, which one might take as one-half the gap distance. Despite the possible non-linearity, it is interesting to note that increases in thermal energy deposition with gap distance follow an approximately linear trend.
An analysis for the dependence of the change in deposition energy with gap distance, analogous to that carried out for the pressure dependence, can be performed. The related constant from the experimental data is in the range of approximately 4–6 mm−1, with an average value close to 5 mm−1. Equation (6) is the resulting relationship for the effect of gap distance “g” on the change in thermal energy deposition that is independent of gas pressure
Again, the sensitivity to other parameters needs to be explored further.
Figure 21 and Figure 22 show the thermal energy deposition as a function of dwell. A longer dwell time results in more electrical energy delivered to the gap, so the observed trend of increasing thermal energy deposition with increasing dwell time would be expected.
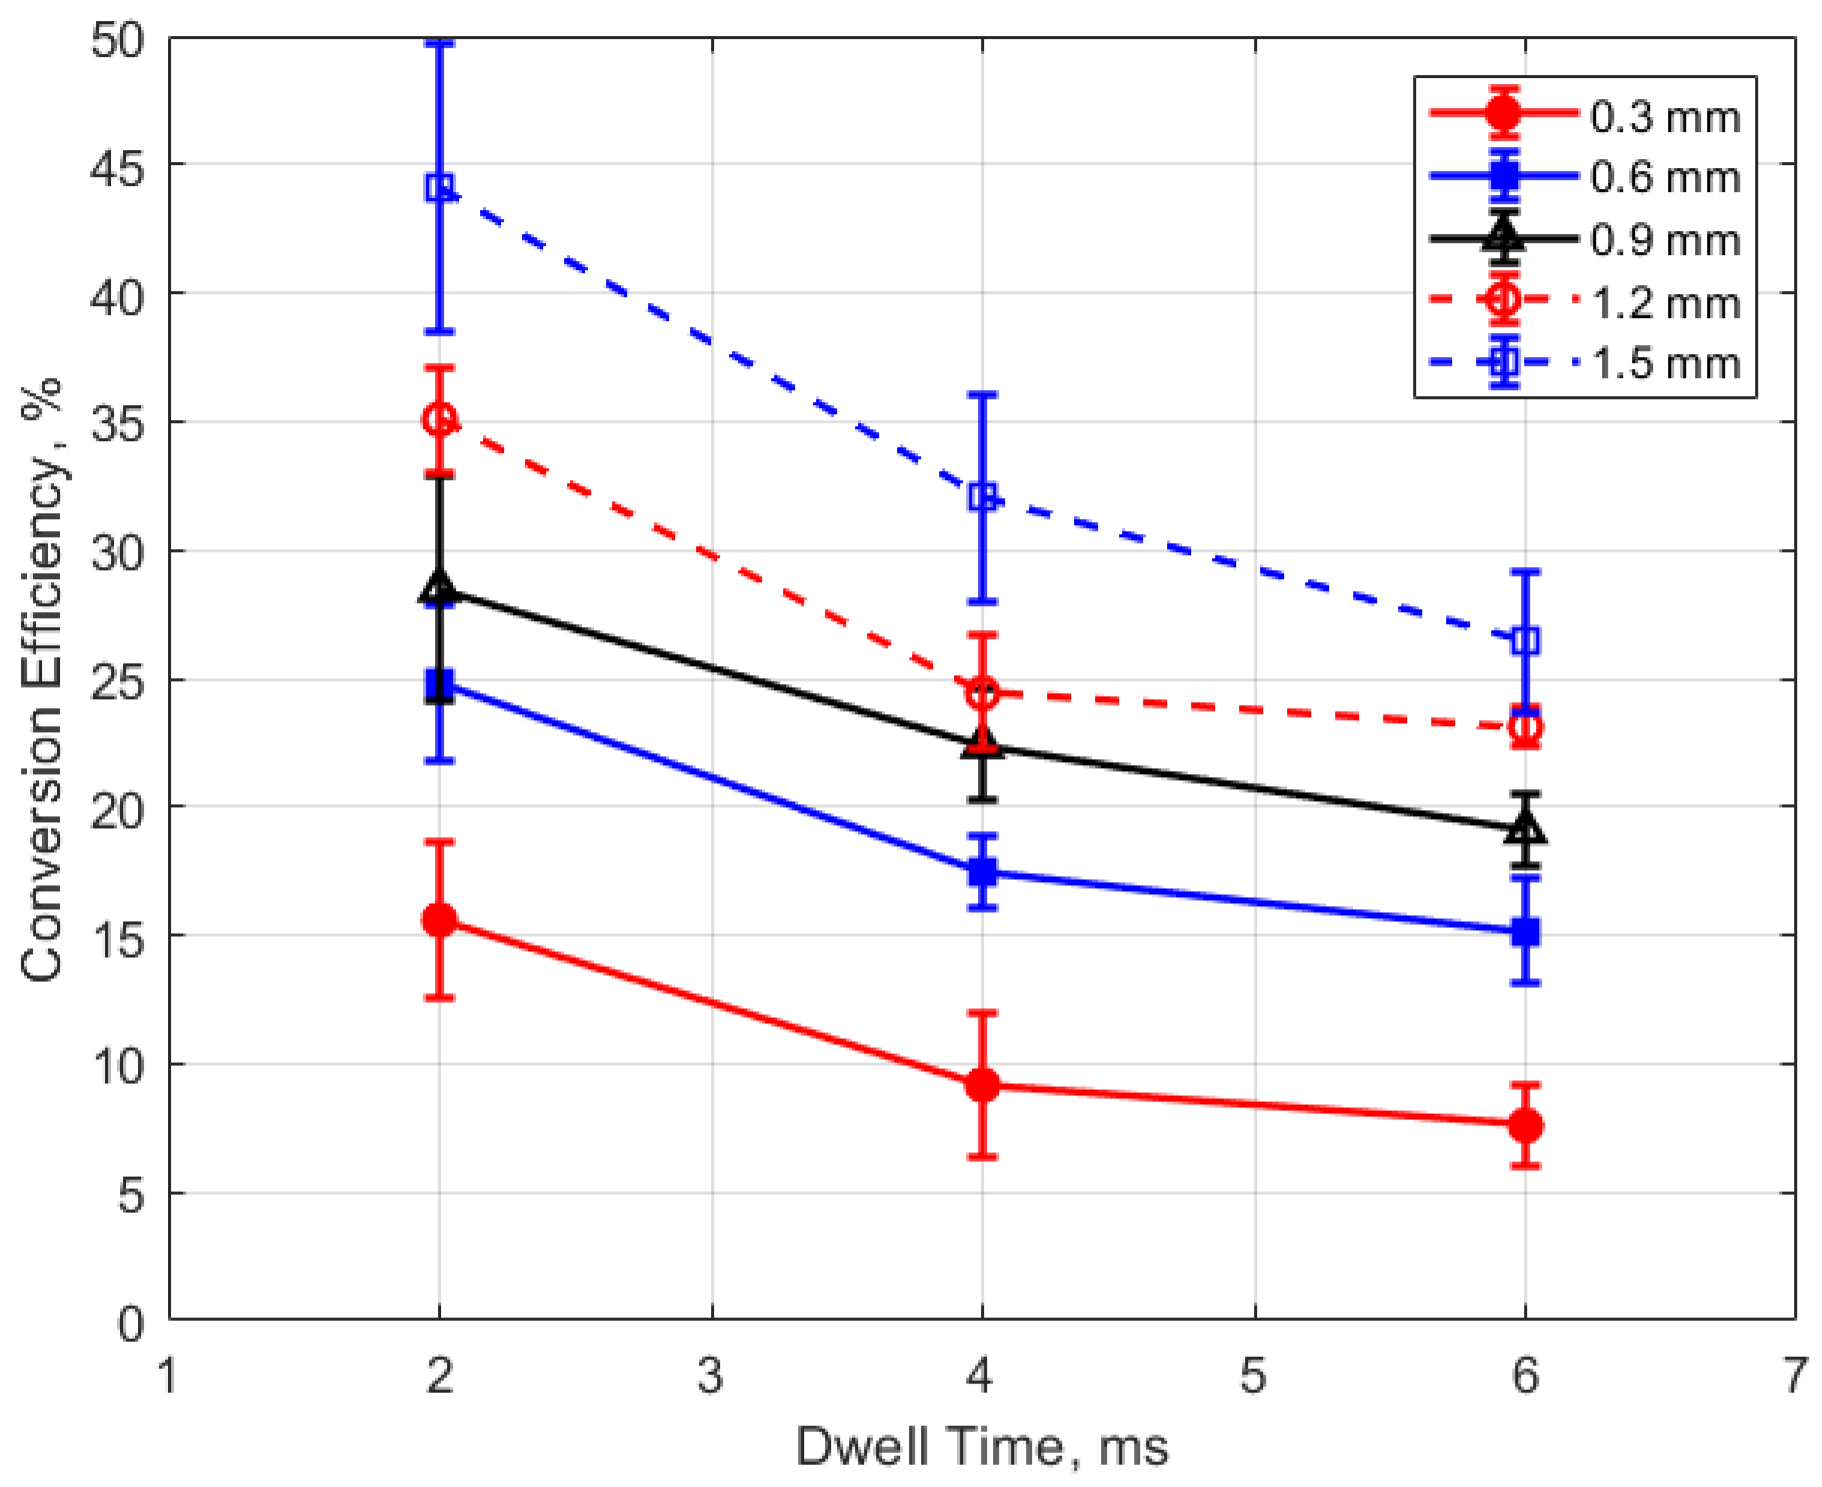
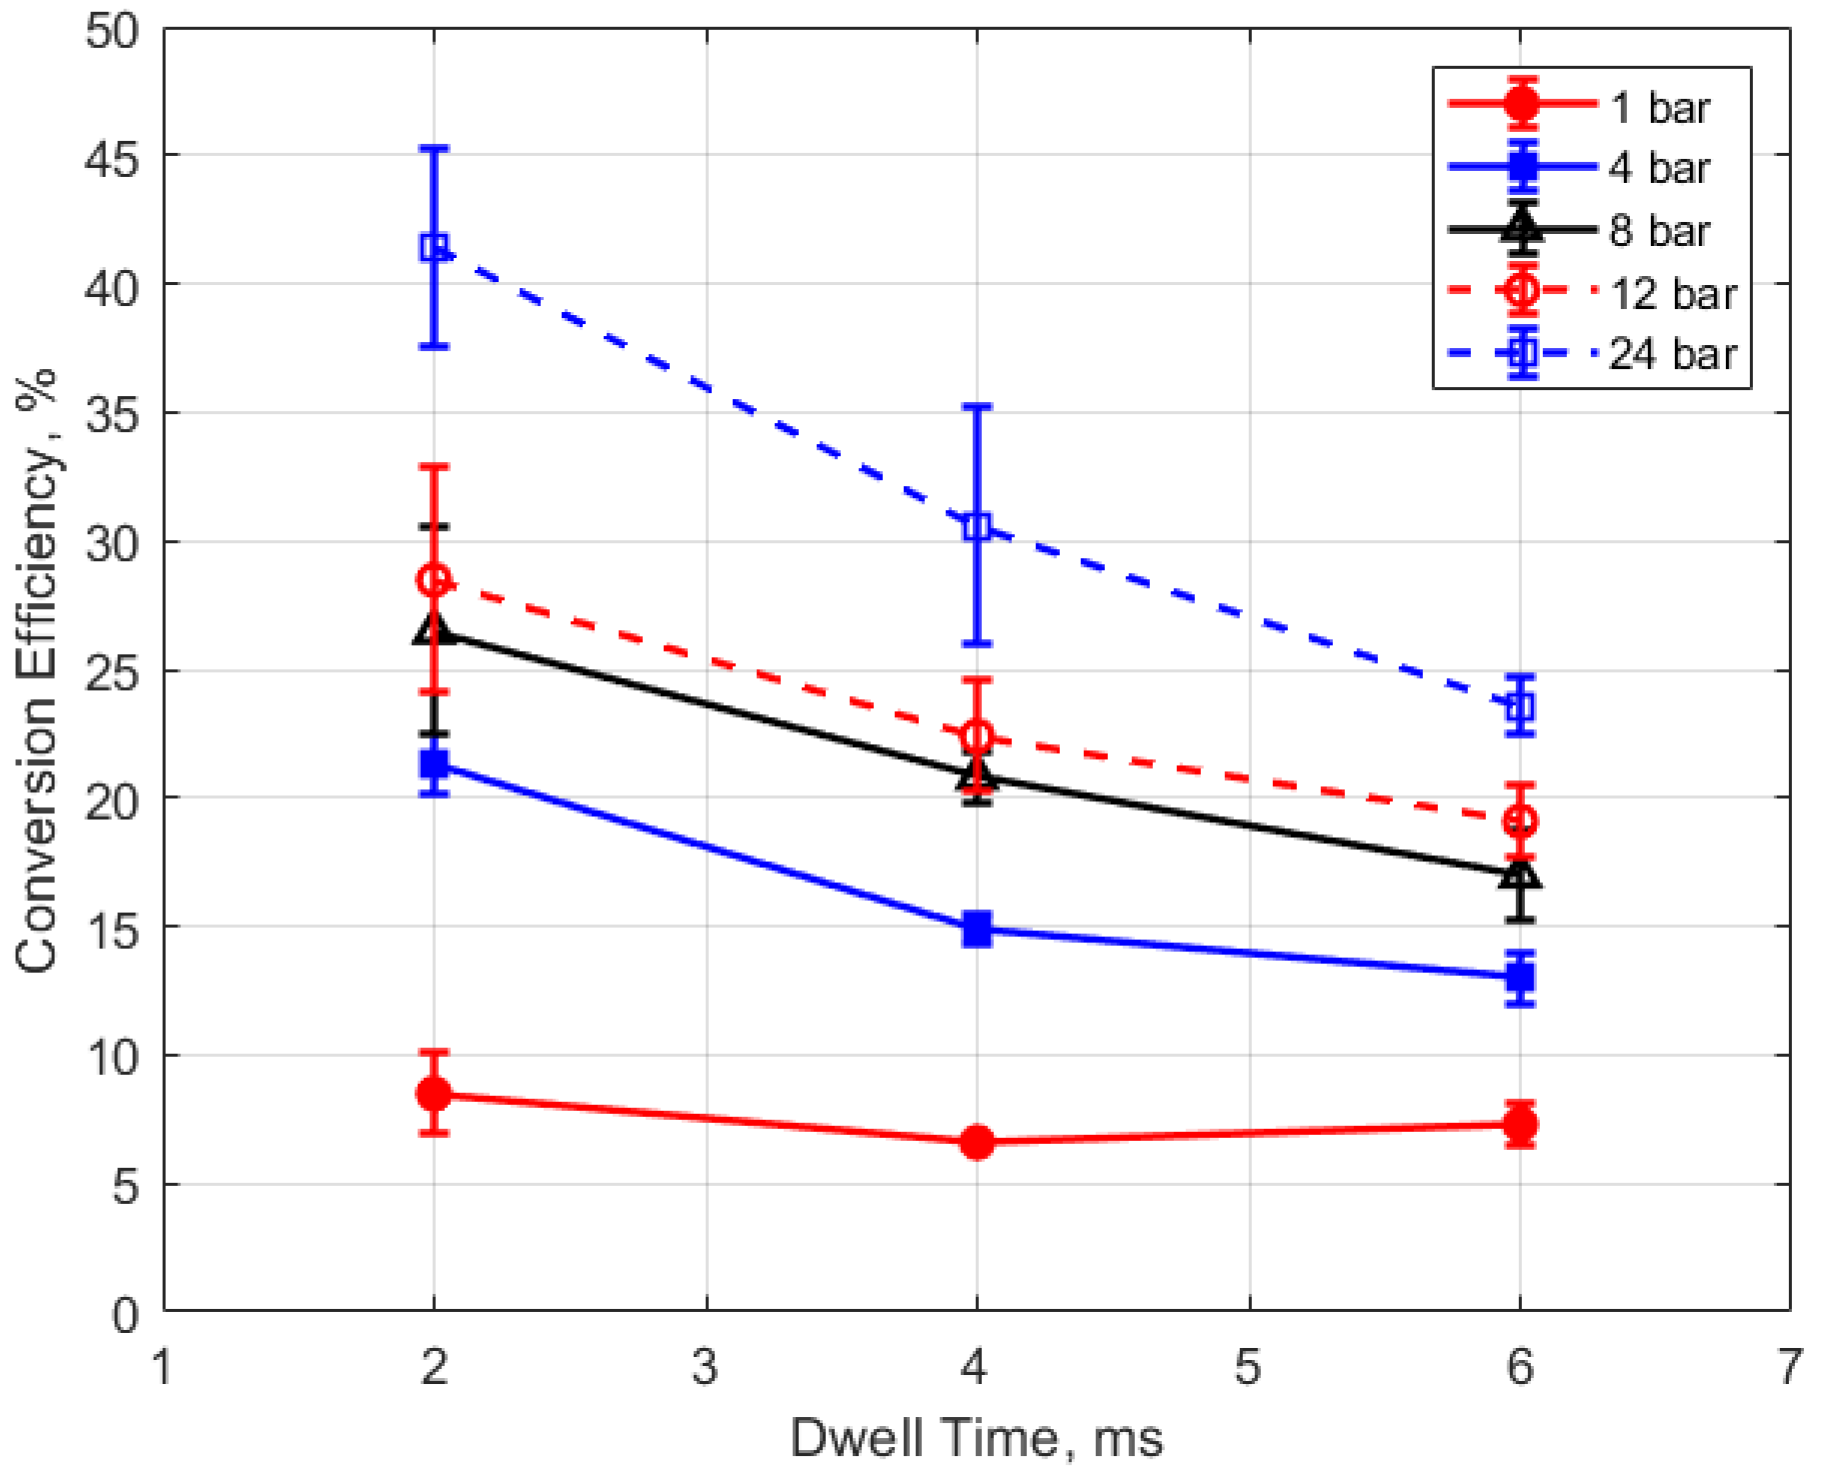
Finally, the conversion efficiencies of electrical energy to thermal energy delivered to the gap are shown in Figure 23, Figure 24, Figure 25 and Figure 26. Figure 23 shows the conversion efficiency as a function of initial gas pressure for the different gap distances. Conversion efficiency increased monotonically with gas pressure, but the dependency was not linear.
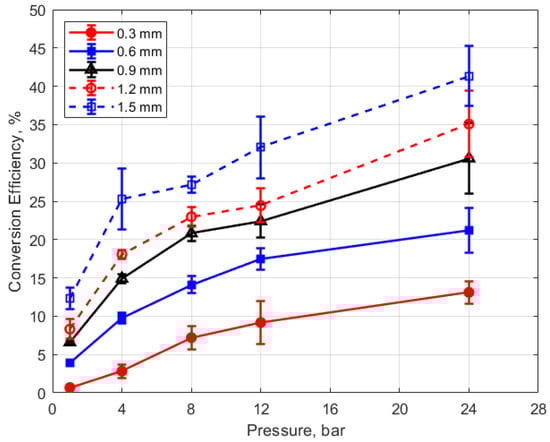
Figure 23.
Conversion efficiency vs. pressure for different gaps, for a dwell time of 4 ms.
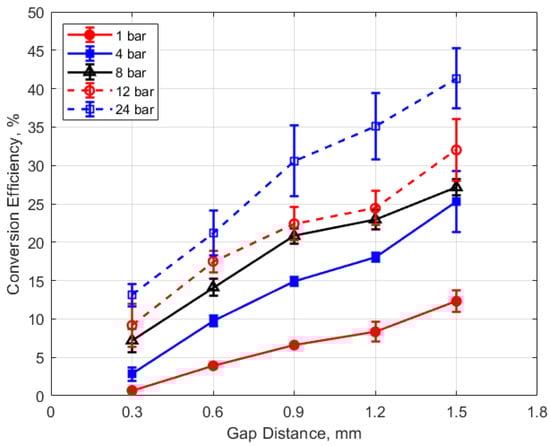
Figure 24.
Conversion efficiency vs. gap for different pressures, for a dwell time of 4 ms.

Figure 25.
Conversion efficiency vs. dwell for different gaps, for a pressure of 12 bar.
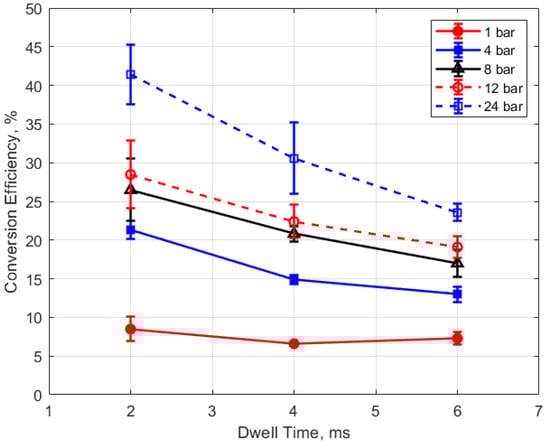
Figure 26.
Conversion efficiency vs. dwell for different pressures, for a 0.9 mm gap.
The degree to which the conversion efficiency increased with gas pressure was quite striking. At a pressure of 1 atm and for the smallest gap distance of 0.3 mm, the conversion efficiency was less than 1%, whereas with the largest gap of 1.5 mm and at the highest gas pressure of 24 bar, the conversion efficiency was over 40%. The rate of increase in the conversion efficiency with pressure tended to diminish with increasing pressure, in contrast to the thermal energy deposition for which the rate of increase showed an increase with increasing gas pressure.
Of course, the gas density associated with the room temperature measurements at 1 atm are not representative of the gas density in an engine at the time of ignition. However, the laboratory gas densities at pressures starting at 4 bar become relevant to engine ignition. At 4 bar pressure, conversion efficiencies were less than 15% for gap distances less than 1 mm.
The dependence of conversion efficiency on spark gap distance was also very strong, as depicted in Figure 24. A smaller gap distance effectively increases the ratio of the cold metal surface area subject to heat transfer relative to the volume of the spark plasma, leading to greater heat losses from the arc.
The conversion efficiencies versus dwell time are shown in Figure 25 and Figure 26. A long dwell time results in greater electrical energy supplied to the gap. However, it is interesting that, in general, the efficiency of electrical-to-thermal energy conversion diminished with increasing dwell time. The reason for this is not clear, but longer dwell time resulted in longer spark durations and, consequently, more time for heat transfer to occur.
4. Summary and Conclusions
A spark plug calorimeter was designed and built that utilizes a high sensitively chip-based differential pressure sensor to detect the rise in gas pressure associated with the thermal energy deposition to the gas from the spark discharge. It differs from most spark plug calorimeters in that the differential pressure rise is measured relative to the initial pressure of the calorimeter chamber rather than relative to the outside ambient pressure or internal reference. This feature creates the possibility of higher precision measurements from a wider dynamic range of the sensor and its high sensitivity. The strength of its stainless steel construction allowed tests to be safely performed at gas pressures at least as high as 24 bar.
The present calorimeter was used to measure the thermal energy deposition and the efficiency of electrical energy to thermal energy conversion for arc discharges for a standard 14 mm automotive resistor-type spark plug for gas pressures between 1 atm and 24 bar, gap distances between 0.3 and 1.5 mm, and inductive ignition circuit dwell times between 2 and 6 ms.
Spark breakdown voltages were measured as well. They were in the expected range, based on the literature, but they did not closely follow the expected linear trends relative to changes in gas density and gap distance suggested by Paschen’s law (e.g., Figure 7 and Figure 8), with the rate of increase in breakdown voltages with increasing gap and increasing pressure less than linear.
Arc-type, as opposed to glow-type spark discharges, were investigated, as distinguished by the sustaining arc voltages during discharge in the range of 100 V–200 V (e.g., Figure 5). The measured electrical energies delivered to the gap increased with both increasing gas pressure and gap distance, but the thermal energy delivered to the gap increased much more strongly. For example, delivered electrical energies, for the larger gaps, increased by approximately 50–90% between 4 and 24 bar pressures, whereas thermal energy deposition increased approximately 200% over the same pressure range. For the same ignition hardware and operating conditions, the thermal energy delivered to the gap varied from less than 1 mJ at 1 atm pressure and a gap distance of 0.3 mm to over 25 mJ at a pressure of 24 bar and a gap distance of 1.5 mm (e.g., Figure 19 and Figure 20).
These trends were reflected in the electrical-to-thermal energy conversion efficiency, which increased monotonically with gas density. For gas densities representative of those in an engine at the time of ignition, the conversion efficiencies ranged from approximately 3% at low pressures (4 bar) and small gap (0.3 mm) to as much as 40% at the highest pressure of 24 bar and with a gap of 1.5 mm (e.g., Figure 23 and Figure 24).
For the particular spark plug and ignition circuit used, empirically calibrated expressions were derived for the incremental change in thermal energy deposition with changes in either gas pressure or gap distance.
Author Contributions
K.K. was responsible for data curation, validation and formal analysis. P.S.W. was responsible for the acoustic analysis of the calorimeter/sensor system. R.D.M. and M.J.H. were responsible for the conceptualization and supervision of the project. All authors participated in the writing, review, and editing of the manuscript. All authors have read and agreed to the published version of the manuscript.
Funding
This project was made possible through the funding provided by Cummins Inc, through the University of Texas at Austin’s site of the National Science Foundation Center for Efficient Vehicles and Sustainable Transportation Systems (EVSTS), NSF Award 1650483.
Acknowledgments
The authors wish to express their gratitude to Sachin Joshi, Daniel J. O’Connor and Douglas L. Sprunger of Cummins Inc. for many helpful discussions and we wish to thank Cummins Inc. for their financial support of this project.
Conflicts of Interest
The authors declare no conflicts of interest.
References
- Maly, R.; Vogel, M. Initiation and Propagation of Flame Fronts in Lean CH4-Air Mixtures by the Three Modes of the Ignition Spark. In Proceedings of the 17th Symposium on Combustion, the Combustion Institute, Leeds, UK, 20–25 August 1978; pp. 821–831. [Google Scholar]
- Haiwen, G.; Zhao, P. A Comprehensive Ignition System Model for Spark Ignition Engines. In Proceedings of the ASME 2018, Internal Combustion Engine Division Fall Technical Conference, ICEF2018-9574, San Diego, CA, USA, 4–7 November 2018. [Google Scholar]
- Scarcelli, R.; Zhang, A.; Wallner, T.; Som, S.; Huang, J.; Wijeyakulasuriya, S.; Mao, Y.; Zhu, X.; Lee, S. Development of a Hybrid Lagrangian-Eularian Model to describe Spark-Ignition Processes at Engine-like Turbulent Flow Conditions. In Proceedings of the ASME 2018, Internal Combustion Engine Division Fall Technical Conference, ICEF2018-9690, San Diego, CA, USA, 4–7 November 2018. [Google Scholar]
- Subramaniam, V.; Karpatne, A.; Breden, D.; Laximinarayan, R. Simulation of Spark-Initiated Combustion. In Proceedings of the WCX SAE World Congress Experience, Detroit, MI, USA, 9–11 April 2019. SAE Technical Paper 2019-01-0226. [Google Scholar]
- Meek, N.F. Electrical Breakdown of Gases; Oxford at the Clarendon Press: London, UK, 1953. [Google Scholar]
- Maly, R. Spark Ignition: Its Physics and Effect on the Internal Combustion Engine. In Fuel Economy; Hilliard and Springer, Ed.; Chapter 3; Plenum Press: New York, NY, USA, 1984. [Google Scholar]
- Lee, M.; Hall, M.J.; Ezekoye, O.A.; Matthews, R.D. Voltage and Energy Deposition Characteristics of Spark Ignition Systems. In Proceedings of the SAE 2005 World Congress & Exhibition, Detroit, MI, USA, 11–14 April 2005. SAE Technical Paper 2005-01-0231. [Google Scholar]
- Roth, W.; Guest, P.G.; Elbe, G.; Lewis, B. Heat Generation by Electric Sparks and Rate of Heat Loss to the Spark Electrodes. J. Chem. Phys. 1951, 19, 1530–1535. [Google Scholar] [CrossRef]
- Merritt, L.R. A Spark Calorimeter. J. Phys. E Sci. Instrum. 1978, 11, 193–194. [Google Scholar] [CrossRef]
- Franke, A.; Reinmann, R. Calorimetric Characterization of Commercial Ignition Systems. In Proceedings of the SAE 2000 Automotive Dynamics & Stability Conference SAE 2000 World Congress, Troy, MI, USA, 15–17 May 2000. SAE Technical Paper 2000-01-0548. [Google Scholar] [CrossRef]
- Teets, R.E.; Sell, J.A. Calorimetry of ignition sparks. In Proceedings of the SAE International Congress and Exposition, Detroit, MI, USA, 29 February 1988. SAE Technical Paper 880204. [Google Scholar]
- Verhoeven, D. Spark heat transfer measurements in flowing gases. In Proceedings of the 1995 SAE International Fall Fuels and Lubricants Meeting and Exhibition, Toronto, ON, Canada, 16–18 October 1995. SAE Technical Paper 952450. [Google Scholar]
- Abidin, Z.; Chadwell, C. Parametric Study and Secondary Circuit Model Calibration Using Spark Calorimeter Testing. In Proceedings of the SAE 2015 World Congress & Exhibition, Detroit, MI, USA, 21–23 April 2015. SAE Technical Paper 2015-01-0778. [Google Scholar] [CrossRef]
- Alger, T.; Mangold, B.; Mehta, D.; Roberts, C. The Effect of Sparkplug Design on Initial Flame Kernel Development and Sparkplug Performance. In Proceedings of the SAE 2006 World Congress & Exhibition, Busan, Korea, 24–28 September 2006. SAE Technical Paper 2006-01-0224. [Google Scholar] [CrossRef]
- Ekici, O.; Ezekoye, O.A.; Hall, M.J.; Matthews, R.D. Thermal and Flow Fields Modeling of Fast Spark Discharges in Air. ASME J. Fluids Eng. 2007, 129, 55–65. [Google Scholar] [CrossRef]
- Kinsler, L.E.; Frey, A.R. Fundamentals of Acoustics; Wiley: New York, NY, USA, 2000. [Google Scholar]
- Lewis, B.; von Elbe, G. Combustion, Flames, Explosions of Gases; Academic Press: New York, NY, USA, 1987. [Google Scholar]


© 2020 by the authors. Licensee MDPI, Basel, Switzerland. This article is an open access article distributed under the terms and conditions of the Creative Commons Attribution (CC BY) license (http://creativecommons.org/licenses/by/4.0/).