Article

Modeling of a CPV/T-ORC Combined System Adopted for an Industrial User

1
Department of Industrial Engineering, University of Salerno, Via Giovanni Paolo II, 132, 84084 Fisciano (Salerno), Italy
2
Department of Industrial Engineering, University of Naples “Federico II”, Piazzale Tecchio 80, 80125 Naples, Italy
*
Author to whom correspondence should be addressed.
Energies 2020, 13(13), 3476; https://doi.org/10.3390/en13133476
Submission received: 6 June 2020 / Revised: 21 June 2020 / Accepted: 3 July 2020 / Published: 5 July 2020
(This article belongs to the Special Issue Applied Thermodynamics and Heat Transfer for Buildings)

Abstract

:
The increasing energy demand encourages the use of photovoltaic solar systems coupled to organic rankine cycle (ORC) systems. This paper presents a model of an ORC system coupled with a concentrating photovoltaic and thermal (CPV/T) system. The CPV/T-ORC combined system, described and modeled in this paper, is sized to match the electrical load of a medium industrial user located in the South of Italy. A line-focus configuration of the CPV/T system, constituted by 16 modules with 500 triple-junction cells, is adopted. Different simulations have been realized evaluating also the direct normal irradiance (DNI) by means of the artificial neural network (ANN) and considering three input condition scenarios: Summer, winter, and middle season. Hence, the energy performances of the CPV/T-ORC system have been determined to evaluate if this integrated system can satisfy the industrial user energy loads. In particular, the peak power considered for the industrial machines is about 42 kW while other electrical, heating or cooling loads require a total peak power of 15 kW; a total electric average production of 7500 kWh/month is required. The annual analysis shows that the CPV/T-ORC system allows satisfying 100% of the electric loads from April to September; moreover, in these months the overproduction can be sold to the network or stored for a future use. The covering rates of the electrical loads are equal to 73%, 77%, and 83%, respectively for January, February, and March and 86%, 93%, and 100%, respectively for October, November, and December. Finally, the CPV/T-ORC combined system represents an ideal solution for an industrial user from the energy point of view.

1. Introduction

Among the renewable technologies, the solar systems represent one of the most interesting solutions for energy production; in fact, they allow matching the energy demands of users both residential and industrial. These systems decrease the primary energy consumptions [1] of residential heating and cooling, commercial buildings, and industries allowing to satisfy both electrical and thermal energy demands.
In particular, the concentrating solar systems are an evolution of the traditional photovoltaic system and allow the decrease of the costs and the global efficiency increase [2]. An interesting solution is represented by the concentrating photovoltaic and thermal systems (CPV/T) that allow to concentrate by means of optical systems the sunlight on a photovoltaic receiver; hence, the photovoltaic area and costs of plant decrease [3]. Differently from the concentrating photovoltaic system (CPV), the CPV/T system allows recovering thermal energy by means of a cooling circuit [4], because the sunlight concentration determines a triple-junction (TJ) cells temperature increase [5]. The cooling circuit allows preserving the TJ cells and producing both electrical and thermal energy for several types of users.
In literature, solar heating and cooling systems driven by CPV/T systems have been realized [6] for several typologies of users. The CPV/T systems can operate at temperatures higher than 100 °C [7] allowing to match even the cooling load by means of the adsorption chiller technology [8]. In [9], two air conditioning systems that adopt a solid desiccant cycle and equipped with PVT collectors, are analyzed. In [10], the energy and economic performances of a desiccant cooling system adopting a solar system, are evaluated. However, in literature, the principal aim is to find new solutions that allow reducing primary energy consumption [11] and determining savings from an economic point of view, by adopting also renewable energy sources [12]. Moreover, it is important to observe that the reliability of the triple-junction cells adopted in the CPV systems on varying the operation temperature, is another basic topic as reported in [13].
In this paper, the main purpose is the performance study of a concentrating photovoltaic and thermal (CPV/T) system coupled with an organic rankine cycle (ORC) to match the energy loads of an industrial user. In [14], a modified CPV/ORC system is modeled and the optimum operation temperature of the photovoltaic module is determined for several photovoltaic efficiency values. In [15], the behavior of a solar power generation system that consists of a CPV/T system that utilizes an ORC integrated with a geothermal condenser and an energy storage unit, is studied. A new configuration of a solar concentrating receiver that adopts nano-fluids for spectral splitting and coupled with ORC for thermal energy recovery, is presented in [16]. Hence, in literature, the ORC systems have already been coupled with the solar systems [17], but much less with the CPV/T systems in order to achieve a CPV/T-ORC integrated system able to match the energy demands of a high size user. For this reason, in this paper, a CPV/T-ORC combined system has been sized to satisfy the electrical loads of a medium industrial user located in the South of Italy. Considering the user energy loads, the CPV/T-ORC system has been sized and different simulations have been realized. Once evaluated, the direct normal irradiance (DNI) by means of the artificial neural networks (ANN), three scenarios with different input conditions have been analyzed: Summer, winter, and middle season. Considering the user loads within these scenarios, the CPV/T-ORC system has been sized to evaluate its energy performances, showing how the system can supply the user energy requirements. Moreover, an energy saving analysis has been conducted comparing the CPVT/ORC system with the only use of the CPV/T system. A CPV/T-ORC system allows energy savings according to: User energy loads, solar radiation, environmental conditions, etc. [18].

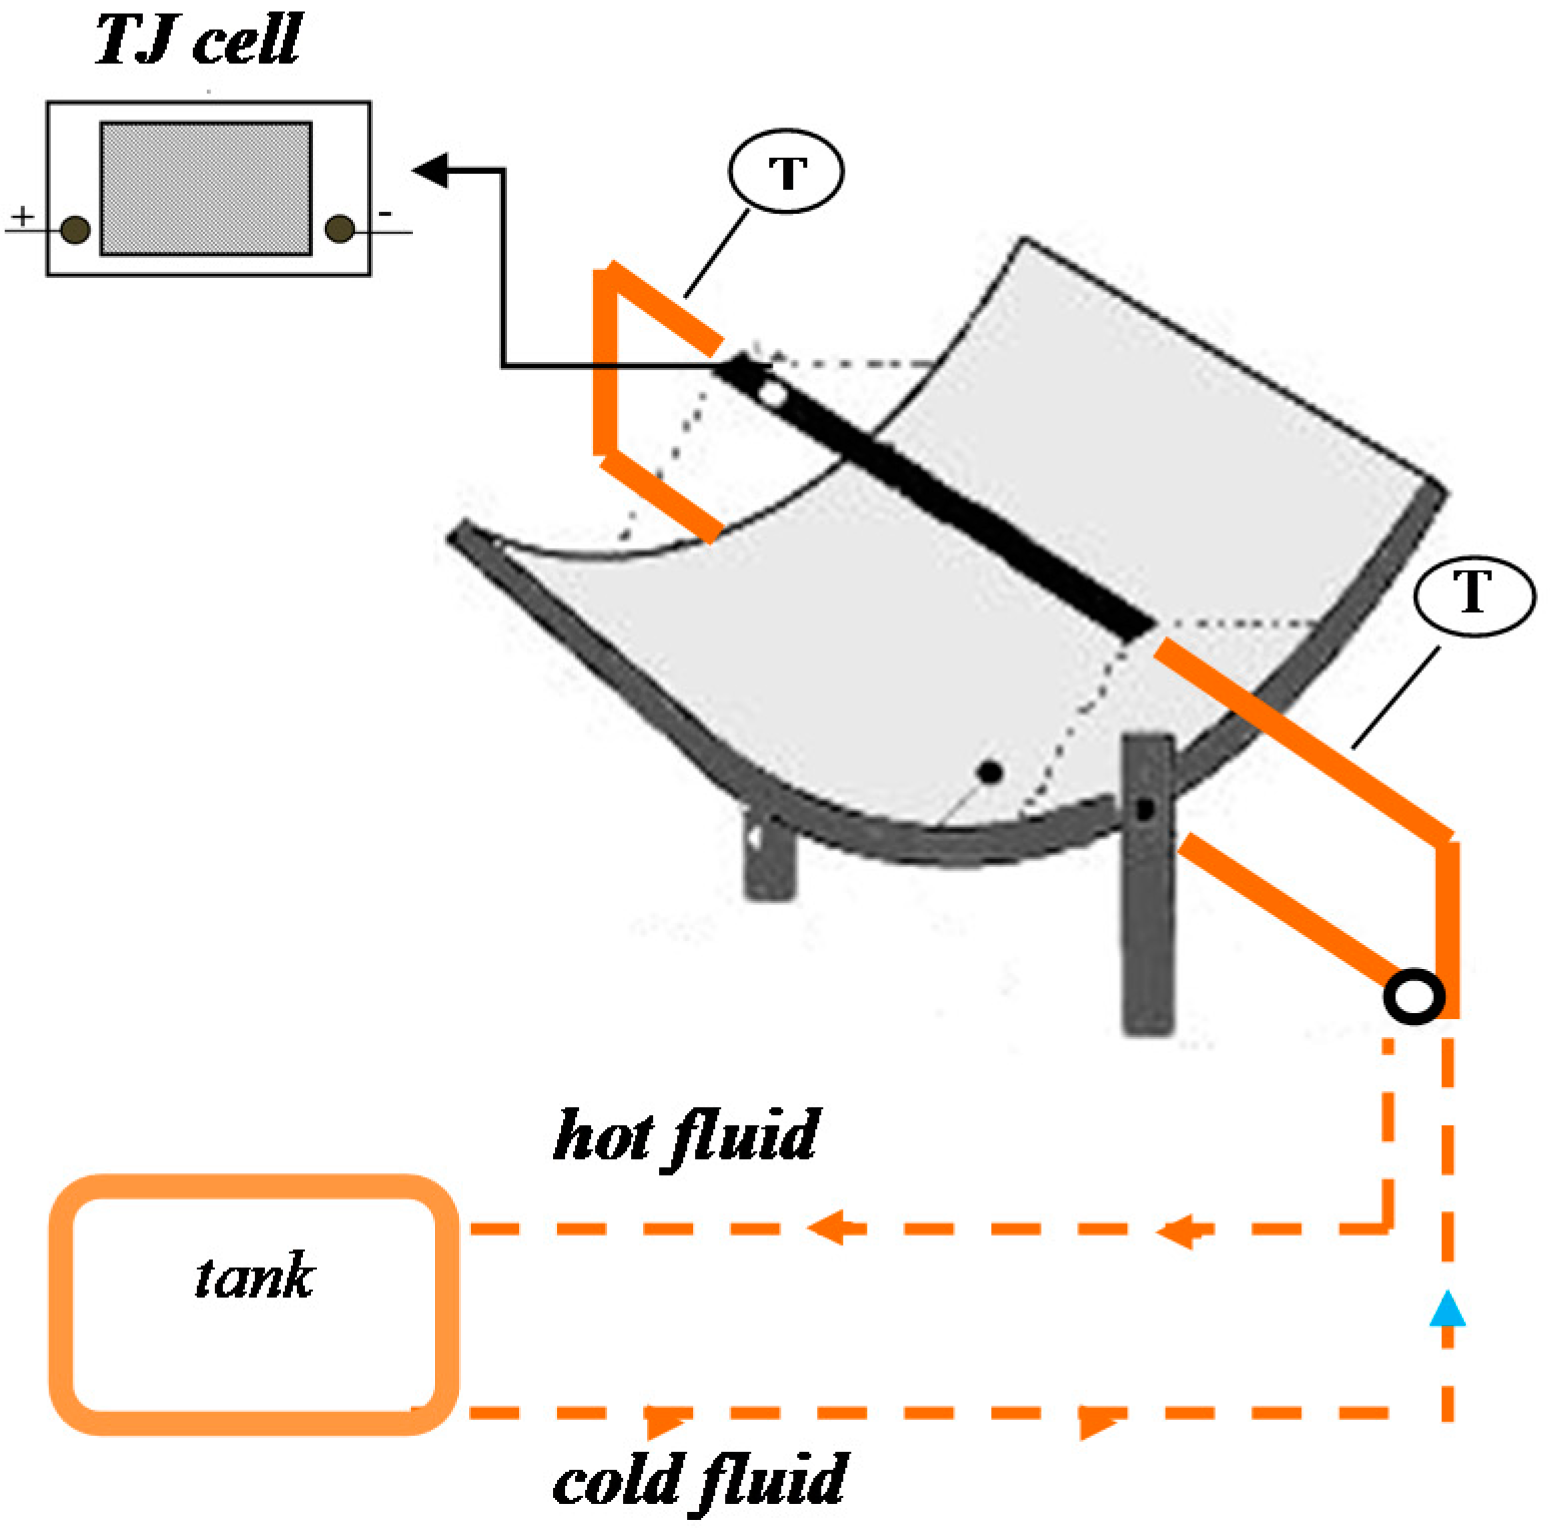
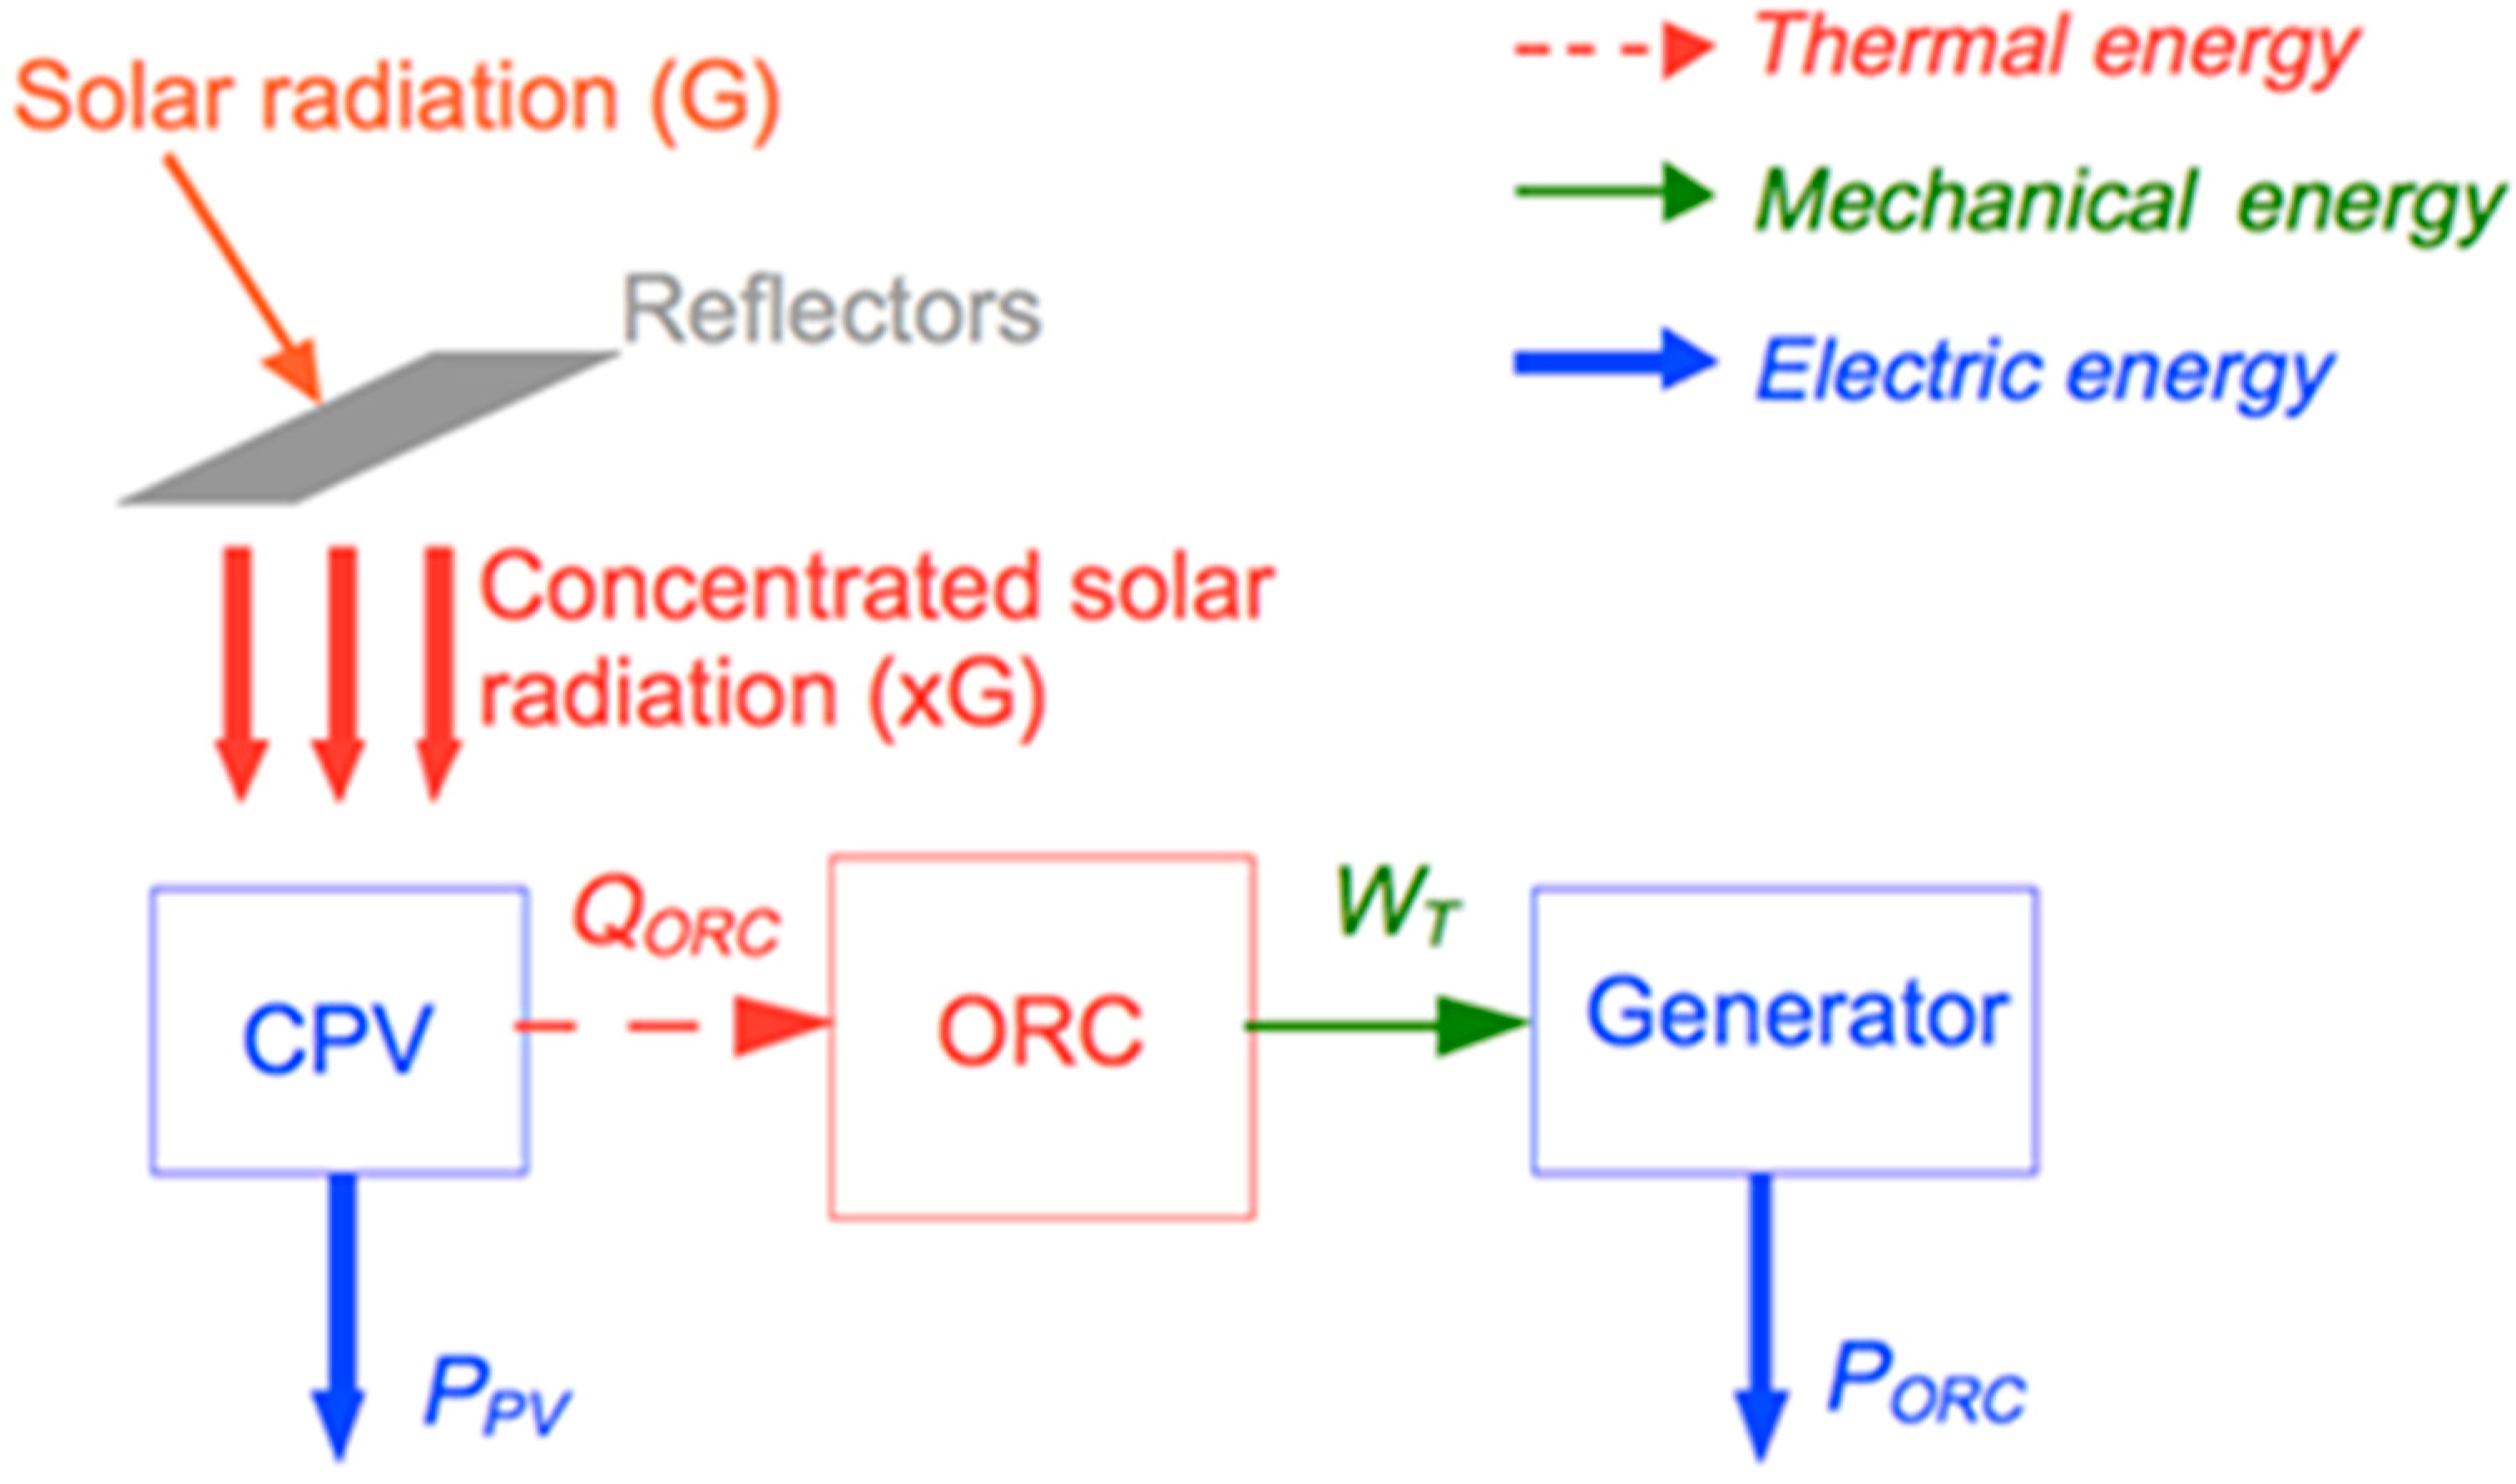
2. CPV/T-ORC System Description

The system modeled in this paper presents a CPV/T system with a line-focus optics that focuses the solar radiation on a line where the triple-junction (TJ) cells are placed. The optics is reflective and presents a trough concentrator made of tempered glass with low aluminum content that allows obtaining a concentration factor equal to about 100. The cells are located on a tube with a diameter of 32 cm in front of the concentrator; the cells number depends on the user load. The TJ cells used in this analysis consist of InGaP/InGaAs/Ge whose characteristics are reported in Table 1. A scheme of the CPV/T system used in the modeling is shown in Figure 1.
The TJ cells work also with high temperatures and then it is possible to recover thermal energy by means of a cooling circuit. A solution of water and glycol flows in the tube under the cells driven by a pump. A thermostat which controls an automatic valve is also adopted. Once reached in the circuit a fixed level of temperature, the fluid is sent to the tank and new cold fluid enters the circuit. The thermal tank allows storing the thermal energy that is able to satisfy the energy demands. The heated cooling fluid is collected in a delivery manifold and then sent to the heat generator of the ORC system. As the ORC cycle adopts a low boiling fluid, the temperatures reached in the CPV/T system are sufficient to feed the cycle. Therefore, obtaining an average temperature of about 70 °C of the cooling fluid of the CPV/T system, it is possible to achieve a double electric output from the solar source.
The CPV/T-ORC system is shown in Figure 2. The solar radiation incident on the mirrors is concentrated on the cells and partially converted into electrical energy, proportionally to the efficiency of the CPV module. The thermal energy produced on the cells is recovered by the cooling circuit of the module and then transferred to the organic fluid, which is thus heated. The evaporated organic fluid is then conducted towards the expander of the cycle, where mechanical energy is produced, and condensed in a cooling unit; finally, it reaches the pump where it is compressed and the cycle is repeated. The mechanical power produced by the ORC system is then converted into electrical power by a generator. The efficiency of the ORC is rather low, given that it operates in a small temperature range, although it may be of the same order of magnitude as the CPV, depending on the point of operation. Hence, the main components of the CPV/T-ORC combined system are: CPV/T plant, which includes a pre-heater and evaporator of the ORC, ORC pump, ORC expander, ORC condenser, ORC cooling pump, ORC generator, and inverter. The system has also a control unit that turns off the ORC when the solar radiation is low. Moreover, a sun tracking system is used to increase the energy production of the system.

3. CPV/T-ORC System Modeling
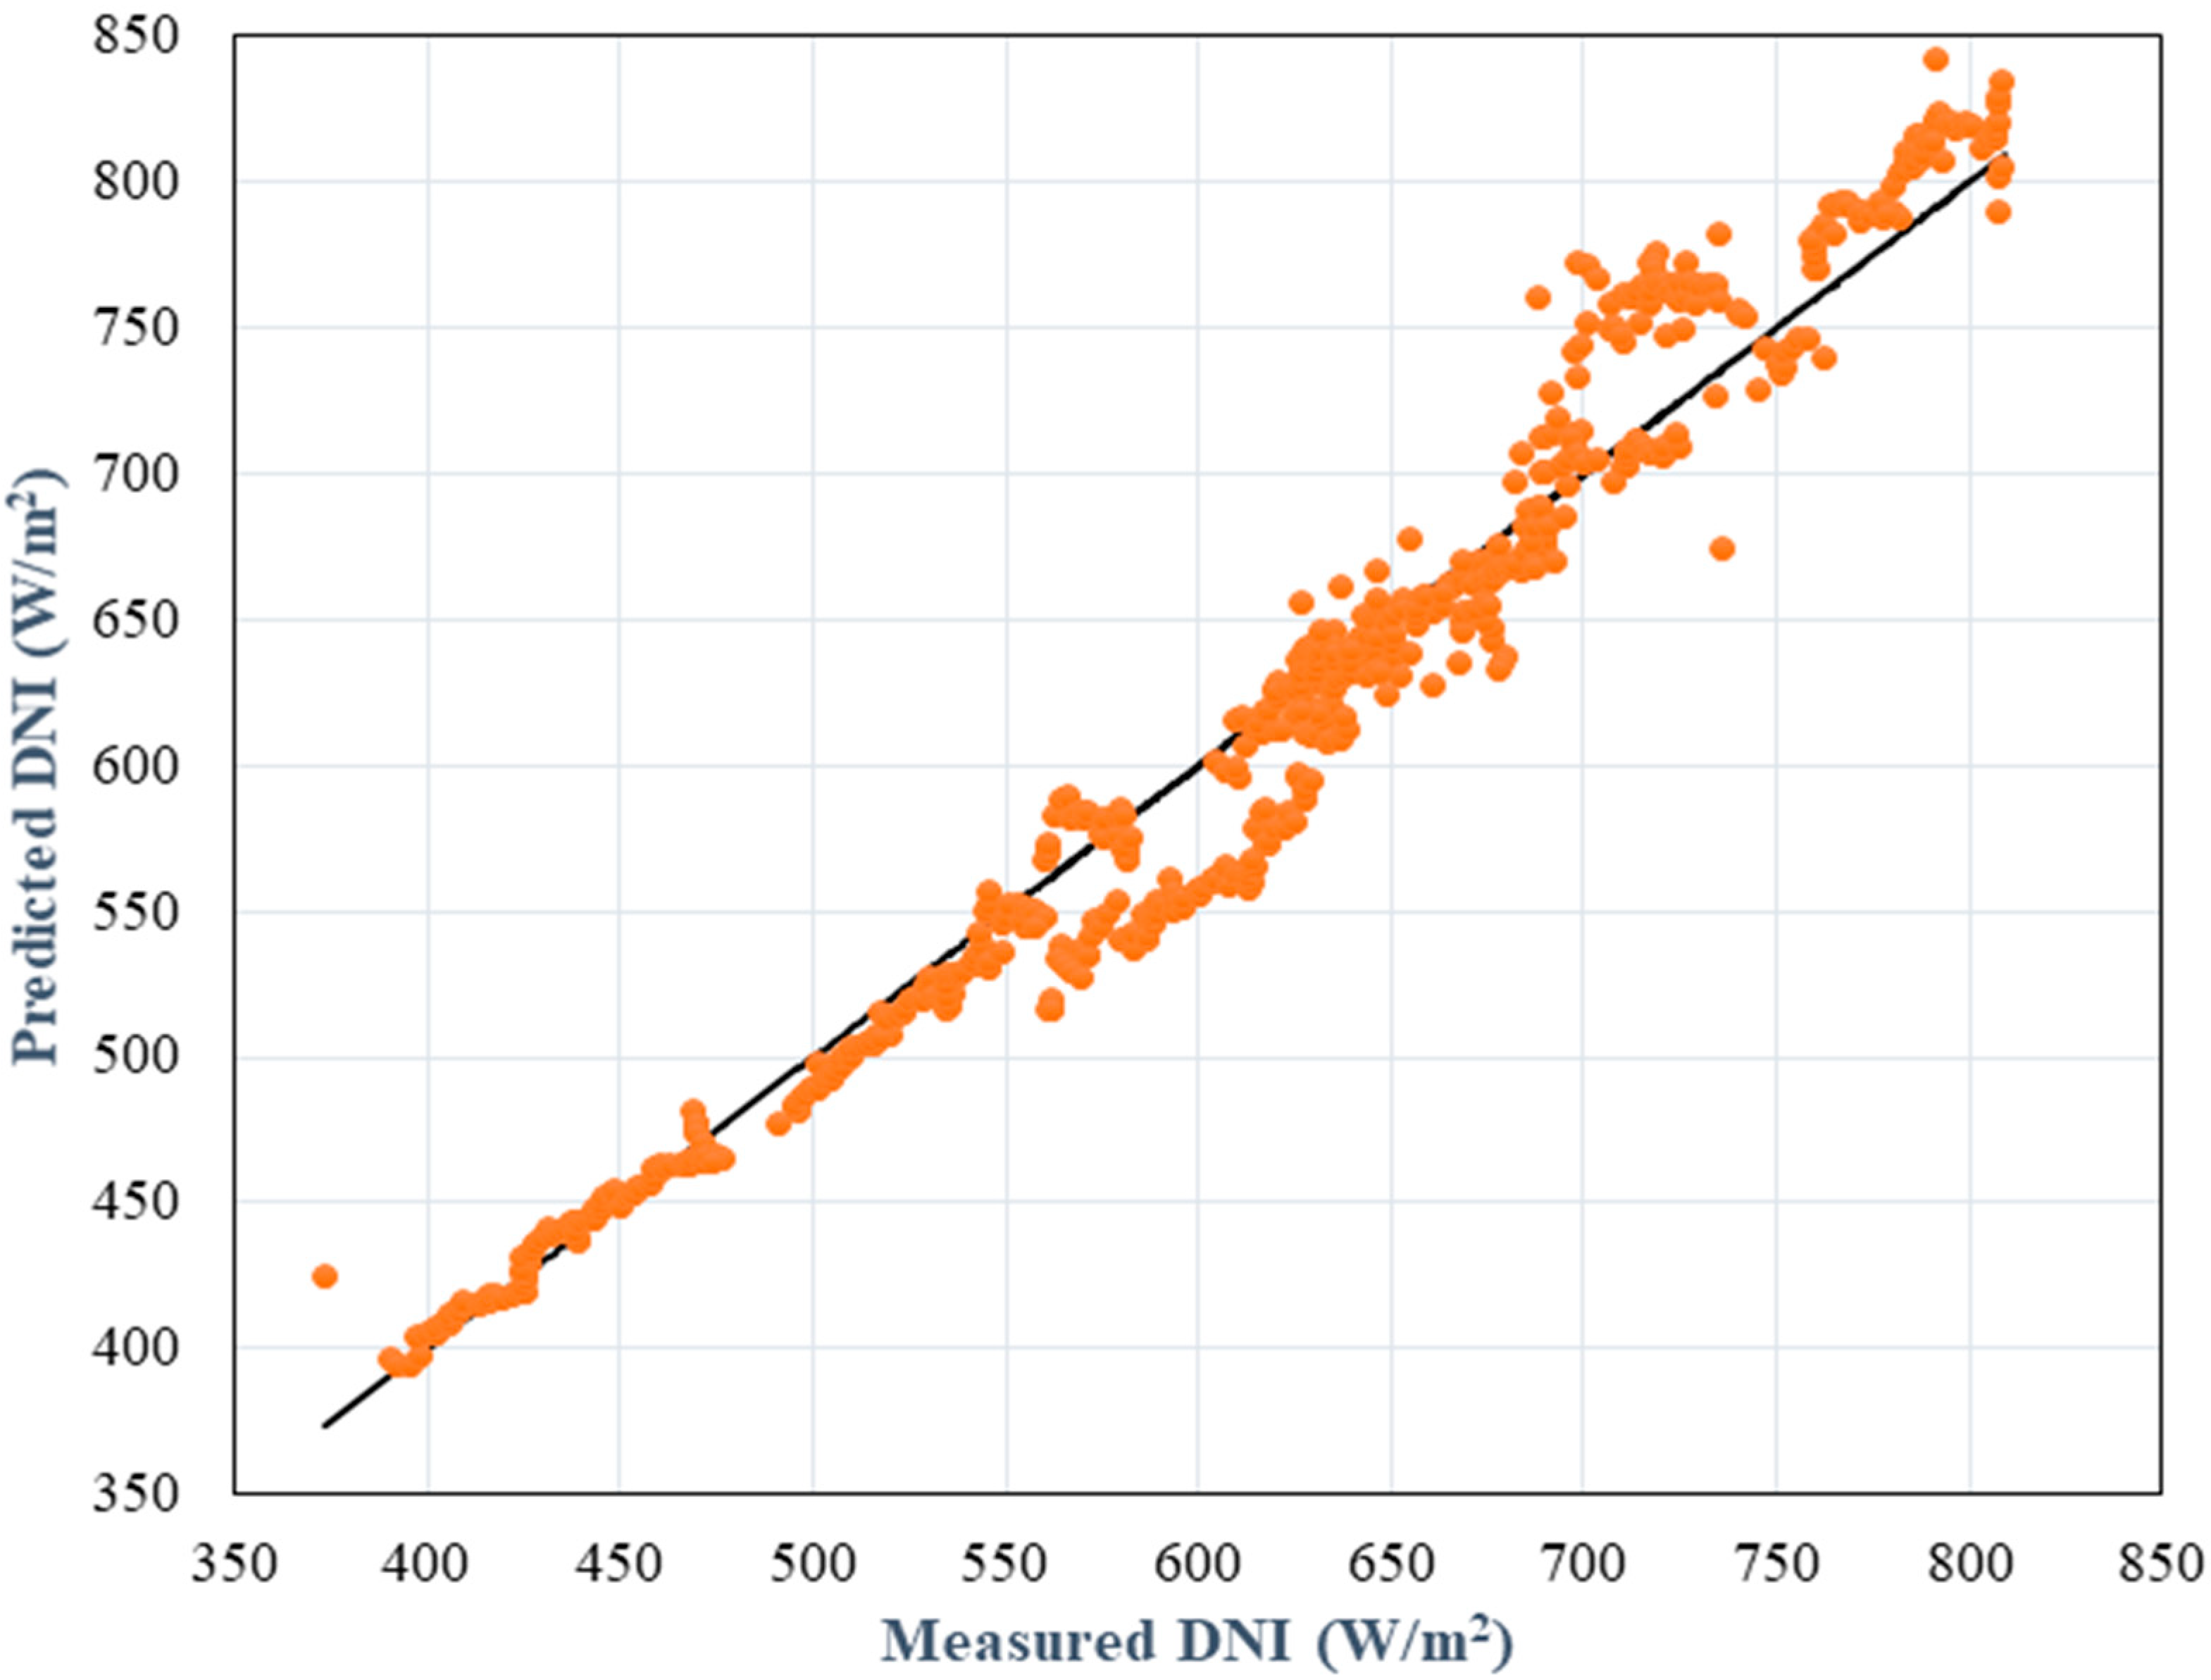
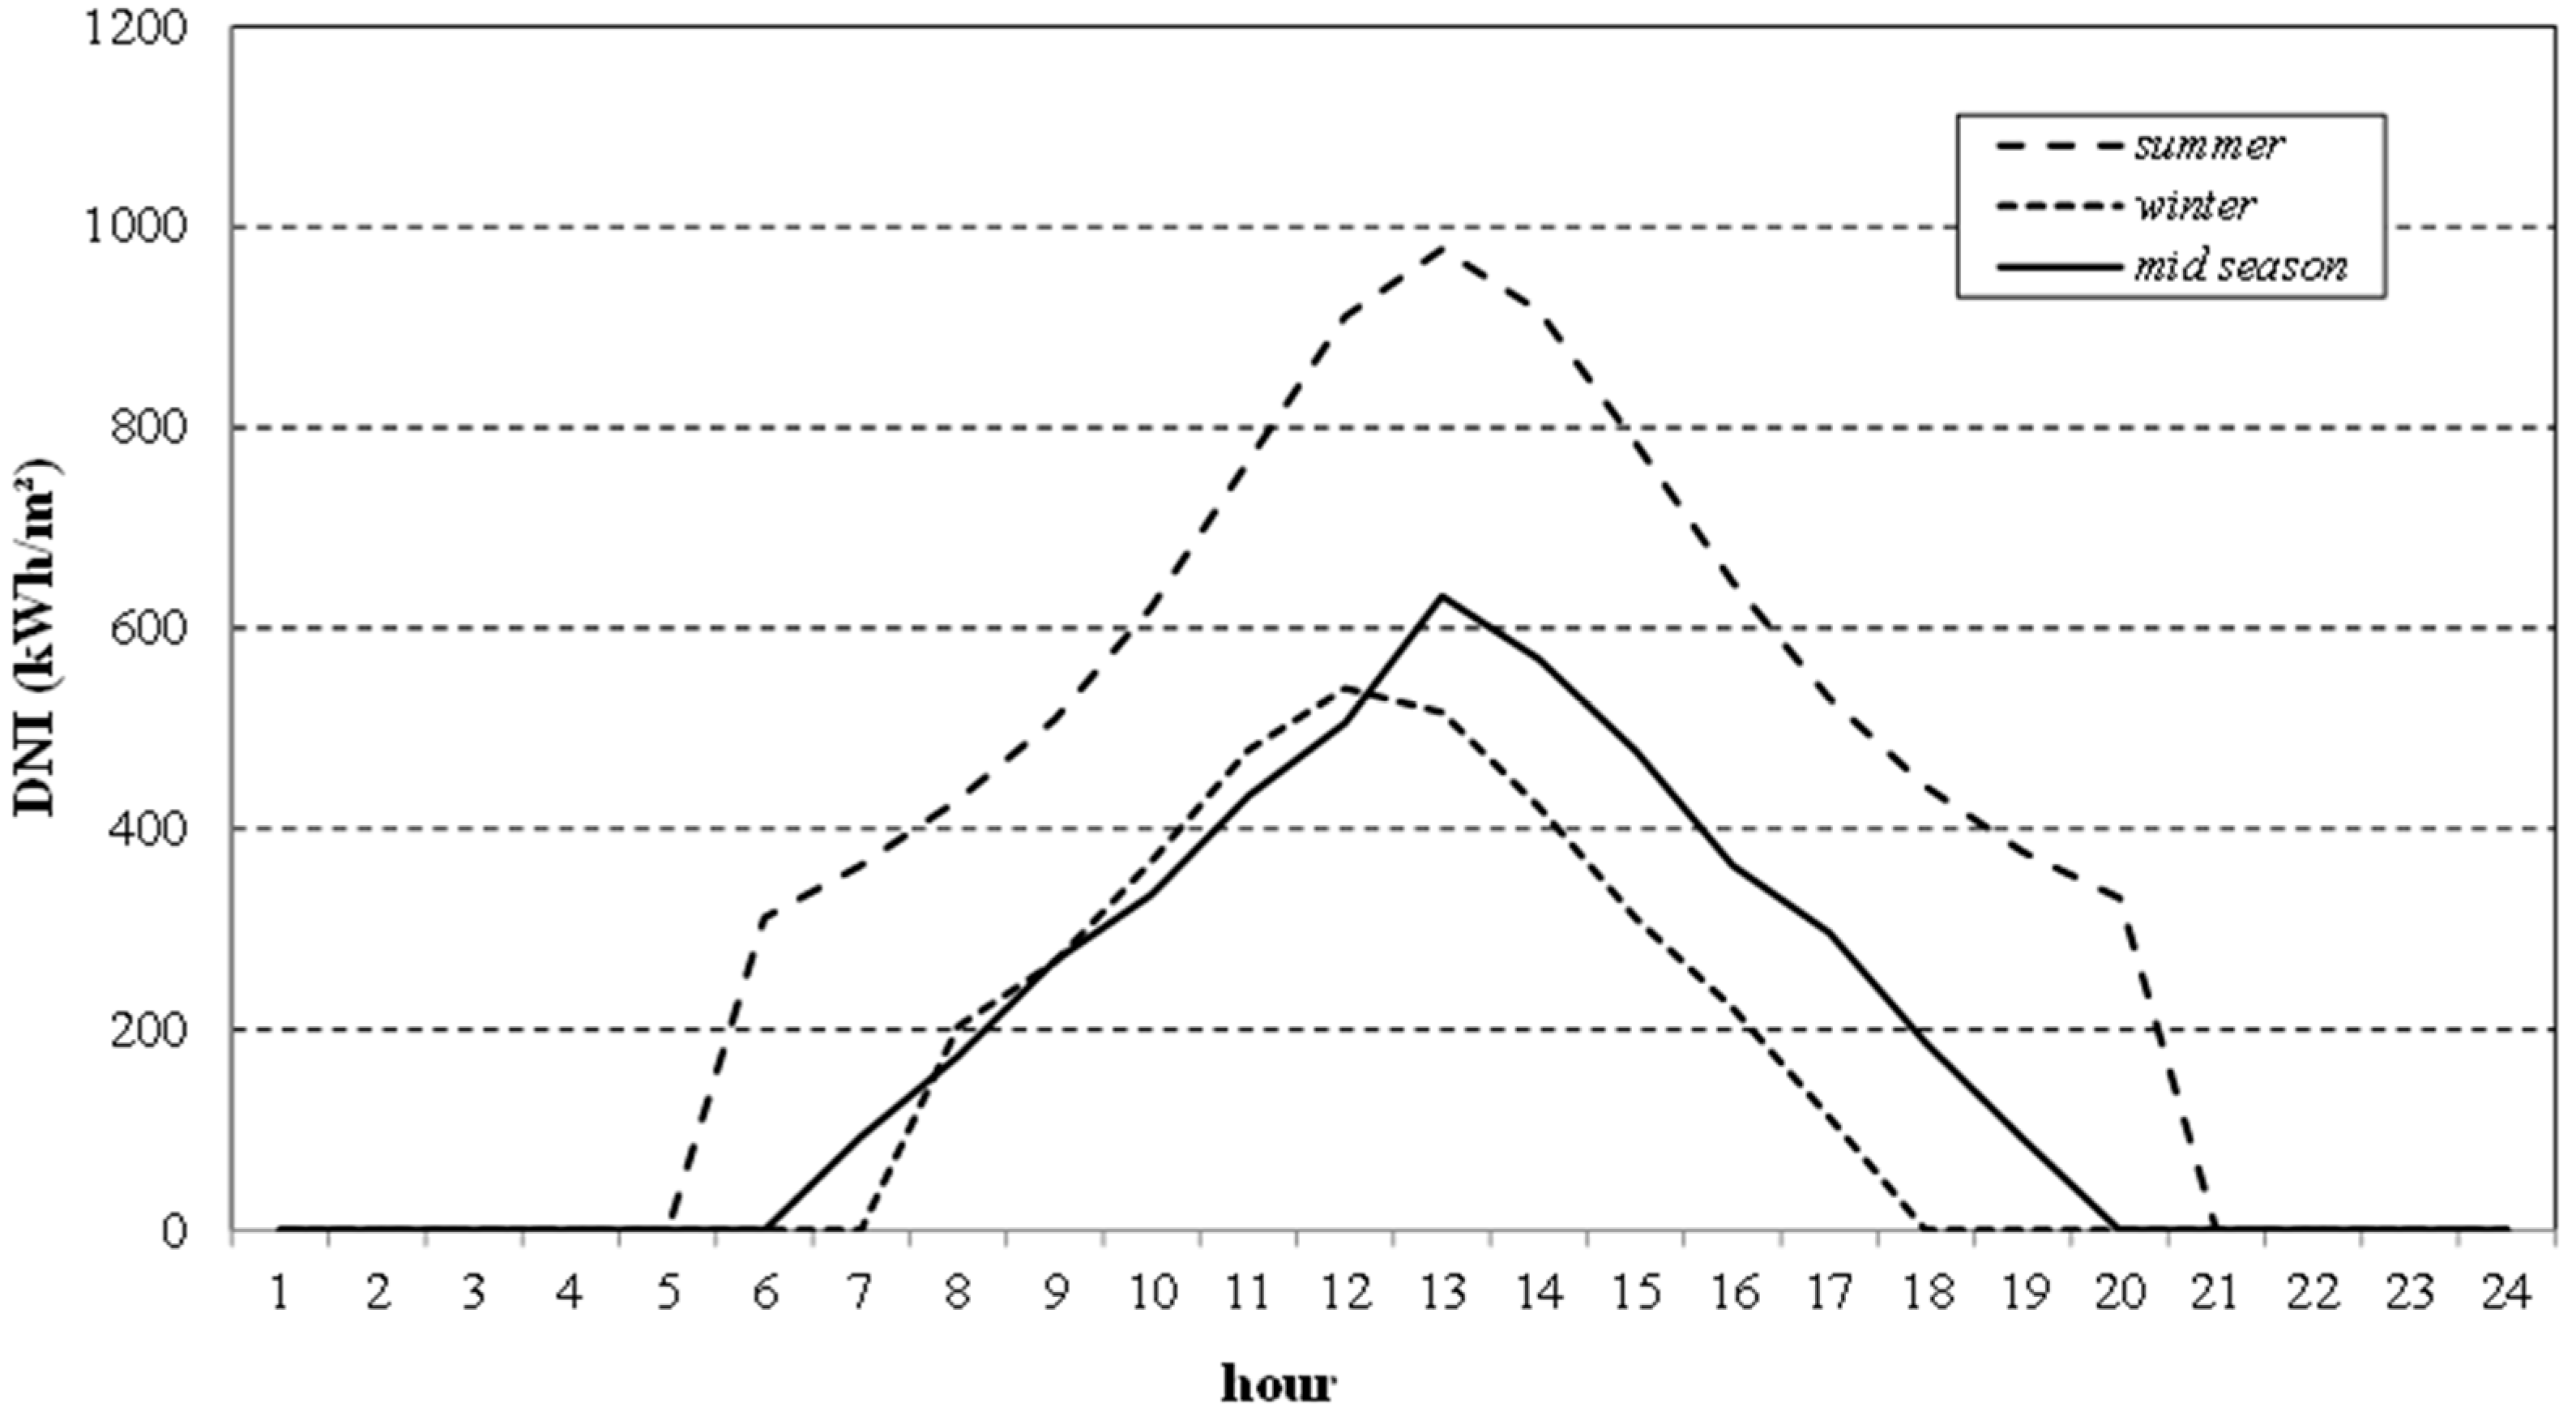
The CPV/T-ORC combined system presented in this paper is modeled to evaluate its energy performances. For this purpose, three models have been integrated to analyze the overall energy output of the designed system. The first model analyzes the input condition mainly represented by the solar radiation. Hence, since the CPV/T system can only work with the direct component of the solar radiation, a model of the direct normal irradiance (DNI) has been described in the next section. Due to the lack of experimental measurements in each situation, an ANN model is adopted to simulate the DNI in all the operating conditions during the year. The other two models describe the operation of the CPV/T and ORC systems and allow evaluating the energy performances of the integrated system.

3.1. DNI Evaluation

In order to accurately evaluate the performances of a CPV/T system, first it is important to determine the DNI generally depending on meteorological, climatic, and radiometric variables [19]. The global radiation measurements are obtained by radiometric stations, while the DNI measurements are limited [20]. The DNI evaluation is complicated because there is a relationship of non-linearity between the variables [21]. An ANN model can solve non-linear problems using long-term data series, studying tasks depending on the physical phenomena [22] not considering the hypothesis of prefixed correlations between input and output data [23].
ANNs link many neurons. Important data to be considered include input variables, the number of layers and neurons for a layer, training functions of the learning process using a set of past data, and transfer functions between layers that exchange information. Once fixed, the ANN structure, the steps of learning, validation, and test are considered. The first two steps allow the network to learn the phenomena and to set the neuron parameters such as weights and bias. The third step uses new data to determine the network prediction capability adopting an error analysis [24]. Among the different methodologies adopted to predict the DNI [25], in this paper the ANN model adopts a multi-layer perceptron network [26]. The data have been obtained by databases and experimental measurements [27] in order to evaluate the initial dataset for the several phases. The training data refer to six months and the validation subset is two months. Clearness index (kt), declination angle (δ), hour angle (HRA), and global normal irradiance (Gni) are the astronomical and radiometric variables used as input variables [27]; the Levenberg-Marquadt algorithm is used for the network training process. As a consequence, the DNI is expressed in this way:
DNI = f ( k t , δ , HRA , G ni )
In the ANN topologic configuration of the DNI there are four input neurons and a hidden layer with five neurons. It adopts a sigmoid function from the input to the hidden layer and a linear function from the hidden to the output layer. The test phase evaluates the good prediction capability of the ANN model. Figure 3 shows the validation results of the training process. A mean absolute percentage error of 2.65% has been determined in the comparison between predicted and measured values. In Figure 4, the predicted DNI is reported as related to winter and summer conditions. These results allow the input conditions to simulate the integrated CPV/T-ORC system necessary to evaluate its energy performances in winter, summer, cloudy, or sunny days.

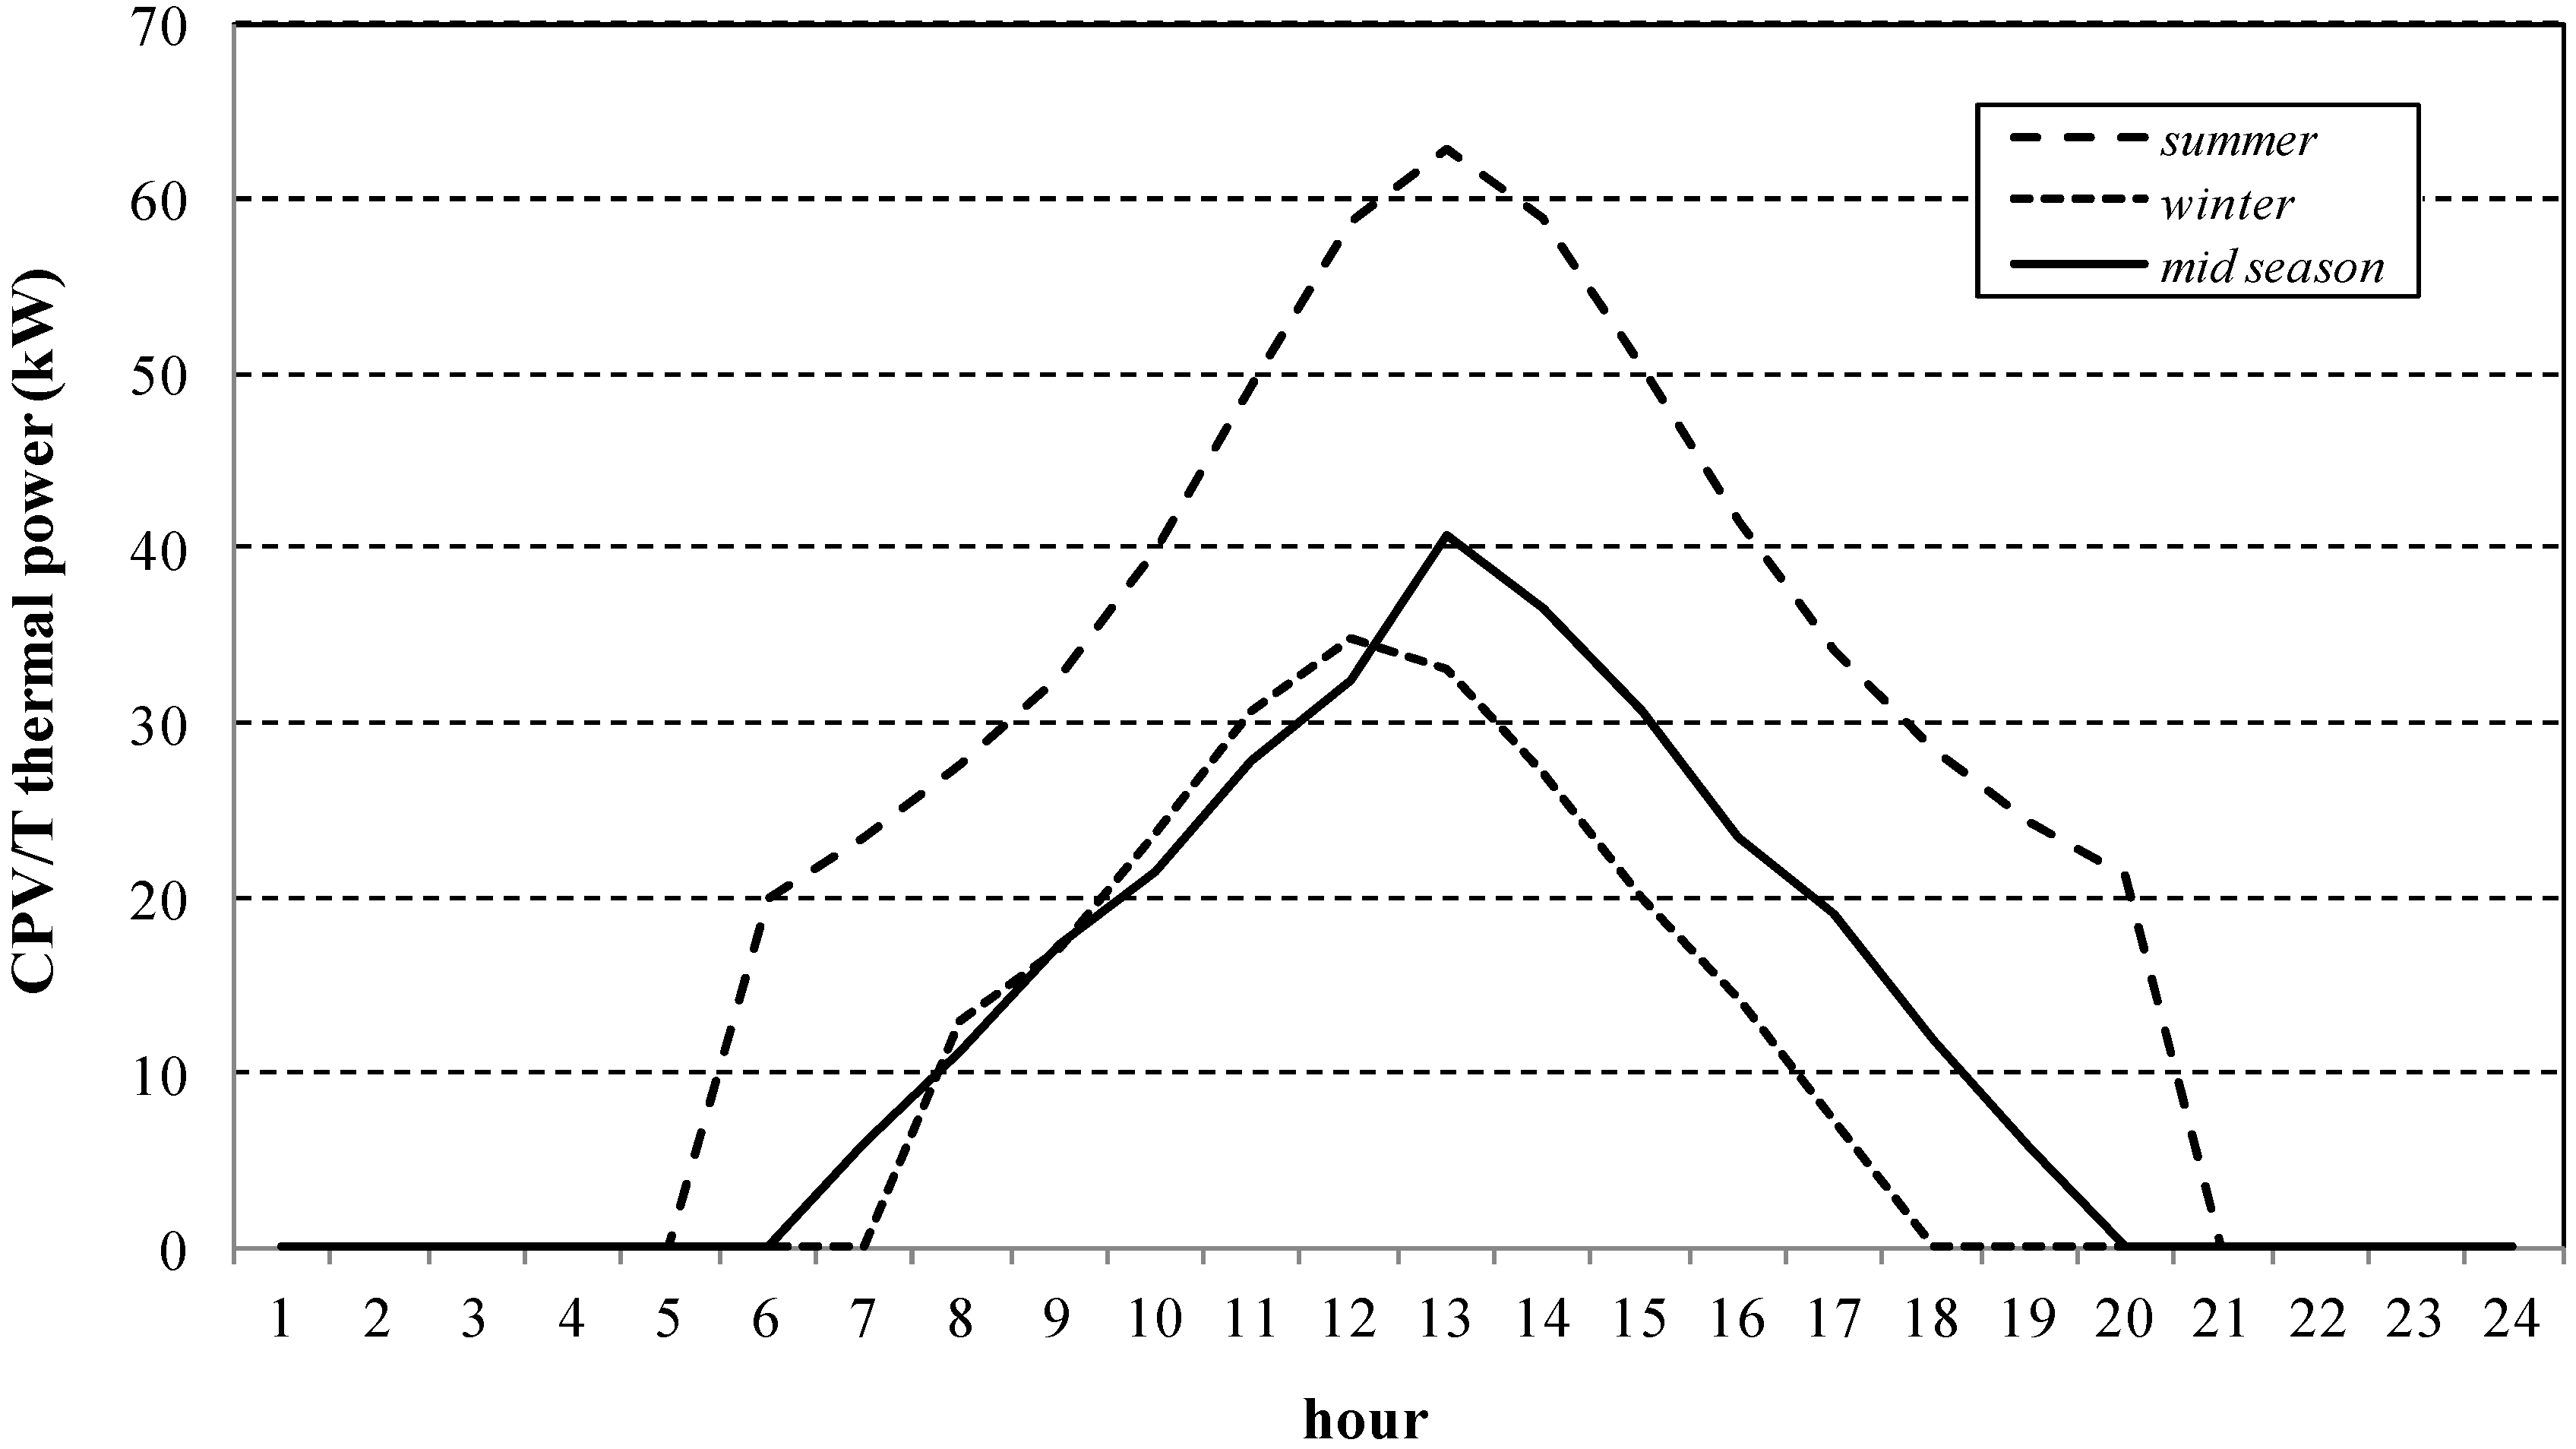
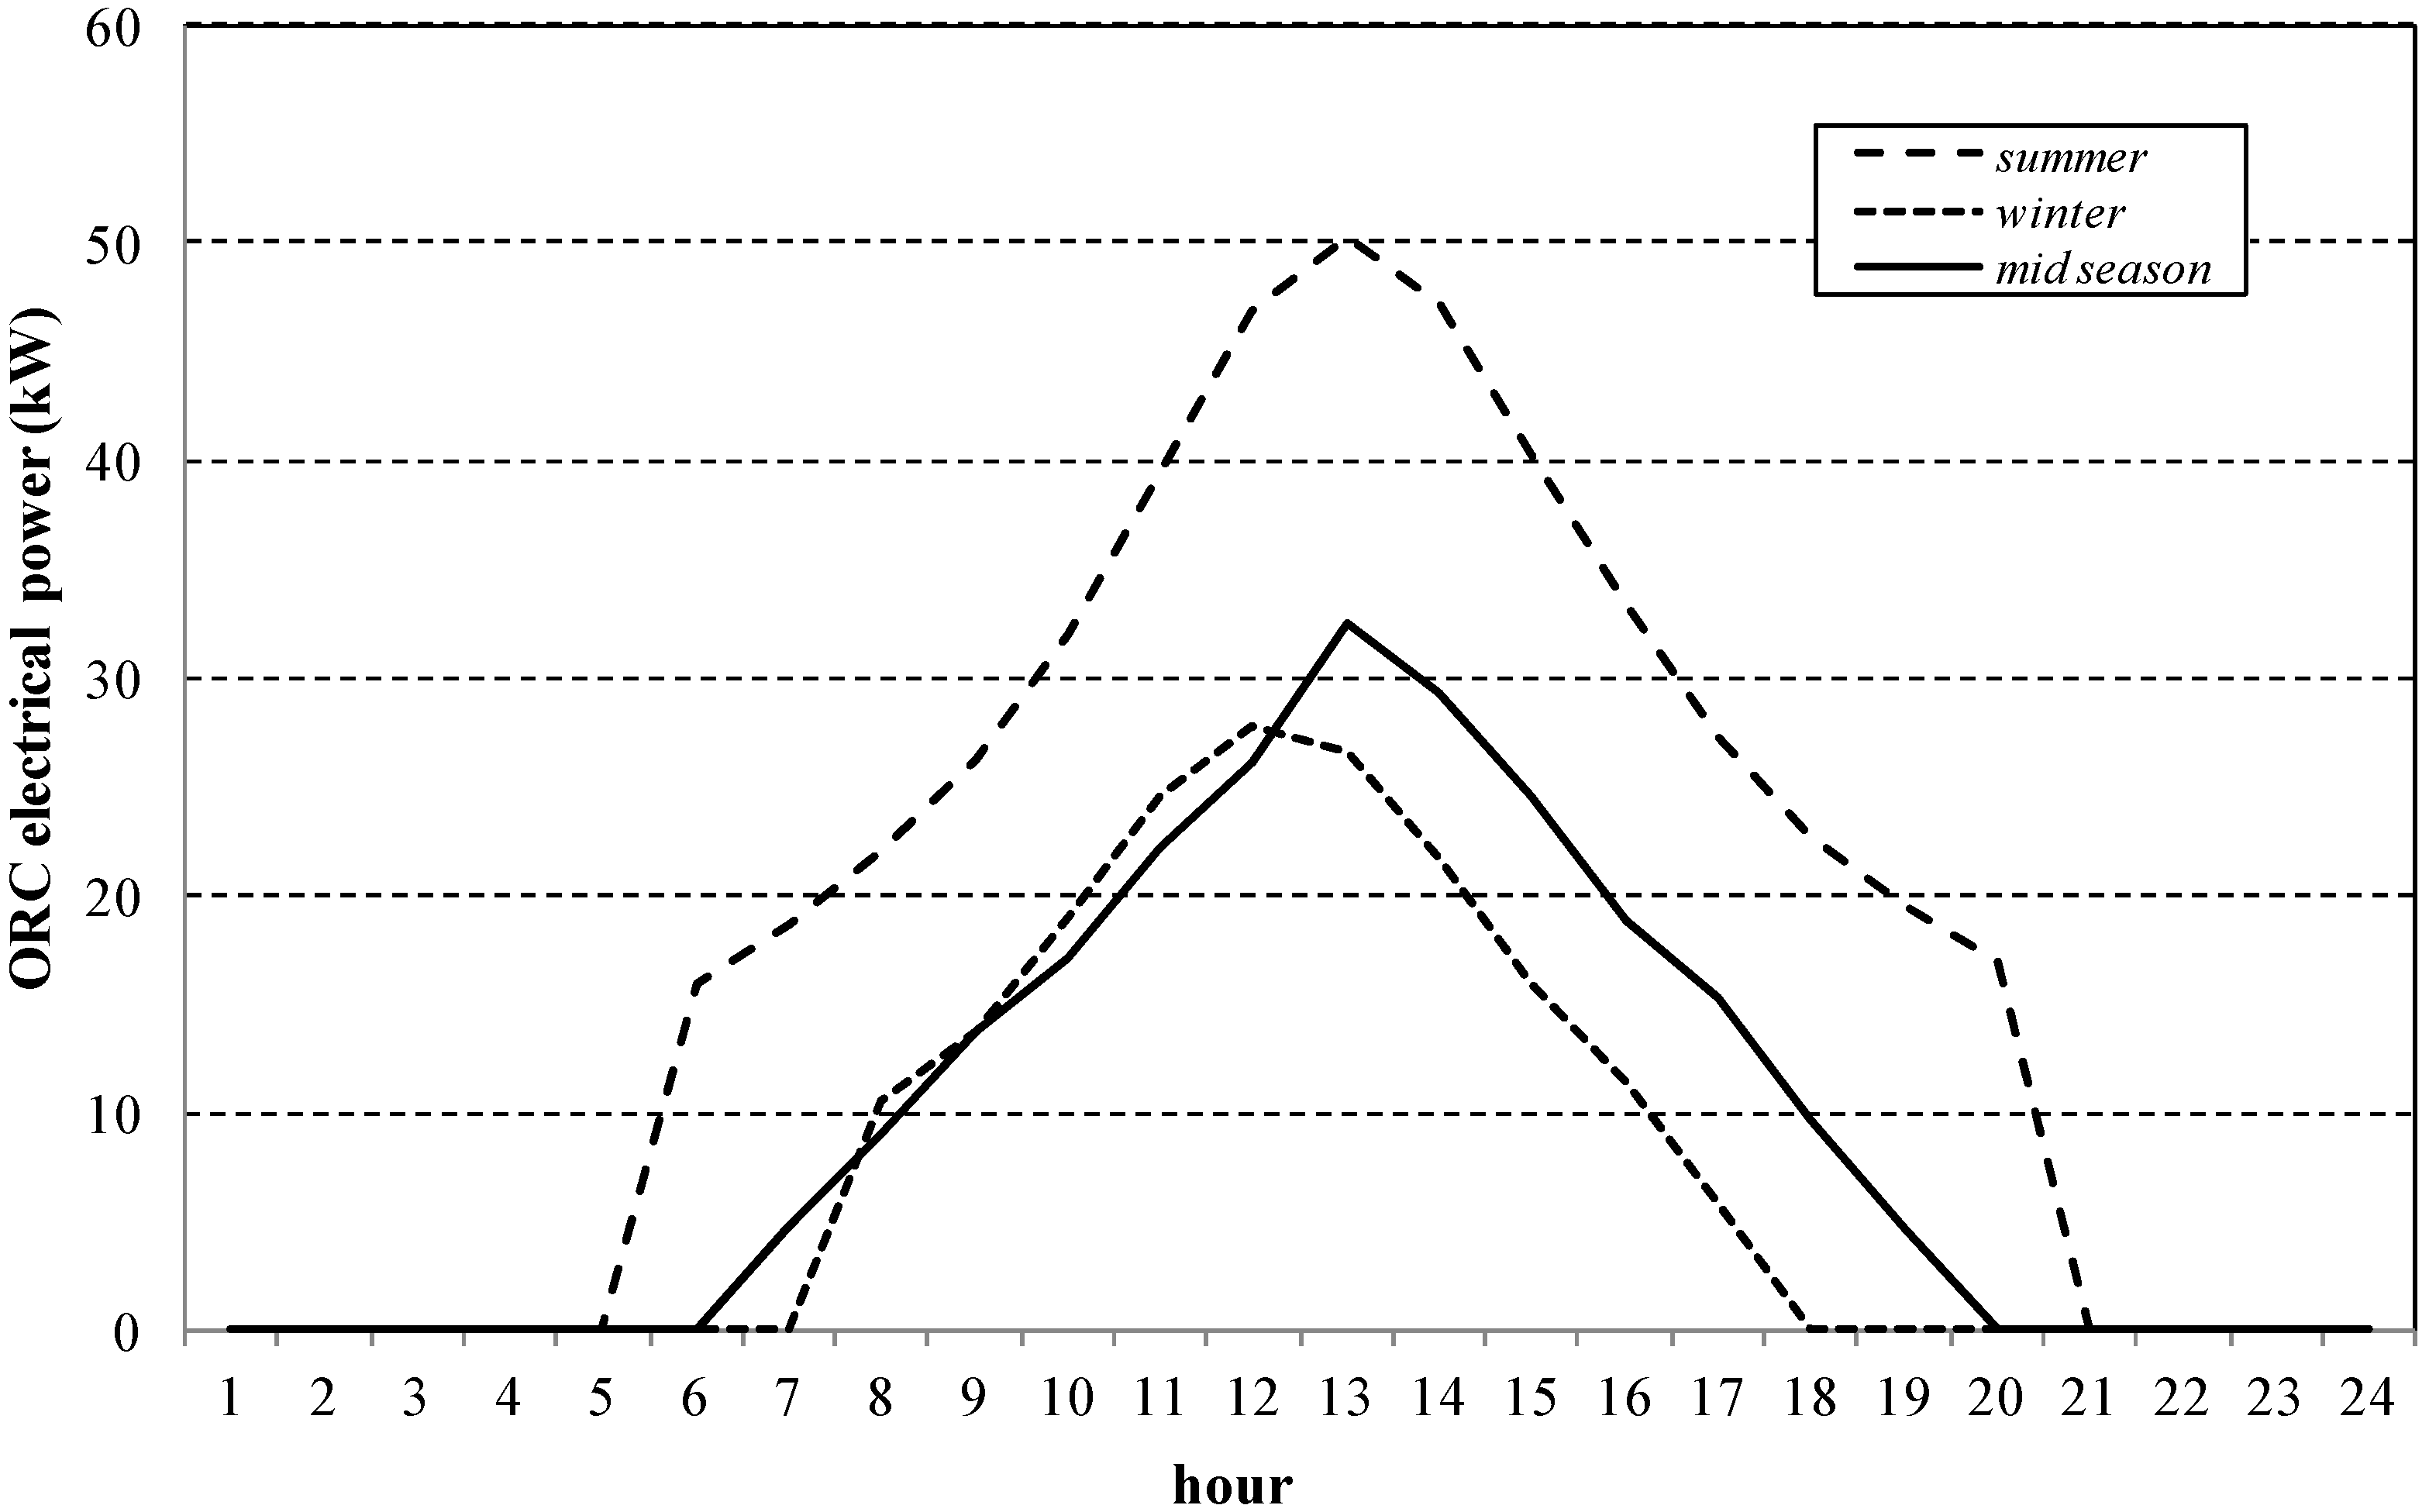
3.2. CPV/T-ORC Electrical and Thermal Model

The electric model of the CPV/T system depends above all on optics and the TJ solar cell. A reflective optic is used in a line-focus configuration. InGaP/InGaAs/Ge solar cells are adopted and their electrical behavior depends on the cell temperature (Tc) [28], model results, and manufacturer indications [29].
The electric performances of the CPV/T system depend on external and internal parameters. DNI is the main external variable defined by the ANN model described above. The internal parameters are cell temperature, concentration factor, and optical efficiency which influence the TJ cell and overall performances [30]. Once fixed, the temporal level (hourly, daily, monthly) of the DNI and the TJ cell electrical energy is calculated as:
E el ,   c =   DNI · A c · C · η opt · η c
where Ac is the cell area and optical efficiency (ηopt) is considered constant and equal to 0.85 [31]. The cell efficiency (ηc) depends on Tc and is equal to [10]:
η c = η r +   σ t · ( T c T r )
where σt is the temperature coefficient which represents the efficiency percentage reduction as a function of the temperature increase. Tr is the temperature of reference equal to 25 °C and ηr is the reference efficiency corresponding to the concentration value, according to the cell manufacturer indications. Therefore, if the CPV/T system is constituted by a variable number of cells subdivided in different modules, the CPV/T system electrical energy is determined as follows [1]:
E el ,   CPV / T = E el ,   c ·   n c · η mod   · η inv  
where ηinv is the inverter efficiency, ηmod is the module efficiency which until 100 cells is equal to 0.95, and nc is the cells number.
The thermal energy obtainable by a CPV/T system is linked to the heat recovery [32] from the TJ cells layer. Hence, the thermal power corresponds to the solar radiation not converted in the electric energy and is equal to [1]:
E th ,   CPV / T = [ ( 1 η el ,   CPV / T )   · DNI · A c · C · η opt ·   n c ]   E th ,   loss
where the CPV/T system electric efficiency considers the cell and module efficiencies:
η el ,   CPV / T = η c ·   η mod · ( 1 p par )
where ppar is a loss factor depending on the solar radiation and linked to parasitic power consumption for tracking motors and coolant pump. The thermal energy losses are considered to evaluate the real thermal potential of the CPV/T system. The convective and radiative losses are also evaluated as follows [1]:
E th   , loss = [ h ¯ c · ( T c T a ) + ε c · σ SB · ( T c   4 T a 4 ) ] · A c · n c
where εc is the cell emissivity considered equal to 0.85, σSB is the Stefan-Boltzmann constant, and   h ¯ c is the unitary convective conductance.
The thermal energy obtained by the CPV/T system represents the main input variable of the ORC system model. In fact, in applications where the electrical output is the main aim, it is possible to adopt solutions that allow the thermal energy recovered to be used in a CPV/T system for the production of additional electricity [33]. The global production of electricity depends mainly on the electrical performances of the CPV module and the optical. As said before, once evaluated the thermal and electrical performances of the CPV/T system, the thermal energy can be adopted for a further electrical energy production. As observed in Figure 2, the global energy balance on the ORC cycle is the following:
E th ,   CPVT = E el ,   ORC η ORC  
where the electrical energy production of the ORC cycle (Eel, ORC) depends on the overall ORC system efficiency (ηORC), generally defined by the manufacturer and whose value is about 10% [34].
Hence, the total electric energy production of the integrated CPV/T-ORC system is equal to:
E el ,   tot = E el ,   CPV / T + E el ,   ORC
Starting from this model, different analyses and simulations of the CPV/T-ORC system have been carried out in order to optimize it and to calculate the energy production; all this can determine an efficiency increase. In particular, fixing the value of the electrical energy necessary for the user, it is possible to size the CPV/T-ORC integrated system.

4. Results and Discussion

The CPV/T-ORC combined system described and modeled in the previous sections has been sized to match the electrical needs of a medium industrial user located in the South of Italy. The combined electrical production has been analyzed in order to show how the thermal energy, recovered from the TJ cells by an active cooling mechanism and sent to the ORC cycle, allows to match the electrical energy loads that the simple CPV system cannot satisfy. The CPV/T system, described in Section 2, has been sized to supply both electrical energy to the user and thermal energy to the ORC system. The cooling fluid [35], which removes heat from the TJ solar cell, is collected in a delivery manifold and then sent to the heat generator of the ORC system. Since the ORC cycle adopts a low boiling fluid, the temperatures reached in the CPV/T system are sufficient to feed the cycle. Hence, obtaining an average temperature of about 70 °C [36] for the cooling fluid of the CPV/T system, it is possible to achieve a double electrical output from the solar source. Starting from the user needs, the CPV/T-ORC system described has been sized and different simulations have been analyzed. Once evaluated the DNI by means of the ANN, three input condition scenarios have been evaluated (summer, winter, and middle season) in order to evaluate if the system can satisfy the energy loads of the industrial user considered in this analysis. The ANN presented in this paper allows determining the solar potential even in colder areas, but it is known that the CPV/T systems work better where the climate is less severe [1].

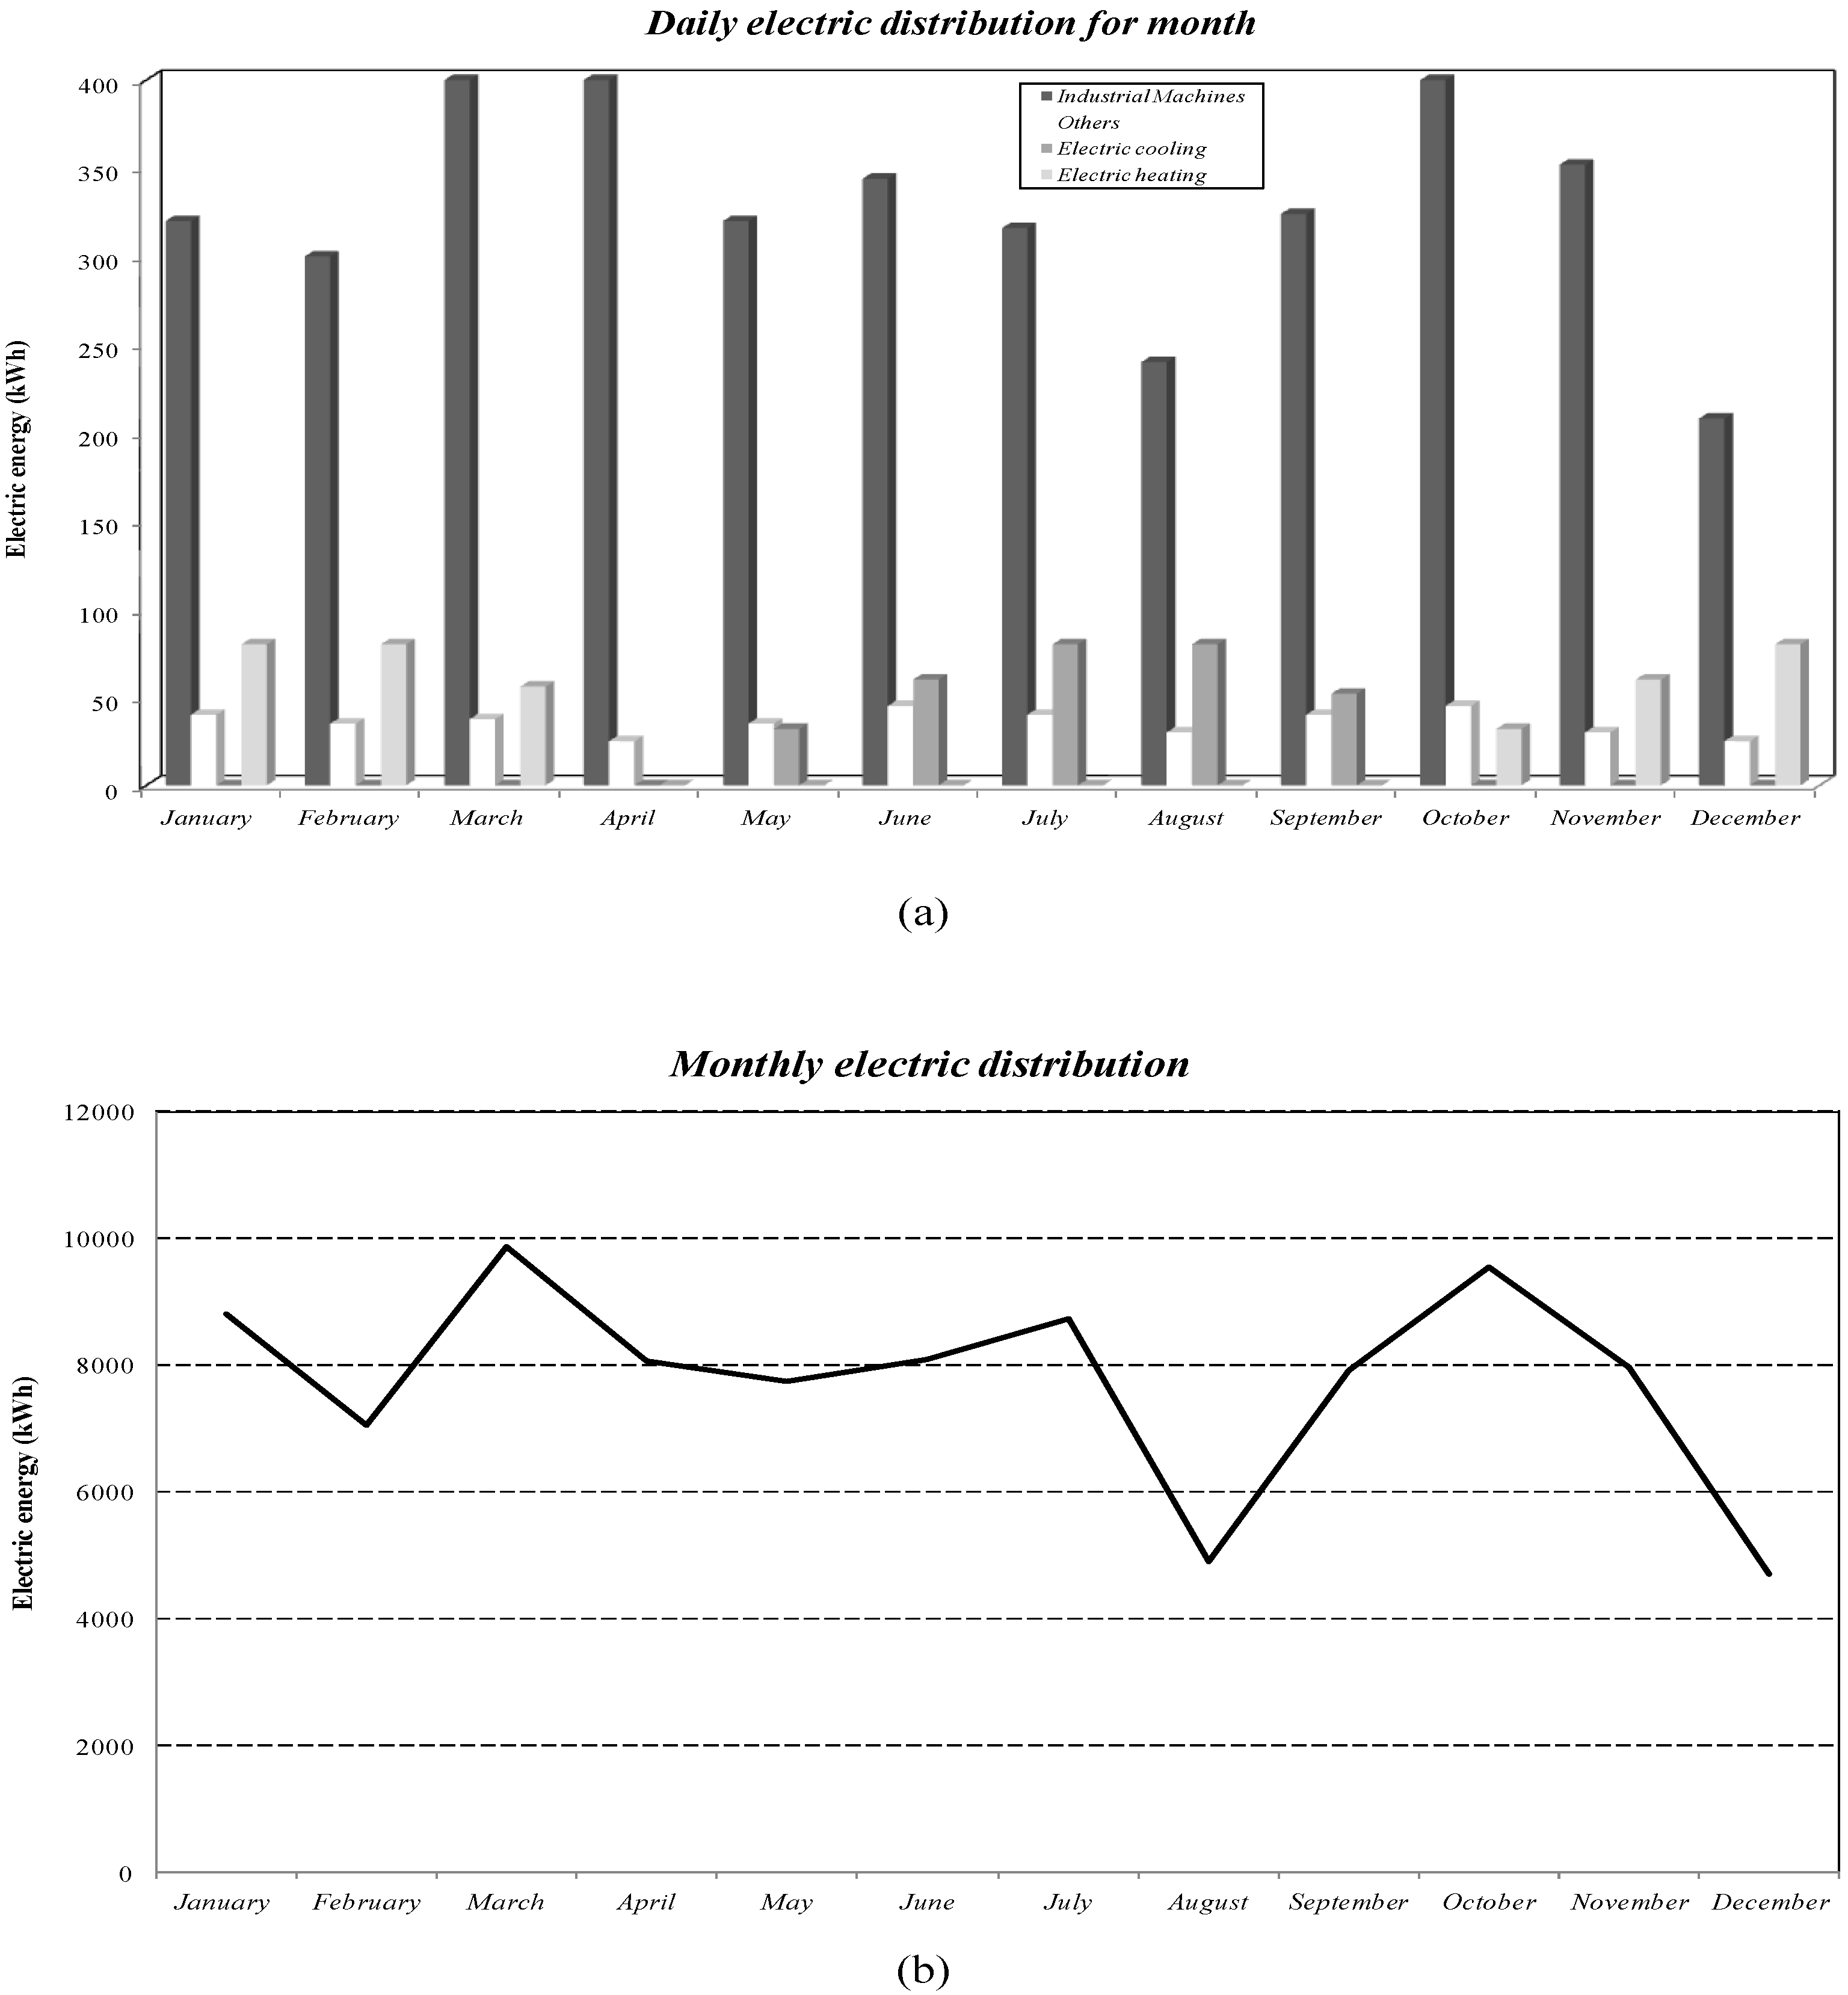
4.1. Energy Loads of the Industrial User

The user considered is represented by a medium-sized industry located in the South of Italy. This typology of user presents a high electric energy consumption due principally to the industrial machines. The energy demands refer to a manufacturing industry of Salerno. The loads analysis takes into account the seasonality of the energy requirements subdivided in electric energy for industrial machines, other loads, electric heating or cooling [37]. In particular, the peak power considered for the industrial machines is about 42 kW, while other electric loads and heating or cooling, as a function of the season, require a total peak power of 15 kW.
The daily loads have been analyzed, considering 10 h of work for industrial machines and offices. The electrical heating, with different load percentages, is considered for about six months from October to March. In particular, the electric heat pumps, which present a total power of 10 kW, are adopted only for three months at the full load. On the contrary, the electric cooling is principally used in the summer period and its use is always at full load except for the month of September. Moreover, as the cooling is just considered for the offices, the periods of closure affect the loads evaluation. The user loads have been reported in Figure 5. Figure 5a shows the daily electrical energy for each month, subdivided for kind of need. The cumulative monthly electric energy needs are represented in Figure 5b. These values have allowed sizing the CPV/T system, as described in Section 3. Both figures show that the electric needs of the industrial machines represent the main load to match. Furthermore, they show that the seasonality of the considered user is an important factor. It can be noted that months as August and December present low consumptions due to the industrial machines stops. As reported in Figure 5a, the average electric energy need, which in the other months is about 300–350 kWh/day, is reduced to 240 kWh/day in August and 210 kWh/day in December. At the same time, the monthly cumulative electric energy consumptions vary from an average value of 9000 to about 4000 kWh/month between August and December. Hence, this case study constitutes a good example for the use of a CPV/T-ORC system, because the electrical energy is supplied by two systems.

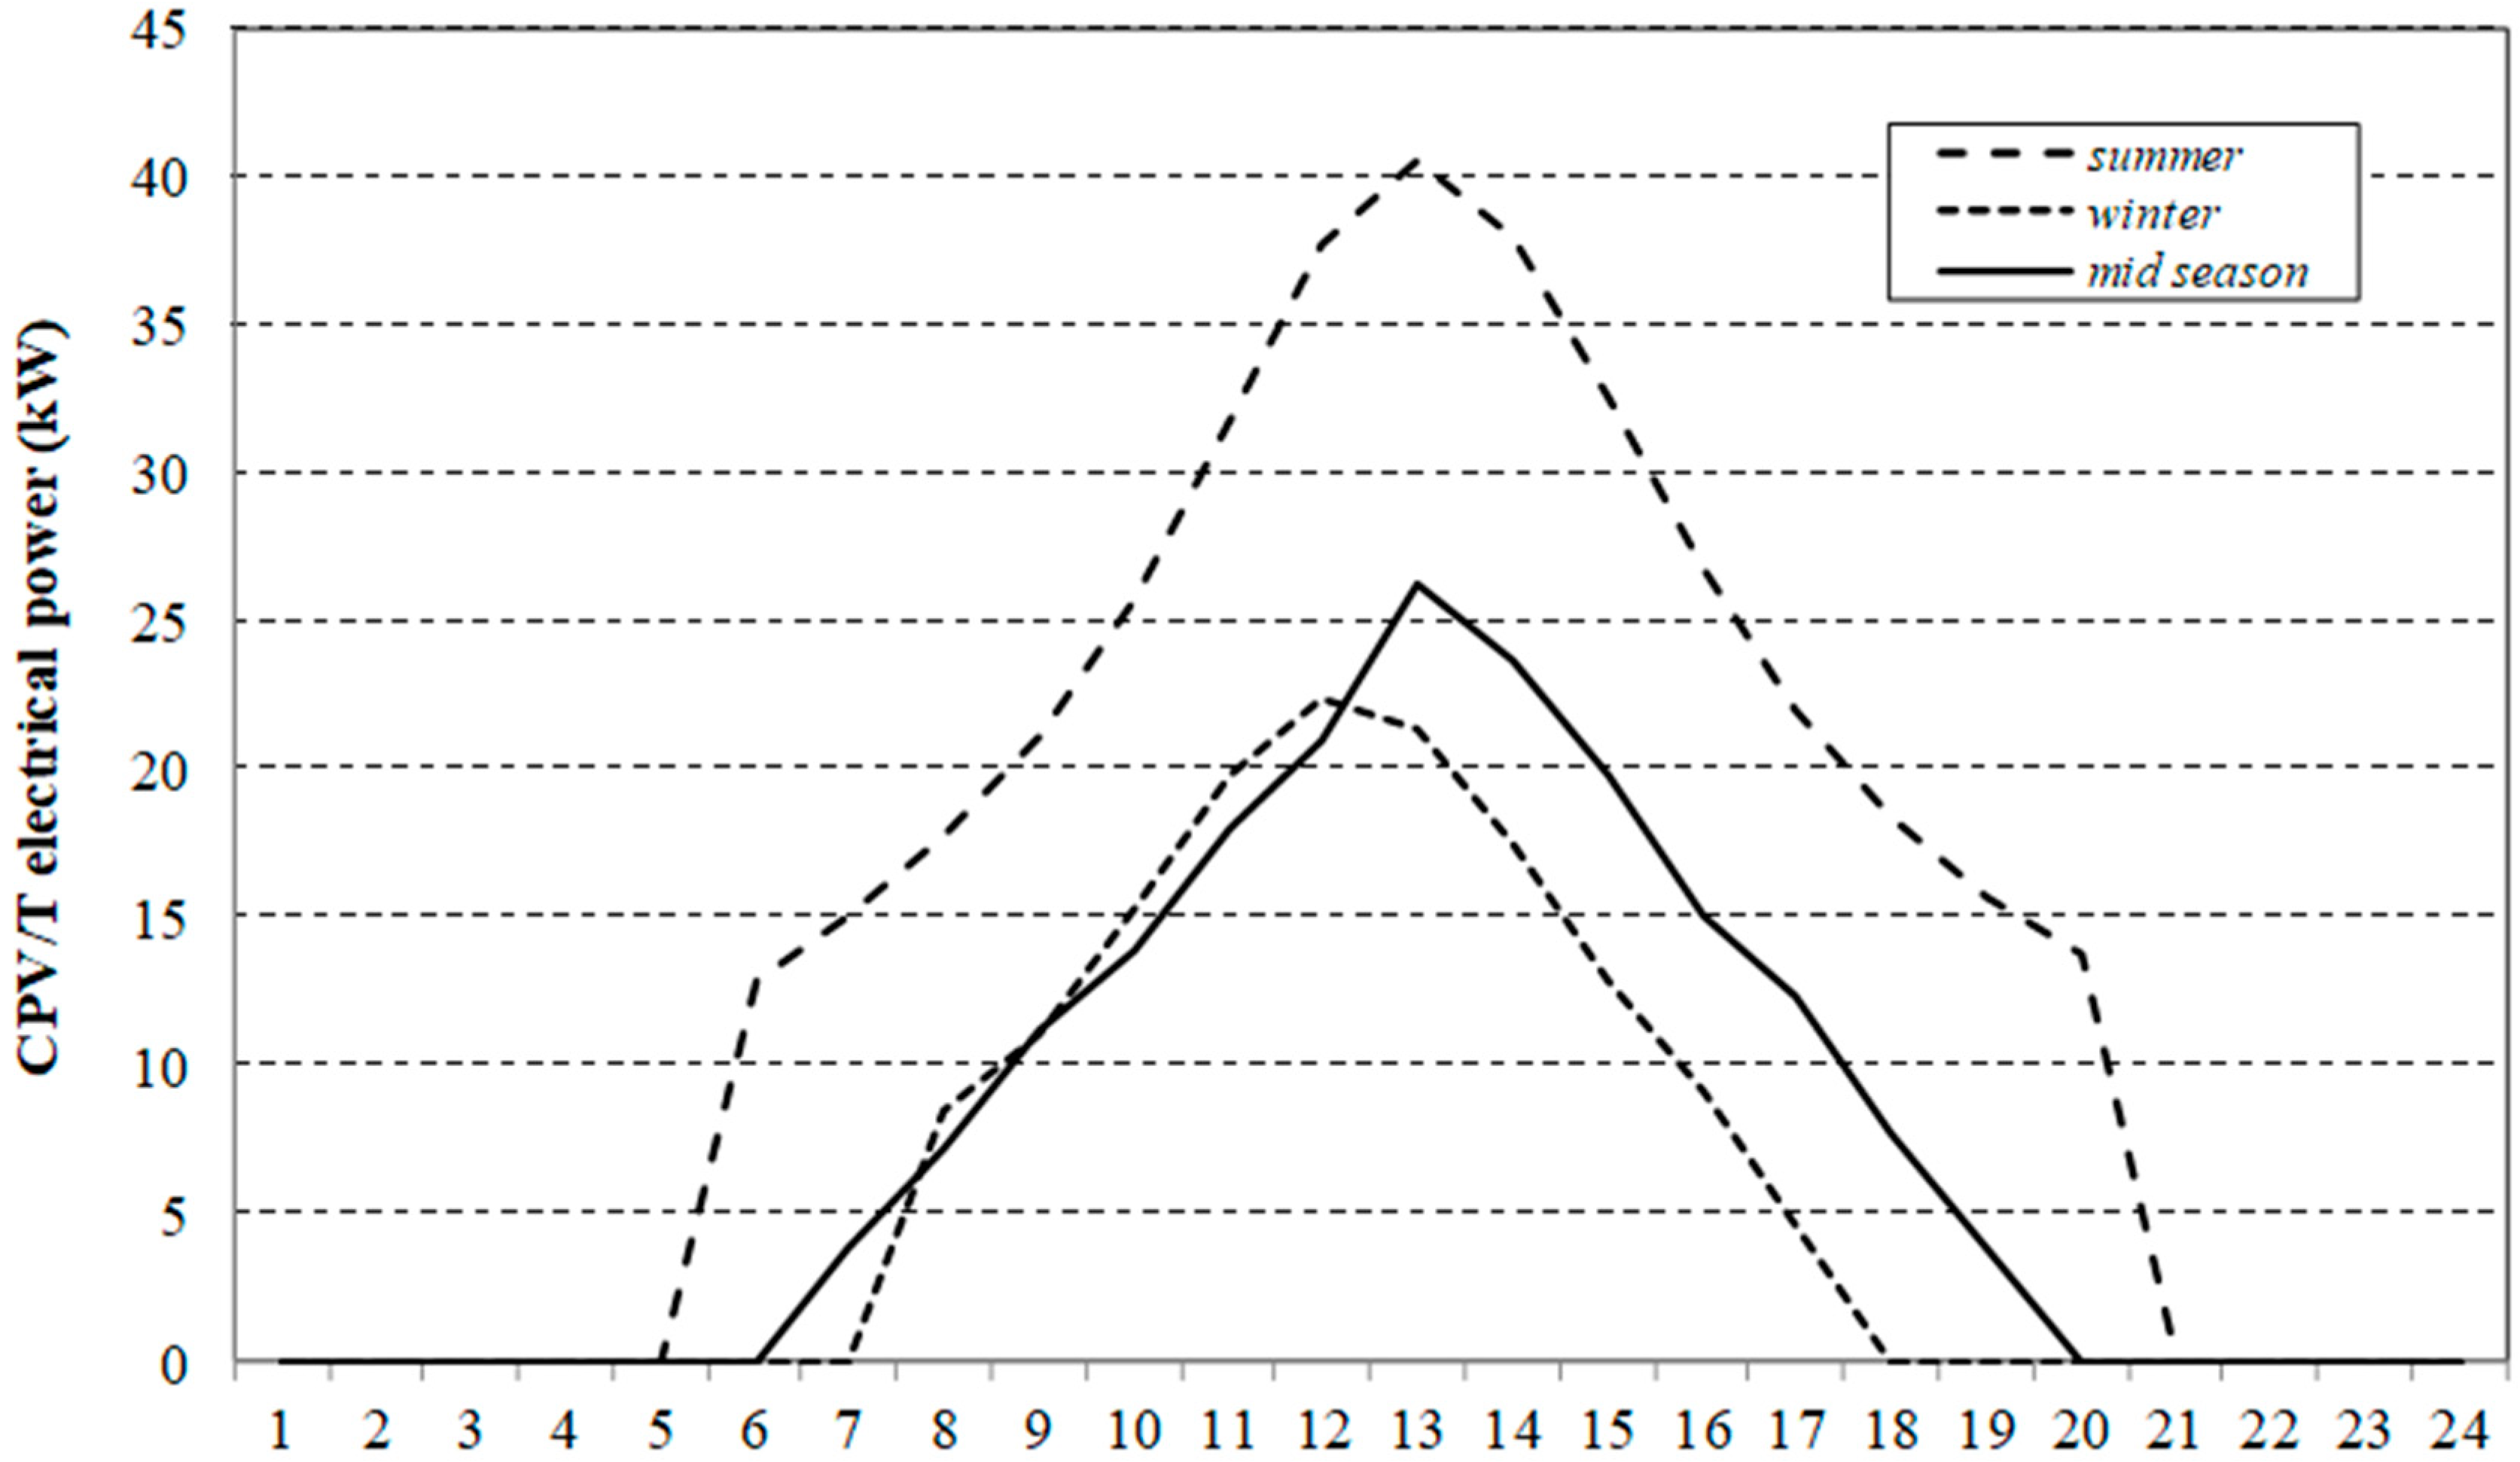
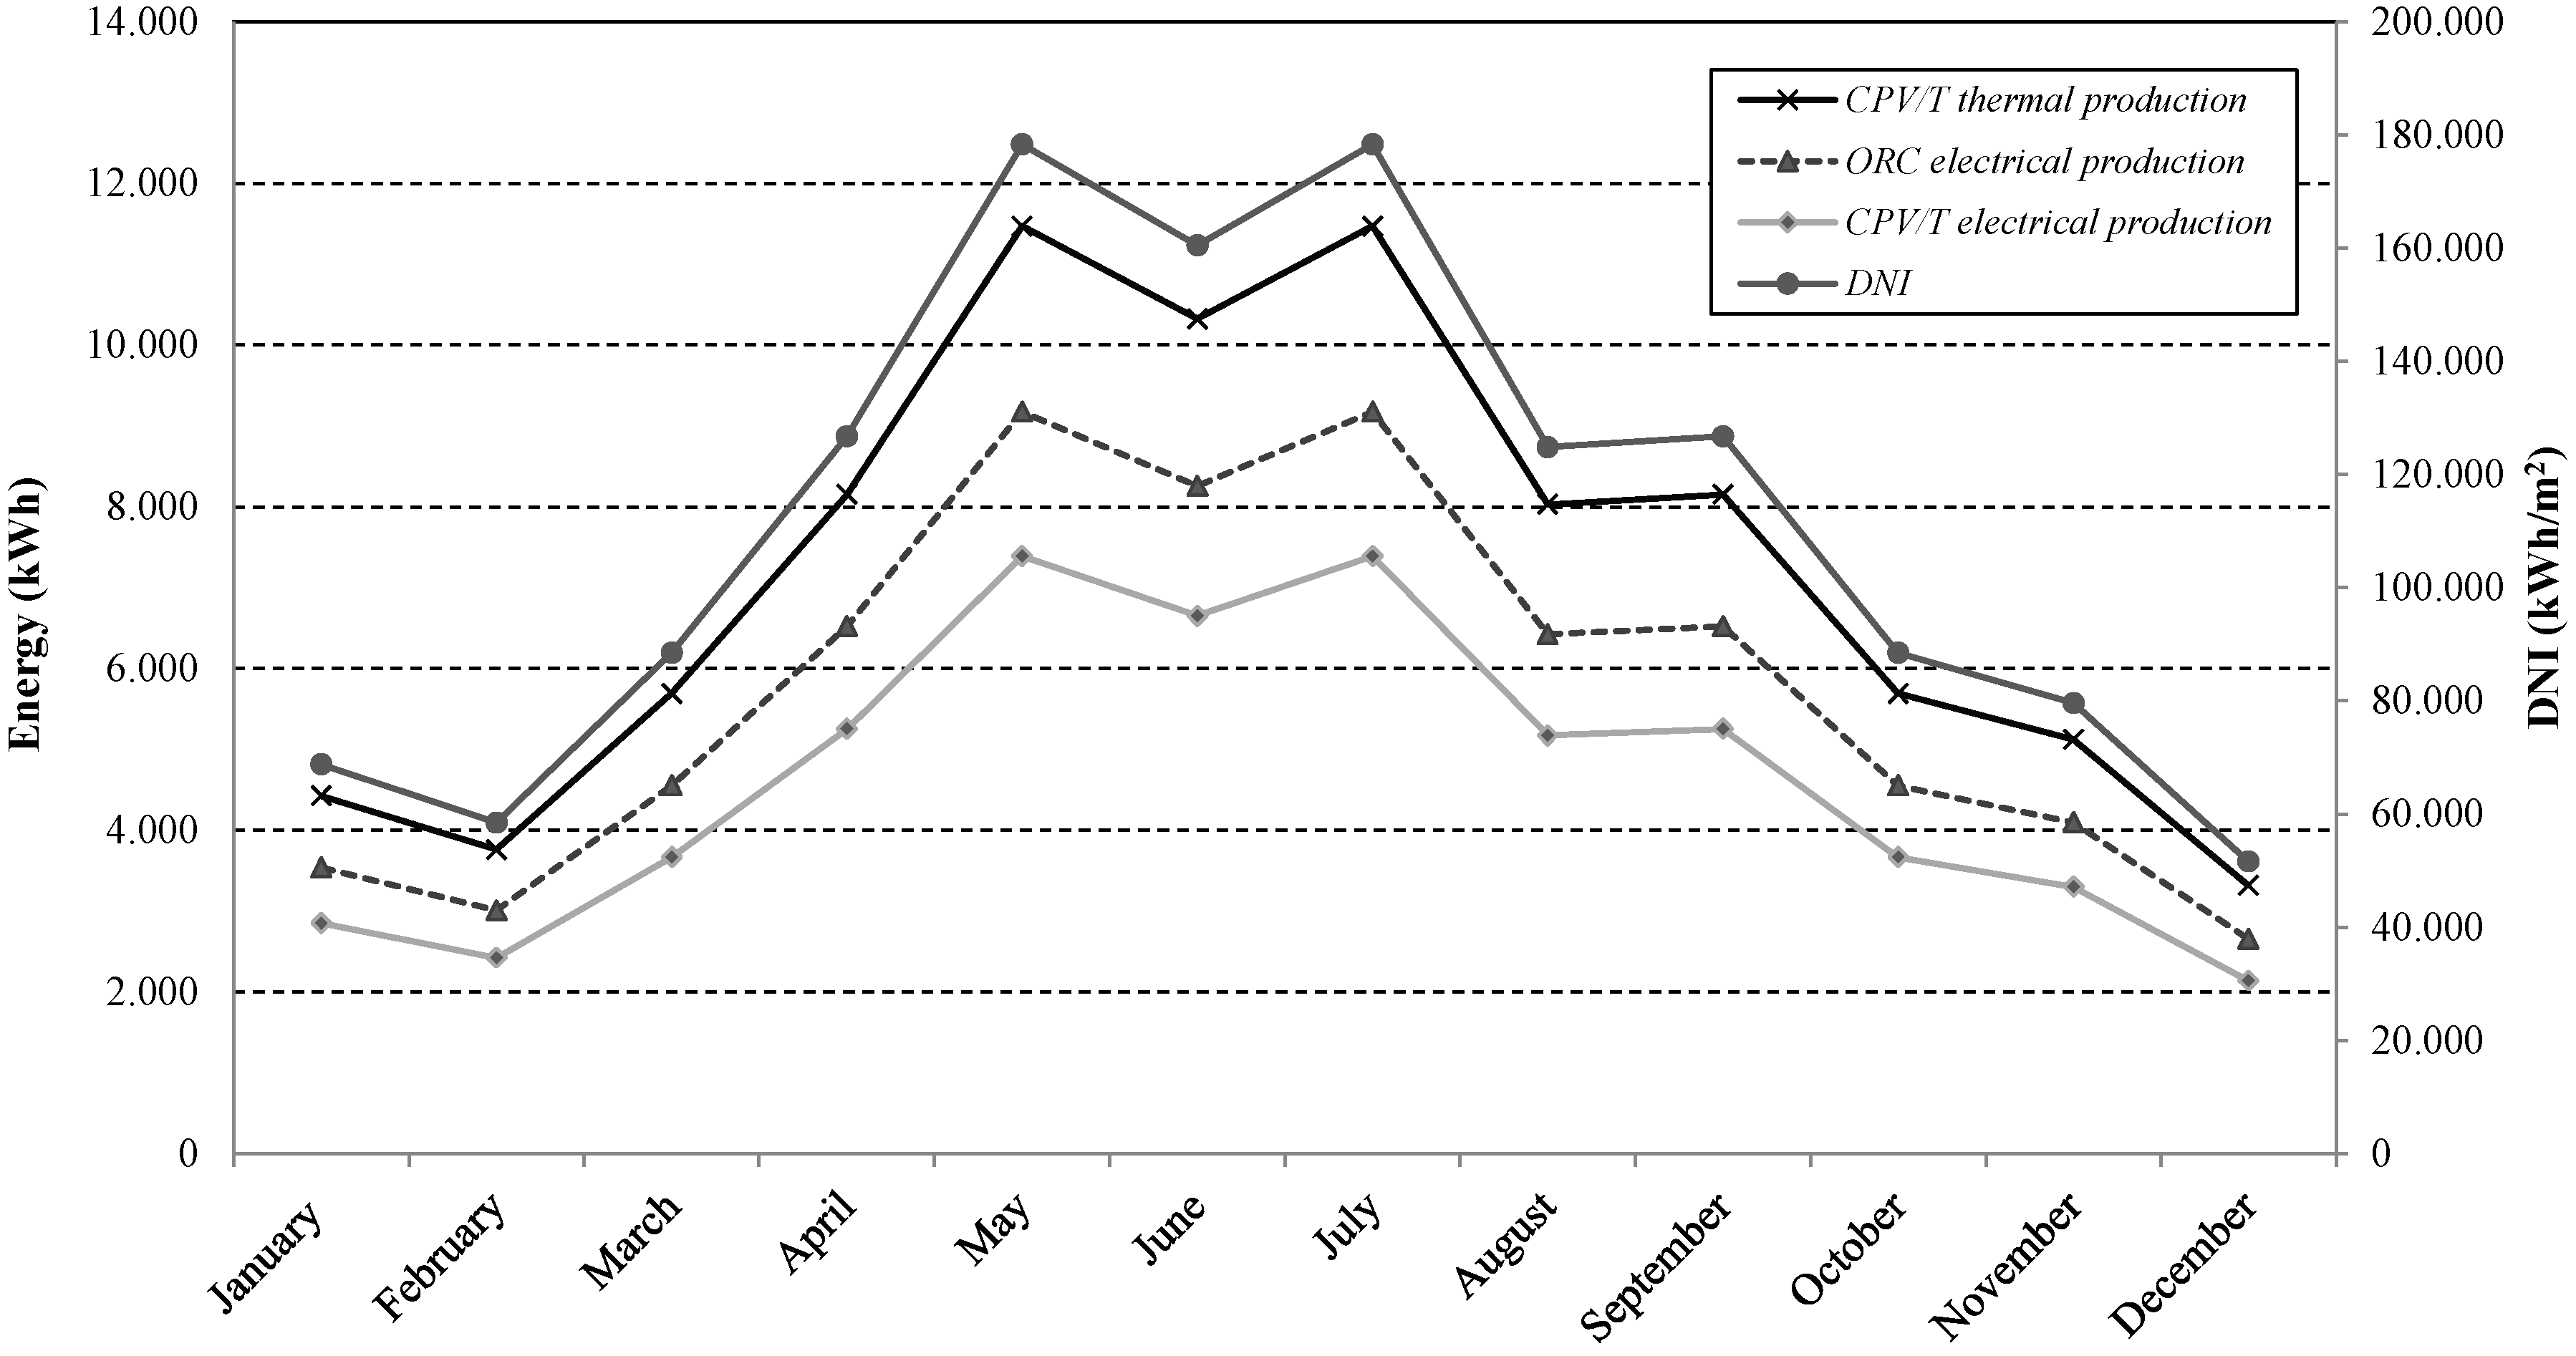
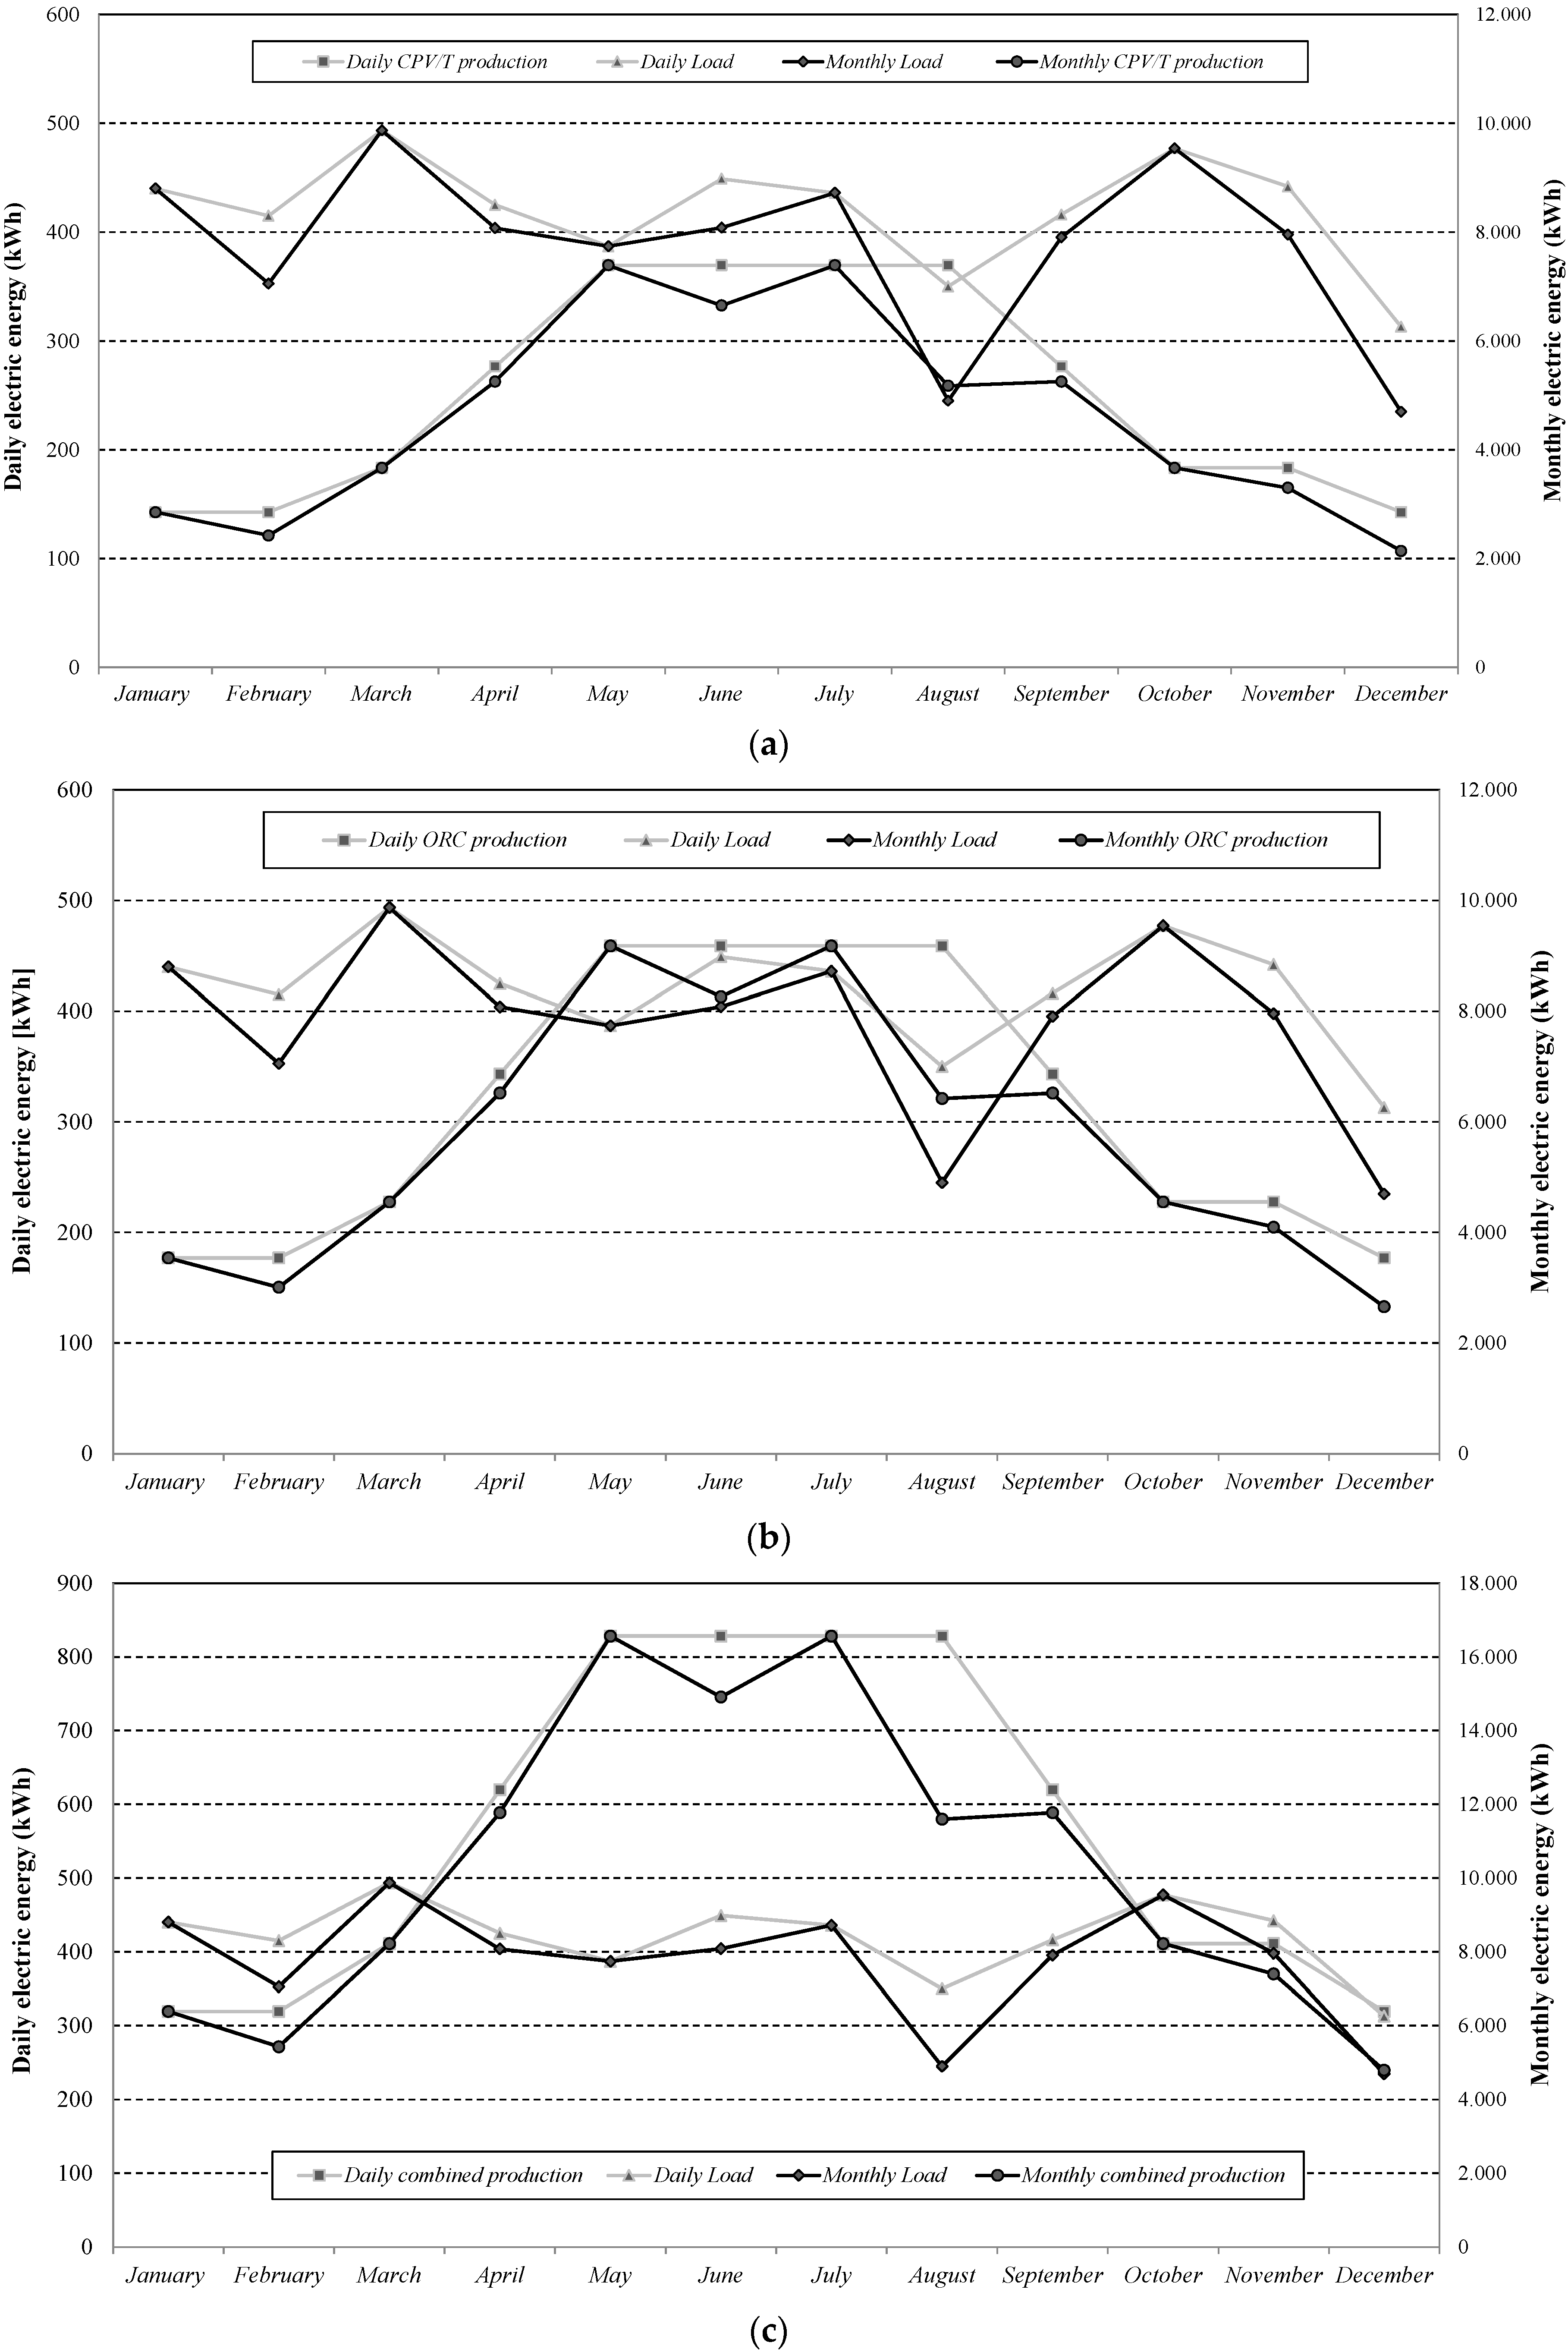
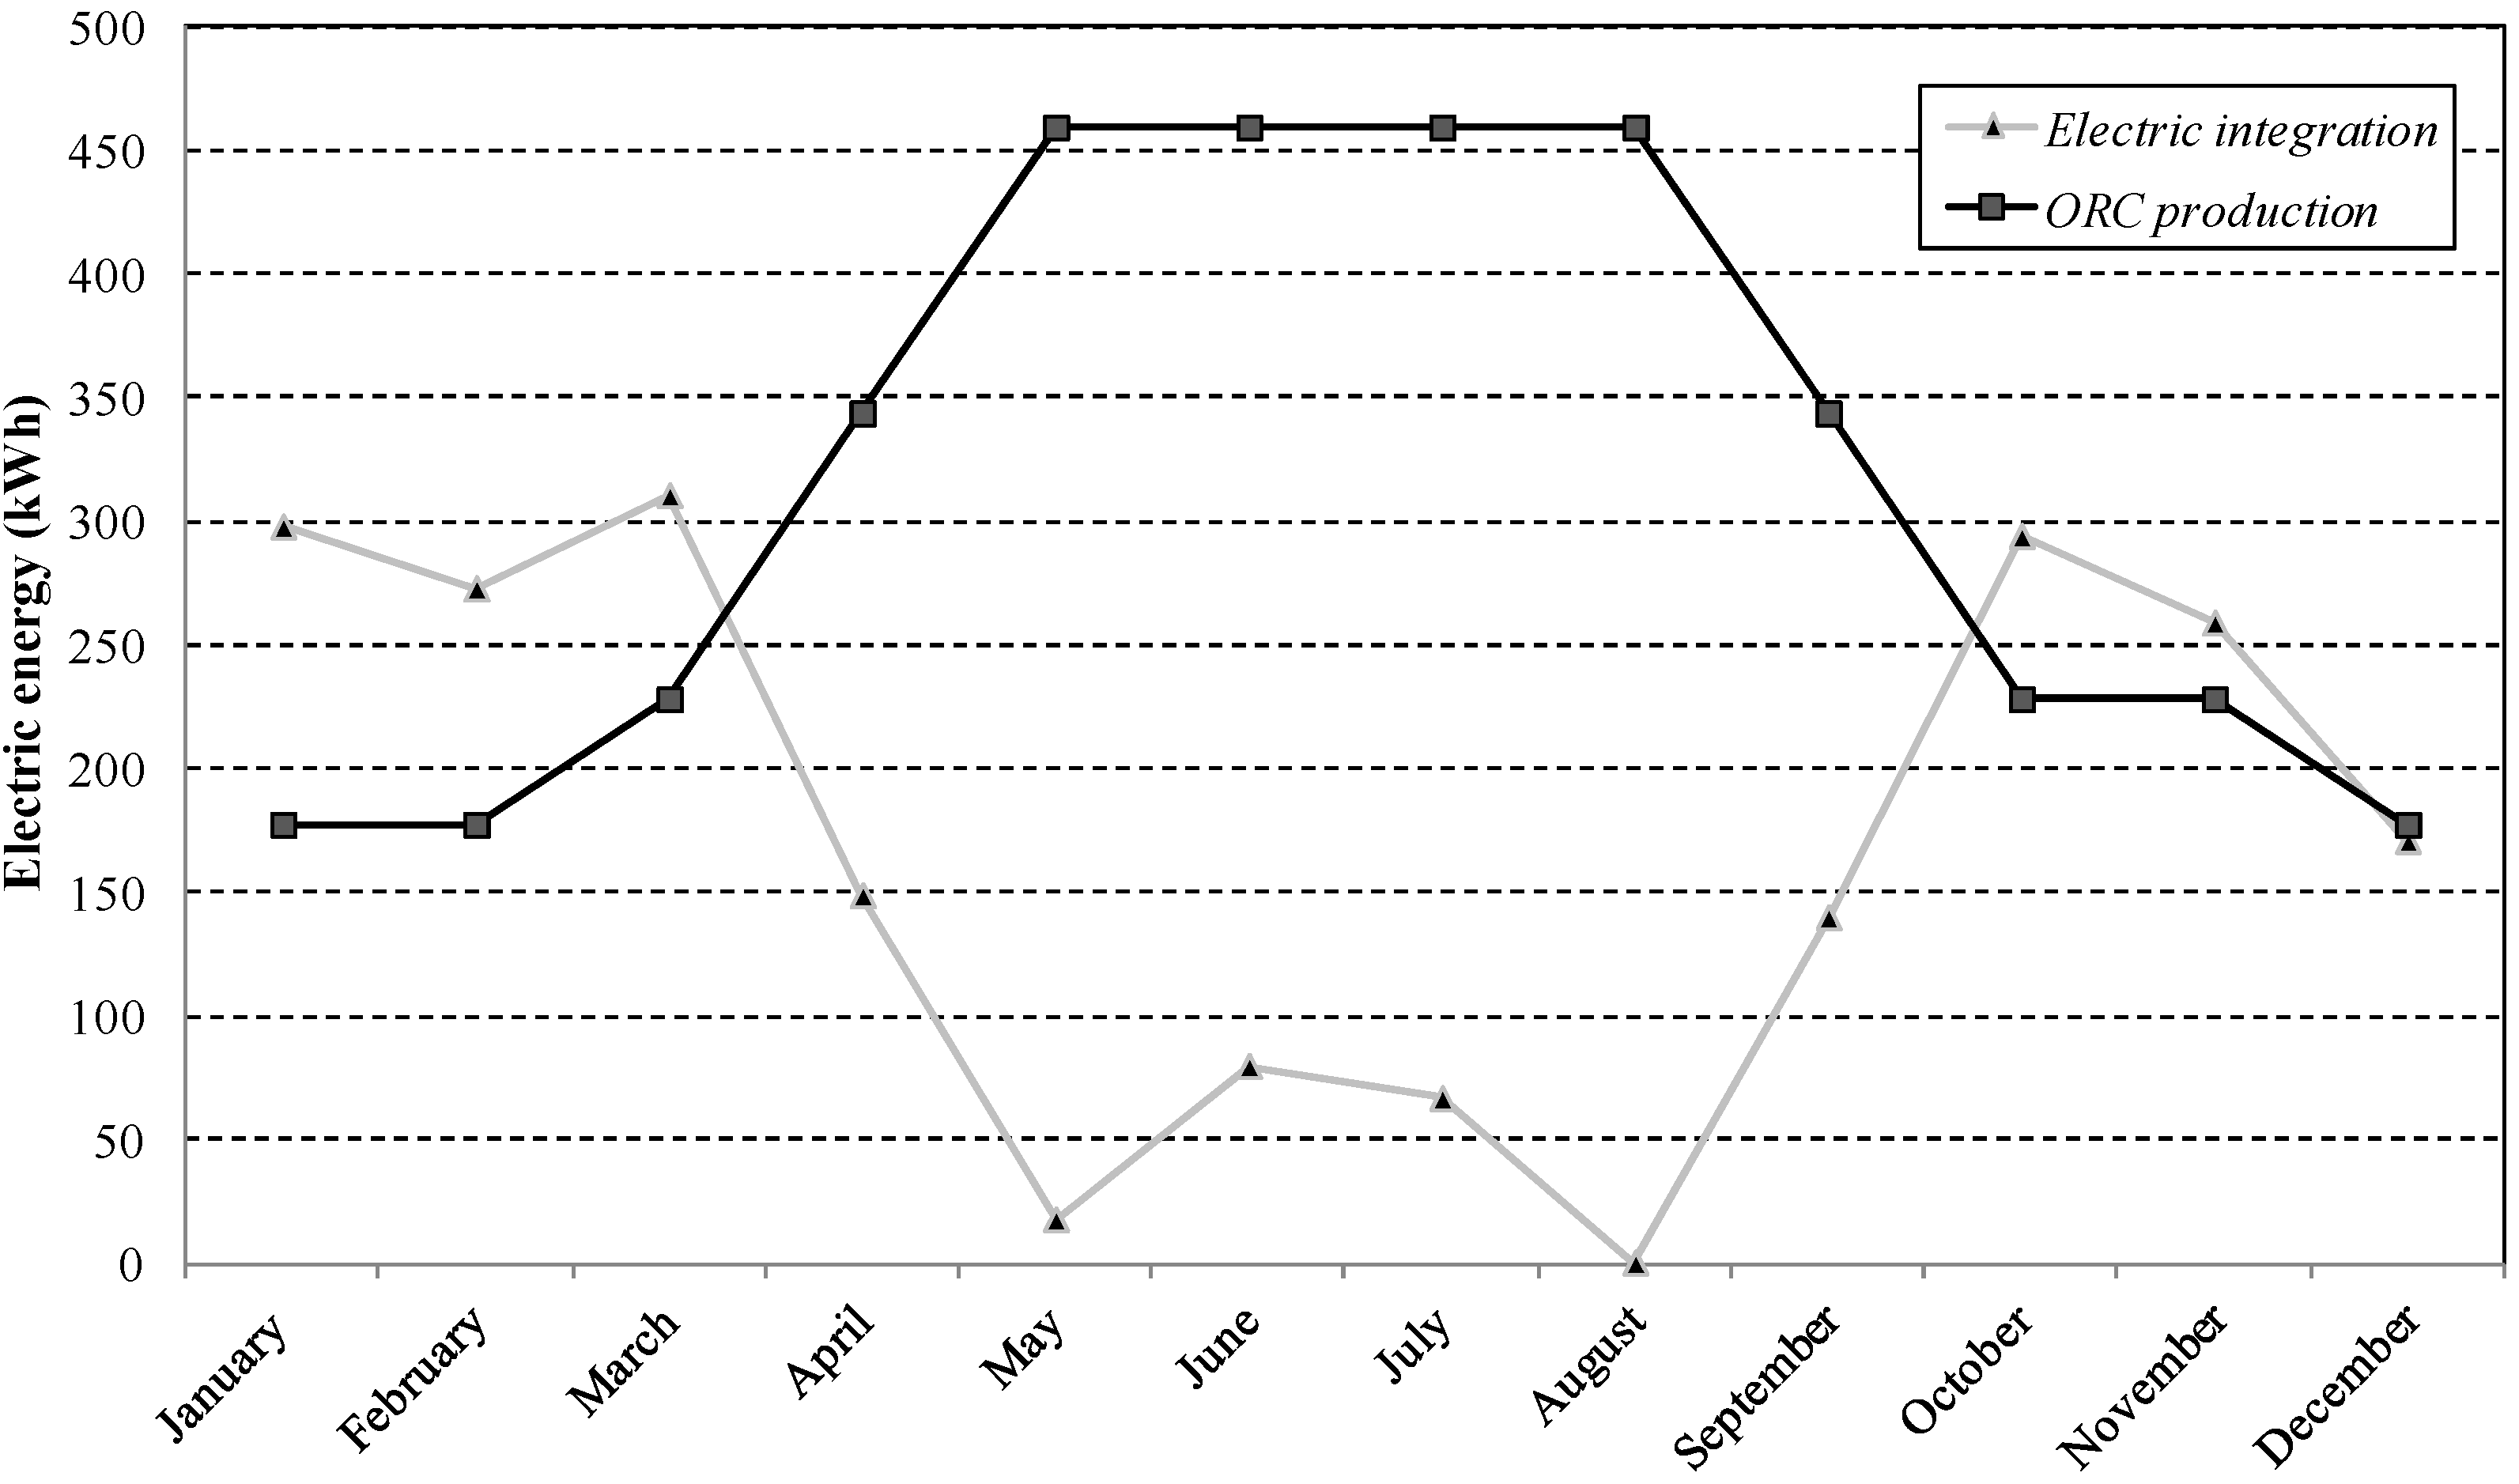
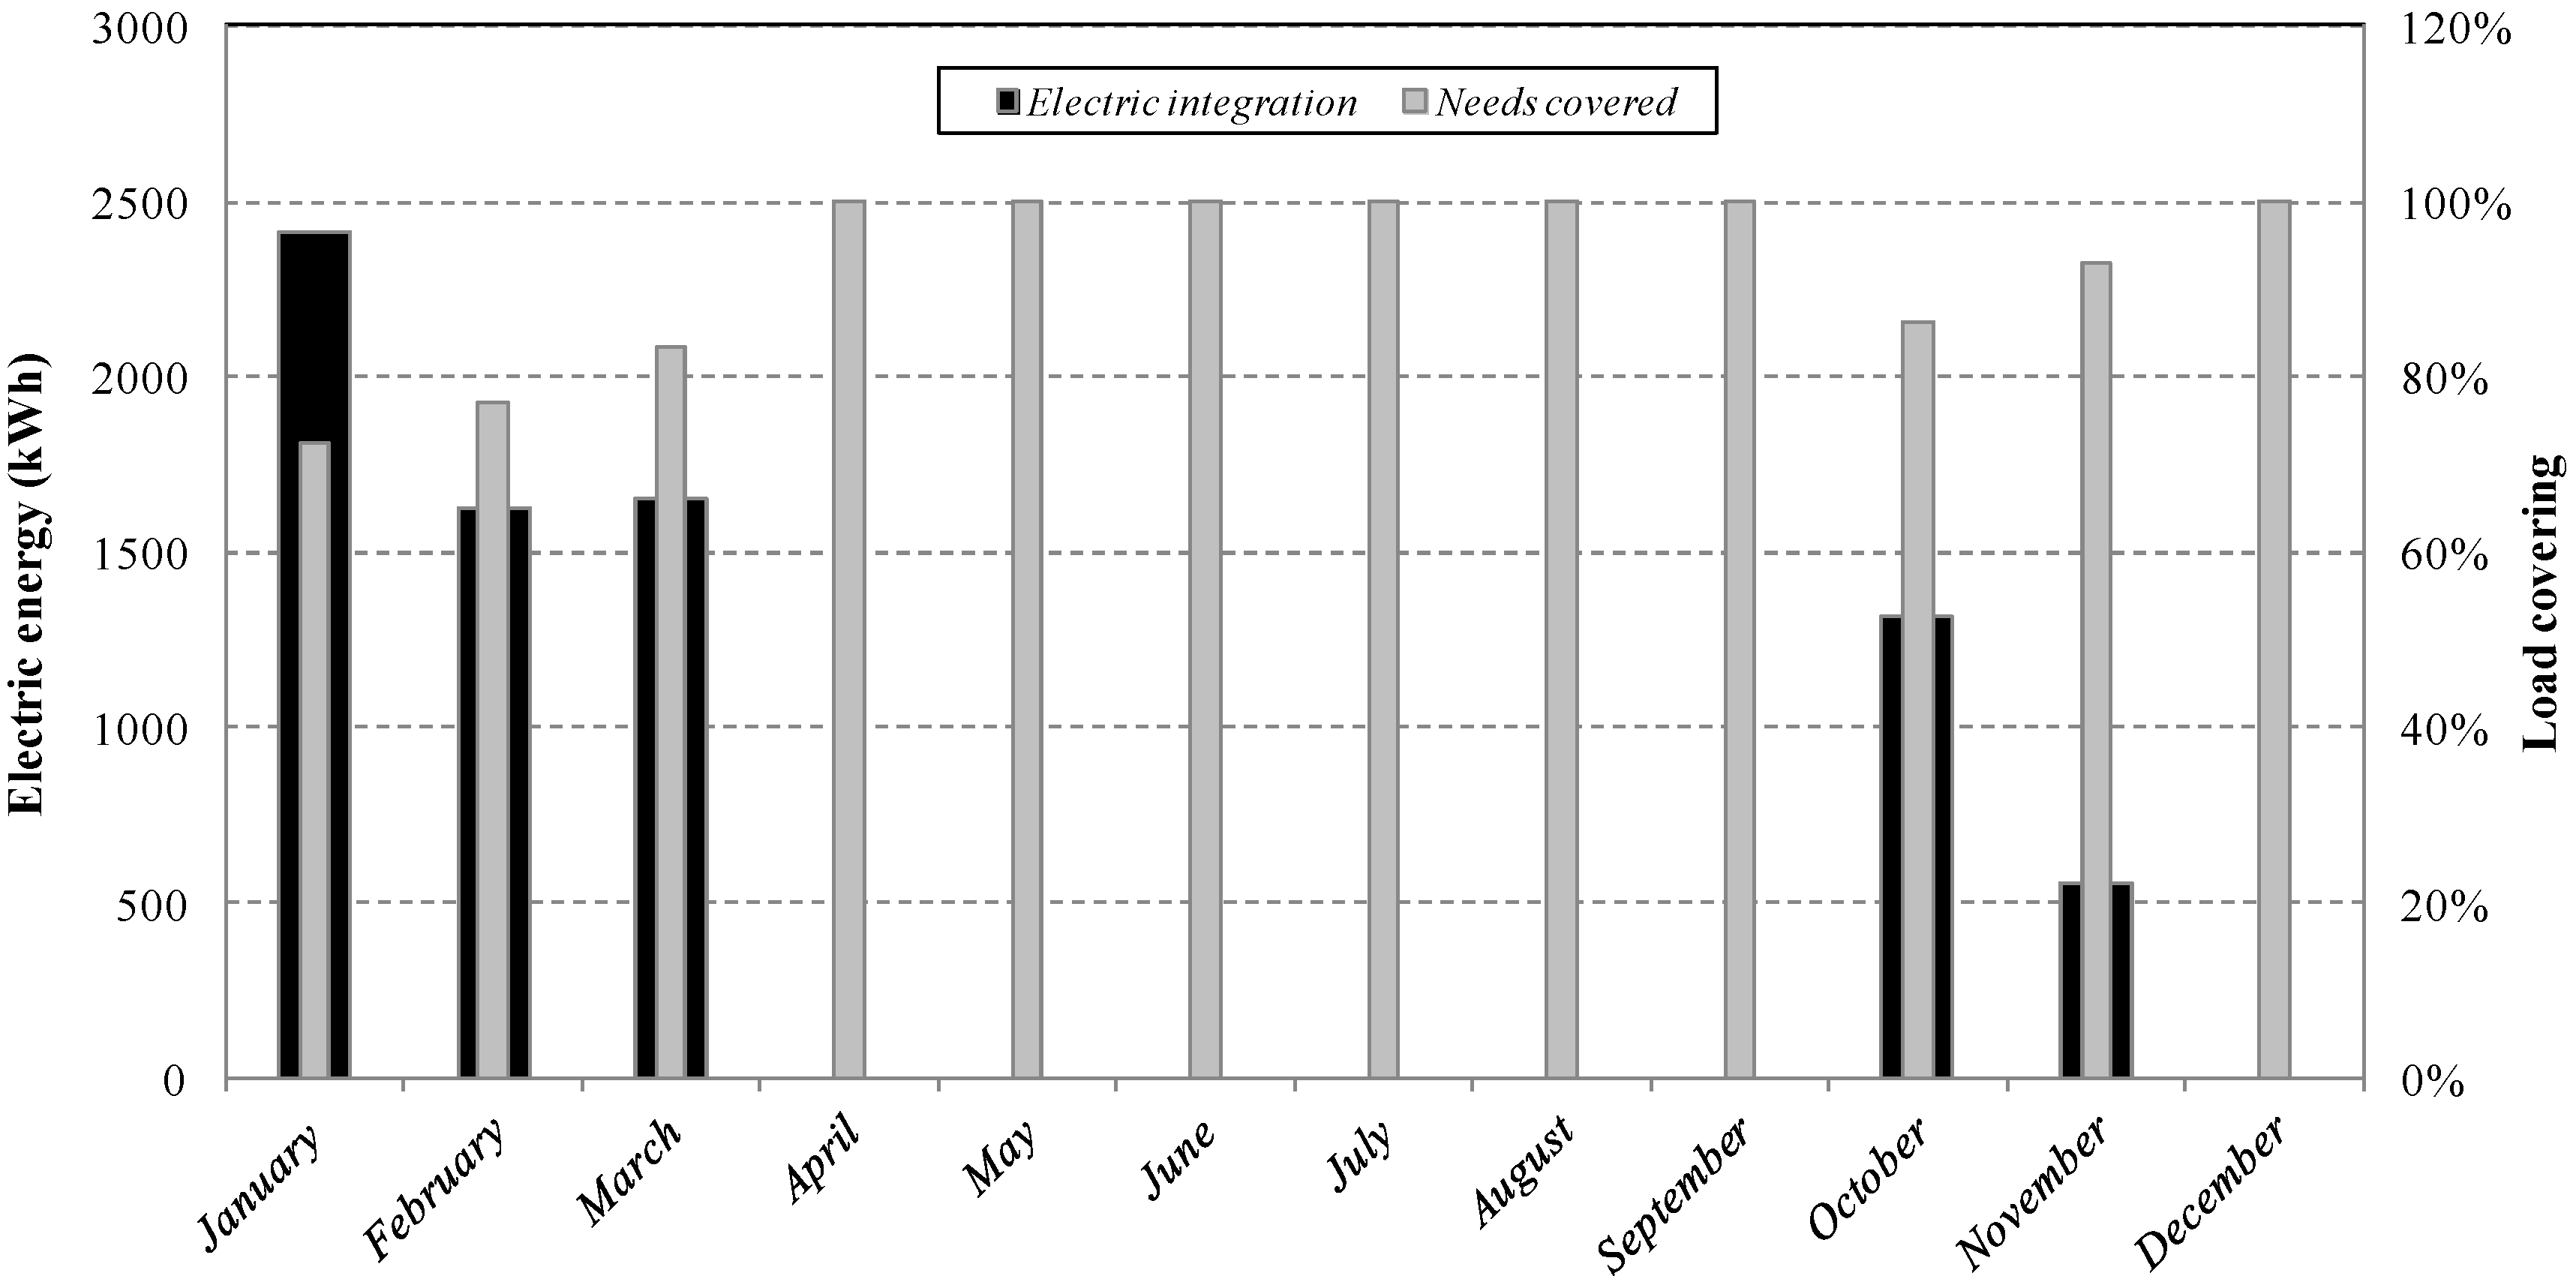
4.2. Energy Production Analysis for Different Scenarios

The high electrical consumption of the considered medium-sized industry represents an ideal application for the system ORC-CPV/T presented in this paper. For this reason, both loads and energy production have been considered in three scenarios (summer, winter, and middle season), in order to evaluate the loads cover percentage. The main purpose is to underline how the thermal production of the CPV/T system allows another energy contribution that increases the electrical energy production when required. The system adopts the thermal energy production obtained by recovering heat from the TJ cells, in order to increase the electrical energy production. This is reflected on the covering percentage of the electrical energy needs, which is greater than considering only the CPV system. Hence, the main aim of this energy analysis is to evidence that the CPV/T and ORC systems coupling is a right choice for a high electric consumption user as the one considered.
The energy analysis conducted starts from the CPV/T system operation. As described in Section 3, the average electrical energy load has been considered as a starting value for the CPV/T system sizing. An average monthly consumption value of 7500 kWh/month, has been considered for the sizing. Starting from this value and considering a concentration factor of 100, the number of necessary TJ cells is 8000. Hence, with the selected size and considering a line-focus configuration, 16 modules of 500 cells have been adopted. Once defined, the CPV/T system size, the first evaluation is referred to its electrical and thermal production. As explained in Section 3, the electric and thermal performances of a solar system, which exploits only the direct radiation, are affected by the amount of the DNI that reaches the TJ cells. In order to increase the quality of the energy analysis, an ANN model has been developed to simulate the DNI input. Although the sizing has been obtained exploiting a mean value of electrical energy load, the simulations take into account three scenarios of production (summer, winter, and middle season). This choice allows demonstrating the specific performances of the system considering also the weather conditions impact. Referring to a CPV/T system with 16 modules, in Figure 6 the electric energy production is shown referring to the three scenarios.
In particular, as a function of DNI duration and intensity, the maximum hourly electrical production in a summer day is about 40 kWh at 1:00 p.m.; the energy production in a summer day covers a wider time range. In the same conditions, a winter day presents an hourly electrical energy of about 23 kWh. On the contrary, the thermal energy production of the CPV/T system, is reported in Figure 7. The maximum value of producibility varies between 35 kWh in winter and 41 kWh in the middle season, up to 63 kWh in the summer period.
Once evaluated, the CPV/T system operating as a stand-alone system, the coupling with the ORC cycle has to be investigated. As observed in Section 3, the thermal energy obtained by the CPV/T system allows overheating the fluid in the ORC cycle and obtaining another contribution to the electrical energy production. Hence, the ORC cycle production is strictly linked to thermal energy production of the CPV/T system. Starting from the thermal energy production reported in Figure 7, the ORC system electrical production is presented in Figure 8 for the three scenarios considered. The daily electrical energy production of the ORC system reaches its maximum value at 12:00 a.m. in the winter condition and at 1:00 p.m. in the summer and middle season period, following the thermal energy production trends. The maximum value in summer is about 50 kWh at 1:00 p.m., while in the middle season is about 33 kWh.
The energy analysis in the different scenarios allows showing the CPV/T-ORC system potential in order to match the electrical energy needs of the presented industrial user. The analysis of the three scenarios shows that even in the winter period the system can operate and cover part of the energy needs. A more refined analysis has been conducted monthly in order to show the system energy production. Hence, starting from the monthly DNI, the electrical and thermal production of the CPV/T and the electrical production of the ORC system, have been evaluated. In Figure 9, the monthly energy production of each part of the system is represented together with the DNI monthly value. It can be noted that the ORC electrical production is always greater than the CPV/T electrical production. In particular, the ORC cycle supplies about 19% more of electric energy compared to the CPV/T system. The reason is linked to the double conversion, electric, and thermal, which the CPV/T system realizes.
The combined electrical production of the CPV/T-ORC system represents a strategic choice to match the industrial energy needs as previously reported. As shown in Figure 10a,b, the use of a single system cannot satisfy the energy needs defined, unless the systems are oversized. In fact, both the electrical energy production of the CPV/T system (Figure 10a) and of the ORC cycle (Figure 10b), do not cover the energy requirements. In particular, both on a daily and monthly basis, they need an electrical energy integration for over 50% of their production; this energy integration by the electricity network is necessary when the CPV/T-ORC system does not match completely the energy load. As shown in Figure 10a,b, the integration needs of the ORC are lower in comparison with the CPV/T system. The average integration in the first three months are respectively equal to 65.3% and 57% for the CPV/T system and the ORC. In the last three months, the electrical integration are lower, but the CPV/T system with an average integration of 58.6% always requires more energy compared to the ORC (48%). In the central six months, considering the stand-alone systems, the CPV/T needs of integration are equal to about 16%, while the ORC does not require an integrated electrical energy. In Figure 10c, the combined production, both on a daily and monthly basis, is compared with the electric energy loads. As shown, the electrical energy needs are always satisfied, unless for coldest months.
Hence, the ORC-CPV/T combined solution represents a good choice which, starting from the solar energy, allows covering the industrial electrical energy needs exploiting as secondary energy the thermal energy obtained by the CPV/T system, in order to produce more electrical energy. For this reason, in Figure 11, the electrical integration required by the CPV/T system is reported together with the ORC electrical production. As shown, the ORC allows covering the high amount of electrical energy that the CPV/T system cannot satisfy. In particular, considering the daily load and the ORC electrical production summed to the CPV/T system production, only a few kWh/day are required to the traditional fossil source. In the first three months, the user needs about 100 kWh/day of integration, while in the last three months of the year the necessary integration is lower (Figure 11).
The monthly situation related to the electric needs covered by the integrated system is analyzed in Figure 12. The CPV/T-ORC system allows satisfying 100% of the loads from April to September. Moreover, in these months the overproduction can be sold to the network or stored for future use. In the first three months, as previously described, the combined production requires integration from the traditional source. The covering rates of the electrical loads are 73%, 77%, and 83%, respectively for January, February, and March, with an average monthly electrical energy to supply equal to about 1895 kWh/month. In the last three months, the covering rates are better: 86% in October, 93% in November, and 100% in December. In this case, an average monthly request of about 939 kWh/month is necessary as electrical energy integration. Hence, the combined CPV/T-ORC system allows covering the electrical loads of the industrial user for seven months, while the integration necessary in the other periods is very low. Finally, the CPV/T-ORC combined system represents an ideal solution for an industrial user from the energy point of view. Therefore, considering the CPV system [4] and ORC system costs [14] and a purchase price of electricity on the Italian market equal to about € 0.20 €/kWh and a sale price electricity of about 0.10 €/kWh in order to define the yearly cash flows, a simple pay-back of about eight years has been obtained considering a useful life of the CPV/T-ORC system of 20 years.

5. Conclusions

In this paper, a CPV/T system is coupled with an organic Rankine cycle and the integrated system energy performances have been investigated in order to satisfy the electrical energy loads of a medium industrial user located in the South of Italy. The CPV/T-ORC system has been sized and different simulations have been realized in order to show how this system can supply the user energy requirements. Once evaluated, the DNI by means of the Artificial Neural Networks, three input condition scenarios have been evaluated: Summer, winter, and middle season. The electrical production of the integrated system has been determined in order to show how the thermal energy, removed from the TJ cells by an active cooling mechanism and sent to the ORC cycle, allows satisfying the electrical energy needs that the simple CPV system cannot supply.
The peak power considered for the industrial machines is about 42 kW, while other electrical loads and heating or cooling, as a function of the season, require a total peak power of 15 kW, obtaining a cumulative monthly average consumption of 7500 kWh/month. The line-focus CPV/T system, with a concentration factor of 100, presents 16 modules of 500 TJ cells. The cooling fluid, which removes heat from the TJ solar cell, is collected in a delivery manifold and then sent to the heat generator of the ORC system. Since the ORC cycle adopts a low boiling fluid, the temperatures of about 70 °C reached in the CPV/T system are sufficient to feed the cycle. Hence, it is possible to achieve a double electric output from the solar source.
The system model has shown that in a summer day the maximum hourly electrical production of the CPV/T system has been about 40 kWh at 1:00 p.m., while in the same condition in a winter day an hourly electrical energy of about 23 kWh is obtainable. The thermal energy production of the CPV/T system has presented a maximum value of 35 kWh in winter, 41 kWh in the middle season, and 63 kWh in the summer period. Once evaluated, the CPV/T system production, the coupling with the ORC cycle has been investigated. Starting from the thermal energy production of the CPV/T, the ORC system electrical production has been evaluated. In particular, the daily electrical energy production of the ORC system reaches its maximum value in summer with about 50 kWh at 1:00 p.m., while in the middle season is 33 kWh. The ORC cycle supplies about 19% more of electric energy compared to the CPV/T system. The combined electrical production of the CPV/T-ORC has allowed satisfying 100% of the loads from April to September and the overproduction of these months can be sold to the network or stored for future use. As for the months of January, February, and March the covering rates of the electrical loads of the CPV/T-ORC combined system have been equal to 73%, 77%, and 83%, respectively. Moreover, the covering rates have been 86% in October, 93% in November, and 100% in December. Hence, the CPV/T-ORC combined system can represent an interesting solution to satisfy the energy loads of an industrial user. Finally, an interesting aspect of the CPV/T systems is to obtain simultaneously electrical and thermal energy. In particular, the thermal energy can be used either to directly meet the thermal demands of a user or to couple the CPV/T systems with other systems in order to obtain additional electrical energy. This is the most interesting aspect that will be increasingly developed in the near future.

Author Contributions

Conceptualization, C.R., F.P., D.D., and F.M.; methodology, C.R., F.P., D.D., and F.M.; software, C.R., F.P., D.D., and F.M.; validation C.R., F.P., D.D., and F.M.; formal analysis, C.R., F.P., D.D., and F.M.; investigation, C.R., F.P., D.D., and F.M.; resources, C.R., F.P., D.D., and F.M.; data curation, C.R., F.P., D.D., and F.M.; writing—original draft preparation, C.R., F.P., D.D., and F.M.; writing—review and editing, C.R., F.P., D.D., and F.M.; visualization, C.R., F.P., D.D., and F.M.; supervision, C.R. All authors have read and agreed to the published version of the manuscript.

Funding

The research received no external funding.

Conflicts of Interest

The authors declare no conflict of interest.

Abbreviations

Aarea (m2)
ANNartificial neural network
Cconcentration ratio
CPVconcentrating photovoltaic system
CPV/Tconcentrating photovoltaic and thermal system
DNI direct normal irradiance (kWh/m2)
Gniglobal normal irradiance (kWh/m2)
HRAhour angle
InGaP/InGaAs/Geindium gallium phosphide/indium gallium arsenide/germanium
ktclearness index
ORCorganic rankine cycle
Ttemperature (°C)
TJ triple-junction
Greek symbols:
δdeclination angle
εcemissivity
η efficiency
σttemperature coefficient (%/K)
Subscripts:
aair
ccell
elelectric
invinverter
modmodule
optoptical
parparasitic
rreference
ththermal

References

  1. Renno, C. Optimization of a concentrating photovoltaic thermal (CPV/T) system used for a domestic application. Appl. Therm. Eng. 2014, 67, 396–408. [Google Scholar] [CrossRef]
  2. Xu, G.; Zhang, X.; Deng, S. Experimental study on the operating characteristics of a novel low-concentrating solar photovoltaic/thermal integrated heat pump water heating system. Appl. Therm. Eng. 2011, 31, 3689–3695. [Google Scholar] [CrossRef]
  3. Renno, C. Thermal and Electrical Modelling of a CPV/T System Varying Its Configuration. J. Therm. Sci. 2019, 28, 123–132. [Google Scholar] [CrossRef]
  4. Renno, C.; Petito, F. Modelling of a linear focus concentrating photovoltaic and thermal system for different load scenarios of a residential user. Energy Convers. Manag. 2019, 188, 214–229. [Google Scholar] [CrossRef]
  5. Jakhar, S.; Soni, M.S.; Gakkhar, N. Historical and recent development of concentrating photovoltaic cooling technologies. Renew. Sustain. Energy Rev. 2016, 60, 41–59. [Google Scholar] [CrossRef]
  6. Zhang, X.; Zhao, X.D.; Smith, S.; Xu, J.H.; Yu, X.T. Review of R&D progress and practical application of the solar photovoltaic/thermal (PV/T) technologies. Renew. Sustain. Energy Rev. 2011, 16, 599–617. [Google Scholar] [CrossRef]
  7. Sharaf, O.Z.; Orhan, M.F. Concentrated photovoltaic thermal (CPVT) solar collector systems: Part I-fundamentals, design considerations and current technologies. Renew. Sustain. Energy Rev. 2015, 50, 1500–1565. [Google Scholar] [CrossRef]
  8. Alobaid, M.; Hughes, B.; Calautit, J.K.; O’Connor, D.; Heyes, A. A review of solar driven absorption cooling with photovoltaic thermal systems. Renew. Sustain. Energy Rev. 2017, 76, 728–742. [Google Scholar] [CrossRef] [Green Version]
  9. Saghafifar, M.; Gadalla, M. Performance assessment of integrated PV/T and solid desiccant air-conditioning systems for cooling buildings using Maisotsenko cooling cycle. Sol. Energy 2016, 127, 79–95. [Google Scholar] [CrossRef]
  10. Renno, C.; D’Agostino, D.; Minichiello, F.; Petito, F.; Balen, I. Performance analysis of a CPV/T-DC integrated system adopted for the energy requirements of a supermarket. Appl. Therm. Eng. 2019, 149, 231–248. [Google Scholar] [CrossRef]
  11. D’Agostino, D.; Daraio, L.; Marino, C.; Minichiello, F. Cost-optimal methodology and passive strategies for building energy efficiency: A case-study. Archit. Sci. Rev. 2018, 61, 400–409. [Google Scholar] [CrossRef]
  12. D’Agostino, D.L.; Marino, C.; Minichiello, F.; Russo, F. Obtaining a NZEB in Mediterranean climate by using only on-site renewable energy: Is it a realistic goal? Energy Procedia. 2017, 140, 23–35. [Google Scholar] [CrossRef]
  13. Renno, C.; Landi, G.; Petito, F.; Neitzert, H.C. Influence of a degraded triple-junction solar cell on the CPV system performances. Energy Convers. Manag. 2018, 160, 326–340. [Google Scholar] [CrossRef]
  14. Moltames, R.; Roshandel, R. Techno-economic analysis of a modified concentrating photovoltaic/organic Rankine cycle system. Int. J. Ambient. Energy 2020. [Google Scholar] [CrossRef]
  15. Al-Nimr, M.A.; Bukhari, M.; Mansour, M. A combined CPV/T and ORC solar power generation system integrated with geothermal cooling and electrolyser/fuel cell storage unit. Energy 2017, 133, 513–524. [Google Scholar] [CrossRef]
  16. Rahbar, K.; Riasi, A.; Sangjoeei, H.K.B.; Razmjoo, N. Heat recovery of nano-fluid based concentrating Photovoltaic Thermal (CPV/T) Collector with Organic Rankine Cycle. Energy Convers. Manag. 2019, 179, 373–396. [Google Scholar] [CrossRef]
  17. Delgado-Torres, A.M.; García-Rodríguez, L. Analysis and optimization of the low-temperature solar organic Rankine cycle (ORC). Energy Convers. Manag. 2010, 51, 2846–2856. [Google Scholar] [CrossRef]
  18. Renno, C. Experimental and Theoretical Analysis of a Linear Focus CPV/T System for Cogeneration Purposes. Energies 2018, 11, 2960. [Google Scholar] [CrossRef] [Green Version]
  19. Lazzaroni, M.; Ferrari, S.; Piuri, V.; Salman, A.; Cristaldi, L.; Faifer, M. Models for solar radiation prediction based on different measurement sites. Measurement 2015, 63, 346–363. [Google Scholar] [CrossRef]
  20. Polo, J.; Ballestrín, J.; Carra, E. Sensitivity study for modelling atmospheric attenuation of solar radiation with radiative transfer models and the impact in solar tower plant production. Sol. Energy 2016, 134, 219–227. [Google Scholar] [CrossRef]
  21. Gueymard, C.A.; Stephen, M.; Wilcox, S.M. Assessment of spatial and temporal ariability in the US solar resource from radiometric measurements and predictions from models using ground-based or satellite data. Sol. Energy 2011, 85, 1068–1084. [Google Scholar] [CrossRef]
  22. Boroojeni, K.G.; Amini, M.H.; Bahrami, S.; Iyengar, S.S.; Sarwat, A.I.; Karabasoglu, O. A novel multi-time-scale modeling for electric power demand forecasting: From short-term to medium-term horizon. Electr. Power Syst. Res. 2017, 142, 58–73. [Google Scholar] [CrossRef]
  23. Celik, A.N.; Muneer, T. Neural network based method for conversion of solar radiation data. Energy Convers. Manag. 2012, 51, 117–124. [Google Scholar] [CrossRef]
  24. Mellit, A.; Eleuch, H.; Benghanem, M.; Elaoun, C.; Massi Pavan, A. An adaptive model for predicting of global, direct and diffuse hourly solar irradiance. Energy Convers. Manag. 2013, 67, 117–124. [Google Scholar] [CrossRef]
  25. Yadav, A.K.; Chandel, S.S. Solar radiation prediction using Artificial Neural Network techniques: A review. Renew. Sustain. Energy Rev. 2014, 33, 772–781. [Google Scholar] [CrossRef]
  26. Chen, S.X.; Gooi, H.B.; Wang, M.Q. Solar radiation forecast based on fuzzy logic and neural networks. Renew. Energy 2013, 60, 195–201. [Google Scholar] [CrossRef]
  27. Renno, C.; Petito, F.; Gatto, A. Artificial neural network models for predicting the solar radiation as input of a concentrating photovoltaic system. Energy Convers. Manag. 2015, 106, 999–1012. [Google Scholar] [CrossRef]
  28. Renno, C.; Petito, F. Triple-junction cell temperature evaluation in a CPV system by means of a Random-Forest model. Energy Convers. Manag. 2018, 169, 124–136. [Google Scholar] [CrossRef]
  29. Triple-Junction Solar Cell for Terrestrial Applications. CTJ Photovoltaic Cell-10 mm × 10 mm. Datasheets Emcore; Emcore Corporation: Alhambra, CA, USA, 2012.
  30. Renno, C. Theoretical and Experimental Evaluation of the Working Fluid Temperature Levels in a CPV/T System. Energies 2020, 13, 3077. [Google Scholar] [CrossRef]
  31. Chemisana, D.; Vossier, A.; Pujol, L.; Perona, A.; Dollet, A. Characterization of Fresnel lens optical performances using an opal diffuser. Energy Convers. Manag. 2011, 52, 658–663. [Google Scholar] [CrossRef]
  32. Aprea, C.; Renno, C. A numerical approach to a very fast thermal transient in an air cooling evaporator. Appl. Eng. 2002, 22, 219–228. [Google Scholar] [CrossRef]
  33. Kaska, O. Energy and exergy analysis of an organic Rankine for power generation from waste heat recovery in steel industry. Energy Convers. Manag. 2014, 77, 108–117. [Google Scholar] [CrossRef]
  34. Song, S.; Zhang, H.; Lou, Z.; Yang, F.; Yang, K.; Wang, H.; Bei, C.; Chang, Y.; Yao, B. Performance analysis of exhaust waste heat recovery system for stationary CNG engine based on organic Rankine cycle. Appl. Therm. Eng. 2015, 76, 301–309. [Google Scholar] [CrossRef]
  35. Aprea, C.; Renno, C. An air cooled tube-fin evaporator model for an expansion valve control law. Math. Comput. Model. 1999, 30, 135–146. [Google Scholar] [CrossRef]
  36. Renno, C.; Petito, F.; Landi, G.; Neitzert, H.C. Experimental characterization of a concentrating photovoltaic system varying the light concentration. Energy Convers. Manag. 2017, 138, 119–130. [Google Scholar] [CrossRef]
  37. Aprea, C.; Renno, C. An experimental analysis of a thermodynamic model of a vapour compression refrigeration plant on varying the compressor speed. Int. J. Energy Res. 2004, 28, 537–549. [Google Scholar] [CrossRef]
Figure 1. Concentrating photovoltaic and thermal (CPV/T) system.
Energies 13 03476 g001
Figure 2. Scheme of the integrated CPV/T-oragnic rankine cycle (ORC) system.
Energies 13 03476 g002
Figure 3. Validation results of the training process.
Energies 13 03476 g003
Figure 4. Direct normal irradiation in the summer, winter, and middle seasons.
Energies 13 03476 g004
Figure 5. Electrical energy loads of the industrial user: Daily loads for each equipment (a), monthly cumulative loads (b).
Energies 13 03476 g005
Figure 6. Electrical production of the CPV/T system in the summer, winter, and middle seasons.
Energies 13 03476 g006
Figure 7. Thermal production of the CPV/T system in the summer, winter, and middle seasons.
Energies 13 03476 g007
Figure 8. Electrical production of the ORC system in the summer, winter, and middle seasons.
Energies 13 03476 g008
Figure 9. Monthly energy production of the combined CPV/T-ORC system.
Energies 13 03476 g009
Figure 10. The CPV/T-ORC system electrical production compared to the user electrical loads: (a) Only the CPVT system; (b) only the ORC system; (c) combined production.
Energies 13 03476 g010
Figure 11. Electrical integration required by the CPV/T system and monthly electrical production of the ORC system.
Energies 13 03476 g011
Figure 12. Annual electrical covering (%) by means of the CPV/T-ORC system and electrical energy integration required (kWh) for the industrial user.
Energies 13 03476 g012
Table 1. Parameters of the triple-junction cell.
ParameterValue
materialInGaP/InGaAs/Ge
dimensions1.0 × 1.0 cm
η r (at 25 °C, 50 W/cm2–1000 suns)39.0%
temperature coefficient ( σ t )−0.04%/K

