Abstract
Anaerobic digestion (AD) of chicken litter (CL) is a viable alternative to disposal. However, methane yields from this primarily organic waste are quite low when mono-digested. This paper discusses the effect of an enzyme cocktail, trace element (TE) supplementation and selenium (Se) addition in small-scale batch biomethane potential (BMP) assays to enhance the AD of CL. Eleven different assays were set up in triplicate including assays containing only inoculum (blank), only CL (negative control) and cellulose and inoculum (positive control). The results indicate that both enzyme treatment and trace element supplementation enhanced the biogas and methane yield. The highest specific biogas and methane yields were noted for 1% enzyme-treated CL of 835.2 L/kg volatile solids (VS) and 460.8 L/kg VS, respectively. Usually, mono-digestion of CL is low due to high nitrogen content and the presence of recalcitrant lignocellulosic material from the bedding material. Enzyme treatment performed better than the addition of the TE mix and Se.
1. Introduction
Animal manure is a rich source of minerals including, nitrogen (N), phosphorus (P), calcium (Ca), potassium (K) and magnesium (Mg), as well as organic matter. Inappropriate disposal of this waste stream can result in the contamination of ground and surface water and thus poses a risk to both animal and human health []. Worldwide, the poultry sector is one of the largest generators of organic waste. In Ireland, chicken consumption is high when compared to other poultry animals, which results in the generation of large volumes of chicken litter (CL) []. CL, composed of chicken excreta along with bedding material, feathers and waste feed, is also a rich source of nutrients (N, P and K) which can be recovered by appropriate processes []. In addition, CL is carbon (C) rich when compared to poultry manure alone as it contains large amounts of bedding material which is primarily lignocellulosic in nature [].
Anaerobic digestion (AD) is a sustainable technology which can be employed to both stabilize waste through the conversion of organic matter to gaseous fuel and to reduce the volume of the waste []. Research into AD of CL has presented some challenges, as the presence of proteins and amino acids contribute to a significantly high nitrogen content []. This further results in a low carbon to nitrogen (C/N) ratio leading to an accumulation of ammonia during the AD process. Ammonia (NH3) concentrations below 3–4 g/L are generally considered non-toxic and can be achieved by dilution, co-digestion or, where possible, ammonia stripping [,,].
Microorganisms involved in the production of biogas by AD require both macronutrients (C, N, P, K) and micronutrients for optimum performance. Carbon is required for cell structure maintenance, nitrogen for the synthesis of amino acids and proteins, while sulfur is involved in both amino acid structure as well as the growth of methanogenic microorganisms []. Trace elements (TE) or micronutrients are also required by the microorganisms as co-factors for the enzymes involved in methanogenesis and chemical reactions during the AD process []. They can also help in microbial aggregation through syntrophic pathways, thus leading to enhanced methanogenesis []. TE are also used as supplements in AD, especially iron (Fe), cobalt (Co) and nickel (Ni). These supplementations have been linked to reductions in volatile fatty acid (VFA) accumulation, a phenomenon that can result in process failure [,].
Moreover, molybdenum (Mo), tungsten (W) and selenium (Se) have also been reported to play an important role in syntrophic acetate oxidation by helping the enzyme formate dehydrogenase (FDH) []. The role of the aforementioned TE has also been investigated in AD of brewery waste, food waste, industrial wastewater and synthetic feeds [,]. Se was reported as a critical TE in AD of chicken manure producing more than 7200 g/m3 of methane (CH4) at high ammonia concentration [].
While TE play an important role in the metabolic pathways of anaerobic microorganisms, enzyme technology has been shown to improve substrate biodegradability, thus enhancing biogas and methane yield by AD. Studies have reported significant improvement in methane yield owing to treatment with a single or mixed enzyme [,,,,]. Enzymes help to improve the rate of hydrolysis during AD, thereby resulting in a higher biomethane yield. It is hypothesized in this study that cellulases, hemicelluloses and carbohydrases will be useful in hydrolyzing the lignocellulosic fraction in CL.
The current study was designed based on the hypothesis that TE supplementation and enzyme addition would have a synergistic effect on the biogas and methane yields by AD of CL. The treatments were carried out individually and in combination to investigate their effects on biogas productivity. The different treatments included addition of (a) a TE mix, (b) Se, (c) an enzyme, (d) a pretreated enzyme, (e) an enzyme and TE mix, (f) a pretreated enzyme and TE mix, (g) an enzyme and Se and (h) a pretreated enzyme and Se.
2. Materials and Methods
2.1. Substrate, Inoculum and Reagents
The CL substrate and dairy slurry inoculum used in this study were obtained from local farms in Dunboyne, Co Meath. Inoculum was prepared by passing it through a 2 mm sieve and collecting the liquid fraction. The enzyme used in this study was a fungal enzyme cocktail, commercially known as-Digest P3, containing carbohydrases, pectinase and xylanase. Enzyme stock was prepared in distilled water and added to the inoculum to a final percentage of 1% (w/v). A TE stock was prepared as previously described []. This stock was diluted ten times instead of thousand times as described in the protocol, and 1mL was added to each test. The concentrations of individual trace metals within the TE stock along with their final concentrations in each BMP assay are provided in Table 1. A Se stock solution (0.25 mg/mL) was also prepared in dH2O. The final concentration of Se in the test assays was 2.5 mg/L, which was achieved by adding 0.5 mL of the above stock to 50 mL reaction volume.

Table 1.
Concentration of individual trace elements in stock solution and biomethane potential (BMP) assays.
2.2. Biomethane Potential (BMP) Assay
BMP assays were conducted in eight groups to investigate the effects of the following on CL AD: (a) enzyme inclusion alone (E); (b) TE supplementation alone; (c) Se supplementation alone; (d) the combination of enzyme inclusion and TE supplementation (E-TE) and (e) the combination of enzyme inclusion and Se supplementation (E-Se). A further three groups of assays were conducted investigating the effect of substrate pretreatment with enzyme (PE). The setup of each of the individual BMP assays is outlined in Table 2. PE was achieved by incubating the CL and enzyme stock of 1% enzyme in distilled water (ES) at 30 °C for 48 h prior to the commencement of the experiment. A negative control (inoculum alone) and two positive controls (inoculum with CL and inoculum with cellulose) were also performed. All BMP assays were conducted in triplicate in 150 mL serum bottles (50 mL working volume) at 37 °C for 29 days. All assays contained 0.75 g volatile solids (VS) of CL with a substrate to inoculum (S/I) ratio of 0.5. Bottles were sealed with rubber bungs and crimp seals and flushed with nitrogen gas to maintain anaerobic conditions.
Table 2.
Description and composition of individual BMP assays.
2.3. Analytical Methods
The pH of all BMP assay liquor was determined at the start and conclusion of the experiment using a digital pH meter according to the manufacturer’s instructions. Total solids (TS), VS, moisture content and ash were analyzed according to the APHA standard methods. Total Kjeldahl nitrogen (TKN), ammonia (NH4), chemical oxygen demand (COD), VFA and alkalinity were determined using Hach test kits LCK 338, LCK 302, LCK014, LCK 365 and AL-AP, respectively, according to the manufacturer’s instruction. Carbon, nitrogen, sulfur (S) and hydrogen (H) content of CL were determined using Leco TruMac CNS element analyzer after drying and blending it to a powder. The results of the element analysis were used to determine the O2 concentration of CL via. the following formula:
O = 100 − (C + H + N + S) %
Volatile solid removal (VSR) is another parameter which indicates process efficiency, as it corresponds to the amount of VS degraded in during the AD process. It was calculated by subtracting initial VS with the final VS at the end of the reaction as described in Equation (2).
2.4. Gas Analysis
Biogas was measured using a pressure transducer routinely and all gas was collected in gas bags []. A specific biogas volume or specific biogas yield (SBY) was expressed as volume of biogas produced per unit volatile solids of the loaded substrate (mL/g or L/kg). The methane percentage was determined at the end of the experiment via Shimadzu GC-14A gas chromatograph, packed with porapak Q 80–100 mesh on a flame ionization detector (FID). The injection and oven temperatures were maintained at 160 °C, while the detector was maintained at 110 °C []. The methane volume was calculated as the product of methane % and the biogas volumes at the end of the experiment. The specific methane yield (SMY) was expressed as the methane volume per unit volatile solids of the substrate (Equation (3)) [].
The theoretical methane yield (TMY) and biogas potential indicate the maximum potential yield from a given organic substrate if complete degradation had occurred. Both values can be calculated using the Buswell equation [] (Equation (4)) when the elemental composition (C, H, N and O) of the substrate are known. Methane and carbon dioxide yields were calculated as described previously []. The TMY was also used to calculate biodegradability index (BI) for the different tests by dividing the observed SMY with the TMY of CL (Equation (5)).
2.5. One-Way ANOVA and Pearson Correlation
One-way ANOVA was performed using IBM SPSS statistics 23 amongst the tests to compare if differences for parameters including cumulative SMY, SBY, final total ammonia nitrogen (TAN), final volatile fatty acids (VFA) and VSR were significantly different. These are denoted by the letters a, b, c and d. SMY with at least one letter in common denotes non-significant differences, while those with no common letter denote significantly different SMYs. Pearson’s correlation was also performed between different tests for SMY, SBY, TAN, VFA and VSR using SPSS to determine whether or not the above-mentioned parameters are linearly correlated.
3. Results
3.1. Substrate and Inoculum Characteristics
The results of the substrate and inoculum analysis carried out preassay are summarized in Table 3. The VS/TS ratio for CL was 0.71, indicating that it is a substrate containing a high level of organic matter and thus suited to AD [,]. In contrast, the C/N ratio of this substrate was 10, which is below the optimum ratio of 25–30 preferred for AD [,]. High C/N ratios result in VFA accumulation, while low ratios lead to ammonia toxicity. Moreover, as described in the introduction, the high nitrogen load of CL can lead to ammonia (NH4) toxicity and process failure in some instances. Nevertheless, although the ammonia concentration and pH of both the inoculum and CL were within the range at this time, it should be noted that a total ammonia concentration above 4 g/L can be inhibitory to the AD process irrespective of the pH [] (Table 3).
Table 3.
Physiological characteristics of inoculum and chicken litter.
3.2. Biogas and Methane Yield
3.2.1. Enzyme, Trace Element and Selenium Batch Assays
Biogas evolution graphs (Figure 1) show that biogas yield rates increased equally for all three test groups up to day 11, after which Se and E assays increase at a higher rate than TE assays. This trend was observed up to day 20 when a sharp increase in biogas yield was observed in the E assay in comparison to the other two assay treatments. In contrast, little or no difference is observed between the biogas yields of enzyme-treated TE- and Se-supplemented assays up to day 22 (Figure 1). After day 22, enzyme treatment alone produced much higher biogas volumes compared to the other two treatments. During the initial phase of AD, easily accessible material is digested, which is mostly similar for enzyme-supplemented and non-supplemented samples. The second phase, where the less accessible material such as lignocellulose is degraded, is where the difference in biogas yield can be observed. This was also observed for an endogenous enzyme that was induced for cellulose activity in AD of ensiled forage ley with an SMY of 319 L/kg VS and 286 L/kg VS for enzyme-treated and non-treated samples, respectively, after 111 days []. However, the difference in feedstock used makes the slopes of the two curves different (steeper for forage ley). Enzyme treatment over a period of 30 days resulted in 835.6 L/kg VS of biogas and 454.1 L/kg VS of SMY.
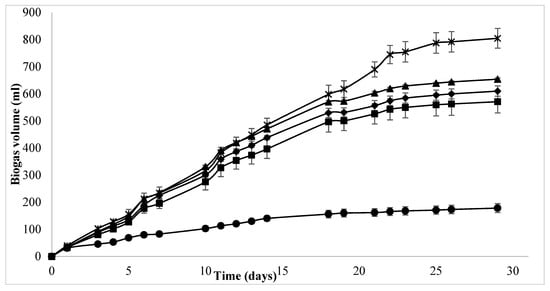
Figure 1.
Accumulated biogas volume (mL) for enzyme-, TE- and Se-supplemented BMP assays over a 30-day period, where ● = blank ■ = control, × = E, ♦ = TE, ▲ = Se.
TE and Se supplementation to batch assays yielded 304.4 L/kg VS and 332.5 L/kg VS of SMY, which is comparable to methane yields [], wherein the highest SMY of 330 L/kg VS and 340 L/kg VS was obtained through the co-digestion of poultry droppings with wheat straw and meadow grass, respectively. Similar results have been obtained through C/N optimization, where the co digestion of CL with wheat straw resulted in 385.3 L/kg VS and 366 L/kg VS of SMY for the C/N ratios 20:1 and 25:1, respectively []. However, it should be noted that the above studies aimed to improve biogas yield for poultry waste by focusing on macronutrient balance and co-digestion with high C/N waste, while the current study focuses on micronutrient balance. These results are significantly higher than the SMY increases of 12% reported for the mono-digestion of grass silage supplemented with TE (Fe, Co and Ni) [].
3.2.2. Enzyme, Trace Elements and Selenium Combination Batch Assays
The effect of enzyme addition can be seen by comparing batch assays which received individual supplementations of TE and Se to batch assays which received combined enzyme and TE supplementation and enzyme and Se supplementation. Interestingly, the difference in biogas production between both batch assay sets was not observed until days 20–22 (Figure 2). As hydrolysis is a common limiting step in the AD process, it is possible that this problem was reached sooner in the non-supplemented controls, as the microorganisms reduced the available substrate.
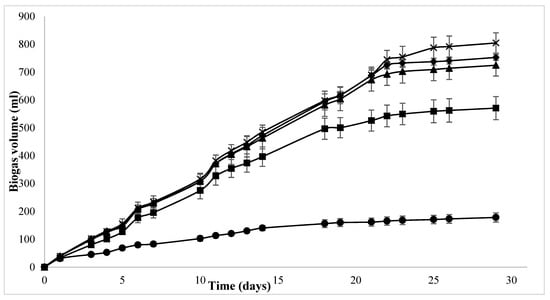
Figure 2.
Accumulated biogas volumes (mL) for E-, E-TE- and E-Se-supplemented BMP assays over a 30-day period, where ● = blank, ■ = control, × = E, ♦ = E-TE, ▲ = E-Se.
Figure 2 shows the cumulative biogas production values for a period of 29 days of combination treatments. As compared to enzyme treatment on its own, enzyme treatment in combination with TE and Se yielded a lower SBY and SMY. This may be a result of the inhibitory effects of TE and specifically high concentration of Se (0.25 mg/L). This was contrary to the hypothesis that the synergistic effects of enzyme and TE may produce higher biogas yields than individual treatments themselves. This can be explained by the toxic effects of some metals that can cause the disruption of protein structure and function by hindering the active sites of the enzyme or replacement of original metal co-factors in the prosthetic groups of the enzymes []. It may be noted that the effect of enzyme treatment is predominant in the combination assays, as both SBY and SMY are higher than the individual Se and TE treatments (Table 4).
Table 4.
Biogas analysis, biodegradability index (BI) and pH of BMP assays.
3.2.3. Substrate Pretreatment with Enzyme Batch Assays
As described in Section 2.2, the effect of substrate pretreatment with the enzyme was investigated in three different batch assays. The biogas production (mL) from these assays was marginally higher in all cases for the first 10 days, after which time, increased biogas production was observed for PE and PE-TE (Figure 3). Although PE-Se-supplemented assays continued to behave similarly to the control until day 20, the biogas production then increased and was comparable to the other assays at the conclusion of the trial on day 29. The SMY on day 29 was 392 L/kg VS, 387.7 L/kg VS and 392.5 L/kg VS for PE-, PE-TE- and PE-Se-supplemented assays, respectively. Despite producing higher biogas than the control assay, the enzyme pretreatment assays produced c. 8% lower biogas volume when compared to assays that received enzyme supplementation directly into the reaction. Moreover, the difference in SMY between pretreated assays was not significantly different from each other, which leads to the conclusion that the addition of trace elements did not contribute to the increased methane yield.
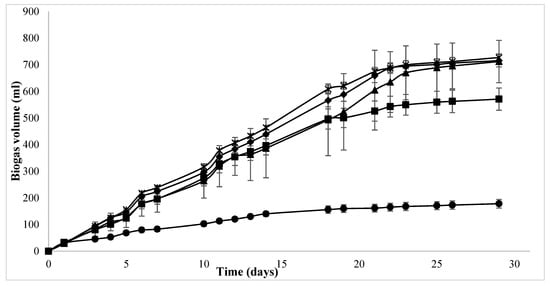
Figure 3.
Accumulated biogas volume (mL) for PE-, PE-TE- and PE-Se-supplemented BMP assays over a 30-day period, where; ● = blank, ■ = control, × = PE, ♦ = PE-TE, ▲ = PE-Se.
This was also the case for the enzyme-supplemented and PE assays which received TE and Se supplementation. For example, in direct comparison between PE-TE and E-TE BMP assays an 8.3% decrease in SMY, and an 11% decrease was observed between PE-Se and E-Se assays (Table 4). A significant increase in the amount of phenols released from the lignocellulosic matrix post-enzymatic treatment for different lignocellulosic substrates was observed []. This was hypothesized to be one of the reasons for inhibition of enzyme activity, especially, for substrates with high lignin content. In the present study, SMYs of pretreated samples are lower than those that received direct enzyme treatment, thus indicating that some degree of inhibition occurred during the incubation of CL, which similarly contains lignocellulose from the bedding material with the enzyme. Enzyme pretreatment of the substrate was performed in the absence of inoculum and, thus, the concentration of such phenolic compounds would be higher compared to the direct addition of the enzyme to the reaction. As a result, a lower SMY was observed for the pretreated assays as compared to the direct treatment.
3.3. Specific Methane Yield (SMY)
It was noted that there was no lag phase observed for the substrate to inoculum (SI) ratio used, thus indicating that the microorganisms provided by the inoculum were enough to support the amount of substrate loaded, subsequently avoiding the rate limiting step []. AD of CL alone resulted in 240.7 L CH4/kg VS and 523 L/kg VS of biogas, respectively (Table 4). A positive control containing pure cellulose yielded an SBY of 1153 L/kg VS and an SMY of 371.8 L CH4/kg VS. The TMY of cellulose was calculated as 415 L CH4/kg VS, with the experimental SMY recorded at 371.8 L CH4/kg VS, accounting for 89% of the TMY, thus indicating the high efficiency of the inoculum.
The TMY for CL was calculated as 526.8 L CH4/kg VS, while the experimental SMY was 240.7 L CH4/kg VS. However, the highest SMY, 460.8 L/kg VS, was obtained from assays containing the 1% enzyme treatment alone (Table 4), thus supporting the hypothesis that addition of enzyme has a positive effect on biogas and methane production. While both enzyme-supplemented (pretreated and direct) and TE-supplemented batch assays recorded that the SBY increased between 36–60% and the SMY increased between 72–91%, highest percent increase was observed for enzyme treatment alone: ~60% in the SBY and 91.4 % in the SMY (Table 4).
As discussed above in Section 3.2.2 and Section 3.2.3 combination trials and pretreatment trials recorded a drop in the biogas and methane yields as compared to enzyme treatment alone. It is important to note here that the addition of Se alone enhanced the SBY and SMY, which can be explained by the recent findings of Se being involved in the syntrophic acetate oxidation pathway []. In the case of individual treatments, SMY for TE and Se addition were not significantly different (p > 0.05), while they were significantly higher for the enzyme-supplemented test (p < 0.001) compared to the control. The SMY was significantly higher when compared to the control for all the combination treatments (p < 0.05). The methane percentage was significantly higher for all the treatments as compared to the control, which demonstrates positive effects of enzyme treatment and TE supplementation. Within the tests, the SBY and SMY are significantly higher for enzyme treatment alone as compared to TE or Se supplementation (Table 4).
3.4. Comparison of Parameters
Specific parameters such as TAN, VFA and pH are important considerations for the success or failure of an AD process [,]. The pH of the starting inoculum was 8.3, which dropped to 8.11 in the case of the control, and it stayed between 7.8–8.15 for all test assays (Table 4). TAN concentration remained between 1.8–3.5 g/L (Table 5), which was below the inhibition limit of 4 g/L []. The methane percentage also ranged between 53 to 55% in all test assays, indicating a 7–9% increase on average when compared with the control assays. The biodegradability index (BI) was calculated by dividing the experimental SMY with the TMY of CL (Table 4). BI values ranged between 58 and 87%, for which the 1% enzyme treatment yielded the highest BI of 87.5%, representing a > two-fold increase when compared to the BI of the control assays (45.7%; Table 4).
Table 5.
Physiological characteristics of the BMP assay liquor on day 30 (assay conclusion).
The percentage of VS removal was also higher for the 1% enzyme treatment assays, corresponding to the highest SBY and SMY, respectively (Table 5). Interestingly, the percentage of VS removal dropped from 82–91% in enzyme-treated assays to 57–68% for enzyme-pre-treated assays. This was also reflected in the biogas and methane yields, which were lower for enzyme-pre-treated samples. The VS removal rates for Se and TE samples alone were lower than their enzyme-treated counterparts, which indicates the contribution of enzyme in enhancing VS removal and also biogas and methane yields.
Figure 4 shows the differences between final concentrations of ammonia, VFAs and volatile solids reduction for the control and the different assays. The statistical significance is denoted by different letters, while common letters denote statistically non-significant values. While ammonia concentration was well below the inhibition limits (Section 3.4), it was significantly higher for all the enzyme-pre-treated tests and for the E-TE treatment when compared with the control (Table 5). CL is a protein-rich feedstock, which is why the TAN concentration in the reaction at the end of the trial is higher than the initial concentration (~1.2 g/L). This increased accumulation of TAN in these assays may therefore be a direct result of enzyme pretreatment. In addition to the observed high TAN, these assays also exhibited lower VSR and lower VFA accumulation compared to enzyme-treated assays.
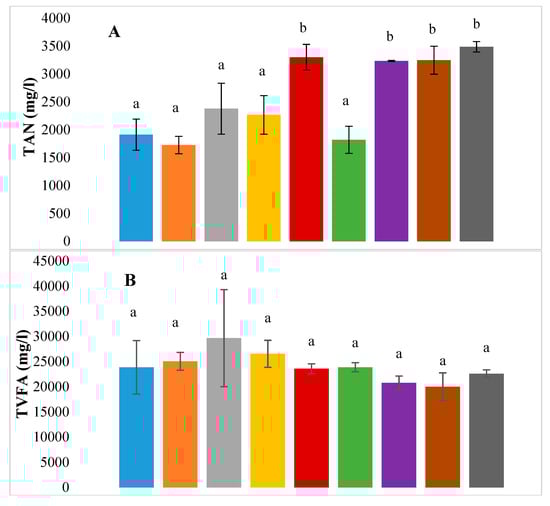
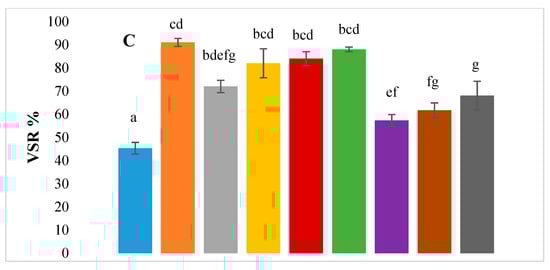
Figure 4.
Bar graphs showing final concentrations of (A) TAN, (B) total VFA and (C) volatile solids reduction (%) for all BMP assays -. ◼ Control, ◼ Enzyme, ◼ Trace elements, ◼ Selenium, ◼ Enzyme with trace elements, ◼ Enzyme with Selenium, ◼ Enzyme pretreatment, ◼ Enzyme pretreatment with trace elements, ◼ Enzyme pretreatment with Selenium.
Where the standard deviation is indicated by error bars and letters denote statistical significance based on p values as described in Section 3.3.
In the case of VFAs, one-way ANOVA revealed that the differences in the final VFA concentrations were not significant amongst the various BMP assay groups. More importantly, the final concentrations range between 20 to 30 g/L. Pearson’s correlation analysis (Table 6) for a two-tailed test also revealed that there was a significant negative final TAN concentration and TVFA (r = −0.293, p = 0.033). This can be observed in Table 4, where VFA accumulation is lower at a higher TAN.
Table 6.
Pearson’s correlation matrix with correlation indices and significance between parameters.
VSR was significantly higher (p < 0.05) for all the test samples as compared to the control (Figure 4). It may also be observed that amongst the different treatments, the enzyme-supplemented tests had a significantly higher VSR as compared to the enzyme-pre-treated tests, which also translates into higher methane yields (Table 3). A significant positive correlation was observed between SMY and VSR (r = 0.387, p = 0.005) and between TVFA and VSR (r = 0.317, p = 0.022) (Table 6). The high positive correlation between SMY and VSR is expected, as the volatile solids removed are converted to biogas and methane. There was no correlation between SMY and TVFA, however, there was a significant positive correlation between TVFA and VSR, which is indicative of volatile solid degradation resulting in the accumulation of VFAs rather than conversion into methane.
4. Conclusions
In this study, the effect of trace elements and enzyme treatment on biogas and methane production from CL was investigated. The main findings of this study are:
- Enzyme treatment without the addition of TE and Se gave the highest biogas and methane yield.
- The results from the experiment highlighted that TE and Se alone did not improve the SMY significantly, while the enzyme treatment did. The results indicated that the concentration of TE and Se were inhibitory for the added enzyme but not for the microbial enzymes, as individual TE and Se assays exhibited a higher SMY than the control.
- Moreover, the SMYs were lower for combination treatment as compared to enzyme treatment alone. This was opposite to the hypothesis that synergistic effects of enzyme with TE and Se would result in a higher yield than enzyme treatment alone.
- Pretreatment of CL with an enzyme prior to the BMP assay also resulted in a lower yield than enzyme treatment. However, enzyme pretreatment still performed better than trace element supplementation.
- Despite the increased methane yields recorded for enzyme-pre-treated assays in comparison with the controls and non-treated assays, these gains were concurrent with increased TAN levels at assay conclusion, indicating that this additional step may not lead to desirable operating conditions in continuous processes.
These results demonstrate the feasibility and effectiveness of the direct addition enzyme treatment in improving mono-digestion of CL, with or without the addition of TE in laboratory-scale experiments. Future work will be required to confirm these conclusions in large-scale trials and commercial facilities. Studies dedicated to investigating the intermittent addition of TE and enzymes over a continuous setup would also be useful in understanding the stability of the process over longer time periods.
Author Contributions
Conceptualization, N.B., D.R., A.-M.E. and R.M.; methodology, N.B.; software, N.B.; validation, A.-M.E., D.R. and R.M.; formal analysis, N.B.; investigation, N.B.; resources, R.M.; data curation, N.B.; writing—original draft preparation, N.B. and A.-M.E.; writing—review and editing, A.-M.E., D.R. and R.M.; visualization, N.B.; supervision A.-M.E.; project administration, A.-M.E.; funding acquisition, A.-M.E. and D.R. All authors have read and agreed to the published version of the manuscript.
Funding
This study was funded by Alltech European Bioscience center, Ireland (Grant no. PES 1162).
Conflicts of Interest
N.B. has received research grants from Alltech which is also the manufacturer of the enzyme used in the study. R.M. is employed by the manufacturer.
References
- Molaey, R.; Bayrakdar, A.; Çalli, B. Long-Term Influence of Trace Element Deficiency on Anaerobic Mono-Digestion of Chicken Manure. J. Environ. Manag. 2018, 223, 743–748. [Google Scholar] [CrossRef] [PubMed]
- Bowen, B.; Lynch, D.; Lynch, D.; Henihan, A.M.; Leahy, J.J.; McDonnell, K. Biosecurity on Poultry Farms from On-Farm Fluidized Bed Combustion and Energy Recovery from Poultry Litter. Sustainability 2010, 2, 2135–2143. [Google Scholar] [CrossRef]
- Thyagarajan, D.; Barathi, M.; Sakthivadivu, R. Scope of Poultry Waste Utilization. IOSR J. Agric. Vet. Sci. 2013, 6, 29–35. [Google Scholar] [CrossRef]
- Shen, J.; Jun, Z. Optimization of Methane Production in Anaerobic Co-Digestion of Poultry Litter and Wheat Straw at Different Percentages of Total Solid and Volatile Solid Using a Developed Response Surface Model. J. Environ. Sci. Health Part A 2016, 51, 325–334. [Google Scholar] [CrossRef] [PubMed]
- Kelleher, B.P.; Leahy, J.J.; Henihan, A.M.; O’dwyer, T.F.; Sutton, D.; Leahy, M.J. Advances in Poultry Litter Disposal Technology—A Review. Bioresour. Technol. 2002, 83, 27–36. [Google Scholar] [CrossRef]
- Keskin, T.; Kubra, A.; Duygu, K.; Nuri, A. The Determination of the Trace Element Effects on Basal Medium by Using the Statistical Optimization Approach for Biogas Production from Chicken Manure. Waste Biomass Valorization 2018, 1–10. [Google Scholar] [CrossRef]
- Markou, G. Improved Anaerobic Digestion Performance and Biogas Production from Poultry Litter after Lowering Its Nitrogen Content. Bioresour. Technol. 2015, 196, 726–730. [Google Scholar] [CrossRef]
- Mao, C.; Yongzhong, F.; Xiaojiao, W.; Guangxin, R. Review on Research Achievements of Biogas from Anaerobic Digestion. Renew. Sustain. Energy Rev. 2015, 45, 540–555. [Google Scholar] [CrossRef]
- Ariunbaatar, J.; Esposito, G.; Yeh, D.H.; Lens, P.N. Enhanced Anaerobic Digestion of Food Waste by Supplementing Trace Elements: Role of Selenium (VI) and Iron (II). Front. Environ. Sci. 2016, 4. [Google Scholar] [CrossRef]
- Cai, Y.; Zehui, Z.; Yubin, Z.; Yue, Z.; Shiyu, G.; Zongjun, C.; Xiaofen, W. Effects of Molybdenum, Selenium and Manganese Supplementation on the Performance of Anaerobic Digestion and the Characteristics of Bacterial Community in Acidogenic Stage. Bioresour. Technol. 2018, 266, 166–175. [Google Scholar] [CrossRef]
- FitzGerald, J.A.; Wall, D.M.; Jackson, S.A.; Murphy, J.D.; Dobson, A.D. Trace Element Supplementation Is Associated with Increases in Fermenting Bacteria in Biogas Mono-Digestion of Grass Silage. Renew. Energy 2019, 138, 980–986. [Google Scholar] [CrossRef]
- Molaey, R.; Bayrakdar, A.; Sürmeli, R.Ö.; Çalli, B. Influence of trace element supplementation on anaerobic digestion of chicken manure: Linking process stability to methanogenic population dynamics. J. Clean. Prod. 2018, 181, 794–800. [Google Scholar] [CrossRef]
- Demirel, B.; Scherer, P. Trace Element Requirements of Agricultural Biogas Digesters during Biological Conversion of Renewable Biomass to Methane. Biomass Bioenergy 2011, 35, 992–998. [Google Scholar] [CrossRef]
- Molaey, R.; Alper, B.; Recep, Ö.S.; Bariş, Ç. Anaerobic Digestion of Chicken Manure: Mitigating Process Inhibition at High Ammonia Concentrations by Selenium Supplementation. Biomass Bioenergy 2018, 108, 439–446. [Google Scholar] [CrossRef]
- Bhatnagar, N.; Ryan, D.; Murphy, R.; Enright, A.M. Effect of Co-Digestion Ratio and Enzyme Treatment on Biogas Production from Grass Silage and Chicken Litter. Waste Biomass Valorization 2018. [Google Scholar] [CrossRef]
- Pérez-Rodríguez, N.; García-Bernet, D.; Domínguez, J.M. Extrusion and Enzymatic Hydrolysis as Pretreatments on Corn Cob for Biogas Production. Renew. Energy 2017, 107, 597–603. [Google Scholar] [CrossRef]
- Müller, L.; Jörg, K.; Jürgen, P.; Jan, L.; Michael, N.; Frank, S. Does the Addition of Proteases Affect the Biogas Yield from Organic Material in Anaerobic Digestion? Bioresour. Technol. 2016, 203, 267–271. [Google Scholar] [CrossRef]
- Ziemiński, K.; Monika, K.-W. Effect of Enzymatic Pretreatment on Anaerobic Co-Digestion of Sugar Beet Pulp Silage and Vinasse. Bioresour. Technol. 2015, 180, 274–280. [Google Scholar] [CrossRef]
- Gerhardt, M.; Vincent, P.; Markus, B. Application of Hydrolytic Enzymes in the Agricultural Biogas Production: Results from Practical Applications in Germany. Biotechnol. J. 2007, 2, 1481–1484. [Google Scholar] [CrossRef]
- Angelidaki, I.; Wendy, S. Assessment of the Anaerobic Biodegradability of Macropollutants. Rev. Environ. Sci. Biotechnol. 2004, 3, 117–129. [Google Scholar] [CrossRef]
- Coates, J.D.; Coughlan, M.F.; Colleran, E. Simple Method for the Measurement of the Hydrogenotrophic Methanogenic Activity of Anaerobic Sludges. J. Microbiol. Methods 1996, 26, 237–246. [Google Scholar] [CrossRef]
- Kaparaju, P.; Lars, E.; Irini, A. Optimisation of Biogas Production from Manure through Serial Digestion: Lab-Scale and Pilot-Scale Studies. Bioresour. Technol. 2009, 100, 701–709. [Google Scholar] [CrossRef] [PubMed]
- Wall, D.M.; Allen, E.; Straccialini, B.; O’Kiely, P.; Murphy, J.D. The Effect of Trace Element Addition to Mono-Digestion of Grass Silage at High Organic Loading Rates. Bioresour. Technol. 2014, 172, 349–355. [Google Scholar] [CrossRef] [PubMed]
- Achinas, S.; Euverink, G.J.W. Theoretical Analysis of Biogas Potential Prediction from Agricultural Waste. Resour. Effic. Technol. 2016, 2, 143–147. [Google Scholar] [CrossRef]
- Li, D.; Liu, S.; Mi, L.; Li, Z.; Yuan, Y.; Yan, Z.; Liu, X. Effects of Feedstock Ratio and Organic Loading Rate on the Anaerobic Mesophilic Co-Digestion of Rice Straw and Pig Manure. Bioresour. Technol. 2015, 187, 120–127. [Google Scholar] [CrossRef]
- Li, Y.; Zhang, R.; Liu, X.; Chen, C.; Xiao, X.; Feng, L.; He y Liu, G. Evaluating Methane Production from Anaerobic Mono- and Co-Digestion of Kitchen Waste, Corn Stover, and Chicken Manure. Energy Fuels 2013, 27, 2085–2091. [Google Scholar] [CrossRef]
- Marchioro, V.; Steinmetz, R.L.; do Amaral, A.C.; Gaspareto, T.C.; Treichel, H.; Kunz, A. Poultry Litter Solid State Anaerobic Digestion: Effect of Digestate Recirculation Intervals and Substrate/Inoculum Ratios on Process Efficiency. Front. Sustain. Food Syst. 2018, 2. [Google Scholar] [CrossRef]
- Zahan, Z.; Georgiou, S.; Muster, T.H.; Othman, M.Z. Semi-Continuous Anaerobic Co-Digestion of Chicken Litter with Agricultural and Food Wastes: A Case Study on the Effect of Carbon/Nitrogen Ratio, Substrates Mixing Ratio and Organic Loading. Bioresour. Technol. 2018, 270, 245–254. [Google Scholar] [CrossRef]
- Matheri, A.N.; Ndiweni, S.N.; Belaid, M.; Muzenda, E.; Hubert, R. Optimising Biogas Production from Anaerobic Co-Digestion of Chicken Manure and Organic Fraction of Municipal Solid Waste. Renew. Sustain. Energy Rev. 2017, 80, 756–764. [Google Scholar] [CrossRef]
- Speda, J.; Johansson, M.A.; Odnell, A.; Karlsson, M. Enhanced Biomethane Production Rate and Yield from Lignocellulosic Ensiled Forage Ley by in Situ Anaerobic Digestion Treatment with Endogenous Cellulolytic Enzymes. Biotechnol. Biofuels 2017, 10, 129. [Google Scholar] [CrossRef]
- Rahman, M.A.; Møller, H.B.; Saha, C.K.; Alam, M.M.; Wahid, R.; Feng, L. Optimal Ratio for Anaerobic Co-Digestion of Poultry Droppings and Lignocellulosic-Rich Substrates for Enhanced Biogas Production. Energy Sustain. Dev. 2017, 39, 59–66. [Google Scholar] [CrossRef]
- Hassan, M.; Ding, W.; Shi, Z.; Zhao, S. Methane Enhancement through Co-Digestion of Chicken Manure and Thermo-Oxidative Cleaved Wheat Straw with Waste Activated Sludge: A C/N Optimization Case. Bioresour. Technol. 2016, 211, 534–541. [Google Scholar] [CrossRef] [PubMed]
- Schroyen, M.; Vervaeren, H.; Vandepitte, H.; Van Hulle, S.W.; Raes, K. Effect of Enzymatic Pretreatment of Various Lignocellulosic Substrates on Production of Phenolic Compounds and Biomethane Potential. Bioresour. Technol. 2015, 192, 696–702. [Google Scholar] [CrossRef] [PubMed]
- Adekunle, K.F.; Okolie, J.A. A Review of Biochemical Process of Anaerobic Digestion. Adv. Biosci. Biotechnol. 2015, 6, 205–212. [Google Scholar] [CrossRef]
- Khalid, A.; Arshad, M.; Anjum, M.; Mahmood, T.; Dawson, L. The Anaerobic Digestion of Solid Organic Waste. Waste Manag. 2011, 31, 1737–1744. [Google Scholar] [CrossRef]
- Zahan, Z.; Othman, M.Z.; Muster, T.H. Anaerobic Digestion/Co-Digestion Kinetic Potentials of Different Agro-Industrial Wastes: A Comparative Batch Study for C/N Optimisation. Waste Manag. 2018, 71, 663–674. [Google Scholar] [CrossRef]
© 2020 by the authors. Licensee MDPI, Basel, Switzerland. This article is an open access article distributed under the terms and conditions of the Creative Commons Attribution (CC BY) license (http://creativecommons.org/licenses/by/4.0/).