Financial Liberalisation, Political Stability, and Economic Determinants of Real Economic Growth in Kenya

 ,
,
Abstract
:1. Introduction
2. Literature Review
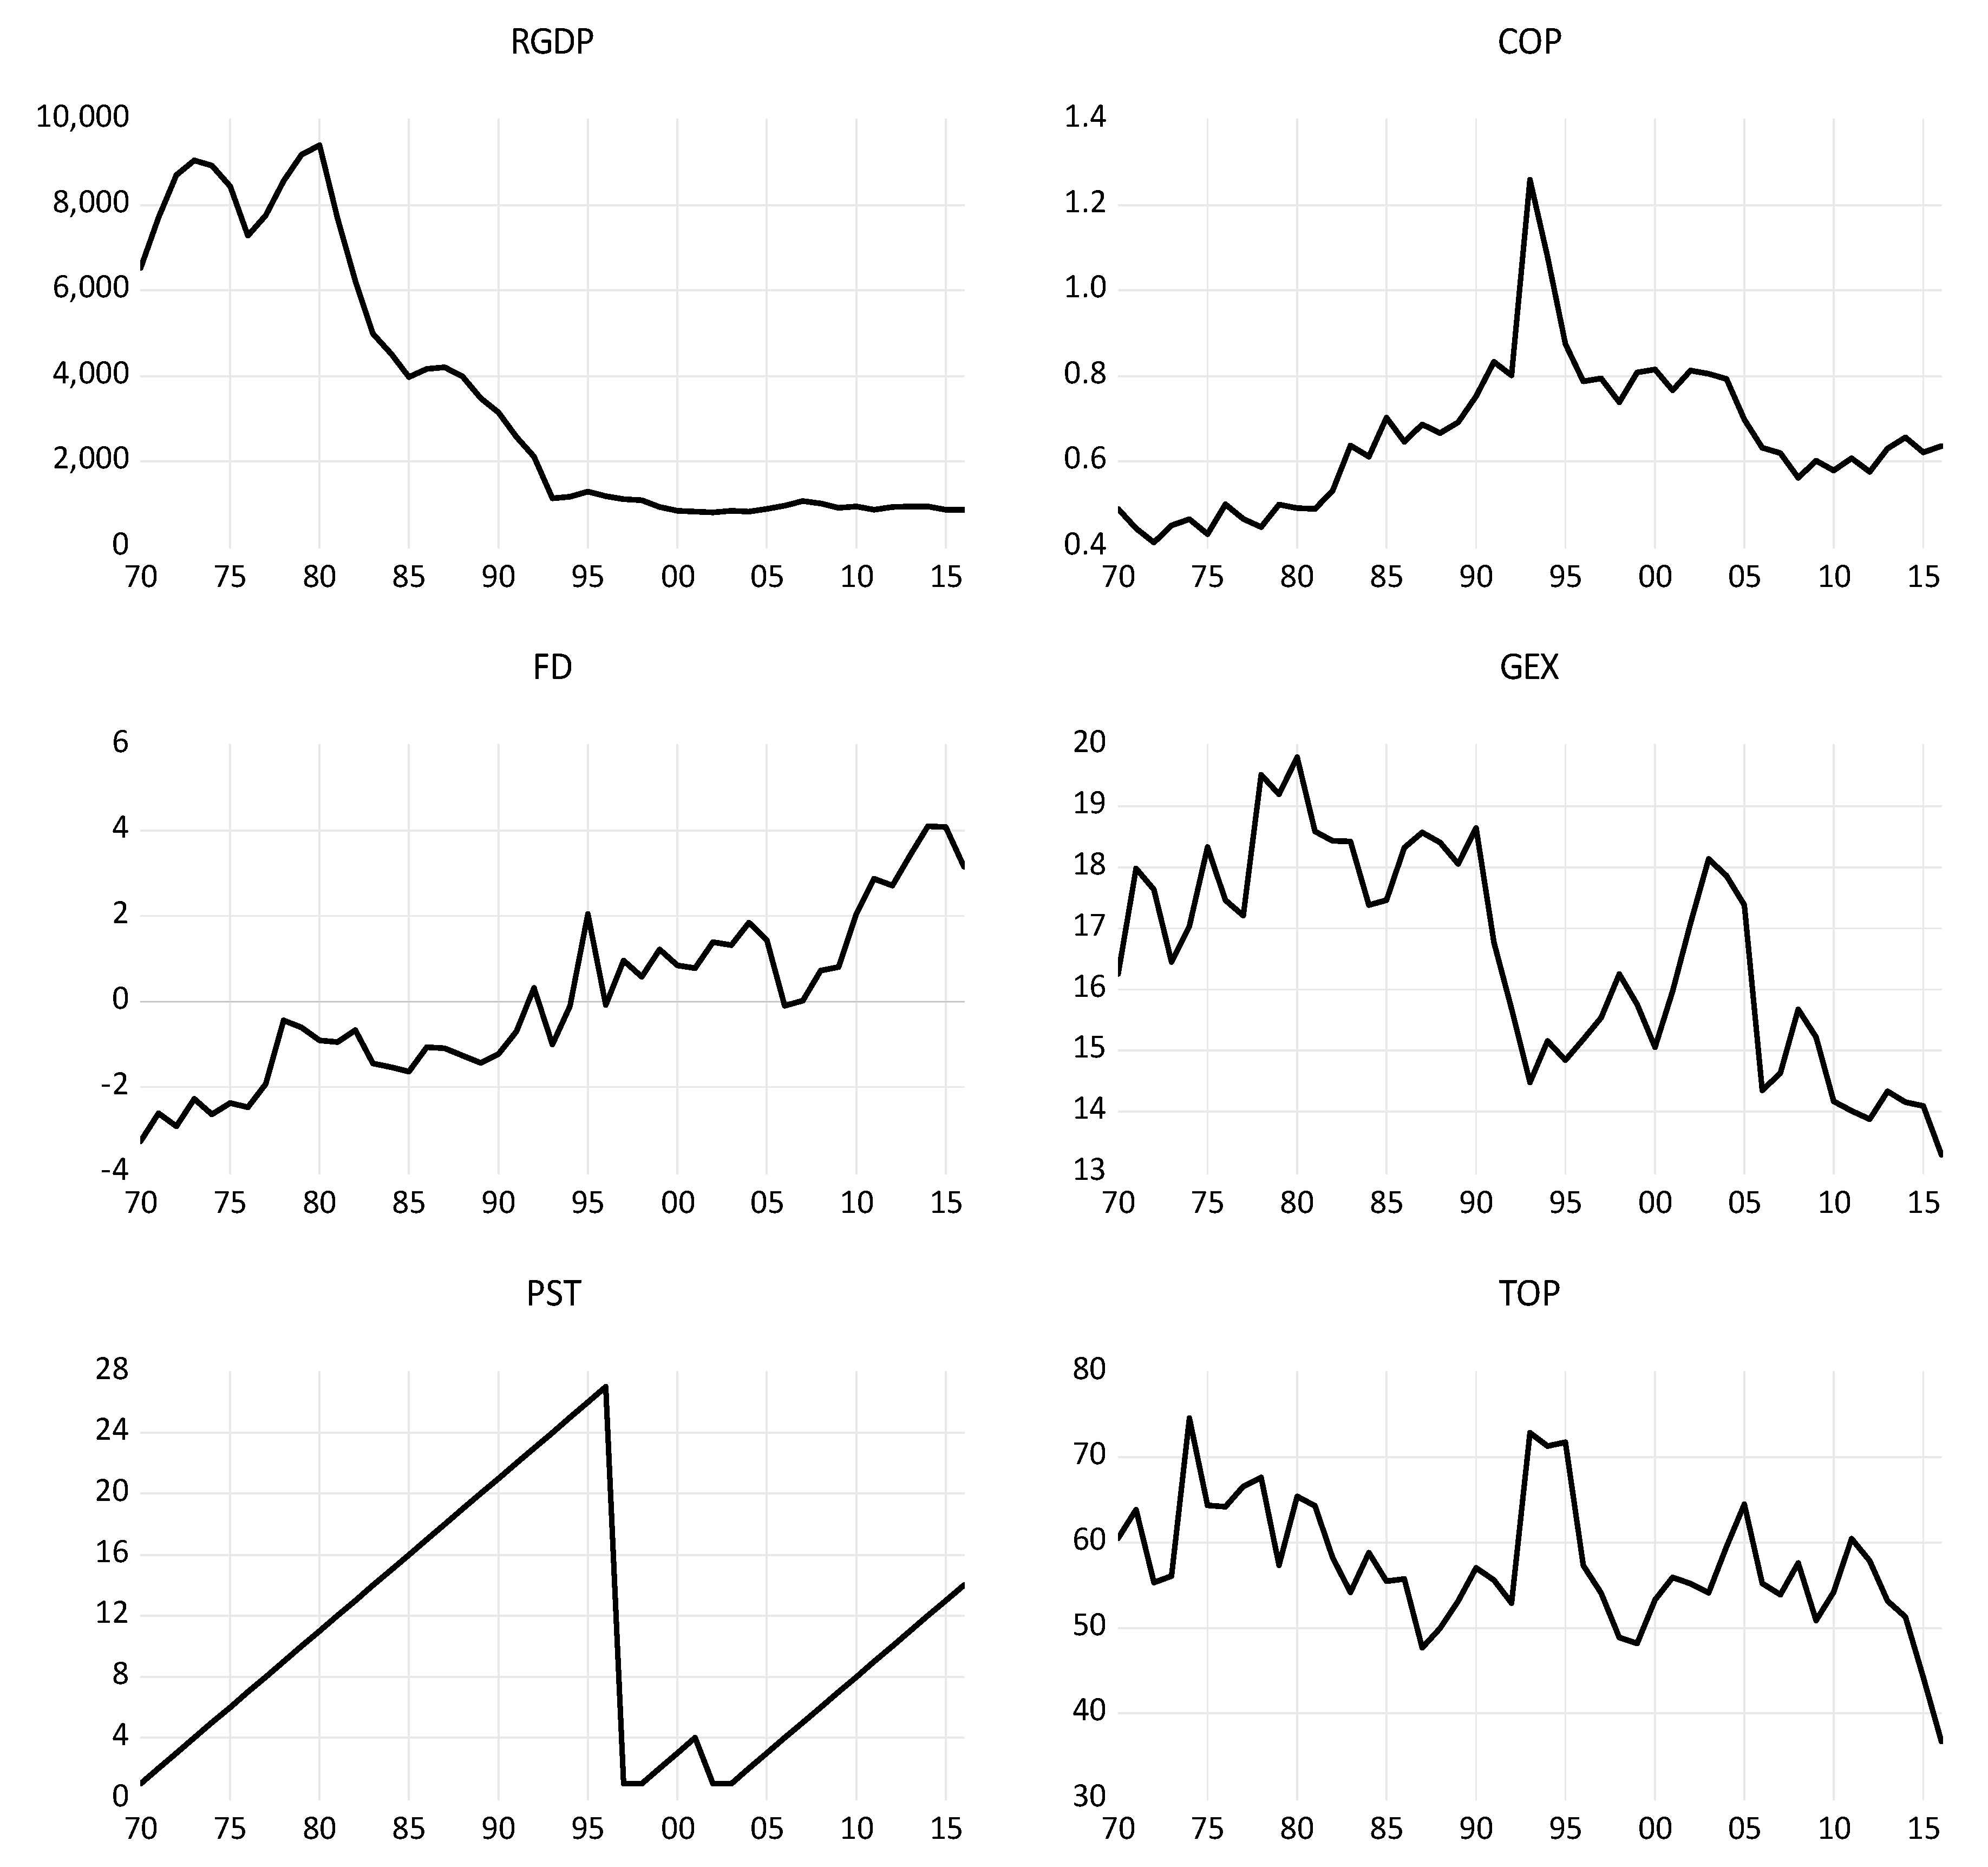
3. Data and Model Specification
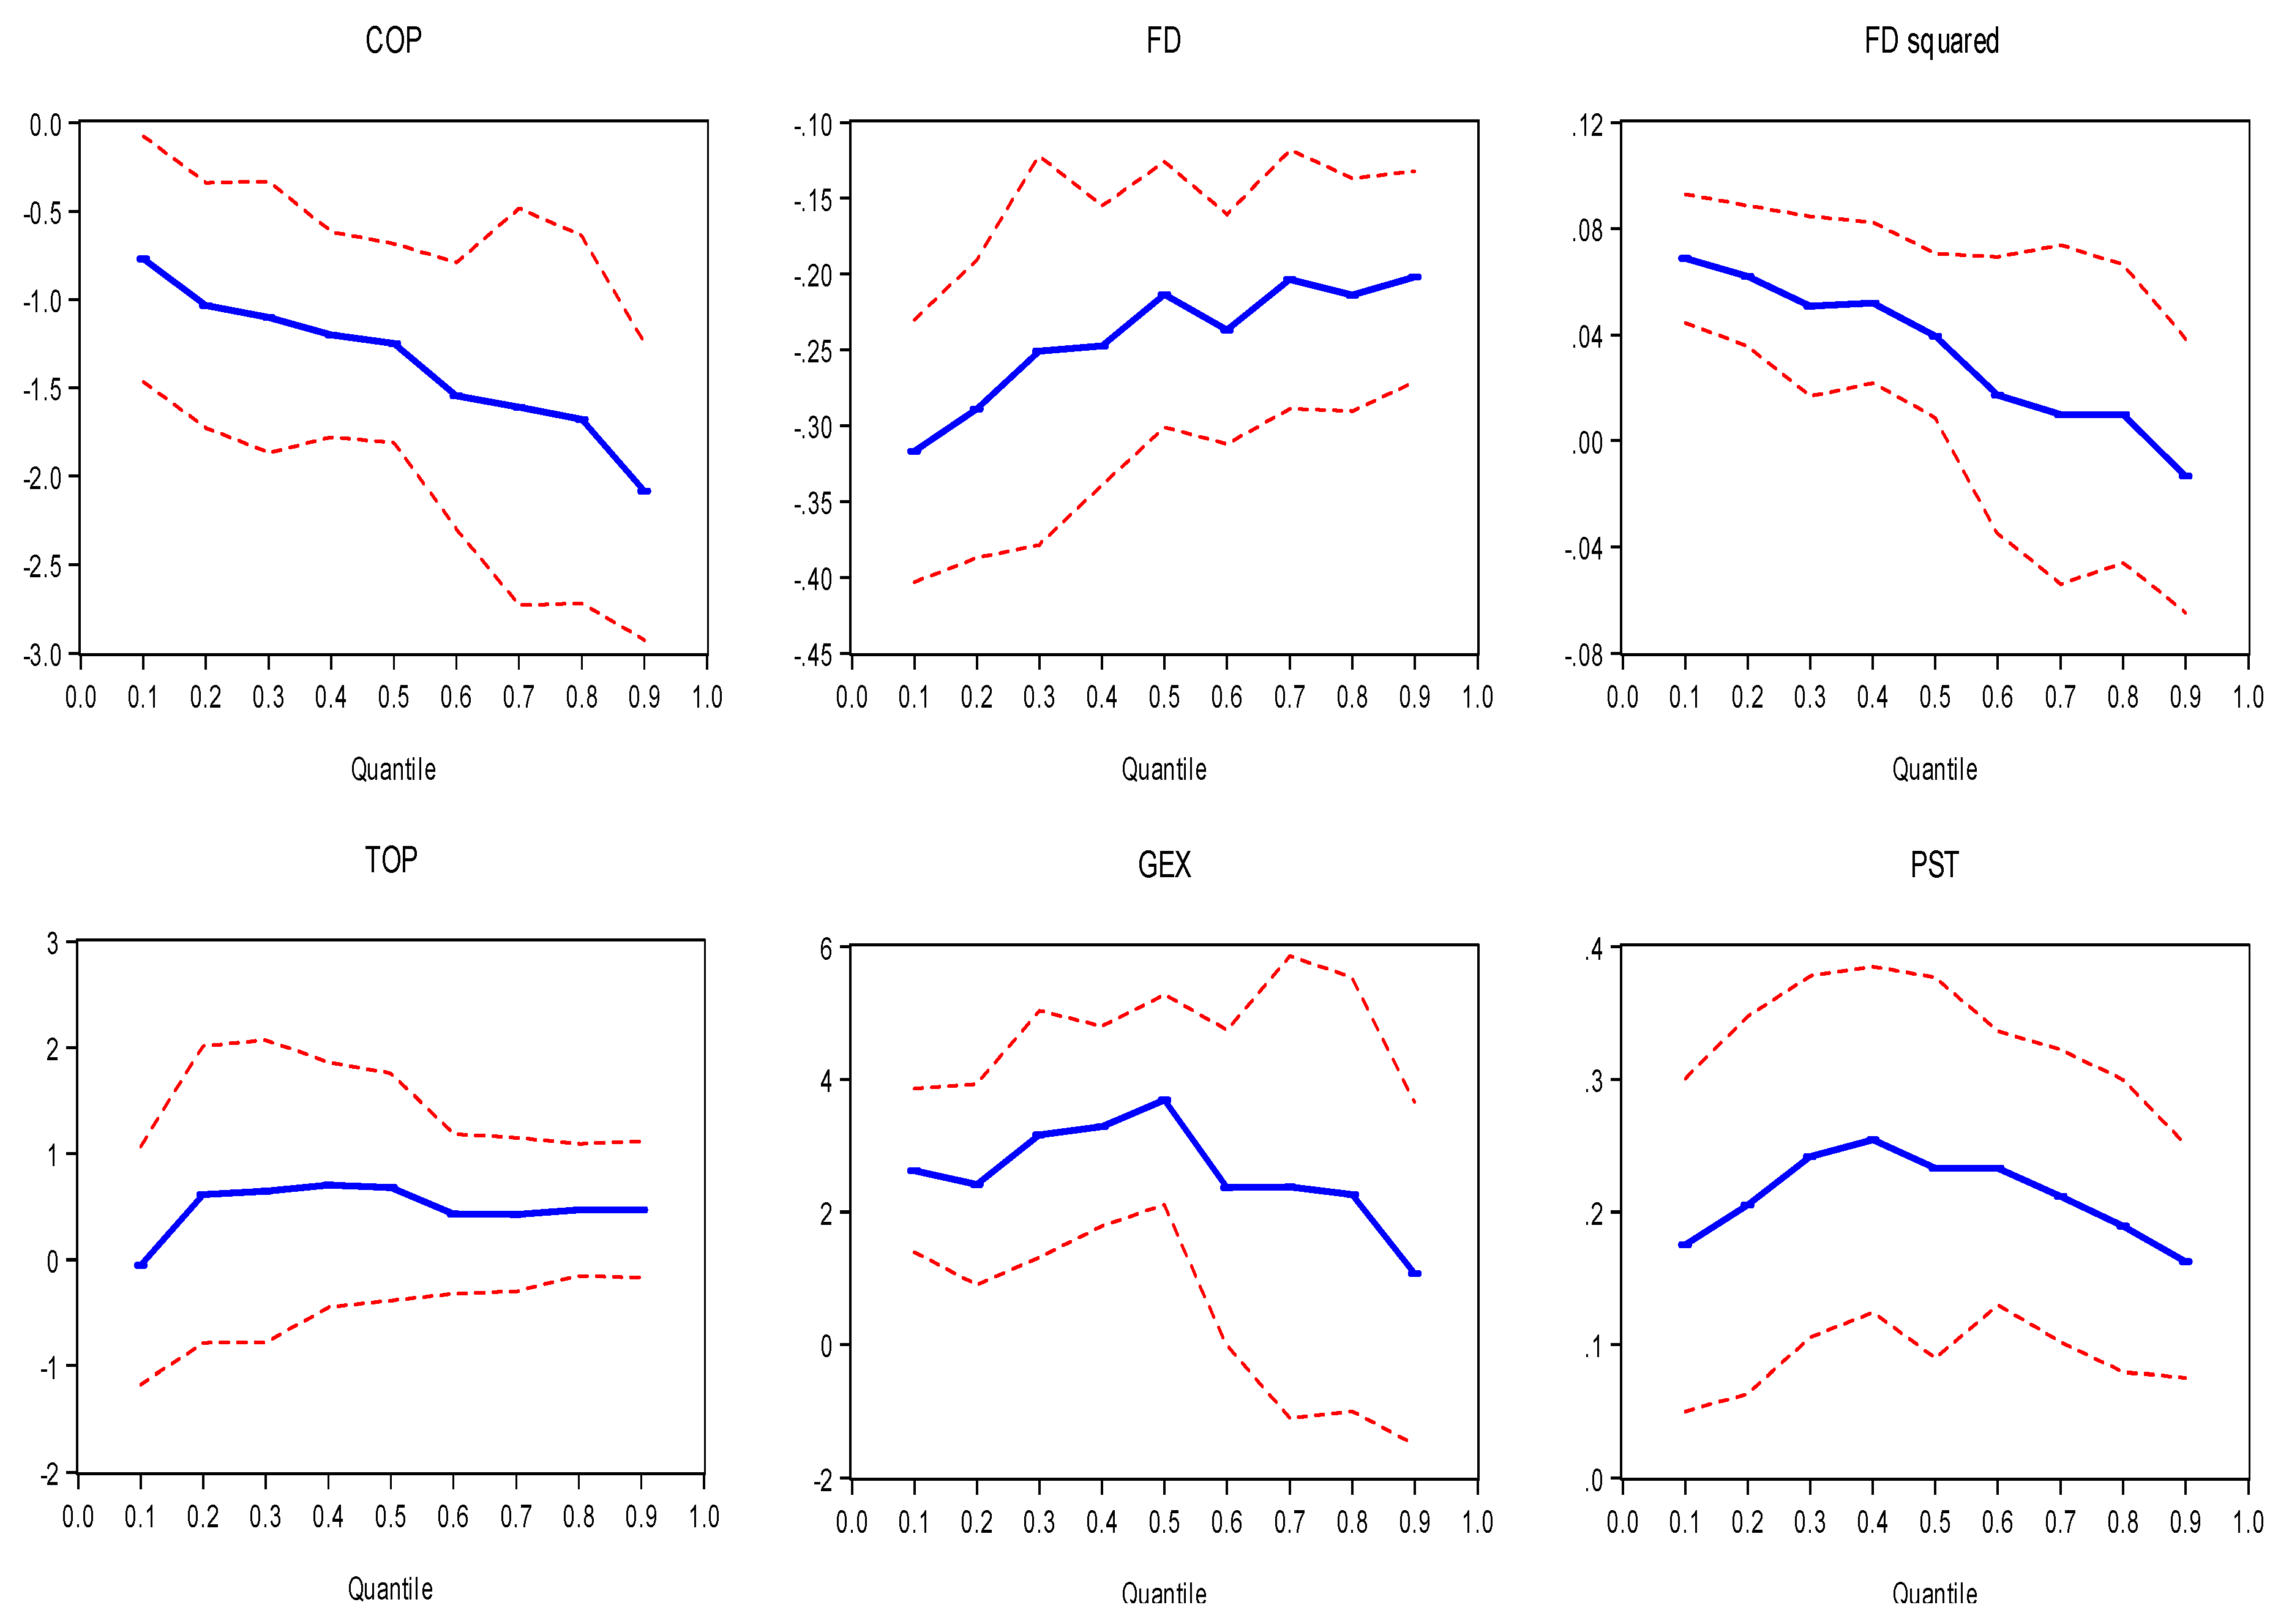
4. Empirical Results
5. Concluding Remarks
Author Contributions
Funding
Acknowledgments
Conflicts of Interest
References
- Bhattacharyya, S.C. Electrification Experiences from Sub-Saharan Africa; Springer: London, UK, 2013. [Google Scholar]
- Ibrahim, S. Financial Integration—Growth Nexus: A quantile regression analysis. J. Econ. Integr. 2016, 31, 531–546. [Google Scholar] [CrossRef] [Green Version]
- Fowowe, B. Financial liberalization in Sub-Saharan Africa: What do we know? J. Econ. Surv. 2013, 27, 1–37. [Google Scholar] [CrossRef]
- Mwega, F.M. Financial regulation in Kenya: Balancing inclusive growth with financial stability. ODI Work. Discuss. Pap. 2014. [Google Scholar] [CrossRef]
- Lane, P.; Milesi-Ferretti, G.M. Global Imbalances and External Adjustment after the Crisis; International Monetary Fund: Washington, DC, USA, 2014; Volume 14, pp. 1–45. [Google Scholar] [CrossRef] [Green Version]
- Onoh, J.O.; Okore, O.A. The impact of capital account liberalisation on economic growth in Nigeria. Eur. J. Bus. Manag. 2016, 5, 34–40. [Google Scholar]
- Omoruyi, S. Capital account liberalisation: The way forward for Nigeria. CBN Econ. Financ. Rev. 2006, 44, 185–201. [Google Scholar]
- Ahmed, A.D. Integration of financial markets, financial development and growth: Is Africa different? J. Int. Financ. Mark. Inst. Money 2016, 42, 43–59. [Google Scholar] [CrossRef]
- Gourinchas, P.O.; Jeanne, O. Capital flows to developing countries: The allocation puzzle. Rev. Econ. Stud. 2013, 80, 1484–1515. [Google Scholar] [CrossRef]
- Gehringer, A. Production economics uneven effects of financial liberalization on productivity growth in the EU: Evidence from a dynamic panel investigation. Int. J. Prod. Econ. 2015, 159, 334–346. [Google Scholar] [CrossRef]
- Bekaert, C.; Harvey, R.; Lundband, C. Does Financial Liberalization Spur Growth? J. Financ. Econ. 2005, 77, 3–55. [Google Scholar] [CrossRef] [Green Version]
- Hye, Q.M.; Wizarat, S. Impact of financial liberalization on economic growth: A case study of Pakistan. Asia Econ. Financ. Rev. 2013, 3, 270–282. [Google Scholar]
- Ahmed, A.D.; Mmolainyane, K.K. Financial integration, capital market development and economic performance: Empirical evidence from Botswana. Econ. Model. 2014, 42, 1–14. [Google Scholar] [CrossRef]
- Berthelemy, J.C.; Demurger, S. Foreign direct investment and economic growth: Theory and application to China. Rev. Dev. Econ. 2000, 4, 140–155. [Google Scholar] [CrossRef]
- Alfaro, L.; Chanda, A.; Sebnem, K.O.; Sayek, S. FDI and economic growth: The role of local financial markets. J. Int. Econ. 2004, 64, 89–112. [Google Scholar] [CrossRef]
- Prasad, E.; Rogoff, K.; Wei, S.J.; Kose, M.A. Effects of financial globalisation on developing countries: Some Empirical evidence. Econ. Political Wkly. 2003, 38, 4319–4330. [Google Scholar]
- Bussiere, M.; Fratzscher, M. Financial openness and growth: Short-run gain, long-run pain? Rev. Int. Econ. 2008, 16, 69–95. [Google Scholar] [CrossRef]
- Rajan, R.; Zingales, L. The great reversals: The politics of financial development in the twentieth century. J. Financ. Econ. 2003, 69, 5–50. [Google Scholar] [CrossRef]
- Onanuga, O.T. Do financial and trade openness lead to financial sector development in Nigeria? Zagreb Int. Rev. Econ. Bus. 2016, 19, 57–68. [Google Scholar] [CrossRef] [Green Version]
- Mubi, S.F. Capital Flows, Trade Openness and Economic Growth Dynamics: New Empirical Evidence from Nigerian Economy; University of Johannesburg: Johannesburg, South Africa, 2012. [Google Scholar]
- Gossel, S.J.; Biekpe, N. Economic growth, trade and capital flows: A causal analysis of post-liberalised South Africa. J. Int. Trade Econ. Dev. 2014, 23, 815–836. [Google Scholar] [CrossRef]
- McKinnon, R.I. Money and Capital in Economic Development; Brookings Institution: Washington, DC, USA, 1973. [Google Scholar]
- Shaw, E.S. Financial Deepening in Economic Development; Oxford University Press: New York, NY, USA, 1973. [Google Scholar]
- Shen, C.H.; Lee, C.C.; Chen, S.W.; Xie, Z. Roles played by financial development in economic growth: Application of the flexible regression model. Empir. Econ. 2011, 41, 103–125. [Google Scholar] [CrossRef]
- Yang, G.; Liu, H. Financial development, interest rate liberalization, and macroeconomic volatility. Emerg. Mark. Financ. Trade 2016, 52, 991–1001. [Google Scholar] [CrossRef]
- Ibrahim, M.; Alagidede, P. Nonlinearities in financial development—Economic growth nexus: Evidence from sub-saharan Africa. Res. Int. Bus. Financ. 2017, 46, 95–104. [Google Scholar] [CrossRef]
- Adeniyi, O.; Oyinlola, A.; Omisakin, O.; Egwaikhide, F.O. Financial development and economic growth in Nigeria: Evidence from threshold modelling. Econ. Anal. Policy 2015, 47, 11–21. [Google Scholar] [CrossRef]
- Ashraf, B.N. Do trade and financial openness matter for financial development? Bank-level evidence from emerging market economies. Res. Int. Bus. Financ. 2018, 44, 434–458. [Google Scholar] [CrossRef]
- Redmond, T.; Nasir, M.A. Role of natural resource abundance, international trade and financial development in the economic development of selected countries. Resour. Policy 2020, 66. [Google Scholar] [CrossRef]
- Atil, A.; Nawaz, K.; Lahiani, A.; Roubaud, D. Are natural resources a blessing or a curse for financial development in Pakistan? The importance of oil prices, economic growth and economic globalization. Resour. Policy 2020, 67. [Google Scholar] [CrossRef]
- Law, S.; Azmani-Saini, W.; Ibrahim, M. Institutional quality thresholds and the finance-growth nexus. J. Bank. Financ. 2013, 37, 5373–5381. [Google Scholar] [CrossRef]
- Slesman, L.; Baharumshah, A.Z.; Azman-saini, W.N.W. Political institutions and finance-growth nexus in emerging markets and developing countries: A tale of one threshold. Q. Rev. Econ. Financ. 2019, 72, 80–100. [Google Scholar] [CrossRef]
- Mercado, R.V. Capital flow transitions: Domestic factors and episodes of gross capital inflows. Emerg. Mark. Rev. 2019, 38, 251–264. [Google Scholar] [CrossRef]
- World Development Indicator. Available online: https://www.worldbank.org (accessed on 10 November 2019).
- Center for Systemic Peace. Available online: https://www.systemicpeace.org/ (accessed on 10 November 2019).
- Marshall, M.G.; Gurr, T.R.; Jaggers, K. Polity IV Project Dataset Users’ Manual. 2016. Available online: https://www.systemicpeace.org/inscr/p4manualv2016.pdf (accessed on 30 June 2019).
- Law, S.H.; Tan, H.B.; Azman-Saini, W.N.W. Globalisation, institutional reforms and financial development in East Asian economies. World Econ. 2015, 38, 379–398. [Google Scholar] [CrossRef]
- Law, S.H.; Tan, H.B. Financial development and income inequality at different levels of institutional quality. Emerg. Mark. Financ. Trade 2014, 50, 21–33. [Google Scholar] [CrossRef]
- Dickey, D.A.; Fuller, W.A. Distribution of the estimators for autoregressive time series with a unit root. J. Am. Stat. Assoc. 1979, 74, 427–431. [Google Scholar]
- Phillips, P.C.B.; Perron, P. Testing for a unit root in time series regression. Biometrika 1988, 75, 335–346. [Google Scholar] [CrossRef]
- Perron, P. The great crash, the oil price shock and the unit root hypothesis. Econometrica 1989, 57, 1361–1401. [Google Scholar] [CrossRef]
- Stock, J.H.; Watson, M. A simple estimator of cointegration vectors in higher order integrated systems. Econometrica 1993, 61, 783–820. [Google Scholar] [CrossRef]
- Phillips, P.C.B.; Hansen, B. Statistical inference in instrumental variables regressions with I (1) processes. Rev. Econ. Stud. 1990, 57, 99–125. [Google Scholar] [CrossRef]
- Bayer, C.; Hanck, C. Combining non-cointegration tests. J. Time Ser. Anal. 2013, 34, 83–95. [Google Scholar] [CrossRef]
- Johansen, S.A. Statistical analysis of cointegration for I (2) variables. Econom. Theory 1995, 11, 25–59. [Google Scholar] [CrossRef]
- Polat, A.; Shahbaz, M.; Rehman, I.U.; Satti, S.L. Revisiting linkages between financial development, trade openness and economic growth in South Africa: Fresh evidence from combined cointegration test. Qual. Quant. 2014, 49, 785–803. [Google Scholar] [CrossRef] [Green Version]
- Rafindadi, A.A. Does the need for economic growth influence energy consumption and CO2 emissions in Nigeria? Evidence from the innovation accounting test. Renew. Sustain. Energy Rev. 2016, 62, 1209–1225. [Google Scholar] [CrossRef]
- Bekun, F.V.; Emir, F.; Sarkodie, S.A. Another look at the relationship between energy consumption, carbon dioxide emissions and economic growth in South Africa. Sci. Total Environ. 2019, 655, 759–765. [Google Scholar] [CrossRef] [PubMed]
- Engle, R.F.; Granger, C.W. Co-integration and error correction: Representation, estimation and testing. Econometrica 1987, 55, 251–276. [Google Scholar] [CrossRef]
- Johansen, S. Estimation and hypothesis testing of cointegration vectors in gaussian vector autoregressive models. Econometrica 1991, 59, 1551–1580. [Google Scholar] [CrossRef]
- Boswijk, P.H. Testing for an unstable root in conditional and structural error correction models. J. Econom. 1994, 63, 37–60. [Google Scholar] [CrossRef]
- Banerjee, A.; Dolado, J.; Mestre, R. Error-correction mechanism tests for cointegration in a single-equation framework. J. Time Ser. Anal. 1998, 19, 267–283. [Google Scholar] [CrossRef] [Green Version]
- Koenker, R.; Xiao, Z. Unit root quantile autoregression inference. J. Am. Stat. Assoc. 2004, 99, 775–787. [Google Scholar] [CrossRef] [Green Version]
- Bolat, S.; Tiwari, A.K.; Kyophilavong, P. Testing the inflation rates in MENA countries: Evidence from quantile regression approach and seasonal unit root test. Res. Int. Bus. Financ. 2017, 42, 1089–1095. [Google Scholar] [CrossRef]
- Lin, B.; Benjamin, N.I. Influencing factors on carbon emissions in China transport industry: A new evidence from quantile regression analysis. J. Clean. Prod. 2017, 150, 175–187. [Google Scholar] [CrossRef]
- Uddin, G.S.; Sjö, B.; Shahbaz, M. The causal nexus between financial development and economic growth in Kenya. Econ. Model. 2013, 35, 701–707. [Google Scholar] [CrossRef] [Green Version]

| Period | GDP Per Capita Growth (Annual %) | Domestic Credit (% GDP) | Foreign Direct Investment (% GDP) | Gross Domestic Savings (% GDP) | Gross Capital Formation (% GDP) | Total Trade (% GDP) |
|---|---|---|---|---|---|---|
| 1970–1979 | 3.265 | 17.926 | 0.8167 | 20.202 | 23.223 | 63.035 |
| 1980–1989 | 0.412 | 19.677 | 0.424 | 19.308 | 23.171 | 56.290 |
| 1990–1999 | −0.822 | 22.069 | 0.605 | 14.417 | 18.314 | 58.988 |
| 2000–2009 | 0.774 | 25.056 | 0.513 | 7.147 | 18.047 | 56.009 |
| 2010–2016 | 3.271 | 31.431 | 1.649 | 7.127 | 20.897 | 51.247 |
| Variables | Description | Data Sources |
|---|---|---|
| RGDP | Represents the real GDP per capita measures in US currency at the 2010 constant basic price after taking the deflator effects. | World Development Indicators (WDI) |
| COP | Represents the capital account openness which is measured in US currency. It is the sum of total foreign assets and total foreign liabilities (% of GDP). | External Wealth of Nations Mark II Database. |
| FD | Represents the financial development index measured using the Principle Component Analysis (PCA) that includes the broad money, domestic credit to the private sector, domestic credit to the private sector by banks, and domestic credit provided by the financial sector (all as a % of GDP). | World Development Indicators (WDI) |
| TOP | It is indicating the total countries volume of export and import as measured in US currency (% of GDP). | World Development Indicators (WDI) |
| GEX | Represents the total government expenditure on final goods and services, excluding military expenditure (% of GDP). | World Development Indicators (WDI) |
| PST | Represents the stability of political institutions of the country measured using a specific formulation. | Centre for Systemic Peace |
| Variables | RGDP | COP | FD | TOP | GEX | PST |
|---|---|---|---|---|---|---|
| Mean | 7.740 | −0.450 | −0.001 | 4.043 | 2.801 | 1.977 |
| Median | 7.170 | −0.452 | −0.105 | 4.024 | 2.820 | 2.197 |
| Maximum | 9.148 | 0.230 | 4.102 | 4.312 | 2.986 | 3.296 |
| Minimum | 6.698 | −0.891 | −3.263 | 3.604 | 2.587 | 0.000 |
| Std. Dev. | 0.952 | 0.246 | 1.900 | 0.133 | 0.108 | 0.997 |
| JB (p-values) | 0.051 | 0.743 | 0.383 | 0.079 | 0.216 | 0.125 |
| Variables | At Level | At First Difference | ||||
|---|---|---|---|---|---|---|
| ADF | PP | Perron | ADF | PP | Perron | |
| RGDP | −1.144 | −1.571 | −3.164 (TB: 2004) | −4.714 * | −4.672 * | −7.634 * (TB: 1993) |
| COP | −1.563 | −1.465 | −3.350 (TB: 2004) | −7.813 * | −7.813 * | −10.888 * (TB: 1993) |
| FD | −1.435 | −1.212 | −4.602 (TB: 2009) | −8.562 * | −8.842 * | −9.828 * (TB: 1995) |
| TOP | −2.936 | −2.936 | −3.651 (TB: 1992) | −7.205 * | −7.307 * | −7.644 * (TB: 1993) |
| GEX | −3.083 | −3.076 | −3.541 (TB: 1990) | −6.550 * | −8.170 * | −7.550 * (TB: 2006) |
| PST | −2.548 | −2.565 | −2.874 (TB: 2006) | −6.149 * | −6.184 * | −8.057 * (TB: 1997) |
| Variables | Lower Quantile | Middle Quantile | Upper Quantile | |
|---|---|---|---|---|
| Panel 1: RGDP | ||||
| −0.101 ** (0.050) | −0.015 (0.399) | 0.024 (0.376) | 0.094 (0.192) | |
| 0.980 (0.353) | 0.985 (0.394) | 0.977 (0.344) | 0.997 (0.487) | |
| −0.392 (0.600) | −0.601 (0.570) | −1.077 (0.430) | −0.339 (0.560) | |
| QKS test | 1.405 [4.658] | |||
| Panel 2: COP | ||||
| −0.077 * (0.001) | 0.011 (0.371) | 0.045 *** (0.079) | 0.113 ** (0.021) | |
| 0.845 ** (0.048) | 0.884 (0.158) | 0.854 (0.101) | 0.884 (0.288) | |
| −2.265 ** −(0.050) | −1.625 (0.270) | −2.228 ** (0.040) | −0.428 (0.610) | |
| QKS test | 2.337 [4.658] | |||
| Panel 3: FD | ||||
| −0.413 (0.134) | 0.163 (0.285) | 0.539 ** (0.023) | 0.981 ** (0.015) | |
| 0.874 (0.157) | 1.016 (0.440) | 1.008 (0.471) | 0.933 (0.373) | |
| −1.349 (0.160) | 0.195 (0.980) | 0.084 (0.950) | −0.377 (0.700) | |
| QKS test | 2.458 [4.101] | |||
| Panel 4: TOP | ||||
| −0.085 * (0.000) | −0.021 (0.221) | 0.050 * (0.008) | 0.090 ** (0.046) | |
| 0.537 * (0.000) | 0.614 * (0.004) | 0.707 ** (0.011) | 0.627 (0.105) | |
| −2.365 ** (0.040) | −2.337 *** (0.090) | −1.422 (0.320) | −0.892 (0.370) | |
| QKS test | 2.401 [4.120] | |||
| Panel 5: GEX | ||||
| −0.045 * (0.003) | −0.009 (0.257) | 0.013 (0.152) | 0.052 * (0.000) | |
| 0.872 (0.163) | 0.976 (0.413) | 0.889 (0.164) | 0.888 (0.161) | |
| −0.857 (0.390) | −0.206 (0.830) | −1.143 (0.409) | −0.678 (0.410) | |
| QKS test | 1.581 [5.342] | |||
| Panel 6: PST | ||||
| 0.115 ** (0.041) | 0.150 * (0.000) | 0.200 * (0.000) | 0.287 * (0.000) | |
| 0.931 *** (0.098) | 0.877 * (0.000) | 0.840 * (0.000) | 0.795 * (0.000) | |
| −0.177 (0.190) | −10.420 * (0.000) | −7.553 * (0.000) | −9.234 * (0.000) | |
| QKS test | 10.420 [4.116] | |||
| Variables | Long-Run Estimates | ||
|---|---|---|---|
| OLS | FMOLS | DOLS | |
| COP | −1.323 * (0.000) | −1.384 * (0.000) | −1.578 * (0.000) |
| FD | −0.247 * (0.000) | −0.252 * (0.000) | −0.226 * (0.000) |
| FD2 | 0.038 *** (0.073) | 0.041 * (0.004) | 0.043 ** (0.048) |
| TOP | 0.310 (0.325) | 0.503 (0.136) | 0.807 (0.206) |
| GEX | 3.122 * (0.000) | 2.999 * (0.000) | 2.892 * (0.006) |
| PST | 0.213 * (0.000) | 0.212 * (0.000) | 0.205 ** (0.015) |
| Estimated Models | EG-JOH | EG-JOH-BO-BDM | Decision |
|---|---|---|---|
| 55.384 * | 70.781 * | Yes | |
| 55.310 * | 110.595 * | Yes | |
| 56.116 * | 76.142 * | Yes | |
| 56.922 * | 112.185 * | Yes | |
| 55.670 * | 112.459 * | Yes | |
| 55.349 * | 71.000 * | Yes | |
| Significant level | Critical values | ||
| 1% | 15.701 | 29.85 | |
| 5% | 10.419 | 19.888 | |
| 10% | 8.242 | 15.804 | |
| Variables | Quantile Bootstraps Estimation | ||||
|---|---|---|---|---|---|
| COP | −0.774 * (0.035) | −1.113 * (0.005) | −1.249 * (0.000) | −1.616 * (0.004) | −2.084 * (0.000) |
| FD | −0.317 * (0.000) | −0.282 * (0.000) | −0.214 * (0.000) | −0.209 * (0.000) | −0.202 * (0.000) |
| FD2 | 0.069 * (0.000) | 0.061 * (0.000) | 0.039 ** (0.017) | 0.011 (0.715) | −0.013 (0.633) |
| TOP | −0.055 (0.924) | 0.761 (0.302) | 0.681 (0.220) | 0.418 (0.219) | 0.468 (0.161) |
| GEX | 2.621 * (0.000) | 2.437 * (0.006) | 3.691 * (0.000) | 2.360 (0.164) | 1.076 (0.420) |
| PST | 0.175 * (0.009) | 0.213 * (0.009) | 0.233 * (0.003) | 0.210 * (0.000) | 0.163 * (0.001) |
| Pseudo R2 | 0.699 | 0.727 | 0.793 | 0.783 | 0.747 |
| Sparsity | 1.006 | 0.800 | 0.724 | 0.762 | 1.023 |
| Prob. (Quasi-LR) | 0.000 | 0.000 | 0.000 | 0.000 | 0.000 |
| Variables | Quantile Bootstraps Estimation | ||||
|---|---|---|---|---|---|
| COP | −0.788 (0.175) | −1.695 * (0.000) | −1.483 * (0.000) | −1.294 * (0.001) | −1.454 * (0.003) |
| FD | 3.017 * (0.015) | 1.079 ** (0.034) | 0.841 (0.221) | 0.735 (0.324) | 0.053 (0.957) |
| TOP | 0.510 (0.570) | 0.530 (0.135) | 0.440 (0.345) | 0.520 (0.171) | 0.598 (0.126) |
| GEX | 3.556 * (0.007) | 3.038 * (0.000) | 3.352 * (0.000) | 2.915 ** (0.013) | 2.001 (0.117) |
| PST | 0.254 (0.140) | 0.433 * (0.000) | 0.320 * (0.000) | 0.220 * (0.003) | 0.178 * (0.019) |
| (FD × COP) | 0.333 (0.560) | 0.430 * (0.009) | 0.338 (0.136) | 0.245 (0.177) | 0.365 (0.247) |
| (FD × TOP) | −0.767 * (0.036) | −0.259 ** (0.050) | −0.209 (0.240) | −0.203 (0.235) | −0.023 (0.915) |
| Pseudo R2 | 0.644 | 0.701 | 0.803 | 0.795 | 0.750 |
| Sparsity | 1.312 | 0.612 | 0.664 | 0.729 | 1.111 |
| Prob. (Quasi-LR) | 0.000 | 0.000 | 0.000 | 0.000 | 0.000 |
© 2020 by the authors. Licensee MDPI, Basel, Switzerland. This article is an open access article distributed under the terms and conditions of the Creative Commons Attribution (CC BY) license (http://creativecommons.org/licenses/by/4.0/).
Share and Cite
Yakubu, Z.; Loganathan, N.; Mursitama, T.N.; Mardani, A.; Khan, S.A.R.; Hassan, A.A.G. Financial Liberalisation, Political Stability, and Economic Determinants of Real Economic Growth in Kenya. Energies 2020, 13, 3426. https://doi.org/10.3390/en13133426
Yakubu Z, Loganathan N, Mursitama TN, Mardani A, Khan SAR, Hassan AAG. Financial Liberalisation, Political Stability, and Economic Determinants of Real Economic Growth in Kenya. Energies. 2020; 13(13):3426. https://doi.org/10.3390/en13133426
Chicago/Turabian StyleYakubu, Zakaria, Nanthakumar Loganathan, Tirta Nugraha Mursitama, Abbas Mardani, Syed Abdul Rehman Khan, and Asan Ali Golam Hassan. 2020. "Financial Liberalisation, Political Stability, and Economic Determinants of Real Economic Growth in Kenya" Energies 13, no. 13: 3426. https://doi.org/10.3390/en13133426