Article

Electrical Generation of a Ground-Level Solar Thermoelectric Generator: Experimental Tests and One-Year Cycle Simulation

Department of Mechanical Engineering and Industrial Construction, University of Girona, c/Universitat de Girona 4, 17003 Girona, Spain
*
Authors to whom correspondence should be addressed.
Energies 2020, 13(13), 3407; https://doi.org/10.3390/en13133407
Submission received: 7 June 2020 / Revised: 25 June 2020 / Accepted: 30 June 2020 / Published: 2 July 2020
(This article belongs to the Special Issue Solar Thermoelectric Generators)

Abstract

:
Solar thermoelectric generators (STEGs) are a promising technology to harvest energy for off-grid applications. A wide variety of STEG designs have been proposed with the aim of providing non-intermittent electrical generation. Here, we designed and tested a STEG 0.5 m long formed by nine commercial thermoelectric generator modules and located at ground level. Data were used to validate a numerical model that was employed to simulate a one-year cycle. Results confirmed the very high variability of energy generation during daylight time due to weather conditions. By contrast, energy generation during night was almost independent of atmospheric conditions. Annual variations of nighttime energy generation followed the trend of the daily averaged soil temperature at the bottom of the device. Nighttime electrical energy generation was 5.4 times smaller than the diurnal one in yearly averaged values. Mean energy generation values per day were 587 J d−1 (daylight time) and 110 J d−1 (nighttime). Total annual energy generation was 255 kJ. Mean electrical output power values during daylight and nighttime were 13.4 mW and 2.5 mW, respectively. Annual mean output power was 7.9 mW with a peak value of 79.8 mW.

1. Introduction

The development of Big Data and the Internet of Things (IoT) has increased the interest in technologies capable of harvesting energy from the environment in order to power devices, especially in remote locations. The aim is to avoid the need of using non-rechargeable batteries, which have disadvantages such as limited lifetime and periodic replacement.
Energy harvesting consists in the energy transformation of heat, light, sound, vibration, etc., into an electric current for instant use or stored for later usage. Energy harvesting arises as a key technology to power IoT sensor networks.
Many researchers have studied the way of extracting energy from the environment to produce this electrical generation. The most common energy sources used for energy harvesting are: mechanical and vibrational energy through piezoelectric materials [1], solar energy through photovoltaic materials [2] and thermal energy through thermoelectric materials [3]. Among them, thermoelectric generators (TEG) are advantageous because they can be used with a variety of heat sources: industrial waste heat streams [4], the human body [5], vehicle exhaust systems [6,7,8,9,10] or underground heat, for instance.
A thermoelectric generator is a circuit containing thermoelectric materials that directly generate electricity from heat. As shown in Figure 1, TEG consists of two dissimilar thermoelectric materials joined at their ends: a negative charge carrier (n-type), and a positive charge carrier (p-type). These semiconductors are electrically connected in series and thermally connected in parallel. Commercial TEGs are composed of a multiple number of thermocouples (a pair of n-type and p-type materials).
This kind of energy harvester requires of a heat flow to produce electrical energy. The open circuit voltage V O C   obtained by a TEG can be expressed as a function of the difference between the hot side temperature T H   and the cold side T C
V O C = α Δ T T E G
with Δ T T E G = T H T C and α = α p α n , where α p and α n are the Seebeck coefficients of the p-type and n-type semiconductor legs, respectively. Note that the voltage generated by the TEG is directly proportional to the temperature difference between its faces, V O C Δ T T E G . It is important to remark that in the case where we fix the position of the thermoelectric generator and change the direction of the heat flow, this voltage can be negative according to the Δ T T E G sign (in this case, the temperature formerly identified as T H   would correspond to that of the colder face, whereas the temperature formerly identified as T C   would be that of the hotter face).
Both the output power P T E G and the efficiency η T E G of a TEG follow [11],
P T E G = α 2 Δ T T E G 2 R L ( R + R L ) 2
η T E G = P T E G Q h
where R is the internal electrical resistance and R L is the external electrical load resistance (Figure 1). Note that Since P T E G is proportional to Δ T T E G 2 , the value of the temperature difference across the TEG is crucial to achieve high output power values. Producing the highest amount of energy is necessary to maintain TEGs under big temperature gradients as long as possible.
Solar TEGs (STEGs) use solar radiation as the main heat source. STEGs commonly apply two different concentration techniques: optical concentration with lenses as in the pioneering work of Telkes [12], and thermal concentration with solar-absorbing panels as in the innovative study of Kraemer et al. [13]. The latter technique has recently received much attention. Rad et al. [14] developed a very efficient STEG that included a selective black flat panel inside a vacuum chamber to prevent convective as well as air conductive losses. The flat panel acted as a thermal collector to increase the amount of heat absorber by the TEG. They numerically optimized the thermal concentration value for two distinct sites, predicting efficiency values above 3.5%. Note that the heat-absorbed Q h during daylight time in Equation (3) is the product of the concentration ratio of the concentrator, the value of solar irradiance, the solar selective absorber area, the absorptivity of the solar selective absorber and the optical efficiency of the concentrator (see ref. [11] for further details). Bellos and Tzivanidis [15] numerically found a mean annual efficiency value of 3.2% by using a similar device sited in Athens that used a concentration ratio equal to 1. They developed an economic analysis concluding the feasibility of installing a solar field (=100 m2) of STEGs. By using heat pipes in vacuum glasses exposed to the sun’s radiation, Lv et al. [16] reported a peak of 5.2% in the efficiency value, which is one of the highest values ever reached in a STEG working under real conditions. These previous results may suggest that this technology can also be of interest for microgrids that combine different energy systems. In this case, the system operation should take into account models with multi-type uncertainties [17] including distributed energy storage [18] and short-term operation constraints [19] in order to provide an optimized cost-effective solution.
Heat flow variability due to changing atmospheric conditions is an important issue in STEGs. The use of phase change materials (PCMs) to manage the thermal flow may partially solve this problem. Luo et al. [20] experimentally tested a STEG with different types of PCMs that regulated the hot side temperature. They found a remarkably stable behavior of the TEG temperature gradient when adding a PCM in the STEG assembly. In addition, PCMs are allowed into the system to provide energy for some hours after sunset. The optimization of the PCMs geometry was numerically studied by Shittu et al. [21] who drastically reduced the characteristic intermittency of the STEG power output. In addition, they found that PCMs may be very valuable to prevent damage of TEGs during high solar radiation events. Another potential damage to a STEG assembly is the thermal stress since different materials are continuously working under temperature cycles of high amplitude. Shittu et al. [11] carefully analyzed this effect in TEGs of single leg and of segmented legs under uniform and non-uniform heat fluxes. PCM materials can also be useful in STEGs working at much lower temperature gradients. Thus, Charris et al. [22] developed a prototype of an autonomous IoT sensor in which a PCM passively regulated the thermal flux. This STEG was able to recharge a battery with Δ T T E G   = 26 °C only [22].
The studies mentioned above mainly focused on the hot side of the STEG system. However, the design of the cold side is also an important issue, as Rad et al. [14] found when analyzing two different modes of heat dissipation (air vs. liquid). Very recently, Zhang et al. [23] investigated the consequences of using different passive strategies to cool a STEG, with the solar-driven thermosyphon effect of water being the most effective. However, there is another type of STEG design and the main feature is that it directly dissipates heat into the soil so as to have an almost constant temperature bath in one of TEG’s faces [24,25,26,27,28,29,30]. This allows it to absorb a non-negligible amount of heat from the soil during nighttime and, hence, to generate electricity at night.
Wang et al. [24] used a combination of TEG and a photovoltaic generator in which the thermoelectric generator had a heat pipe buried 2.5 m deep. The TEG part of the device was able to sustain almost 0.37 mW during night. Carvalhaes-Dias et al. [25] developed a flat black panel STEG with a buried heat sink. They obtained an important contribution to the total energy during the night when the heat flowed from the soil to the ambient air. Lawrence and Snyder [26] tested four different types of heat sinks buried in the soil (rods vs. fins), concluding that the starfish geometry (fins radially distributed) was the best. Stevens [27] studied the effect of using finned or unfinned heat exchangers in both soil and air regions. Results showed that the finned device produced 52% more energy than the unfinned one, with most of the generation (>75%) occurring during daylight time. Whalen and Dykhuizen [28] took advantage of the heating of the first soil layer by the sun’s radiation to design a subsurface STEG entirely buried 1 cm from the soil surface. The calculated output power clearly followed a diurnal temperature cycle, with peak power at noon being 5.5 times the peak at midnight.
However, some of the previous STEG designs are not optimal if installed in zones with low values of sun radiation, as in forest soils due to tree canopies. In this case, Huang et al. [29] developed a device with a heat exchanger at the atmospheric side composed of multiple fins. Heat mainly flowed from the soil to the ambient air, reaching power values on the order of mW. Much higher output power was obtained by Jiang et al. [30] when heat was extracted from asphalt pavement and dissipated into a liquid. Values reached 45 mW and 840 J/day with only three TEG modules. At night, however, production decreased substantially.
Table 1 summarizes the main features of these STEG devices that use the soil as a key thermal system. Note that several authors substituted the black flat panels with finned heat absorbers at the air side [26,27] to increase the surface area exposed to the sun’s radiation. However, these designs may suffer from convective cooling by ambient air unless low air speed values are enforced. STEGs are shown to provide a non-negligible energy during night as well (see, e.g., [25]). This is achieved by a high radiative cooling on the air side whereas the buried one remains at a higher temperature. Therefore, as pointed out in [25], the purpose of a STEG is to achieve a high value of 0 365 Δ T 2 d t all year round. Indeed, any application involving the use of TEGs needs to be accurately designed with the objective to maximize this parameter.
The present study aimed to analyze the one-year cycle behavior of a solar thermoelectric generator with multiple commercial TEGs whose upper face was at ground level (to minimize forced convection effects). The purpose of the STEG design was to keep the temperature of the bottom side of commercial TEGs as close as possible to the soil temperature so the TEG could experience higher temperature differences and produce electrical energy not only during daylight time but also during nighttime.
This concept had the disadvantage of generating positive and negative voltages depending on the time of the day since TEG’s upper side temperature could be higher or lower than soil temperature. During the day, with solar radiation warming the ambient air as well as the TEGs heat exchanger, heat flowed through the TEG device towards the soil. This meant T H > T C and consequently both the Δ T and the V O C were positive. Contrarily, during the night a strong radiative cooling occurred in the air heat exchanger region, leading a heat flow to move from the soil to the ambient air. Consequently, T H < T C (since T H and T C were assumed to be the temperatures in the upper and lower sides of the TEG, marked as hot and cold faces in normal operation, respectively) and both Δ T T E G and V O C became negative.
The best way to cope with this change in polarity is to use a bipolar DC-DC converter [31,32,33,34]. This can transform any voltage value, even negative, into an adequate tension for the load. For maximum energy harvesting the use of a DC-DC converter equipped with a maximum power point tracking system (MPPT) is also recommended [35]. The MPPT searches and matches the TEG maximum power point for any TEG temperature gradient. This system can store up to 98% of the energy generated by the TEG to a battery.
Thus, the objective of this work was to analyze the viability of a STEG system to generate energy all day long, not only during the daytime. Its performance, in terms of energy per day and year, was compared with other similar generators extracted from literature.
To carry out this study, (1) a STEG was designed, built and tested experimentally in a real environment during various days; (2) the gathered information from the experiment was used to develop and validate a numerical model; (3) the numerical model was used to obtain the yearly energy production, the average daily energy production, the temperature differences across the TEG and the power production.

2. Materials and Methods

2.1. Equipment and Experimental Setup

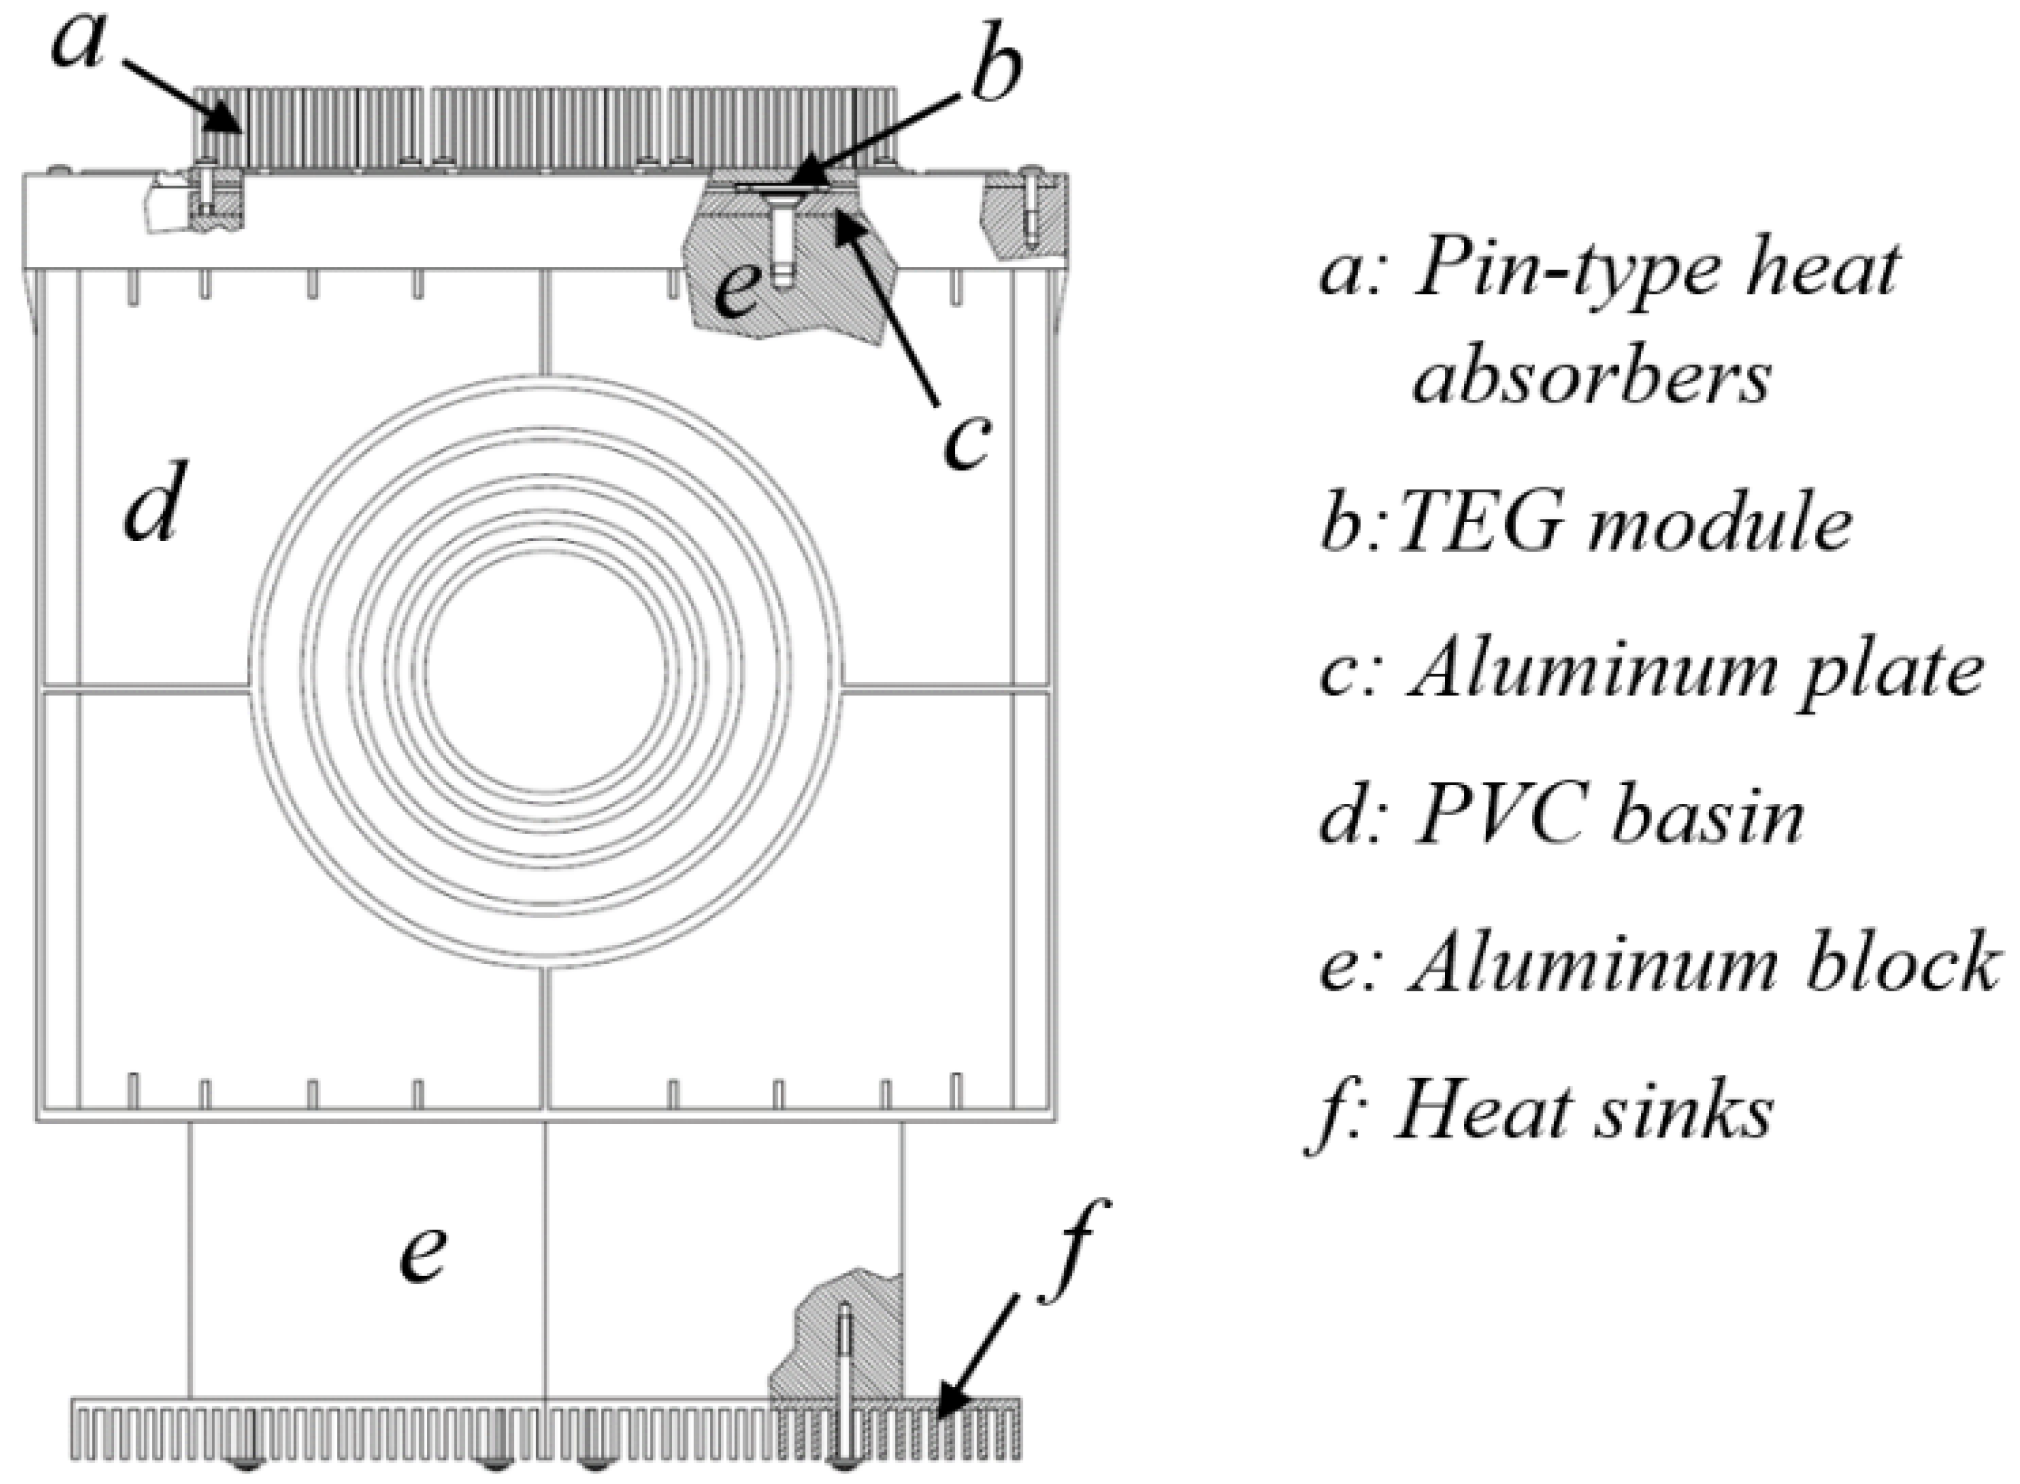
The STEG developed and tested in the present study is shown in Figure 2. It essentially consisted of an aluminum block 500 mm long and with a 300 × 300 mm2 section. Its high thermal conductivity (210 W m−1K−1) reduces losses. The bottom of this block was bolted to four heat sinks (Fischer Electronik SK42-200-SA) of 200 × 200 mm2 surface dimensions each. These heat sinks were in contact with the soil. The upper part of the block was bolted to an aluminum plate 10 mm thick and with a 300 × 300 mm2 section in which we had bolted nine TEGs (Crystal LTD H-19-14-06-L2) equally distributed in a 3 × 3 pattern. These commercial TEG modules had dimensions of 44 × 40 × 3.3 mm3. The semiconductor thermoelectric material was bismuth telluride. The maximum operational temperature was 200 °C with a maximum power production of 10.85 W and voltage of 4.5 V when Δ T T E G = 100 °C and T H = 150 °C. The efficiency at this point was 4.2%. The hot face of each one of these nine TEGs was in contact with a pin-type heat sink of 100 × 100 mm2 surface area with pins 40 mm high (ALPHA N100-40B). They were made of black anodized aluminum in order to maximize the heat transfer and to prevent corrosion. The pin-type was chosen to reduce shadows and to minimize the variation of these shadows during the sun’s path (in comparison with those obtained with finned-type heat sinks).
The design of the upper heat exchanger is critical in a reversible STEG. A large surface area leads to more absorbed solar radiation during daylight, which increases surface temperature and heat flux. However, it also enhances convection by ambient air, which cools the surface down. Although this effect is not desirable during day, at nighttime it increases the heat flux since the soil becomes the hot source. Nevertheless, enhancing convection may significantly reduce daylight performance and, therefore, we located the system at the ground level. This minimized wind speed values at the heat exchanger, thereby reducing forced convection. Natural convection, however, still existed.
Heat losses to the ground were also expected to occur, contributing in a substantial way in case the thermal block was in direct contact with the soil. These heat losses are significant if the depth is high and if the area in contact with the ground is also large. To minimize this effect, the thermal block was insulated by an air gap of 50 mm. This gap was achieved by installing a polyvinyl chloride (PVC) catch basin around the STEG that also protected it from water leaks in rainy periods.
Note that, in comparison with other studies shown in Table 1, the present one used a big thermal block and, therefore, a body with higher thermal inertia. This effect, in fact, was beneficial as it allowed the temperature of the surface of the soil to lag with that of the environment. This lag was expected to produce a higher thermal gradient.
Four K type thermocouples of 0.5 mm diameter (model 406–482, TC Direct) were installed to monitor the temperature behavior of the system. Two of them were inserted to measure both hot and cold side temperatures of the central TEG, a third one was located at the base of the aluminum heat block, and the last one to log the soil temperature at 0.5 m depth.
The data acquisition system consisted of a Compact RIO (National Instruments, Austin, USA) with temperature (NI 9211; uncertainty ± 0.6 °C) and voltage (NI 9215; uncertainty ± (8.53 mV + 0.2% of reading)) modules. The first one acquired data coming from the thermocouples, and the last one measured the open circuit voltage from the nine TEGs electrically connected in a series configuration. It is worth noting that we assume a smaller temperature uncertainty for the instruments used since we tested the thermocouples at room conditions in a similar procedure as that explained in [25], and temperature discrepancies between them were smaller than ±0.2 °C.
The experimental test was carried out in a plot inside the University of Girona campus (41°57′54″ latitude, 2°49′52″ longitude), see Figure 3. The plot is a flat spot covered with short grass, so there was neither vegetation nor nearby obstacles around that could interfere with sunlight. Note that electrical wiring was buried. Data were continuously recorded at varying intervals not greater than 15 min during almost eight days (from 24–31 July 2017).
Information regarding weather conditions was available through the weather station of the university campus [36] situated 175 m away from the site (the uncertainty of data was ±10 W m−2 for the global horizontal irradiance and ±0.1 °C for the air temperature). The selected location allowed a high solar radiation contribution, with about 2500 sunshine hours per year and a mean annual solar irradiance on the ground (horizontal) of 640 W m−2 (see Figure 4).

2.2. Soil Model.

The objective to obtain one-year period data with numerical simulation required the estimation of the soil temperature at a given depth since it was a boundary condition for the model. The soil surface temperature depends on the heating due to the absorption of solar radiation, the cooling due to the longwave radiation, the amount of convective exchange between the soil and the ambient air, the energy losses due to evaporation and the heat flowing through the soil layers. Empirical studies carried out in the literature show that ground temperature varies following both diurnal and annual oscillations [37].
The most common model employed to describe the soil temperature behavior is based on a one-dimensional approach of the unsteady heat transfer equation for a semi-infinite solid ( z 0 , with the surface at z = 0 , and z positive pointing downwards) [37]. The solution to this equation with constant soil thermal diffusivity, fixed temperature at z = ,
T ( , t ) = T a
and sinusoidal temperature oscillation as a function of time at z = 0 (surface),
T ( 0 , t ) = T a + A c o s [ 2 π ( t t m a x ) / t 0 ]
with A half the amplitude of the ground surface temperature oscillation, t m a x as the time lag of the ground surface maximum temperature and t 0 as the time period of the oscillation, is [37].
T ( z , t ) = T a + A e z / d c o s [ 2 π ( t t m a x ) / t 0 z / d ]
where d is the damping depth of the temperature oscillations, that follows
d = k / ( ρ C p π )
with k as the soil thermal conductivity, ρ as the soil density, and C p as the soil specific heat.
The actual soil characteristics at the selected test location was unknown. Coarse geological maps [38] showed that two soil types converge in the test location: silt and arkosic sand with quartz. These gave values of soil heat diffusivity α s = k / ( ρ C p ) ranging from 0.32 to 2.79 mm2 s−1 [39]. Here, we adopted the soil model of Wu and Nofziger [37], in which the soil volumetric heat capacity ( ρ C p ) (in kJ m−3K−1) reads,
ρ C p = 2000 ( 1 n ) + 4200 θ
where n is the soil porosity and θ is its volumetric water content.
The thermal conductivity (in kJ m−1d−1K−1), where d stands for day, is,
k = F s ( 1 n ) k s + F a ( n θ ) k a + θ k w F s ( 1 n ) + F a ( n θ ) + θ
where the F s and F a factors are calculated from
F s = 1 3 [ 2 1 + 0.125 ( k s / k w 1 ) + 1 1 + 0.75 ( k s / k w 1 ) ]
F a = 1 3 [ 2 1 + g ( k a / k w 1 ) + 1 1 + ( 1 2 g ) ( k a / k w 1 ) ]
g = 0.333 0.298 ( 1 θ / n )
that use constant thermal conductivities for air k a = 2.25   kJ m−1d−1K−1, water k w = 51.41   kJ m−1d−1K−1, and solids k s = 504.59 2.85 f (kJ m−1d−1K−1) with f as the clay content (in weight percentage). With a soil porosity equal to 0.4 and minimum water content, the soil heat diffusivity equals to α s = 1.54 mm2 s−1 that changes to 0.74 mm2 s−1 when almost fully saturated (both values within the expected values from the coarse geological maps available). For both cases, the damping depth parameter is d = 3.94 m and   d = 2.73 m, respectively.
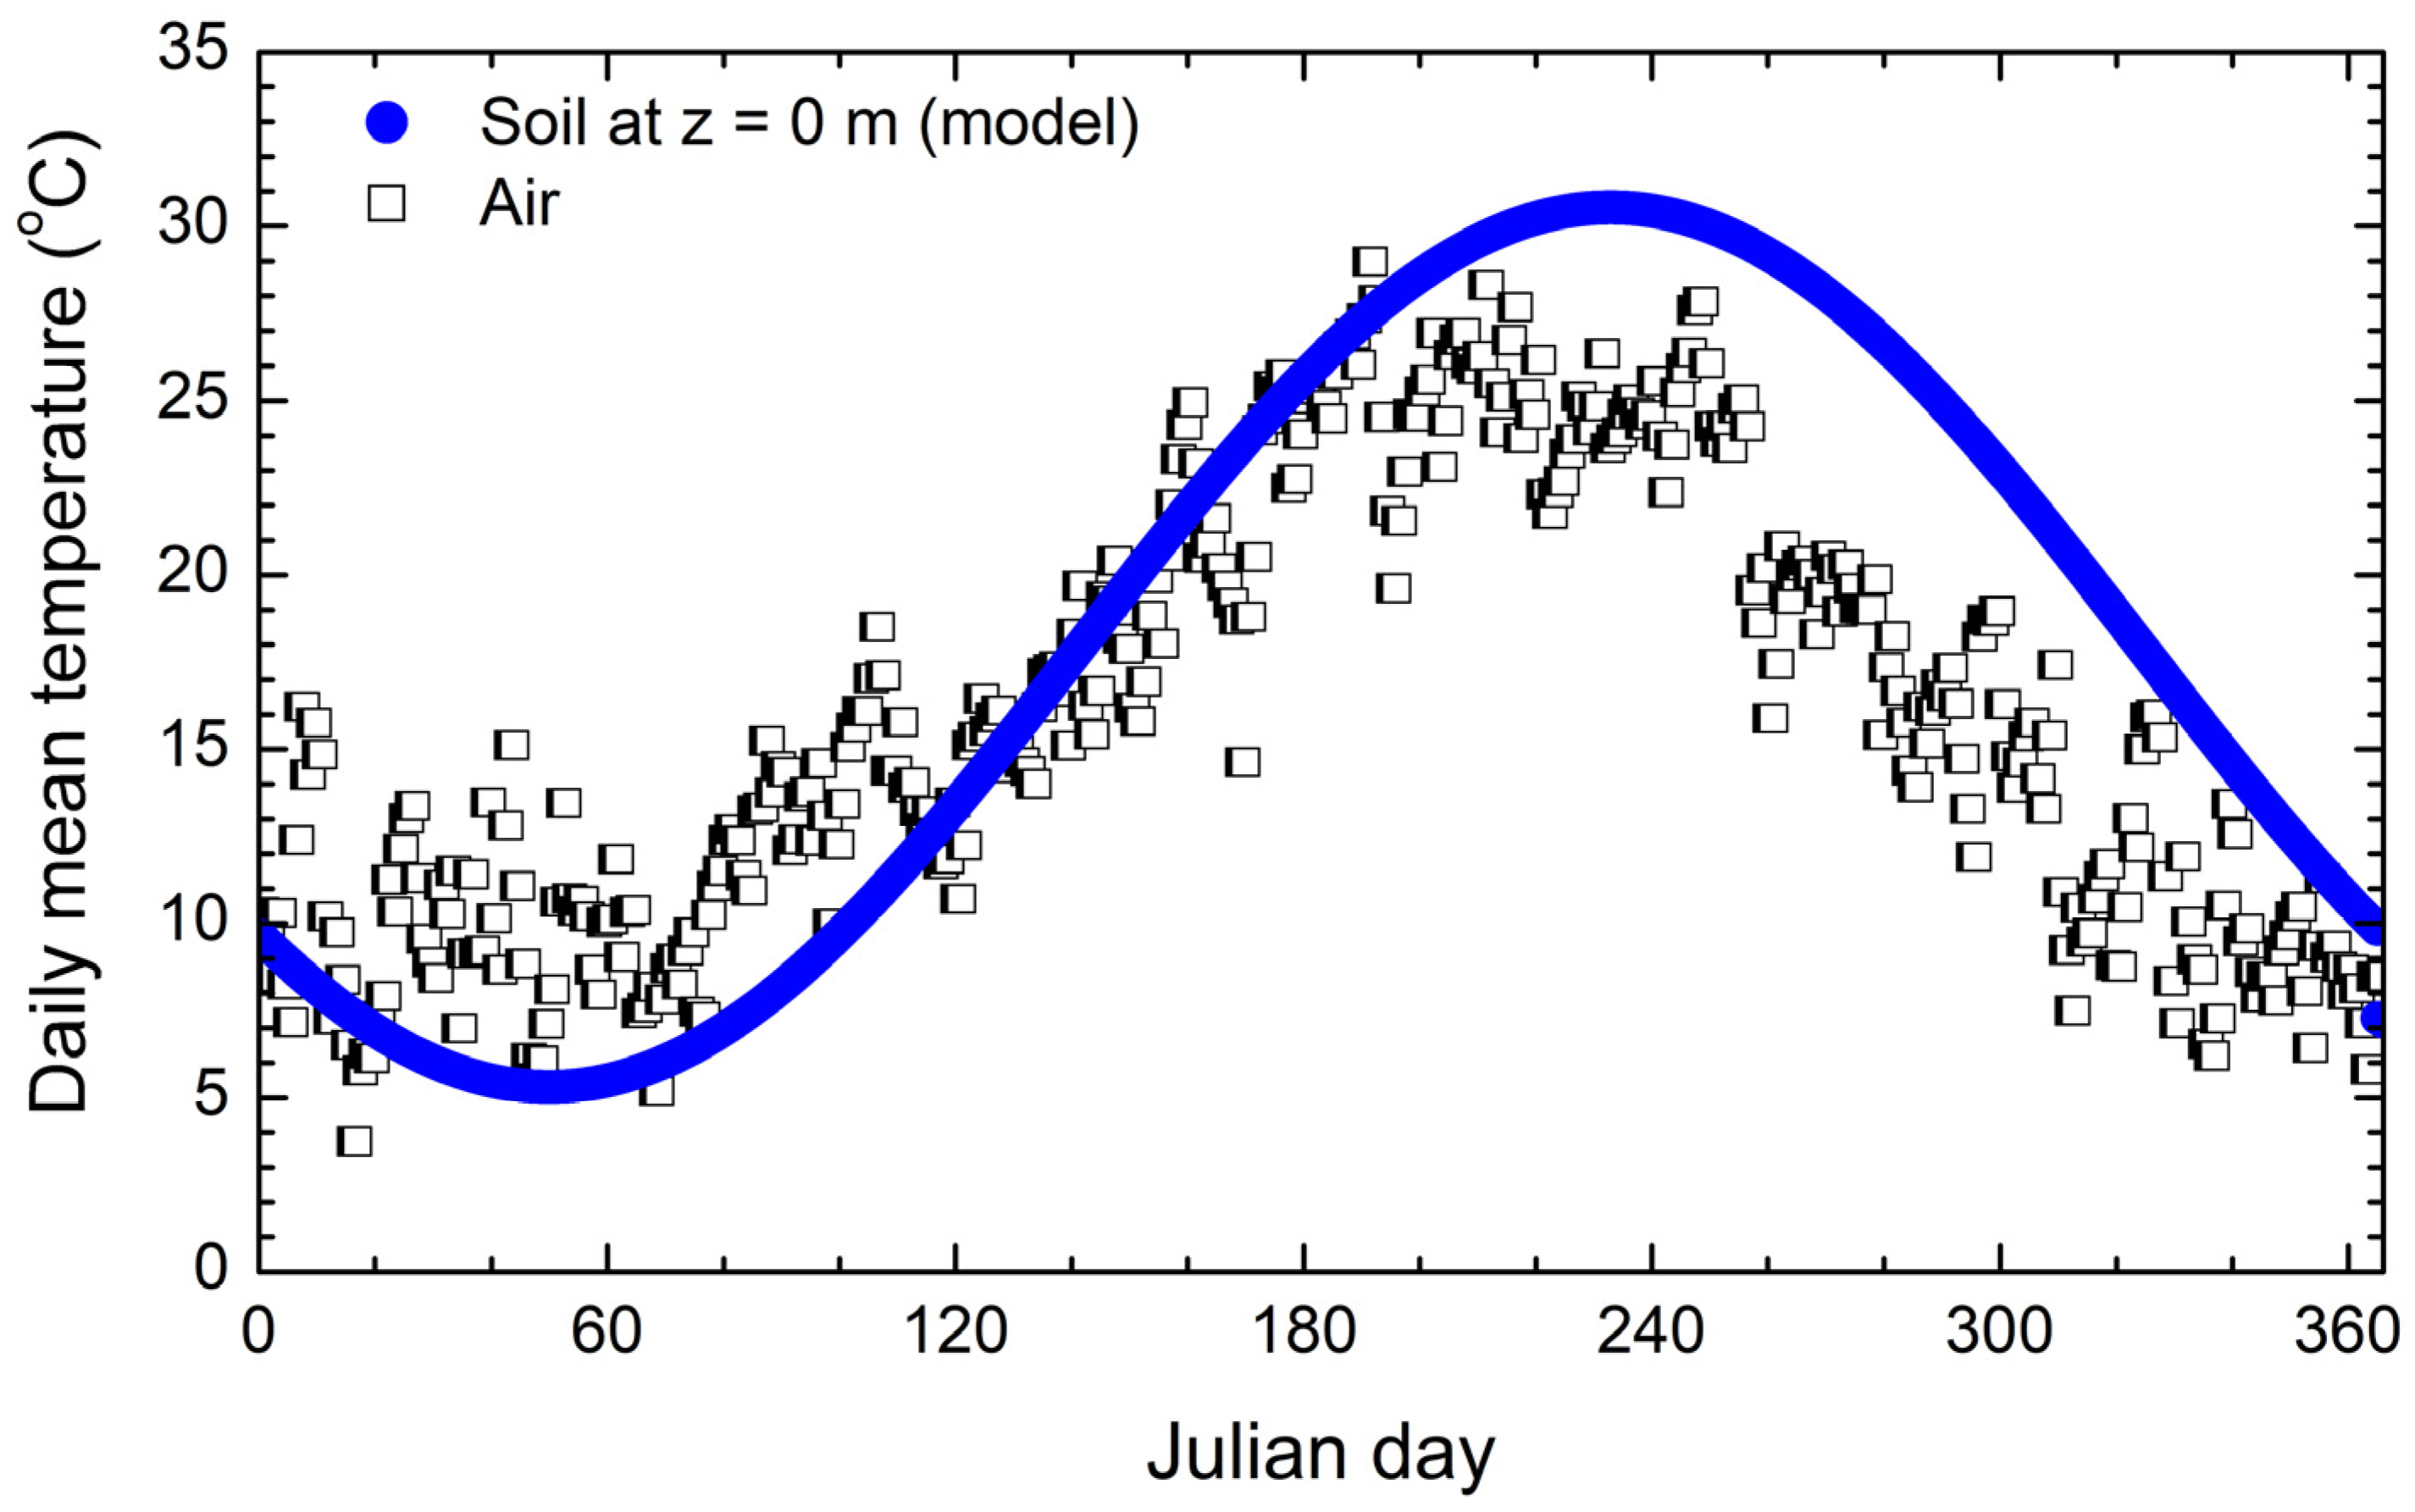
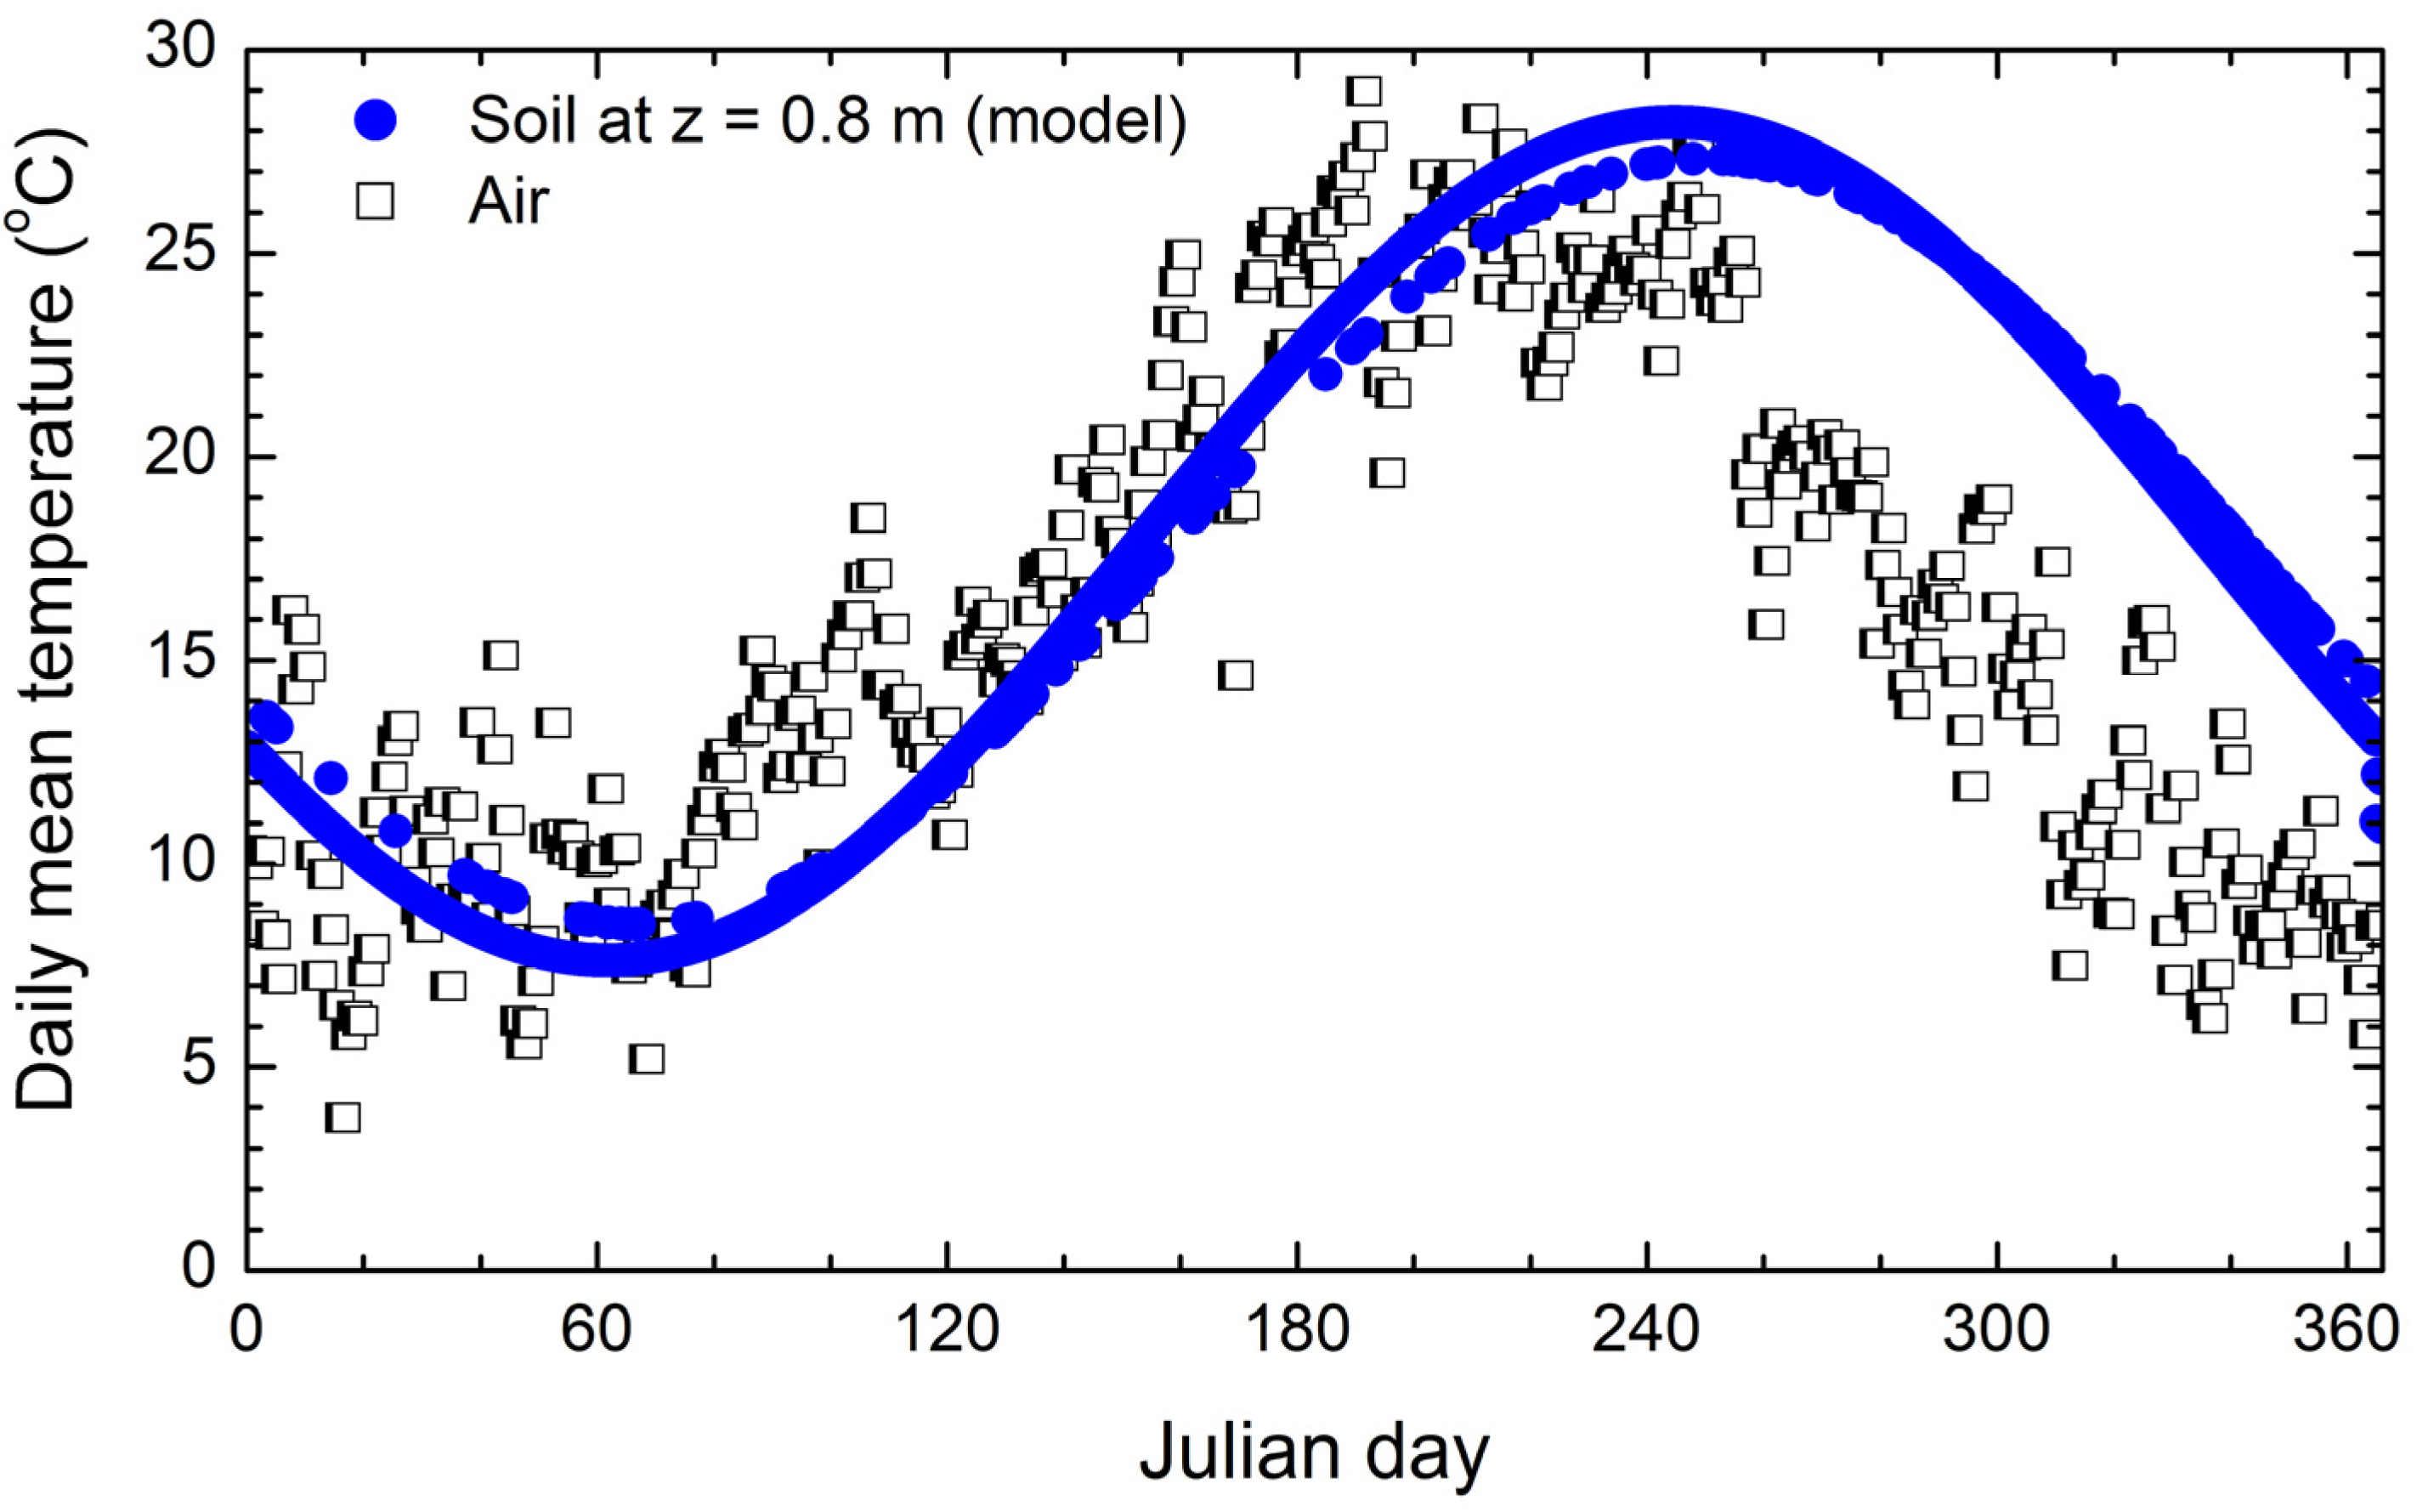
Wu and Nofziger [37] analyzed the feasibility of using air temperature data to estimate the soil temperature. Weather stations are much more widespread than sites measuring ground surface temperature, so the potential use of atmospheric data is of great interest. They analyzed daily mean temperatures during a three-year period and concluded that Equation (6) with T a equal to the annual average of the daily mean air temperature, A equal to half of the annual amplitude of the daily mean air temperature, t 0 = 365 days and t m a x as the time lag of the occurrence of the maximum daily mean air temperature slightly underpredicted the daily averaged values of surface soil temperature by 2 °C. Similar data were reported by other authors. Since the surface soil temperature was unavailable for a one-year period in our site, we applied Equation (6) with T a = T a i r + 2 , where T a i r was the daily mean air temperature recorded by the weather station, and A was half the amplitude of the annual variation of this daily mean. The time lag was determined by matching the mean soil temperature measured at z = 0.5 m at 24 July 2017 with T ( z = 0.5 , t = 205 ) data obtained from Equation (6) with t 0 = 365 days and d = 3.94 m. The predicted annual signal of the daily mean surface soil temperature is shown in Figure 5.
The time lag between the maximum daily mean air temperature and the maximum daily mean surface temperature was about 17 days, being similar to the 13 days lag observed in [37]. Note that the daily variation of the surface temperature was ignored. However, at z = 0.8 m, which was the depth of the boundary condition applied to the numerical model, the amplitude of this signal is very weak (see, for example, [37]), so the conclusions would be essentially the same when including it.

2.3. Model Setup

The numerical model was developed with ANSYS 2019R1 commercial software using the thermal transient analysis. This code applies the finite element method to solve the heat transfer equation in multiple solid bodies.
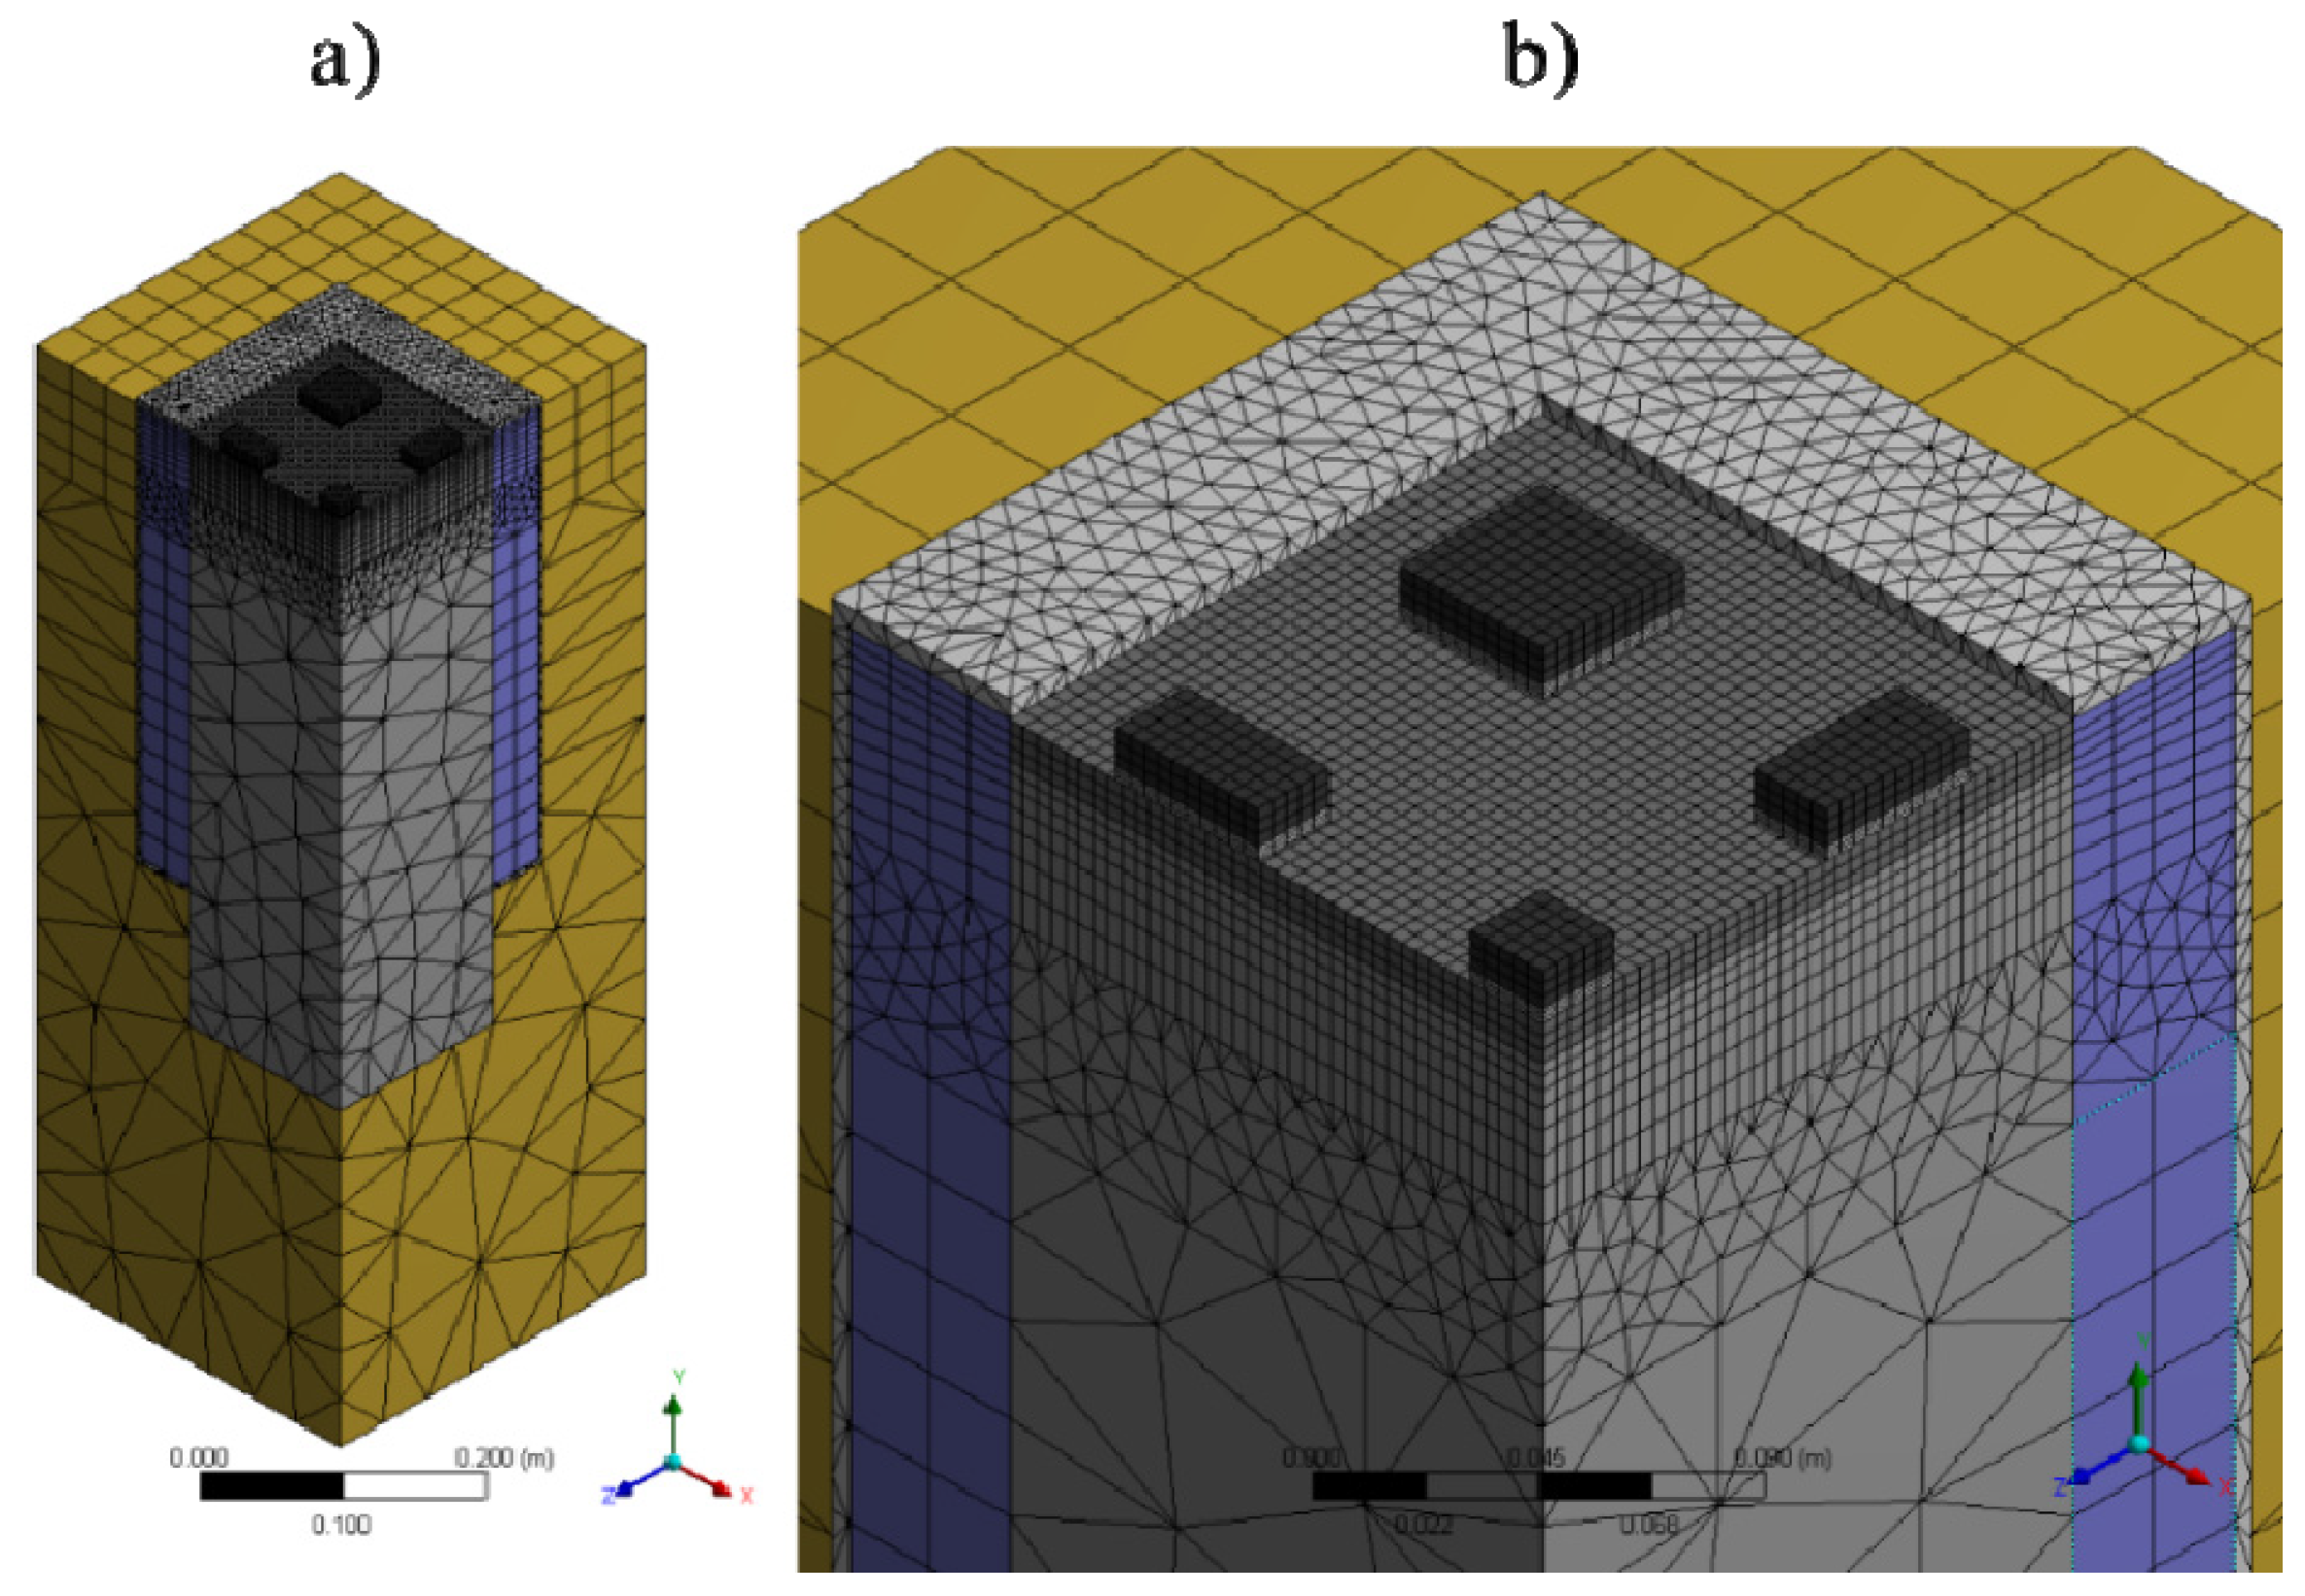
Only a quarter part of the real geometry of the STEG was simulated since double symmetry was applied (see Figure 6). This substantially reduced computational resources and calculation time. The ground was modelled with a depth of 0.8 m. Boundary conditions were solar irradiance and air temperature on its top face and soil temperature on its bottom face. The soil temperature was estimated as described above. Heat sinks were defined as parallelepipeds to simplify the mesh. Therefore, the heat flux due to the solar radiation was multiplied by 6.25 to take into account the area of the real heat sink surface, and it was applied on their top faces. In addition, the heat transfer convection coefficient between the heat sinks and the environment was defined equal to 437 Wm−2K−1, and for the rest of the top faces equal to 15 Wm−2K−1 [40]. The air temperature, at hourly intervals, was obtained from the weather station at the university campus, whereas global solar irradiance values for a horizontal surface were extracted either from the weather station or from meteorological satellites (METEOSAT )data (uncertainty of global horizontal irradiance values <3.7%) at hourly intervals [41], as explained in Section 3.
The heat exchanger between the aluminum blocks and the ground was modelled by a thermal contact between these two parts, with a contact thermal conductance equal to 40 Wm−2K−1. It was estimated from the experimental test as q = S Δ T / ( 1 C C + 1 C G + 1 C A l ) , where q is the heat flow between the ground and the heat blocks, S is the cross sectional area between both bodies, C c is the contact thermal conductance and C G and C A l are the ground and aluminum thermal conductances, respectively. The heat flow through the vertical walls of the heat blocks was neglected in the estimation of C c . In addition, the thermal contacts of the interfaces TEGs-heat sinks and TEGs-heat blocks were defined using a contact thermal conductance equal to 6.67 × 10⁵ Wm−2K−1 [42]. The rest of the contacts were defined as perfect contacts.
Non-previously defined material properties used in the model were extracted from the ANSYS library. The effective material properties of the TEGs were obtained from the manufacturer’s datasheet. The TEG effective thermal conductivity was estimated from k T E G = q   e / A T E G Δ T T E G = 5.33 Wm−1K−1, where e is the TEG thickness, q is the nominal heat flow through the TEG, A T E G is the TEG cross sectional area and Δ T T E G is the nominal temperature difference across the TEG.
Quadratic hexahedron elements were used to model the heat sinks, the TEGs and part of the aluminum block in contact with the TEGs, being more refined up to 50 mm of depth, see Figure 6b. The mesh employed in the estimation of the annual energy production applied an in-plane element size of 4 × 4 mm2 with at least three elements through the thickness. The rest of the bodies were meshed using linear elements. The total number of elements used in the numerical model employed to estimate the energy generation in a one-year cycle was equal to 80,844. Averaged aspect ratios and orthogonal quality were 3.3 and 0.56, respectively. Results obtained with five different meshes were also investigated to determine the discretization effect, as explained in Section 3.2.

2.4. Laboratory Test of TEG Performance

The previous model was able to predict temperature differences at TEG sides ( Δ T T E G ). However, our purpose was to obtain electrical output power P T E G and, hence, electrical energy generated for a given period of time. The estimation of P T E G in terms of Δ T T E G was carried out by means of laboratory tests of a single TEG module.
The laboratory experiment consisted of an electronically controlled hot plate (COMBIPLAC, Selecta) above which we had the TEG module (H-19-14-06-L2, Crystal LTD). We placed an unbranded water heat sink for cooling central processing units of computers with dimensions 40 × 40 mm2 on the upward face of the TEG module. The previous three elements were not directly in contact since we located two thin brass sheets 40 × 40 mm2 of surface area and 0.25 mm thick between the hot plate and the TEG module and between the TEG module and the water heat sink. Type K thermocouples 0.25 mm thick were inserted within a small slot made in each one of these two brass sheets to measure the central temperatures of both TEG faces. Temperature data were acquired with a NI9211 National Instruments module and monitored with LabVIEW software. Two M5 bolts were used to clamp the whole system, fitted at 0.6 Nm, which was the same torque value as applied in the actual STEG device. The electrical circuit consisted of a 10 W, 5 Ω rheostat connected in series at both TEG terminals. TEG voltage and current were obtained with NI9215 and NI9227 (uncertainty ± (12.7 mA + 0.37% of reading)) National Instruments modules and monitored with LabVIEW software.
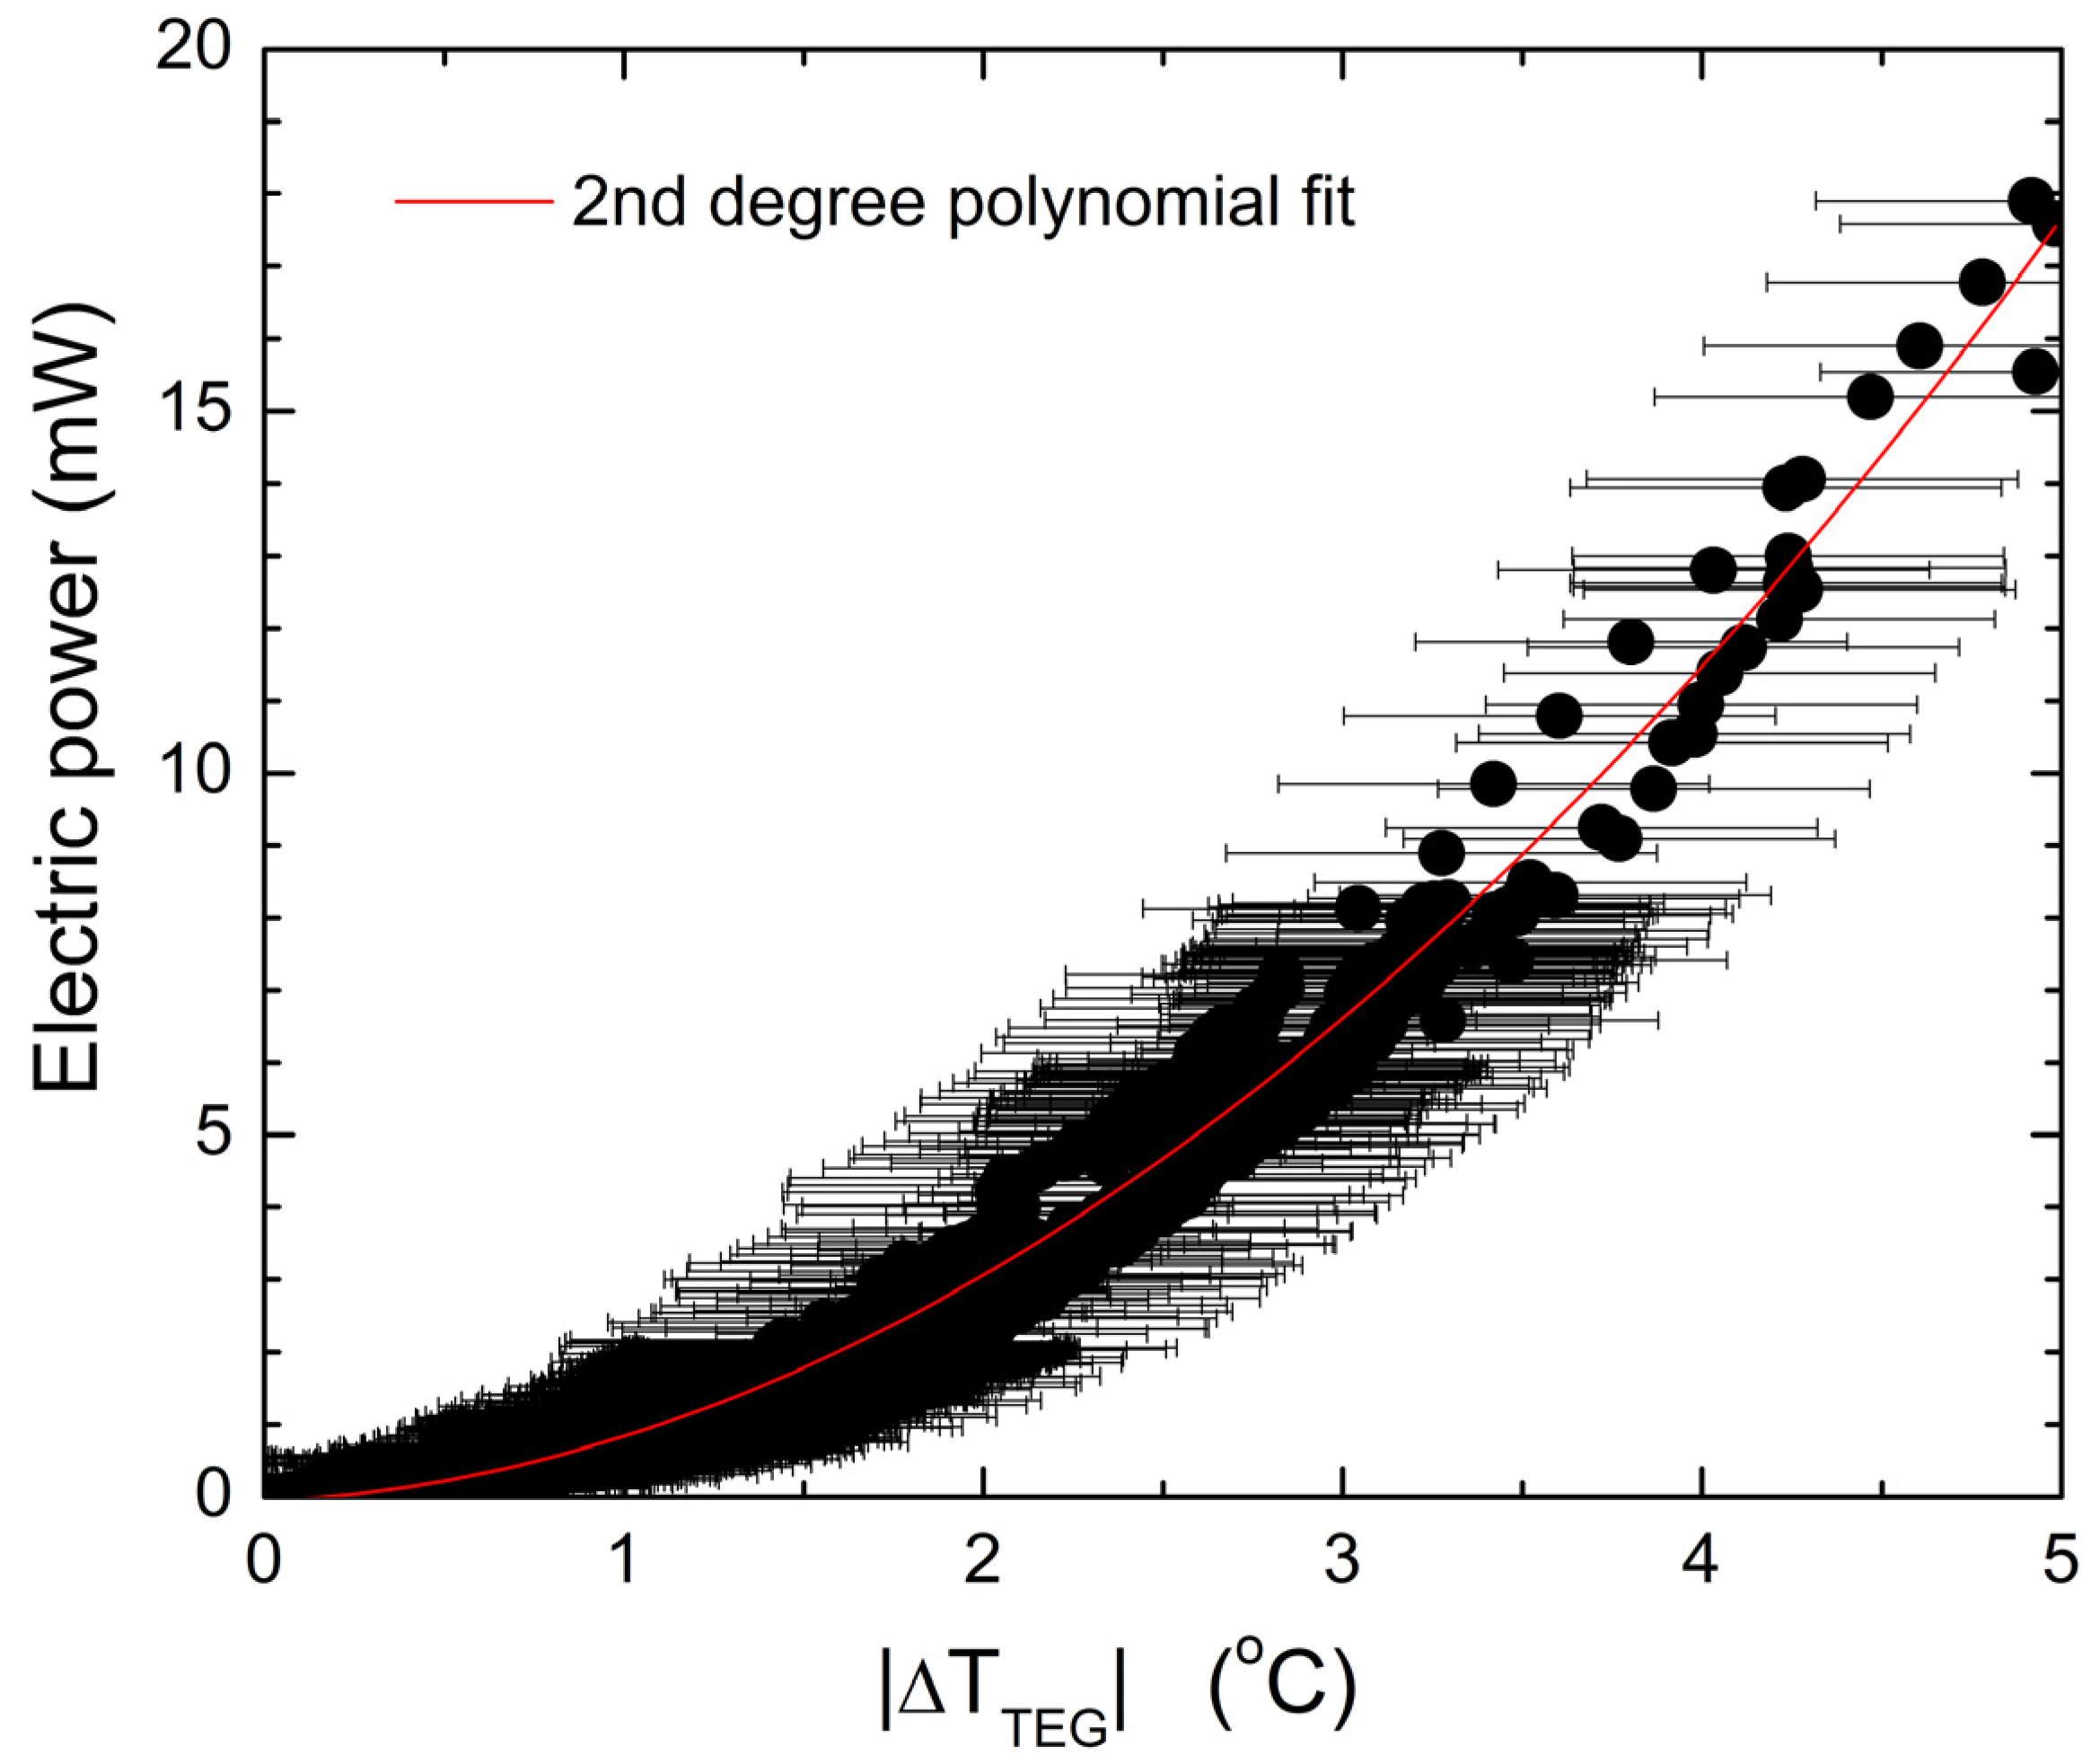
The experimental procedure consisted of increasing the heat flow of the hot plate at different intervals to attain quasi steady conditions. At a given interval, the rheostat was manually operated to reach the maximum output power. The minimum temperature obtained at the cold side was 17 °C since tap water was used for cooling. Common values of cold side temperature were below 25 °C. Three repetitions of the experiment were carried out, both in normal position (side expected to be the hottest one by the manufacturer facing towards the hot plate) and in reverse one (side expected to be the coldest one by the manufacturer facing towards the hot plate). Maximum output power values for all the experiments within the 0 < | Δ T T E G | < 5 K interval are shown in Figure 7.
Data in Figure 7 were fitted to a second order polynomial (see red line in Figure 7). We did not force the regression to intercept the origin in order to better reproduce data at higher Δ T T E G values. The parabolic regression was,
P T E G ( mW ) = 0.66036   | Δ T T E G | 2 + 0.24174   | Δ T T E G | 0.06114
with a square of the correlation coefficient R 2 = 0.985. In the results section, all values below | Δ T T E G | < 0.173 K were ignored in terms of power production (positive root of Equation (13)).

3. Results and Discussion

3.1. Experimental Data

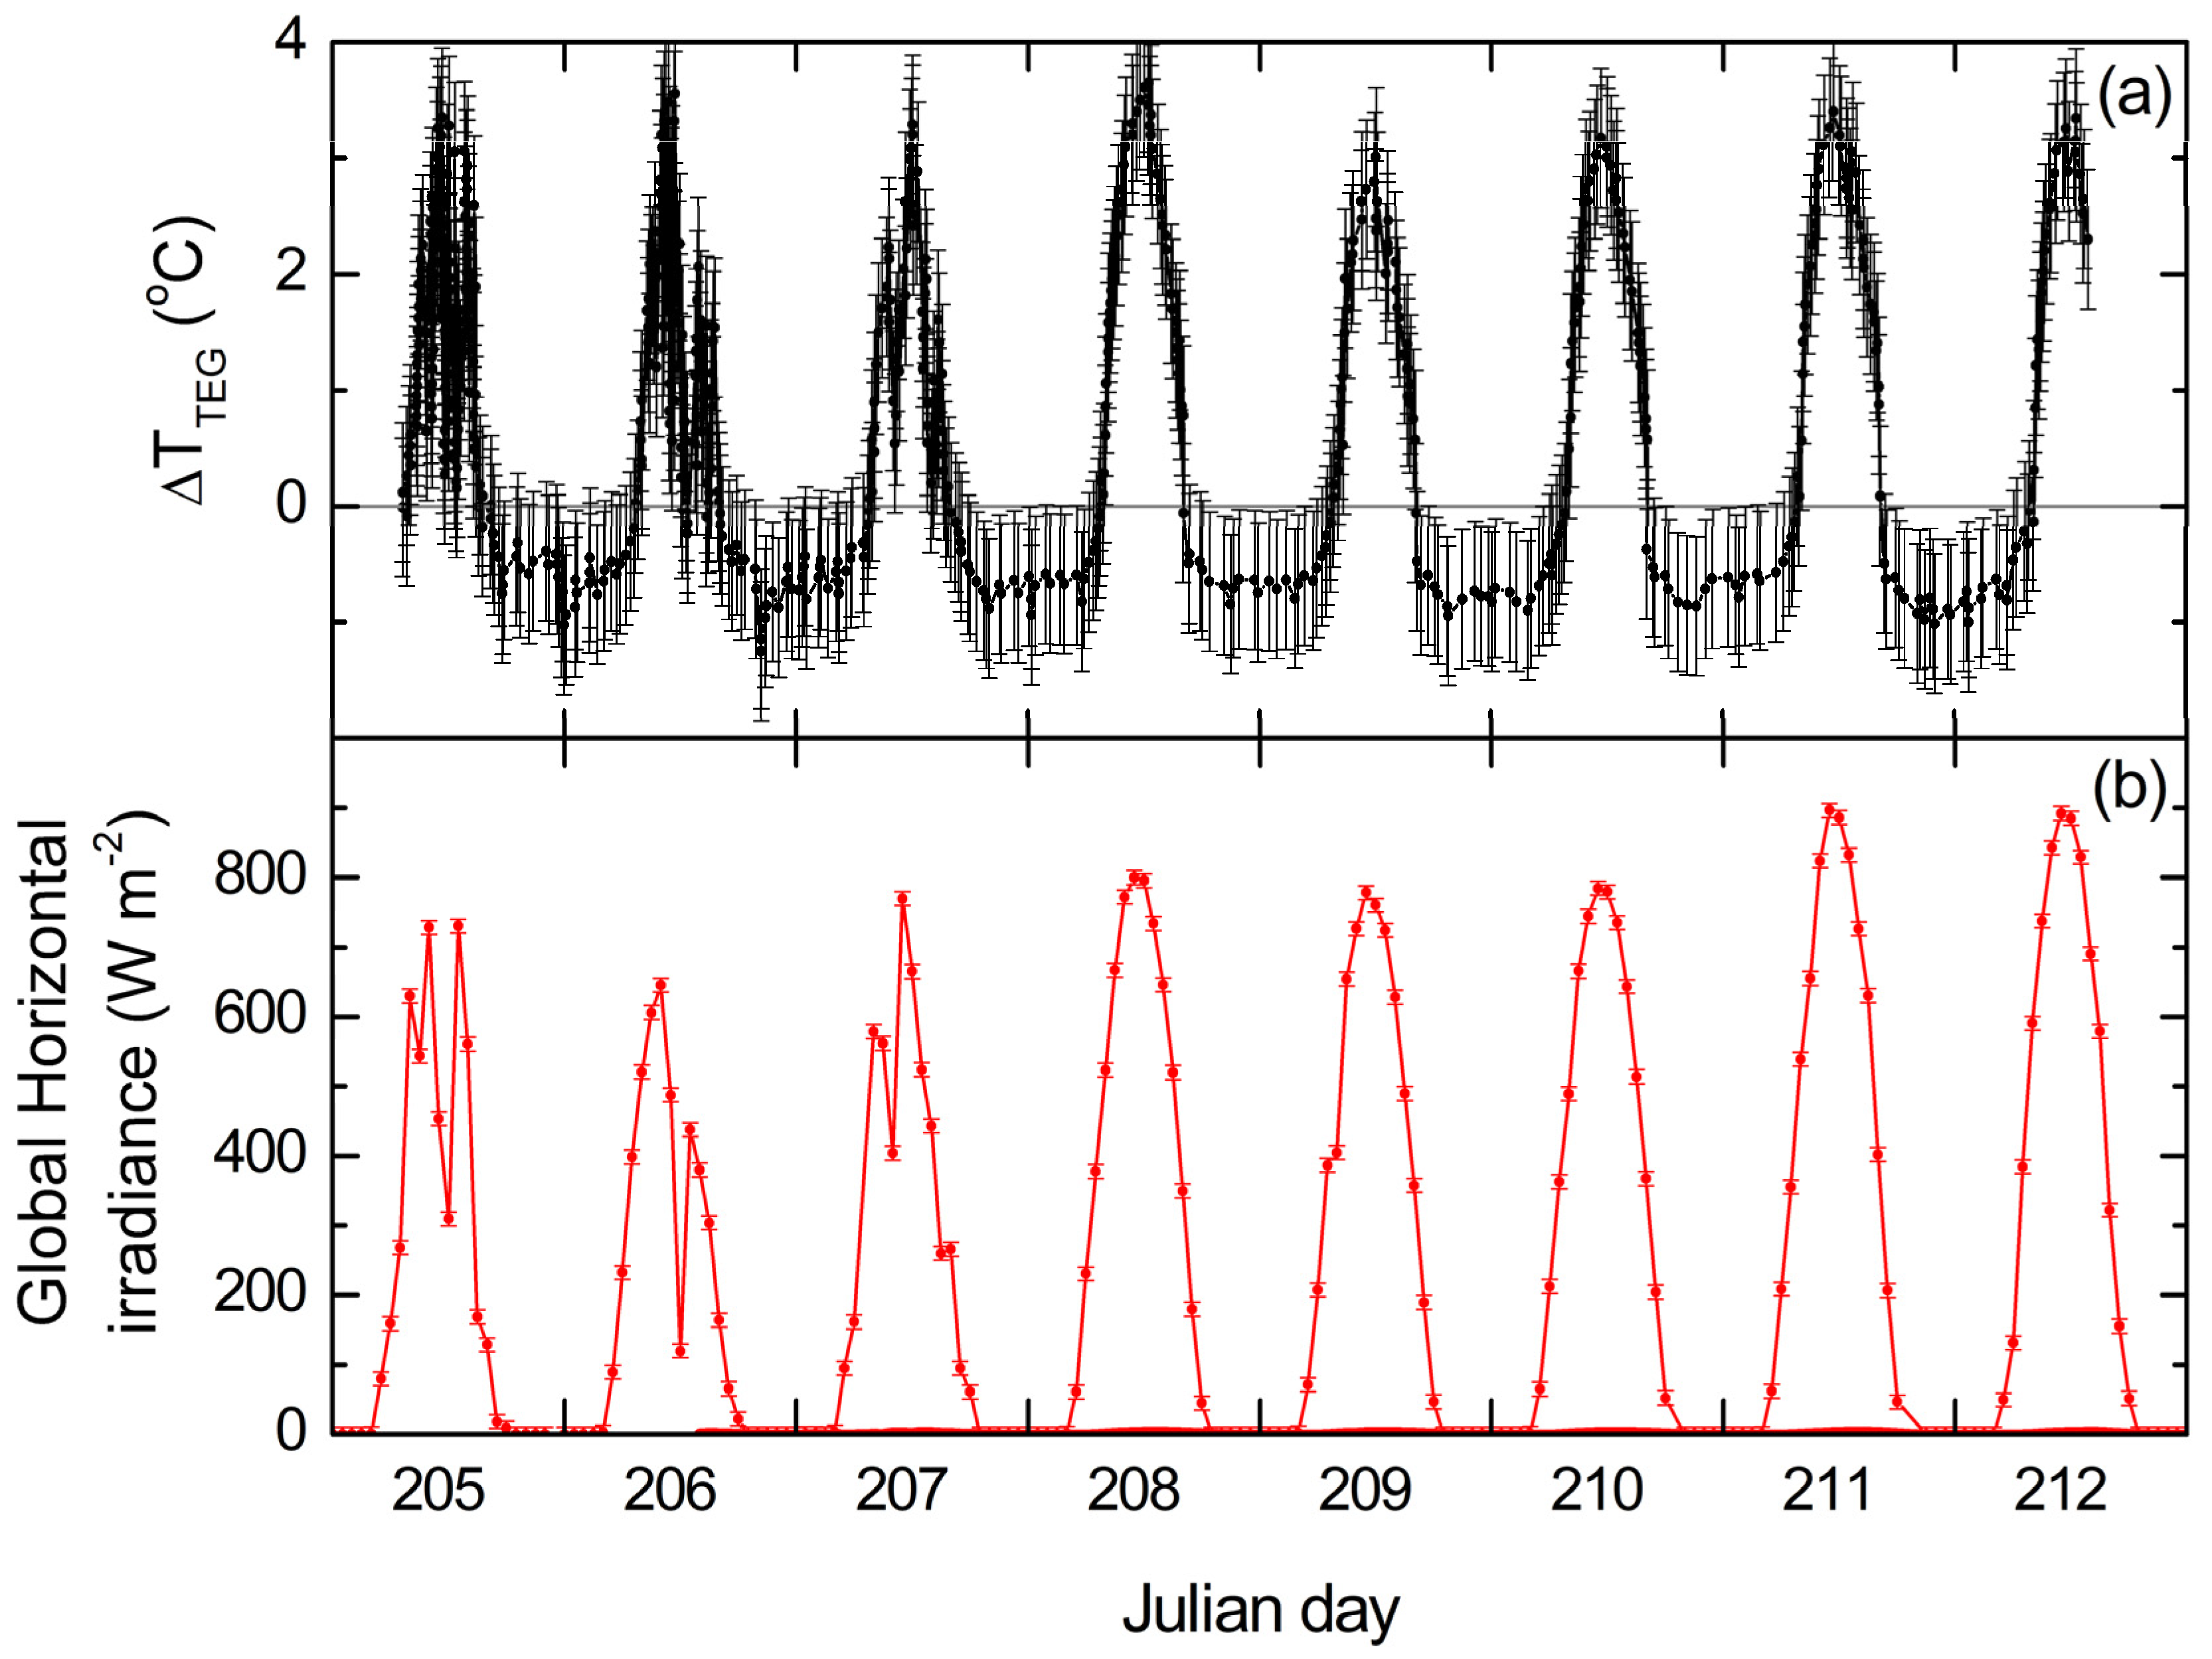
Data were recorded during almost eight days (24–31 July 2017) at variable intervals below 15 min. Temperature differences between upper and lower sides of the TEG Δ T T E G working under open circuit conditions are shown in Figure 8a. Daily peak differences (day—night) of more than four degrees were observed in most of the days. The highest temperature difference was obtained on 27 July at 12:30 (UTC) with a value equal to Δ T T E G = 3.6 °C. The most negative one was reached on 25 July at 20:20 (UTC) with Δ T T E G = −1.2 °C. Note the high variability of diurnal Δ T T E G values during the first three days of measurements, even reaching Δ T T E G   negative values during daylight hours. This was caused by local weather conditions, since days 205 to 207 (24–26 July) were cloudy with high variability of horizontal global irradiance (see hourly data in Figure 8b) including very weak precipitation. The sky was clear from day 208 on. Thus, data from Figure 8a,b clearly revealed the strong dependence of our STEG on solar irradiance behavior with an almost immediate response of Δ T T E G   to its variations.
Hourly Δ T T E G values for all the eight days recorded in Figure 8 are shown in Figure 9. As noted above, the output of the STEG was highly variable during daylight hours because of the weather conditions. By contrast, this was not observed during night, even on cloudy days in which radiative cooling was expected to not be so intense. Thus, although peak performance was always reached at noon, steady conditions at night were very favorable for a constant generation. The mean of Δ T T E G values from 0:00 to 7:00 and from 17:00 to 24:00 was −0.66 °C with minimum and maximum values equal to −1.25 °C and −0.25 °C for these 14 h intervals. In the 8 h interval ranging from 8:00 to 16:00, the mean value of Δ T T E G was 1.74 °C, with a maximum of 3.65 °C and a minimum of −0.23 °C.

3.2. Model Validation

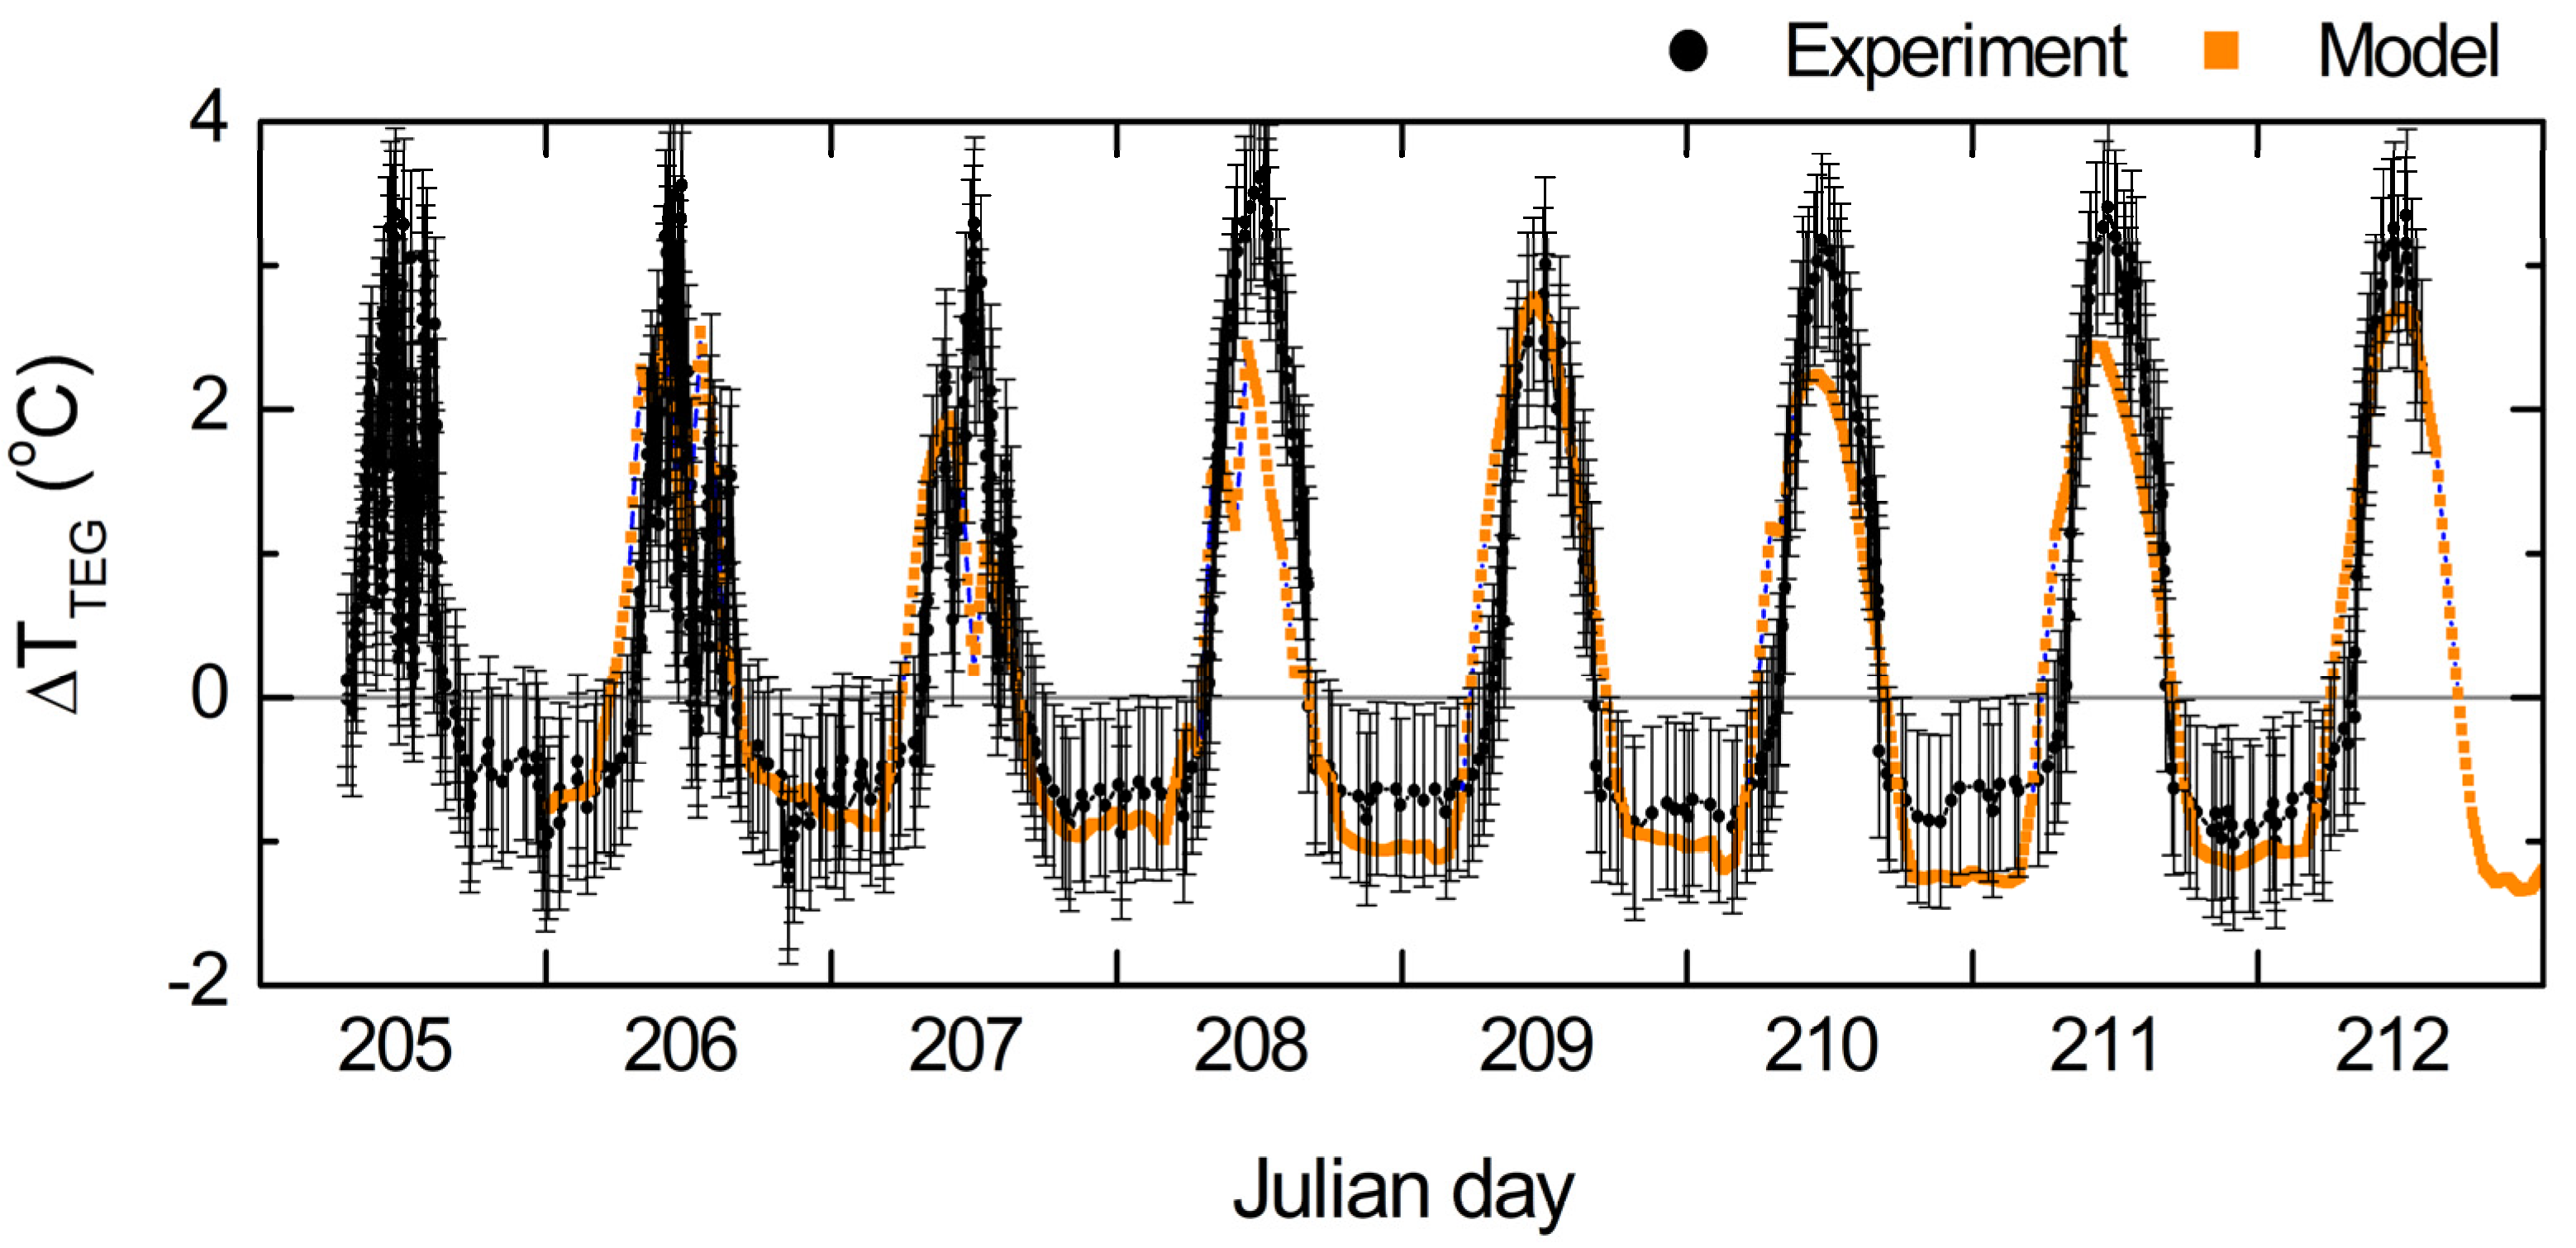
The model developed in Section 2.3 was run for the 205–212 day period of year 2017. Input data of the model were air temperature, global horizontal irradiance recorded at the university campus weather station and soil temperature at z = 0.8 m from the soil model developed in Section 2.2. Figure 10 shows the comparison of both experimental and simulated data for the 80,844 elements mesh.
The maximum output power obtained after applying Equation (13) was 51.2 W, with a mean energy generation per day of 858.3 J d−1 during that period. A mesh independence study was carried out with meshes of 60,096, 64,930, 80,844, 102,396 and 161,380 elements. These were obtained by proportionally varying the characteristic size of the model elements. Values of peak power and mean energy generation per day during the eight-day period differed less than 0.48% and 0.55%, respectively, with respect to those found with the finer mesh. The mesh with 80,844 elements (used in next section), predicted a peak power and mean energy generation per day greater than those of the finer mesh by 0.27% and 0.30%, respectively. Therefore, we accepted that our results were mesh independent.
We point out that predicted data did not exactly reproduce the experimental values. The main discrepancies were found near noon (i.e., peak values of temperature differences) and during the nighttime. One of the reasons for underpredicting peak daytime values may come from the use of boundary conditions that were hourly averaged values. Weather station data were not recorded at short intervals, and only mean hourly values were available. This was the reason that the model tended to underestimate the peak of Δ T T E G   reached at daylight times, as can also be clearly seen in Figure 10. Differences between maximum Δ T T E G observed and predicted were on the order of 0.3 °C. In addition, this may be the reason why the model did not capture the rapid variations of Δ T T E G well, as was observed during the first three days in Figure 10. On the other hand, absolute values of Δ T T E G during the night were slightly overpredicted by the same amount (0.2–0.3 °C) for days 208 to 211. This was probably caused by the thermal inertia of the device that increased the cool down of the upper surface in case of diurnal temperatures not as high as those observed. Note that night data were very well reproduced for days 205 to 206 in which mean diurnal Δ T T E G values were closer to hourly mean observations. All in all, the model results were promising with a reasonable reproduction of observed data.

3.3. One-Year Simulation Data

The numerical model was used to simulate the STEG device during a whole one-year cycle and to predict its behavior at hourly intervals. As in previous cases, input data of the model were air temperatures recorded at the university campus weather station and soil temperatures at z = 0.8 m evaluated from the model explained in Section 2.2. However, the global horizontal irradiance was not extracted from the local weather station, as in 3.2, since it had large periods (>3 months) with null data. Instead, we used the photovoltaic geographical information system from the satellite application facility on climate monitoring (PVGIS-CMSAF) dataset that is based on METEOSAT satellites measurements [41]. All data corresponded to year 2016 since this was the most recent year that the local weather station recorded air temperatures with a minimum set of non-null data. Thus, Figure 4 displays the model input values of global horizontal irradiance (hourly), whereas Figure 11 shows those for daily mean air temperatures (although used hourly in the model) and daily mean soil temperatures at the bottom of the computational domain. The latter showed a slight discontinuity since we assumed a different soil thermal conductivity (and, hence, a different damping depth parameter) for those days with recorded precipitation ( θ = n in Equation (9), d = 2.73 m). This modification, however, was not expected to substantially vary the prediction of Δ T T E G   since ground temperature variations at z = 0.8 m from the standard d = 3.94 m case were small. Nevertheless, these discontinuities indicated the days in which the sky was likely to be covered, clearly found for a large number of days during autumn.
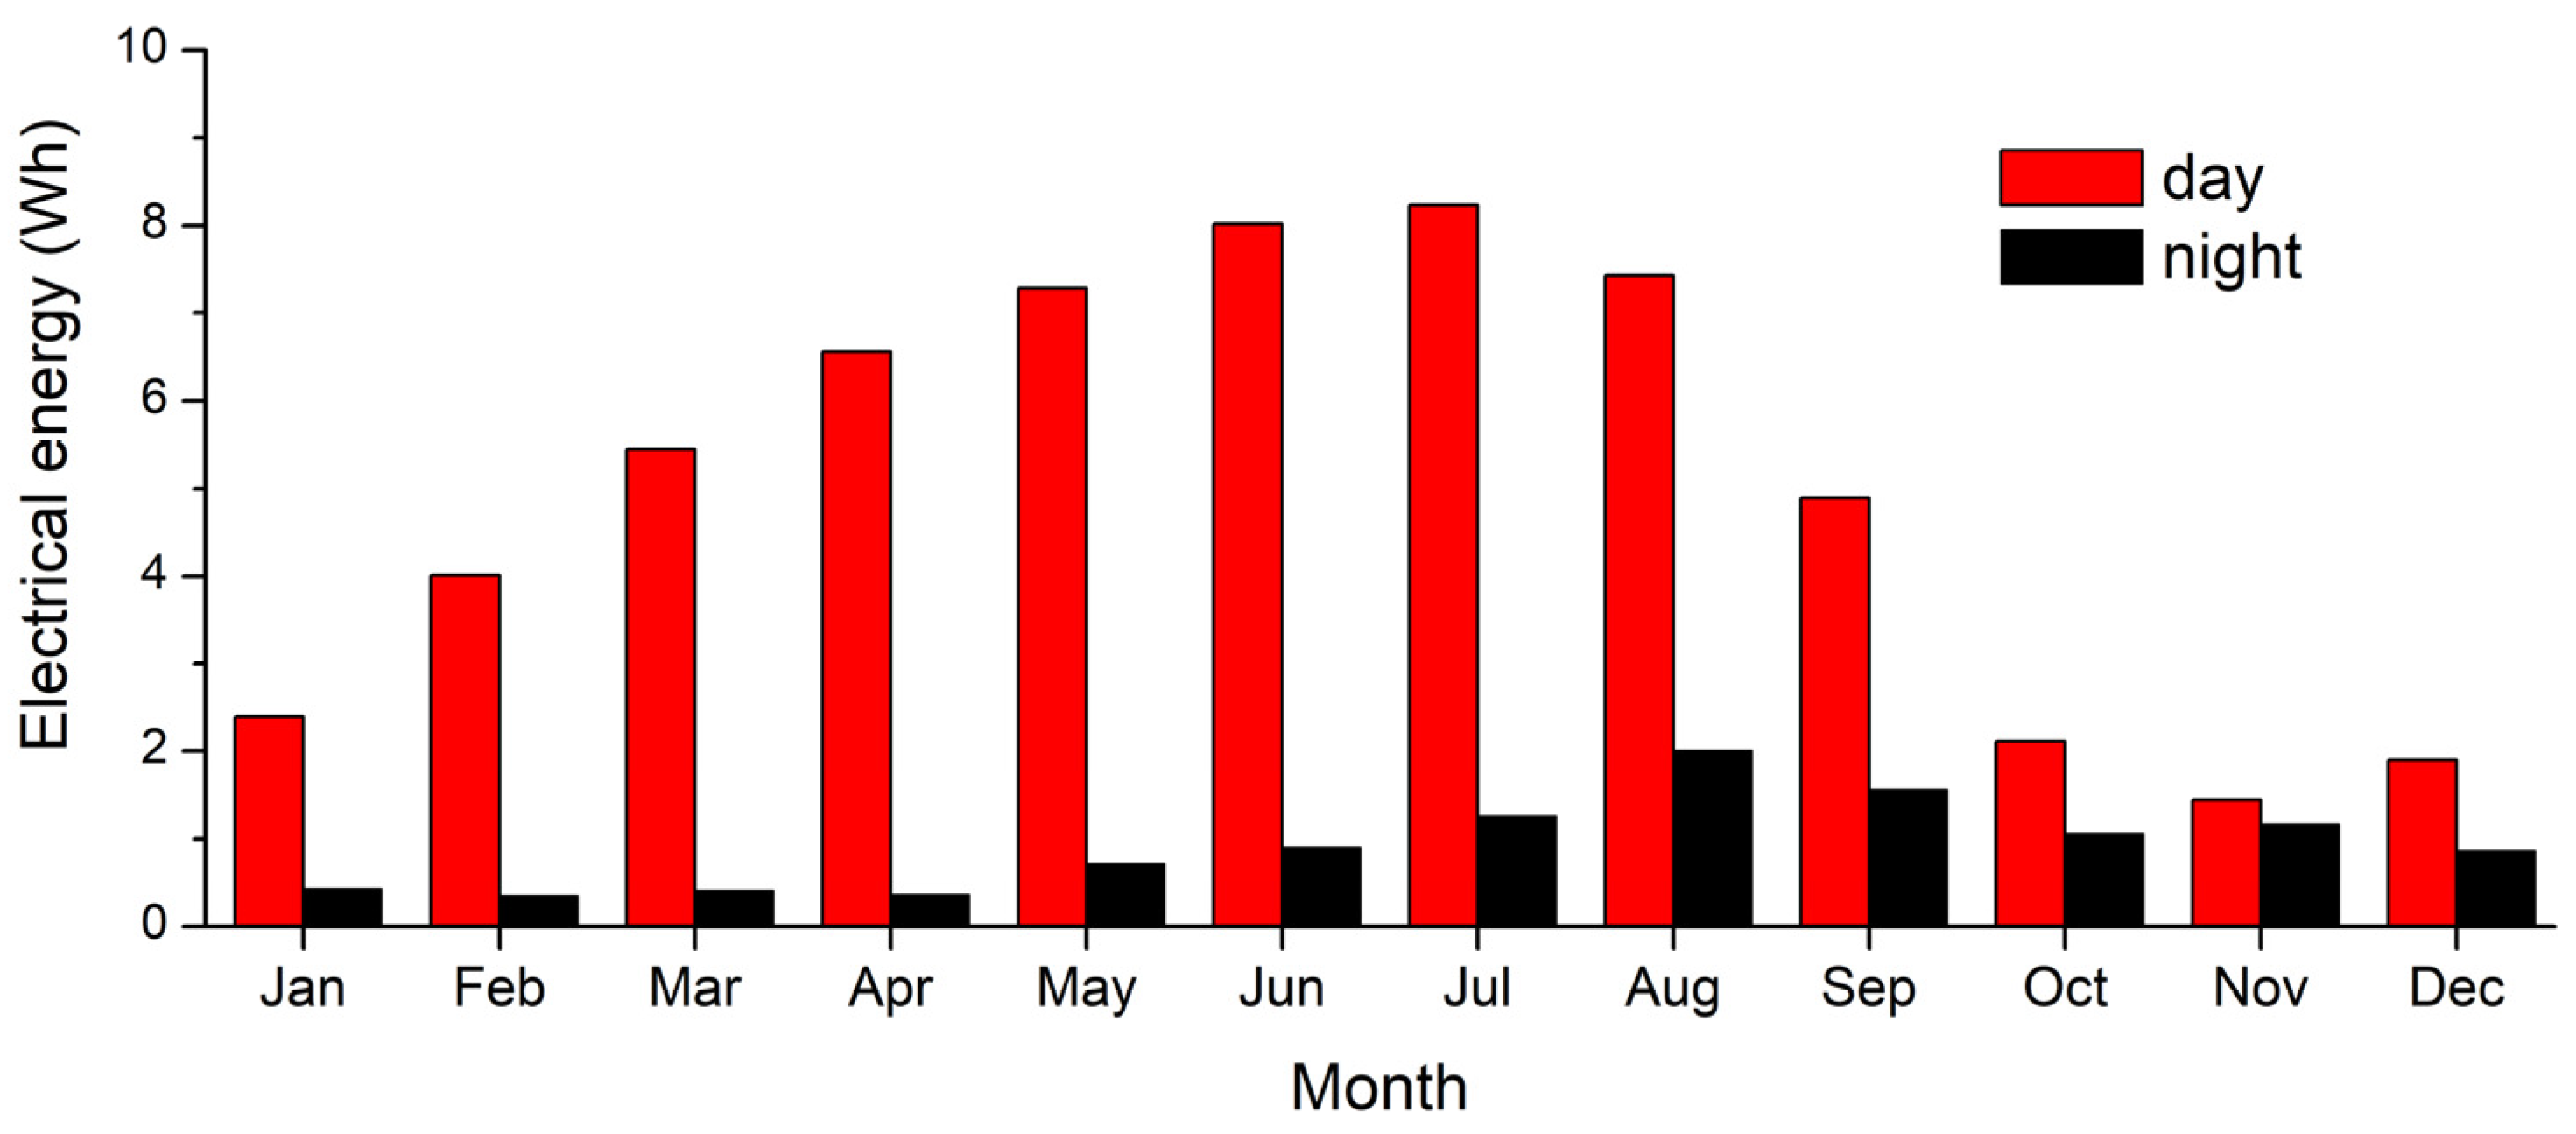
Power obtained from a single TEG was estimated by applying Equation (13) to the Δ T T E G values predicted by the model. This value multiplied by nine (number of TEGs employed) was the power for the whole STEG device. Electrical energy was then straightforwardly calculated from hourly power data. Figure 12 shows the electrical energy estimated for each month during day and night (no irradiance values) periods. Diurnal harvesting reached a maximum of 8.2 Wh (=29.6 kJ) during July and a minimum of 1.4 Wh (=5.2 kJ) in November. The daylight energy generation through the year behaved similarly to the global horizontal irradiance data (Figure 4). Note the intense decline of diurnal output energy observed during October, November and December. This period coincided with months of high precipitation, as pointed out when discussing Figure 11, so the irradiance peaks were sparser in that autumn season (see Figure 4).
On the other hand, nighttime production clearly followed the depth ground signal (blue dots in Figure 11), with a maximum in August (=2.0 Wh or, equivalently, 7.2 kJ) and a minimum in February (=0.4 Wh or, equivalently, 1.3 kJ). Note that autumn was a season with a high nighttime generation, since it was a period with soil temperatures greater than air ones (see Figure 11) and this favored the ground-to-air heat flow at night. Conversely, during the winter season, both air and ground temperatures were similar (see Figure 11), so the production was low.
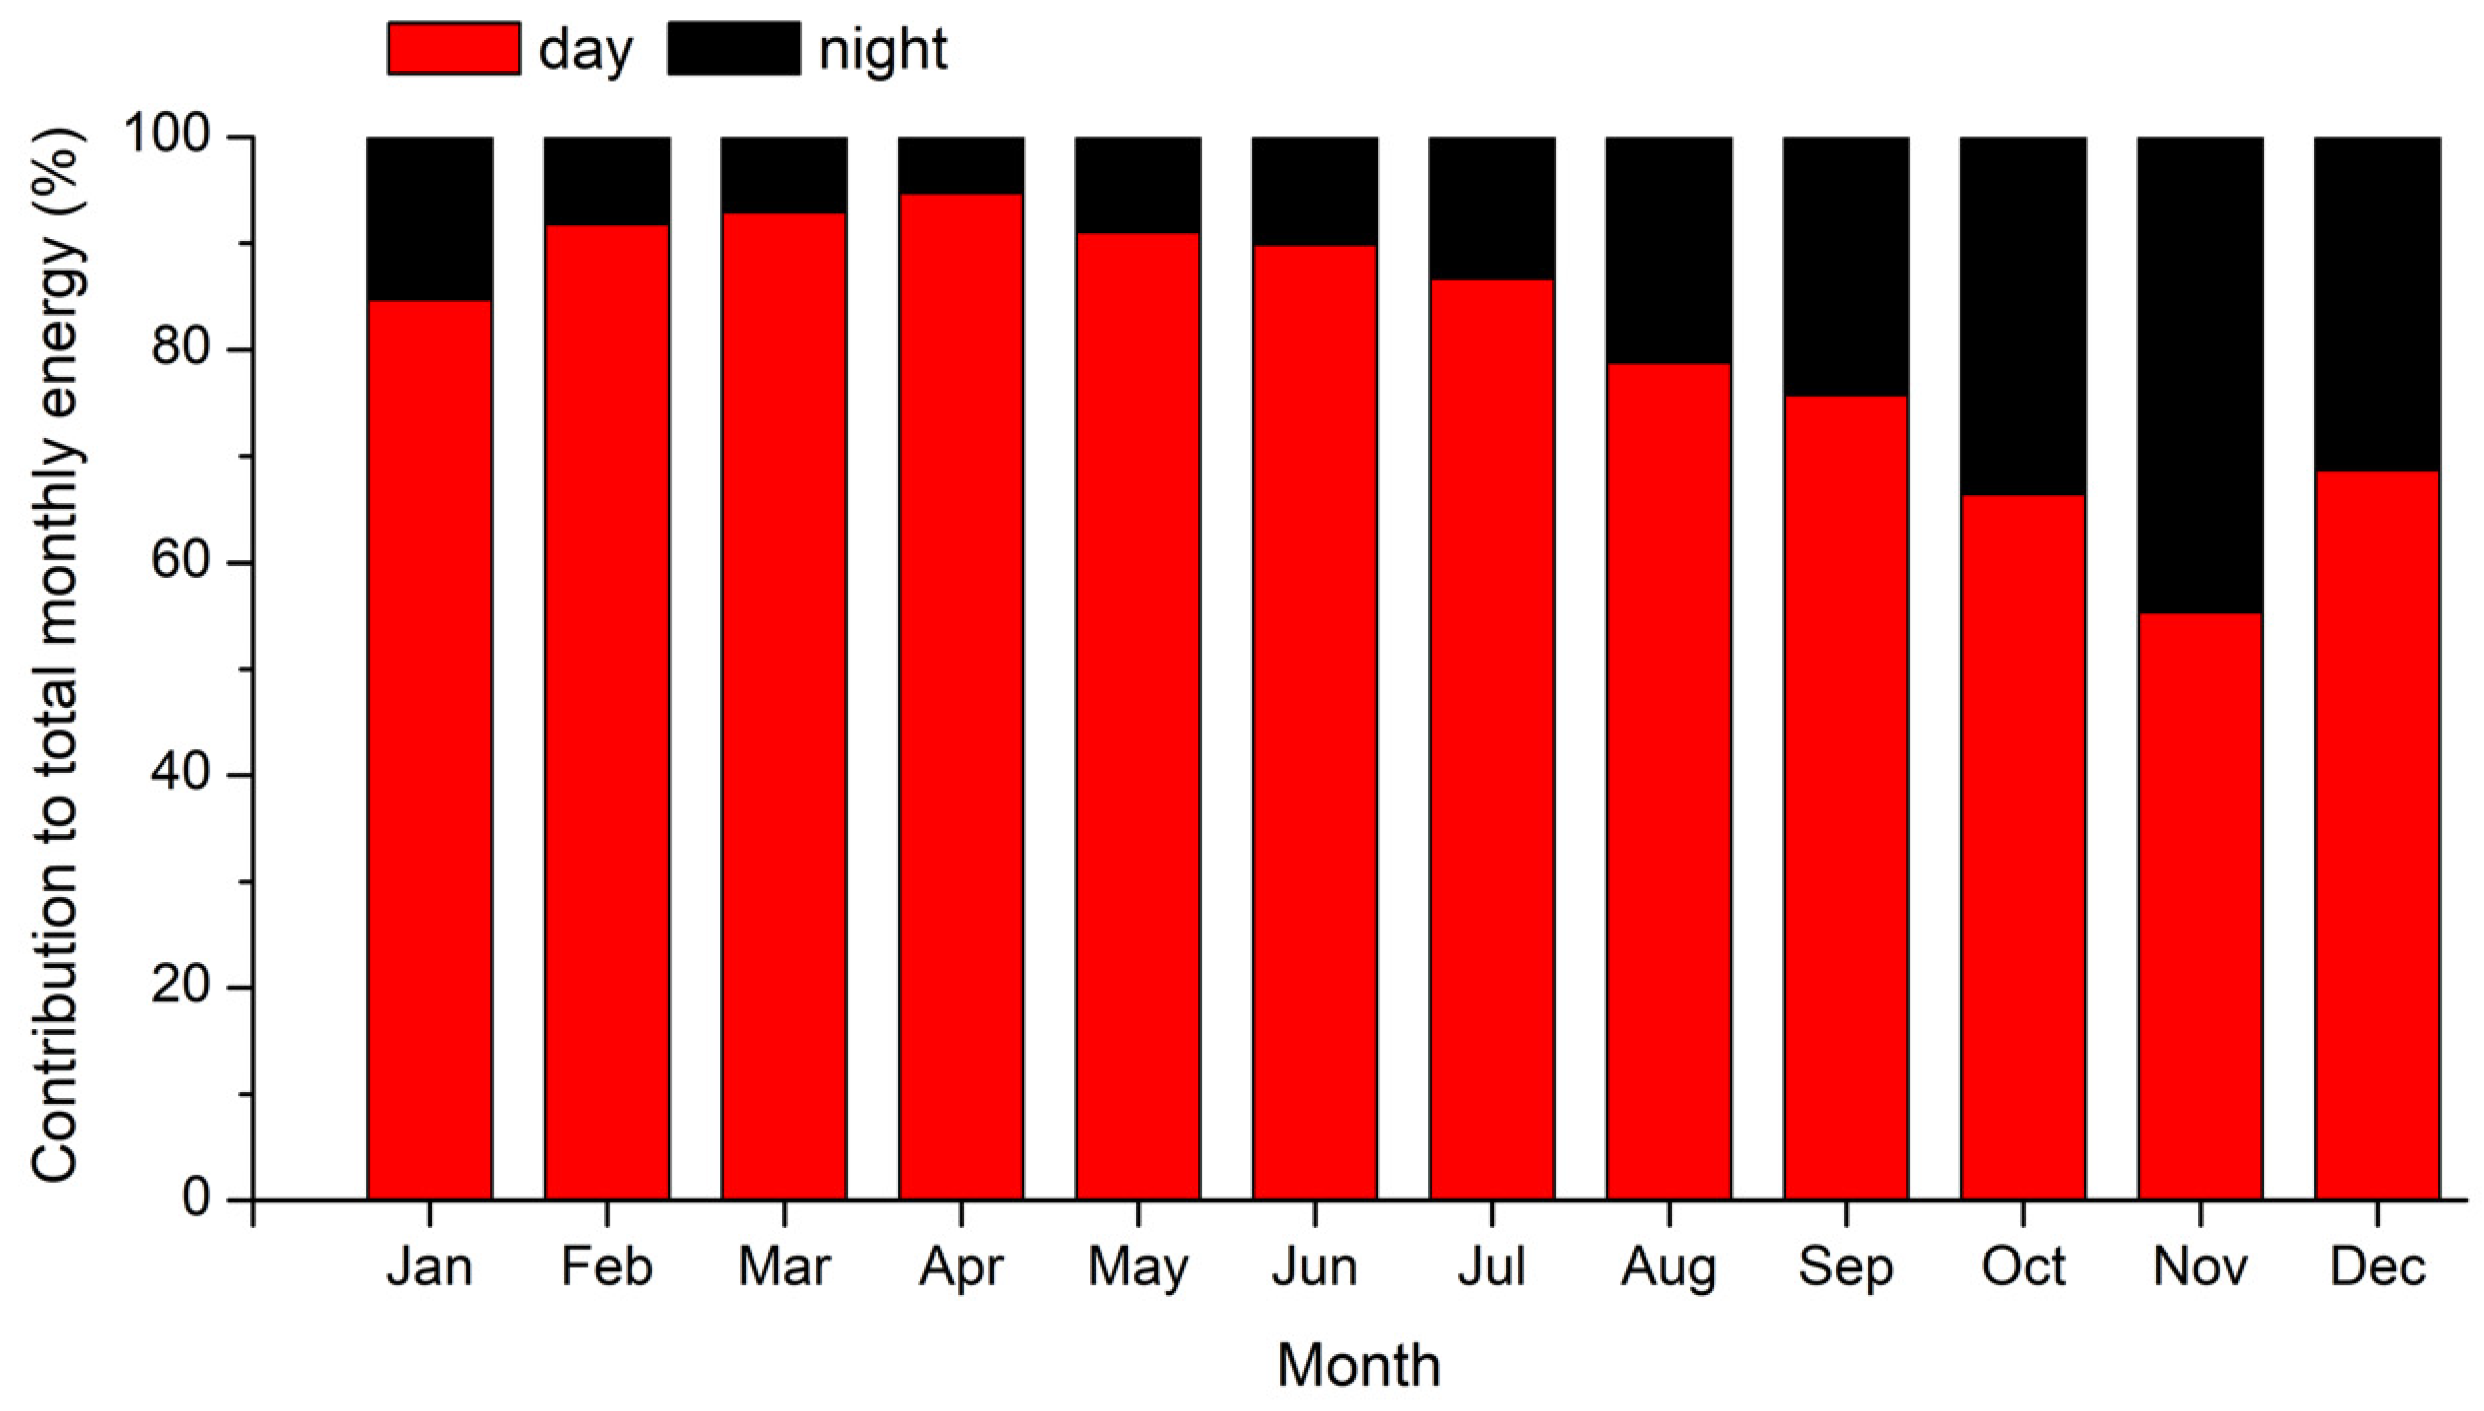
Global (day plus night) monthly values varied from 9.5 Wh (=34.2 kJ; July) to 2.6 Wh (=9.4 kJ; November) with an annual energy generation of 70.9 Wh (=255.1 kJ) and mean daily energy of 0.2 Wh (=697 J d−1). The contribution of the two working modes (day and night) to the total monthly energy generation is shown in Figure 13. Nighttime was a very important mode during autumn, contributing more than 44% to the total energy harvesting in November. However, its contribution was below 6% in April.
Finally, day and night monthly maximum and mean output power are shown in Figure 14. Maximum power of 79.8 mW was obtained in March, the month with the lowest ground temperatures. Mean power values during daylight time were above 10 mW from February to September. Power values during night were substantially smaller, with mean values above 3 mW from June to September. The maximum power attained during night was 18.7 mW in September. Note that the trend of mean values largely followed those of the monthly electrical energy outputs in Figure 12. Maximum values, however, behaved differently, indicating that peak values may occur throughout different periods during the year. Nevertheless, it is highly unlikely to reach global peak values in late autumn (winter) months for daytime (nighttime) working mode. The annual mean power value was 8.0 mW.
In comparison with previous STEGs listed in Table 1, the present model obtained the highest peak power and was second in energy per day production. Values per TEG (i.e., dividing generation by nine) were also among the best results. However, the energy density per day was very low due to a design that relied on commercial TEGs whose nominal working point was far from that obtained here. From the economical point of view, the cost per Wh was very high. Building the prototype cost 1096€, of which 28% corresponded to the commercial TEGs and 41% to the aluminum block. As stated above, the annual generation was 70.9 Wh only. At that stage, any comparison with other alternatives may conclude that this type of STEG is economically unfeasible. However, robustness and reliability are key points of these devices for being used in IoT technologies. In addition, there is large room for improvement. From the design point of view, for example, the combination of TEG and photovoltaic generators (PVG) may increase the overall efficiency above 6% in small devices [43]. On the basis of the results, and since daylight time generation was substantially higher than during the night, a priori preferred location would be that with high insolation values. In these sites, however, PVG technology is likely to have much higher efficiency values. Thus, in the case of prioritizing nighttime generation, the preferred sites would correspond to those with high radiative cooling during night, probably obtained at high altitude zones.

4. Conclusions

Laboratory tests of commercial TEG modules designed to work at moderate temperatures (150 °C hot side and 50 °C cold side temperatures) confirmed their ability to deliver power on the order of few mW when working at temperature differences between TEG faces below 5 °C. These power output values were almost independent of the direction of the heat flux through the TEG.
A STEG with nine commercial TEG modules with the air heat exchange zone almost at ground level and 0.5 m deep was designed and tested during an eight-day period (24–31 July 2017). Experimental data of the STEG confirmed that: (1) daylight time temperature differences between TEG faces greatly depended on solar irradiance, with high variations observed in cloudy days; (2) nighttime data showed a much steadier behavior. During the test, peak values of TEG face temperature differences were 3.6 °C during the day and −1.2 °C during the night.
A STEG numerical model was developed and validated with the experimental data. Simulations of one-year cycle (2016) revealed that: (1) diurnal monthly energy generation followed the trend of the horizontal global irradiance with a maximum in July (29.5 kJ); (2) night monthly energy generation had an evolution similar to soil temperature, with a maximum in August (7.2 kJ). Autumn was the best season for nighttime energy generation, whereas late spring and early summer were the best for diurnal. Annually averaged daily energy generation was 697 J d−1, with monthly averages having a maximum of 1102 J d−1 in July and a minimum of 314 J d−1 in November. Averaged energy generation per day during daylight time was 587 J d−1 and during nighttime was 110 J d−1. A ratio of 5.4 for day/night generation was found. Mean power was 8.0 mW but greatly varied between months (monthly averaged values from 3.5 mW in January to 12.6 mW in July) and between day and night (maximum values of 79.8 mW in March and 18.7 mW in September, respectively).
Despite the modest values of energy generation achieved, the high reliability of STEG systems still makes them a promising technique to power grid microdevices. The smooth service observed during the night is of particular interest for those sites where no photovoltaic alternatives are available. In this sense, such STEGs would be better thought as air–soil thermoelectric generators (ASTEG).

Supplementary Materials

Author Contributions

Conceptualization, E.M. and A.M.; methodology, E.M., A.M. and I.R.C.; software, E.B. and I.R.C.; validation, E.B., I.R.C. and T.P.; prototype building, E.B. and A.M., field data campaign, E.M. and A.M.; laboratory test of TEG, E.B. and M.C.; investigation, M.C. and L.M.; formal analysis, E.M., A.M., T.P.; data curation, M.C. and L.M.; visualization, E.B., I.R.C. and T.P.; writing, E.M., A.M., I.R.C. and T.P.; funding acquisition, E.M., A.M. and T.P. All authors have read and agreed to the published version of the manuscript.

Funding

This work was partially funded by the University of Girona under grant MPCUdG2016-4.

Acknowledgments

The authors gratefully acknowledge the technical support provided by Sergi Saus and Jorci Vicens.

Conflicts of Interest

The authors declare no conflict of interest. The funders had no role in the design of the study; in the collection, analyses, or interpretation of data; in the writing of the manuscript, or in the decision to publish the results.

References

  1. De Marqui, C. Piezoelectric Energy Harvesting. In Dynamics of Smart Systems and Structures; Lopes Junior, V., Steffen, V., Jr., Savi, M., Eds.; Springer: Basel, Switzerland, 2016; pp. 267–288. [Google Scholar]
  2. Abdin, Z.; Alim, M.A.; Saidur, R.; Islam, M.R.; Rashmi, W.; Mekhilef, S.; Wadi, A. Solar energy harvesting with the application of nanotechnology. Renew. Sustain. Energy Rev. 2013, 26, 837–852. [Google Scholar] [CrossRef]
  3. Champier, D. Thermoelectric generators: A review of applications. Energy Convers. Manag. 2017, 140, 167–181. [Google Scholar] [CrossRef]
  4. Araiz, M.; Casi, Á.; Catalán, L.; Martínez, Á.; Astrain, D. Prospects of waste-heat recovery from a real industry using thermoelectric generators: Economic and power output analysis. Energy Convers. Manag. 2020, 205, 112376. [Google Scholar] [CrossRef]
  5. Hyland, M.; Hunter, H.; Liu, J.; Veety, E.; Vashaee, D. Wearable thermoelectric generators for human body heat harvesting. Appl. Energy 2016, 182, 518–524. [Google Scholar] [CrossRef] [Green Version]
  6. Comamala, M.; Cózar, I.R.; Massaguer, A.; Massaguer, E.; Pujol, T. Effects of design parameters on fuel economy and output power in an automotive thermoelectric generator. Energies 2018, 11, 3274. [Google Scholar] [CrossRef] [Green Version]
  7. Comamala, M.; Pujol, T.; Cózar, I.R.; Massaguer, E.; Massaguer, A. Power and fuel economy of a radial automotive thermoelectric generator: Experimental and numerical studies. Energies 2018, 11, 2720. [Google Scholar] [CrossRef] [Green Version]
  8. Massaguer, E.; Massaguer, A.; Pujol, T.; Comamala, M.; Montoro, L.; Gonzalez, J.R. Fuel economy analysis under a WLTP cycle on a mid-size vehicle equipped with a thermoelectric energy recovery system. Energy 2019, 179, 306–314. [Google Scholar] [CrossRef]
  9. Comamala, M.; Massaguer, A.; Massaguer, E.; Pujol, T. Validation of a fuel economy prediction method based on thermoelectric energy recovery for mid-size vehicles. Appl. Therm. Eng. 2019, 153, 768–778. [Google Scholar] [CrossRef]
  10. García-Contreras, R.; Agudelo, A.; Gómez, A.; Fernández-Yáñez, P.; Armas, O.; Ramos, Á. Thermoelectric energy recovery in a light-duty diesel vehicle under real-world driving conditions at different altitudes with diesel, biodiesel and GTL fuels. Energies 2019, 12, 1105. [Google Scholar] [CrossRef] [Green Version]
  11. Shittu, S.; Li, G.; Xuan, Q.; Zhao, X.; Ma, X.; Cui, Y. Electrical and mechanical analysis of a segmented solar thermoelectric generator under non-uniform heat flux. Energy 2020, 199, 117433. [Google Scholar] [CrossRef]
  12. Telkes, M. Solar thermoelectric generators. J. Appl. Phys. 1954, 25, 765–777. [Google Scholar] [CrossRef] [Green Version]
  13. Kraemer, D.; Poudel, B.; Feng, H.-P.; Caylor, J.C.; Yu, B.; Yan, X.; Ma, Y.; Wang, X.; Wang, D.; Muto, A.; et al. High-performance flat-panel solar thermoelectric generators with high thermal concentration. Nat. Mater. 2011, 10, 532–538. [Google Scholar] [CrossRef] [PubMed]
  14. Rad, M.K.; Omid, M.; Rajabipour, A.; Tajabadi, F.; Rosendahl, L.A.; Rezaniakolaei, A. Optimum thermal concentration of solar thermoelectric generators (STEG) in realistic meteorological condition. Energies 2018, 11, 2425. [Google Scholar]
  15. Bellos, E.; Tzivanidis, C. Energy and financial análisis of a solar driven thermoelectric generator. J. Clean. Prod. 2020, 264, 121534. [Google Scholar] [CrossRef]
  16. Lv, S.; He, W.; Hu, Z.; Liu, M.; Qin, M.; Shen, S.; Gong, W. High-performance terrestrial solar thermoelectric generators without optical concentration for residential and commercial rooftops. Energy Convers. Manag. 2019, 196, 69–76. [Google Scholar] [CrossRef]
  17. Wei, J.; Zhang, Y.; Wang, J.; Cao, X.; Khan, M.A. Multi-period planning of multi-energy microgrid with multi-type uncertainties using change constrained information gap decision method. Appl. Energy 2020, 260, 114188. [Google Scholar] [CrossRef]
  18. Chowdhury, N.; Pilo, F.; Pisano, G. Optimal energy storage system positioning and sizing with robust optimization. Energies 2020, 13, 512. [Google Scholar] [CrossRef] [Green Version]
  19. Li, Q.; Wang, J.; Zhang, Y.; Fan, Y.; Bao, G.; Wang, X. Multi-period generation expansion planning for sustainable power systems to maximize the utilization of renewable energy sources. Sustainability 2020, 12, 1083. [Google Scholar] [CrossRef] [Green Version]
  20. Luo, X.; Guo, Q.; Tao, Z.; Liang, Y.; Liu, Z. Modified phase change materials used for thermal management of a novel solar thermoelectric generator. Energy Convers. Manag. 2020, 208, 112459. [Google Scholar] [CrossRef]
  21. Shittu, S.; Li, Q.; Xuan, Q.; Xiao, X.; Zhao, X.; Ma, X.; Akhlaghi, Y.G. Transient and non-uniform heat flux effect on solar thermoelectric generator with phase change material. Appl. Therm. Eng. 2020, 172, 115206. [Google Scholar] [CrossRef]
  22. Charris, D.; Gomez, D.; Rincon Ortega, A.; Carmona, M.; Pardo, M. A thermoelectric energy harvesting scheme with passive cooling for outdoor IoT sensors. Energies 2020, 13, 2782. [Google Scholar] [CrossRef]
  23. Zhang, Z.; Wu, Y.; Li, W.; Xu, D. Performance of a solar thermoelectric power-harvesting device based on an all-glass solar heat transfer pipe and gravity-assisted heat pipe with recycling air cooling and water cooling circuits. Energies 2020, 13, 947. [Google Scholar] [CrossRef] [Green Version]
  24. Wang, H.; Li, W.; Xu, D.; Kan, J. A hybrid microenergy storage system for power supply of forest wireless sensor nodes. Electronics 2019, 8, 1409. [Google Scholar] [CrossRef] [Green Version]
  25. Carvalhaes-Dias, P.; Cabot, A.; Siqueira Dias, J.A. Evaluation of the thermoelectric energy harvesting potential at different latitudes using solar flat panels systems with buried heat sink. Appl. Sci. 2018, 8, 2641. [Google Scholar] [CrossRef] [Green Version]
  26. Lawrence, E.E.; Snyder, G.J. A Study of Heat Sink Performance in Air and Soil for Use in A Thermoelectric Energy Harvesting Device. In Proceedings of the Twenty-First International Conference on Thermoelectrics, Long Beach, CA, USA, 29 August 2020; pp. 446–449. [Google Scholar]
  27. Stevens, J.W. Performance factors for ground-air thermoelectric power generators. Energy Convers. Manag. 2013, 68, 114–123. [Google Scholar] [CrossRef]
  28. Whalen, S.A.; Dykhuizen, R.C. Thermoelectric energy harvesting from diurnal heat flow in the upper soil layer. Energy Convers. Manag. 2012, 64, 397–402. [Google Scholar] [CrossRef]
  29. Huang, Y.; Xu, D.; Kan, J.; Li, W. Study on field experiments of forest soil thermoelectric power generation devices. PLoS ONE 2019, 14, 1–13. [Google Scholar] [CrossRef] [PubMed] [Green Version]
  30. Jiang, W.; Yuan, D.; Xu, S.; Hu, H.; Xiao, J.; Sha, A.; Huang, Y. Energy harvesting from asphalt pavement using thermoelectric technology. Appl. Energy 2017, 205, 941–950. [Google Scholar] [CrossRef]
  31. Morais, F.; Carvalhaes-Dias, P.; Daurte, L.; Spengler, A.; de Paiva, K.; Martins, T.; Cabot, A.; Siqueira Dias, J. Optimization of the TEGs configuration (series/parallel) in energy harvesting systems with low-voltage thermoelectric generators connected to ultra-low voltage DC-DC converters. Energies 2020, 13, 2297. [Google Scholar] [CrossRef]
  32. Shen, B.; Hendry, R.; Cancheevaram, J.; Watkins, C.; Martini, M.; Venkatasubramanian, R. DC-DC Converter Suitable for Thermoelectric Generator. In Proceedings of the 24th International Conference on Thermoelectrics, Clemson, SC, USA, 24 October 2005; pp. 529–531. [Google Scholar]
  33. Desai, N.V.; Ramadass, Y.K.; Chandrakasan, A.P. A bipolar ±40 mV self-starting boost converter with transformer reuse for thermoelectric energy harvesting. In Proceedings of the 2014 international symposium on low power electronics and design, La Jolla, CA, USA, 11–13 August 2014; pp. 221–226. [Google Scholar]
  34. Kimura, K.; Koizumi, H. A bipolar power converter with bridgeless boost rectifier for thermoelectric Energy Harvesting. In Proceedings of the 2015 IEEE 2nd International future energy electronics conference (IFEEC), Taipei, Taiwan, 1–4 November 2015; pp. 1–6. [Google Scholar]
  35. Paraskevas, A.; Koutroulis, E. A simple maximum power point tracker for thermoelectric generators. Energy Convers. Manag. 2016, 108, 355–365. [Google Scholar] [CrossRef]
  36. Weather Station NuclierData—Data download. Available online: http://nuclierdata.udg.edu/ (accessed on 4 May 2020).
  37. Wu, J.; Nofziger, D.L. Incorporating temperatura effects on pesticide degradation into a management model. J. Environ. Qual. 1999, 28, 92–100. [Google Scholar]
  38. Institut Cartogràfic i Geològic de Catalunya. Available online: https://www.icgc.cat/ (accessed on 8 April 2019).
  39. Llopis, G.; Rodrigo, V. Guía de la Energía Geotérmica; Dirección General de Industria, Energía y Minas, Consejería de Economía y Consumo, Comunidad de Madrid: Madrid, Spain, 2008. [Google Scholar]
  40. Bergman, T.L.; Lavine, A.S.; Incropera, F.P.; DeWitt, D.P. Fundamentals of Heat and Mass Transfer, 7th ed.; John Willey & Sons: Hoboken, NJ, USA, 2011. [Google Scholar]
  41. Photovoltaic Geographical Information System (PVGIS). Available online: https://ec.europa.eu/jrc/en/pvgis (accessed on 7 May 2020).
  42. Cózar, I.R.; Pujol, T.; Lehocky, M. Numerical analysis of the effects of electrical and thermal configurations of thermoelectric modules in large-scale thermoelectric generators. Appl. Energy 2018, 229, 264–280. [Google Scholar] [CrossRef]
  43. Calderón-Henao, N.; Venturini, O.J.; Medina Franco, E.H.; Silva Lora, E.E.; Scherer, H.F.; Yepes Maya, D.M.; Ando Junior, O.H. Numerical-experimental performance assessment of a non-concentrating solar thermoelectric generator (STEG) operating in the southern hemisphere. Energies 2020, 13, 2666. [Google Scholar] [CrossRef]
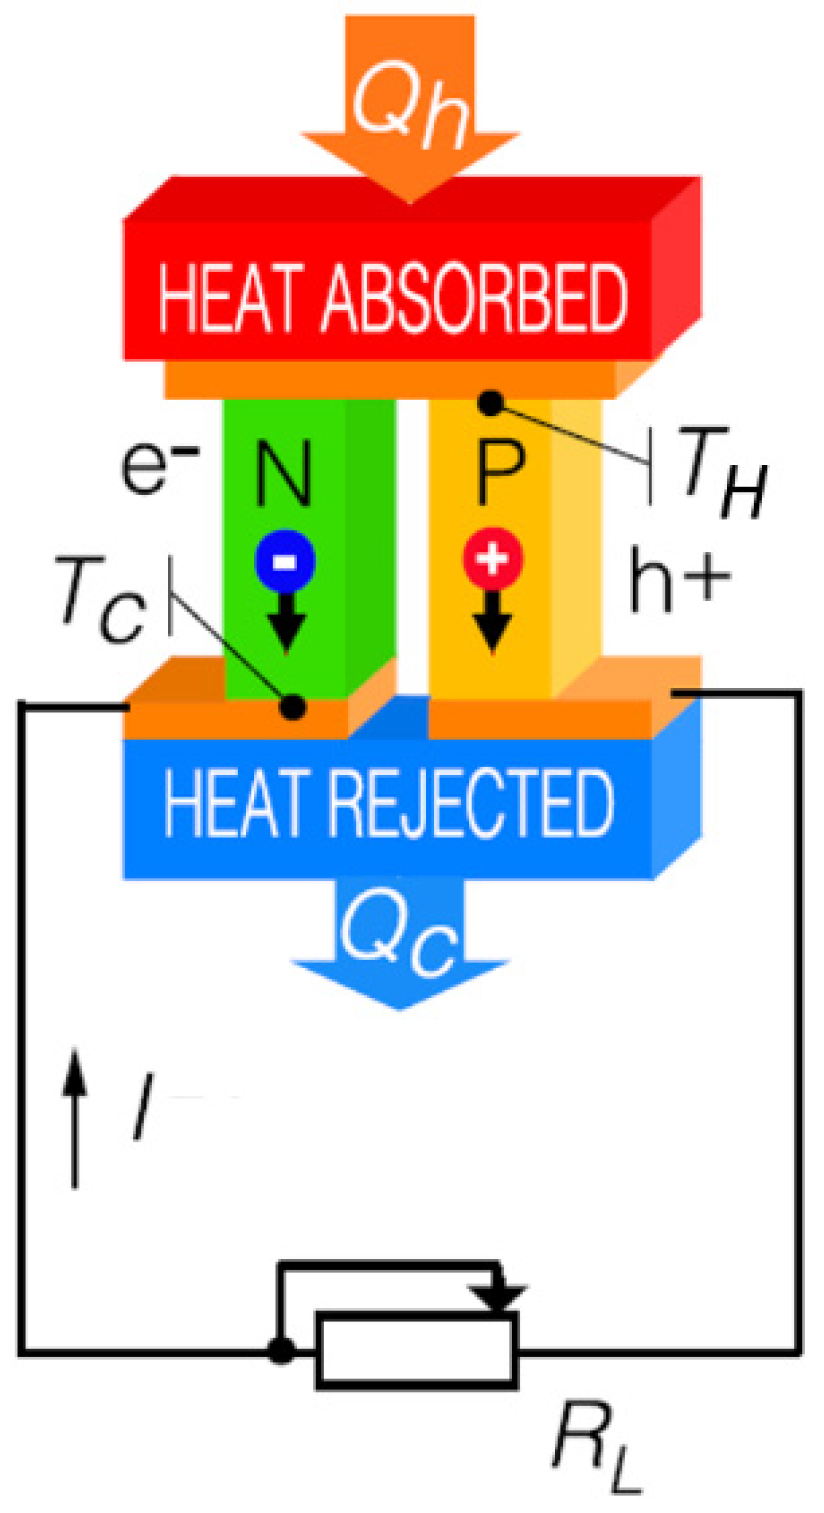
Figure 1. Scheme of a thermoelectric generator where Q h is the absorbed heat flow, Q C is the dissipated heat flow and I is the electrical current. See text for other variables.
Energies 13 03407 g001
Figure 2. Schematic view of the STEG prototype used in the present study with its main components.
Energies 13 03407 g002
Figure 3. (a) View of the STEG before being buried (dimensions of the outer PVC catch basin 440 × 440 mm2 cross sectional area and 400 mm length; of the inner aluminum block 300 × 300 mm2 cross sectional area and 500 mm length; location 41°57′54″ latitude, 2°49′52″ longitude); (b) general view of the STEG location.
Energies 13 03407 g003
Figure 4. Global horizontal solar irradiance received at site (2016; hourly data).
Energies 13 03407 g004
Figure 5. Daily mean air temperature (measured) and surface soil temperature (calculated from Equation (6)) for year 2017.
Energies 13 03407 g005
Figure 6. (a) Domain of the finite element model used to predict the annual production of the STEG; (b) detail of the mesh.
Energies 13 03407 g006
Figure 7. Electrical output power P T E G of a single TEG module experimentally obtained with both normal and reverse positions with respect to the heat flow as a function of the absolute value of temperature differences at both TEG sides | Δ T T E G | . Data available in the Supplementary Materials.
Energies 13 03407 g007
Figure 8. (a) Measured temperature differences at TEG faces. (b) Measured hourly global horizontal irradiance.
Energies 13 03407 g008
Figure 9. Hourly TEG temperature differences from collected data (Figure 8). Data available in the Supplementary Materials.
Energies 13 03407 g009
Figure 10. Experimental (black dots) and model (orange dots) data.
Energies 13 03407 g010
Figure 11. Temperatures of daily mean air (observed) and soil ( z = 0.8 m, calculated for both dry and saturated, when rain recorded, conditions). Year 2016. Data available in the Supplementary Materials.
Energies 13 03407 g011
Figure 12. STEG monthly electrical energy estimated from model (year 2016). Data available in the Supplementary Materials.
Energies 13 03407 g012
Figure 13. Contribution of the two working modes (daytime and nighttime) to the total monthly energy harvested. Data available in the Supplementary Materials.
Energies 13 03407 g013
Figure 14. Monthly maximum and mean values of output power obtained during day and night periods. Data available in the Supplementary Materials.
Energies 13 03407 g014
Table 1. Main features of various solar thermoelectric generators (STEG) devices. Data of last row correspond to the present study.
Soil Heat ExchangerAir Heat Exchanger#TEGsDepth
(m)
Δ T m a x ( ° C ) Peak Power
(mW)
Energy Per Day
(J d−1)
Energy Density Per Day
(J m−3d−1)
Ref
Gravity heat pipe-82.50240.4325.9010,300[24]
Al finnedBlack flat plate10.1022-24.40-[25]
Starfish CuAl finned 110.30100.393.40-[26]
FinnedFinned21.30251.0573.80201,000[27]
Black flat plateBlack flat plate40.01-6.0095.101.36 × 106[28]
Starfish CuCu finned83.304.63.70128.0051,198[29]
Vapor chamberWater tank + vapor chamber30.021745.00840.0093,333[30]
Al blockAl finned90.403.579.79696.968737
1 No solar radiation considered