Article

Property Data Estimation for Hemiformals, Methylene Glycols and Polyoxymethylene Dimethyl Ethers and Process Optimization in Formaldehyde Synthesis

1
Mitsubishi Hitachi Power Systems Europe GmbH, 47059 Duisburg, Germany
2
Electrochemical Process Engineering (IEK-14), Forschungszentrum Jülich GmbH, 52425 Jülich, Germany
3
Techno-Economic Systems Analysis (IEK-3), Forschungszentrum Jülich GmbH, 52425 Jülich, Germany
4
JARA-ENERGY, 52056 Aachen, Germany
5
Chair for Fuel Cells, Faculty of Mechanical Engineering, RWTH Aachen University, 52072 Aachen, Germany
*
Author to whom correspondence should be addressed.
Energies 2020, 13(13), 3401; https://doi.org/10.3390/en13133401
Submission received: 1 June 2020 / Revised: 27 June 2020 / Accepted: 29 June 2020 / Published: 2 July 2020
(This article belongs to the Section I: Energy Fundamentals and Conversion)

Abstract

:
Polyoxymethylene dimethyl ethers (OMEn) are frequently discussed as alternative diesel fuels, with various synthesis routes considered. OME3–5 syntheses demand significant amounts of thermal energy due to the complex separation processes that they entail. Therefore, innovative process designs are needed. An important tool for the development of new processes is process simulation software. To ensure sound process simulations, reliable physico-chemical models and component property data are necessary. Herein we present the implementation of a state-of-the-art thermodynamic model to describe the component systems of formaldehyde-water and formaldehyde-methanol using Microsoft® Excel (2010, Microsoft Corp, Redmond, WA, USA) and Aspen Plus®, (V8.8, Aspen Tech, Bedford, MA, USA) determine the deviation between the calculated results and experimental literature data, and minimize the deviation by means of parameter fitting. To improve the accuracy of the estimation of the missing property data of hemiformals and methylene glycols formed from formaldehyde using group contribution methods, the normal boiling points were estimated based on molecular analogies. The boiling points of OME6-10 are determined through parameter regression in accordance with the vapor pressure equation. As an application example, an optimization of the product separation of the state-of-the-art formaldehyde synthesis is presented that helps decrease the losses of methanol and formaldehyde in flue gas and wastewater.

Graphical Abstract

1. Introduction

In replacing fossil fuels in the transport sector, one promising option is fuel synthesis via the so-called power-to-fuel (or power-to-liquid) concept [1]. In the power-to-fuel concept, H2 produced via electrolysis powered by renewable energy and CO2 are used to synthesize transport fuels. The required CO2 can be captured for instance from industrial exhaust gases or ambient air. One frequently discussed alternative diesel fuel or diesel fuel additive is poly oxymethylene dimethyl ethers, which have a chain length of 3 to 5 (OME3–5) [1,2,3,4,5,6]. Furthermore, OME1 can be used as a fuel additive [7,8]. Several studies [9,10,11,12,13,14,15,16] deal with the energy demand of OME3–5 synthesis based on hydrogen or methanol.
According to simulations performed by Peters [17], the direct synthesis of OME3–5 from H2 and CO2 is, thermodynamically-speaking, virtually impossible. Although the direct synthesis of OME1 from H2 and CO2 is possible under high pressures and at low temperatures, side reactions play a crucial role and a suitable catalyst would have to suppress dimethyl ether (DME) formation [17]. Further thermodynamic analyses regarding synthesis routes are published by Peters et al. [18]. The recent progress in the production of OME3–5 is discussed, for instance, by Baranowski et al. [19] and Hackbarth et al. [20]. As is outlined in the literature [19,20,21,22,23], various synthesis routes are under discussion, wherein important intermediates along the routes include formaldehyde (FA) solutions, trioxane (TRI), DME and methylal (OME1).
We recently published a comparative techno-economic analysis of different H2-based production pathways towards higher alcohols, ethers including OME3–5 and hydrocarbons [11]. In the course of that work, the three OME3–5 synthesis routes suggested by Burger [21] were analyzed. As a result, compared to other H2- or methanol-based production pathways towards fuels or chemicals, the OME3–5 synthesis routes have the highest utility demand and, as a result, utility costs [11]. However, there is still potential for process optimization. For large-scale production in particular, the optimization of separation processes is crucial to minimizing the production costs. For process intensification and, in particular, for the challenging separation of the by-product water along the OME3–5 synthesis routes, various innovative technologies are suggested, for instance integrated reaction-distillation [24], adsorption technologies using zeolites [25], pervaporation [26], thin film evaporators [12] and falling film evaporators [13]. For the correct determination of energy expenditures and the optimal design of plant components, the use of process simulation software is effective. For reliable process simulation, the component behavior and physical properties must be known and predictable using the software.
In OMEn syntheses, aqueous and methanolic formaldehyde (FA) solutions play an important role, as the water separation from FA solutions is especially energy-intensive. FA is one of the most important intermediates in the chemical industry, requiring about 50% of the methanol produced worldwide, and is commercially-available in three forms: aqueous formaldehyde solution (formalin, 35–55 wt.-%), in the form of 1-3-5-trioxane (TRI; C3H6O3) and para-formaldehyde (p-FA) [27]. p-FA is polymeric FA obtained by evaporating an aqueous solution and is present with degrees of polymerization up to 100 as a thermally unstable gel and depolymerized slightly to form FA [27]. The technical handling of FA, as well as industrially-established production processes of FA from methanol, are presented by Reuss et al. [28].
FA spontaneously reacts without any catalyst with water (W) and methanol (MeOH) to form polyoxymethylene glycols (MGn) and polyoxymethylene hemiformals (HFn) [29,30,31]. MGn and HFn form homologous series with chain length n, corresponding to the number of FA components. In contrast to OMEn, MGn and HFn are unstable and cannot be obtained in the form of pure substances. The reaction network presented in the literature [30,31,32,33,34,35] as well as the molecular structures are shown in Figure 1. MGn and HFn with chain length n ≥ 2 have negligible vapor pressures [36,37], and so their presence can be neglected in the gas phase, as is shown in Figure 1. High FA contents lead to high degrees of polymerization, which can then lead to solid precipitation [33,37,38,39]. Solid precipitation occurs in solutions with >60 wt.-% FA [37] and must be avoided in technical applications, for instance by using stabilizers or small shares of methanol [28].
In recently published literature [19,24,25,29,40,41,42], an alternative chain growth mechanism to that shown in Figure 1 has been proposed, in which the chain length of MGn and HFn increases by the addition of FA. The conditions under which the individual mechanisms dominate is not clearly indicated in the literature. In process modeling, spontaneous equilibrium reactions must be considered in all process units in which FA is present, together with water and/or methanol. If the process simulation can be validated with experimental data, the mechanism of the equilibrium reactions is not directly relevant for the process design and analysis.
To determine the utility demand of separation units, thermodynamic data are required, e.g., vapor pressure, vaporization heat and heat capacity. However, in the case of OMEn>1, MGn and HFn, these data are not given the built-in property databases of process simulation programs such as Aspen Plus® and CHEMCAD. The property data of MGn and HFn must be estimated, as these substances do not exist in pure form and thus cannot be physically measured. The description of MGn and HFn as real components in the process simulation software is therefore necessary, as the reaction mechanism in the reactor depends on these components.
For robust process simulation, missing property data must be determined with experimental literature data, estimated or predicted using suitable prediction models. As stated by Ouda et al. [41], small errors in property data estimations accumulate and can affect the simulation and calculation results. Prediction models are based on the group contribution methods (e.g., Universal Quasichemical Functional Group Activity Coefficients (UNIFAC) [43], Joback [44] and Gani [45]). In general, at least the structural formulae and normal boiling points should be given for the use of property prediction models [46]. Thus, the property prediction models can be used to estimate all of the important scalar and temperature-dependent variables (i.e., critical temperature, critical pressure, vapor pressure, heat of vaporization, heat capacity, etc.) necessary for calculating material and energy balances, as well as phase equilibria. For the design of thermal separation processes, the minimum required component property data are temperature-dependent vapor pressure, heat capacity and vaporization heat.
In this paper, we discuss the deviation between calculated and experimental data using a physico-chemical system which we built-up in commercial spreadsheet software, as well as process simulation software. Another goal of this work is to develop an approach to improve the predictions of missing property data for HFn and MGn using group contribution methods via the estimation of normal boiling points. For the sake of completeness, the thermodynamic data of the component systems containing trioxane, DME and OMEn in process simulations are outlined through literature references or determined in the course of this paper. Another aspect is to show how the state-of-the-art FA synthesis process of the OME3–5 synthesis route can be optimized by recycling wastewater. In the course of that, the product of the FA synthesis is also adjusted, as different processes along the OME3–5 synthesis routes require different FA solutions as input material. For the sake of clarity, the research approach followed in this paper is presented in Figure 2.

2. Prior Work on Reaction Model and Property Data

In 1986, Maurer [32] described non-ideal reaction behavior in terms of activity-based equilibrium constants. Maurer [32] determined the necessary information for the UNIFAC method by drawing on the work of Gmehling et al. [47]. The fundamental physico-chemical equilibrium model developed by Maurer [32] was validated and further developed by a research group at the University of Kaiserslautern [31,33,34,35,36,48,49,50,51,52,53,54]. In particular, the models of Albert et al. [52] and Kuhnert et al. [33] are based on broad experimental data. The application, quality and constraints of the model published by Albert et al. [36] are discussed in O’Connell et al. [39]. Additionally, O’Connell et al. [39] modeled solid precipitation based on data from Kuhnert et al. [33,55]. As well as the equilibrium model, Hasse and Maurer [56] and Hahnenstein et al. [30] published a reaction kinetic model to describe the temperature and pH depending on HFn and MGn formations. This kinetic model was further developed by Ott et al. [57] and can be used in combination with the thermodynamic models of Albert et al. [52] and Kuhnert et al. [33] in process simulations of thermal separations of FA-containing component systems [57].
For use in process simulations for the basic engineering of the FA-containing processes, the further extended fundamental model published by Maurer [32] was applied by a number of companies [39], with various examples of its implementation to be found in the literature.
To determine the impact of kinetics, Grützner et al. [40] implemented two approaches using CHEMASIM software from BASF: the equilibrium model of Kuhnert et al. [33] and an advanced model that also included a reaction kinetic model, using the approach of Ott [58], which is based on the work of Hahnenstein et al. [30]. The predictions of both approaches are in good agreement with the experimental distillation data [40]. Analogously, Weidert et al. [24] showed that the implementation of the equilibrium model of Albert et al. [53] und Kuhnert et al. [33] in Matlab was also effective in predicting the experimental distillation data. Thus, referring to Grützner et al. [40] and Weidert et al. [24], the assumption that the chemical equilibrium of the component system FA-W-MeOH is reached at every distillation column stage is justified, and so the equilibrium model can be used in the process simulation. This reduces the computational effort compared to the kinetic approaches. The latest applications of the equilibrium model in the process simulations are published by Ouda et al. [59] using CHEMCAD and Ai et al. [60], Bongartz et al. [10], Burre et al. [13] and Schemme et al. [11] using Aspen Plus®.
As an alternative to property data modeling via merely group contribution models, Liu et al. [61] and Albert et al. [36] published correlations for the heat capacities of HF1–10 (for 312–347 K) and MG1–10 (for 323–363 K) and vapor pressures for HF1 and MG1 (for 293–413 K). Correlations for the temperature-dependent enthalpy of evaporation and isobaric heat capacity of the ideal gas of OME2–10 are published by Burger et al. [62]. For the implementation of component properties in CHEMCAD, Ouda et al. [59] estimate the heat capacities cP of HFn > 1, as well as MGn > 1, HF9–10 and MG9–10 to be equal to those of the corresponding OMEn and OME8, respectively. Bongartz et al. [10] recently published an approach to modeling the temperature-dependent enthalpies of vaporization and the ideal gas heat capacities of MGn and HFn based on the original model [49,61,63] to be used in Aspen Plus®. To comply with the assumption that the presence of HFn > 1 and MGn > 1 in the gas phase can be neglected, Ouda et al. [59] estimate the vapor pressures of HFn > 1 and MGn > 1 to be equal to those of OME8. For the same reason, Bongartz et al. [10] set the normal boiling points of HFn > 1 and MGn > 1 at 1000 K and calculated the critical points of HFn and MGn using the group contribution from Ott [58].

3. Modeling Approaches and Discussion of the Results

In this section, the required methodology is developed and implemented according to the research design presented in Figure 2. Firstly, the numerical approaches to describe the chemical model are developed in Section 3.1 to prepare the basis for process simulations. This is followed by Section 3.2, which deals with the estimation of missing property data. The developed methods and their outcome flow into Section 3.3., in which a process optimization is practiced for the selected example of formaldehyde synthesis.

3.1. Development of the Chemical Model

To ensure sound process simulation design, as a first step, a physico-chemical system is simulated by means of a numerical approach using Microsoft® Excel to illustrate the phase equilibria of FA-W and FA-MeOH and create a fundamental understanding of the component system.
The modeling of the reaction network shown in Figure 1 is based on the work of Maurer [32], which is state-of-the-art and describes the reactions and component distribution with activity-based equilibrium constants using the UNIFAC method [43], linked to the extended Raoult’s law to model the gas phase. The model, drawn from Maurer [32] and describing the activity coefficients, is presented in the Appendix A (see Equation (A1) to (A4)). The necessary data of the molecular groups of W, FA, MeOH, HFn and MGn required by the UNIFAC method are also noted in Maurer [32]. The molecular groups CH2(OH)2 and CH2OH are not standard groups of the UNIFAC method. The phase equilibria depending on the mole fractions of FA-W and FA-MeOH can be determined by calculating the stoichiometric mole fractions using the reaction equations as described by Albert et al. [52] (see Equation (A5) to (A8) in the Appendix A).
In the following sub-section, firstly the numerical approach will be developed. Afterwards, the developed chemical model will be implemented in process simulation software. As the last step, the remaining component systems trioxane, DME, OMEn are given for the sake of completeness.

3.1.1. Numerical Approach for Formaldehyde-Containing Component Systems

In the numerical approach, the UNIFAC method [43] for calculating the activity coefficients is implemented in Microsoft® Excel and logically linked to the volume, surface and interaction parameters drawn from the work of Maurer [32]. Additionally, the correlations for the equilibrium constants given by Maurer [32] (Equation (1)) and mass balances (Equations (A5) to (A8)) given by Albert et al. [52] to recalculate the FA, W and MeOH shares were implemented.
ln ( K i n ) = A + B T / K + C ( T / K ) 2
The correlation between the UNIFAC method, which uses the equilibrium composition of the liquid phase to predict the activity coefficients γi, and the correlation for the equilibrium constant, which in turn determines the equilibrium composition using the activity coefficient, results in a circular dependency. As a starting point, the activity coefficients are set to γi = 1. As a termination criterion, the activity of water γW was chosen. According to Equation (2), the relative deviation e of two successive iterations (z − 1 and z) should fall below a specific value. For convergence, the maximum relative deviation was set to e = 0.1%:
| γ W z γ W z 1 γ W z | e
The numerical solution is complicated by unstable target values that permanently decay into two thermodynamically-inconsistent but stable points, which cannot represent the experimental data. Therefore, an additional convergence strategy was used to allow the unstable point to be transformed into a stable point according to Equation (3):
γ i z = 0.5   γ i z 1 + 0.25   γ i z 2 + 0.25   γ i z 3
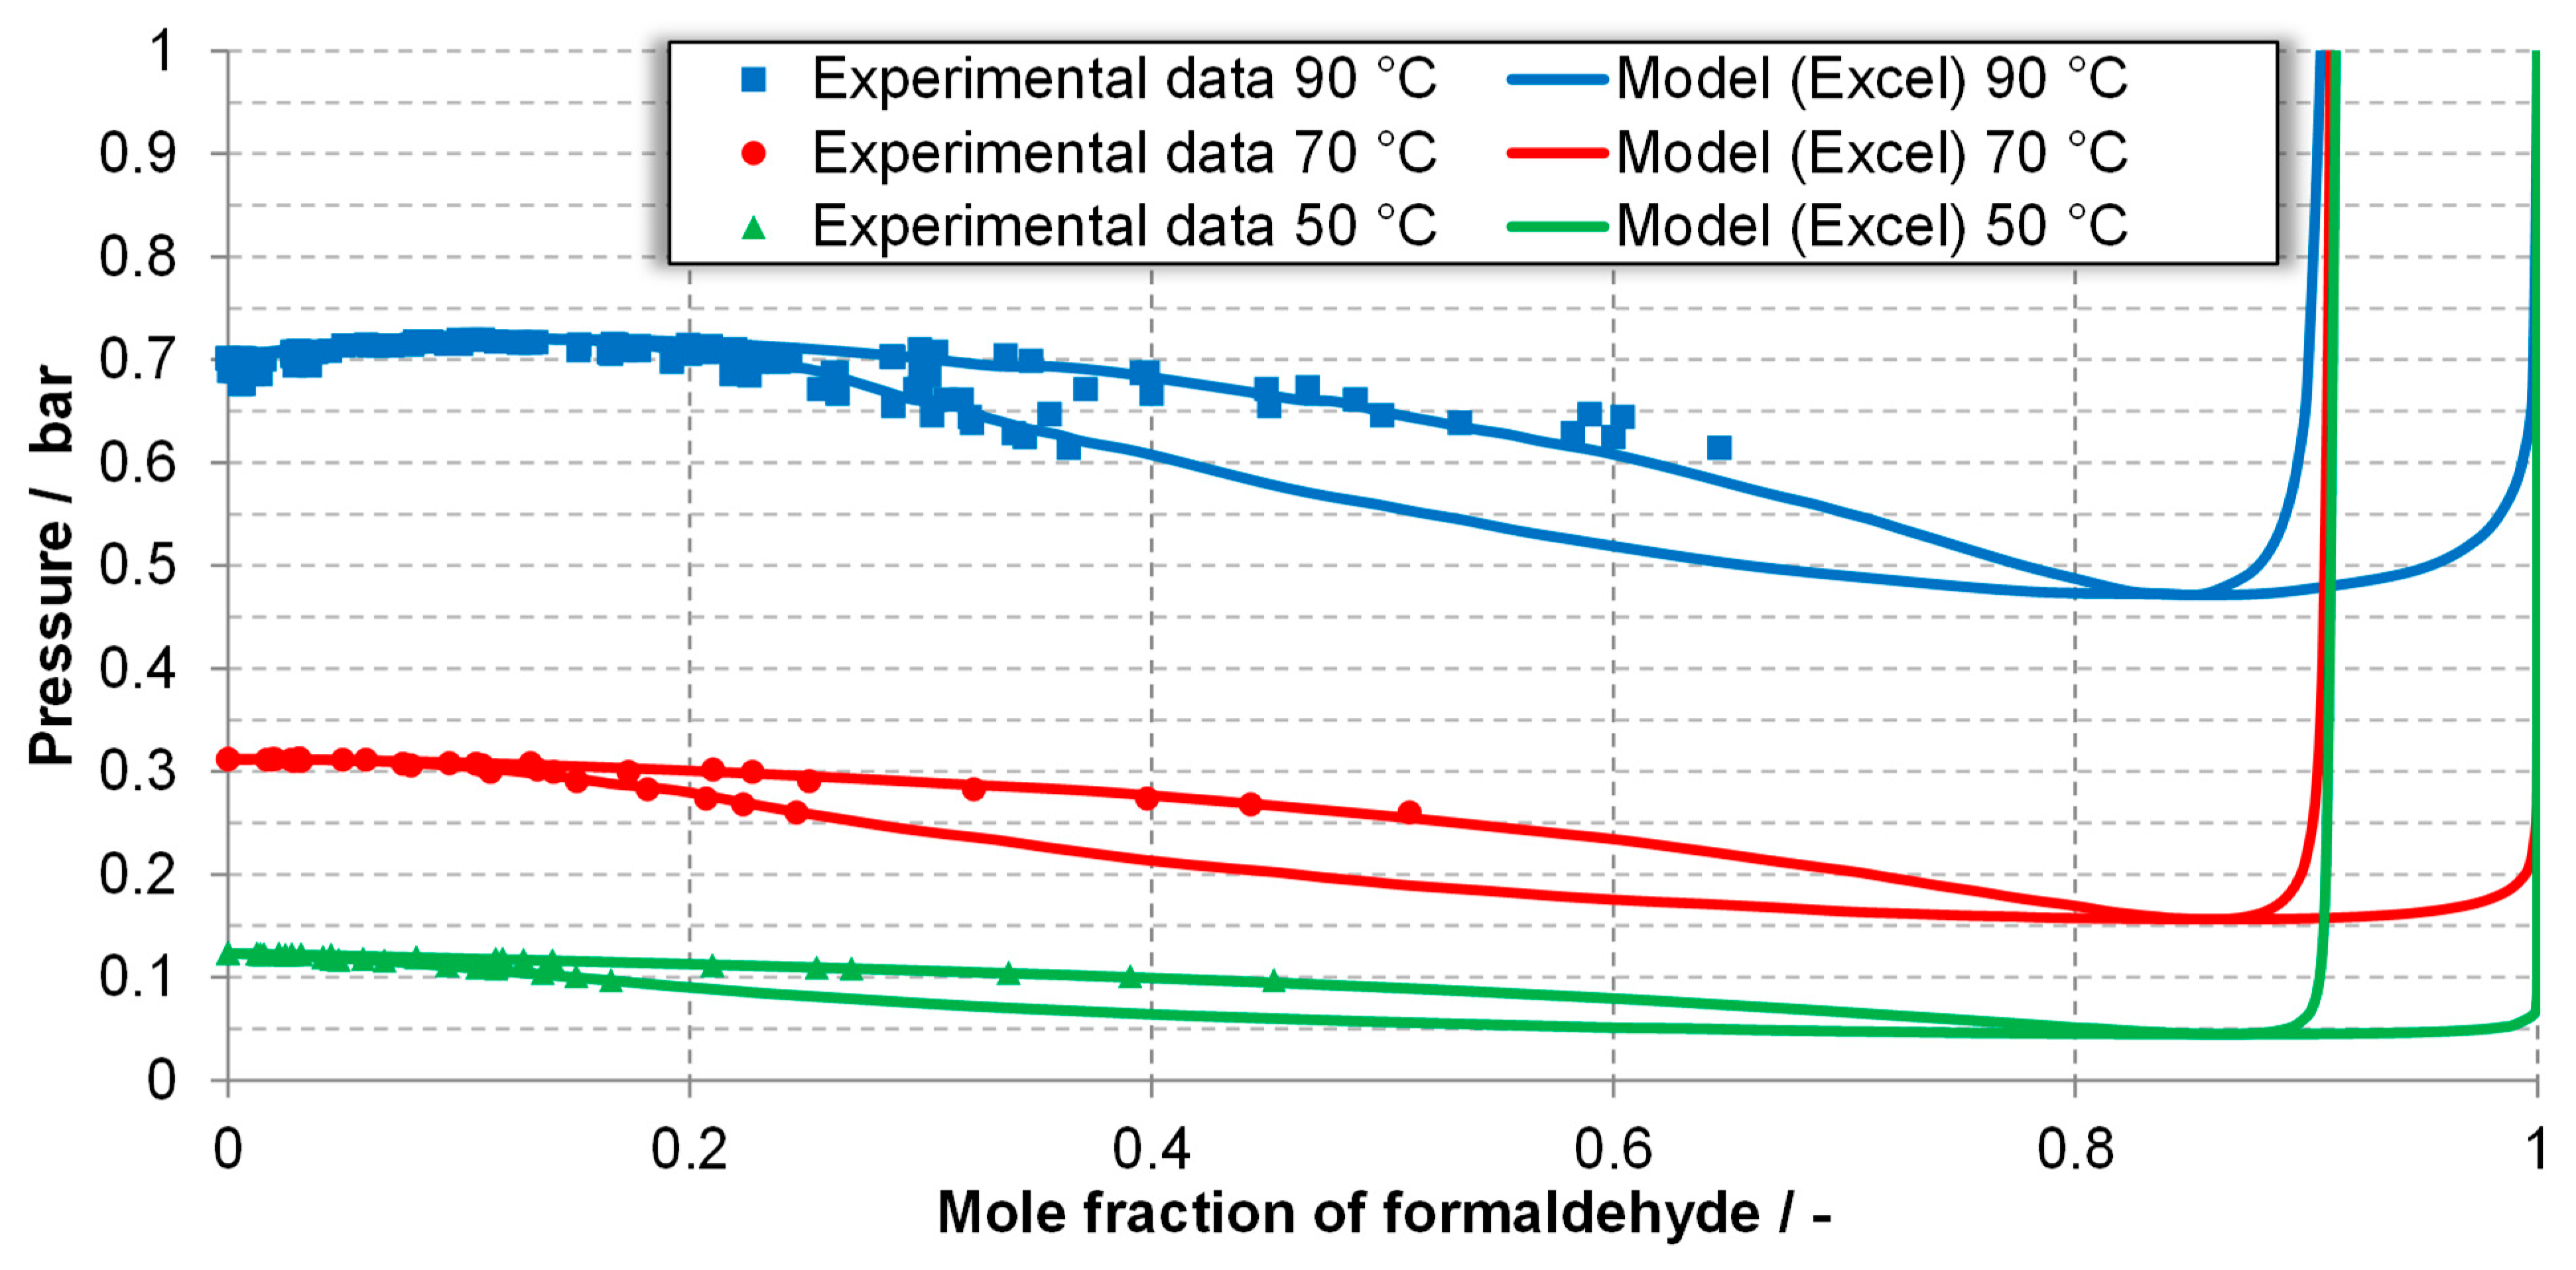
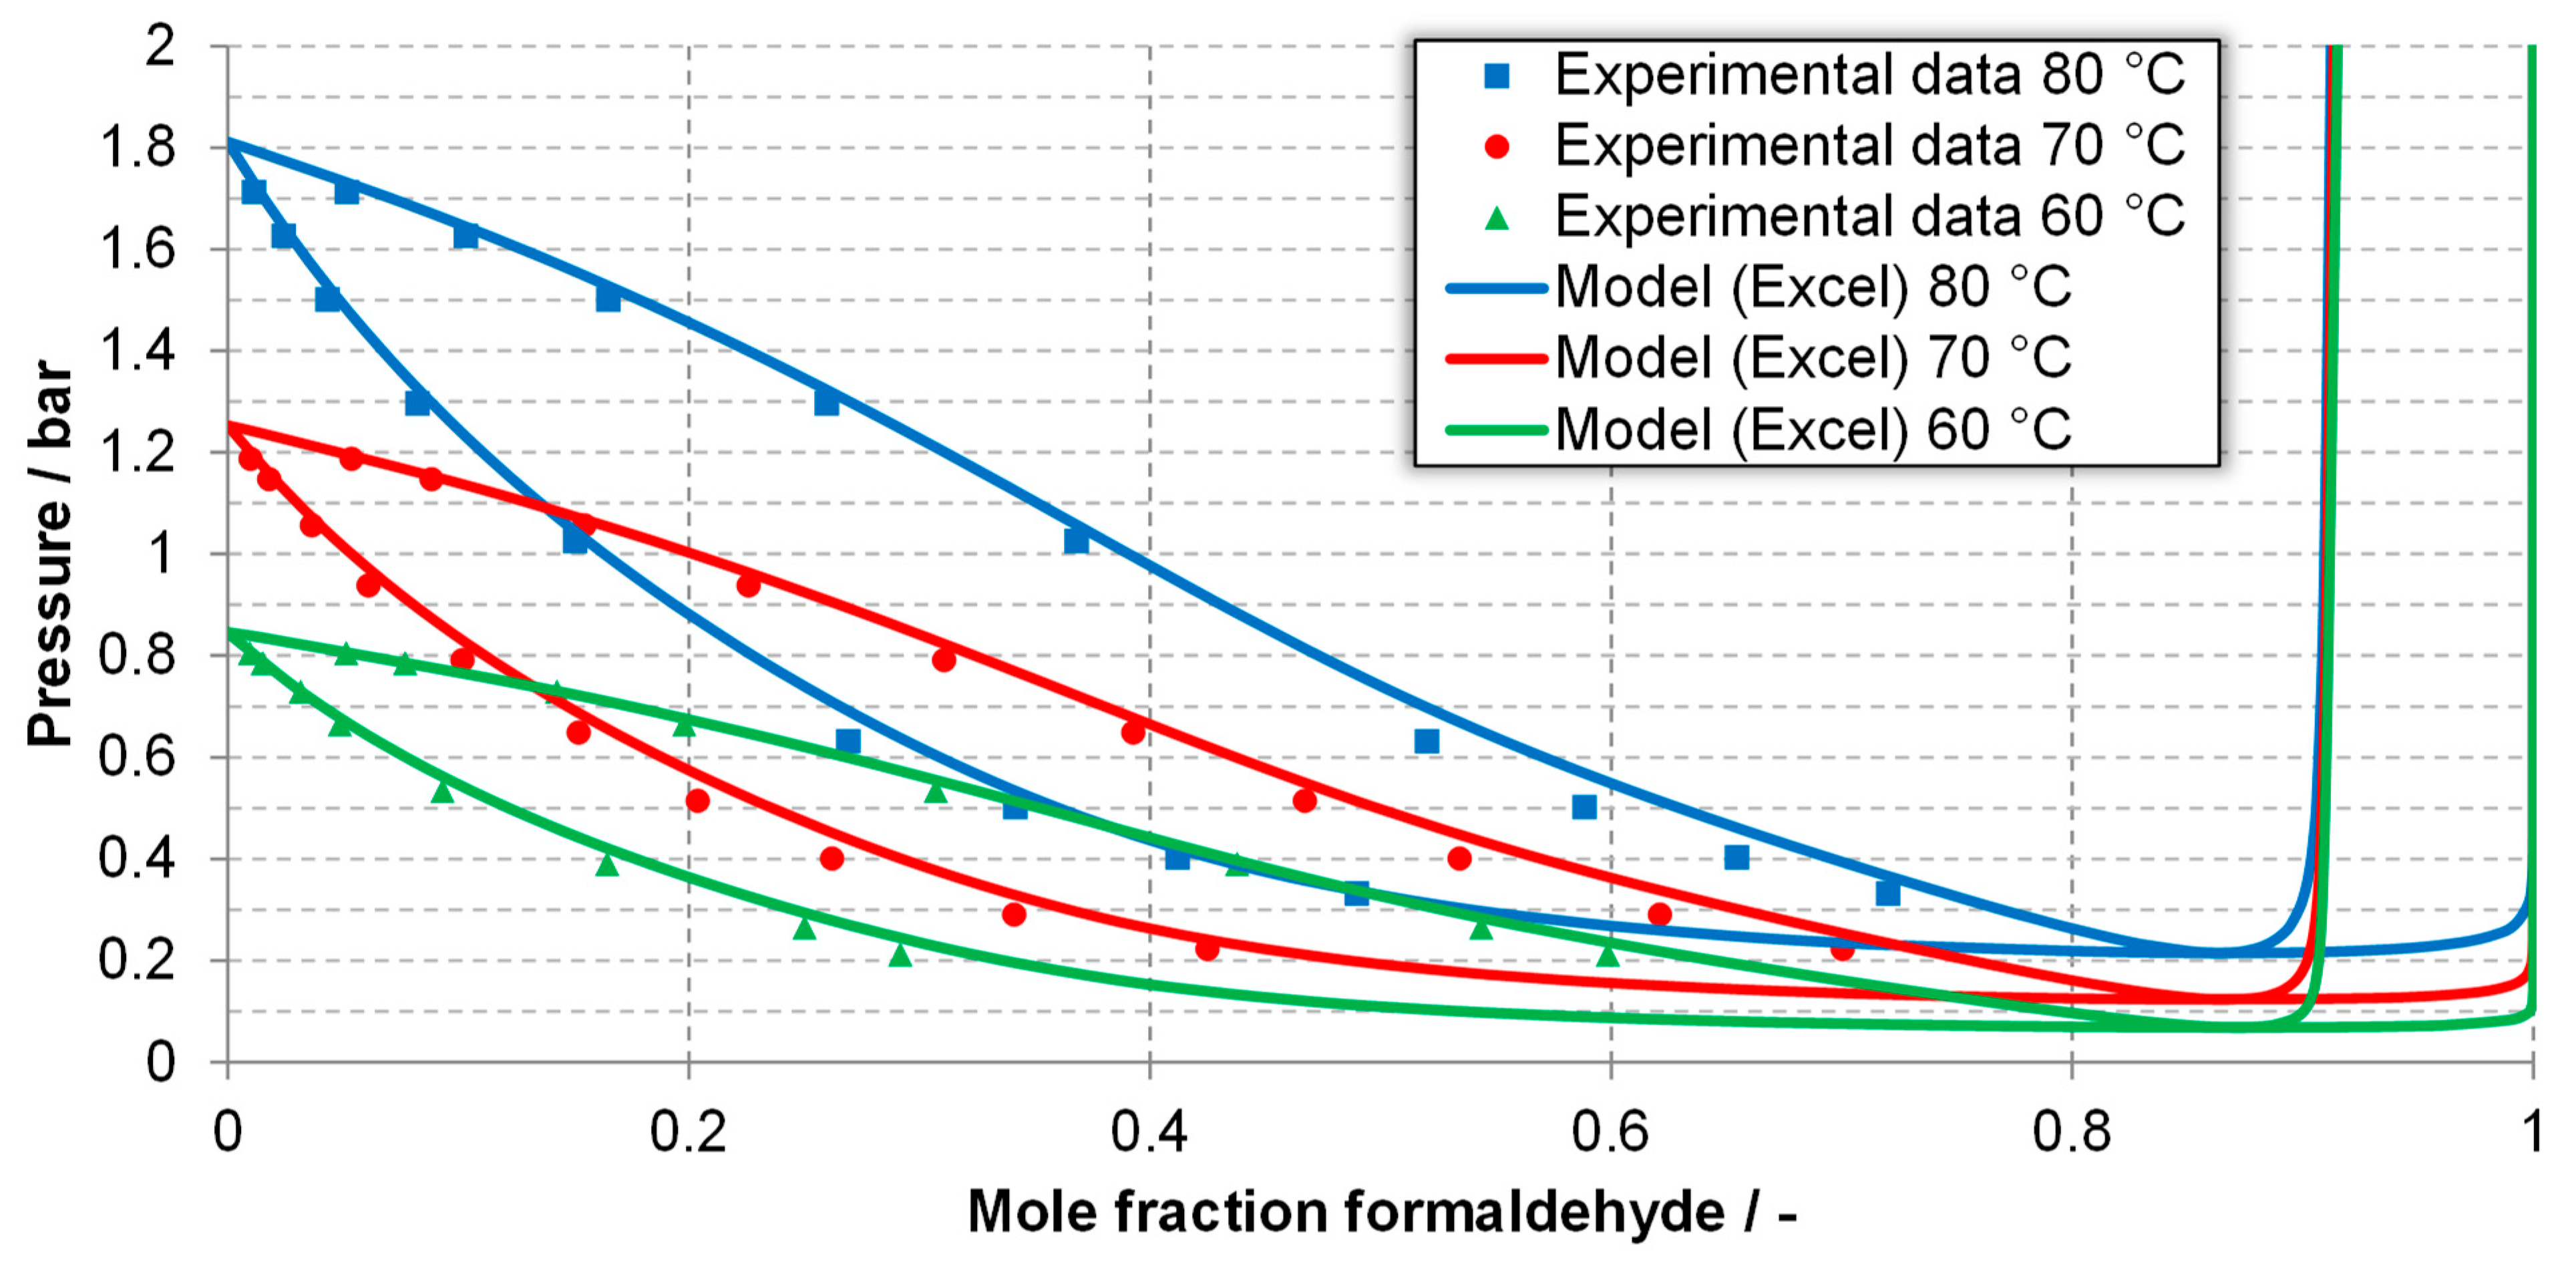
Figure 3 and Figure 4 show the pressure-dependent phase equilibria for the component systems FA-W and FA-MeOH that were determined with the implemented approach compared to the experimental literature data [32,34,64,65] (with 72 data points for FA-W and 27 data points for FA-MeOH). Maurer [32] suggests a maximum oligomer chain length of n = 30. As in the works of Ott [58], Ouda et al. [41] and Bongartz et al. [10], in this work the maximum chain length is set to n = 10 to reduce computational requirements. As Figure 3 and Figure 4 show, calculations with the maximum chain length of n = 10 are sufficient to get very close to the experimental data.
The vapor pressures in the component systems FA-W and FA-MeOH remain low over a wide molar range of FA and are even smaller with increasing FA content. The reason for this is the continuous reactions of FA to long-chain oligomers, which have a lower vapor pressure. The reaction occurs until all the water has reacted to the methylene glycols and methanol to hemiformal and is no longer present in the equilibrium state. Therefore, the oligomerization reactions in more concentrated FA solutions can no longer take place where monomeric FA is present. The monomeric FA evaporates, significantly increasing the vapor pressure. An azeotropic point exists for both material systems, with an FA content of about 85 mol.-%. At 90 °C and 70 °C, the FA-W system also has more azeotropes at FA levels of 12 mol.-% and 2 mol.-%, which is not directly apparent in Figure 3.
Table 1 shows the average of the relative deviations of pressure and temperature (ARDp,T; see Equation (4)) and the standard deviations (sp,T; see Equation (5)) of the modeled phase equilibria diagrams shown in Figure 3 and Figure 4 to the 99 experimental data points given in the diagrams. In each case, the values are determined for the dew point and boiling point line of the component system.
ARD p , T = 1 m i = 1 m ( | p , T m exp . p , T m model p , T m exp .   | )
s p , T = 1 m i = 1 m ( | p , T m exp . p , T m model p , T m exp .   | ARD p , T ) 2
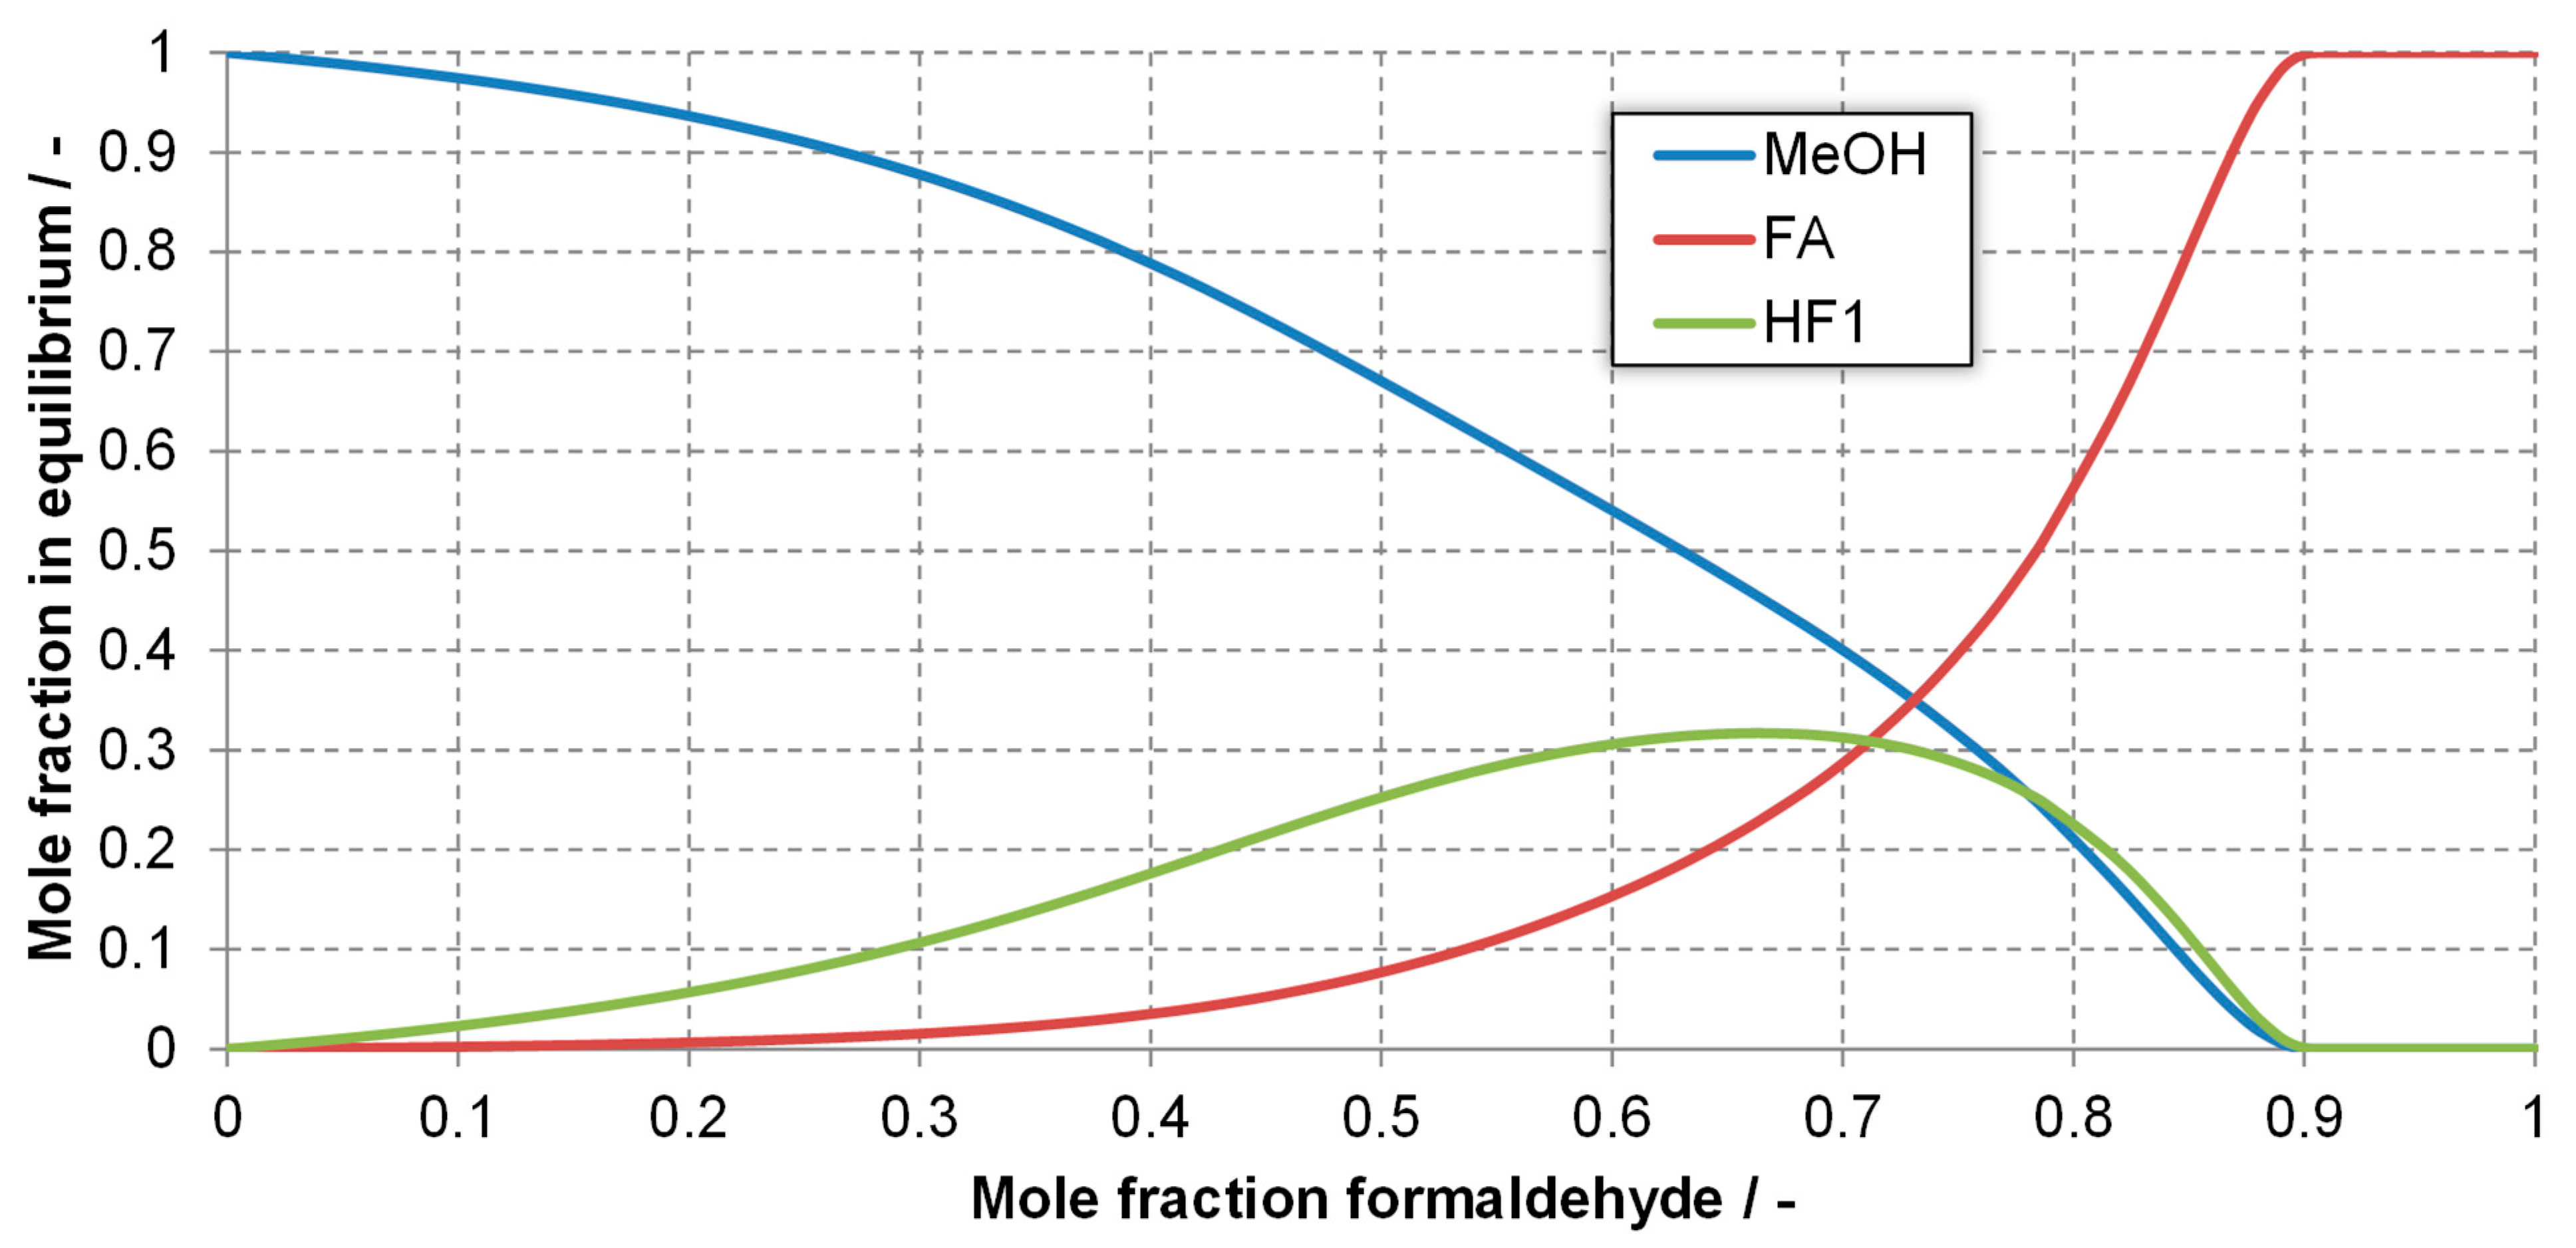
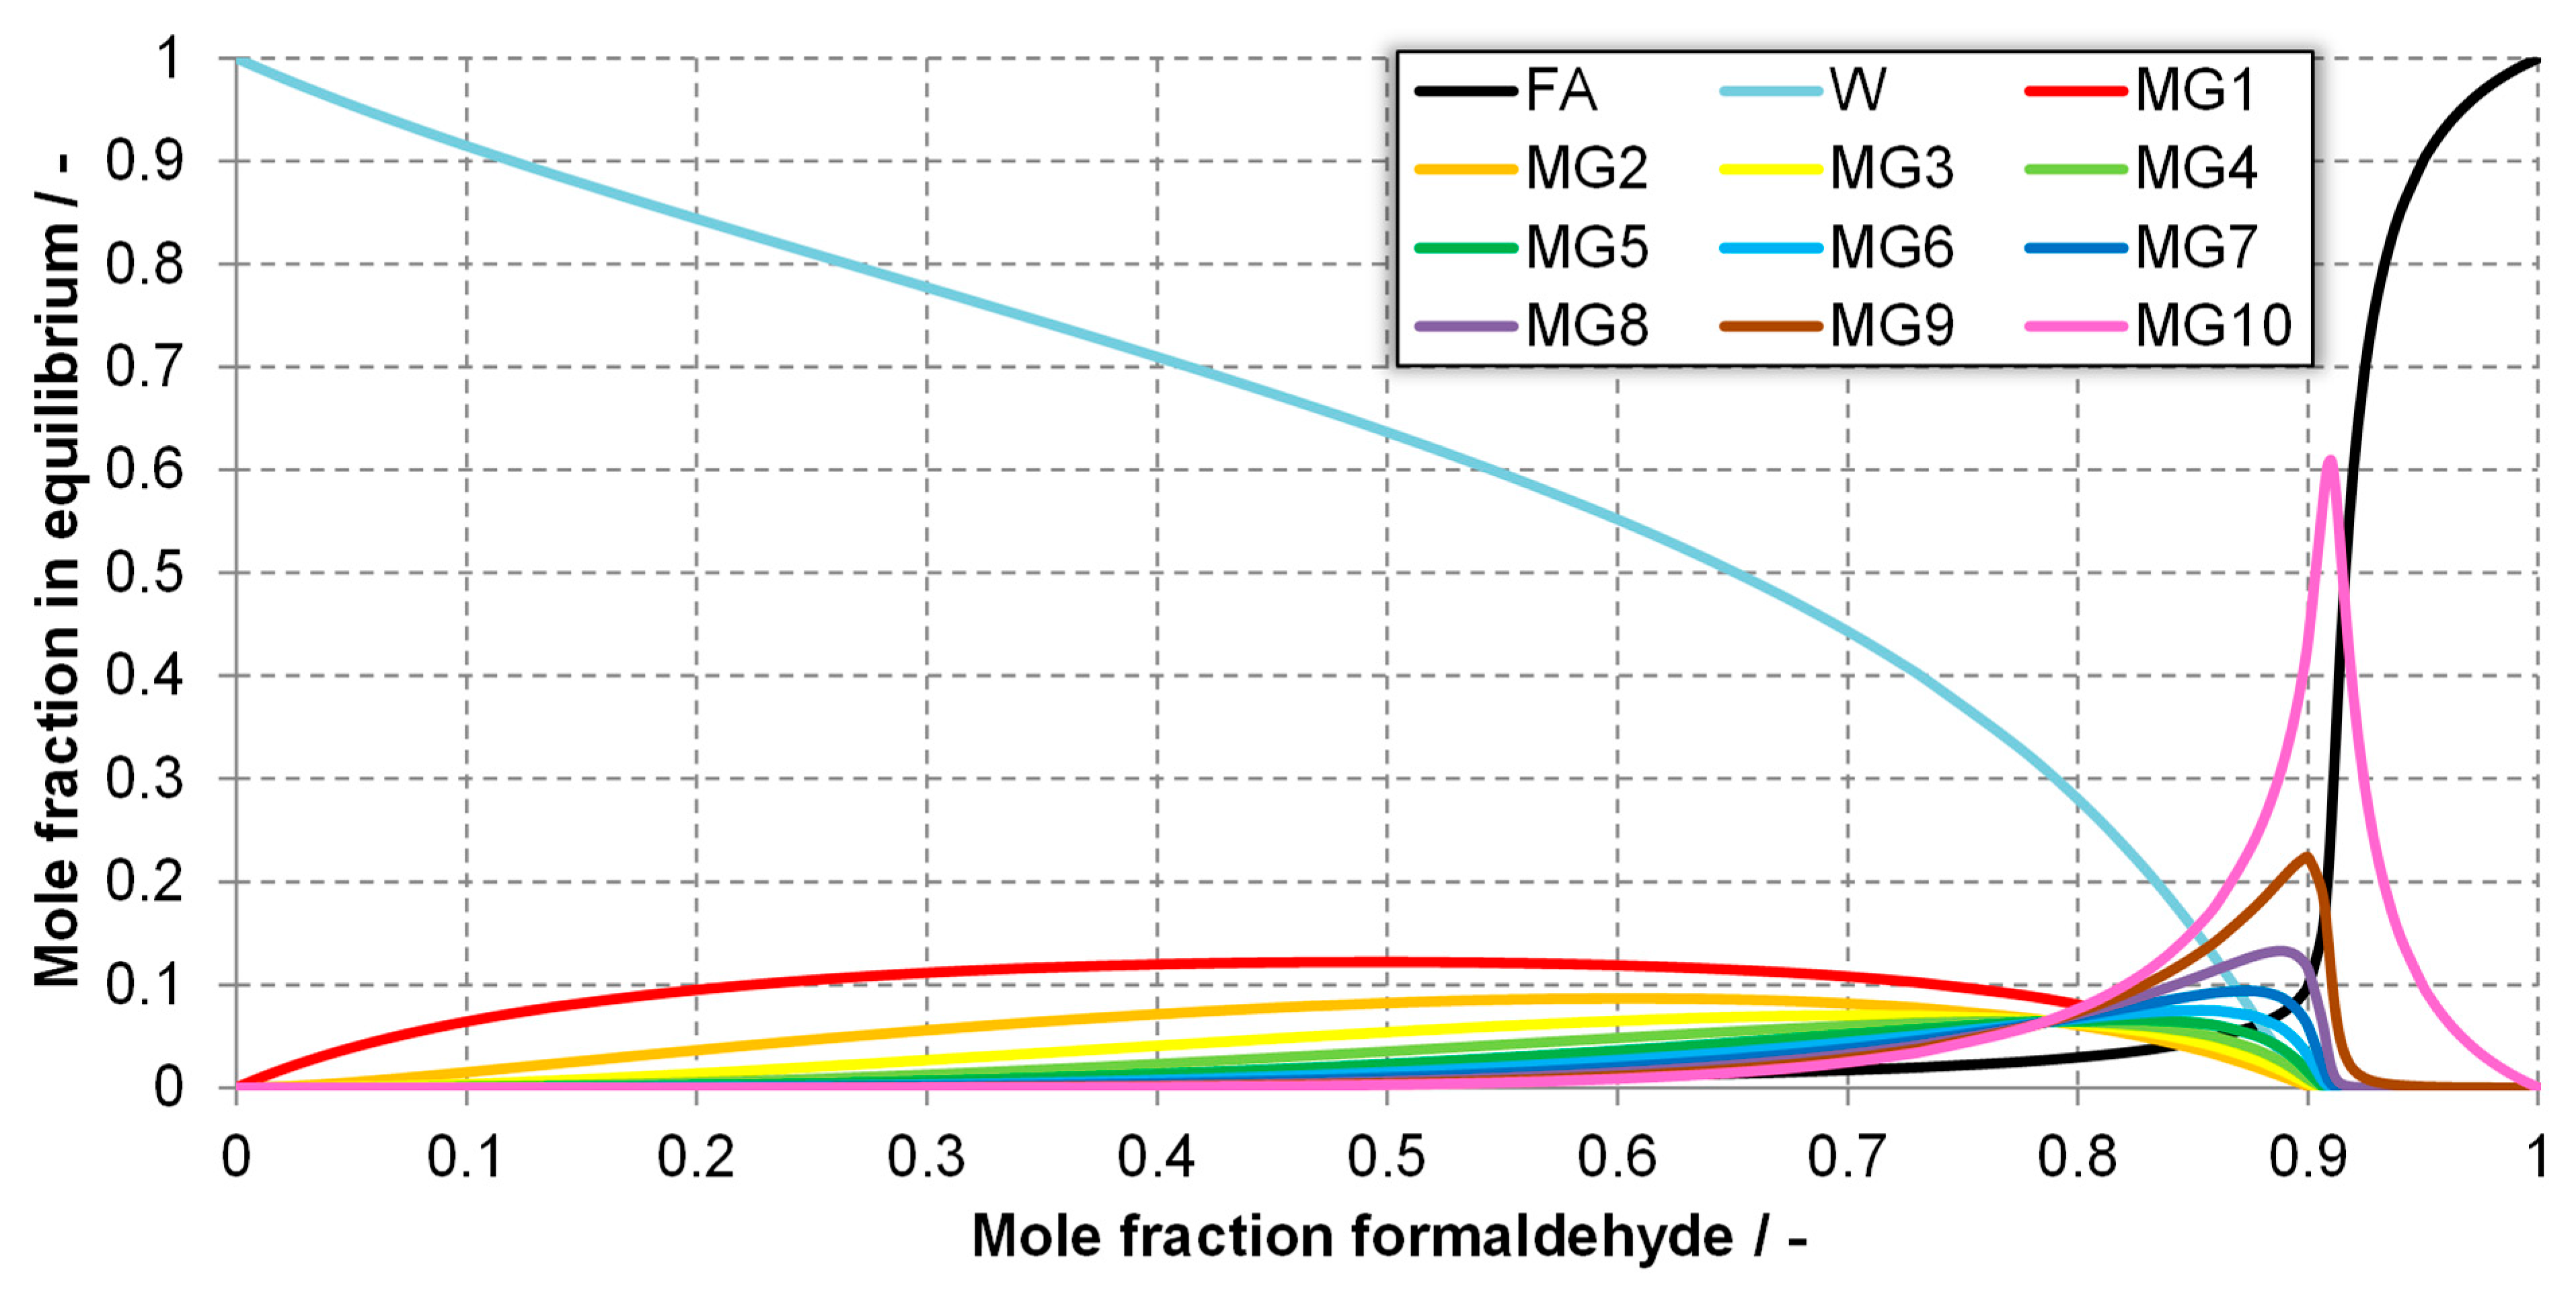
The processes in aqueous and methanol-containing formaldehyde solutions can be even better clarified with the equilibrium distributions of the oligomers MGn and HFn, as is shown in Figure 5 and Figure 6. For recalculated FA mole fractions of 0–90 mol.-%, monomeric FA is present in the corresponding equilibrium state with only a maximum of 10 mol.-%, while the remaining fraction is polymerized. The corresponding equilibrium distributions in the gas phase are given in Figure A1 and Figure A2 in the Appendix A. For a recalculated FA content of ca. 91 mol.-%, the entire water content is bound in the oligomers. Therefore, as is shown in Figure 5 and Figure 6, in both component systems the content of MG10 or HF10 in equilibrium in this case reached the maximum with a value of more than 60 mol.-%.
Generally, however, such high FA contents are not technically relevant, as otherwise the long oligomers precipitate as solids. Ott et al. [37], state that solids precipitate in FA-W and FA-MeOH solutions with > 60 wt.-% FA (corresponding to 47.4 mol.-% FA in FA-W and 61.5 mol.-% FA in FA-MeOH).
According to the equilibrium distributions shown in Figure 5, Figure 6, Figure A1 and Figure A2, the formation of HF1 in the FA-MeOH system is significantly stronger than that of MG1 in the FA-W system. Therefore, in technical applications, methanol is often added to aqueous FA solutions to suppress the formation of long-chain MGn with high melting points [28,66]. This leads to the stabilization of the oligomerization reactions and thus to inhibited solid precipitation. In general, the formation of HFn and MGn is favored by high overall levels and low temperatures [66].
Knowledge regarding the mole fraction distribution can, depending on the FA content and temperature, help optimize the operation of the reactors. For example, FA-based trioxane is formed by means of linear MG3 [67] or MGn ≥ 3 [68]. Maximizing the share of MG3 or MGn ≥ 3 by varying the operating conditions and FA share has the potential to increase the trioxane yield. Another, analogous example is the acid-catalyzed reaction of methanol and HF1 to OME1 [24,29,69].
In this sub-section, it is shown that the developed chemical model can reproduce the experimental results with a high accuracy. In the next sub-section, the model will be implemented in process simulation software.

3.1.2. Implementation of the Chemical Model in Aspen Plus®

The UNIFAC method and its equations are already implemented by default in Aspen Plus®. The volume, surface, and interaction parameters, drawn from the work of Maurer [32], are implemented using the available template. The input format of the Chemistry template of Aspen Plus®, which is used to describe the equilibrium reactions shown in Figure 1, corresponds to Equation (6) and is, thus, mathematically consistent with the equation given by Maurer [32] (Equation (1)).
ln ( K ) = A + B T + C ln ( T ) + D T
The parameters for the implementation of the temperature-dependent equilibrium constants are determined by a parameter fitting based on the least squares method (Gauss [70]). The error sum of squares (LSE) is minimized for all relevant equilibrium constants, in accordance with Equation (7):
LSE i = T = 273.15   K 373.15   K [ ln ( K i , Equation ( 1 ) L ( T ) ) ln ( K i , Equation ( 6 ) L ( T ) ) ] 2
The parameter fitting is carried out in the temperature range 0–100 °C, which is relevant for the OME3–5 syntheses. The respective parameters of Equation (6) are varied to minimize the least square error (LSE) for the considered component. Additionally, a curve-fitting method was applied to KHF1 and KMG1, so that the phase equilibria better match the experimental data. The formation of MG1 and HF1 has the greatest influence on the phase equilibrium, which is why the associated correlation parameters are most suitable for influencing the calculated phase equilibria. Table 2 shows the determined correlation parameters for use in the Aspen Plus® template. Due to the applied curve-fitting, the LSE of ln(KLHF1) and ln(KLMG1) are relatively larger than the others.
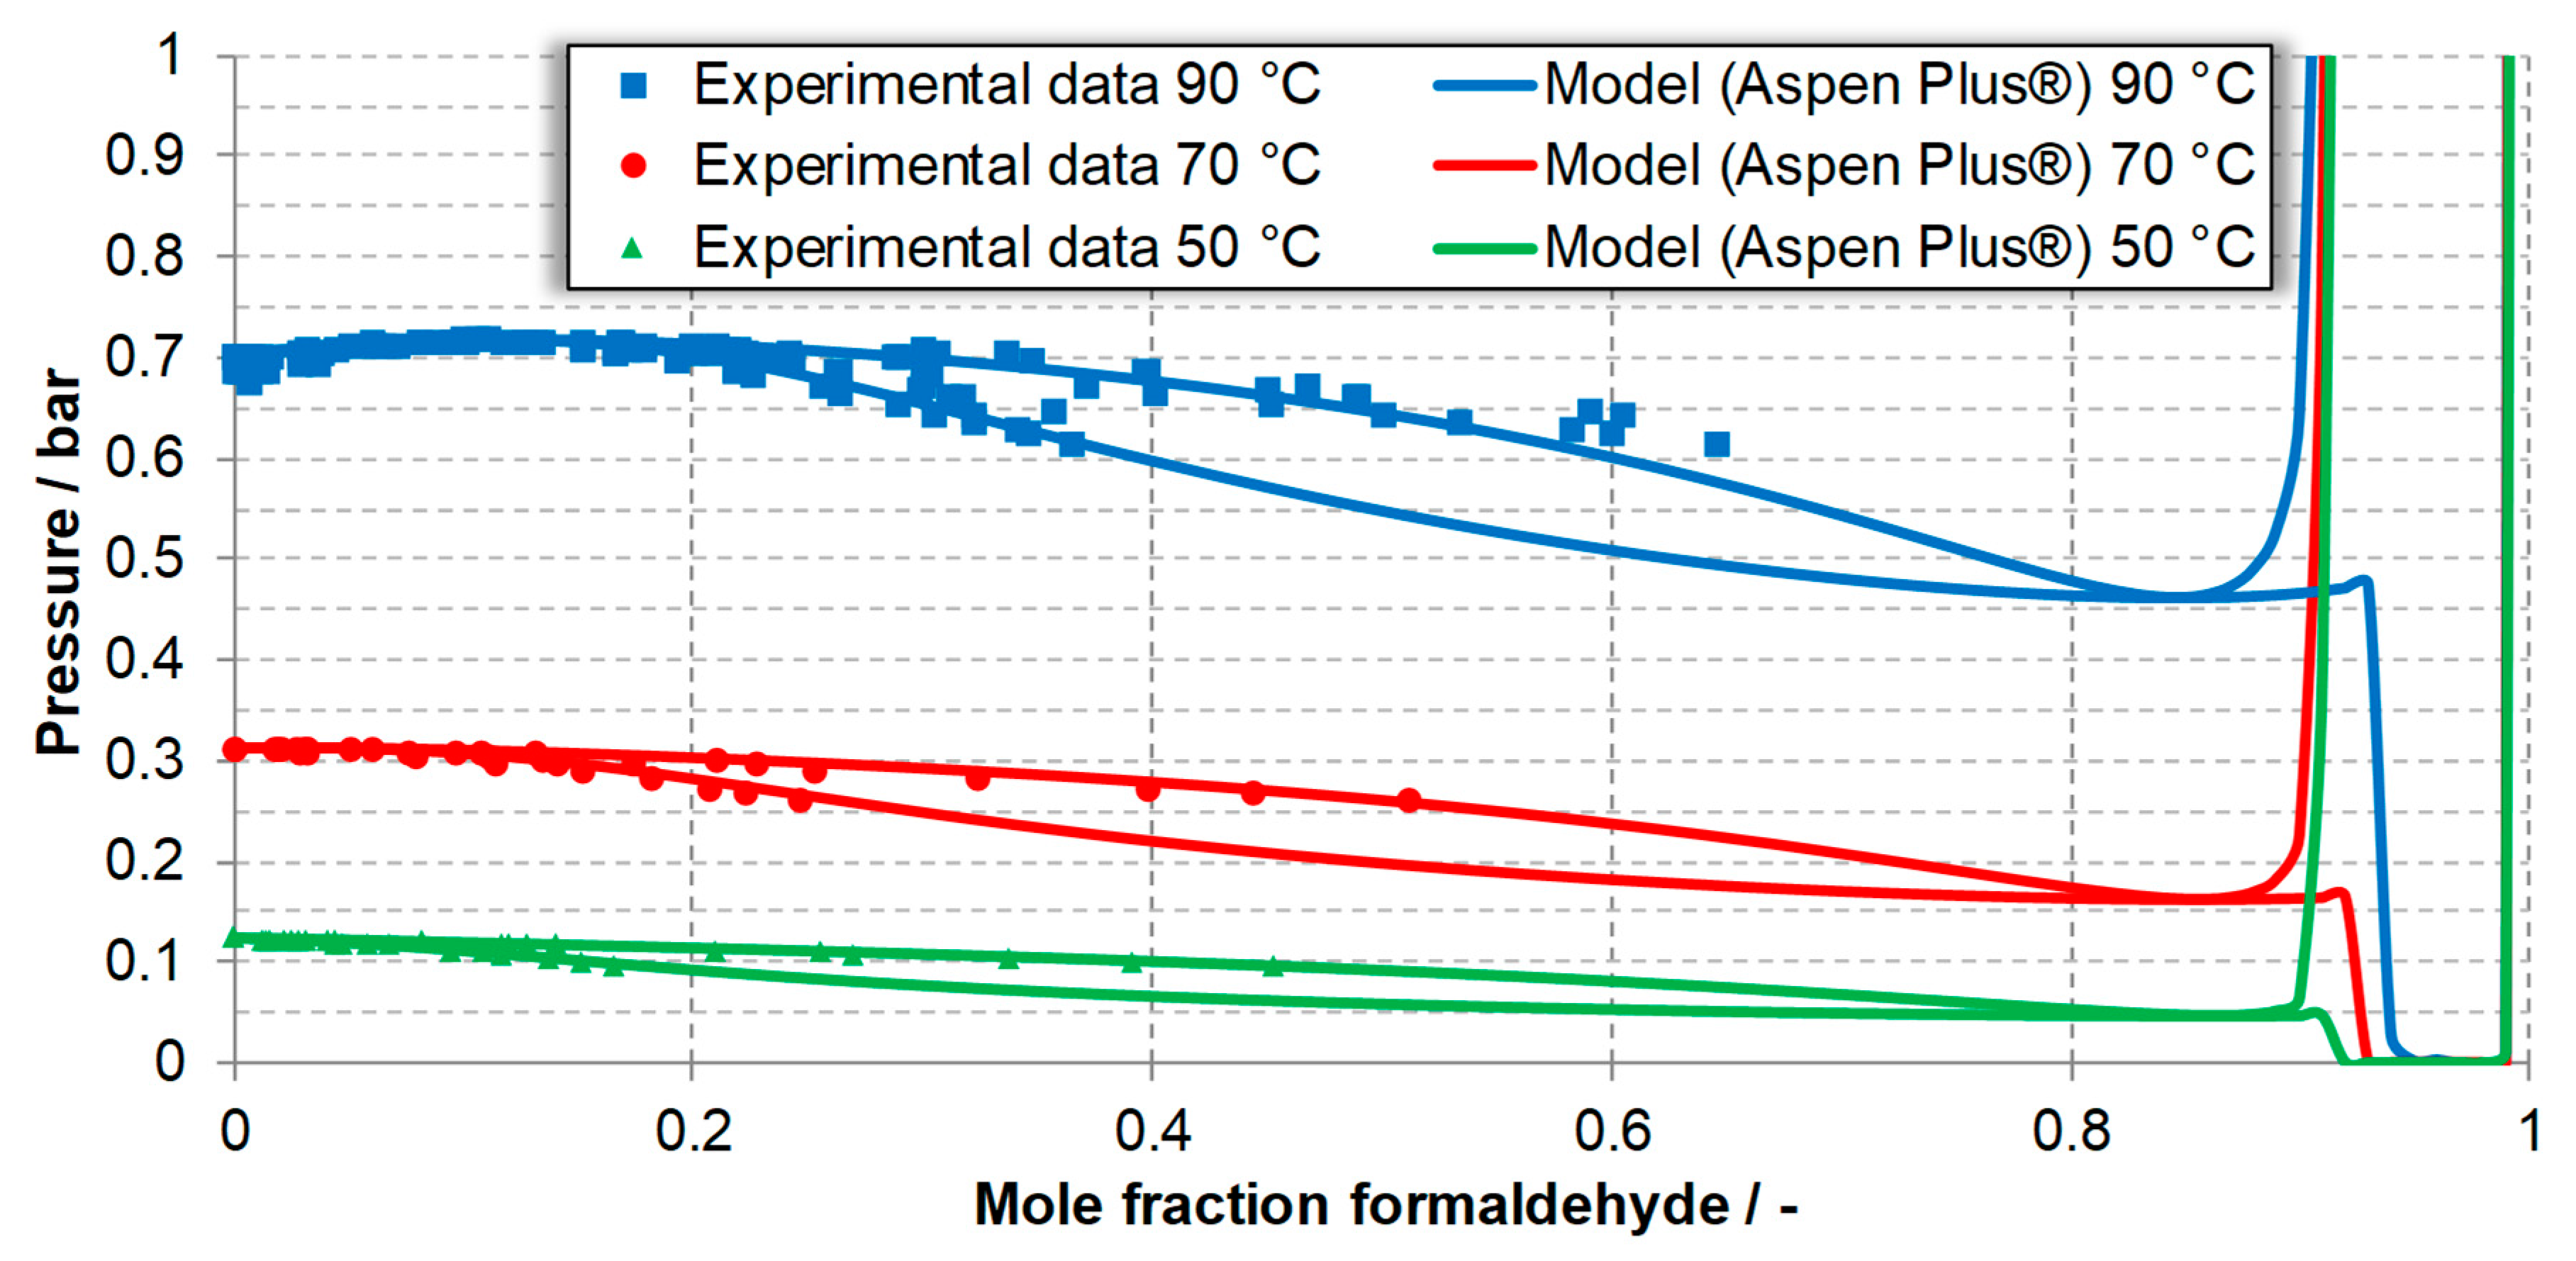
In the original model of Maurer [32], the gas phase was modeled as ideal gas. In this work, the gas phase is modeled using the Redlich-Kwong state equation for real gases [71] to enable the modeling of phase behavior at higher pressure. The phase diagrams of FA-W and FA-MeOH, generated after implementing the new thermodynamic and chemistry data using Aspen Plus®, are shown in Figure 7 and Figure 8, together with experimental literature data [32,34,64,65].
The two diagrams generated using Aspen Plus, which are shown in Figure 7 and Figure 8, are broadly consistent with the diagrams generated with Microsoft® Excel (Figure 3 and Figure 4). Comparing the values given in Table 1 and Table 3, the experimental literature data of the FA-MeOH component system can be even better described using the Aspen Plus® model, which is achieved by slightly adjusting the correlation parameters. Discrepancies only occur in the area of the stoichiometric FA shares of >85 mol.-%, where the vapor pressures are in part 0 bar. The Aspen Plus® solver algorithms appear to have convergence issues in this region. However, this is acceptable because FA shares of >85 mol.-% are not reached on the OMEn synthesis routes and so the phase behavior for compositions relevant for process simulations is modeled with sufficient accuracy.
With this step, the chemical model is not only transferred to process simulation software for performing detailed analyses, but also the accuracy level is further increased.

3.1.3. Other Components Systems: Trioxane, Dimethyl Ether (DME), Polyoxymethylene Dimethyl Ethers (OMEn)

The UNIFAC parameters required to describe the component systems of FA-W and FA-MeOH, including MGn and HFn, are given by Maurer [32]. These component systems only cover a part of all occurring component systems on the OMEn synthesis routes, albeit the far more thermodynamically-complex ones. In contrast to FA, trioxane, DME and OMEn exhibit no additional spontaneous reaction mechanisms, which is why only the corresponding UNIFAC parameters must be implemented.
For the sake of completeness, the corresponding UNIFAC groups and UNIFAC parameters are listed in Table A2, Table A3 and Table A4 in the Appendix A. As can be seen from Table A2, trioxane and methylal are modeled as autonomous UNIFAC groups. The corresponding values can be taken from Grützner [72] (based on Albert [49]) and Drunsel [29] (based on Kuhnert [73]). For the description of OMEn, Schmitz et al. [54] introduced a second oxymethylene group (-CH2O-)OME that resembles the existing oxymethylene group (-CH2O-), but has changed the interaction parameters with water and methylal on the basis of experimental data. For use in Aspen Plus®, the interaction parameters must be reduced to scalar values. An appropriate temperature, based on the temperature levels of the varied synthesis steps in the work of Burger [21], Oestreich [22], Grützner [72] and Drunsel [69], is 353.15 K. The selected values can be adjusted as required; however, the influence is relatively low and the resulting deviations with respect to the present temperature ranges are therefore justifiable.
The UNIFAC parameters of the trioxane-methylal component system are not available, but can be determined via regression as per the work of Burger [21], who described the system using the NRTL (non-random two-liquid) method (the results are displayed in Table A1 in the Appendix A for the sake of completeness).
The DME-containing component systems occurring on the OME3–5 synthesis routes have been neither sufficiently studied nor thermodynamically-modeled. However, reliable thermodynamic data are required for process design and simulation, for instance for the formation of OME3–5 from DME and trioxane [74]. Two different approaches are possible in terms of the UNIFAC parameters of DME: decomposition into existing UNIFAC groups (CH3O- and -CH3) and the use of an autonomous UNIFAC group (C2H6O). In some cases, decomposition into existing UNIFAC groups insufficiently reproduces experimental data. For instance, the miscibility gap in the component system DME-W cannot be sufficiently described. Modeling as an autonomous UNIFAC group requires further unknown UNIFAC parameters that can be adapted to the existing data. However, the data are not sufficient to consider all occurring material systems of the OME3–5 synthesis routes. Thus, the missing UNIFAC parameters cannot be added and are set as equal to zero which, according to the UNIFAC method, corresponds to an ideal liquid phase. For process simulations where all components are given in the default database of the process simulation software, such as DME synthesis from methanol, other thermodynamic models such as NRTL should be used.

3.2. Estimation of Property Data of OME2–10, Polyoxymethylene Glycols (MGn) and Hemiformals (HFn)

In this section, an approach to estimating the missing component property data for OME2–10, MGn and HFn is presented. The estimation is carried out using the group contribution method PCES (Property Constant Estimation System) from Aspen Plus®.
Prior to this, to determine the accuracy of a property estimation system, the relative deviations of the property data of OME1, DME (dimethyl ether) and TRI (trioxane), estimated using PCES (property constant estimation system [75,76]), as well as property data from the Aspen Plus® databases, were determined. In case 1, only the molecular structure is given. In case 2, the inputs for the property estimation system are the molecular structure and normal boiling point. The results are given in Table 4. In case 1, the normal boiling point TB is also estimated with group contribution methods that use the molecular structure. The estimations are performed with the JOBACK method [44].
The reference values used are the critical temperature TC and critical pressure pC, as these are applied to many equations of state (e.g., Redlich–Kwong, Peng–Robinson, Van der Waals), which are in turn utilized to describe thermodynamic systems. Other missing component properties, such as the vapor pressure or enthalpy of vaporization, can be estimated with the RIEDEL method based on TB, TC and pC and, respectively, the LI-MA method based on the structure and TB [76].
The relative deviations of the estimated data to the data from the database are indicated below the estimated data. Referring to Table 4, different degrees of deviations must be expected (here: up to 8.56%). TC is calculated using the JOBACK method based on the molecular structure and TB. pC is exclusively calculated based on the molecular structure, which is why the respective values are equal in both case 1 and case 2. The relative deviation for the TC can be reduced if the normal boiling point is given. This result underlines the recommendation that, at a minimum, the molecular structure as well as the normal boiling point should be conveyed in order to reliably estimate data. In the following sub-sections, the normal boiling points of OMEn, MGn and HFn are estimated and finally the critical temperatures of these compounds are estimated based on normal boiling points and molecular structures.

3.2.1. Estimation of the Normal Boiling Points of OMEn

Boyd [77] experimentally determined the vapor pressures of OME2–5 and correlated them according to the temperature (Equation (8)), which can then be used to determine the normal boiling points TB.
ln ( p kPa   ) = A + B T / K   + C + D ln ( T / K )  
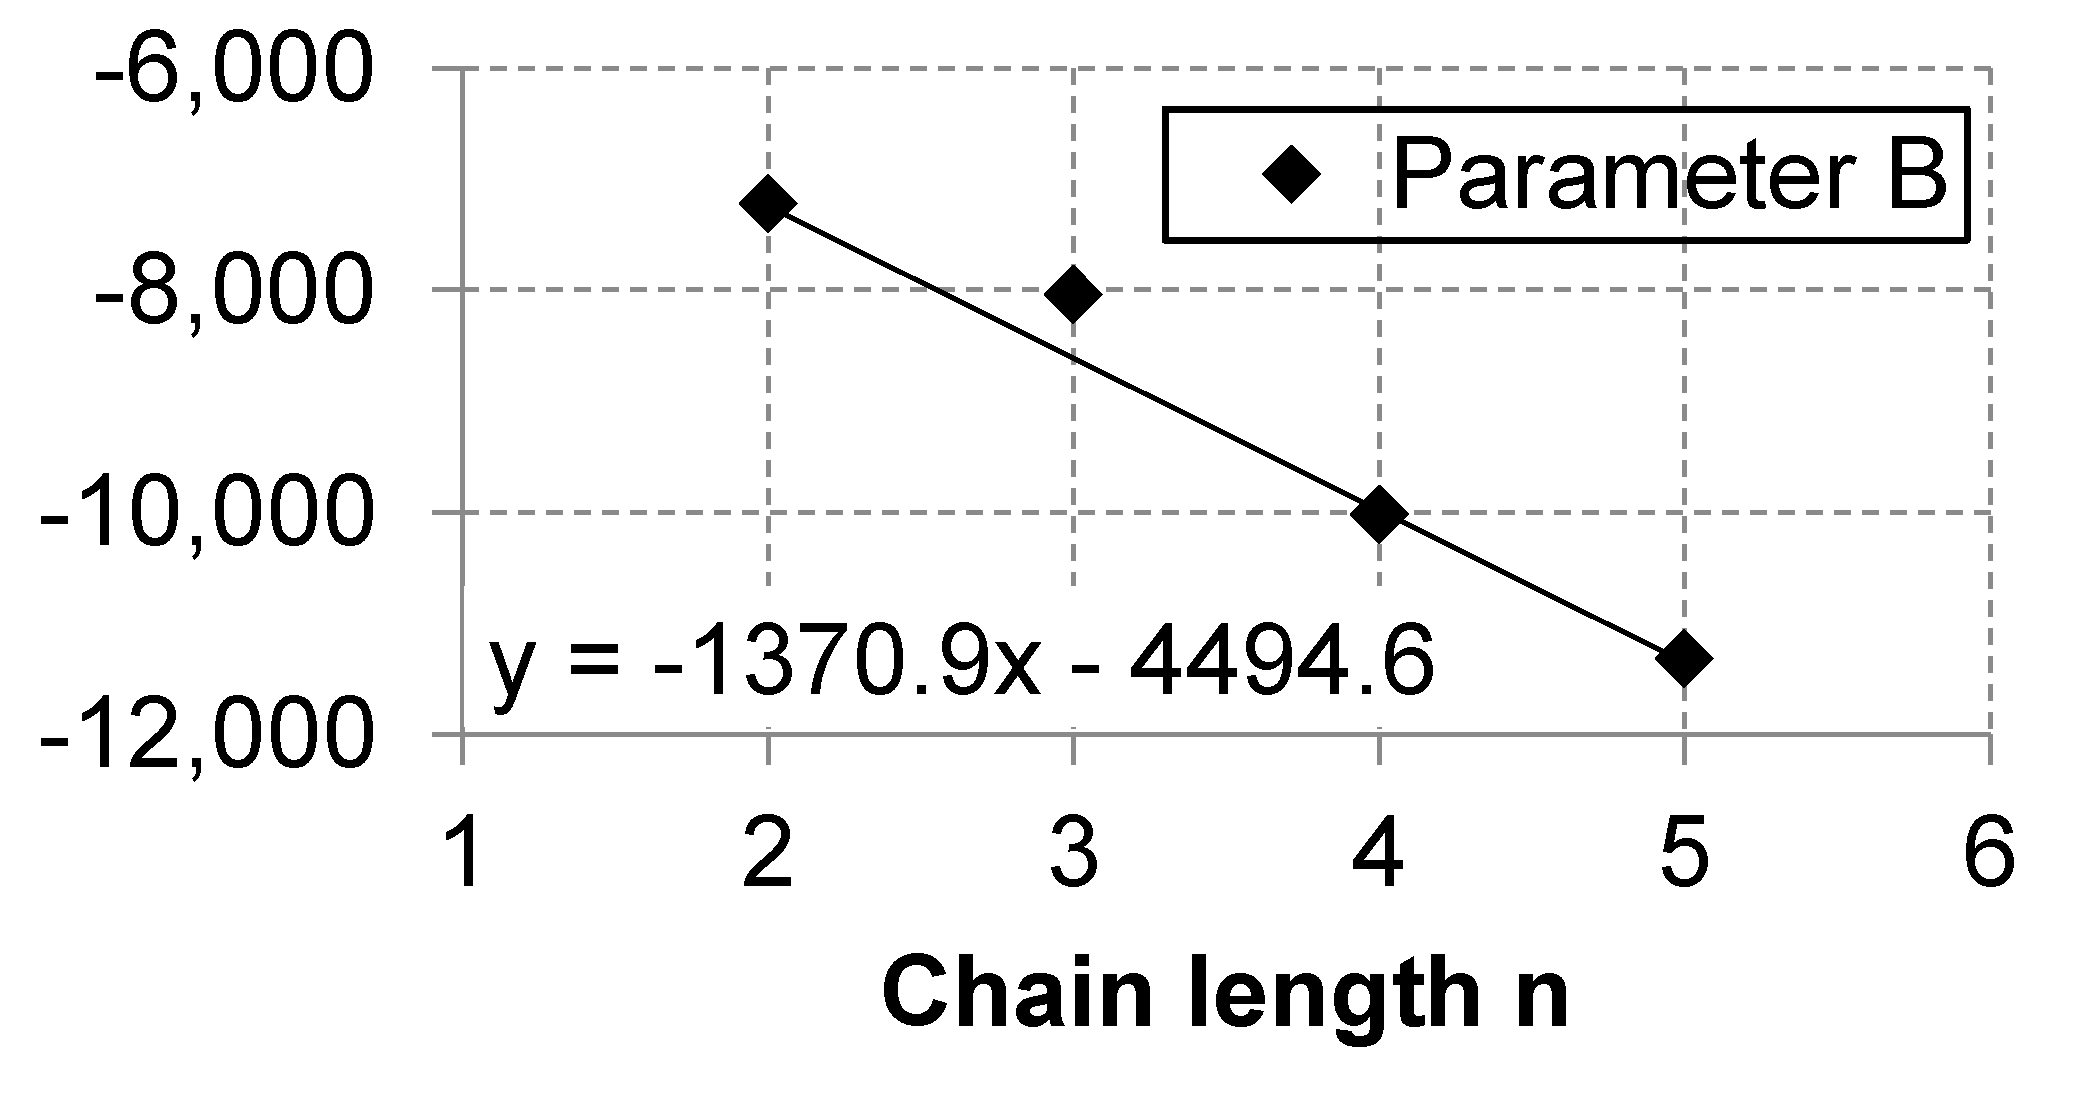
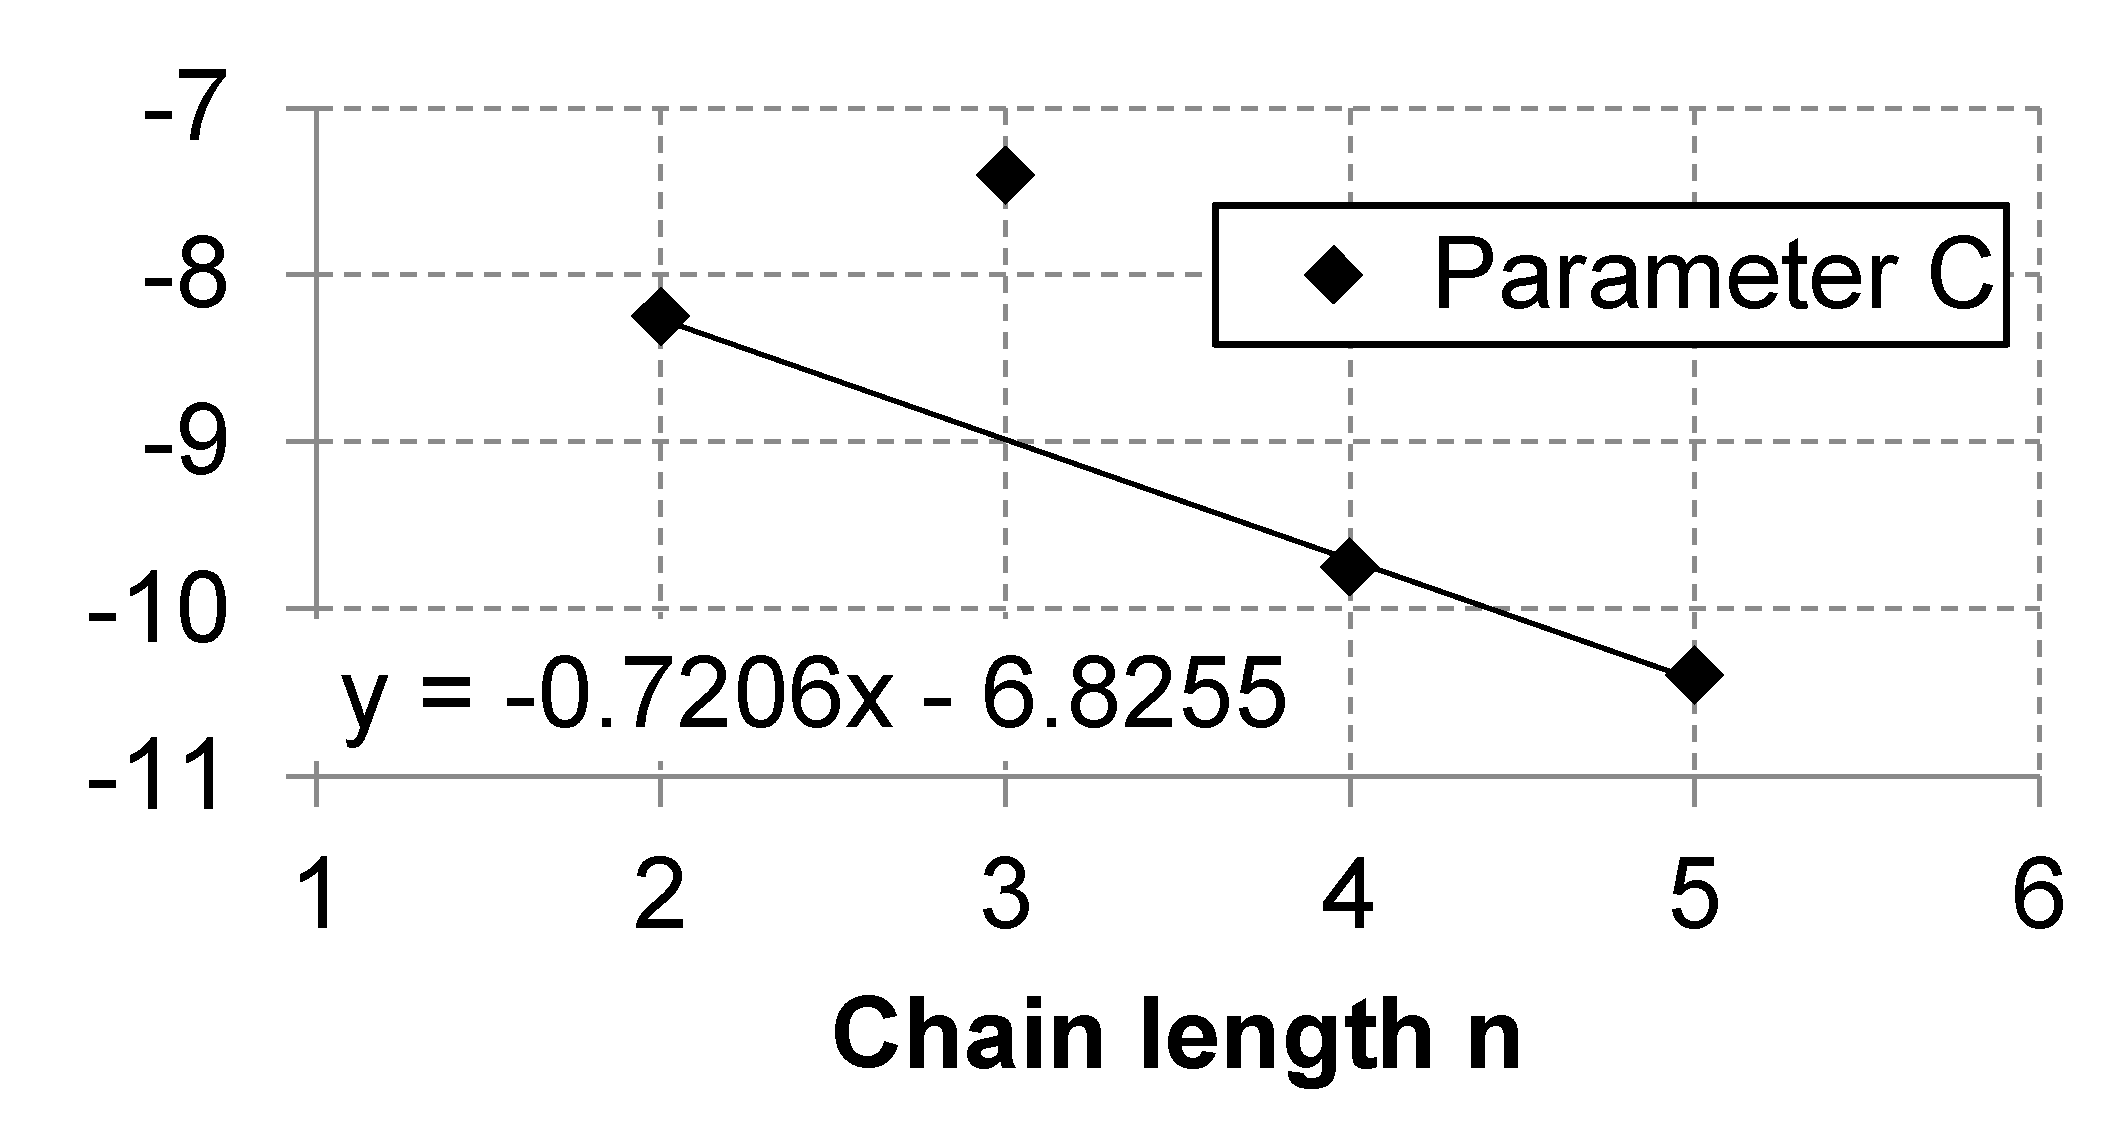
To calculate the missing TB of OME6–10, a linear regression was performed using the correlation parameters given by Boyd [77]. The corresponding diagrams are given in the Appendix A (Figure A4, Figure A5 and Figure A6). The parameters for OME3 are identified as a discrepancy and not considered for the regression.
Table 5 lists the given and calculated correlation parameters of the vapor pressure equation (Equation (8)) and the normal boiling points for OME2–10, which are implemented in Aspen Plus® to use the internal prediction method PCES to model the component data, which is not given in literature.

3.2.2. Estimation of the Normal Boiling Points of MGn and HFn

Table A5 in the Appendix A gives the normal boiling points TB of MG1–10 and HF1–10 based on the molecular structure estimated with the PCES (JOBACK method). The group contribution method predicts a constant increase of 45.3 K for each additional oligomerization unit of an oxymethylene group (-CH2O-). However, MGn and HFn have a similar molecular structure to OMEn and the latter shows no linear increase as a function of length (see Table 5).
The TB of MG1 and HF1 can be calculated using the parameters given by Maurer [32], who correlated the vapor pressures of MG1 and HF1 with the vapor pressure equation (Equation (8)) using a UNIFAC model (see Table 6).
Referring to Table A5 and Table 6, the values estimated with the PCES method differ significantly from those calculated with the data given in Maurer [32]. The prediction of the TB of MGn and HFn via the PCES method using merely the molecular structure is, therefore, not advisable, which is why a different approach is chosen. It is assumed that the TB of MGn and HFn increase with each oligomerization unit (−CH2O−), analogous to those of OMEn (see Equation (9)).
T B ( OME n ) T B ( OME n 1 ) = T B ( MG n ) T B ( MG n 1 ) = T B ( HF n ) T B ( HF n 1 )
Applying Equation (9) and the values given in Table 6 results in the TB for MG1–10 and HF1–10 listed in Table 7.
The critical temperatures TC of MGn, HFn and OMEn, which were estimated based on the normal boiling point TB and the molecular structure, are given in Table 8.

3.3. Simulation and Optimization of Formaldehyde Synthesis

In this section, we present an optimized concept of the state-of-the-art FA synthesis, which is possible to perform when the methanol-based FA synthesis is part of an OME3–5 production route. In the conventional processes, the FA solution is separated from the reactor product via an absorption column using pure water as the absorbent and, depending on the process concept, an additional downstream distillation column.
As is shown in the following, due to the use of water with a small share of FA as the absorbent instead of pure water, it is possible to decrease the MeOH loss in the absorber top stream, as well as the loss of FA that is chemically bound in wastewater. Additionally, the wastewater treatment and freshwater demand are reduced. Consequently, the raw material requirement is reduced, and the overall yield and efficiency of the OME3–5 synthesis routes is increased.
In the following, an application example is described to show the impact of the optimization on the process efficiency and yield. The exemplary process design of an FA synthesis is developed on the basis of the silver catalyst process with incomplete methanol conversion of the chemical company ICI (Imperial Chemical Industries), which is similar to the BASF process and outlined by Reuss et al. [28] and Chauvel and Levebre [78].
Figure 9 shows the three OME3–5 synthesis routes that are suggested by Burger [21] and techno-economically analyzed and compared by Schemme et al. [11]. As different processes on the OME3–5 synthesis routes require aqueous FA solutions with varying methanol contents, the routes are slightly modified. The discussed FA process, as well as the OME1 and TRI process to which reference is made, correspond to those used in the techno-economic analysis of Schemme et al. [11].
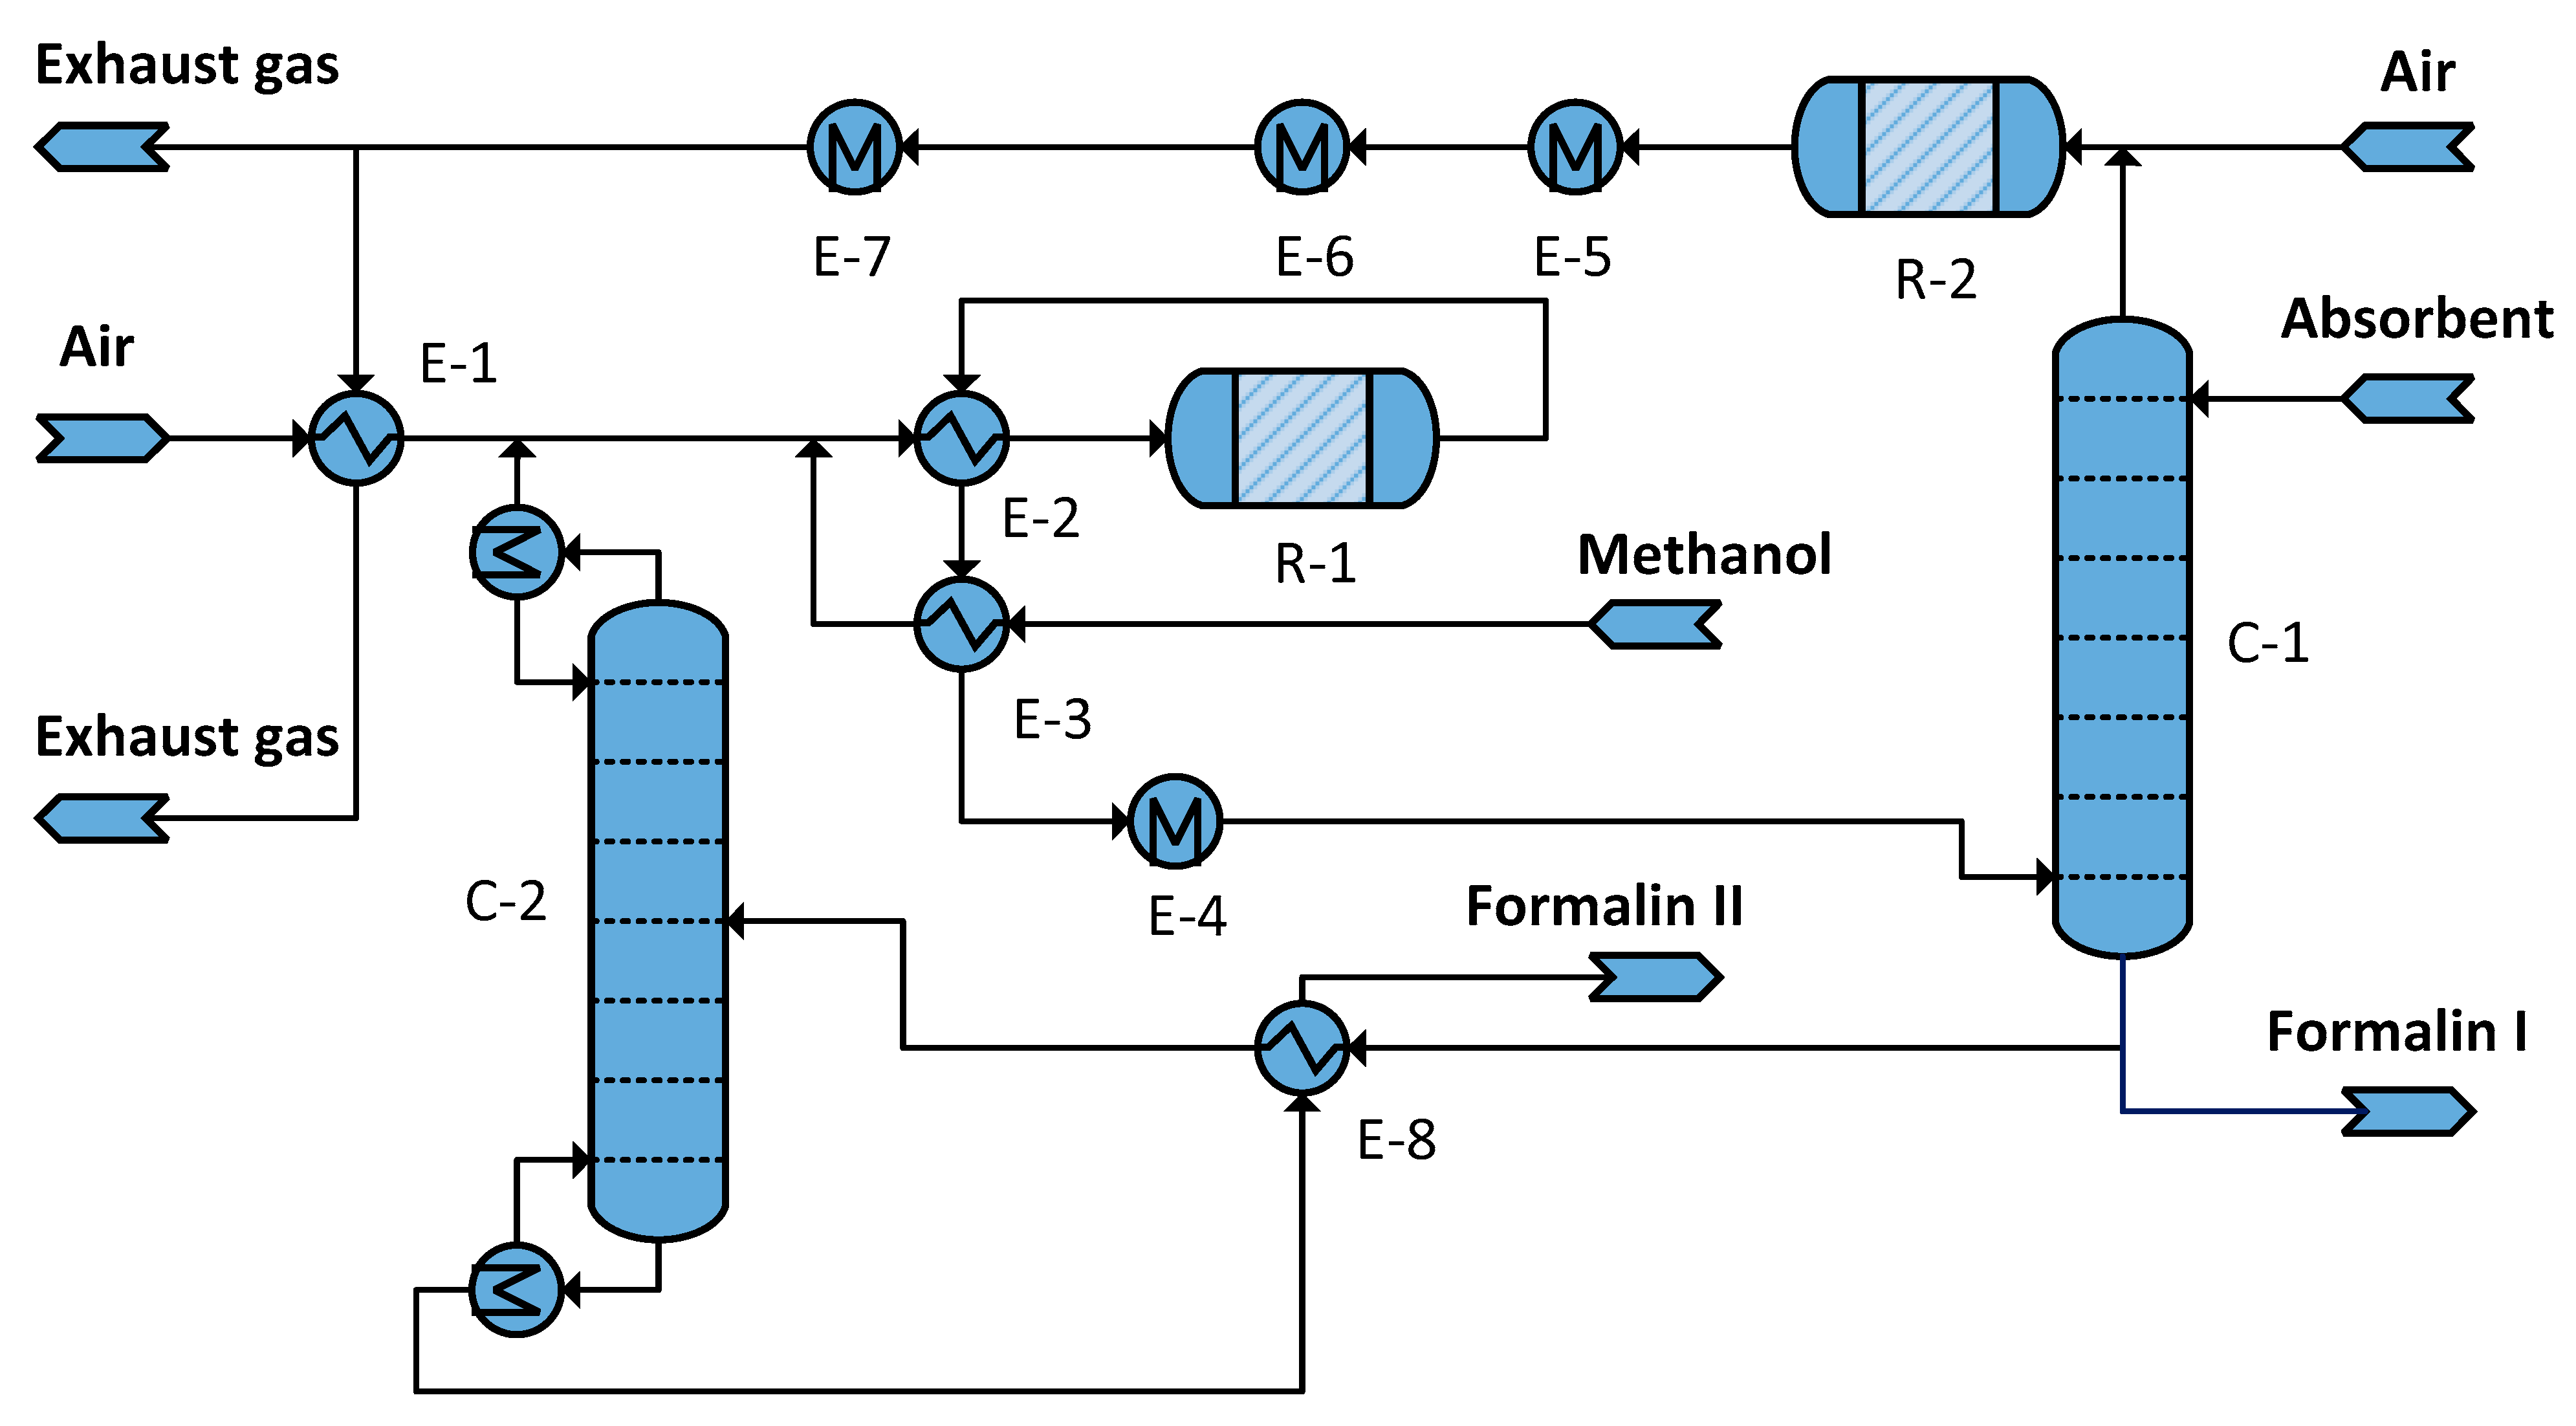
In contrast to the TRI synthesis [40,72], which requires methanol-free FA solutions (formalin II), in the OME1 synthesis and the direct OME3–5 from formaldehyde and methanol, the separation of unconverted methanol (distillation recovery of methanol [28]) from the reactor product can be omitted. The process flowsheet is given in Figure 10, which combines the synthesis of two different FA solutions: formalin I and formalin II. In the simulation model, the chemical reactions from MeOH to FA taking place in the reactor R-1 are described using the kinetic model of Panzer and Emig [79], which considers the following reactions, Equations (10) to (13).
Dehydration CH3OH → CH2O + H2
Hydration CH2O + H2 → CH3OH
Oxy dehydration CH3OH + ½ O2 ↔ CH2O + H2O
Total oxidation CH3OH + 1 ½O2 ↔ CO2 + 2 H2O
Table 9 gives the Gibbs free energy (ΔGR) and enthalpy of reaction (ΔHR) of the reaction Equations (10) to (13) for ideal gas states under standard conditions (STP) and calculated using the PSRK (Predictive Soave–Redlich–Kwong) model at reaction conditions of 630 °C and 1 bar.
By using the kinetic model of Panzer and Emig [79], sensitivity analyses reveal that an increased O2/MeOH ratio increases the methanol conversion, but also reduces the selectivity towards FA. The maximum FA yield is achieved with an O2/MeOH ratio at 0.25 mol/mol. This ratio provides an optimal balance between FA formation and ongoing oxidation. Possible side reactions such as the formation of formic acid are largely suppressed at temperatures of 590–650 °C [28] and are therefore neglected in the simulation. As the highest MeOH conversion is not reached in the chemical equilibrium, the residence time is limited and the reactor outlet stream is immediately quenched after leaving the catalyst bed. The stoichiometric FA share in the reactor product is 21.5 wt.-%. After cooling down, the FA solution is separated from gaseous components using an absorber column (C-1 in Figure 10). In the case of formalin II synthesis, methanol is separated in distillation column C-2 and recycled back (distillation recovery of methanol [28]). For the synthesis of formalin I, C-2 is not required, and the bottom product of C-1 can be used directly as input for the following process. Due to the incomplete methanol conversion, formalin I has a stoichiometric methanol share of 18.6 wt.-% and equal FA and water shares by weight.
The amount of absorbent used in C-1 is adjusted so that the mass ratio of FA/W in the bottom outlet is 1. A slight loss of volatile methanol in the top stream of the absorber C-1 is unavoidable. If pure water is used as the absorbent (base case), up to 1.65% of the methanol (stoichiometric) supplied to the process or, respectively, 6.3% of the methanol (stoichiometric) fed into the absorber leaves the process with the absorber top stream. If water with a small share of FA is used as the absorbent, the FA causes the methanol to be bound in the form of hemiformals in the liquid phase according to the reaction network shown in Figure 1. The methanol loss can be more than halved if wastewater from the downstream OME1 synthesis with a stoichiometric FA content of 5.2 wt.-% is used instead of fresh water. The stoichiometric FA content of 5.0 wt.-% means an FA loss of 0.04 kgFA/kgOME1.
Even the use of the wastewater of the TRI synthesis with a stoichiometric FA content of about 1.0 wt.-% used as the absorbent reduces the loss of methanol. With both TRI and OME1 production, the amount of wastewater is higher than the amount of absorbent required. In the example simulation described, 42% of the wastewater of the OME1 is required to cover the absorbent demand of the corresponding FA synthesis.
As reported by Reuss et al. [28], the gaseous top stream is burned using air. The waste heat can be used to produce steam to support covering the heat demand of other processes. The product distribution and reaction heat (reactor R-2 in Figure 10) is determined by minimizing the Gibbs free energy (Aspen Plus® reactor model RGibbs). With a high surplus of air (λ ≈ 2.5) resulting in a combustion temperature of 800 °C, the NOx content in the exhaust gas is around 100 mg/m3 (norm cubic meter, water free). For heat supply and recovery, saturated steam at three different temperature levels (250 °C, 175 °C and 125 °C) is used within the simulation, leading to a slight limitation compared to heat integration via pinch analysis, but is closer to the technical implementation.
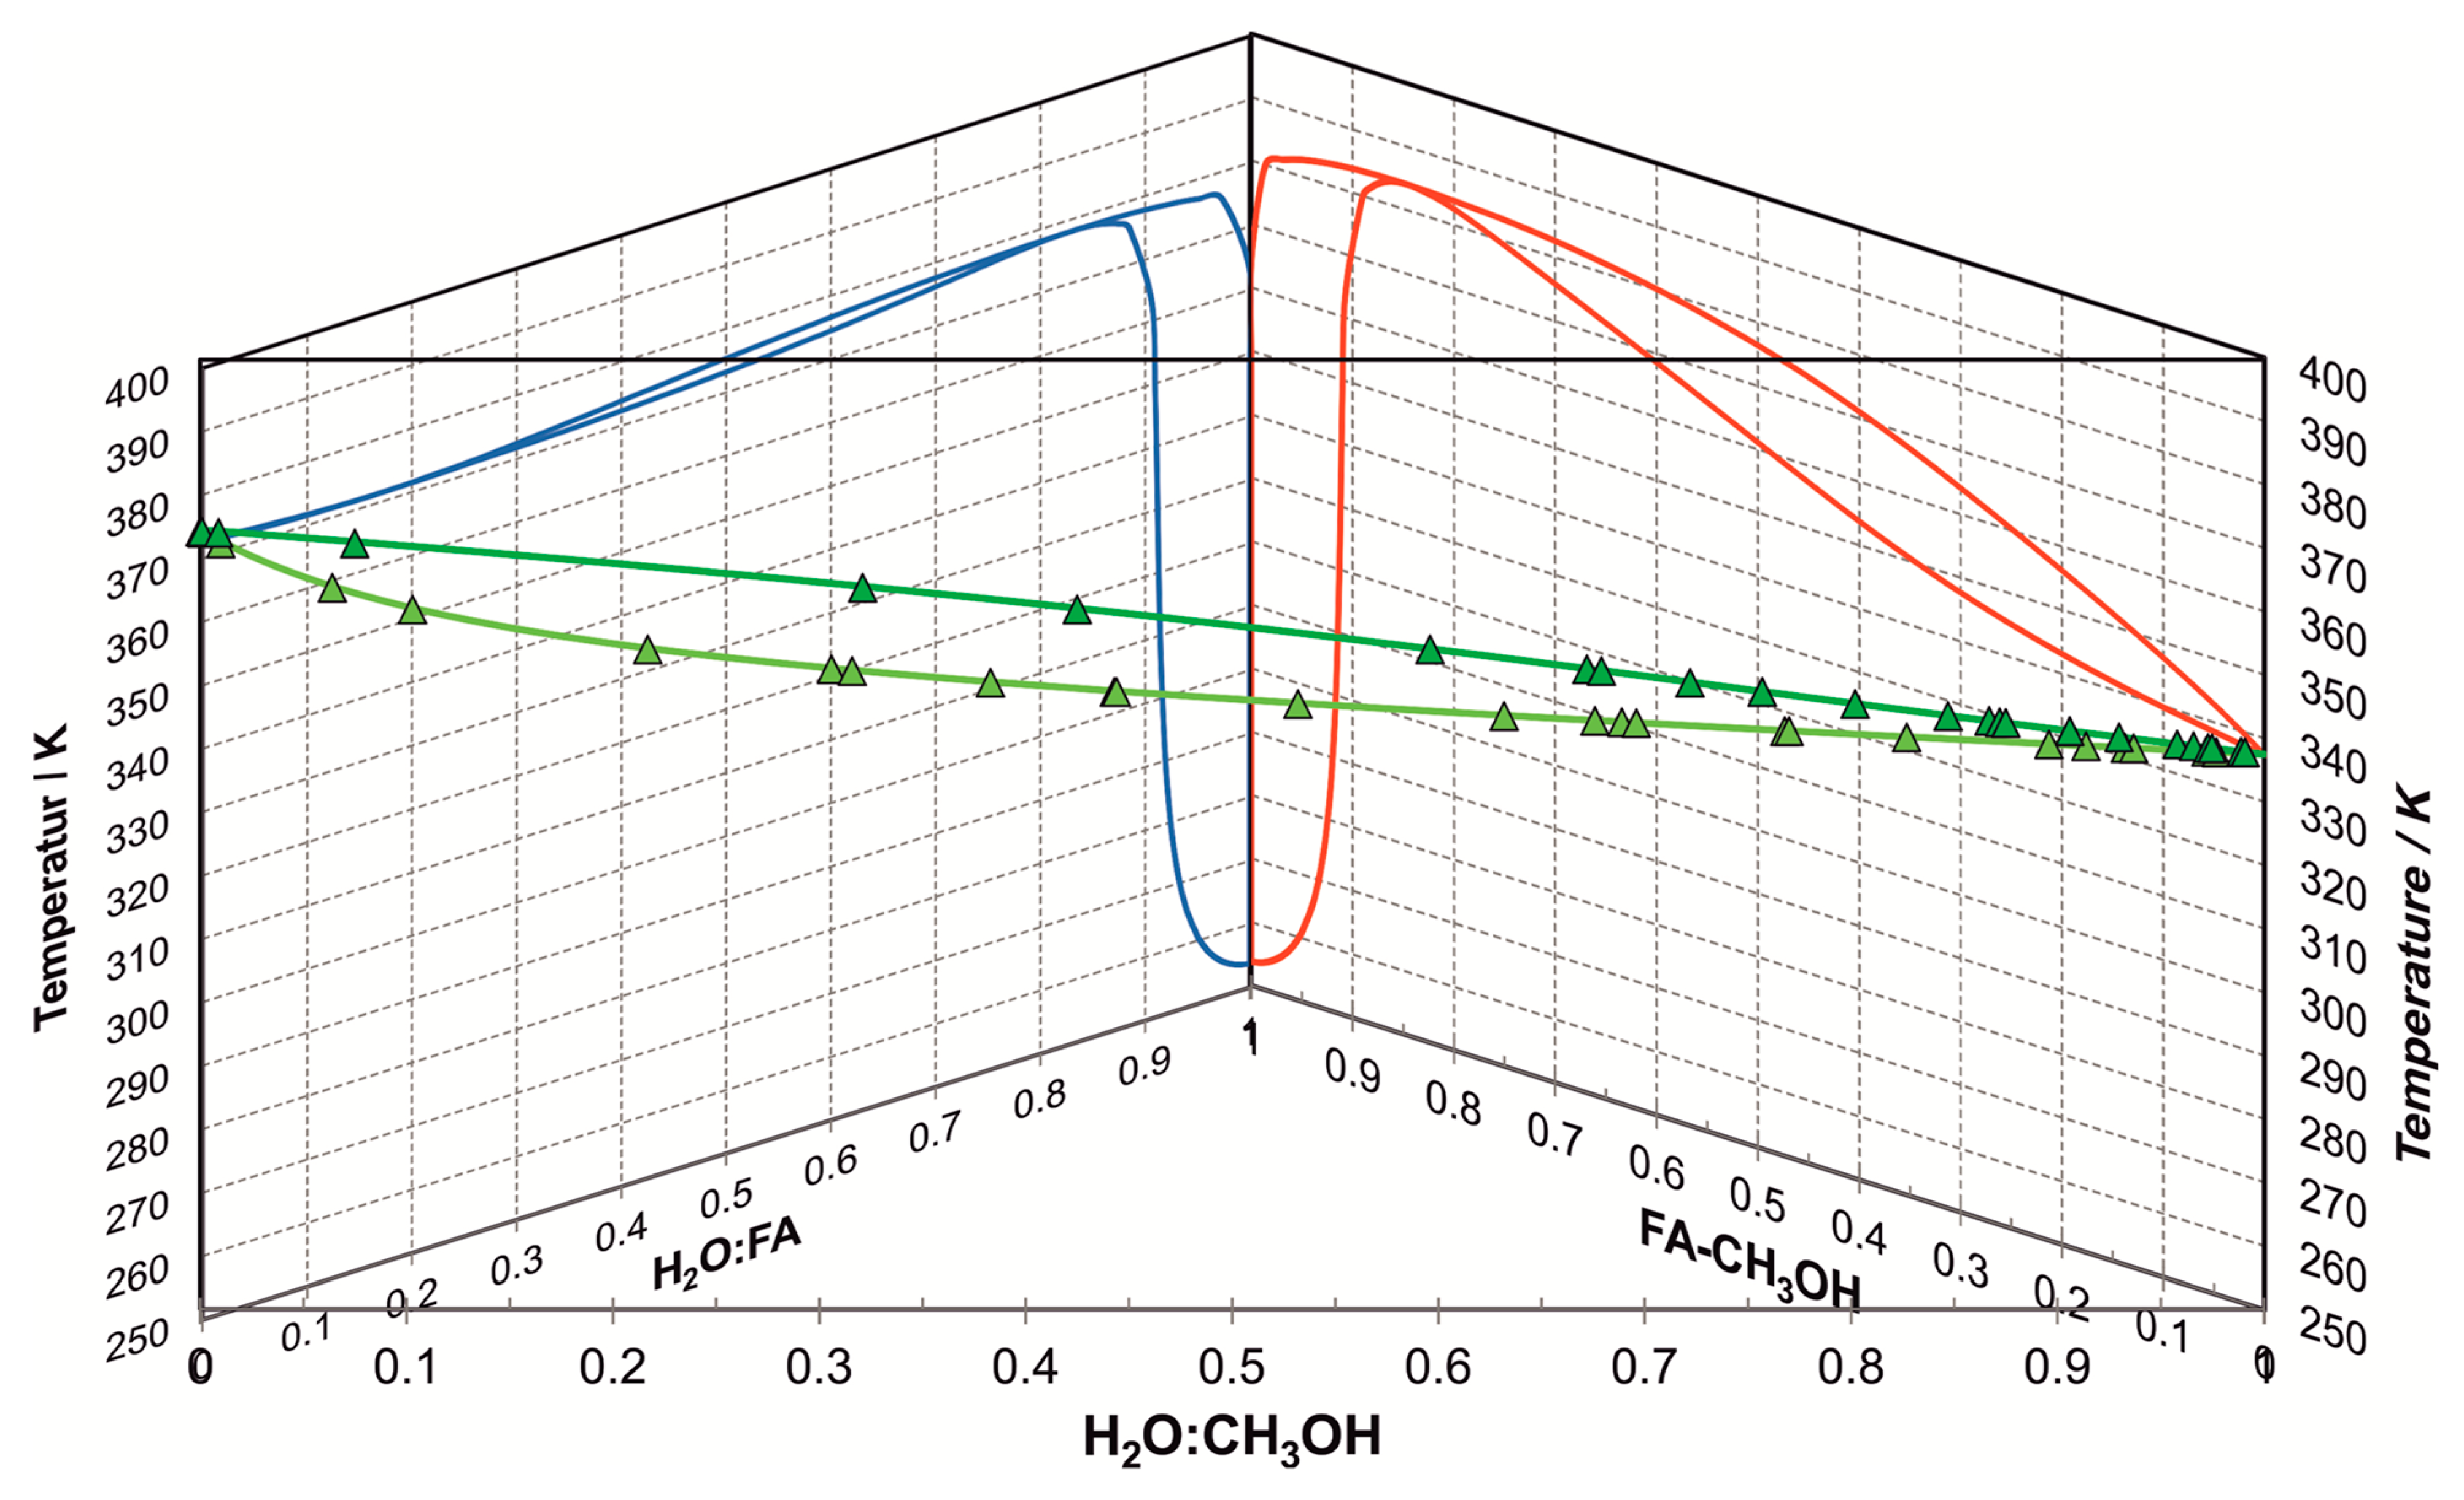
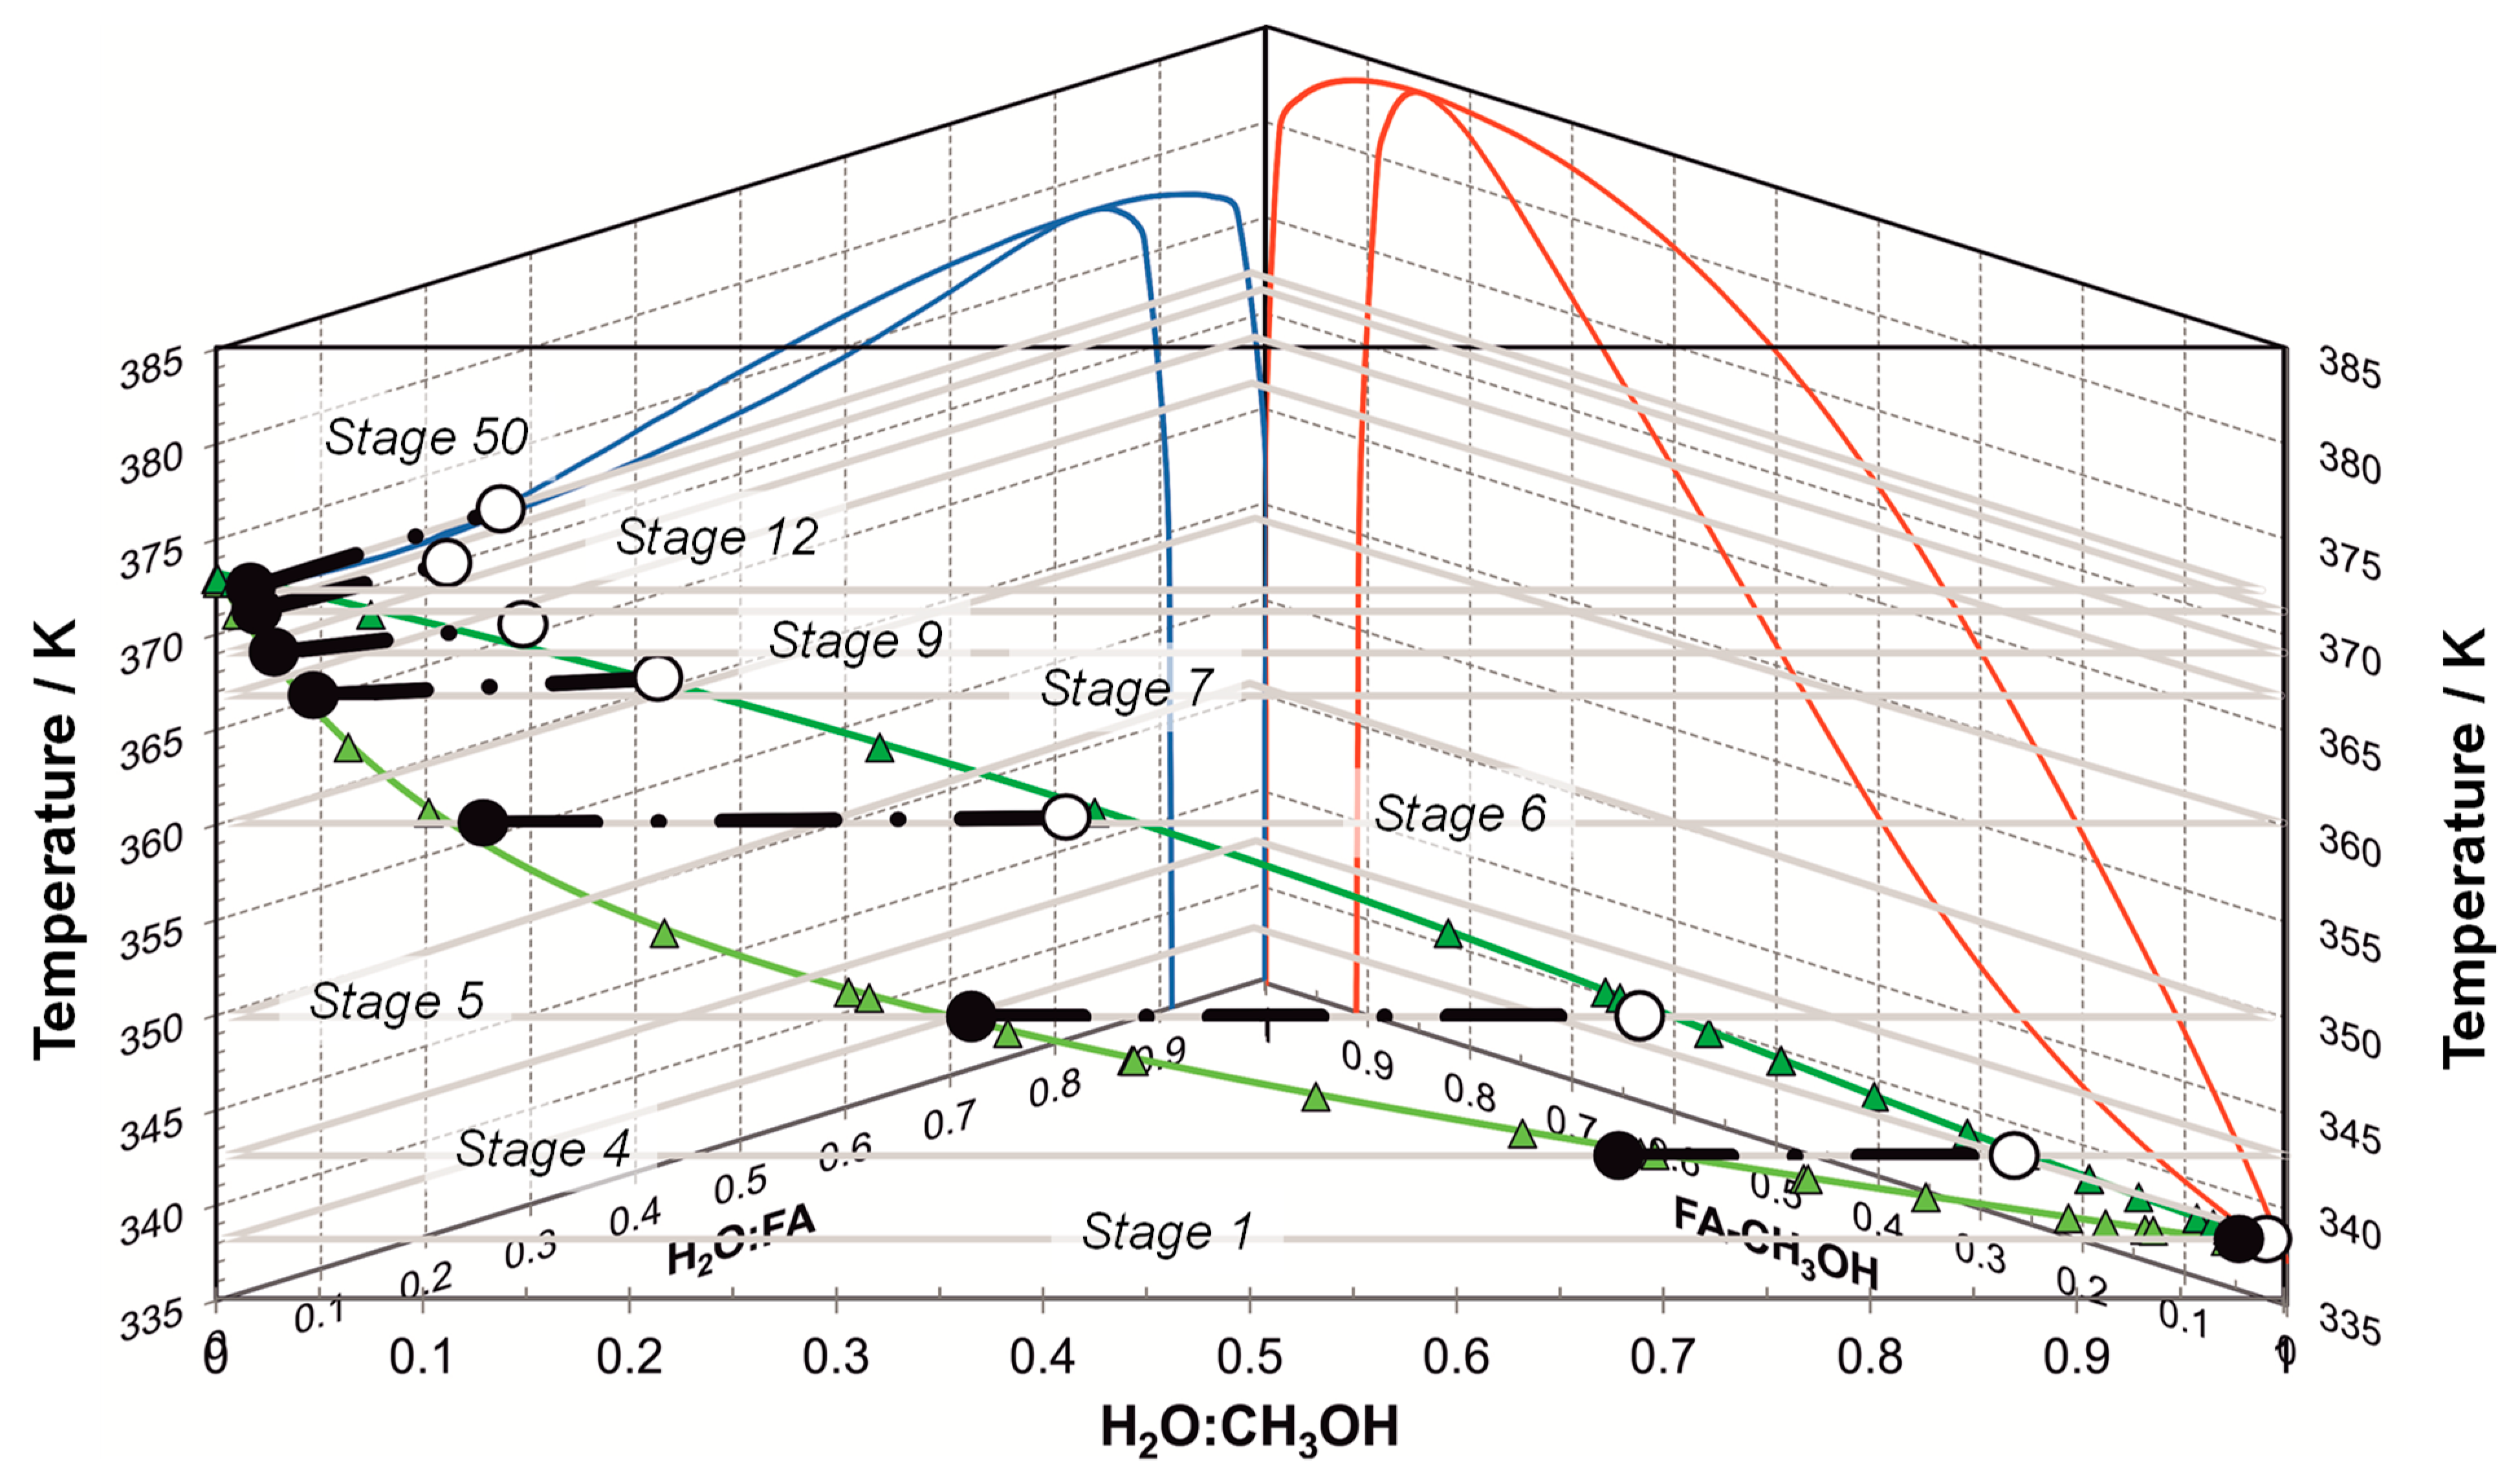
Figure 11 shows the temperature-depending phase equilibria of the binary systems W/FA and W/MeOH, corresponding to Figure 3 and Figure 4, as well as the phase diagram of W/MeOH in a prism illustration. To elucidate the effect of vapor-liquid equilibria data on the separation behavior of the distillation column C-2 in Figure 10, the corresponding conodes were depicted in a phase diagram (see Figure 11). For ease of understanding Figure 11, the binary diagrams of the system W/MeOH/FA without conodes is given in Figure A3 in the Appendix A. The phase diagram in Figure 11 shows a small region for vapor-liquid phase separation due to the formation reactions of hemiformals and methylene glycols in the W/MeOH/FA system. The phase equilibria at constant pressure shown in Figure 11 is overwhelmed by the azeotrope at high FA concentrations in combination with the high saturation pressure of the pure species and the low boiling temperature. Additionally, solid precipitation must be considered at high FA concentrations, (see Ott et al. [57]). The design of column C-2 in Aspen Plus® results also in a dataset with conodes representing the phase behavior in the system with all intermediate species, hemiformals and methylene glycols of different chain lengths. These numbers can be stoichiometrically recalculated to the three-component mixture of W/MeOH/FA. Column C-2 comprises 50 stages, each of which is operated at vapor-liquid equilibrium with temperatures between 337–373 K. Feed is given between stages 8 and 9 with a stoichiometric composition of 40.7 wt.-% water, 40.7 wt.-% FA and 18.6 wt.-% methanol (see formalin I in Table 10).
As can be seen from Figure 11, only 8 stages between 337–367 K are necessary to obtain methanol of high purity at the top of the column, i.e., 99%. These condones are placed at the front of the 3D-prism, T(xW, xMeOH), and were determined by the binary methanol-water system. In contrast, 40 stages are required to achieve a 50:50 (by weight) W/FA solution (formalin II) at the bottom of the column. The temperature change from stage to stage is very small due to the narrow band between the liquid and gaseous phases. The conodes are placed on the back side of the 3D-prism, T(xW, xFA), and were determined by the binary W/FA system. Finally, it can be stated that the design of the distillation column leads to mixtures in a small space within the complete phase diagram. Solid precipitation should not play a role in this composition matrix.

Process Assessment

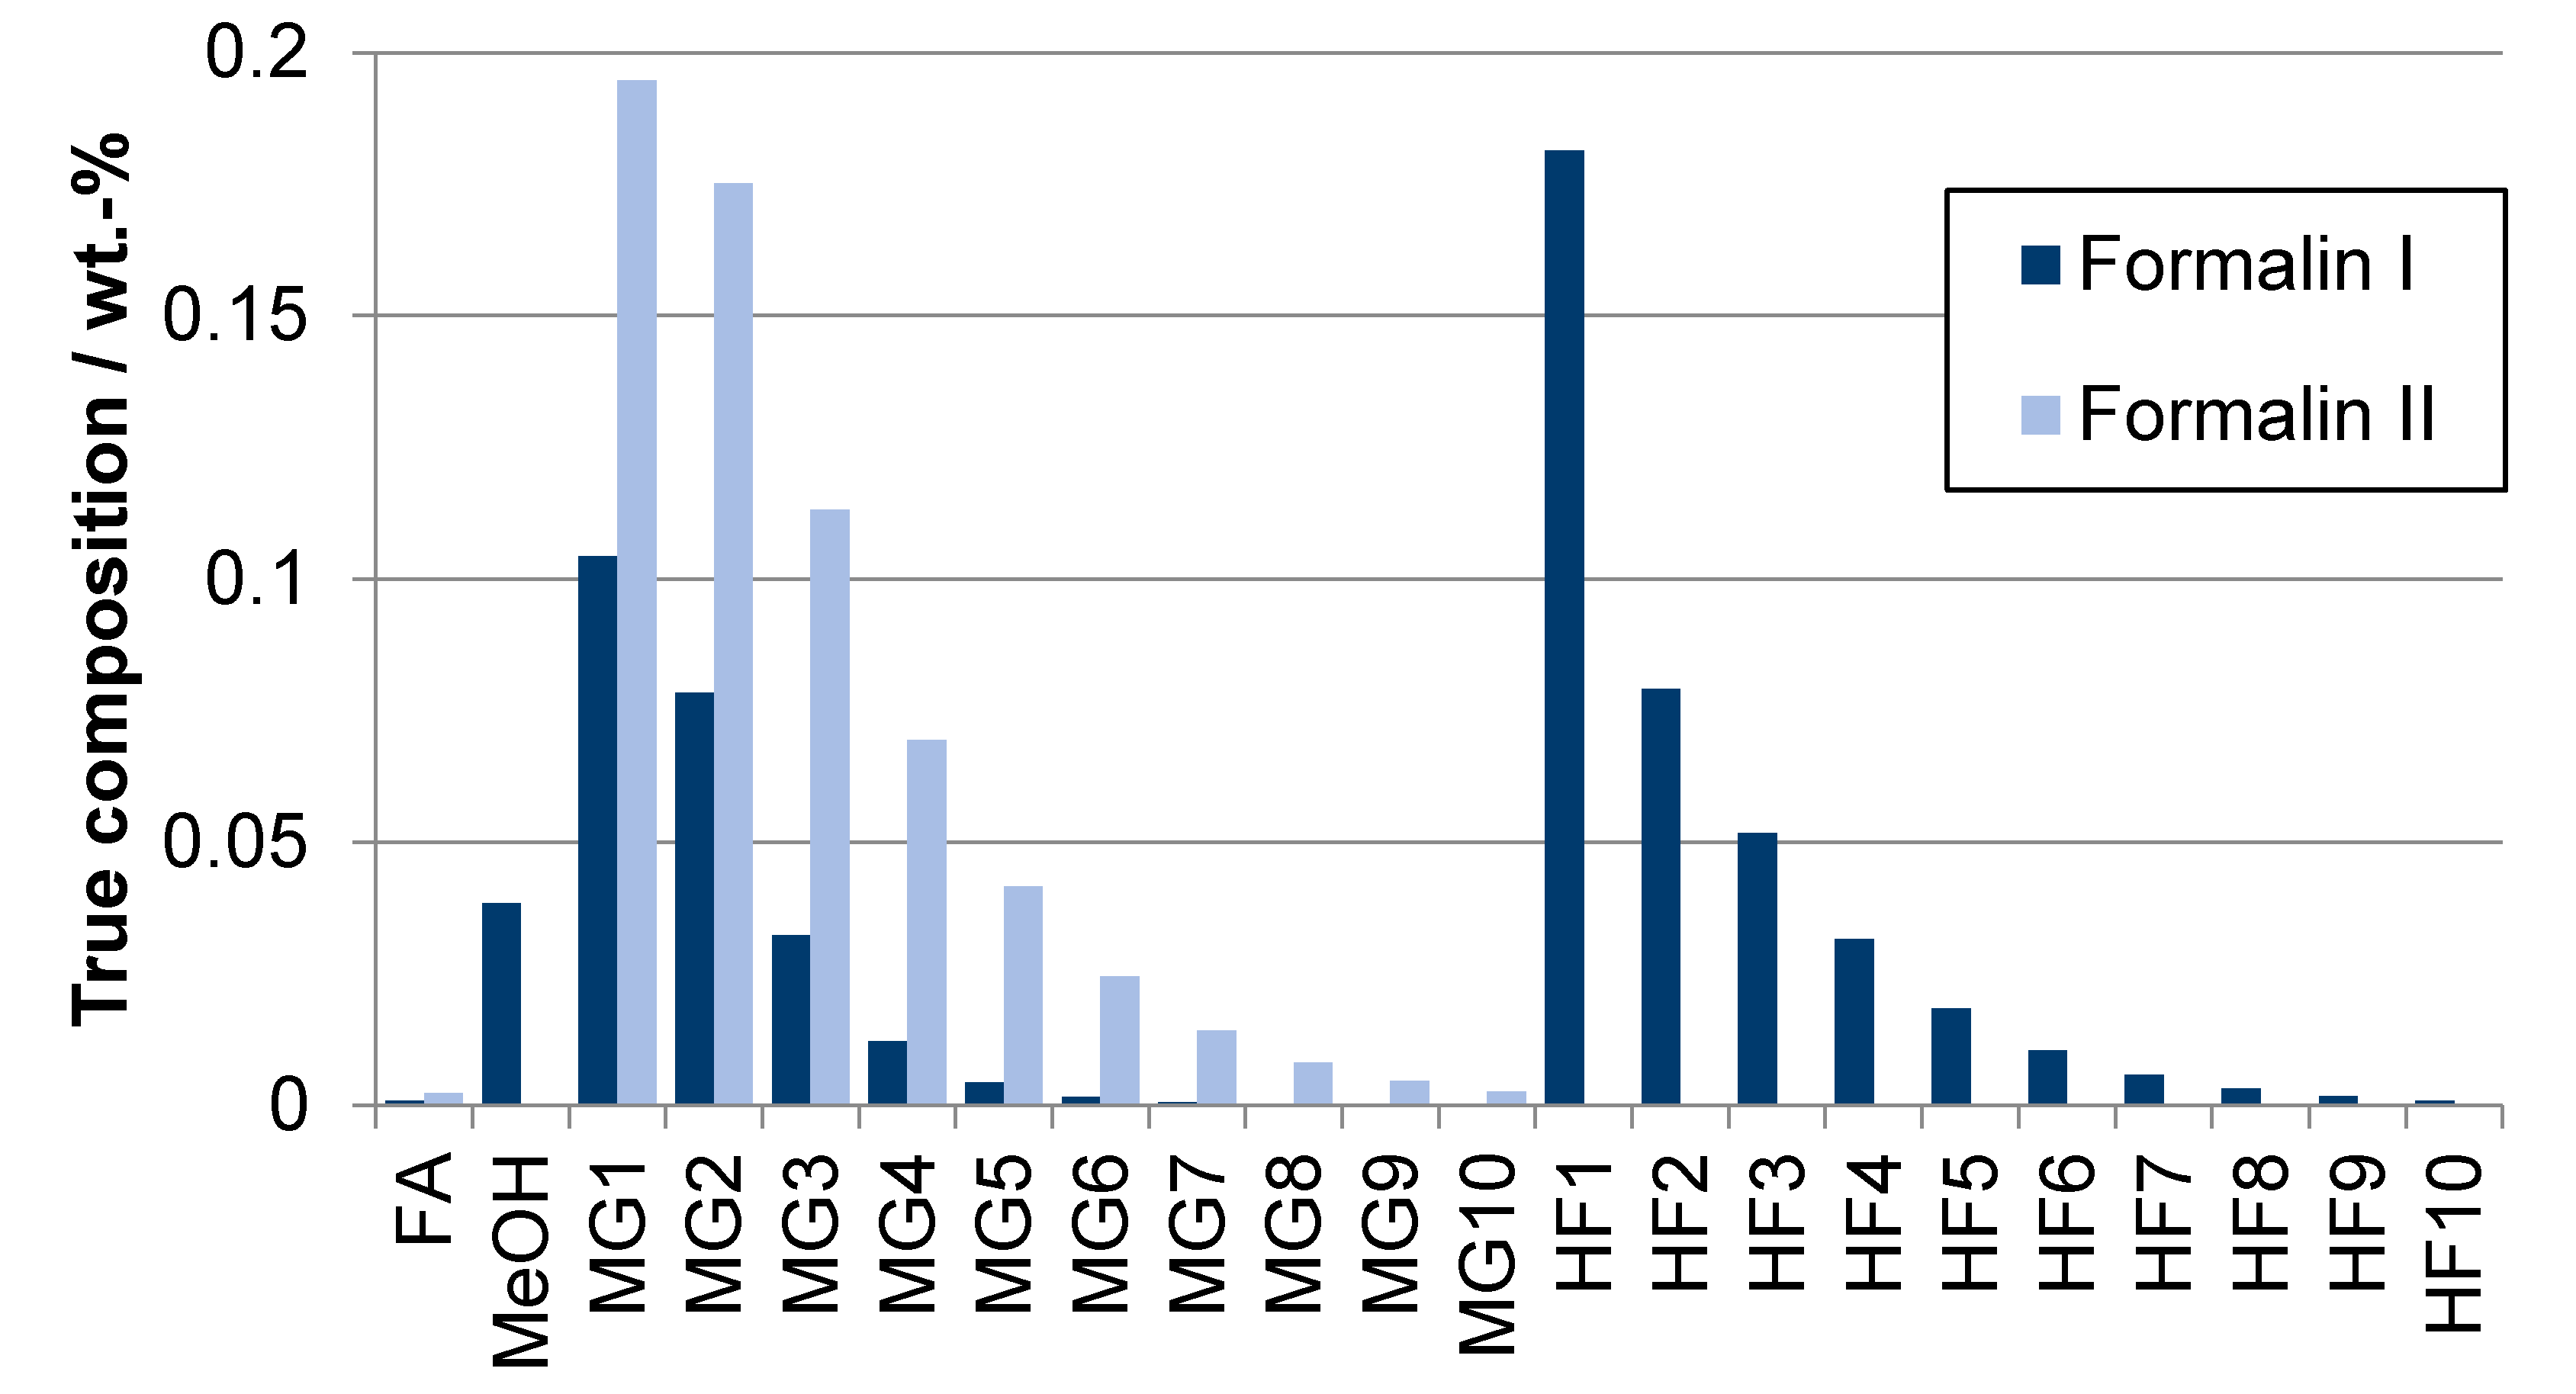
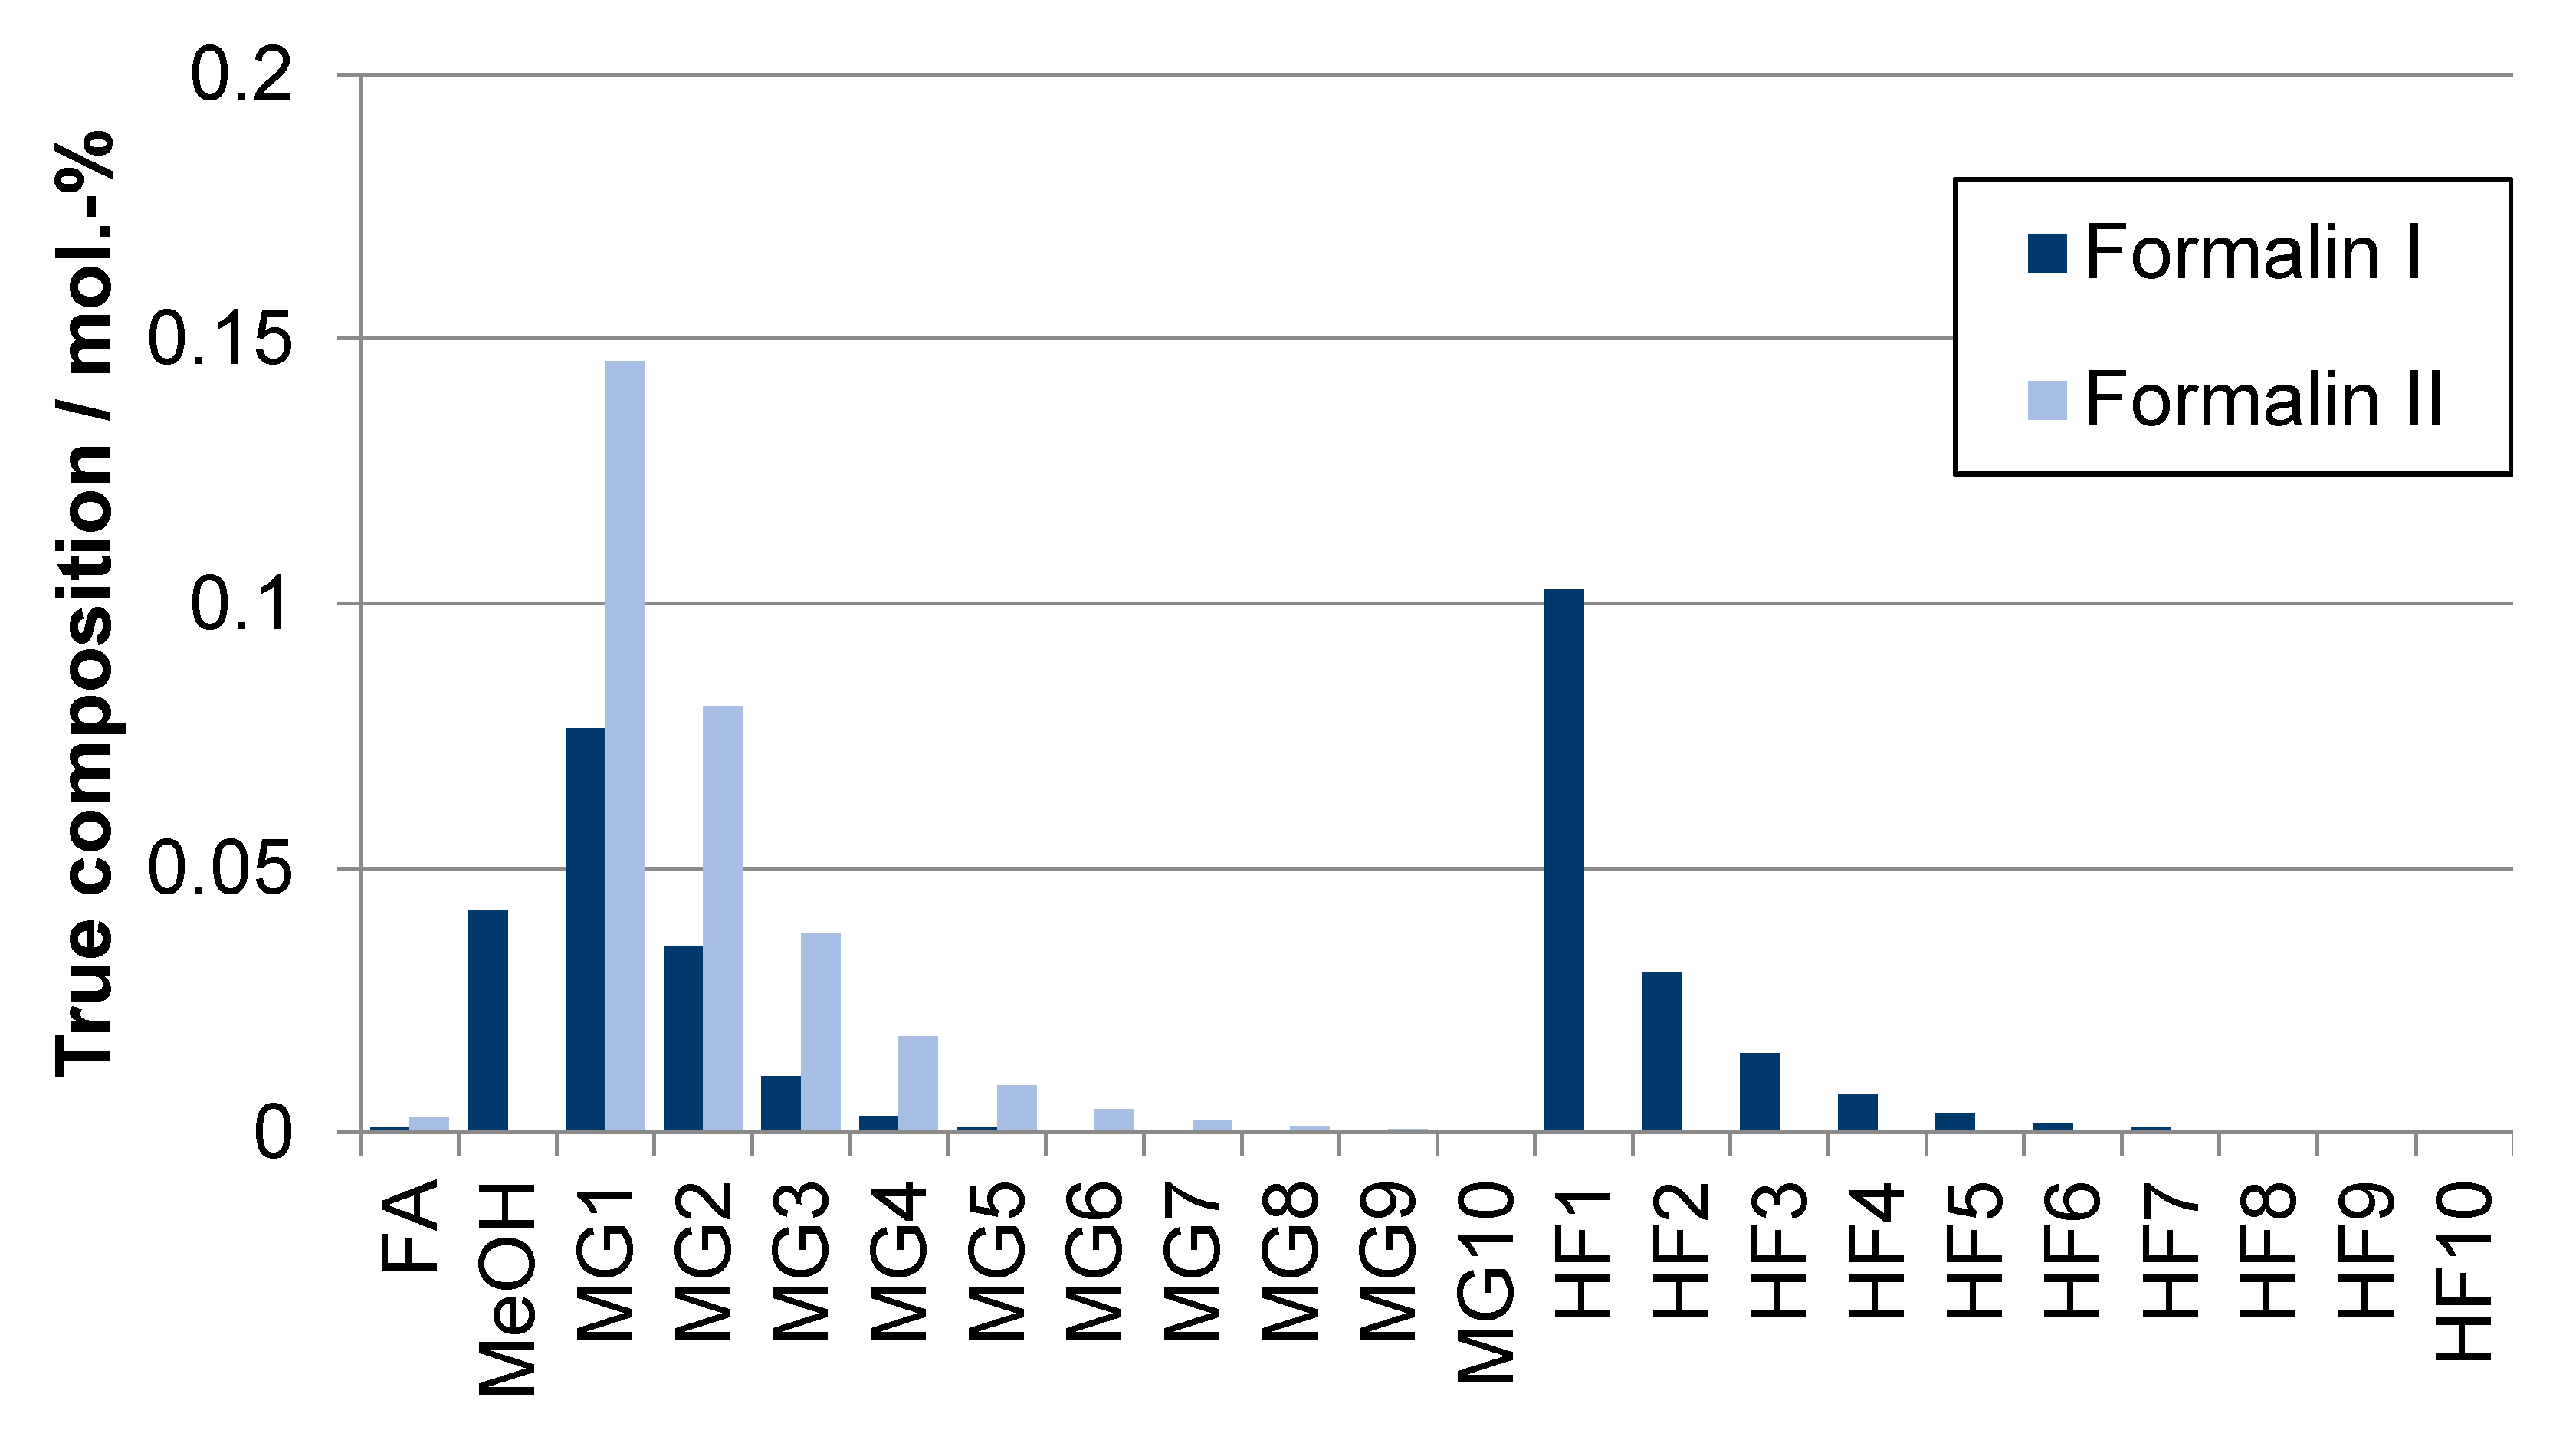
Table 10 lists the three different cases of the simulation using different absorbents and having different target products, corresponding to the OME3–5 synthesis routes shown in Figure 9. In accordance with the stoichiometric compositions listed in Table 10, Figure 12 and Figure 13 show the true compositions of the chemical equilibrium at 60 °C and 1 bar in weight and molar fraction, respectively. As formalin II contains almost no methanol, no HFn is formed. The true water contents at 60 °C and 1 bar of 34.2 wt.-% (66.8 mol.-%) in the case of formalin I and 34.9 wt.-% (69.8 mol.-%) in the case of formalin II are not shown in Figure 12 and Figure 13.
Table 11 displays the utility demand. Water cooling is not required, as cooling is provided via steam generation or air cooling. As the entire process runs at atmospheric pressure and pressure losses are neglected in this case study, no electricity demand is listed in Table 11. The distillation separation in column C-2 (see Figure 10) requires a comparatively higher amount of thermal energy (see Table 11) to ensure a high purity (99.9 wt.-% FA+W) of formalin for the downstream trioxane synthesis. The preheating of the feed using the heat exchanger E-8 is limited, as the formalin II stream can only be cooled to 60 °C because long-chain MGn could otherwise precipitate as solids [28].
The use of the wastewater of the OME1 synthesis as the absorbent in column C-1 decreases the methanol content of the absorber tail gas, slightly reducing the steam generated by tail gas burning. The amount of steam generated by formalin II synthesis is higher, as formalin II is methanol-free. This also reduces the raw material of methanol. The formalin II synthesis requires 0.706 kgMeOH/kgFA, whereas the syntheses of formalin Ia and formalin Ib require 0.763 kgMeOH/kgFA and 0.740 kgMeOH/kgFA.
As reported by Schemme et al. [11], using the wastewater from the OME1 synthesis plant as the absorbent in the upstream formalin synthesis leads, with the chosen assumptions, to an increase in the power-to-fuel efficiency from ηPTL = 0.443 to ηPTL = 0.448. The H2 demand and CO2 demand drop from 0.275 kgH2/kgOME1 to 0.270 kgH2/kgOME1 and from 3.039 kgCO2/lDE to 2.987 kgCO2/lDE, respectively [11].

4. Conclusions

In this work, the deviation between the calculated results using thermodynamic models and experimental literature data was determined using commercial spreadsheet software (Microsoft® Excel) and process simulation software (Aspen Plus®). In the latter case, the standard deviation was reduced to less than 4.9% in worst case by means of a curve-fitting method. Previously, the equations of the original model were adjusted through parameter-fitting to be used in the respective Aspen Plus® input template.
Aside from the physico-chemical behavior of the component system, reliable property data is fundamental for sound process simulations. However, important substances (polyoxymethylene dimethyl ethers (OMEn>1), hemiformals (HFn) and methylene glycols (MGn)) that take place in the OME3–5 synthesis are not available in the databases of common process simulation software like Aspen Plus® or CHEMCAD. Missing property data can be estimated based on the molecular structure using group contribution methods, whereby the accuracy of the prediction can be significantly improved when the normal boiling points (TB) are given. However, the TB of HFn and MGn cannot normally be physically measured, as these substances do not exist in pure form.
This study also determined the normal boiling points (TB) of HF2–10 and MG2–10 based on molecular analogies to OMEn. The TB of OME1 is given in the Aspen Plus® database, and while the TB of OME2–5 can be calculated using values from the literature. The TB of OMEn was determined extrapolating the vapor pressure equation parameters of OME2–5.
As an example of its application, we demonstrated herein that an optimization of the state-of-the-art formaldehyde synthesis process is possible based on the developed approaches, inter alia, along the OME3–5 synthesis routes. As different formaldehyde solutions along the synthesis routes are required, different process variations are presented in the optimization. Using the wastewater from subsequent processes as the absorbent in the FA synthesis, the loss of methanol in the absorber flue gas and the loss of formaldehyde in the wastewater were significantly reduced. In the case presented, using the wastewater of the OME1 synthesis decreases the demand of H2 from 0.275 kgH2/kgOME1 to 0.270 kgH2/kgOME1 and the demand of CO2 from 3.039 kgCO2/lDE to 2.987 kgCO2/lDE. Overall, the power-to-fuel efficiency can be improved by 0.5 percentage points using the suggested approach. Finally, the proposed modelling approach in this paper opens the way to further process optimization studies for the rather complex synthesis routes to produce OME3–5.

Author Contributions

Conceptualization, S.S., R.C.S. and R.P.; methodology, S.S. and R.P.; software, S.M. and M.K.; validation, S.M., M.K. and S.S.; investigation, S.S.; writing—original draft preparation, S.S.; writing—review and editing, S.S., R.C.S., and R.P.; visualization, S.S. and R.P.; supervision, R.C.S., R.P. and D.S.; project administration, R.P.; funding acquisition, R.P., D.S. All authors have read and agreed to the published version of the manuscript.

Funding

This research was partly funded by ACT ALIGN-CCUS Project, grant number 271501 and partly performed within the framework of project house TESYS (Technology-based Energy Systems Analysis) of RWTH Aachen University, financed by the Excellence Initiative of the German federal and state governments to promote science and research at German universities.

Acknowledgments

The authors would like to thank the members of the group “Future Fuels” at the Forschungszentrum Jülich GmbH, Institute of Energy and Climate Research (IEK-14 – Electrochemical Process Engineering) for their valuable input. Further thanks are addressed to the members of the JARA Energy seed fund, “Power to Fuel,” and its successor – The Competence Center Power to Fuel. JARA (Jülich-Aachen Research Alliance) is an initiative of RWTH Aachen University and the Forschungszentrum Jülich. This work was funded in part by the ACT ALIGN-CCUS Project No. 271501. Additionally, this work was partly performed within the framework of project house TESYS (Technology-based Energy Systems Analysis) of RWTH Aachen University, financed by the Excellence Initiative of the German federal and state governments to promote science and research at German universities.

Conflicts of Interest

The authors declare no conflict of interest. The funders had no role in the design of the study; in the collection, analyses, or interpretation of data; in the writing of the manuscript, or in the decision to publish the results.

Abbreviations

FAFormaldehyde
WWater
MeOHMethanol
MGMethylene glycol
OME1Methylal
OMEPolyoxymethylen dimethylether
HFHemiformal
TRITrioxane
DMEDimethyl ether
TBNormal boiling point
TCCritical temperature
pCCritical pressure
ARDAverage of the relative deviations
sStandard deviation
STPStandard temperature and pressure
ΔGR Gibbs free energy
ΔHREnthalpy of reaction

Appendix A

Figure A1. Equilibrium distribution in the gas phase of the component system FA-W at 90 °C.
Energies 13 03401 g0a1
Figure A2. Equilibrium distribution in the gas phase of the component system FA-MeOH at 80 °C.
Energies 13 03401 g0a2
Figure A3. Prism illustration of temperature-dependet binary diagrams of the system W/MeOH/FA.
Energies 13 03401 g0a3

Appendix A.1. Model for Activity-Based Equilibrium Constants

The correlations for K MG 1 and K HF 1 (Equations (A1) and (A2)) refer to the gas phase and all others to the liquid phase. The corresponding conversion between the gas and liquid phases takes place via the vapor pressures [32]:
K MG 1 L = x MG 1 x W x FA γ MG 1 γ W γ FA = K MG 1 G p W S p FA S p MG 1 S p 0
K HF 1 L = x HF x MeOH x FA γ HF 1 γ MeOH γ FA = K HF 1 G p MeOH S p FA S p HF 1 S p 0
Equations (A3) und (A4) describe the equilibrium constants of longer HFn and MGn with n ≥ 2 [32]:
K MG n L = x MG n x W x MG n 1 x MG 1 γ MG n γ W γ MG n 1 γ MG 1   n 2
K HF n L = x HF n x MeOH x HF n 1 x HF 1 γ HF n γ MeOH γ HF n 1 γ HF 1   n 2
The mass balances (Equations (A5) to (A8)) given by Albert et al. [52] to recalculate the FA, W and MeOH shares are as follows:
x ˜ FA = 1 s [ x FA + i = 1 ( i x MG i ) + i = 1 ( i x HF i ) ]
x ˜ W = 1 s [ x W + i = 1 x MG i ]
x ˜ MeOH = 1 s [ x MeOH + i = 1 x HF i ]
s = 1 + i = 1 ( i x MG i ) + i = 1 ( i x HF i )

Appendix A.2. UNIFAC Parameters Required for Modeling Component Systems on OME3–5 Synthesis Routes

Table A1. NRTL parameters of the component system trioxane-methylal and UNIFAC interaction parameters determined by data regression.
NRTL Parameter [21]UNIFAC Parameter (Regression)
a T R I , D M M 0.3 Ψ ( C H 2 O ) 3 , C 3 H 8 O 2 142.2
a D M M , T R I 0.3 Ψ C 3 H 8 O 2 , ( C H 2 O ) 3 −22.0
b T R I , D M M 251.45--
b D M M , T R I 33.22--
Table A2. UNIFAC groups.
SubstanceMolecule GroupsReference
WaterH2O[32]
FormaldehydeCH2O[32]
MethanolCH3OH[32]
MG1CH2(OH)2[32]
MG2–10(n − 1)-CH2O-[32]
2-OH
1-CH2-
HF1–10(n − 1)-CH2O-[32]
1CH3O-
1-CH2OH
Trioxane(CH2O)3Grützner [72] (based on Albert [49])
MethylalC3H8O2Drunsel [29] (based on Kuhnert [73])
Dimethylether1C2H6Oassumption
OME2–10n(CH2O)OME[54]
1C3H8O2
Table A3. UNIFAC volume and surface parameters.
NumberMolecule GroupRQReference
1-OH1.01.2[32]
2-CH2O-0.91830.78[32]
3(CH2O)OME0.91830.78[54]
4-CH2-0.67440.54[32]
5-CH30.90110.848[43]
6H2O0.92001.4[32]
7CH2(OH)22.67442.94[32]
8CH3OH1.43111.432[32]
9CH3O-1.14501.088[32]
10-CH2OH1.20441.124[32]
11(CH2O)32.7542.34Grützner [72] (based on Albert [49])
12C3H8O22.96442.716Drunsel [29] (based on Kuhnert [73])
13C2H6O1.230.418regression
Table A4. Interaction parameters Ψ i j of the UNIFAC groups listed in Table A2 and Table A3.
i\j124/56789101112133
10.028.1156.4353.5353.5−137.128.1−137.128.128.10.028.1
2237.70.083.4240.0240.0339.70.0339.7−320.6 *0.00.00.0
4/5986.5251.50.01318.01318.0697.2251.5697.2251.5251.50.0251.5
6−229.1−149.0300.00.000.0289.6−149.0289.680.628.9 *79.6−141.0 *
7−229.1−149.0300.00.000.0289.6−149.0289.680.628.9 *0.0−149.0
8249.1−180.616.5−181.0−181.00.0−180.60.0−16.7−71.2−69.4−180.6
9237.70.083.4240.0240.0339.70.0339.70.000.00.00.0
10249.1−180.616.5−181.0−181.00.0−180.60.0−187.70.00.0−180.6
11237.73041.2 *83.4379.4379.4239.60.0392.20.00142.20.03041.2 *
12237.70.083.4413.4 *413.3 *410.00.00.0−22.00.00.026.0
130.00.00.0−447.50.0−364.10.00.00.00.00.00.0
3237.70.083.4670.7240.0339.70.0339.7−320.6 *141.50.00.0
* for T = 80 °C.

Appendix A.3. Linear Regression of Correlations Parameters
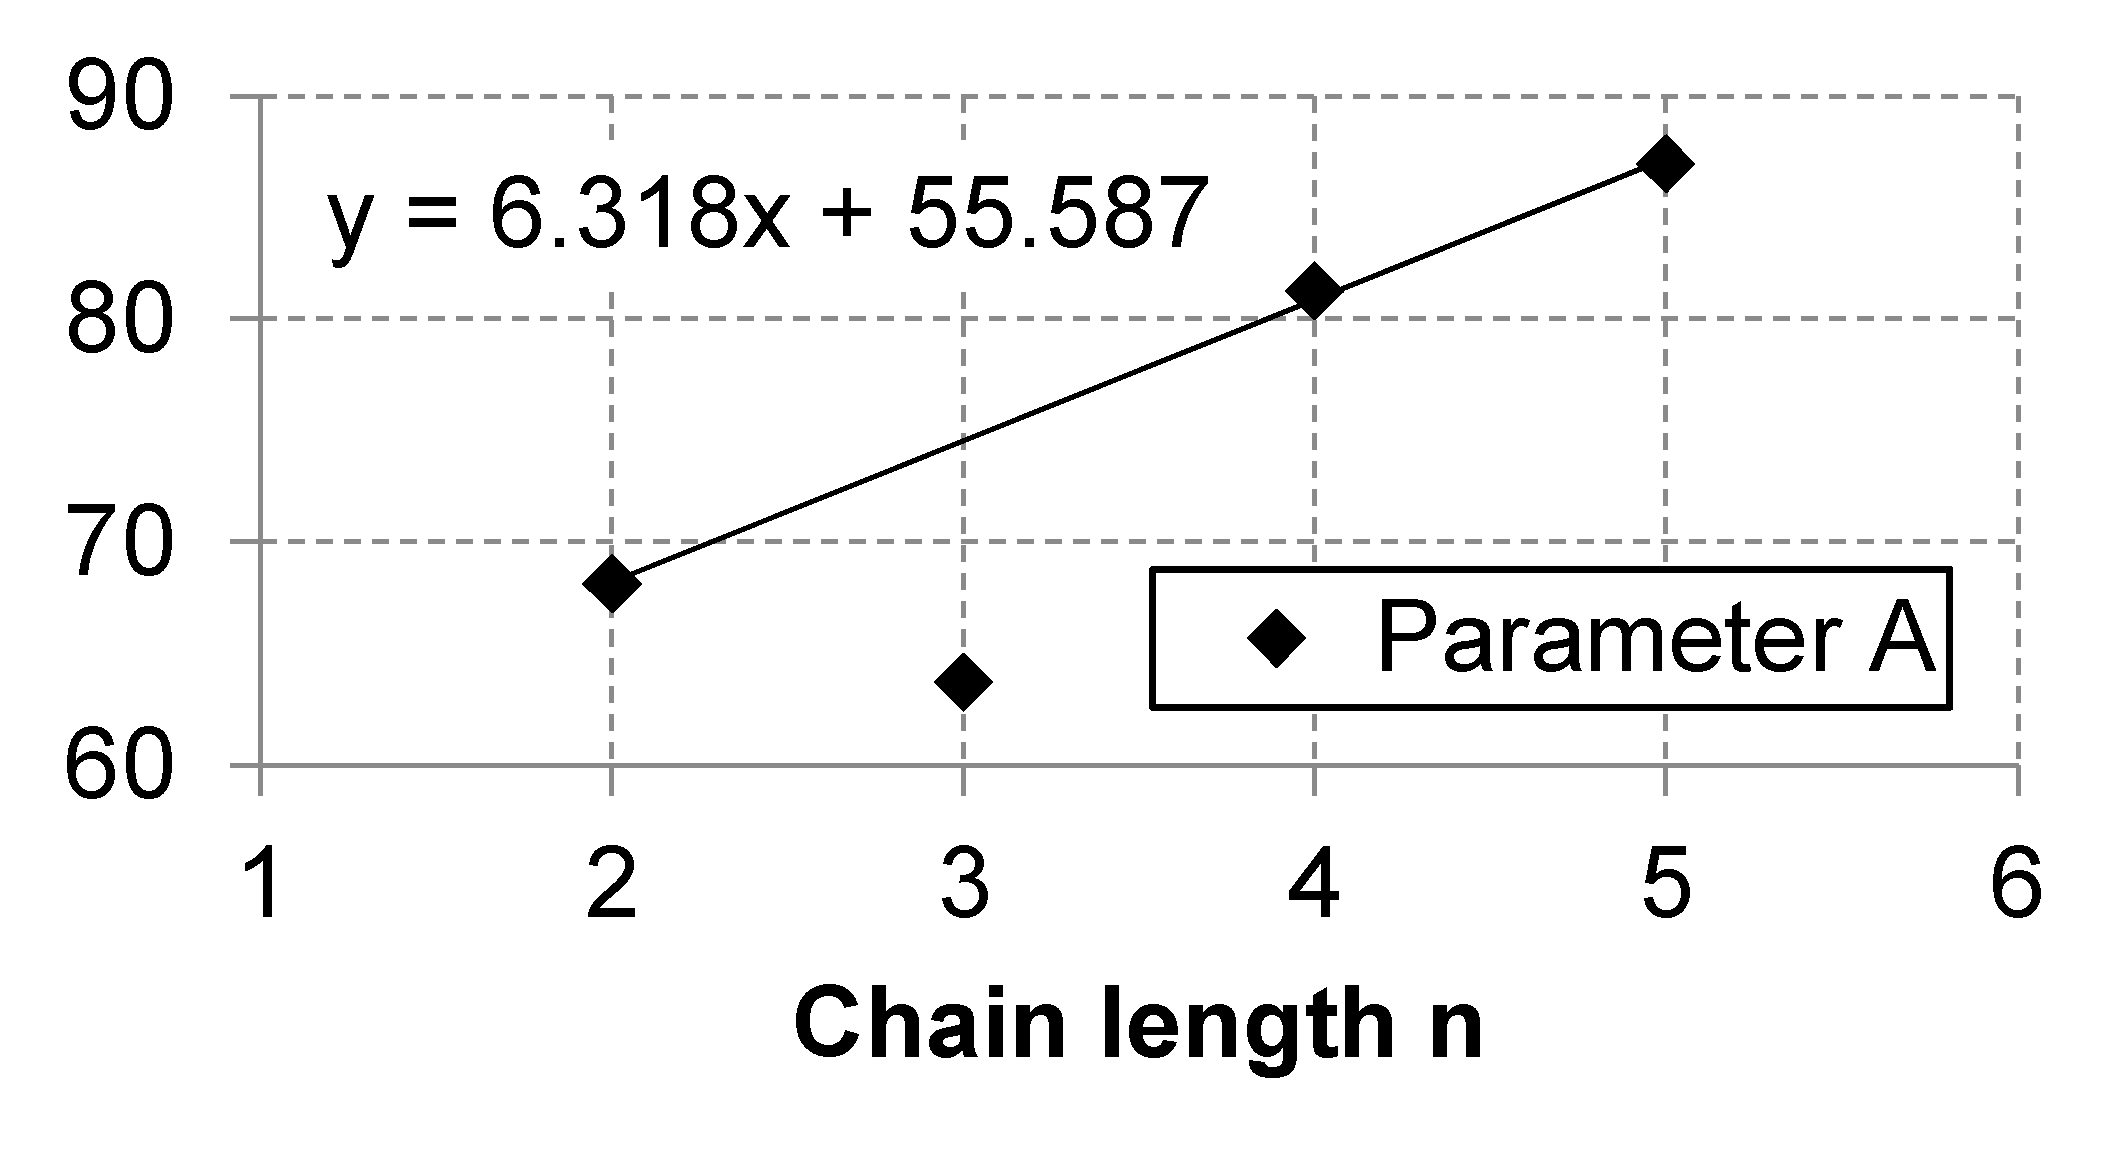
Figure A4. Linear regression of correlation parameter A of the vapor pressure equation (Equation (8)) for OME2–5 (data given by Boyd [77]).
Energies 13 03401 g0a4
Figure A5. Linear regression of correlation parameter B of the vapor pressure equation (Equation (8)) for OME2–5 (data given by Boyd [77]).
Energies 13 03401 g0a5
Figure A6. Linear regression of correlation parameter C of the vapor pressure equation (Equation (8)) for OME2–5 (data given by Boyd [77]).
Energies 13 03401 g0a6
Table A5. Normal boiling points of MG1–10 and HF1–10 based on the molecular structure using the group contribution method PCES (not to be used; the values used are listed in Table 7).
T B / ° C n = 1n = 2n = 3n = 4n = 5n = 6n = 7n = 8n = 9n = 10
MGn133.5178.8224.1269.4314.7360.0405.3450.6495.9541.2
HFn86.6131.9177.2222.5267.8313.1358.4403.7449.0494.3

References

  1. Schemme, S.; Samsun, R.C.; Peters, R.; Stolten, D. Power-to-fuel as a key to sustainable transport systems—An analysis of diesel fuels produced from CO2 and renewable electricity. Fuel 2017, 205, 198–221. [Google Scholar] [CrossRef]
  2. Lumpp, B.; Rothe, D.; Pastötter, C.; Lämmermann, R.; Jacob, E. Oxymethylene Ethers as Diesel Fuel Additives of the Future. MTZ Worldwide eMagazine 2011, 72, 34–38. [Google Scholar] [CrossRef]
  3. Burger, J.; Siegert, M.; Ströfer, E.; Hasse, H. Poly(oxymethylene) dimethyl ethers as components of tailored diesel fuel: Properties, synthesis and purification concepts. Fuel 2010, 89, 3315–3319. [Google Scholar] [CrossRef]
  4. Lautenschütz, L.; Oestreich, D.; Seidenspinner, P.; Arnold, U.; Dinjus, E.; Sauer, J. Physico-chemical properties and fuel characteristics of oxymethylene dialkyl ethers. Fuel 2016, 173, 129–137. [Google Scholar] [CrossRef]
  5. Barro, C.; Parravicini, M.; Boulouchos, K. Neat polyoxymethylene dimethyl ether in a diesel engine; part 1: Detailed combustion analysis. Fuel 2019, 256, 115892. [Google Scholar] [CrossRef]
  6. Iannuzzi, S.E.; Barro, C.; Boulouchos, K.; Burger, J. POMDME-diesel blends: Evaluation of performance and exhaust emissions in a single cylinder heavy-duty diesel engine. Fuel 2017, 203, 57–67. [Google Scholar] [CrossRef]
  7. Omari, A.; Heuser, B.; Pischinger, S. Potential of oxymethylenether-diesel blends for ultra-low emission engines. Fuel 2017, 209, 232–237. [Google Scholar] [CrossRef]
  8. Härtl, M.; Seidenspinner, P.; Jacob, E.; Wachtmeister, G. Oxygenate screening on a heavy-duty diesel engine and emission characteristics of highly oxygenated oxymethylene ether fuel OME1. Fuel 2015, 153, 328–335. [Google Scholar] [CrossRef]
  9. Zimmermann, A.W.; Gençer, E.; O’Sullivanb, F.; Schmäckera, R. E-fuels as Carbon Capture and Utilization Option for the Industry? A Standardized Techno-Economic Assessment OME3–5. In Proceedings of the 14th International Conference on Greenhouse Gas Control Technologies, GHGT-14, Melbourne, Australia, 22–25 October 2018. [Google Scholar]
  10. Bongartz, D.; Burre, J.; Mitsos, A. Production of Oxymethylene Dimethyl Ethers from Hydrogen and Carbon Dioxide—Part I: Modeling and Analysis for OME1. Ind. Eng. Chem. Res. 2019, 58, 4881–4889. [Google Scholar] [CrossRef]
  11. Schemme, S.; Breuer, J.L.; Köller, M.; Meschede, S.; Walman, F.; Samsun, R.C.; Peters, R.; Stolten, D. H2-based synthetic fuels: A techno-economic comparison of alcohol, ether and hydrocarbon production. Int. J. Hydrogen Energy 2019, 45, 5395–5414. [Google Scholar] [CrossRef]
  12. Held, M.; Tönges, Y.; Pélerin, D.; Härtl, M.; Wachtmeister, G.; Burger, J. On the energetic efficiency of producing polyoxymethylene dimethyl ethers from CO2 using electrical energy. Energy Environ. Sci. 2019, 12, 1019–1034. [Google Scholar] [CrossRef]
  13. Burre, J.; Bongartz, D.; Mitsos, A. Production of Oxymethylene Dimethyl Ethers from Hydrogen and Carbon Dioxide—Part II: Modeling and Analysis for OME3–5. Ind. Eng. Chem. Res. 2019, 58, 5567–5578. [Google Scholar] [CrossRef]
  14. Breitkreuz, C.F.; Schmitz, N.; Ströfer, E.; Burger, J.; Hasse, H. Design of a Production Process for Poly(oxymethylene) Dimethyl Ethers from Dimethyl Ether and Trioxane. Chemie Ingenieur Technik 2018, 90, 1–9. [Google Scholar] [CrossRef]
  15. Schmitz, N.; Burger, J.; Ströfer, E.; Hasse, H. From methanol to the oxygenated diesel fuel poly(oxymethylene) dimethyl ether: An assessment of the production costs. Fuel 2016, 185, 67–72. [Google Scholar] [CrossRef]
  16. Ouda, M.; Mantei, F.K.; Elmehlawy, M.; White, R.J.; Klein, H.; Fateen, S.E.K. Describing oxymethylene ether synthesis based on the application of non-stoichiomsetric Gibbs minimisation. React. Chem. Eng. 2018, 3, 277–292. [Google Scholar] [CrossRef]
  17. Peters, R. Identification and thermodynamic analysis of reaction pathways of methylal and OME-n formation. Energy 2017, 138, 1221–1246. [Google Scholar] [CrossRef]
  18. Peters, R.; Decker, M.; Eggemann, L.; Schemme, S.; Schorn, F.; Breuer, J.L.; Weiske, S.; Pasel, J.; Samsun, R.C.; Stolten, D. Thermodynamic and ecological preselection of synthetic fuel intermediates from biogas at farm sites. Energy Sustain. Soc. 2020, 10, 4. [Google Scholar] [CrossRef]
  19. Baranowski, C.J.; Bahmanpour, A.M.; Kröcher, O. Catalytic synthesis of polyoxymethylene dimethyl ethers (OME): A review. Appl. Catal. B Environ. 2017, 217, 407–420. [Google Scholar] [CrossRef]
  20. Hackbarth, K.; Haltenort, P.; Arnold, U.; Sauer, J. Recent Progress in the Production, Application and Evaluation of Oxymethylene Ethers. Chemie Ingenieur Technik 2018, 90, 1–10. [Google Scholar] [CrossRef]
  21. Burger, J. A Novel Process for the Production of Diesel Fuel Additives by Hierarchical Design. Ph.D. Thesis, Kaiserslautern Technical University, Kaiserslautern, Germany, 2012. [Google Scholar]
  22. Oestreich, D. Prozessentwicklung zur Gewinnung von Oxymethylenethern (OME) aus Methanol und Formaldehyd. Ph.D. Thesis, Karlsruher Institut für Technology, Karlsruhe, Germany, 2017. [Google Scholar]
  23. Bhatelia, T.; Lee, W.J.; Samanta, C.; Patel, J.; Bordoloi, A. Processes for the production of oxymethylene ethers: Promising synthetic diesel additives. Asia-Pac. J. Chem. Eng. 2017, 12, 827–837. [Google Scholar] [CrossRef]
  24. Weidert, J.-O.; Burger, J.; Renner, M.; Blagov, S.; Hasse, H. Development of an Integrated Reaction–Distillation Process for the Production of Methylal. Ind. Eng. Chem. Res. 2017, 56, 575–582. [Google Scholar] [CrossRef]
  25. Schmitz, N.; Strofer, E.; Burger, J.; Hasse, H. Conceptual Design of a Novel Process for the Production of Poly(oxymethylene) Dimethyl Ethers from Formaldehyde and Methanol. Ind. Eng. Chem. Res. 2017, 56, 11519–11530. [Google Scholar] [CrossRef]
  26. Schmitz, N.; Breitkreuz, C.F.; Ströfer, E.; Burger, J.; Hasse, H. Separation of water from mixtures containing formaldehyde, water, methanol, methylal, and poly(oxymethylene) dimethyl ethers by pervaporation. J. Membr. Sci. 2018, 564, 806–812. [Google Scholar] [CrossRef]
  27. Bertau, M.; Räuchle, K.; Offermanns, H. Methanol—Die Basischemikalie. Chemie In Unserer Zeit 2015, 49, 312–329. [Google Scholar] [CrossRef]
  28. Reuss, G.; Disteldorf, W.; Gamer, A.O.; Hilt, A. Formaldehyde. In Ullmann’s Encyclopedia of Industrial Chemistry; Wiley-VCH Verlag GmbH & Co. KGaA: Weinheim, Germany, 2012; Volume 15. [Google Scholar] [CrossRef]
  29. Drunsel, J.-O.; Renner, M.; Hasse, H. Experimental study and model of reaction kinetics of heterogeneously catalyzed methylal synthesis. Chem. Eng. Res. Des. 2012, 90, 696–703. [Google Scholar] [CrossRef]
  30. Hahnenstein, I.; Albert, M.; Hasse, H.; Kreiter, C.G.; Maurer, G. NMR Spectroscopic and Densimetric Study of Reaction Kinetics of Formaldehyde Polymer Formation in Water, Deuterium Oxide, and Methanol. Ind. Eng. Chem. Res. 1995, 34, 440–450. [Google Scholar] [CrossRef]
  31. Maiwald, M.; Fischer, H.H.; Ott, M.; Peschla, R.; Kuhnert, C.; Kreiter, C.G.; Maurer, G.; Hasse, H. Quantitative NMR Spectroscopy of Complex Liquid Mixtures:  Methods and Results for Chemical Equilibria in Formaldehyde−Water−Methanol at Temperatures up to 383 K. Ind. Eng. Chem. Res. 2003, 42, 259–266. [Google Scholar] [CrossRef]
  32. Maurer, G. Vapor-Liquid Equilibrium of Formaldehyde– and Water-Containing Multicomponent Mixtures. AIChE J. 1986, 32, 932–948. [Google Scholar] [CrossRef]
  33. Kuhnert, C.; Albert, M.; Breyer, S.; Hahnenstein, I.; Hasse, H.; Maurer, G. Phase Equilibrium in Formaldehyde Containing Multicomponent Mixtures:  Experimental Results for Fluid Phase Equilibria of (Formaldehyde + (Water or Methanol) + Methylal)) and (Formaldehyde + Water + Methanol + Methylal) and Comparison with Predictions. Ind. Eng. Chem. Res. 2006, 45, 5155–5164. [Google Scholar] [CrossRef]
  34. Albert, M.; García, B.C.; Kreiter, C.; Maurer, G. Vapor-liquid and chemical equilibria of formaldehyde-water mixtures. AIChE J. 1999, 45, 2024–2033. [Google Scholar] [CrossRef]
  35. Albert, M.; Hasse, H.; Kuhnert, C.; Maurer, G. New Experimental Results for the Vapor−Liquid Equilibrium of the Binary System (Trioxane + Water) and the Ternary System (Formaldehyde + Trioxane + Water). J. Chem. Eng. Data 2005, 50, 1218–1223. [Google Scholar] [CrossRef]
  36. Albert, M.; Hahnenstein, I.; Hasse, H.; Maurer, G. Vapor–liquid equilibrium of formaldehyde mixtures: New data and model revision. AIChE J. 1996, 42, 1741–1752. [Google Scholar] [CrossRef]
  37. Ott, M.; Schoenmakers, H.; Hasse, H. Distillation of formaldehyde containing mixtures: Laboratory experiments, equilibrium stage modeling and simulation. Chem. Eng. Process. Process Intensif. 2005, 44, 687–694. [Google Scholar] [CrossRef]
  38. Grützner, T.; Hasse, H. Solubility of Formaldehyde and Trioxane in Aqueous Solutions. J. Chem. Eng. Data 2004, 49, 642–646. [Google Scholar] [CrossRef]
  39. O’Connell, J.P.; Gani, R.; Mathias, P.M.; Maurer, G.; Olson, J.D.; Crafts, P.A. Thermodynamic Property Modeling for Chemical Process and Product Engineering: Some Perspectives. Ind. Eng. Chem. Res. 2009, 48, 4619–4637. [Google Scholar] [CrossRef]
  40. Grützner, T.; Hasse, H.; Lang, N.; Siegert, M.; Ströfer, E. Development of a new industrial process for trioxane production. Chem. Eng. Sci. 2007, 62, 5613–5620. [Google Scholar] [CrossRef]
  41. Ouda, M.; Yarce, G.; White, R.J.; Hadrich, M.; Himmel, D.; Schaadt, A.; Klein, H.; Jacob, E.; Krossing, I. Poly(oxymethylene) dimethyl ether synthesis—A combined chemical equilibrium investigation towards an increasingly efficient and potentially sustainable synthetic route. React. Chem. Eng. 2017, 2, 50–59. [Google Scholar] [CrossRef]
  42. Schmitz, N.; Breitkreuz, C.F.; Ströfer, E.; Burger, J.; Hasse, H. Vapor–liquid equilibrium and distillation of mixtures containing formaldehdye and poly(oxymethylene) dimethyl ethers. Chem. Eng. Process. Process Intensif. 2018, 131, 116–124. [Google Scholar] [CrossRef]
  43. Fredenslund, A.; Jones, R.L.; Prausnitz, J.M. Group-contribution estimation of activity coefficients in nonideal liquid mixtures. AIChE J. 1975, 21, 1086–1099. [Google Scholar] [CrossRef]
  44. Joback, K.G.; Reid, R.C. Estimation of pure-component properties from group-contributions. Chem. Eng. Commun. 1987, 57, 233–243. [Google Scholar] [CrossRef]
  45. Constantinou, L.; Gani, R. New group contribution method for estimating properties of pure compounds. AIChE J. 1994, 40, 1697–1710. [Google Scholar] [CrossRef]
  46. Aspen Technology, I. Aspen Physical Property System. In Physical Property Methods and Models; Aspen Technology: Cambridge, MA, USA, 2001. [Google Scholar]
  47. Gmehling, J.; Rasmussen, P.; Fredenslund, A. Vapor-liquid equilibriums by UNIFAC group contribution. Revision and extension. 2. Ind. Eng. Chem. Process Des. Dev. 1982, 21, 118–127. [Google Scholar] [CrossRef]
  48. Hahnenstein, I.; Hasse, H.; Kreiter, C.G.; Maurer, G. 1H- and 13C-NMR-Spectroscopic Study of Chemical Equilibria in Solutions of Formaldehyde in Water, Deuterium Oxide, and Methanol. Ind. Eng. Chem. Res. 1994, 33, 1022–1029. [Google Scholar] [CrossRef]
  49. Albert, M. Thermodynamische Eigenschaften formaldehydhaltiger Mischungen. Ph.D. Thesis, Universität Kaiserslautern, Aachen, Germany, 1999. [Google Scholar]
  50. Hasse, H.; Hahnenstein, I.; Maurer, G. Revised vapor-liquid equilibrium model for multicomponent formaldehyde mixtures. AIChE J. 1990, 36, 1807–1814. [Google Scholar] [CrossRef]
  51. Hasse, H.; Maurer, G. Vapor—Liquid equilibrium of formaldehyde-containing mixtures at temperatures below 320 K. Fluid Phase Equilibria 1991, 64, 185–199. [Google Scholar] [CrossRef]
  52. Albert, M.; Coto García, B.; Kuhnert, C.; Peschla, R.; Maurer, G. Vapor–liquid equilibrium of aqueous solutions of formaldehyde and methanol. AIChE J. 2000, 46, 1676–1687. [Google Scholar] [CrossRef]
  53. Albert, M.; Hahnenstein, I.; Hasse, H.; Maurer, G. Vapor−Liquid and Liquid−Liquid Equilibria in Binary and Ternary Mixtures of Water, Methanol, and Methylal. J. Chem. Eng. Data 2001, 46, 897–903. [Google Scholar] [CrossRef]
  54. Schmitz, N.; Friebel, A.; von Harbou, E.; Burger, J.; Hasse, H. Liquid-liquid equilibrium in binary and ternary mixtures containing formaldehyde, water, methanol, methylal, and poly(oxymethylene) dimethyl ethers. Fluid Phase Equilibria 2016, 425, 127–135. [Google Scholar] [CrossRef]
  55. Kuhnert, C.; Albert, M.; Breyer, S.; Hahnenstein, I.; Hasse, H.; Maurer, G. Phase Equilibrium in Formaldehyde Containing Multicomponent Mixtures:  Experimental Results for Fluid Phase Equilibria of (Formaldehyde + (Water or Methanol) + Methylal)) and (Formaldehyde + Water + Methanol + Methylal) and Comparison with Predictions. Ind. Eng. Chem. Res. 2006, 45, 6093–6094. [Google Scholar] [CrossRef] [Green Version]
  56. Hasse, H.; Maurer, G. Kinetics of the poly(oxymethylene) glycol formation in aqueous formaldehyde solutions. Ind. Eng. Chem. Res. 1991, 30, 2195–2200. [Google Scholar] [CrossRef]
  57. Ott, M.; Fischer, H.H.; Maiwald, M.; Albert, K.; Hasse, H. Kinetics of oligomerization reactions in formaldehyde solutions: NMR experiments up to 373K and thermodynamically consistent model. Chem. Eng. Process. Process Intensif. 2005, 44, 653–660. [Google Scholar] [CrossRef]
  58. Ott, M. Reaktionskinetik und Destillation formaldehydhaltiger Mischungen. Ph.D. Thesis, TU Kaiserslautern, Kaiserslautern, Germany, 2004. [Google Scholar]
  59. Ouda, M.; Mantei, F.; Hesterwerth, K.; Bargiacchi, E.; Klein, H.; White, R.J. A hybrid description and evaluation of oxymethylene dimethyl ethers synthesis based on the endothermic dehydrogenation of methanol. React. Chem. Eng. 2018, 3, 676–695. [Google Scholar] [CrossRef]
  60. Ai, Z.-J.; Chung, C.-Y.; Chien, I.L. DESIGN AND CONTROL OF POLY(OXYMETHYLENE) DIMETHYL ETHERS PRODUCTION PROCESS DIRECTLY FROM FORMALDEHYDE AND METHANOL IN AQUEOUS SOLUTIONS. IFAC-PapersOnLine 2018, 51, 578–583. [Google Scholar] [CrossRef]
  61. Liu, Y.-Q.; Hasse, H.; Maurer, G. Enthalpy change on vaporization of aqueous and methanolic formaldehyde solutions. AIChE J. 1992, 38, 1693–1702. [Google Scholar] [CrossRef]
  62. Burger, J.; Ströfer, E.; Hasse, H. Production process for diesel fuel components poly(oxymethylene) dimethyl ethers from methane-based products by hierarchical optimization with varying model depth. Chem. Eng. Res. Des. 2013, 91, 2648–2662. [Google Scholar] [CrossRef]
  63. Hasse, H. Dampf-Flüssigkeits-Gleichgewichte, Enthalpien und Reaktionskinetik in formaldehydhaltigen Mischungen. Ph.D. Thesis, University of Kaiserslautern, Kaiserslautern, Germany, 1990. [Google Scholar]
  64. Soboleva, O.D.; Kazakova, S.V.; Blazhin, Y.M.; Ogorodnikov, S.K. Liquid-Vapor Equilibrium in the Formaldehyde-Water System. Zhurnal Prikladnoi Khimii 1984, 57, 860–865. [Google Scholar]
  65. Kogan, L.V.; Blazhin, Y.M.; Ogorodnikov, S.K.; Kafarov, V.V. Liquid-Vapor Equilibrium in the System Formaldehyde-Water (Thermodynamic Verification with Chemical Interaction in the Liquid Phase Taken into Account). Zhurnal Prikladnoi Khimii 1977, 50, 2682–2687. [Google Scholar]
  66. Walker, J.F. Formaldehyde; Reinhold: New York, NY, USA, 1964. [Google Scholar]
  67. Savchenko, V.I. Equilibrium in the reaction of trioxane formation in aqueous formaldehyde solutions. Bull. Acad. Sci. USSR Div. Chem. Sci. 1969, 18, 2449–2451. [Google Scholar] [CrossRef]
  68. Balashov, A.L.; Krasnov, V.L.; Danov, S.M.; Chernov, A.Y.; Sulimov, A.V. Formation of Cyclic Oligomers in Concentrated Aqueous Solutions of Formaldehyde. J. Struct. Chem. 2001, 42, 398–403. [Google Scholar] [CrossRef]
  69. Drunsel, J.-O. Entwicklung von Verfahren zur Herstellung von Methylal und Ethylal. Ph.D. Thesis, Kaiserslautern Technical University, Kaiserslautern, Germany, 2012. [Google Scholar]
  70. Gauss, C.F. Abhandlungen zur Methode der Kleinsten Quadrate; P. Stankiewicz: Berlin, Gemany, 1887. [Google Scholar]
  71. Redlich, O.; Kwong, J.N.S. On the Thermodynamics of Solutions. V. An Equation of State. Fugacities of Gaseous Solutions. Chem. Rev. 1949, 44, 233–244. [Google Scholar] [CrossRef]
  72. Grützner, T. Entwicklung eines destillationsbasierten Verfahrens zur Herstellung von Trioxan. Ph.D. Thesis, Institut für Technische Thermodynamik und Thermische Verfahrenstechnik, Universität Stuttgart, Stuttgart, Germany, 2007. [Google Scholar]
  73. Kuhnert, C. Dampf-Flüssigkeits-Gleichgewichte in mehrkomponentigen formaldehydhaltigen Systemen. Ph.D. Thesis, Universität Kaiserslautern, Kaiserslautern, Germany, 2004. [Google Scholar]
  74. Haltenort, P.; Hackbarth, K.; Oestreich, D.; Lautenschütz, L.; Arnold, U.; Sauer, J. Heterogeneously catalyzed synthesis of oxymethylene dimethyl ethers (OME) from dimethyl ether and trioxane. Catal. Commun. 2018, 109, 80–84. [Google Scholar] [CrossRef]
  75. AspenTech. Aspen Physical Property System—Physical Property Models; AspenTech: Cambridge, MA, USA, 2012. [Google Scholar]
  76. AspenTech. Aspen Plus User Guide V10.2; AspenTech: Cambridge, MA, USA, 2000. [Google Scholar]
  77. Boyd, R.H. Some Physical Properties of Polyoxymethylene Dimethyl Ethers. J. Polym. Sci. 1961, 50, 133–141. [Google Scholar] [CrossRef]
  78. Chauvel, A.; Lefebvre, G. Petrochemical Processes; Editions OPHRYS: Paris, France, 2001. [Google Scholar]
  79. Panzer, E.; Emig, G. Verfahrensoptimierung der technischen Formaldehydsynthese am Silberkatalysator; Lehrstuhl für Technische Chemie I, Universität Erlangen-Nürnberg: Nürnberg, Germany, 2000. [Google Scholar]
  80. Álvarez, V.H.; Mattedi, S.; Iglesias, M.; Gonzalez-Olmos, R.; Resa, J.M. Phase equilibria of binary mixtures containing methyl acetate, water, methanol or ethanol at 101.3 kPa. Phys. Chem. Liq. 2011, 49, 52–71. [Google Scholar] [CrossRef]
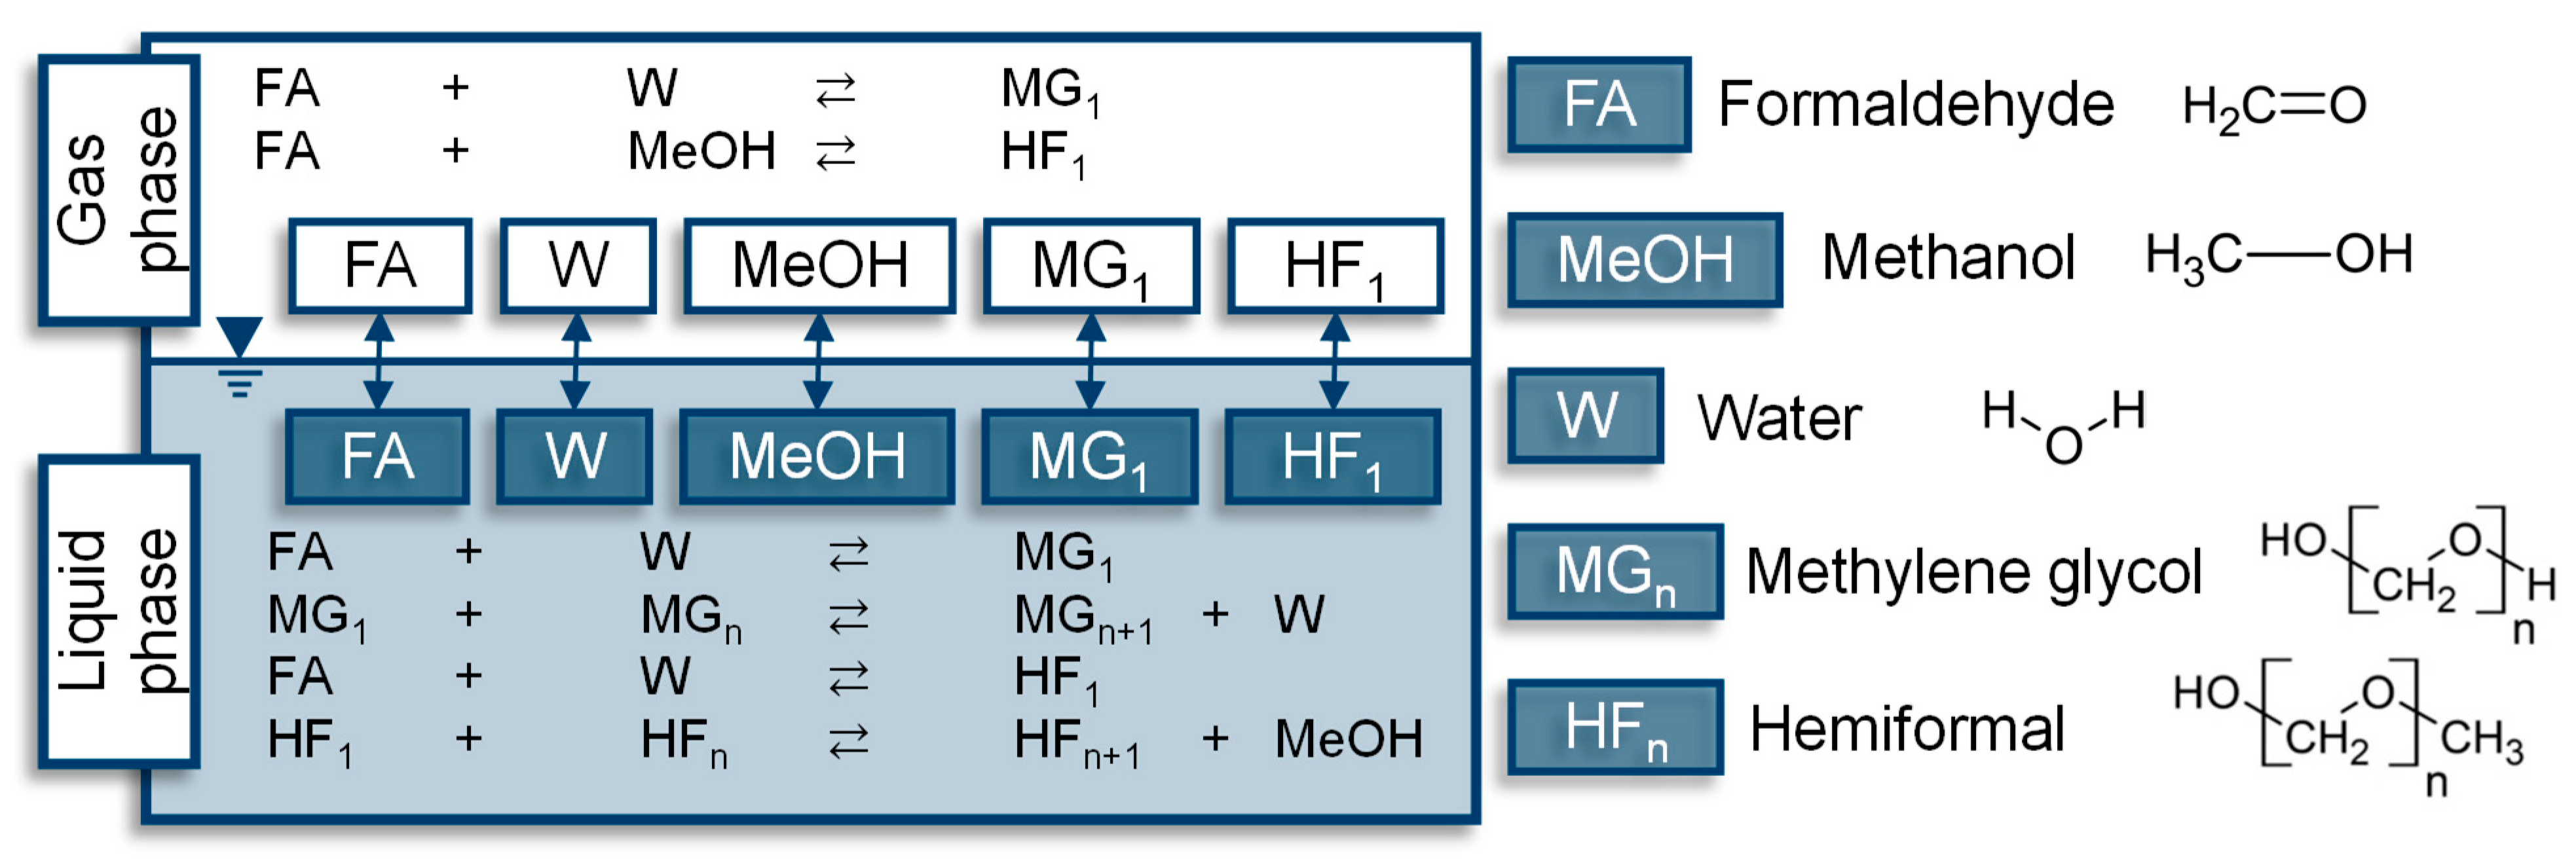
Figure 1. Chemical equilibrium reactions in water and methanol-containing formaldehyde (FA) solutions [30,31,32,33,34,35,37,39].
Energies 13 03401 g001
Figure 2. Illustration of the research approach followed in this paper.
Energies 13 03401 g002
Figure 3. Phase equilibrium of the system formaldehyde-water (FA-W) for different temperatures calculated using Excel and compared to the experimental data [32,34,64,65].
Energies 13 03401 g003
Figure 4. Phase equilibrium of the system formaldehyde-methanol (FA-MeOH) for different temperatures calculated using Excel compared to the experimental data [65].
Energies 13 03401 g004
Figure 5. Equilibrium distribution in the liquid phase of the component system FA-W at 90 °C.
Energies 13 03401 g005
Figure 6. Equilibrium distribution in the liquid phase of the component system FA-MeOH at 80 °C.
Energies 13 03401 g006
Figure 7. Phase equilibrium of the FA-W-system for different temperatures calculated using Aspen Plus®, compared to the experimental data [32,34,64,65].
Energies 13 03401 g007
Figure 8. Phase equilibrium of the FA-MeOH system for different temperatures calculated using Aspen Plus®, compared to the experimental data [65].
Energies 13 03401 g008
Figure 9. Poly oxymethylene dimethyl ethers with a chain length of 3 to 5 (OME3–5) synthesis routes based on methanol (reproduced with modifications; Burger [21]).
Energies 13 03401 g009
Figure 10. Process flowsheet for formalin synthesis from methanol.
Energies 13 03401 g010
Figure 11. Illustration of the phase equilibria W/MeOH/FA with experimental literature data [80] and conodes of selected stages in column C-2; see Figure 10.
Energies 13 03401 g011
Figure 12. True composition in weight as a percentage of formalin I and formalin II at 60 °C and 1 bar.
Energies 13 03401 g012
Figure 13. True composition in molar percent of formalin I and formalin II at 60 °C and 1 bar.
Energies 13 03401 g013
Table 1. Average of the relative deviations (ARD) and standard deviations between the modeled phase equilibria diagram shown in Figure 3 and Figure 4 and the experimental data [32,34,64,65].
Component SystemDiagram of the Modeled Phase Equilibria and Experimental DataBoiling Point LineDew Point Line
ARD
%
s
%
ARD
%
s
%
FA-W system
generated using
Excel
90 °CFigure 3,
experimental data [32,34,64,65]
1.231.271.170.86
70 °C0.650.630.570.41
50 °C0.480.530.690.47
FA-MeOH system generated using
Excel
80 °CFigure 4,
experimental data [65]
6.435.353.402.73
70 °C6.305.636.344.47
60 °C3.363.885.455.35
Table 2. In Aspen Plus®, with the implemented correlation parameters of the equilibrium constants and least square errors (LSEs).
l n ( K M G n L ) l n ( K H F n L )
n A B C L S E A B C L S E
1–242.11718033.5473.13173.85600–11.71.945
2151.9215–8666.63–21.50840.230–2.097–49.150.00.0
3152.41–8508.3–21.70350.259–1.635–530.00.0
4152.372–8502.62–21.69480.199–1.682–530.00.0
5152.367–8491.15–21.69640.200–1.709–530.00.0
6152.363–8470.65–21.70350.252–1.728–530.00.0
7152.358–8470–21.70150.232–1.741–530.00.0
8152.351–8477–21.6960.187–1.751–530.00.0
9152.334–8468.75–21.69610.205–1.759–530.00.0
10152.3375–8464.4–21.6980.216–1.765–530.00.0
Table 3. Average of the relative deviations and the standard deviations between the modeled phase equilibria diagram shown in Figure 7 and Figure 8, as well as the experimental data.
Component SystemDiagram of Modeled Phase Equilibria and Experimental DataBoiling Point LineDew Point Line
ARD
%
s
%
ARD
%
s
%
FA-W system generated using Aspen Plus®90 °CFigure 7,
Experimental data [32,34,64,65]
1.291.481.661.25
70 °C0.740.740.570.38
50 °C0.430.411.230.90
FA-MeOH system generated using
Aspen Plus®
80 °CFigure 8,
experimental data [65]
1.881.833.774.88
70 °C2.522.553.072.40
60 °C1.501.392.883.04
Table 4. Comparison of critical component properties from Aspen Plus® databases with the built-in predictive models.
Aspen Plus®
Database
Case 1: Estimation Using
the Molecular Structure
Case 2: Estimation Using
the Molecular Structure and Boiling Point T B
T B / K T C / K p C / bar T B / K ARD / % T C / K ARD / % p C / bar ARD / % T B / K ARD / % T C / K ARD / % p C / bar ARD / %
OME1315.0497.039.5312.9
0.7%
477.4
3.9%
42.2
6.8%
315.0
0.0%
480.7
3.3%
42.2
(6.8%)
DME248.3400.053.7267.6
7.8%
427.9
7.0%
49.1
8.6%
248.3
0.0%
397.2
0.7%
49.1
(8.6%)
TRI387.7604.058.2373.1
3.8%
585.0
3.2%
59.6
2.5%
397.7
0.0%
607.8
0.6%
59.6
(2.5%)
Table 5. Correlation parameters of vapor pressure equation (Equation (8)) and the normal boiling points of OMEn.
OMEn Chain Length nABCDTB/°CReference
275.01−7223.440.0−8.25104.7[77]
370.59−8042.310.0−7.41155.6[77]
488.12−10017.280.0−9.75201.3[77]
593.85−11323.170.0−10.40241.7[77]
6100.40−12720.000.0−11.15276.6*
7106.72−14091.900.0−11.87307.9*
8113.04−15462.800.0−12.59335.7*
9119.36−16833.700.0−13.31360.7*
10125.67−18204.600.0−14.03383.1*
* Linear regression (based on data provided by Boyd [77]).
Table 6. Correlation parameters of the vapor pressure equation (Equation (8)) and normal boiling points (TB) of HF1 and MG1.
ABCDTB/°CReference
MG111.07681997.20−142.720.0178.8[32]
HF118.01255125.000.00.0109.5[32]
Table 7. Calculated normal boiling points (TB) of MG1–10 and HF1–10.
T B / ° C n = 1n = 2n = 3n = 4n = 5n = 6n = 7n = 8n = 9n = 10
MGn178.8241.6292.5338.3378.6413.6444.8472.7497.6520.1
HFn109.5172.3223.2268.9309.3344.3375.5403.4428.3450.8
Table 8. Estimated critical temperature (TC) of MG1–10, HF1–10 and OME1–10.
T C / ° C n = 1n = 2n = 3n = 4n = 5n = 6n = 7n = 8n = 9n = 10
MGn356.9400.1443.3486.9531.3577.0624.2673.3724.9779.3
HFn282.8327.4371.3415.0458.9503.4549.0596.1645.0696.1
OMEn223.9 *280.7333.2377.5414.4442.9469.4493.2515.1536.0
* Value given in Aspen Plus® database.
Table 9. Gibbs free energy (ΔGR) and enthalpy of reaction (ΔHR) of the reaction Equations (10) to (13).
Equation Δ G R S T P   kJ / mol Δ H R S T P kJ / mol Δ G R r e a c t .   c o n d . kJ / mol Δ H R r e a c t . c o n d . kJ / mol
Equation (10)52.6385.33−19.7392.05
Equation (11)−52.63−85.3319.73−92.05
Equation (12)−176.14−156.67−217.82−155.35
Equation (13)−689.57−676.46−720.34−673.22
Table 10. Products of formalin synthesis using different absorbents.
ProductStoichiometric Weight Fraction/wt.-%RouteAbsorbent
FAWaterMethanol
Formalin Ia40.740.718.6AFreshwater
Formalin Ib40.740.718.6BOME1 wastewater
(5.0 wt.-% FA)
Formalin II50.050.00.0B, CTRI wastewater
(1.0 wt.-% FA)
Table 11. Heat demand and excess of formalin synthesis from methanol. HP: high pressure (39.7 bar), MP: medium pressure (8.9 bar) and LP: low pressure (2.3 bar).
UnitFormalin Ia
Heat
MJ/kg
Formalin Ib
Heat
MJ/kg
Formalin II
Heat
MJ/kg
Temperature
Level
°C
Heating or
Cooling
Utility
Reactor R-1−2.183−2.119−2.665630HP steam (250 °C)
Steam generator E-5−1.964−1.830−2.385260HP steam (250 °C)
Steam generator E-6−0.264−0.256−0.322185MP steam (175 °C)
Steam generator E-7−0.174−0.168−0.212135LP steam (125 °C)
Column Reboiler C-2--4.89299LP steam (125 °C)