Article

Cogeneration Economics for Greenhouses in Europe

by
Kalliopi Tataraki
*,
Eugenia Giannini
,
Konstantinos Kavvadias
and
Zacharias Maroulis
Laboratory of Process Analysis and Design, National Technical University of Athens, 15780 Athens, Greece
*
Author to whom correspondence should be addressed.
Energies 2020, 13(13), 3373; https://doi.org/10.3390/en13133373
Submission received: 2 May 2020 / Revised: 16 June 2020 / Accepted: 17 June 2020 / Published: 1 July 2020
(This article belongs to the Special Issue Cogeneration Economics)

Abstract

:
Cogeneration is a cost-effective technology, and modern greenhouses are considered one of the best applications for it due to their energy intensity. Taking into account that in such cases the production cost is significantly affected by the cost of energy, the potential of combined heat and power (CHP) has already been examined and proved in practice in some European countries, with the Netherlands being the most representative example. In this study, a comparative investigation of the greenhouse energy cost in all European countries is presented through the use of a combined cooling heat and power (CCHP) system. Using actual historical data spanning a decade, a total overview of the European level is given regarding greenhouse thermal requirements and CCHP energy costs for the cultivation of products with an accepted temperature cultivation range 20 ± 5 °C. By consulting (a) the available daily historical meteorological data for the 2008–2018 period, (b) the recorded actual electricity and natural gas prices for the 2008–2018 period, and (c) the technical characteristics of the CCHP system, the annual heating and cooling requirements of greenhouses are determined for all EU countries. Assuming a cogeneration unit with an internal combustion engine (ICE) as a prime mover, as well as a single-effect absorption chiller for the production of useful cooling, the unitary cost of energy is estimated along with the annual cost for heating and cooling per unit cultivation area. Using this methodology, the economic efficiency of cogeneration in greenhouses is assessed for the selected 10-year period, allowing the identification of the countries that benefit the most from this technology. The results indicate that the spark ratio (e.g., the electricity to natural gas price ratio) is the most crucial parameter for greenhouse costs. For countries where the ratio is larger than 3, greenhouses can even result in an extra cashflow instead of energy expenditures. The most favorable conditions for cogeneration use were found in Italy and the United Kingdom with an average spark ratio more than 4, resulting in an annual total cost of heating energy close to −7 €/m2 per year. On the other hand, cogeneration proved not to be a cost-efficient system in Sweden and Finland as a result of significantly high greenhouse energy requirements.

1. Introduction

Protected cultivation is steadily expanding in European counties, and the greenhouse sector is considered to be one of the most energy-intensive areas in the agri-foods industry [1]. According to a recent report [2], the estimated area of protected cultivation in Europe was around 175,000 ha in 2015, with a growth rate of 4.5% between 2005 and 2013. The Netherlands and Spain lead in greenhouse applications, followed by other Mediterranean counties (Italy, France, Greece). In Europe, cultivation is mainly based on vegetables that belong to either the Solanacea (tomato, pepper, eggplant) or to the Cucurbitacea plant family (melon, summer squash, watermelon and cucumber) [3].
The greenhouses structures and energy equipment utilized vary. According to the literature [2], low-cost greenhouse structures are more common in Mediterranean—with an average cost between 0.2 to 0.6 million Euros/ha—than in Central and North Europe, where state-of-the-art technologies are more often utilized. In the latter case, costs vary between 0.9 and 1.2 million Euros/ha. Each greenhouse type has its pros and cons. The advantage of low-tech facilities is that they are not directly affected by the volatility of energy prices and are less exposed to similar risks. On the other hand, modern facilities have the comparative benefit of being independent from external climatic conditions that can affect their productivity, although operating costs in such cases are susceptible to fluctuations. Thus, minimization of energy costs, which account for up to 40% of final production costs [4,5,6], is primary objective of modern and high-yield greenhouses.
In general, the amount of thermal energy required in a greenhouse depends on the product cultivation requirements and the climatic conditions of the region, while the cost of energy is directly connected to energy prices and the technology used to fulfil the facility’s energy needs. Regarding climatic factors, it is widely accepted that the most significant factors for crop cultivation are ambient temperature and solar irradiation. The former is critical in order to meet cultivation requirements, while the latter is a basic factor behind photosynthesis and, consequently, the crop growth [1]. As far as technologies are concerned, among the various available energy systems used in greenhouse applications for heating, air-unit heaters are a less-efficient solution (usually adopted in small-scale applications), while gas boilers are more popular. Sustainable energy sources have also been introduced in the sector over the last decades in an effort to mitigate climate change, starting with energy-intensive facilities. Cases of solar energy [7,8], geothermal energy [9], and biomass [10] have already been discussed. Combined heat and power (CHP) systems have also been examined and implemented in different countries [11,12]. CHP when combined with an absorption chiller can efficiently provide useful cooling. Such systems can further reduce the productivity problems of facilities affected by hot summer climates by extending their overall operating periods [12].
Greenhouses have been widely researched in terms of energy use [13,14,15,16,17,18,19], and multiple studies have performed economic analyses of agricultural production [12,20,21]. The key issue in the relevant research is the determination of the required energy input per area (MWh per ha), and the area production cost (cost per ha). Some indicative outputs have been determined from country-specific studies, such as in Turkey, where much research has been done on this field. Çetin et al. [17] performed an economic analysis and compared input energy (per ha) for industrial tomato production with production costs. They concluded that fuel (diesel) energy was the biggest energy input, accounting almost for 35% of the total energy consumed (12.6 MWh/ha), and that there was an insufficient energy output–input ratio, due to low tomato prices. An examination of energy inputs and a cost analysis of intermediate-type tomatoes staked and grown in an open field in Tokat province (Turkey) was the subject of research done by Esengun et al. [14], who proved that the energy intensiveness required for the production of this product was 26.9 MWh/ha. Similar to Çetin et al. [17], a significant amount of that energy (42%) was generated by diesel oil in this case. On the same level, a more extensive study including tomato, cucumber, eggplant, and pepper was carried out by Ozkan et al. [19], who examined the energy equivalents of inputs and the outputs of a greenhouse in Antalya. They concluded in their study that among the four examined crops, cucumber had the most energy requirements (37.4 MWh/ha) followed by the other products (35.4 MWh/ha for tomato, 27.4 MWh/ha for eggplant, and 22.3 MWh/ha for pepper).
The same author in another study compared the energy use and production cost of greenhouse versus open-field grape production [21]. They revealed that although production costs were higher in the greenhouse compared with the open-field conditions, the grapes were more profitable in the first case due to premium prices, leading to higher net returns. An economic analysis of a greenhouse cucumber cultivation in Iran was conducted by Mohammadi et al. [20]. In their study, they collected and analyzed data from 43 cucumber production greenhouses and calculated the energy consumption at 41.4 MWh/ha, with diesel fuel being the highest energy input (42%). The economic analysis revealed a total production cost of 33,426 $/ha, with a mean net return of 52,803 $/ha. Among the studies dealing with high-efficiency technologies, Compernolle et al. [11] investigated the economic viability of a cogeneration system for two different products cultivated in Belgian greenhouses, tomato and lettuce, with different annual heat demands of 6388 and 1452 MWhth, respectively. The results indicate that, in both cases, investing in cogeneration for greenhouse applications has positive Net Present Values (NPVs), but to a different extent between the two products. Similarly, Tataraki et al. [12] proved that cogeneration is a cost-effective technology for greenhouses, and concluded that for the case of Greece, the simultaneous use of a heat-driven absorption chiller (combined cooling heat and power (CCHP)) during the summer season increases the operating period of the greenhouse, and enhances both annual productivity and profits. Of the two examined products (tomato and cucumber), it was pointed out that cucumber has a smaller accepted cultivation range than tomato, resulting in a significantly higher thermal demand and, consequently, production cost.
Since cogeneration is technically feasible and has proven to be economically efficient in greenhouse applications in some countries, this paper extends a previous study [12] with the aim of contributing to the current literature and investigating cogeneration’s potential in all European countries. Although greenhouse energy input studies have already been conducted for some countries individually, greenhouse thermal requirements have not previously been analyzed on a European level using actual historical data. Thus, considering the significant differentiations in climatic conditions and energy prices among the EU regions, a comparative analysis of greenhouse energy costs with this technology is of great interest. As an extra contribution to the existing literature of countries other than Greece [12], this paper considers the potential of trigeneration (CCHP) via a heat-driven absorption chiller for cooling.
Given products with an accepted temperature cultivation range of 15–25 °C (20 ± 5 °C), and taking into account actual historical meteorological data (ambient temperature and solar irradiation) and the evolutions of energy prices (electricity and natural gas price) among all European countries for the 2008–2018 time period, this paper includes specific calculations and comparative illustrations of: (a) the annual greenhouse heating and cooling demands per unit area (kWh/m2); (b) the required numbers of heating days, cooling days, and days without energy requirements; (c) the heating and cooling costs per MWh produced with the use of a CCHP system (€/MWh); (d) the heating and cooling costs per greenhouse unit area (€/m2) with the use of a CCHP system.
The paper is structured as follows: Section 2 gives an overview of the basic climatic characteristics and average electricity and natural gas prices of specific European countries during the 2008–2018 time period. In Section 3, the proposed thermal and economic models for calculating the energy requirements and costs of operating a greenhouse are given. Section 4 contains the results of the analysis, while Section 5 summarizes the main conclusions of the research study.

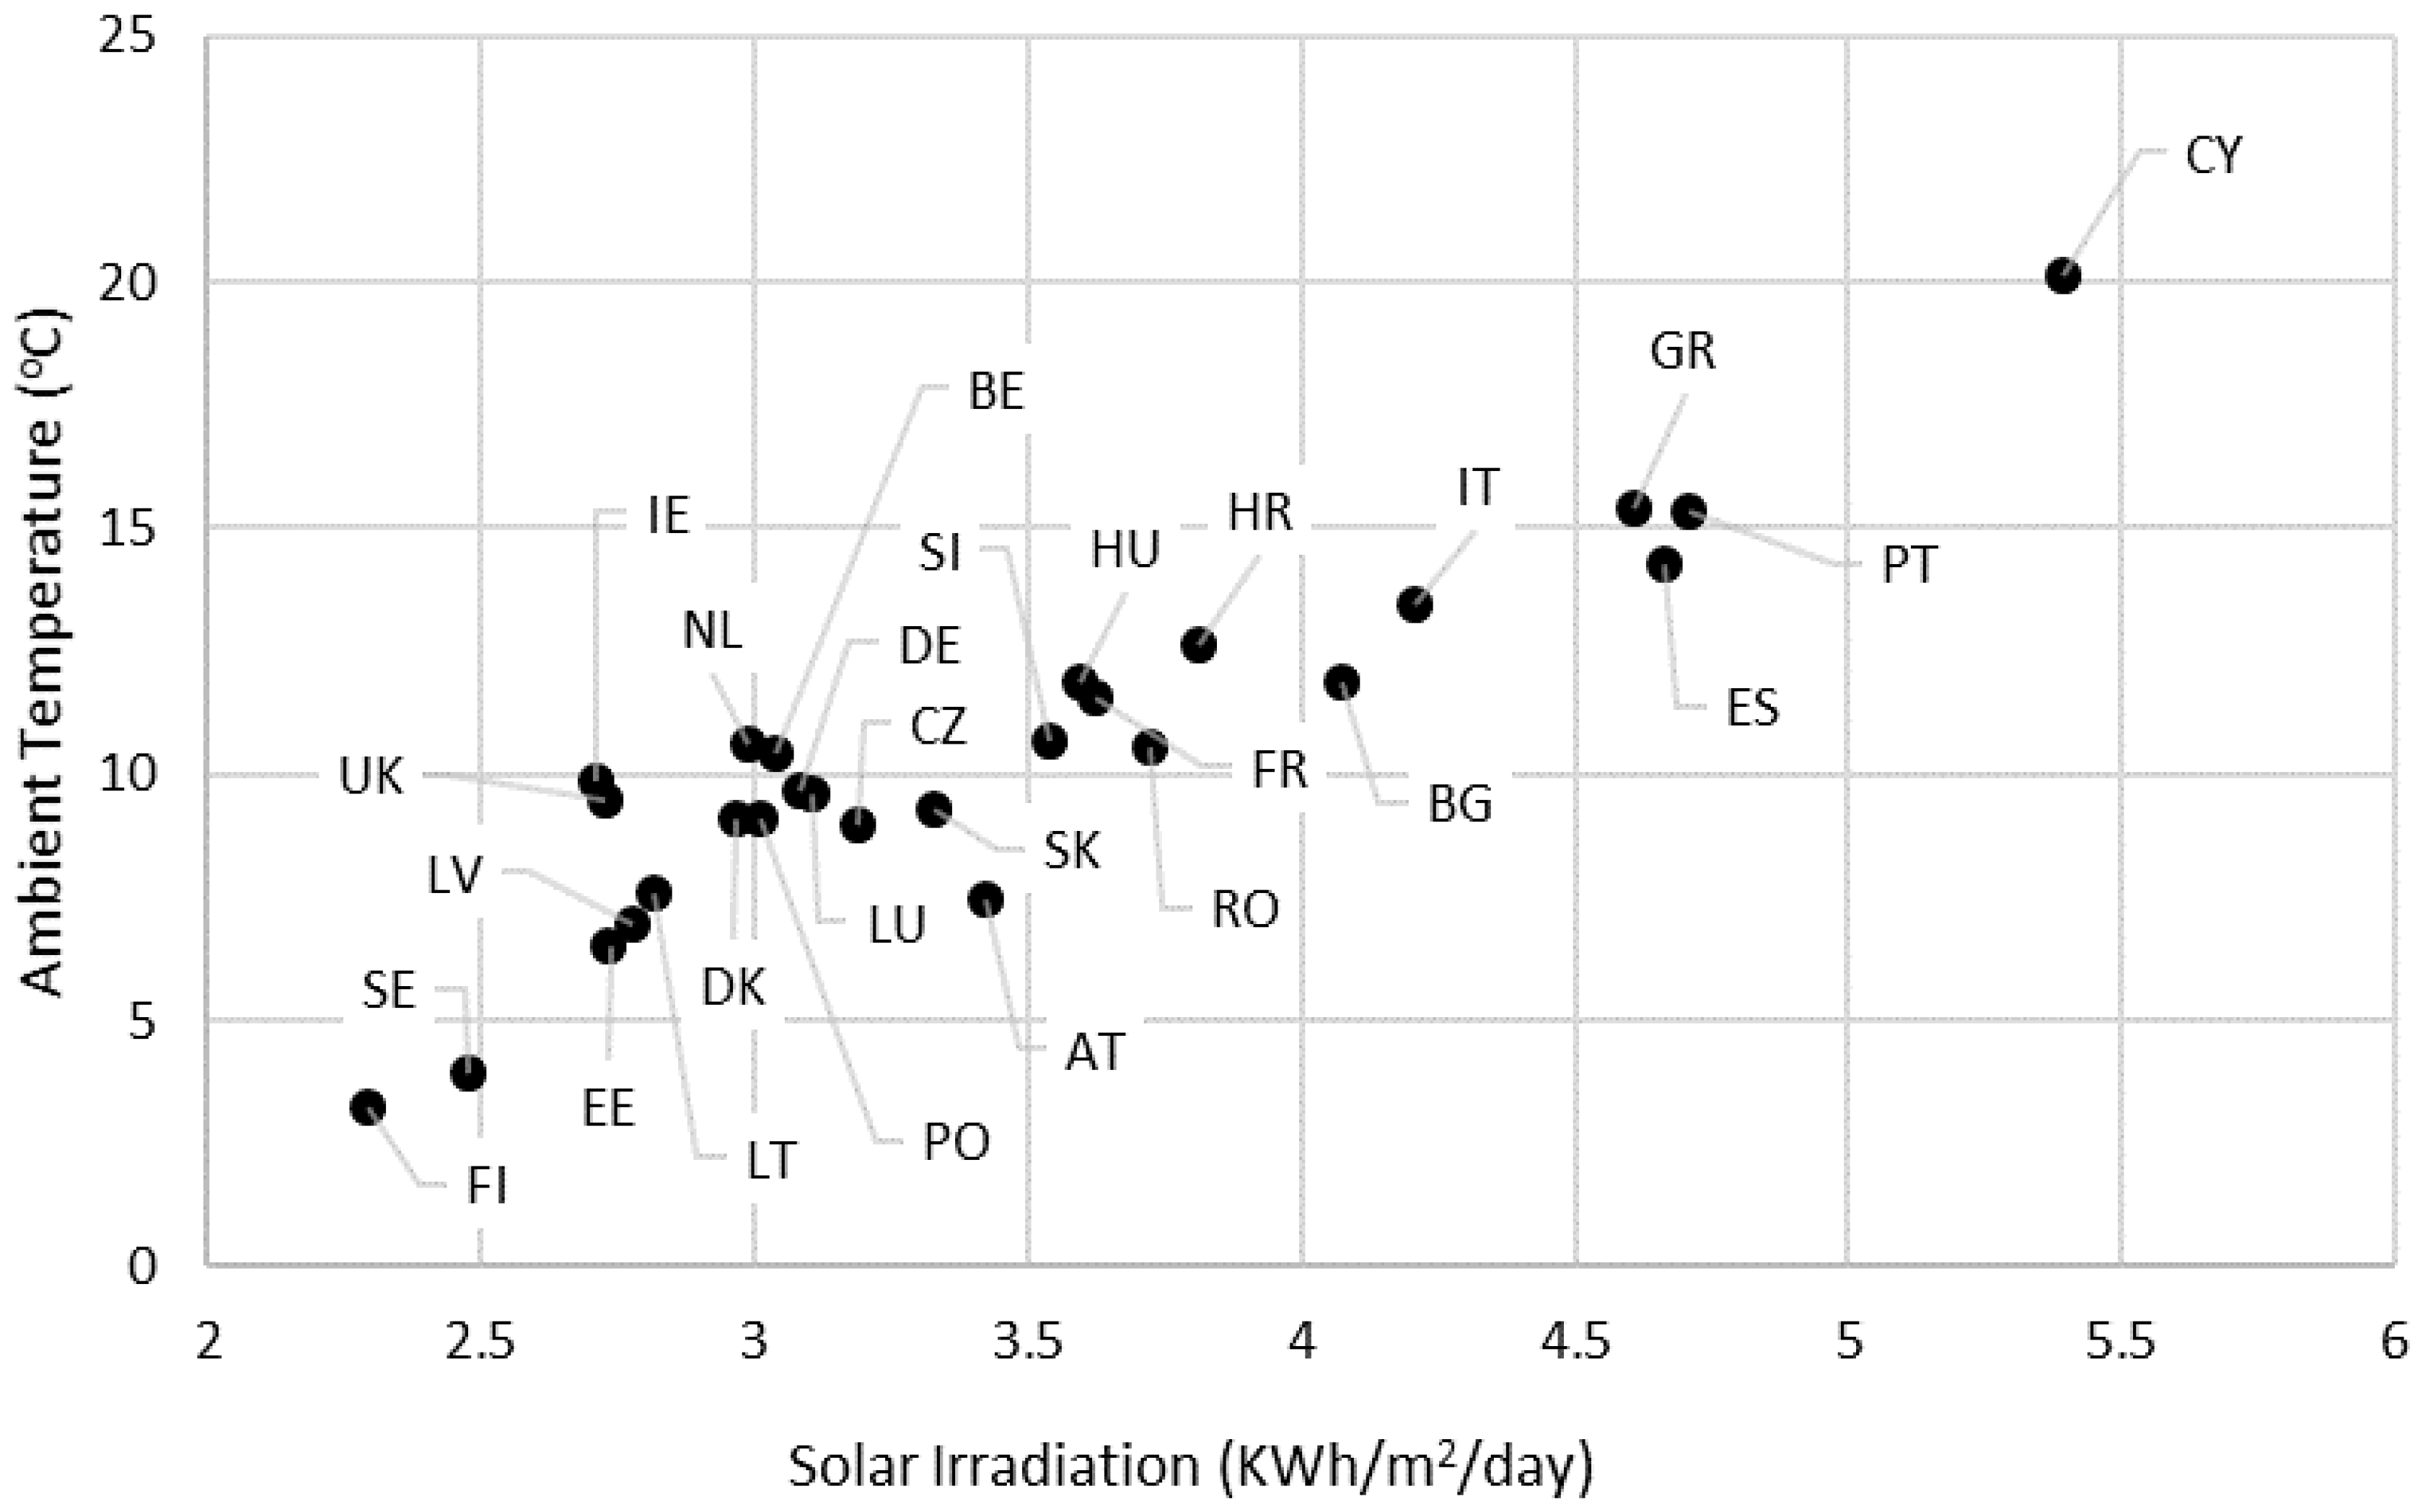
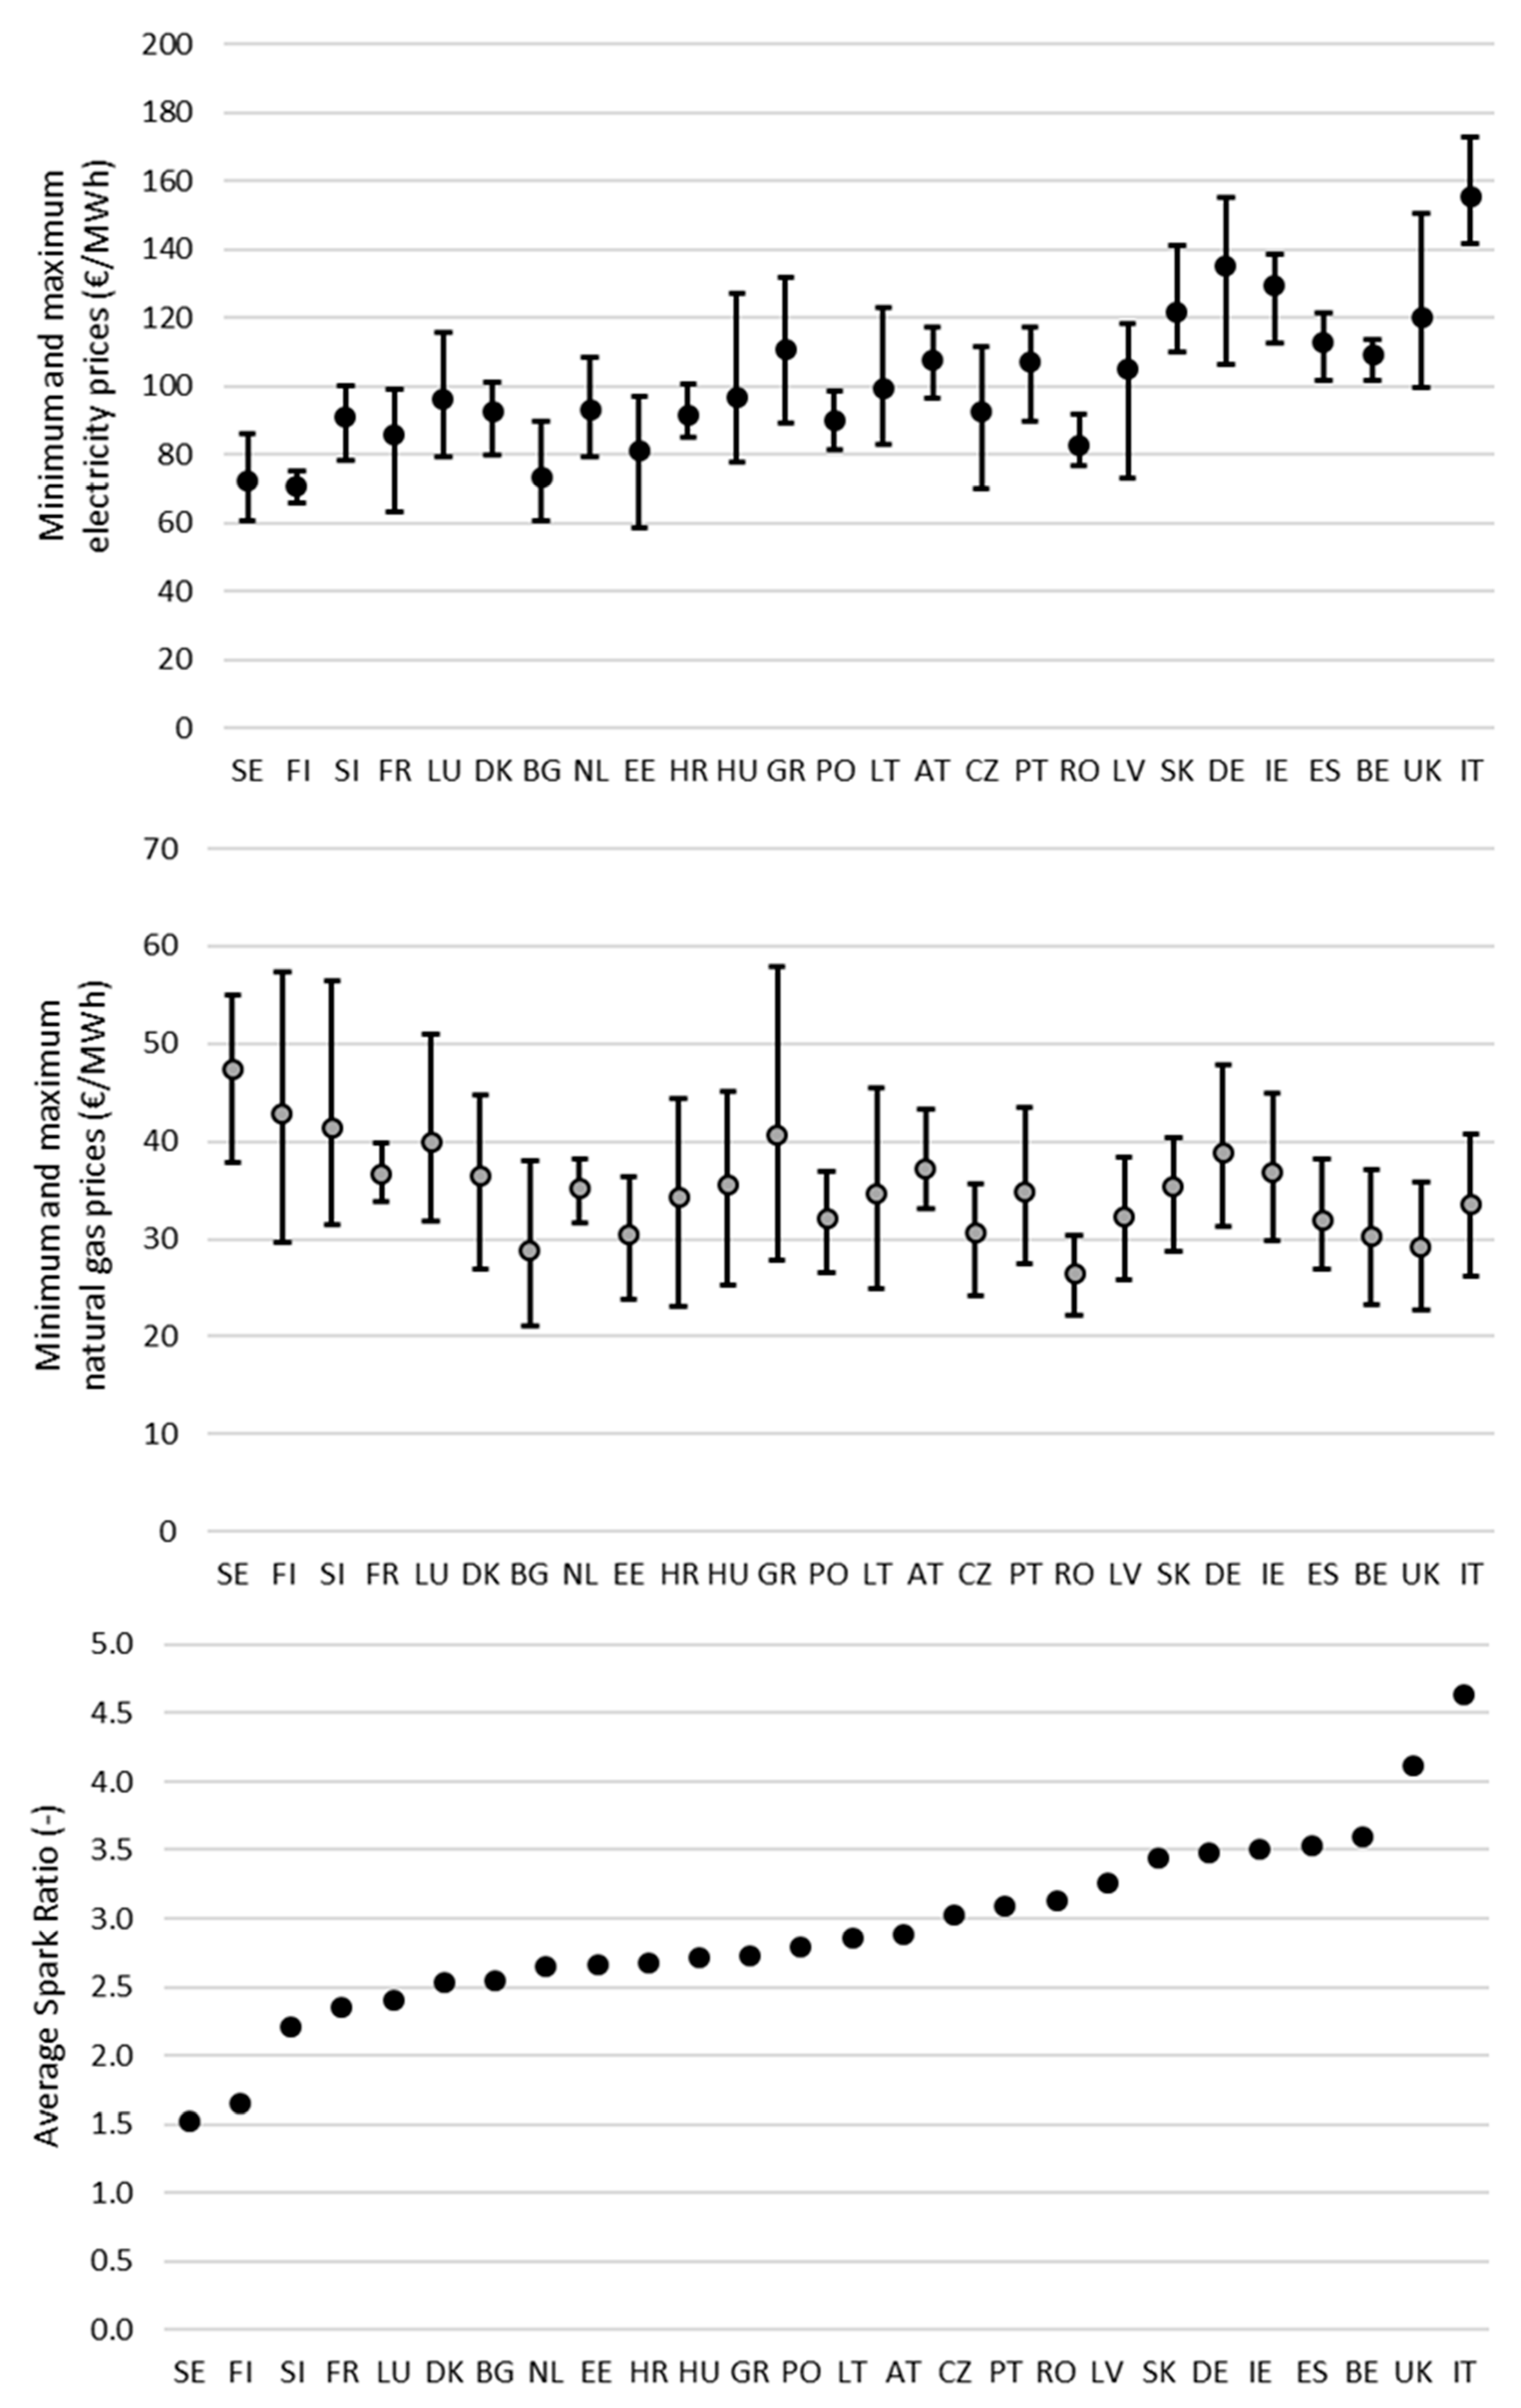
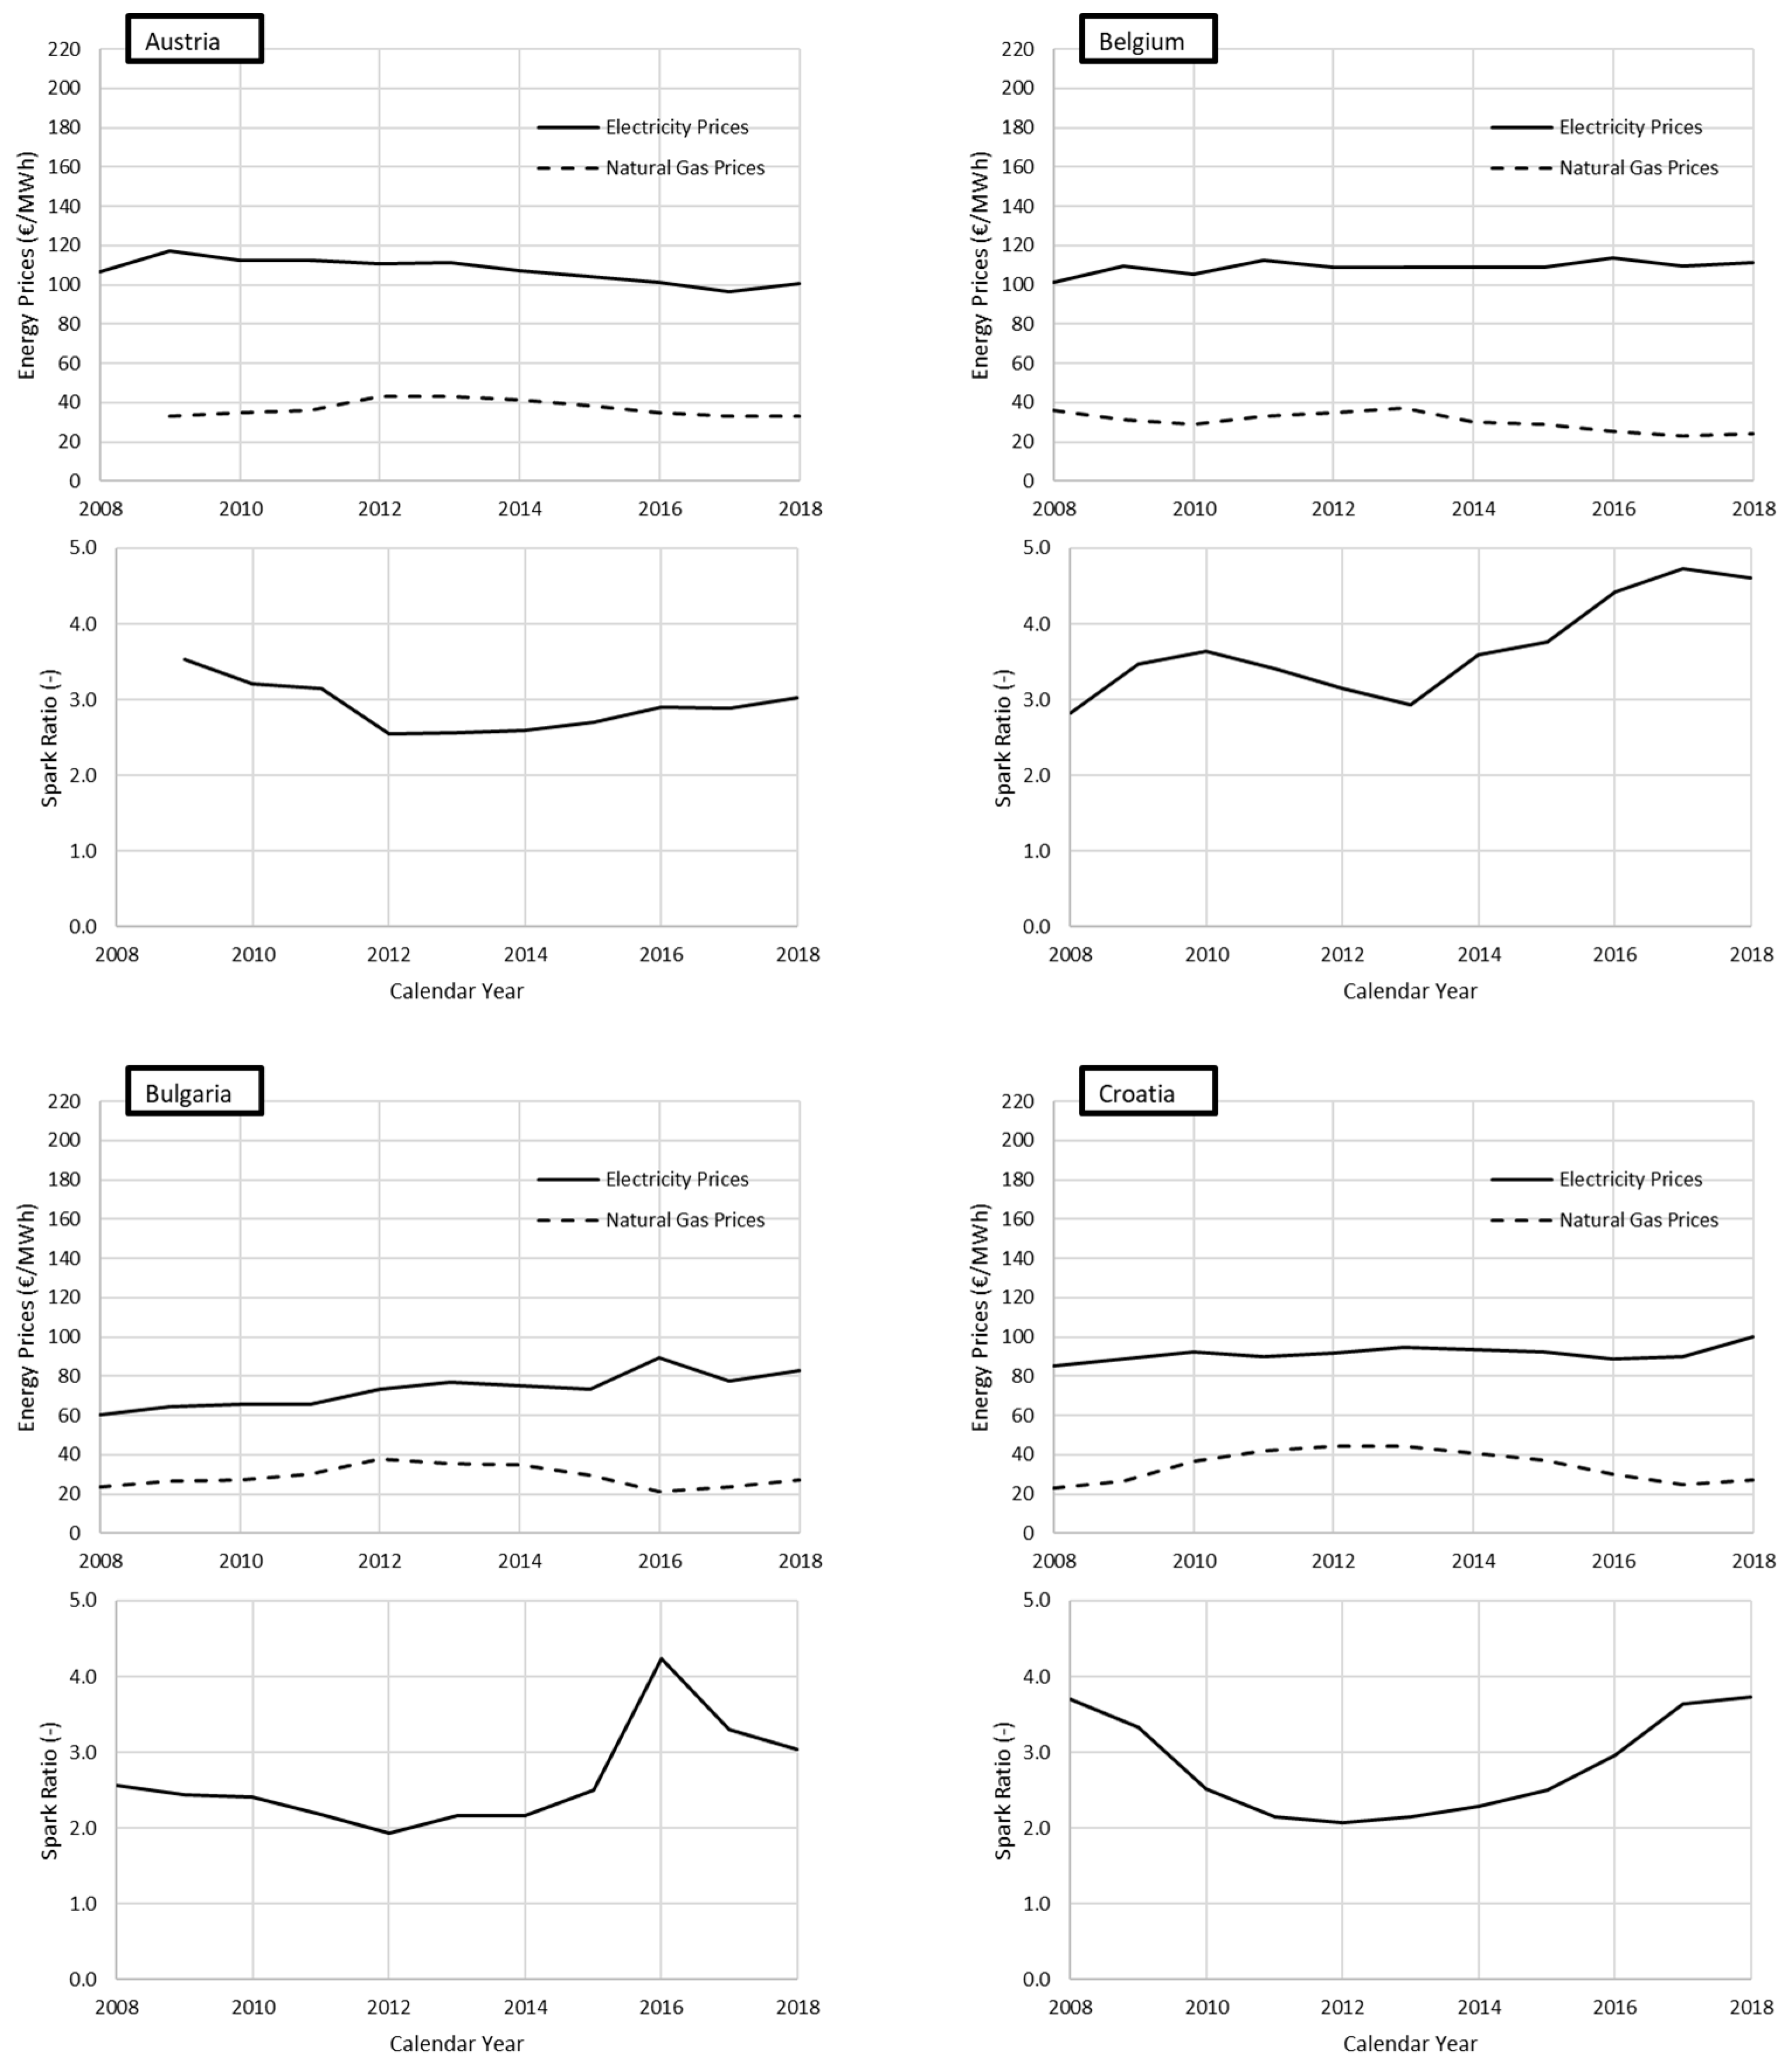
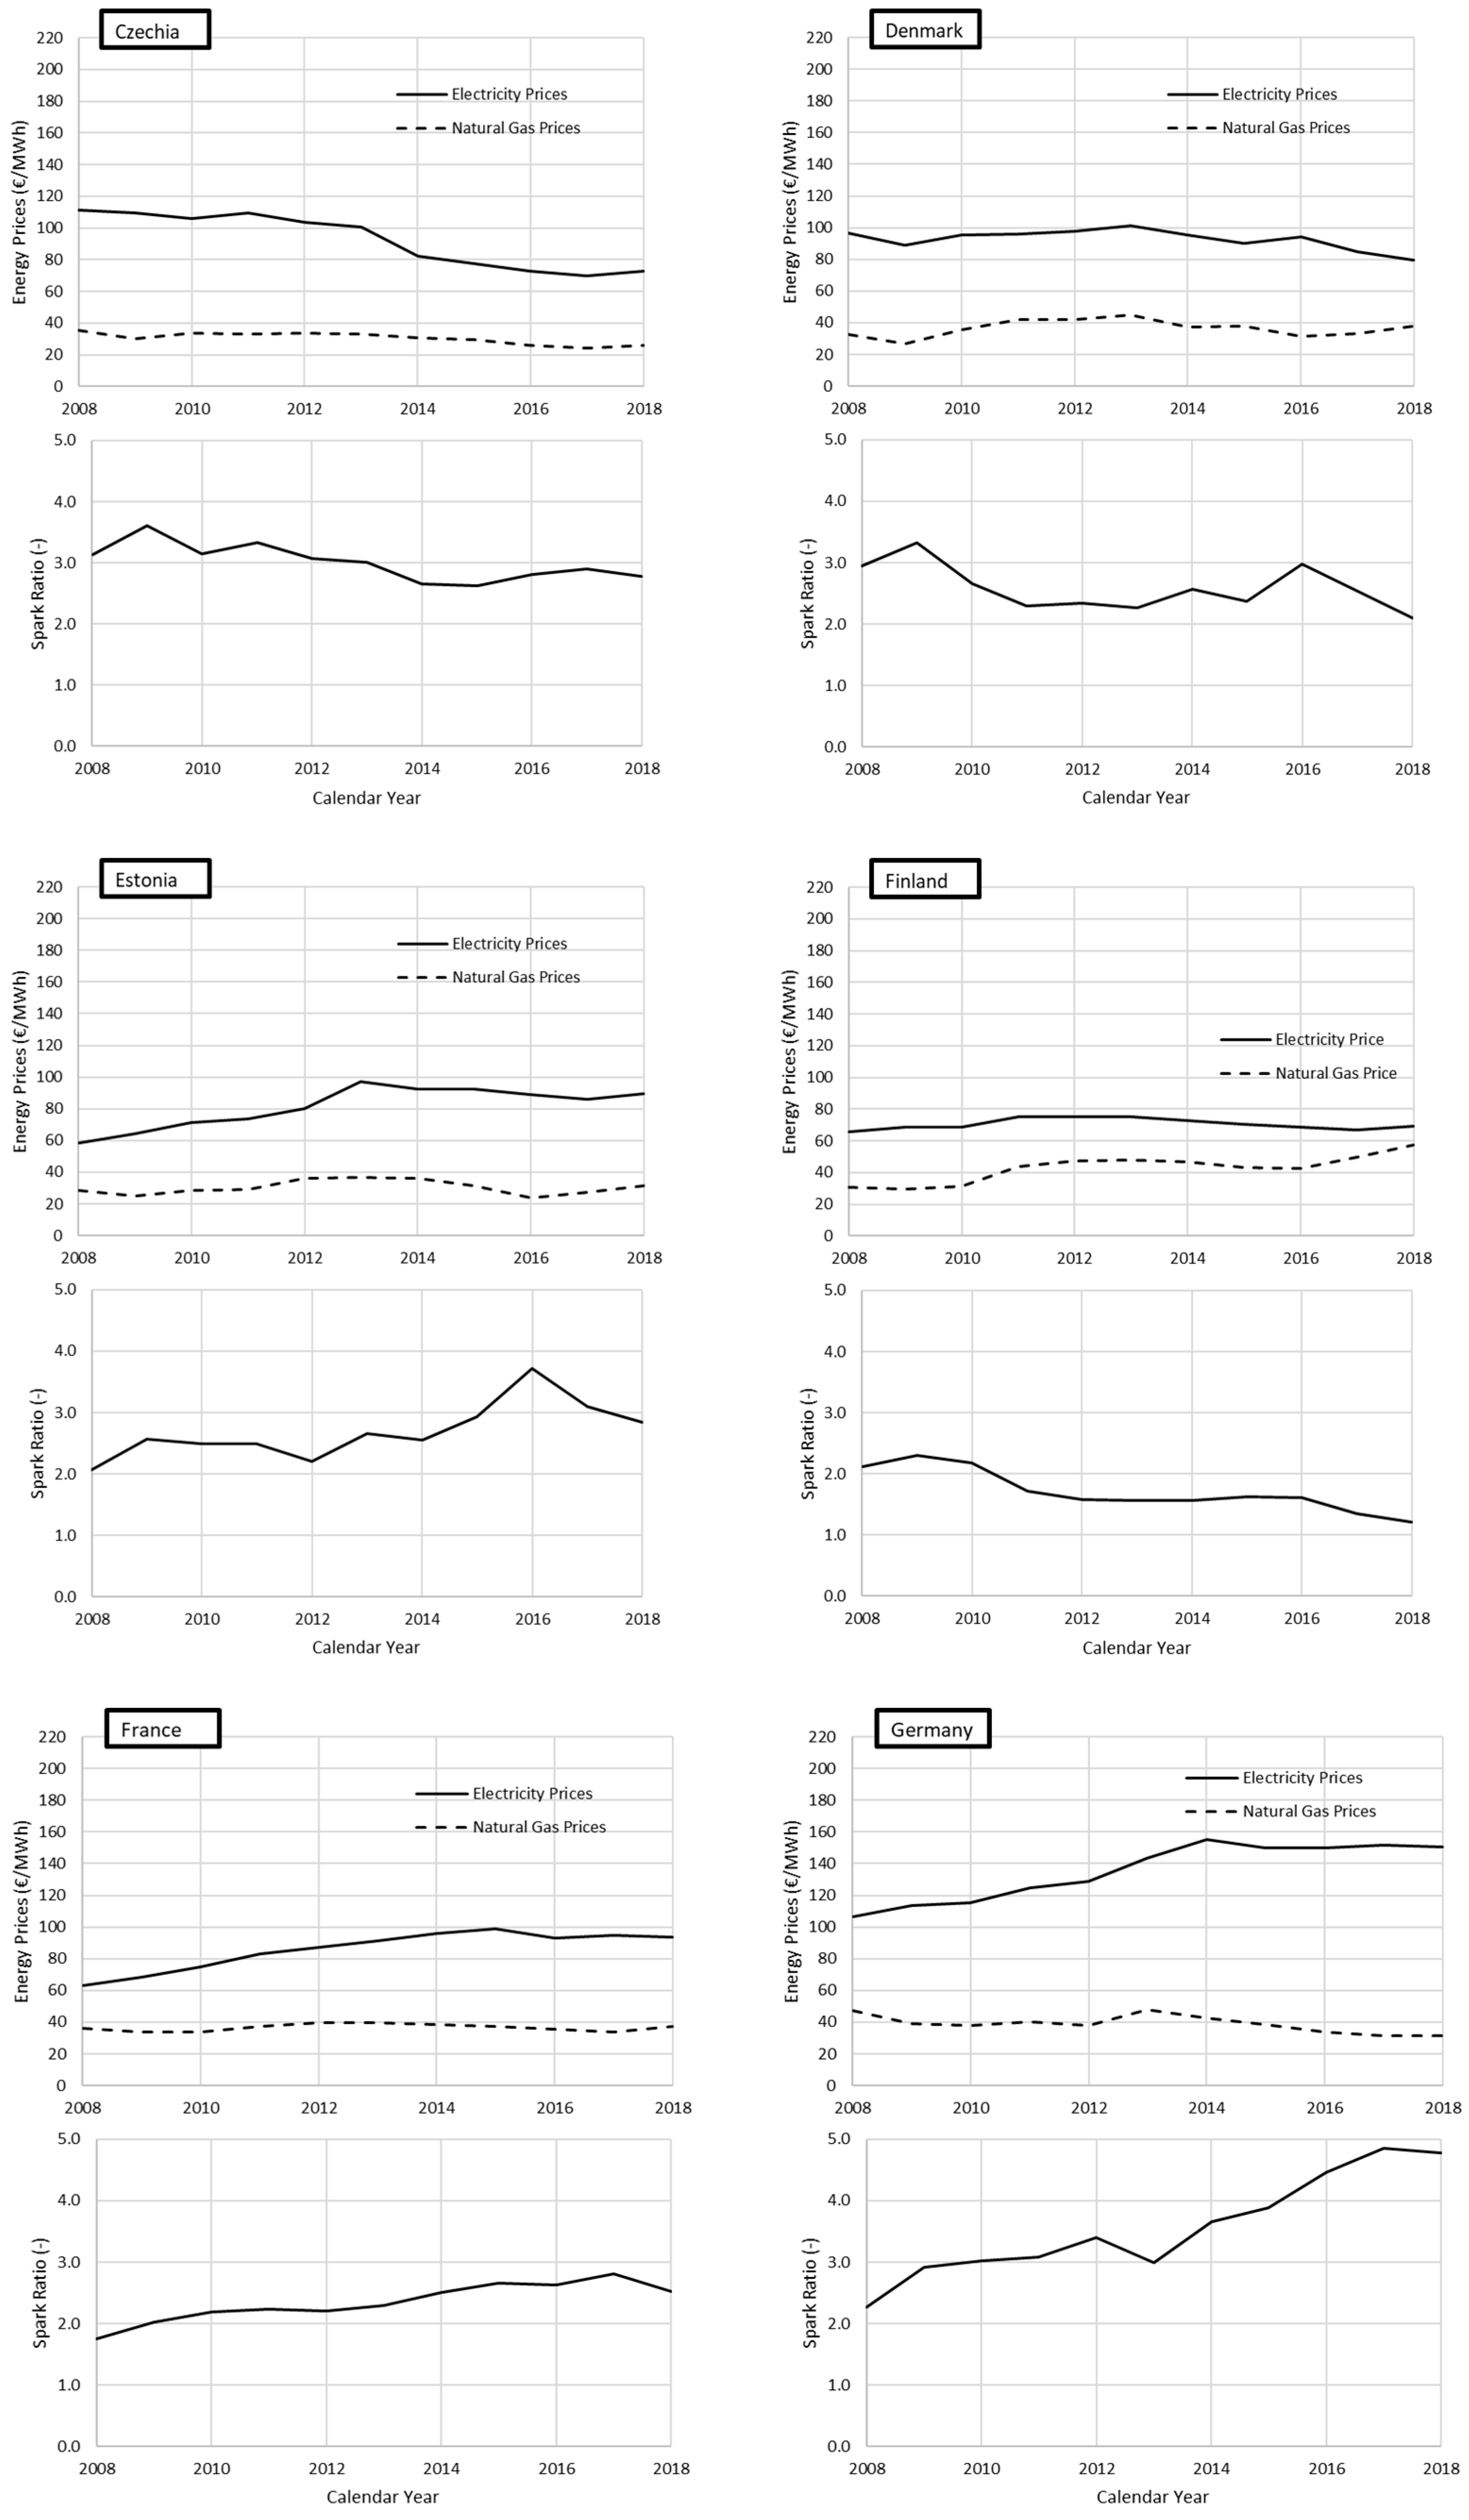
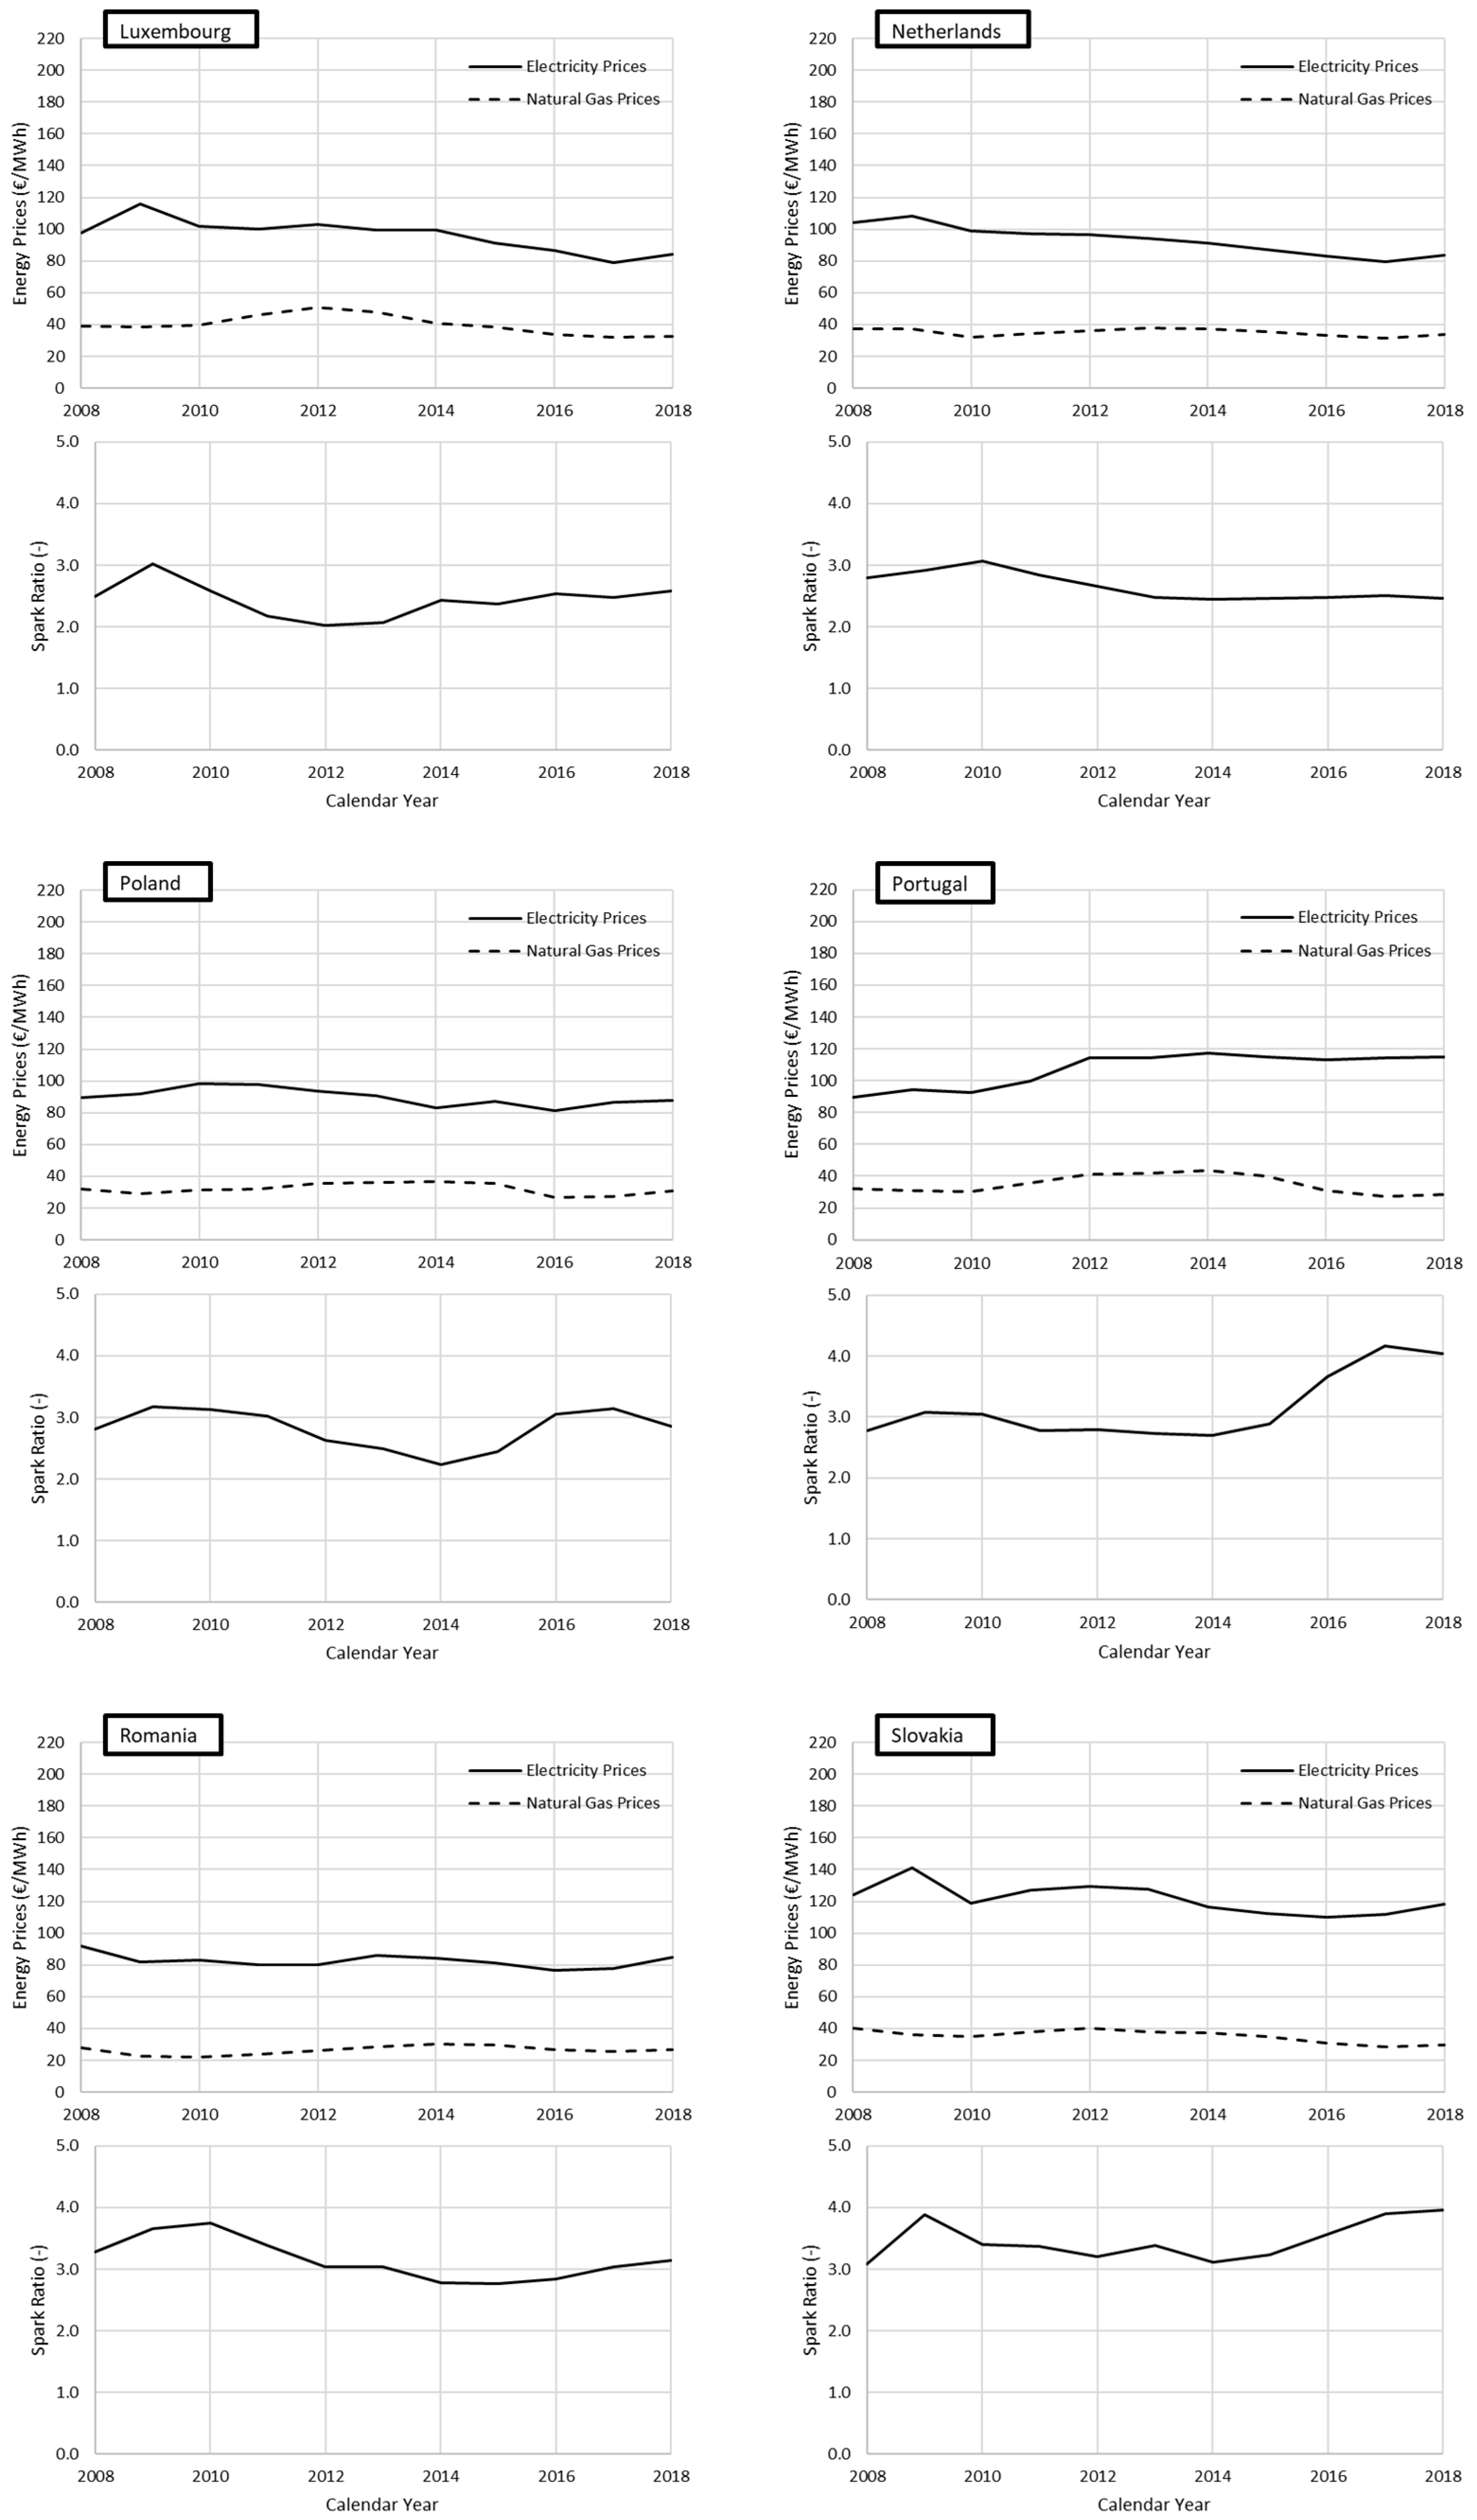
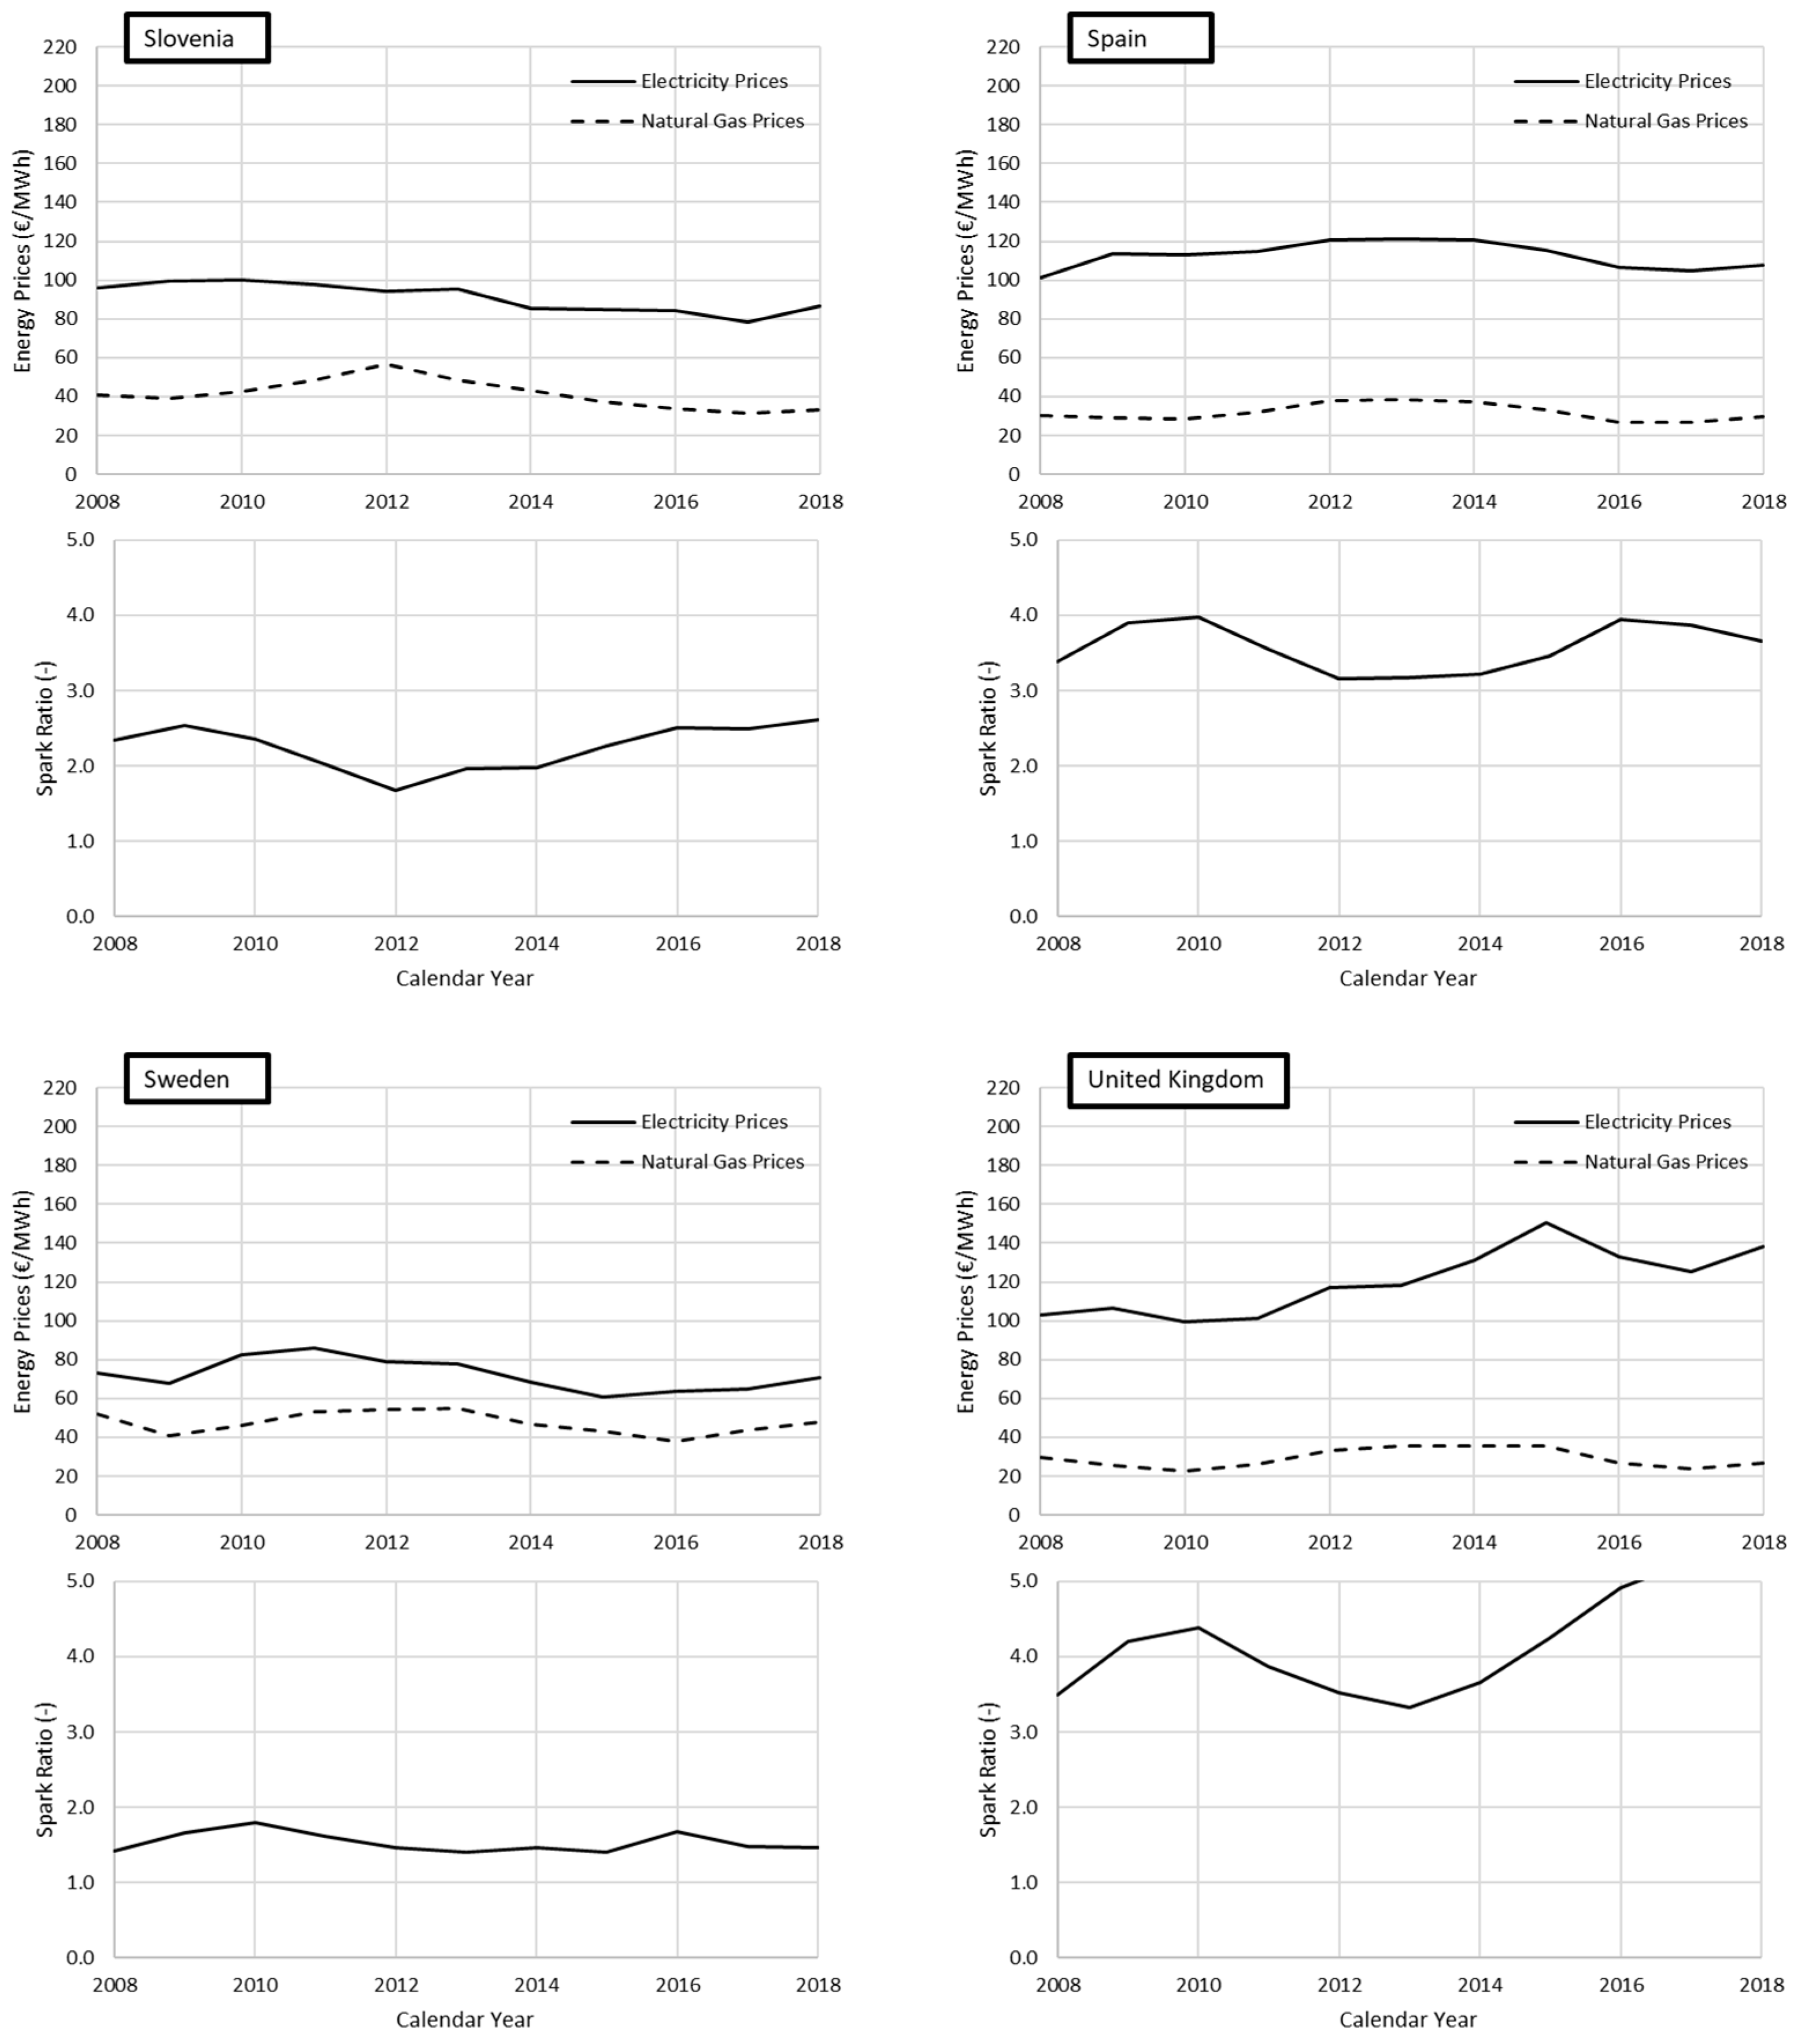
2. European Countries: Basic Climatic and Energy Cost Characteristics
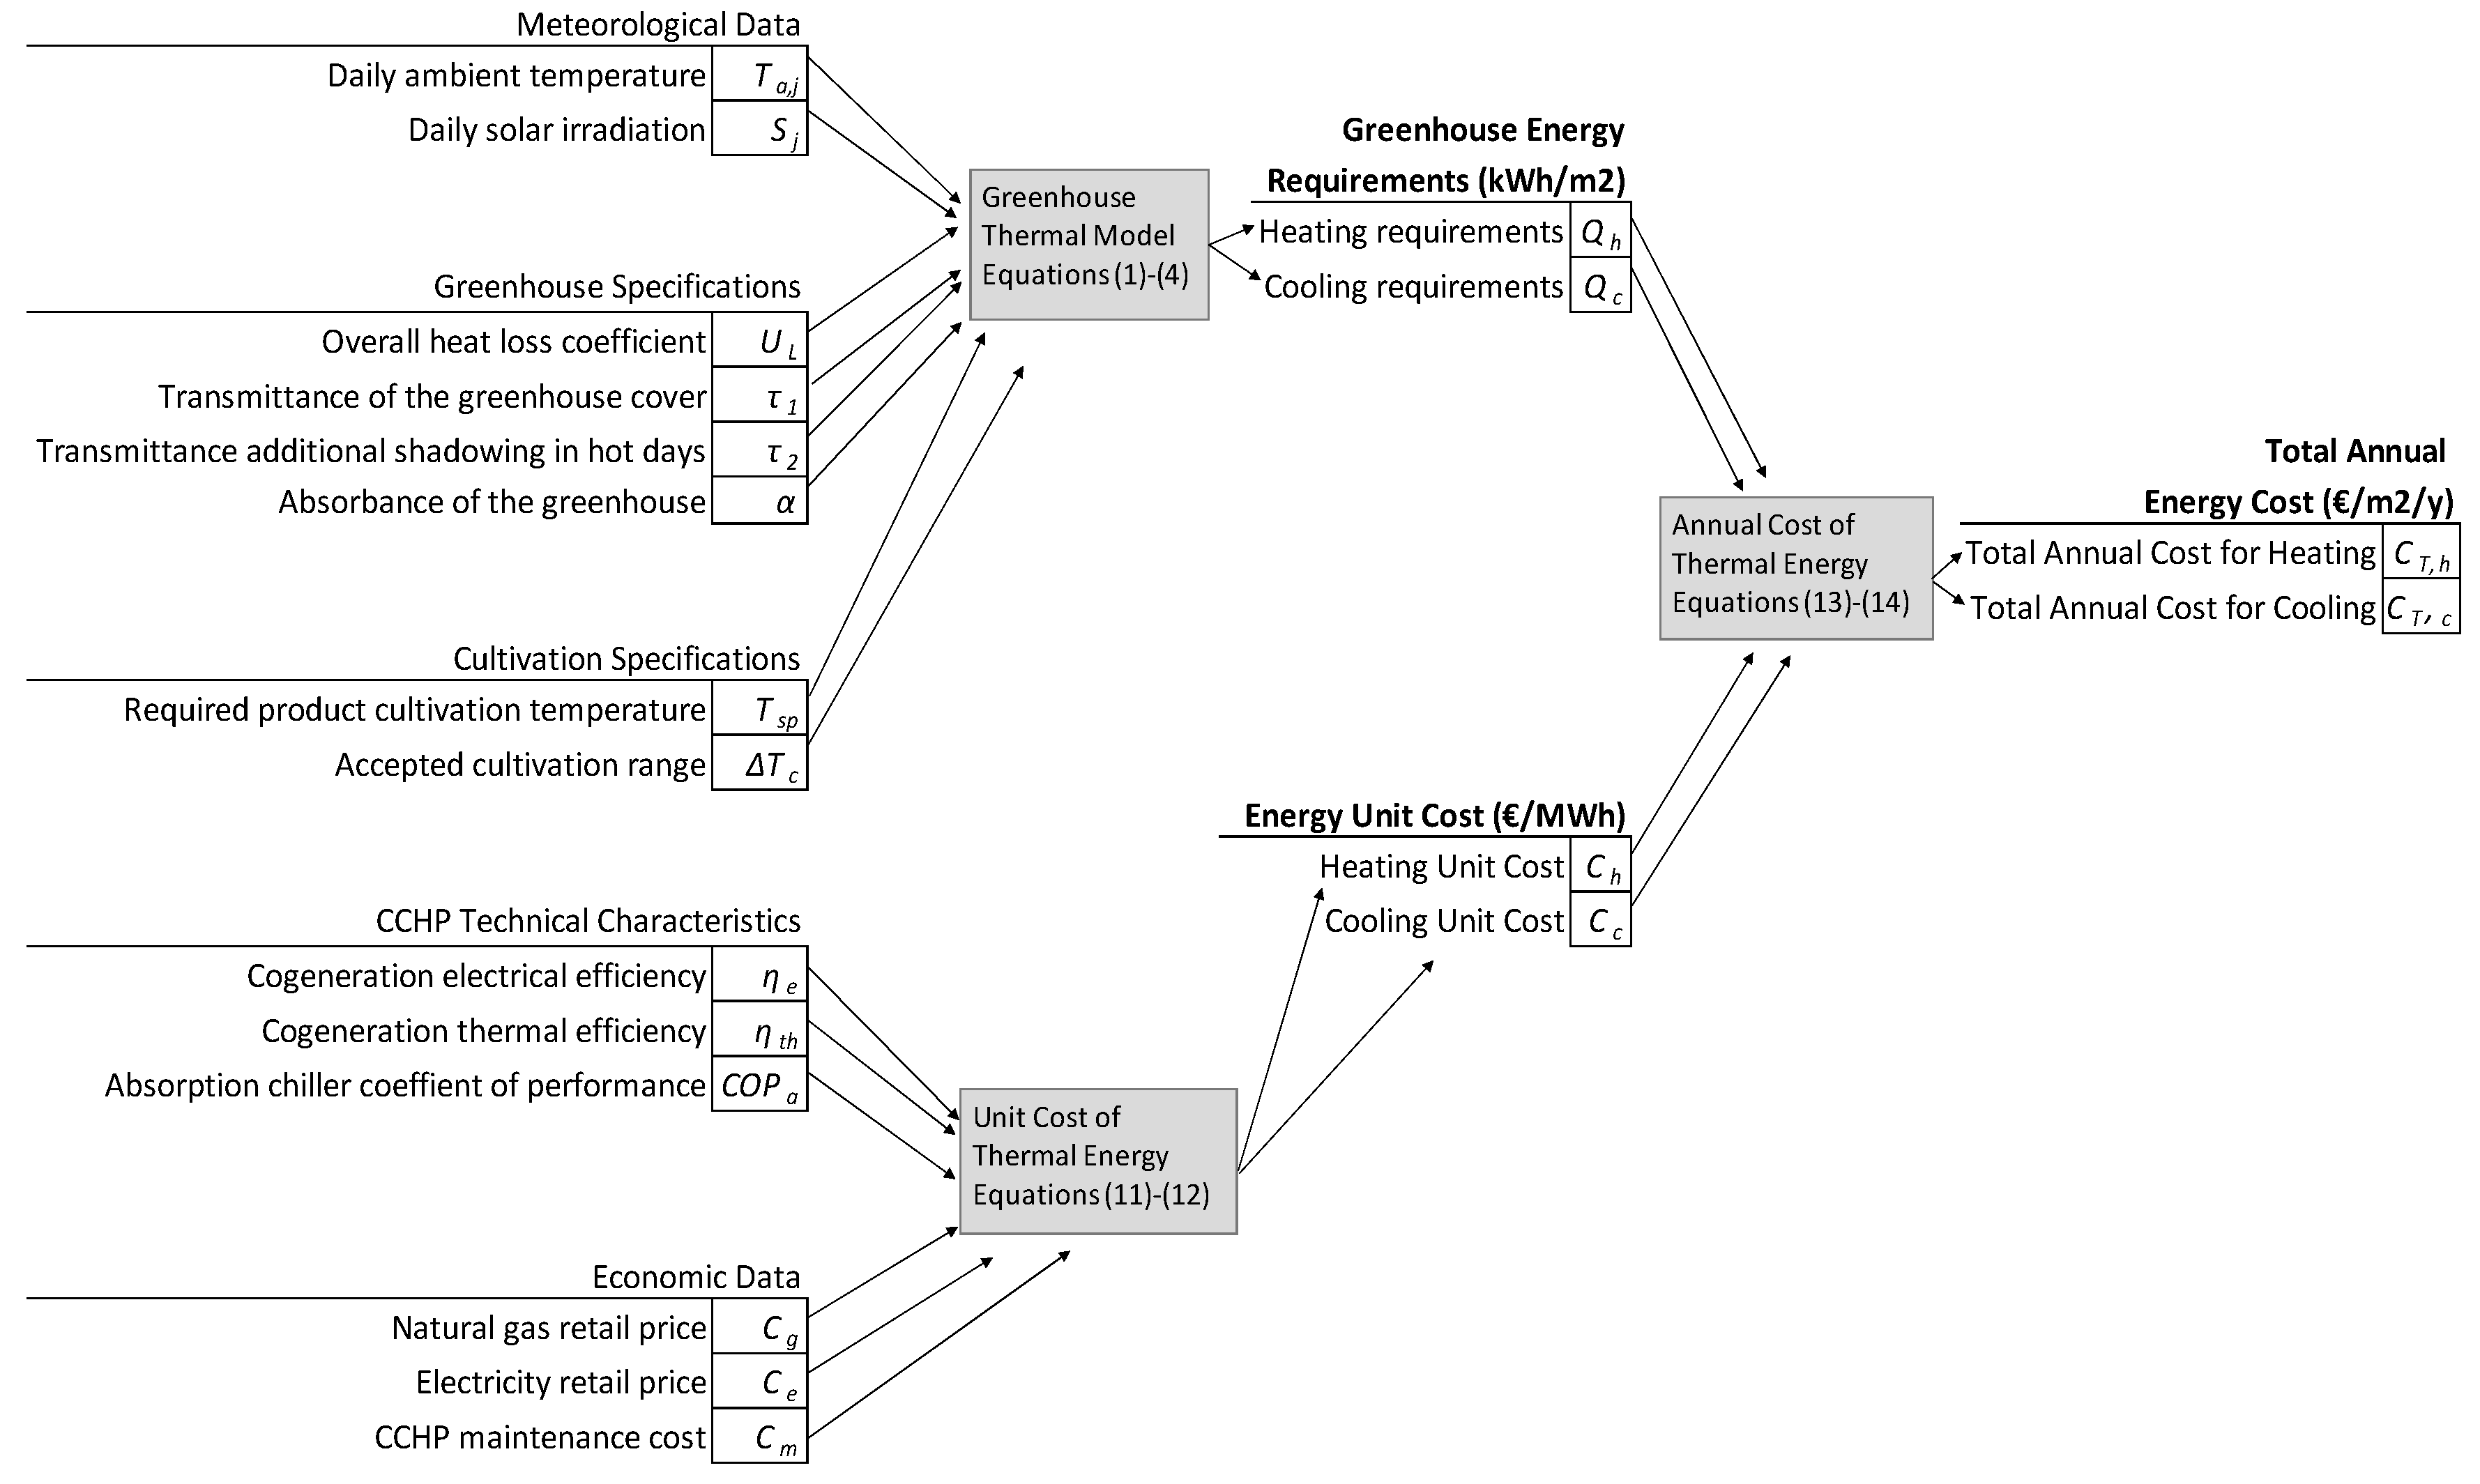
This section presents the meteorological characteristics of European countries along with the evolution of energy prices (electricity and natural gas) during the 2008–2018 time period. Figure 1 depicts the correlation of ambient temperature and solar irradiation for each country. For both meteorological characteristics, average annual values for the years 2008–2018 were calculated from the daily records of climate reanalysis data (derived from Copernicus Climate Change Service ERA5 reanalysis) aggregated for each country [22], with the overall averages shown in Figure 1.
As expected, the left low area of the points refers to North European countries, with Finland and Sweden having the lowest values of ambient temperature and solar irradiation at about 3.5 °C and 2.4 kWh/m2/day, respectively. On the other hand, the climatic conditions in South Europe are significantly hotter, which led to higher values of their relative meteorological characteristics; Cyprus is the warmest region in Europe by far, with a mean ambient temperature of 20 °C and solar irradiation of 5.4 kWh/m2/day.
In the following graphs (Figure 2), the average electricity and natural gas prices, as well as the maximum and minimum obtained values during the same period, are illustrated (all retrieved from Eurostat [23,24]). Additionally, the well-known “spark ratio” is presented, a very crucial decision-making indicator for cogeneration investment and operation. This is defined as the electricity-to-natural gas price ratio, the threshold above which cogeneration is considered feasible according to a rule of thumb. The value of this ratio is 3 [25].
As can be seen from the graphs, there are 10 EU countries that surpass the “threshold” of 3, with the highest being Italy (IT) and the United Kingdom (UK), where the spark ratio exceeds a value of 4. Italy (IT) is the European country with the largest average electricity price (155 €/MWh). On the other hand, Sweden (SE) and Finland (FI) have very low ratios, close to 1.5, causing them to be classified as “less attractive” cases for cogeneration. These are followed by France (FR), Slovenia (SI), and Luxembourg (LU), which fluctuate between 2 and 2.5.

3. Greenhouse Model

In this section, the mathematical model is presented for the determination of: (a) the required thermal energy required per unit cultivation area (m2) for the operation of any given greenhouse; and (b) its energy costs using a CCHP system.
An information flow diagram of the proposed mathematical model is presented in Figure 3, which considers the cultivation of products with similar cultivation specifications. The greenhouse thermal model estimates the annual heating and cooling requirements ( Q h , Q c ) of the facility per unit area (kWh/m2) based on the meteorological data of each country (ambient temperature, solar irradiation), the greenhouse heat transfer characteristics, and the product cultivation requirements. The unit cost of thermal energy ( C h , C c ) is estimated given the CCHP technical efficiencies and energy prices of each country. Finally, the total annual cost of energy per unit area ( C T , h , C T , c ) with the use of cogeneration (€/m2/y) is determined from the energy requirements ( Q h , Q c ) and energy unit cost ( C h , C c ).
As far as the operation of the CCHP system is concerned, it is assumed that it follows the thermal requirements and partially covers the heating and cooling loads. Considering the small electricity consumption of greenhouses compared to other applications, it is assumed that the electricity generated is sold to the grid at the corresponding retail prices of each European country without any additional subsidy. In general, the range of electricity selling prices from cogeneration varies. According to the target model, one can sell: (a) either at the wholesale price (system marginal price), (b) close to the retail price (in the case of bilateral contracts), or (c) at the feed-in premium (FIP) (subsidy). In this paper, the intermediate case is selected, to make a fairer comparison among European countries. The produced heat was used either for the greenhouse’s heating requirements or cooling (when needed) through a heat-driven absorption chiller. An internal combustion engine (ICE) was selected as the prime mover, which is typical for such applications and has a small efficiency drop for load factors above 35%.

3.1. Greenhouse Thermal Load Model

In contrast with other applications (e.g., buildings or industries), analysis of the greenhouse thermal demand requires the simultaneous consideration of three different sets of parameters:
(1)
meteorological conditions (ambient air temperature, solar irradiation);
(2)
product cultivation species; and
(3)
greenhouse design parameters (structure, size, etc.).
Tataraki et al. [12] proposed the following equations to describe the greenhouse thermal load based on similar studies [26,27,28].
Q h , j = m a x [ U L ( ( T s p Δ T c ) T a , j ) τ 1 α S j , 0 ]  
Q c , j = m a x [ U L ( T a , j ( T s p + Δ T c ) ) + τ 2 τ 1 α S j , 0 ]
where,
  • Q h , j (kWh/m2/d) is the greenhouse daily heating load during day j;
  • Q c , j (kWh/m2/d) is the greenhouse daily cooling load during day j;
  • j (-) is the number of the day of the year ( j = 1 ,   2 ,   365 ) ;
  • U L (kW/m2K) is the greenhouse effective overall heat loss coefficient;
  • T s p (°C) is the set point greenhouse temperature (the required product cultivation temperature);
  • Δ T c (°C) is the accepted temperature difference from set point temperature (cultivation range);
  • T a , j (°C) is the daily ambient temperature during day j;
  • S j (kWh/m2/d) is the daily average solar irradiation on a horizontal surface during day j;
  • τ 1 (-) is the transmittance of the greenhouse cover;
  • τ 2 (-) is the transmittance of the additional shadowing cover during hot days; and
  • α (-) is the absorbance of the greenhouse.
It must be noted that a greenhouse’s effective overall heat loss coefficient ( U L ) is defined per m2 of the cultivation area, and thus the daily heating and cooling load refer to this area, too.
According to the above, the annual heating ( Q h ) and cooling ( Q c ) demands of a greenhouse per unit area are given using Equations (3) and (4), respectively.
Q h = j Q h , j
Q c = j Q c , j

3.2. Cost of Thermal Energy with Cogeneration

The cost of thermal energy and cogenerated electricity is usually derived by a cost allocation of the fuel combusted. In order to estimate the unitary cost of heating and cooling, the proportional (calorific) method is applied, through which the total cost is allocated proportionally to the production of the individual energy products. This method is suitable for internal combustion engines where the quality of heat recovered is low and uniform (i.e., there are no other heat products such as medium-pressure steam). Since gas and electricity have an operating market in place that defines their prices, these prices are eventually used to define the price of cogenerated heating and cooling. Maintenance costs, usually estimated as a function of generated electricity, are also subtracted. This method is formulated in Equation (5) for the heating season and Equation (6) for the cooling season. When a cogeneration system is used to cover the greenhouse heating requirements, it consumes natural gas ( G h ) and produces useful heat ( Q h ) and electricity ( E h ) , taking into account the maintenance cost ( C m ) per MWh of electricity production (Equation (5)). Similarly, during the cooling season, the CCHP system consumes natural gas ( G c ) , and produces useful cooling through a heat-driven absorption chiller ( Q c ) and electricity ( E c ) (Equation (6)). Generated electricity is sold to the grid at retail prices without any additional subsidy.
G h C g = Q h C h + E h ( C e C m )  
G c C g = Q c C c + E c ( C e C m )  
where,
  • G h (MWh(gas)) is the annual natural gas consumption by the cogeneration system to cover the required greenhouse heating load ( Q h ) ;
  • G c (MWh(gas)) is the annual natural gas consumption by the cogeneration system to cover the required greenhouse cooling load ( Q c ) ;
  • E h (MWh(el)) is the electricity produced by the cogeneration during heating season;
  • E c (MWh(el)) is the electricity produced by the cogeneration during cooling season;
  • C g (€/MWh(gas)) is the natural gas retail price;
  • C h (€/MWh(th)) is the cost of the useful heating produced by the CCHP system (unit cost for heating);
  • C e (€/MWh(el)) is the electricity retail price;
  • C m (€/MWh(el)) is the cogeneration maintenance cost relative to the electricity produced; and
  • C c (€/MWh(co)) is the cost of the useful cooling produced by the CCHP system (unit cost for cooling).
The produced thermal energy and electricity can be expressed according to the following efficiency definitions (Equations (7)–(10)).
Q h = G h   η t h
E h = G h   η e
Q c = G h   η t h C O P a  
E c = G c   η e
where,
  • η t h (-) is the CCHP thermal efficiency;
  • η e (-) is the CCHP electrical efficiency; and
  • C O P a   (-) is the coefficient of performance of the heat driven absorption chiller.
By substituting the relevant terms of Equations (7)–(10) into Equations (5) and (6), the unit cost for heating and cooling ( C h ,   C c ) can be calculated based only on technical efficiencies and energy prices by means of Equations (11) and (12).
C h = C g η e ( C e C m ) η t h
C c = C g η e ( C e C m ) η t h C O P a
More specifically, C h and C c are defined as the unitary costs of useful heating and cooling energy produced by the CCHP system, respectively. These costs depend on the natural gas retail price ( C g ) , which is an expense (cost of fuel), and the electricity retail price   ( C e ) , which is income. The CCHP maintenance cost ( C m ) is also considered. These costs, along with the annual thermal requirements of the facility ( Q h ,   Q c ), are defined by Equations (3) and (4), and determine the overall annual greenhouse energy costs ( C T , h ,   C T , c ) (Equations (13) and (14)).
C T , h = Q h C h
C T , c = Q c C c
The presented model requires 13 parameters for the estimation of the greenhouse energy cost with the use of a CCHP system: two meteorological characteristics ( T a , j , S j ) , four greenhouse characteristics ( U L ,   τ 1 ,   τ 2 ,   α ), two product cultivation characteristics ( T s p ,   Δ T c ), three equipment technical characteristics ( η e ,   η t h ,   C O P a ), and two energy cost parameters ( C e , C g ).
The meteorological data are defined according to the climatic conditions of the examined use-cases, and the energy costs are country-specific. For the rest of the parameters, typical values were used according to Table 1. The overall heat loss coefficient ( U L ) value was based on Food and Agriculture Organization (FAO) suggestions [29], while the transmittance coefficient ( τ 1 ) and the absorbance ( α ) were retrieved from studies of Kittas et al. [28] and Marsh et al. [5]. τ 2 expresses the additional shadowing during hot days, and is based on [12], which assumes that this value is equal to 1/5 of τ 1 . In this paper, a required product cultivation temperature of 20 °C was selected, with an accepted range of ±5 °C. Indicative products that belong to this range are tomato, pea, brussels sprout, and broccoli [30]. Finally, representative nominal efficiencies of a CCHP system for internal combustion engines [31] and gas-driven absorption chillers [32] were used, while the value of the CCHP maintenance cost was based on reports from the US Energy Information Administration [33] and Austrian Institute of Technology (AIT) GmbH with ILF Consulting Engineers Austria GmbH [34].

4. Results and Discussion

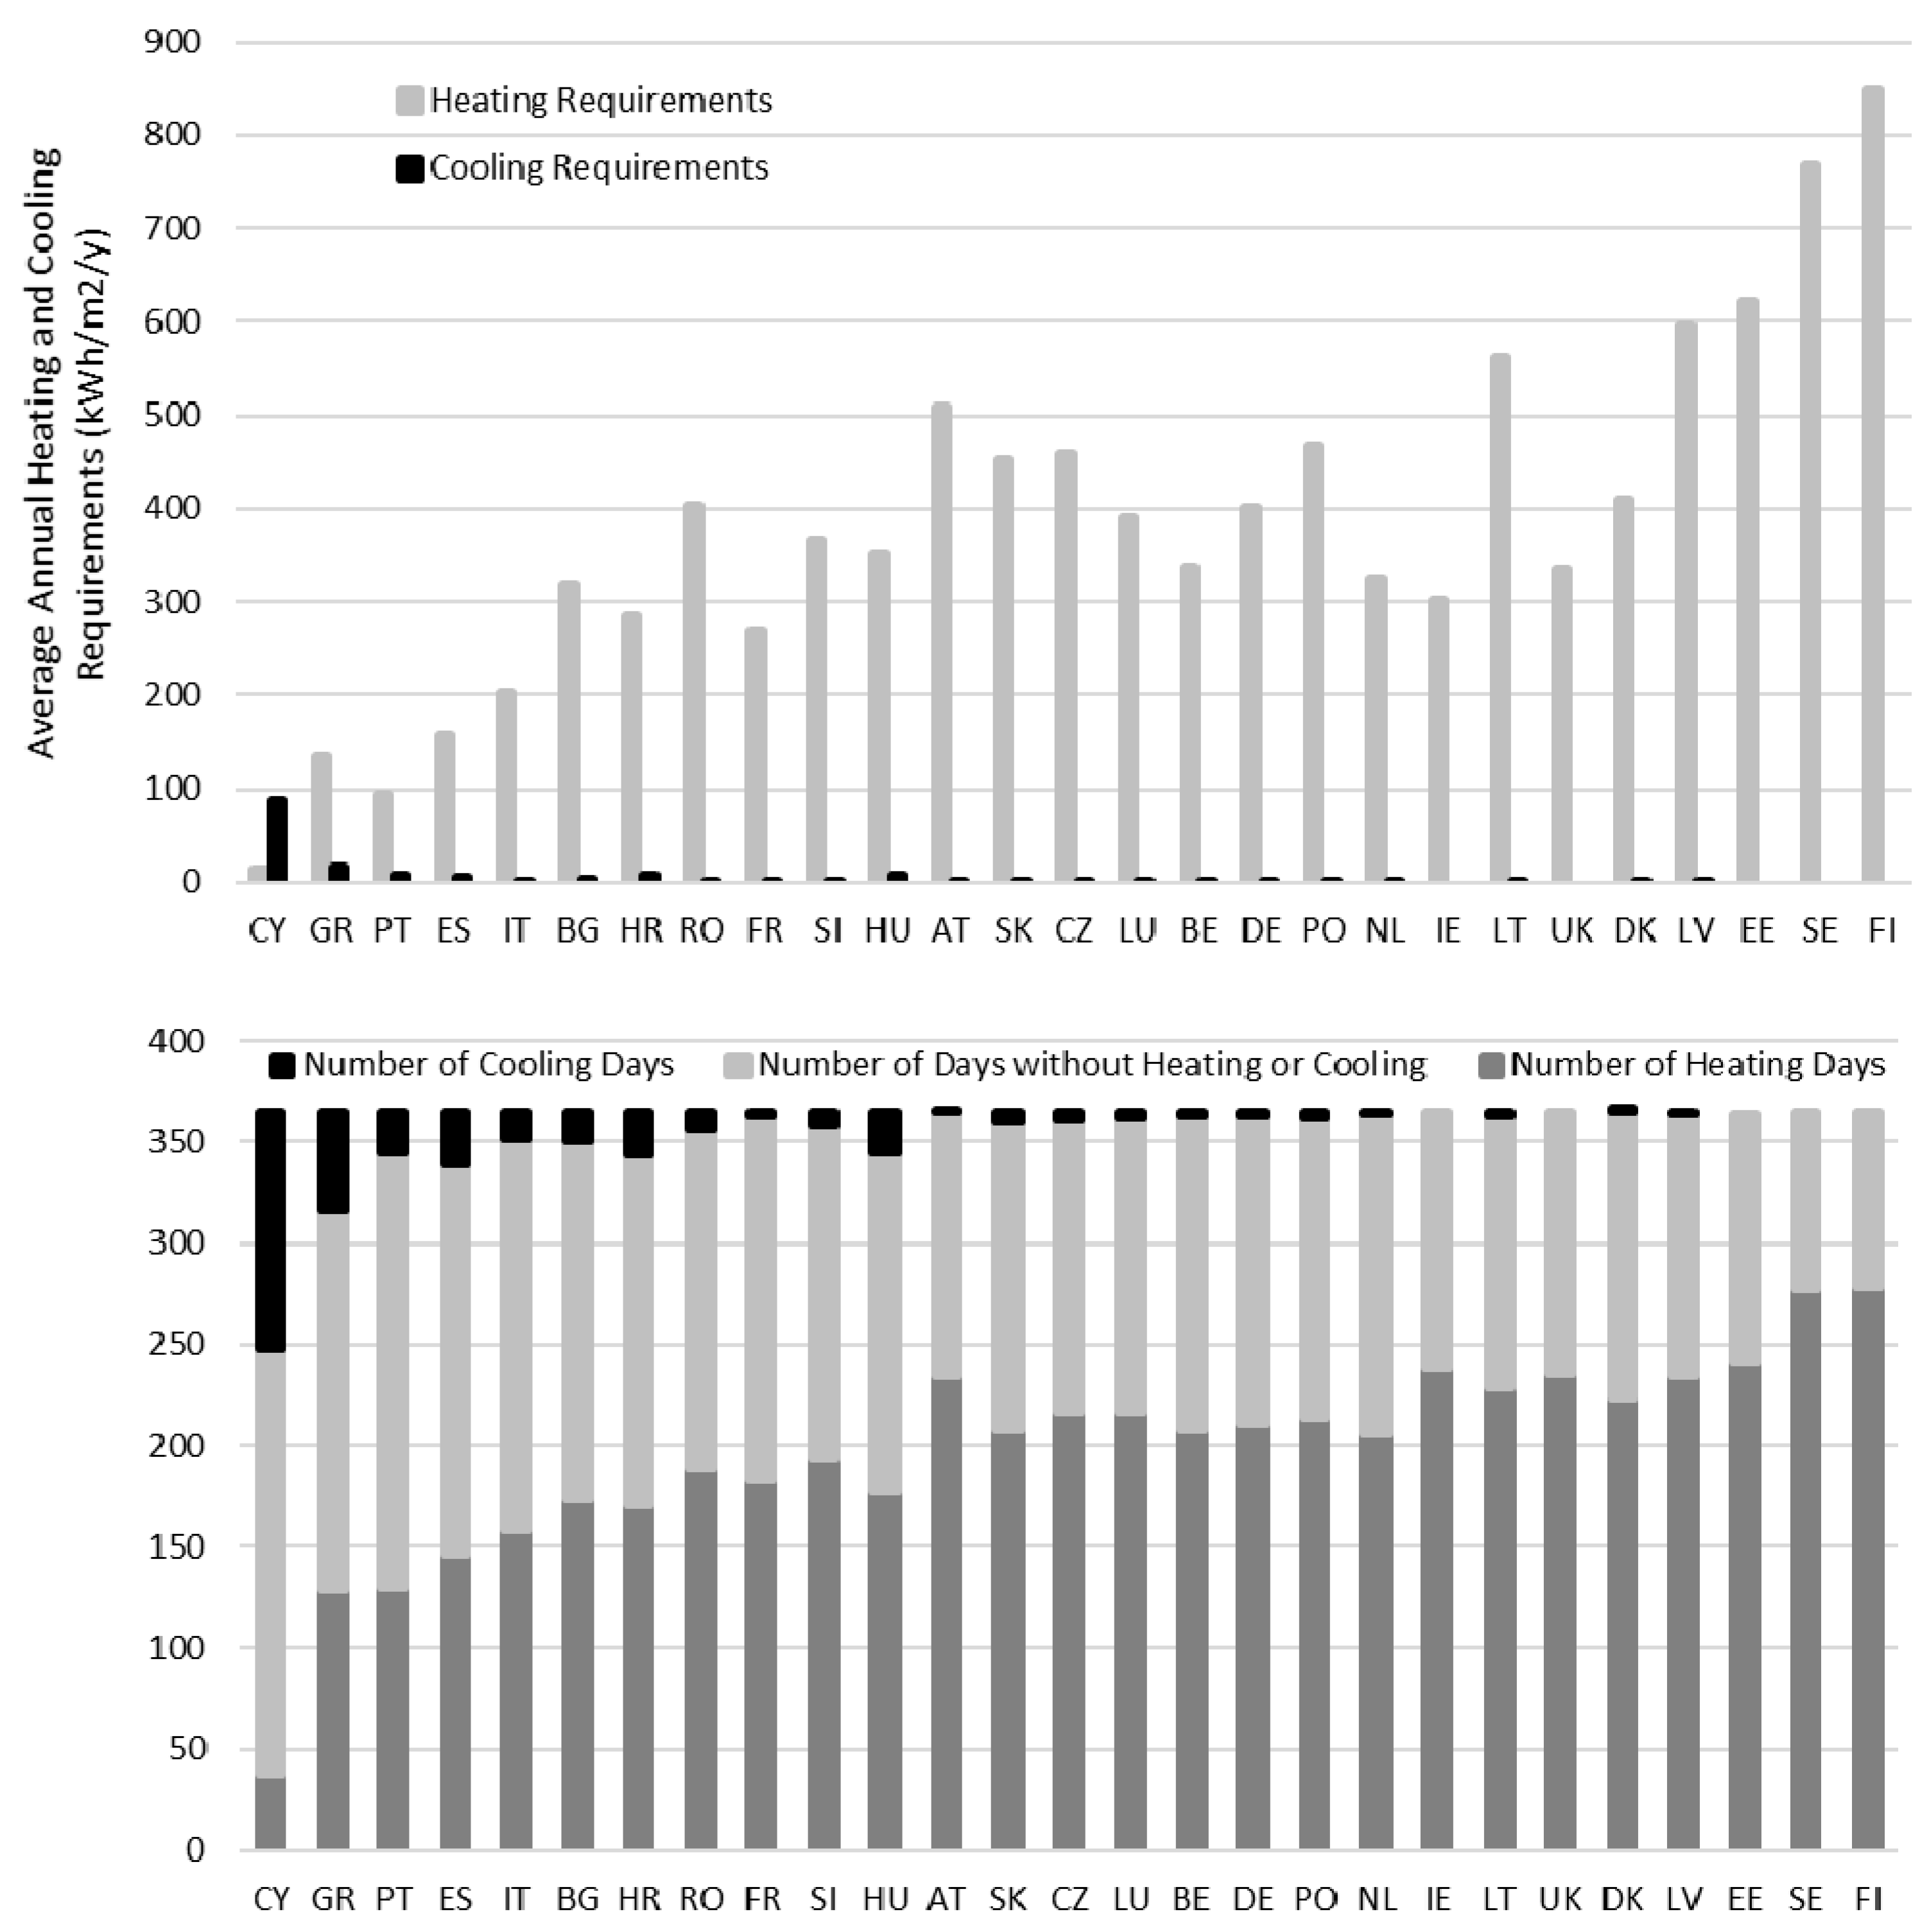
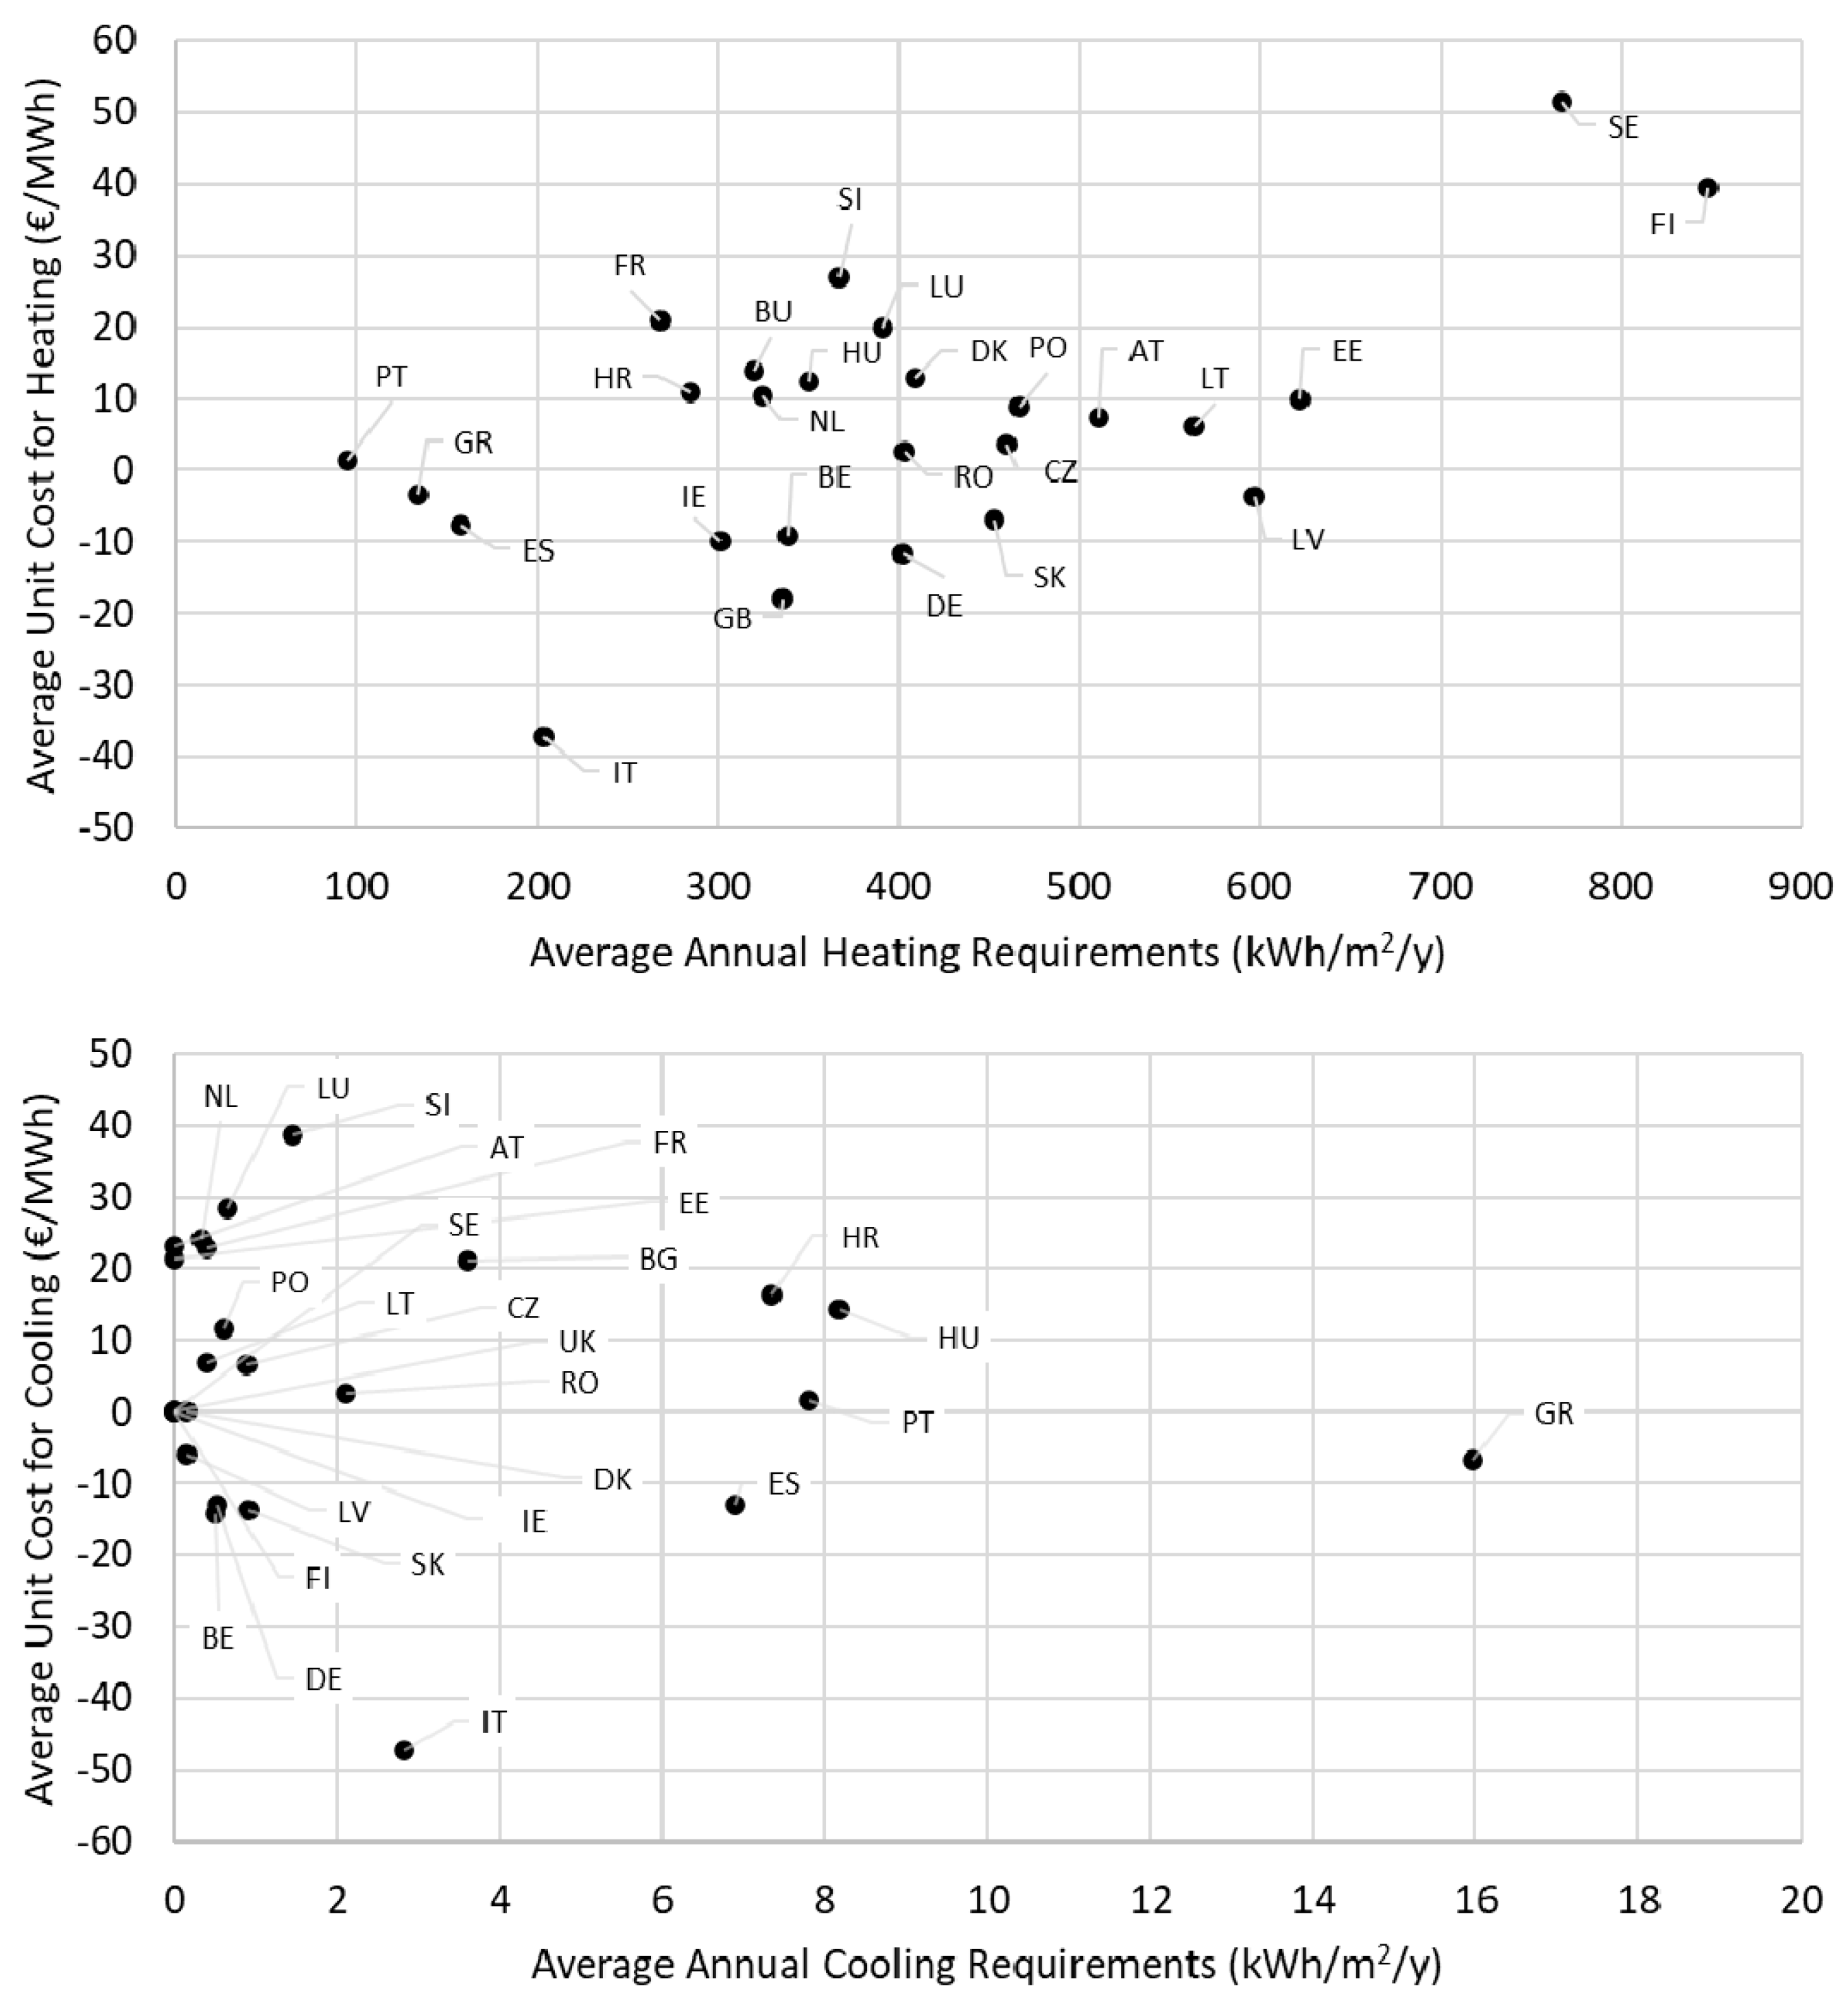
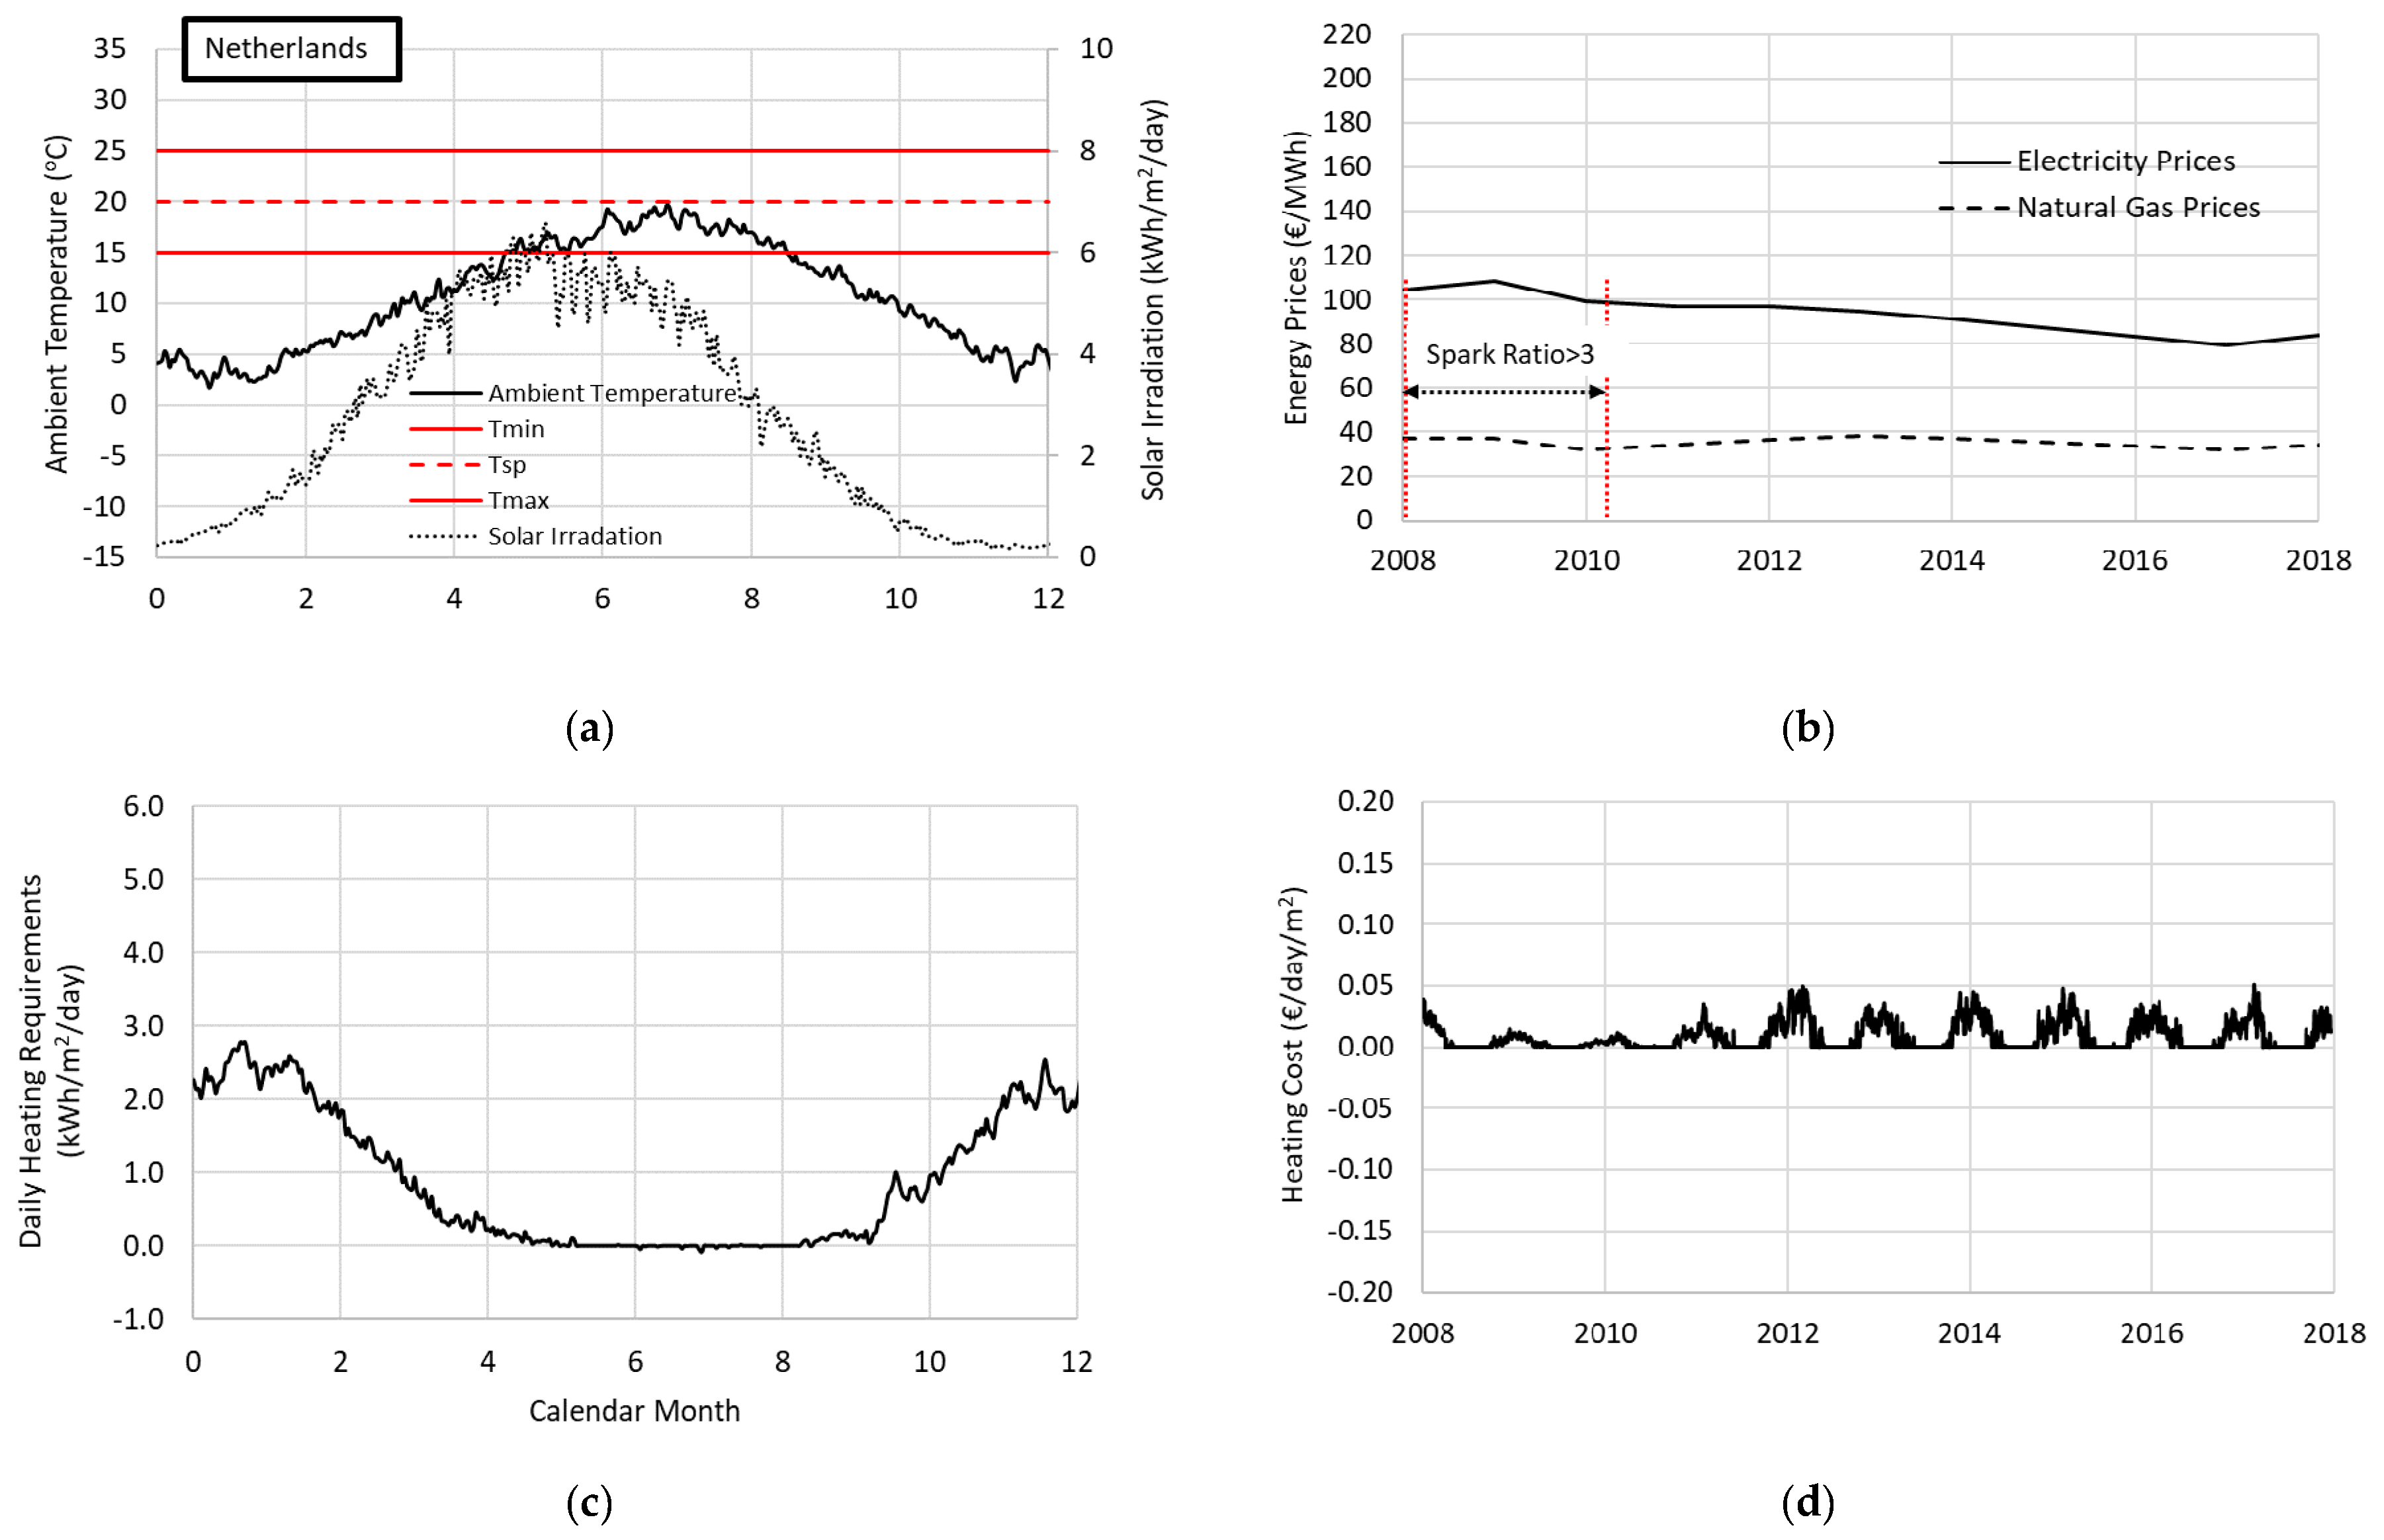
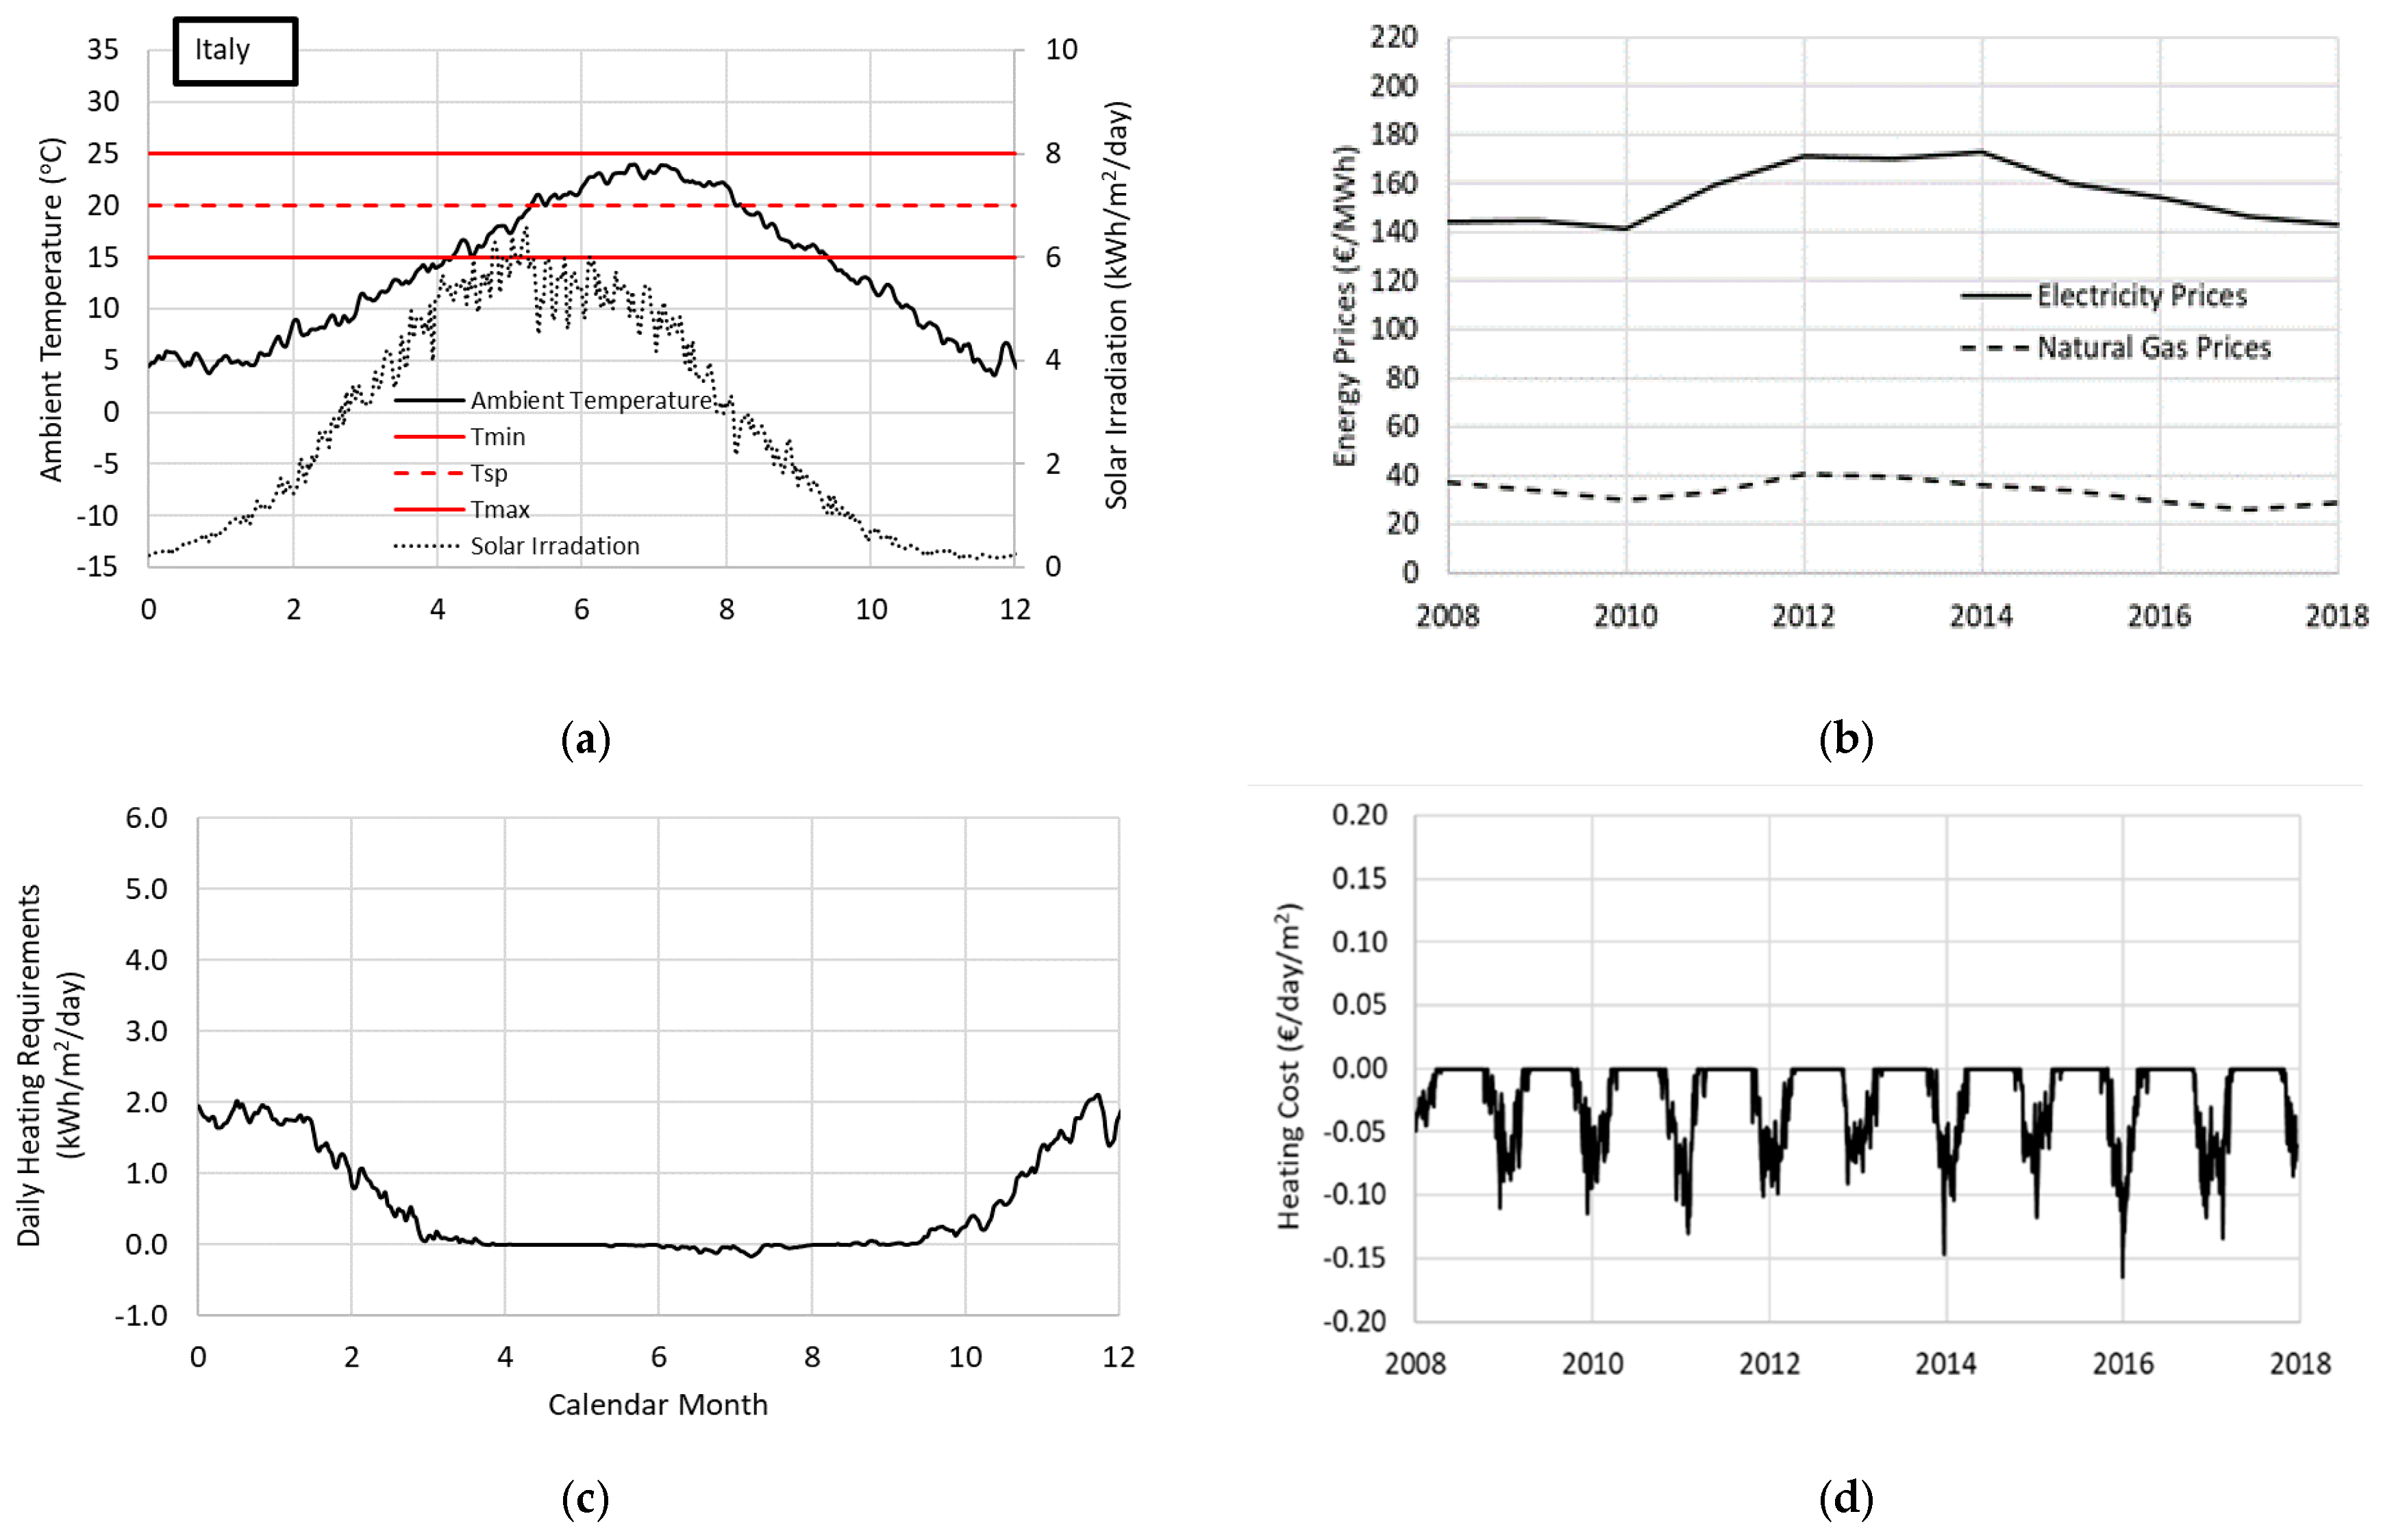
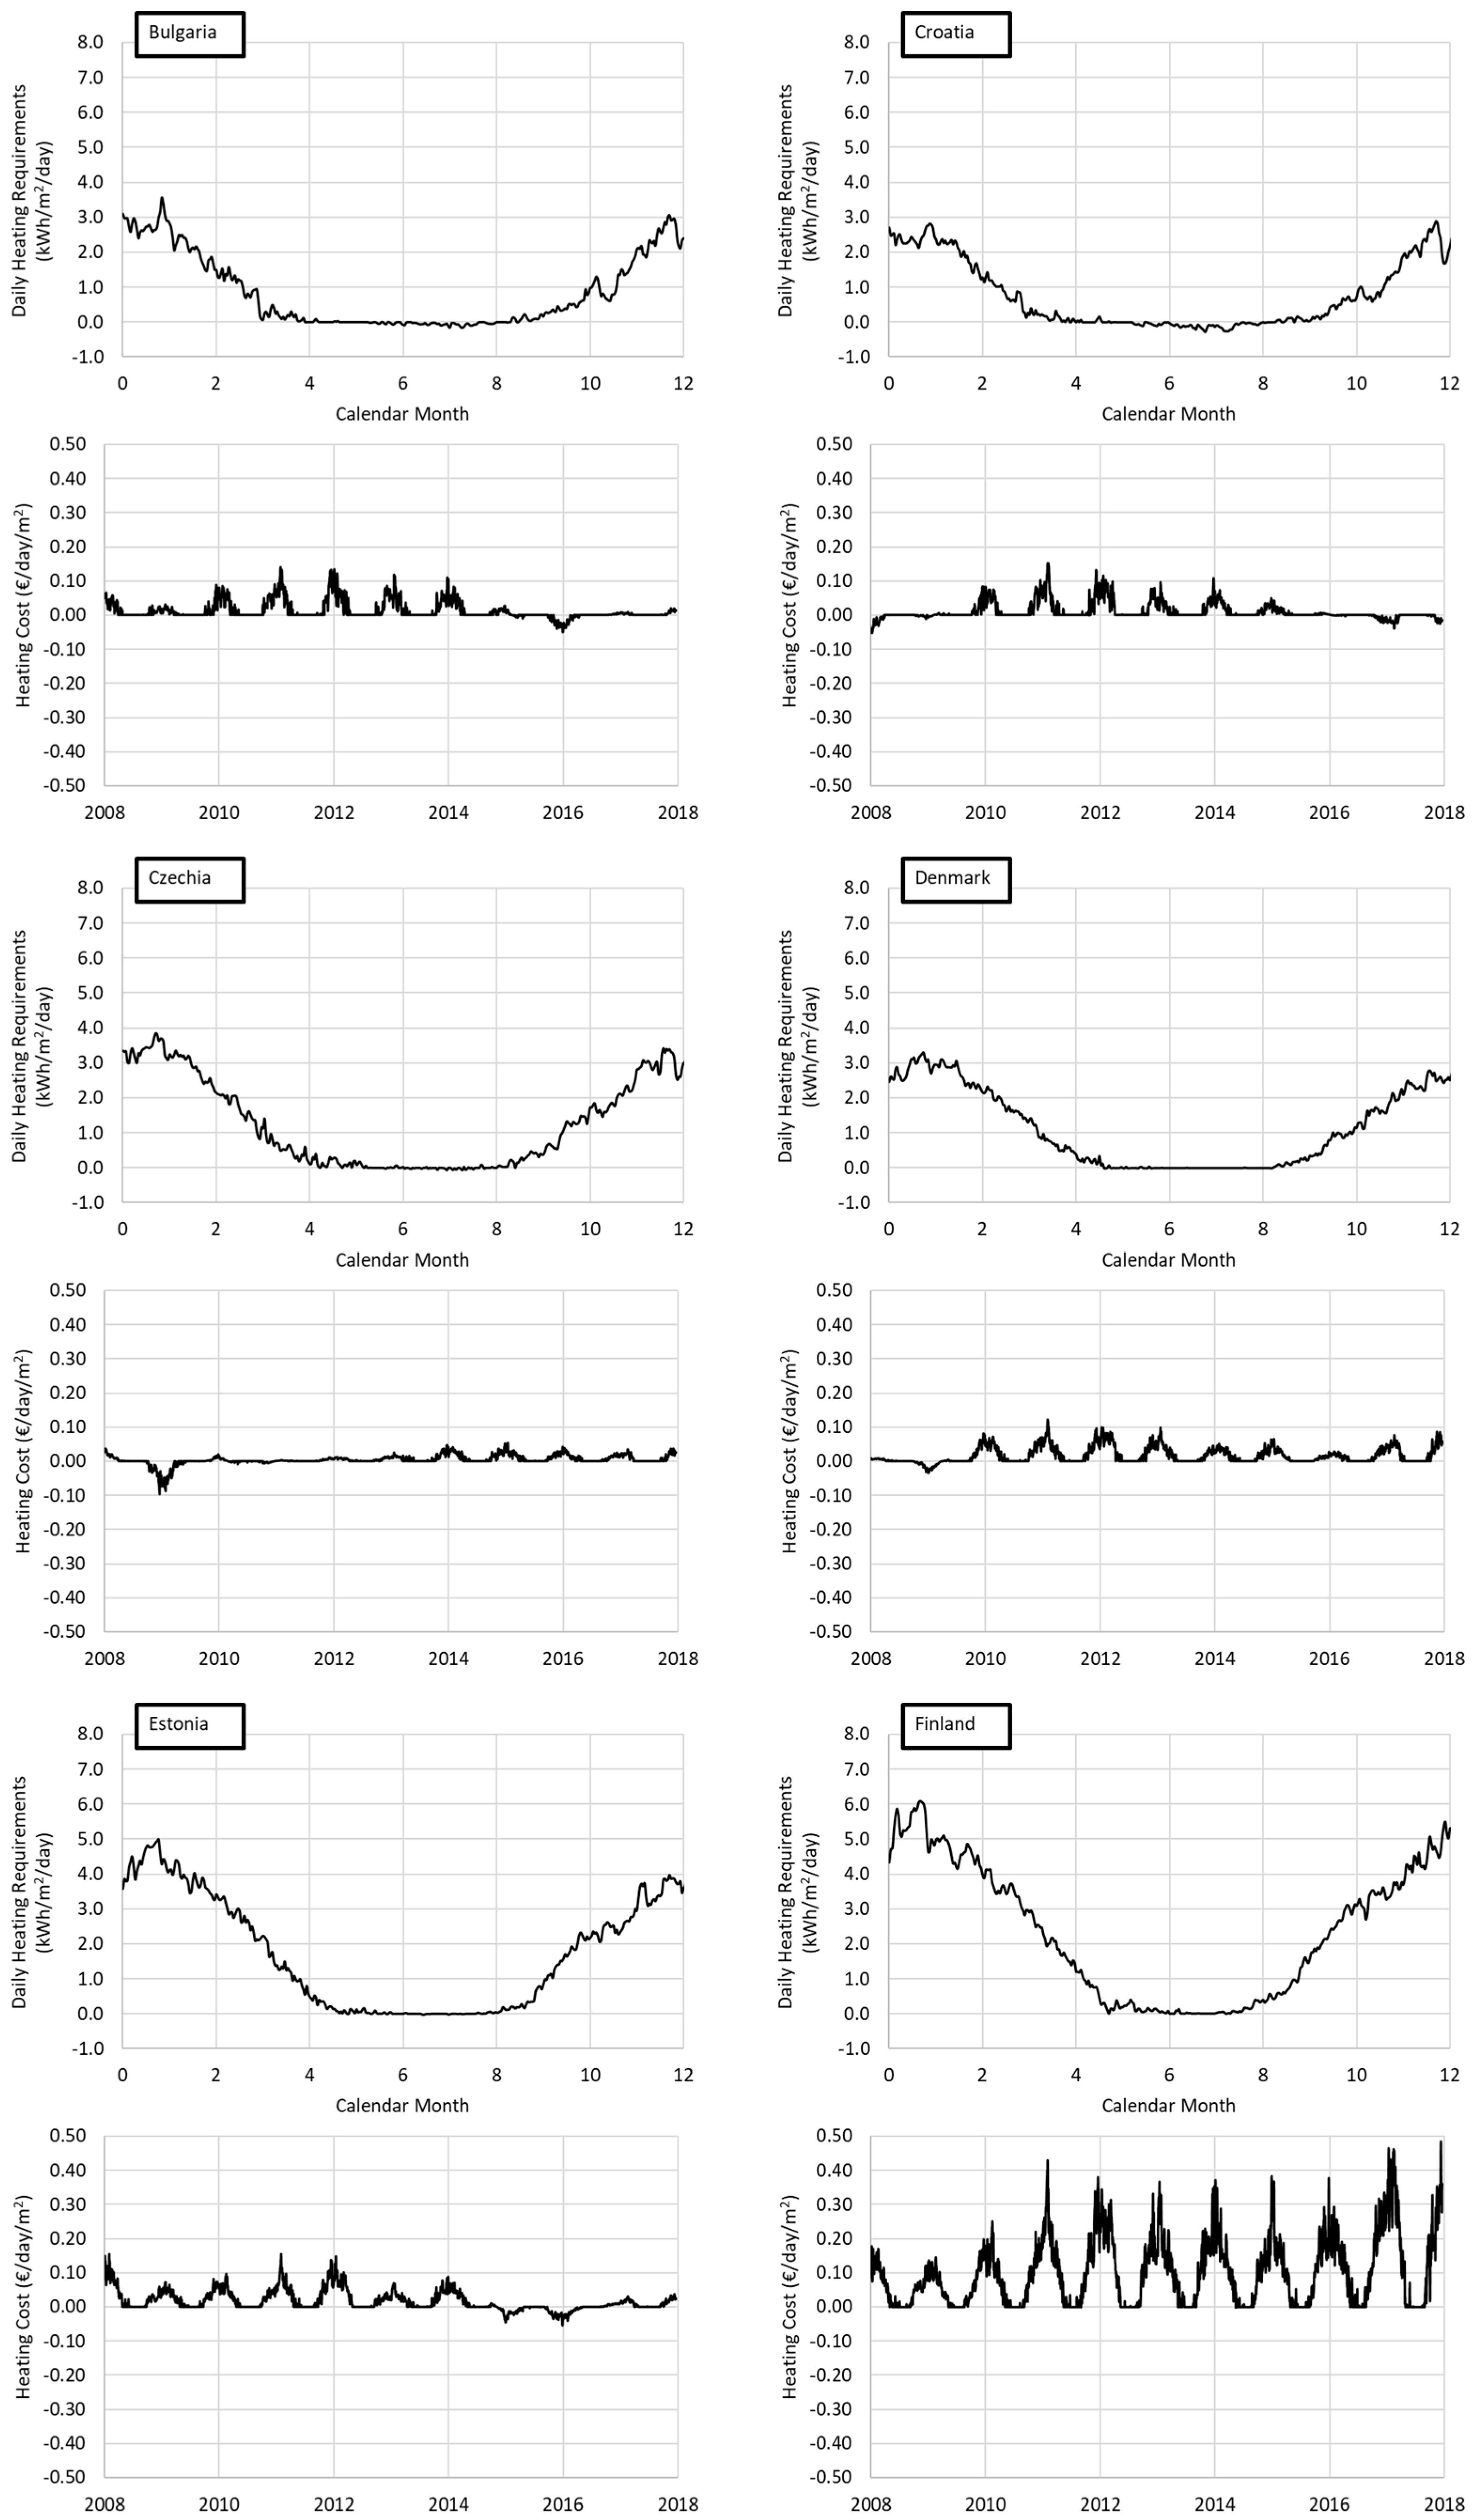
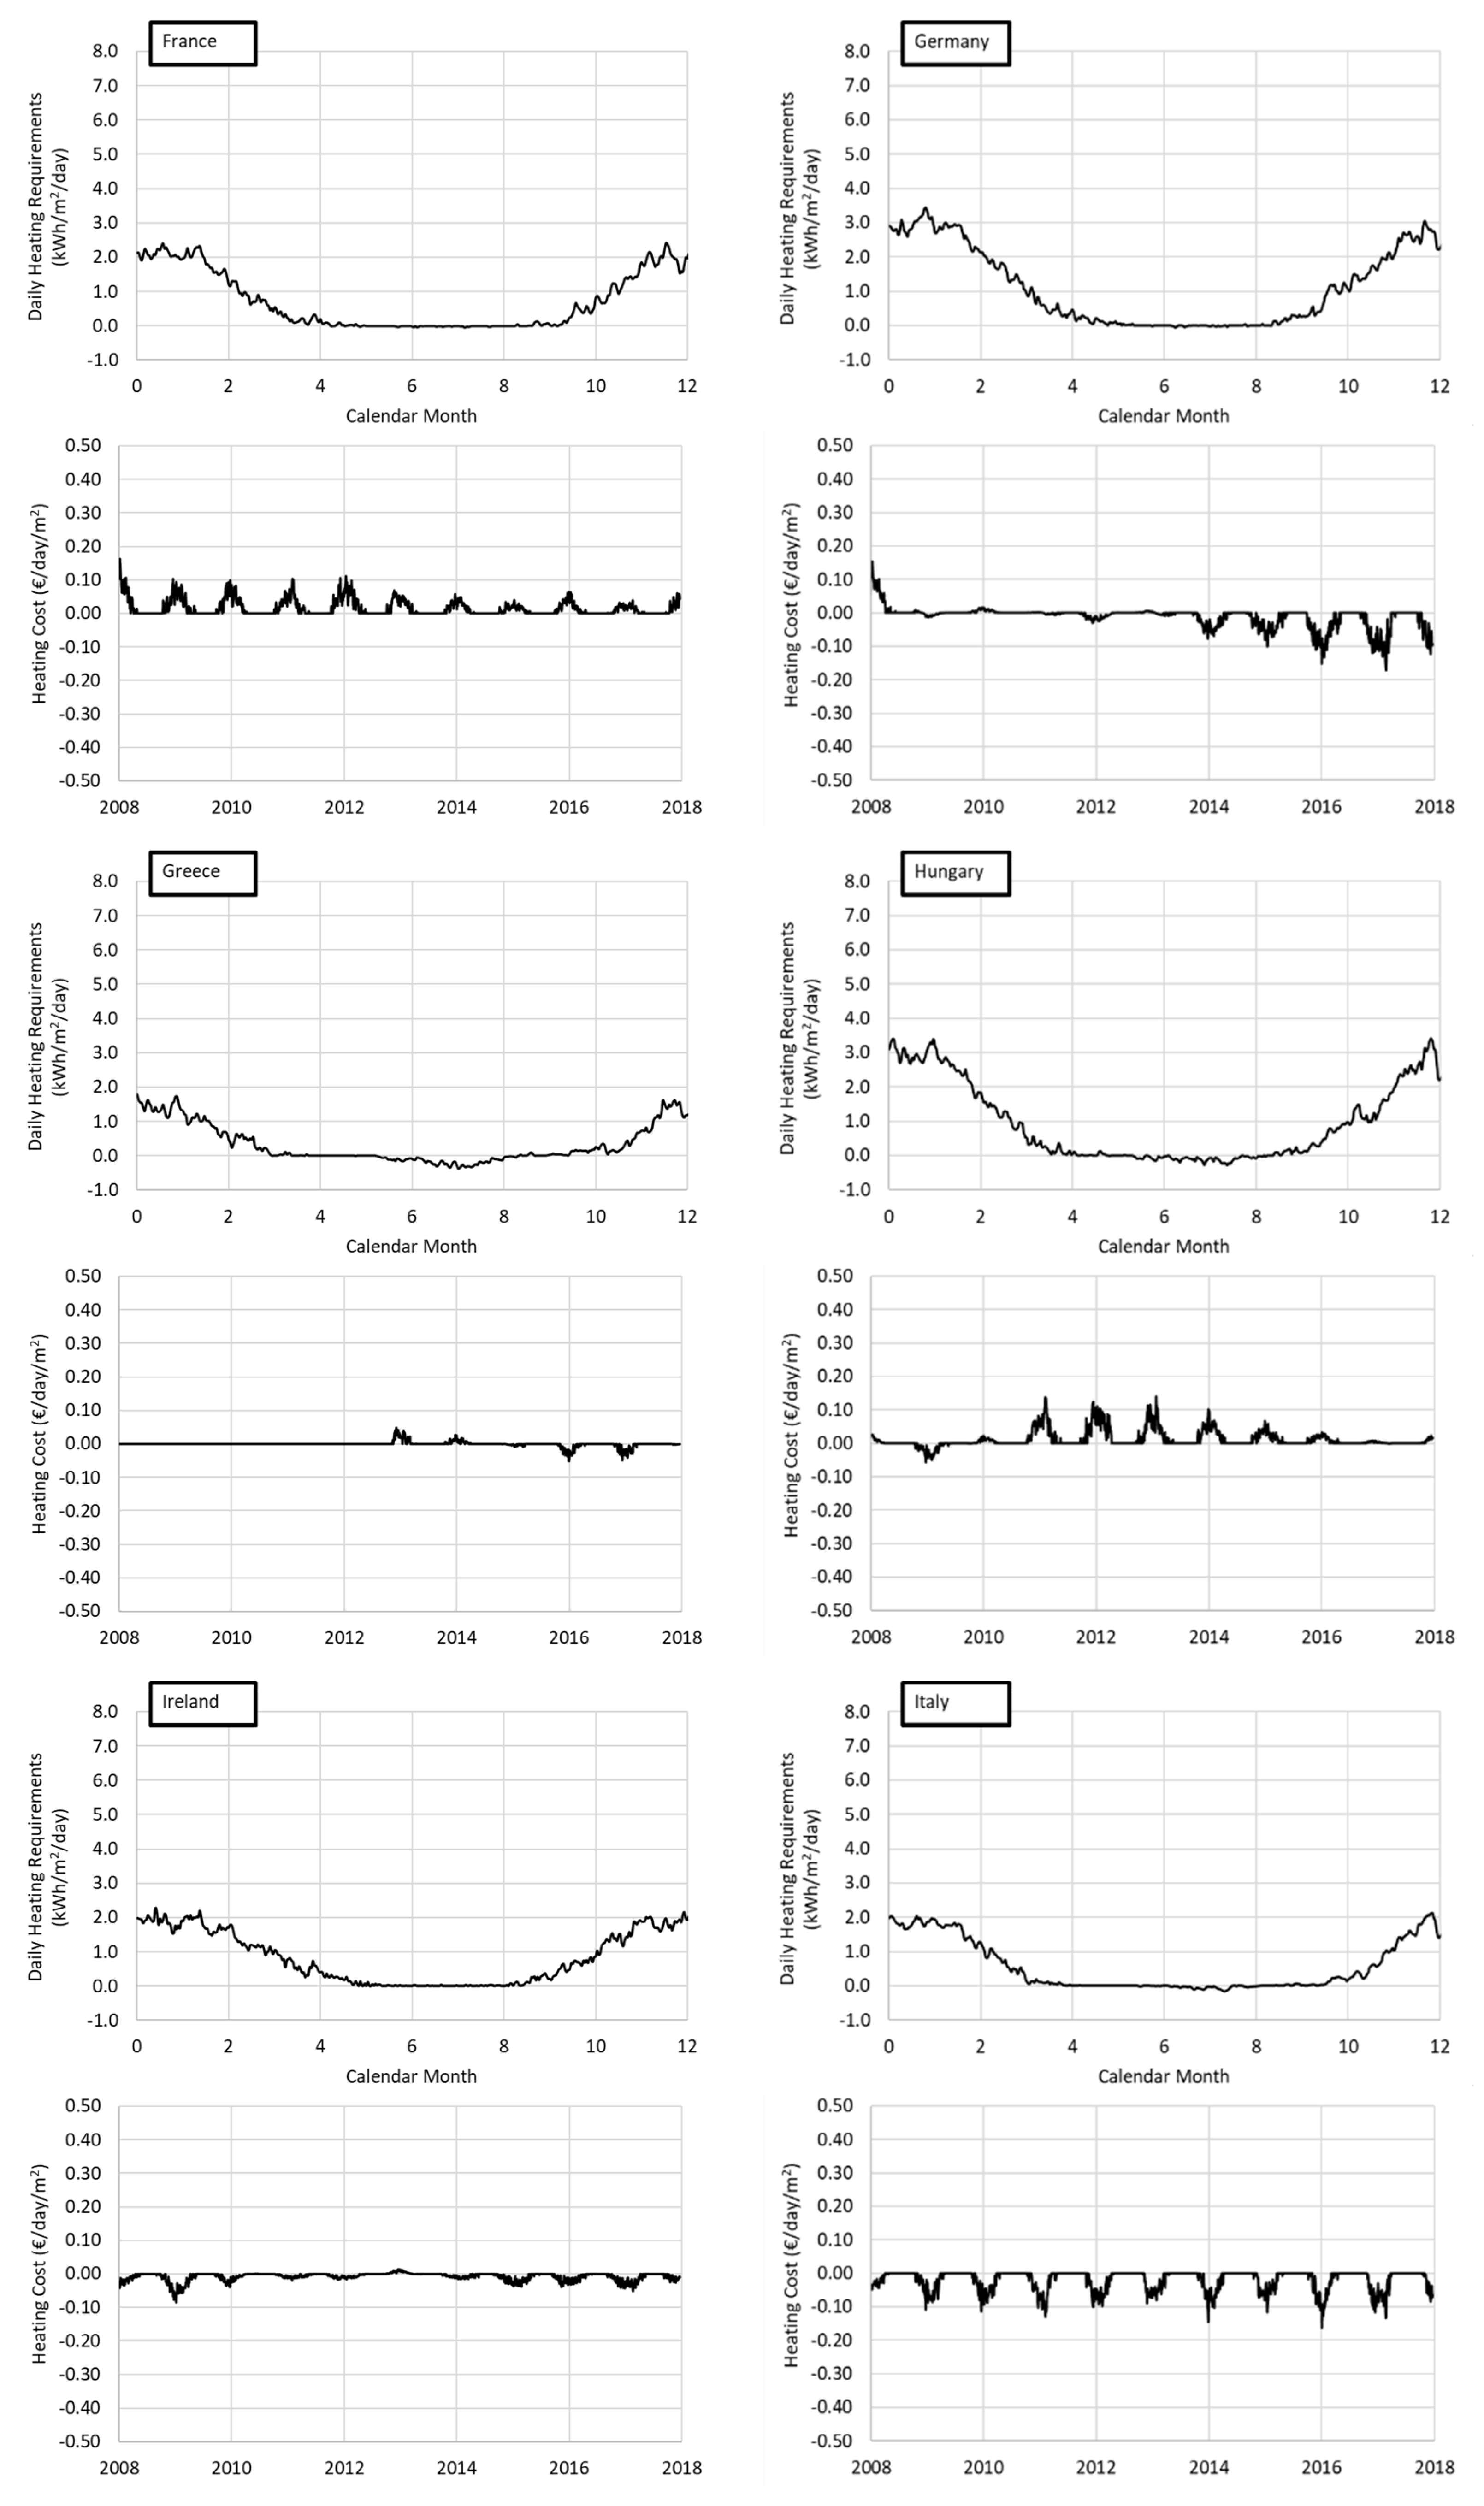
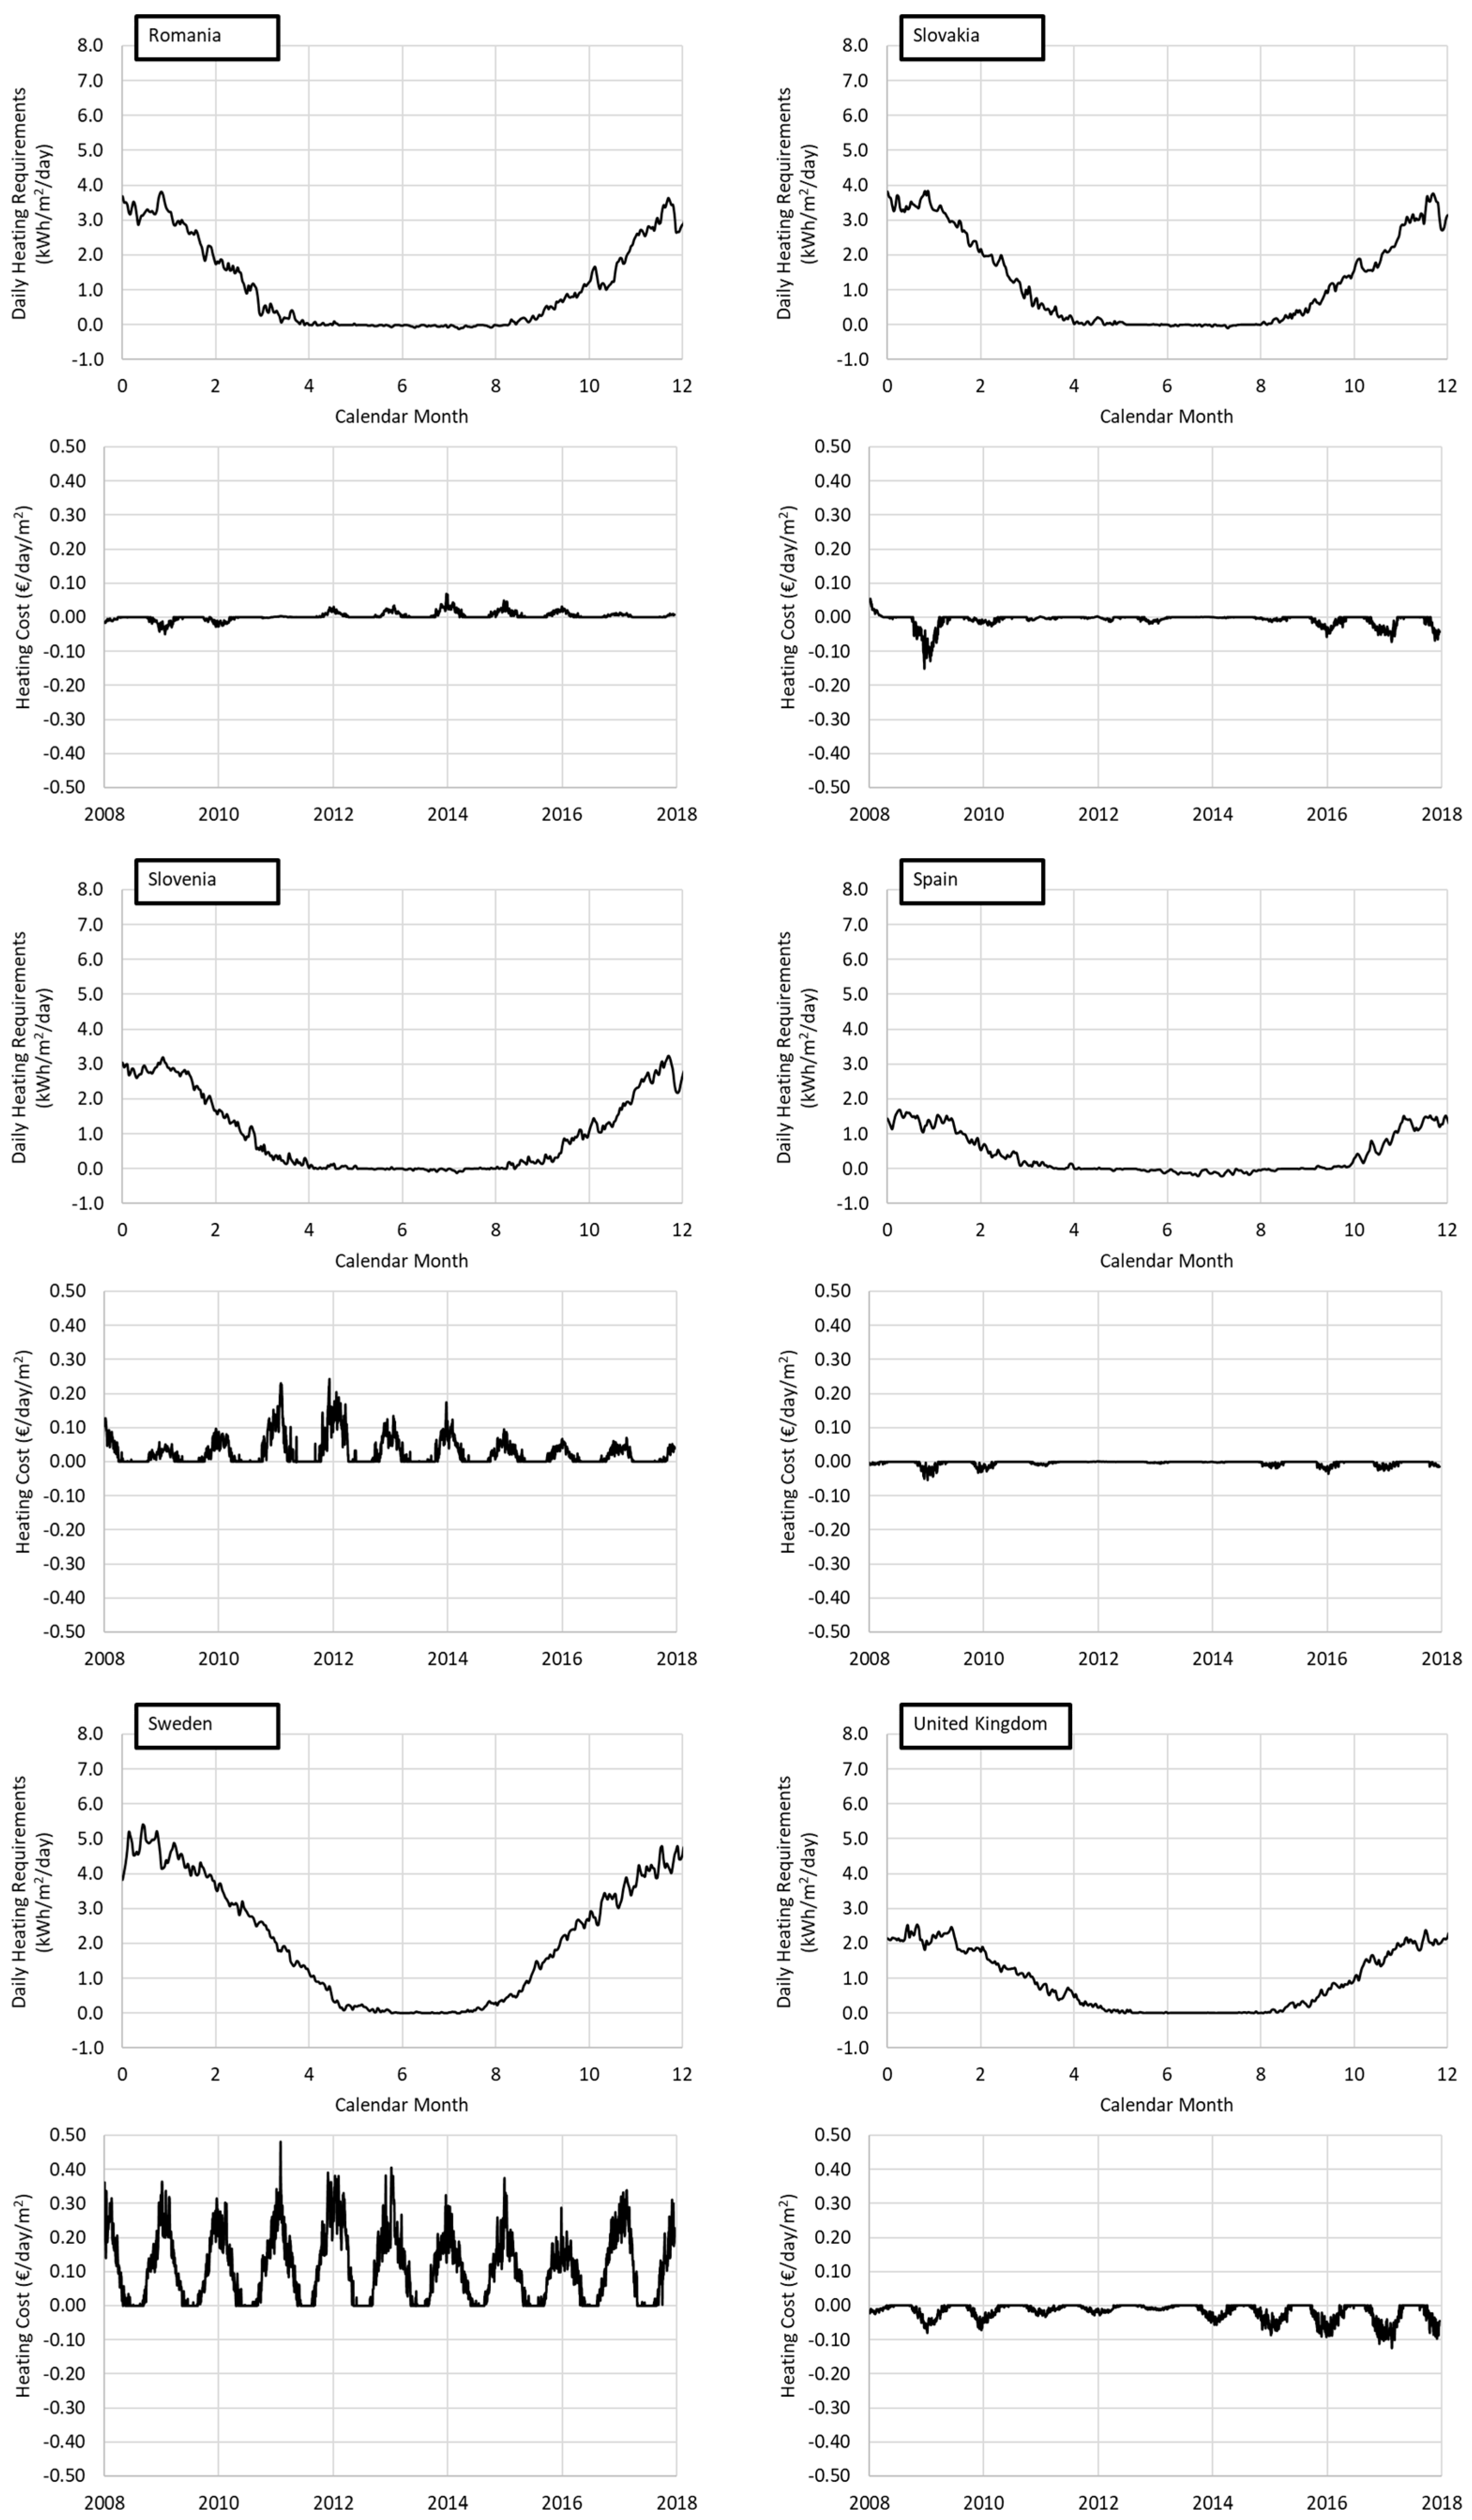
4.1. Greenhouse Energy Requirements

According to the weather timeseries analysis and using the daily values of the climatic data (ambient temperature and solar radiation) for the 2008–2018 period from the dataset [22], the average annual greenhouse heating and cooling needs for various European countries are summarized in Figure 4, along with the numbers of days where heating, cooling, or no energy were required for the cultivation of products in the accepted temperature range of 15–25 °C. The results are depicted with the countries sorted from smallest to largest latitude. As an experimental comparison, Table 2 compares the present study with the results of García et al. [35], who performed a similar analysis estimating the thermal needs of seven European locations based on monthly climatic data, assuming a greenhouse heat-transfer coefficient of 8 W/K m2; daily and nightly temperature setpoints of 22 and 16 °C, respectively; a percentage of solar radiation contributing to sensible heating of 40%; and a transmissivity of greenhouse cover of 0.75.
With respect to Figure 4 it is obvious that northern countries have greater heating needs than southern countries, with three of them (Finland, Sweden, and Estonia) exceeding the annual value of 600 kWh/m2, four with a heating demand less than 200 kWh/m2 (Cyprus, Greece, Portugal, and Spain), and the rest fluctuating between these two values. Cooling requirements were only met in a very few cases (mainly in Cyprus, Greece, Portugal, and Spain). This is especially true for Cyprus, where cooling requirements exceeded even the heating requirements due to the hot climate conditions. Cyprus also had the largest number of days in which greenhouses did not have any energy needs in order to maintain the proper conditions for the growth of the selected temperature-range products. In addition to this, 16 European countries needed more than 200 days of heating annually, while only four European countries needed less than 150 days. The remaining countries days did not need additional energy to reach the desired setpoint.

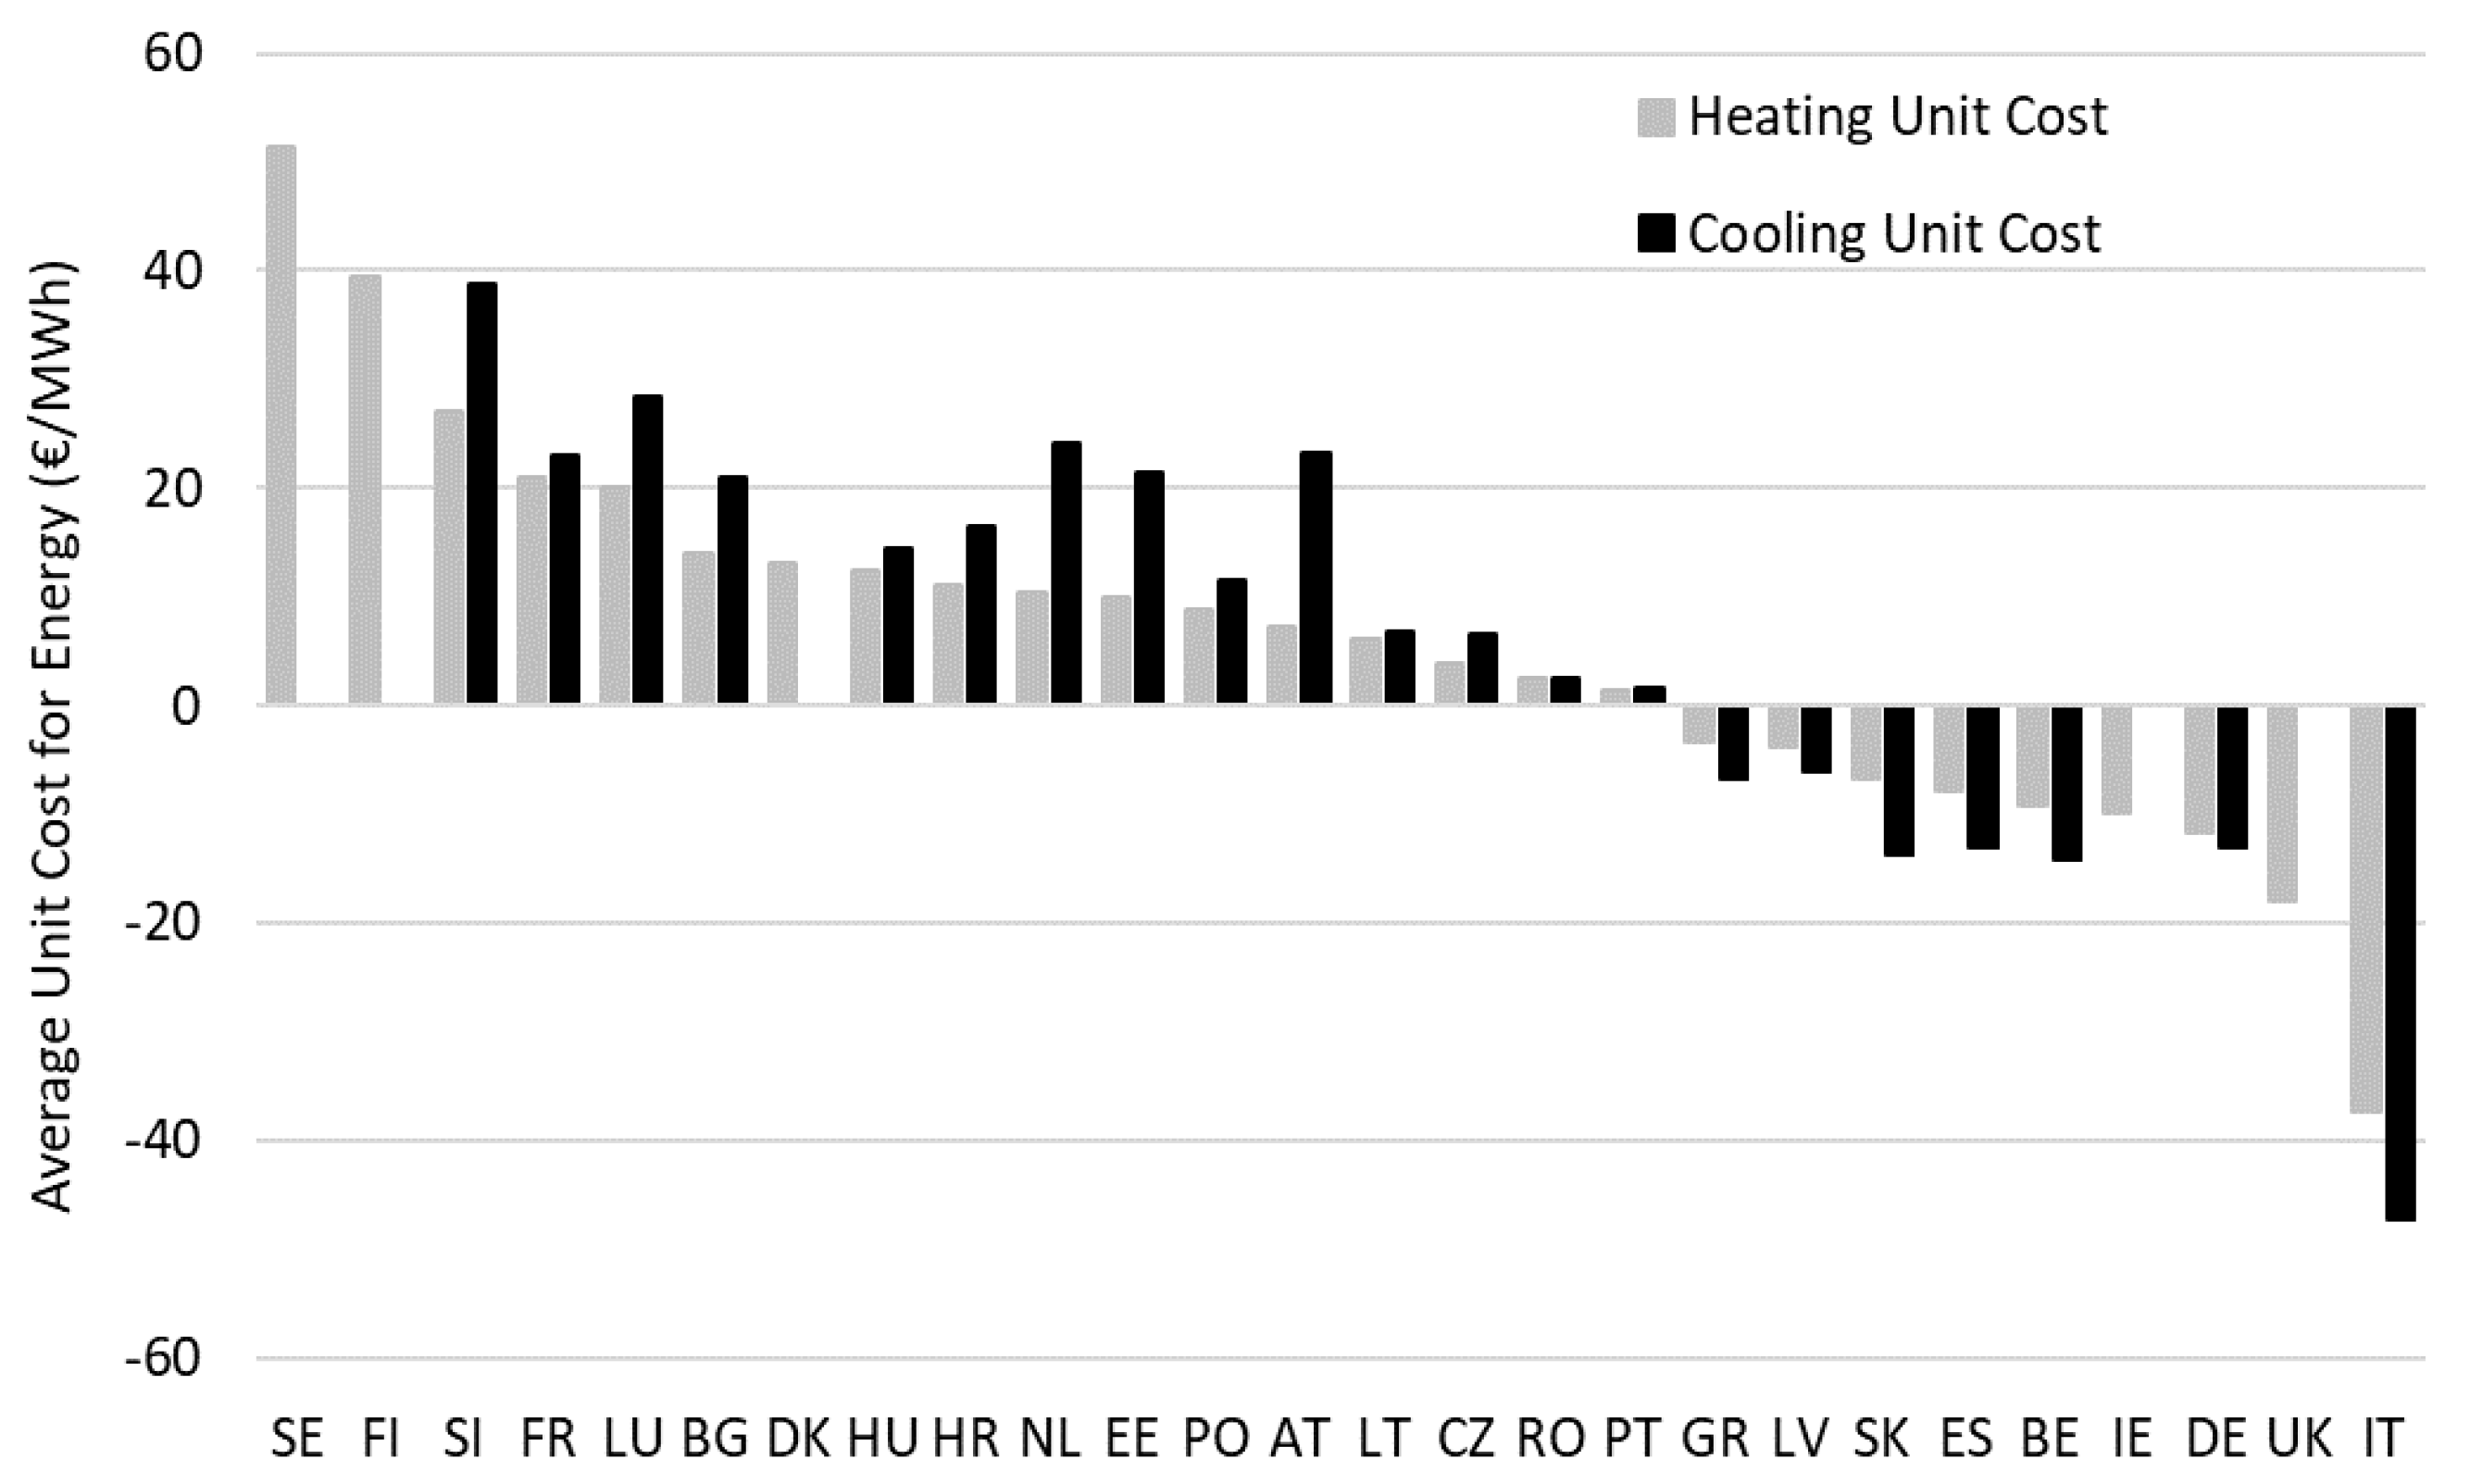
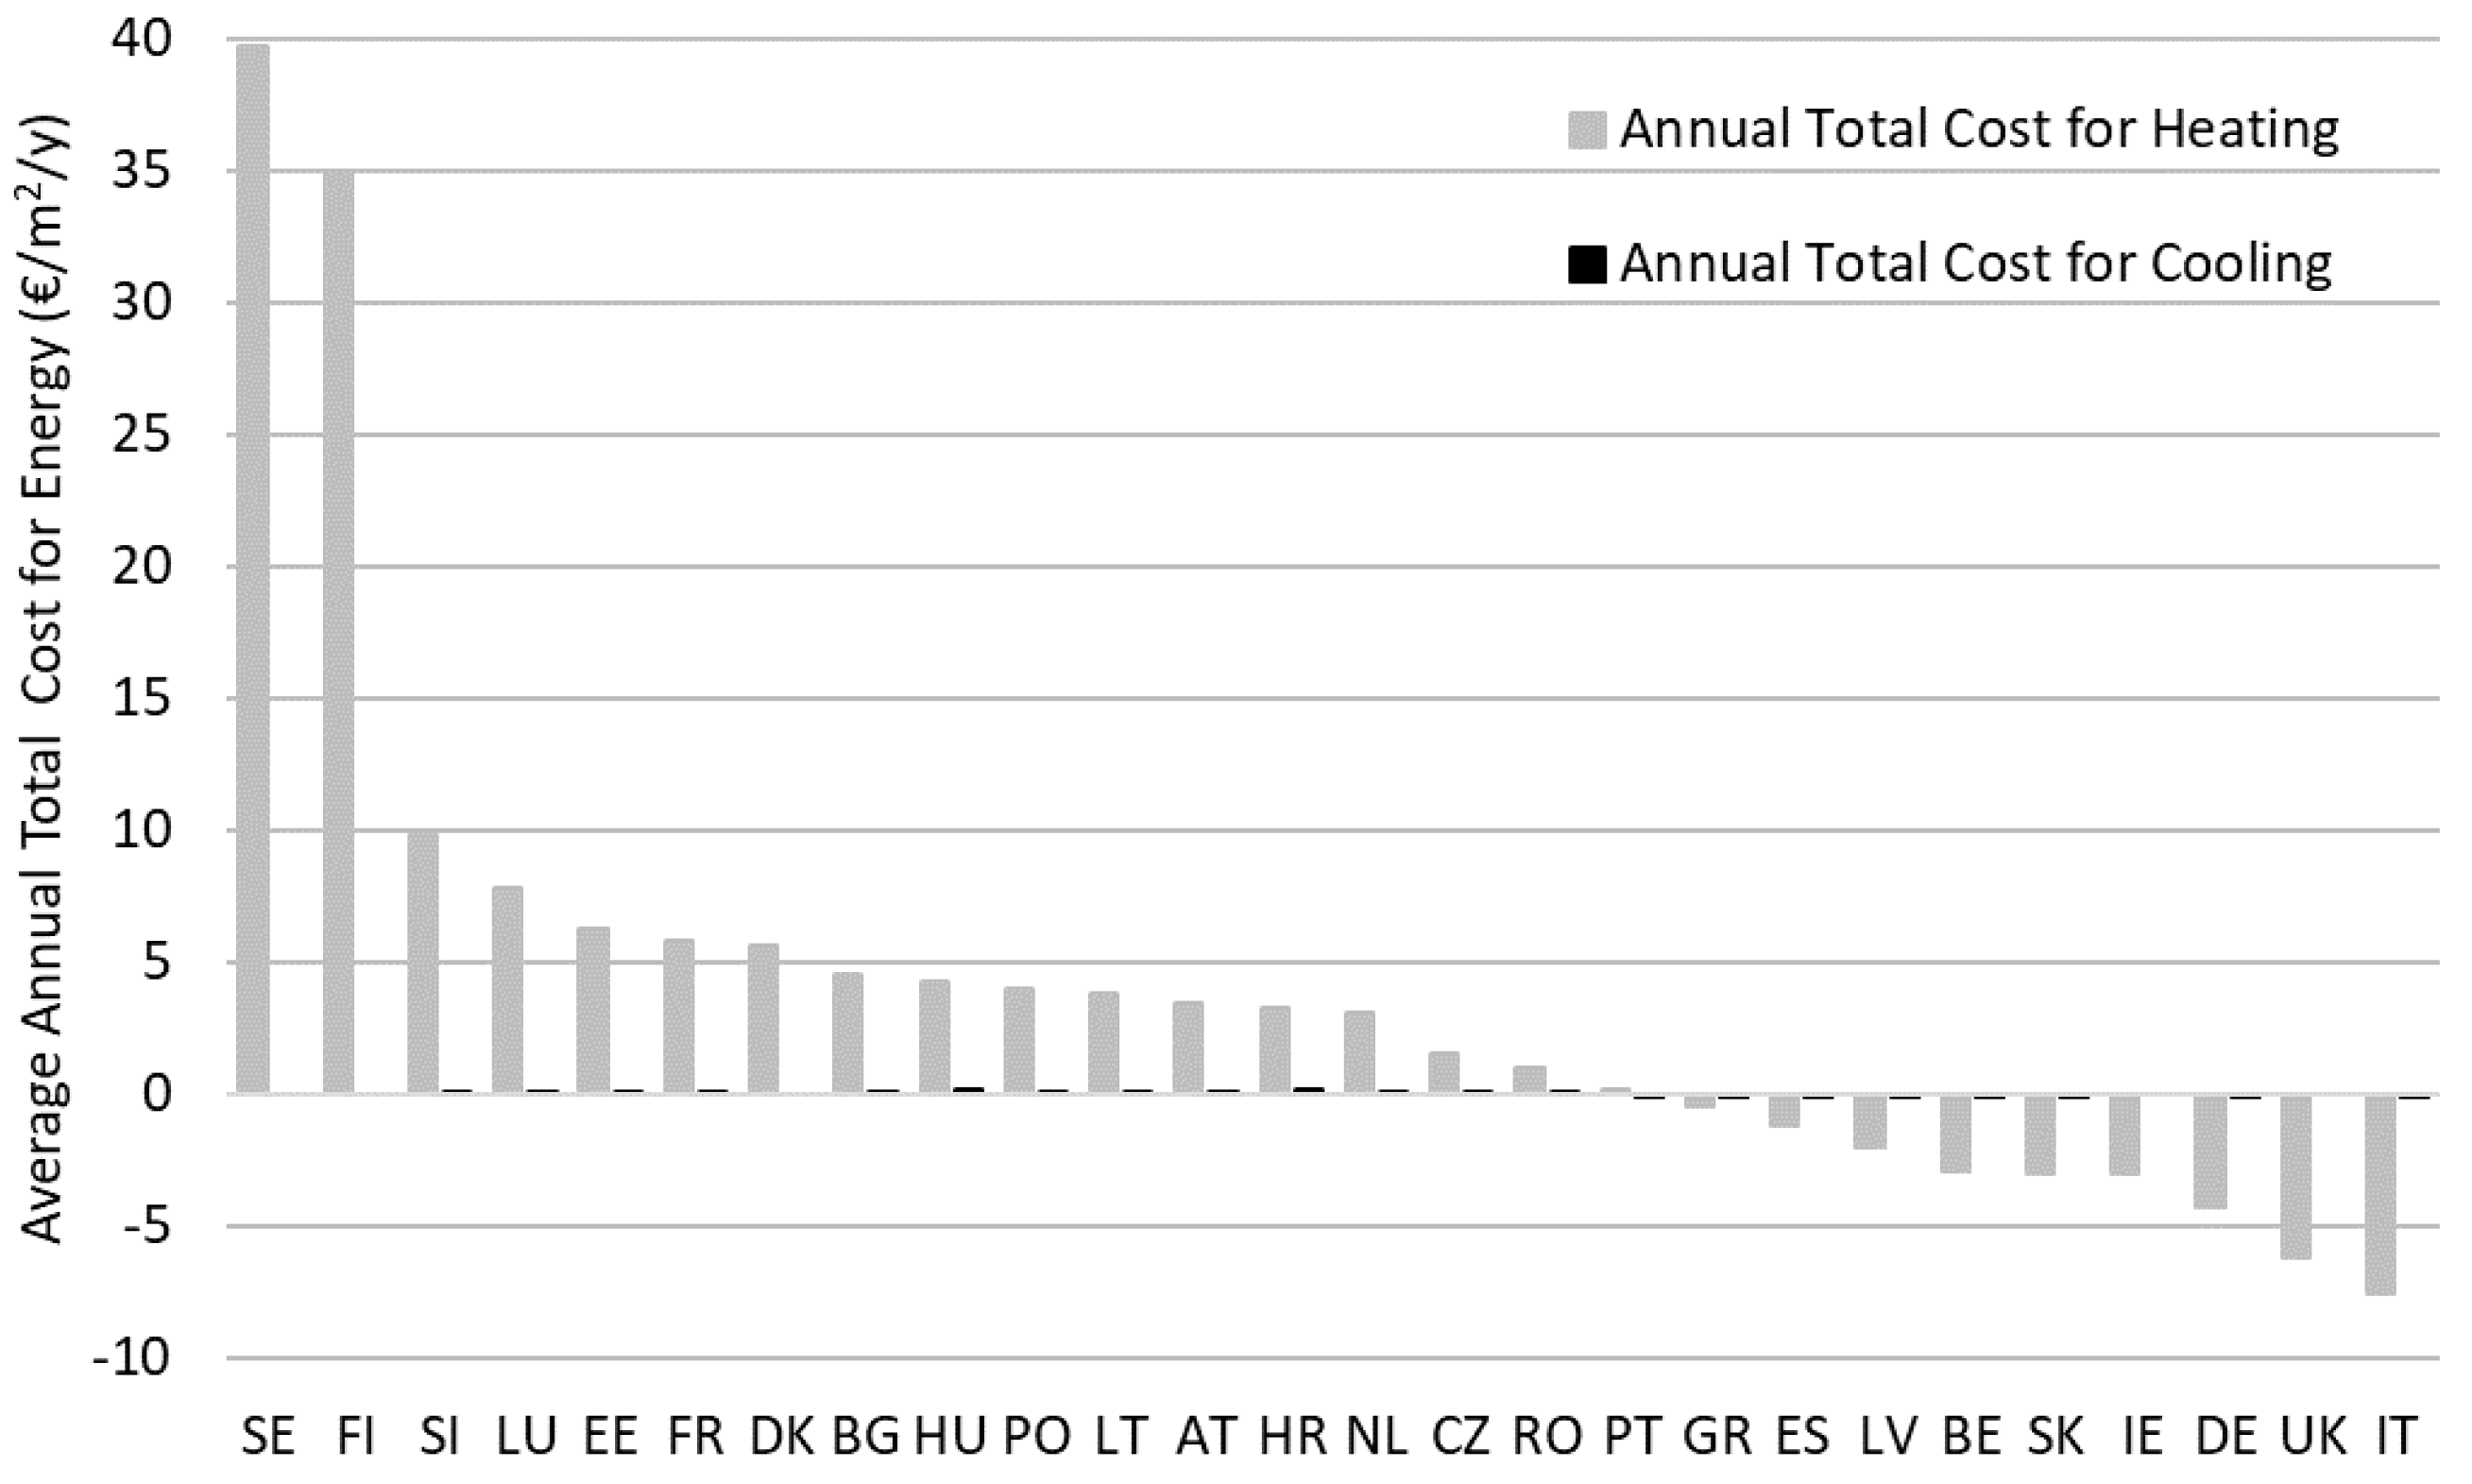
4.2. Cost of Greenhouse Energy

Two different costs for the greenhouses were calculated: (a) the unit cost of energy (heating and cooling) produced by the CCHP system (€/MWh) (Equations (11) and (12)); and (b) the annual total cost for heating and cooling per greenhouse unit area (€/m2/y) (Equations (13) and (14)). The former depended only on the technical efficiencies of the technology and the energy prices of each country (Figure 5), while the latter depended on the former, as well as on the annual heating and cooling requirements of each facility (Figure 6), which were directly related to the climatic conditions. In Figure 6, the heating cost is depicted using grey bars, while the cooling cost is represented using black bars. As can be seen, cooling cost is always a bit higher than heating in relative values, due to the relatively low coefficient of performance of the heat-driven absorption chiller. In countries where no cooling costs are depicted, no needs for cooling were found during the examined time period (2008–2018). Cooling needs in absolute terms were disproportionally lower than heating, which dominated the total energy costs. Figure 7 maps this parameter space in two dimensions: countries with low energy requirements and energy costs (bottom left corner) had favorable conditions for cultivation, while countries in the top right corner had high costs associated with cultivation as a result of market and weather conditions.
Based on the results of Figure 5, Figure 6 and Figure 7, it can be concluded that for 10 countries the use of a CCHP system was very profitable, leading to negative energy production costs. Negative energy costs indicate income rather than of expenditures, when satisfying a greenhouse’s energy needs. Considering that the technical efficiencies of the system were stable and the same throughout all the cases, it can be determined that the parameters which most affected this outcome were the energy prices, with energy requirements having a smaller impact on annual energy costs. In fact, as previously illustrated (in Section 2 and Figure 2), the spark ratio was higher than 3 for 9 of those 10 countries.
More specifically, Italy seems to have been the most suitable country for cogeneration in the greenhouse sector, as the average energy unit cost and annual cost for heating was negative and came out at −37 €/MWh and −7.5 €/m2/y, respectively, followed by other Mediterranean countries (Spain, Greece, and Portugal). On the other hand, in countries like Sweden and Finland, where the spark ratio was close to 1.5, the heating unit cost was more than 40 €/MWh. In combination with the significant heating demand, this means that the annual area heating cost was higher than 35 €/m2/y for these countries. In Sweden in particular, the unit area cost was almost 40 €/m2/y. Interestingly, in some countries (the United Kingdom, Ireland, Germany, and Latvia), despite their increased heating needs, the annual heating cost per area came out negative and close to that of Italy (between −2 and −6 €/m2/y). This can be attributed to the very favorable energy prices for cogeneration, which resulted in negative energy unit costs (since the average spark ratio in all these cases was more than 3). Thus, as a general conclusion it can be observed that energy requirements are very important for the determination of annual cost; however, energy unit cost is the most important factor.

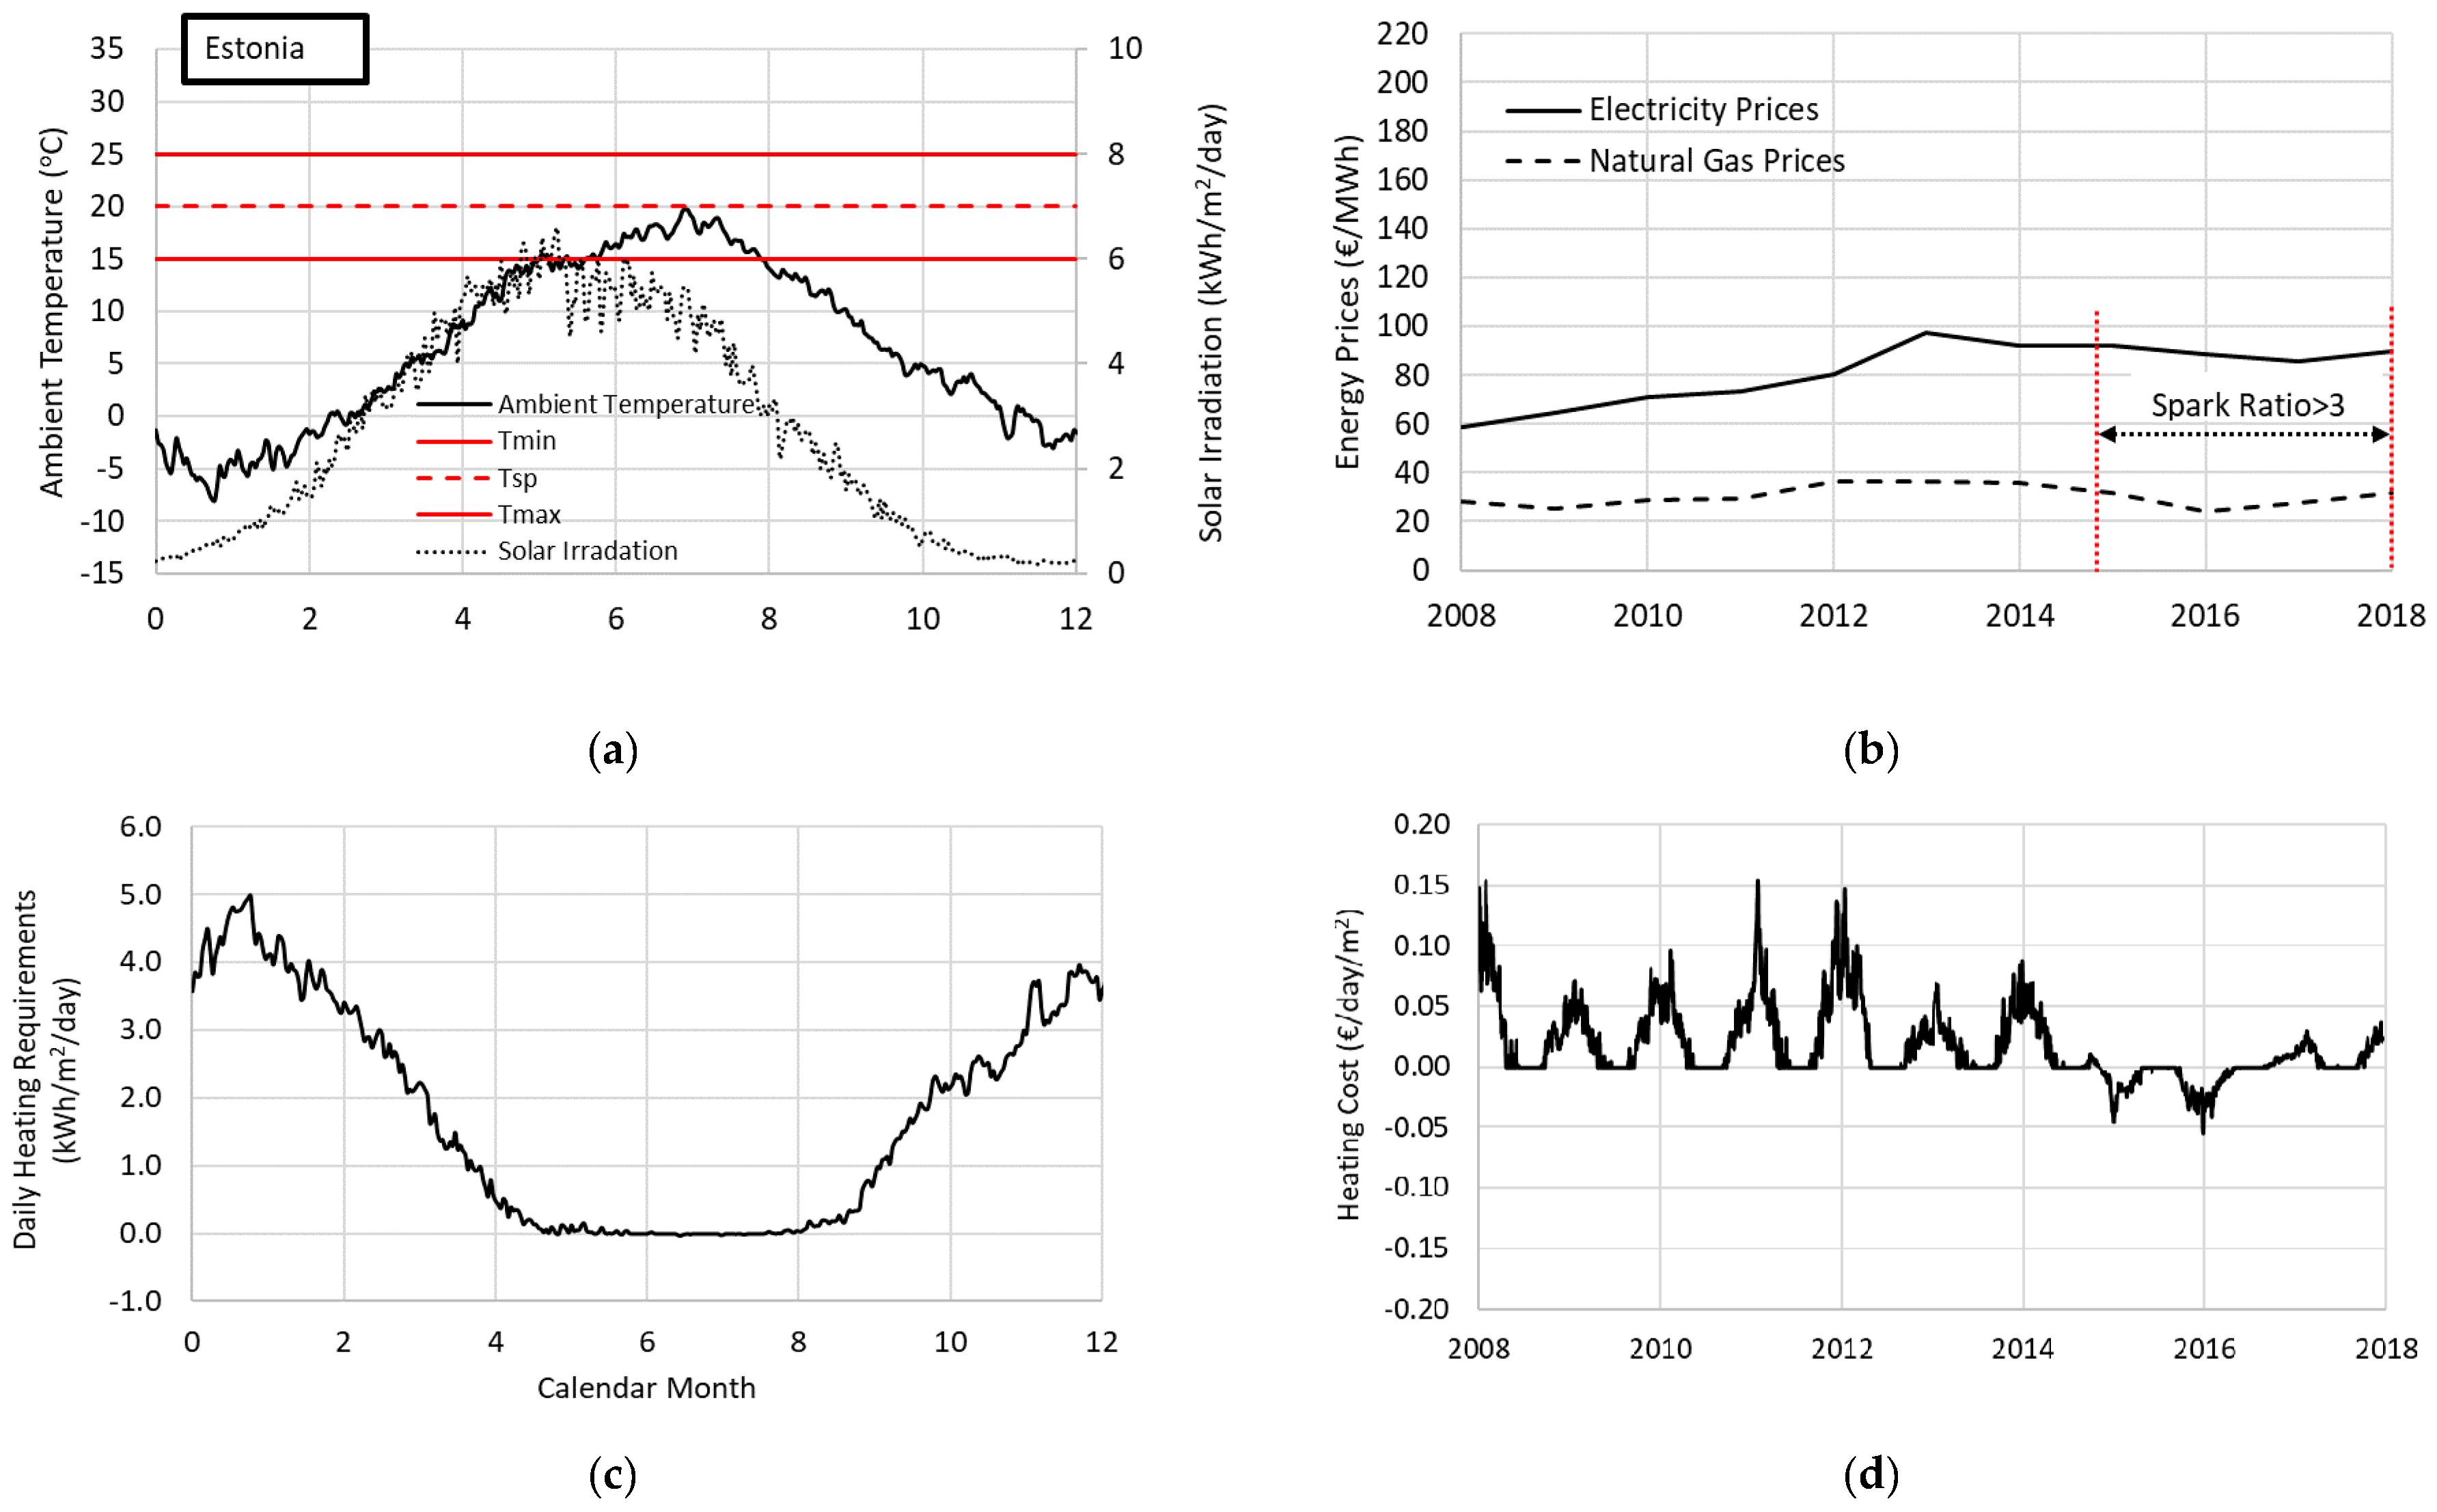
4.3. Seasonal Representation of the Effects of Energy Prices on Energy Greenhouse Costs: Estonia, The Netherlands, and Italy

The significant effect of energy prices on greenhouse costs is presented in this section and in Figure 8, Figure 9 and Figure 10 using the examples of Estonia, the Netherlands, and Italy. Estonia is located in Northern Europe and has an average ambient temperature of 6.6 °C and solar irradiation of 2.7 kWh/m2/day (Figure 8a). Estonia’s electricity prices have shown an increasing trend since 2008, with the minimum value obtained in 2008 at 58.4 €/MWh and the maximum value being 97.2 €/MWh in 2013. Regarding natural gas prices, there were some fluctuations during the examined period. Accordingly, the minimum and maximum values was obtained in 2016 (at 23.6 €/MWh) and 2013 (at 36.5 €/MWh), respectively (Figure 8b).
Considering the cultivation of products with accepted temperature range between 15 and 25 °C (two red solid lines), Estonian greenhouses required only heating, since the ambient temperature never exceeded the upper accepted cultivation limit of 25 °C, and there were months during the summer during which the facility did not require any kind of energy system to fulfil the cultivation requirements (Figure 8a). This can be seen in the daily heating requirements diagram (Figure 8c).
As can be seen from Figure 8d, cogeneration could not be considered an attractive solution during the 2008–2015 period, since the correlation of energy prices caused a spark ratio less than 3, and the heating cost of the greenhouse was positive. However, in 2015—when a decrease in natural gas prices combined with a simultaneous increase in the price of electricity—the spark ratio exceeded the value of 3, and the cost of heating turned from positive into negative for most of that period, thus benefiting the use of CHP.
The Netherlands had an average ambient temperature and solar irradiation of 10.6 °C and 3 kWh/m2/day, respectively, during the decade 2008–2018 (Figure 9a). The annual heating requirements were on average 325 kWh/m2, while in the summer months the greenhouse could maintain the proper cultivation conditions without any additional energy input (Figure 9c). The electricity prices had a downward trend, with an average value at 93.6 €/MWh. On the other hand, natural gas prices did not fluctuate much. In fact, the maximum price was obtained in 2013 at 38.2 €/MWh, while the minimum was 31.7 €/MWh in 2017 (Figure 9b). The combined behavior of energy prices after 2010 led to a decrease in the spark ratio, which fell below the threshold of 3, and since then heating cost with cogeneration has increased significantly (Figure 9d). However, this was proven to be lower than in Estonia.
Finally, Italy had the most favorable conditions for cogeneration use. The spark ratio in the country was always more than 3, resulting in a negative daily greenhouse heating cost that in winter months was even less than −0.10 €/m2 (Figure 10d). In fact, the electricity price obtained its maximum value during the examined period in 2014 (172.8 €/MWh), which—in combination with a natural gas price of 36.2 €/MWh—produced a spark ratio close to 5 (Figure 10b). Climatic conditions were obviously warmer, as Italy is a Mediterranean country, leading to relatively low heating requirements and long periods without the need for the cogeneration system to cover the greenhouse needs (Figure 10a,c).
A graphic representation of the seasonal heating requirements and energy costs of other European countries are presented in Appendix A Figure A1 and Figure A2.

5. Conclusions

A comparative analysis was conducted among European countries in order to investigate the trigeneration potential and cost-effectiveness in the greenhouse sector from 2008 until 2018. Based on the actual historical climatic characteristics and energy prices of all countries, a simple mathematical model was proposed to estimate greenhouse thermal requirements and energy unit costs in terms of €/MWh with the use of a CCHP system; the annual costs of heating and cooling per unit area were then presented in terms of €/m2/y. The cultivation of products with the accepted temperature range 15–25 °C was selected, and typical values for the technical efficiencies were used, assuming an internal combustion engine as the prime mover for cogeneration and a heat-driven absorption chiller for cooling.
From the thermal load model, it was concluded that as we move to a higher latitude, heating requirements increase. Greenhouses in three countries had annual heating requirements of more than 600 kWh/m2/y (i.e., Finland, Sweden, and Estonia), while Cyprus was the only country in Europe where the cooling needs exceeded the heating needs. In general, cooling was mainly needed in the three southernmost countries, (i.e., Greece, Portugal, and Spain), while the heating fluctuated between 200 and 600 kWh/m2/y across the rest of Europe.
The results of the cost analysis indicate that the ratio of electricity and natural gas prices affected the annual energy cost the most. Market conditions were unfavorable in most cases before 2014. Italy (with an average spark ratio of 4.6) had the most favorable conditions for cogeneration during the 2008–2018 period, achieving a negative energy unit cost of −37 €/MWh and an annual total heating cost of −7.5 €/m2/y. The least attractive country was found to be Sweden, with a heating unit cost of 51 €/MWh that—in combination with demanding heating requirements—resulted in a significant annual heating cost of 40 €/m2/y. In general, Mediterranean countries achieved negative energy costs, offering extra cashflow and proving that cogeneration is a cost-effective technology in these latitudes.

Author Contributions

Conceptualization: K.K. and Z.M.; data curation: K.T. and K.K.; formal analysis: K.T., K.K., E.G., and Z.M.; methodology: K.T., K.K., E.G., and Z.M.; software: K.T. and K.K.; supervision: E.G. and Z.M.; writing—original draft: K.T., K.K., and E.G.; writing—review and editing: K.T., K.K., E.G., and Z.M. All authors have read and agreed to the published version of the manuscript.

Funding

This research received no external funding

Conflicts of Interest

The authors declare no conflict of interest.

Abbreviations

C h the cost of the produced useful heating by the CCHP system (unit cost for heating) (€/MWh(th))
C O P a   the coefficient of performance of the heat driven absorption chiller (-)
C c the cost of the produced useful cooling by the CCHP system (unit cost for cooling) (€/MWh(co))
C e the electricity retail price (€/MWh(el))
C g the natural gas retail price (€/MWh(gas))
C m the CCHP maintenance cost (€/MWh(el))
C T , h the annual total heating cost (€/m2/y)
C T , c the annual total cooling cost (€/m2/y)
E h the electricity produced by the cogeneration during heating periods (kWh(el))
E c the electricity produced by the cogeneration during cooling periods (kWh(el))
j the number of the day of the year ( j = 1 ,   2 ,   365 ) (-)
G h the annual natural gas consumption by the cogeneration system to cover the required greenhouse heating load (kWh(th))
G c the annual natural gas consumption by the cogeneration system to cover the required greenhouse cooling load (kWh(co))
Q h , j the greenhouse daily heating load (kWh(th)/m2/d)
Q h the annual heating requirements of the greenhouse (kWh(th)/m2)
Q c , j the greenhouse daily cooling load (kWh(co)/m2/d)
Q c the annual cooling requirements of the greenhouse (kWh(co)/m2)
S j the daily average solar irradiation on a horizontal surface (kW/m2)
T a , j the daily ambient air temperature (°C)
T s p the set point greenhouse temperature (the required product cultivation temperature) (°C)
U L the greenhouse effective overall heat loss coefficient (kW/m2K)
Δ T c the accepted temperature difference from set point temperature (cultivation range) (°C)
η e the CCHP electrical efficiency (-)
η t h the CCHP thermal efficiency (-)
τ 1 the transmittance of the greenhouse cover (-)
τ 2 the transmittance of the additional shadowing cover during hot days (-)
α the absorbance of the greenhouse (-)
ATAustria
BEBelgium
BGBulgaria
CCHPCombined cooling heat and power
CHPCombined heat and power
CYCyprus
CZCzech Republic
DEGermany
DKDenmark
EEEstonia
ESSpain
FIFinland
FIPFeed-in premium
FRFrance
GRGreece
HRCroatia
HUHungary
ICEInternal combustion engine
IEIreland
ITItaly
LTLithuania
LULuxembourg
LVLatvia
NLNetherlands
POPoland
PTPortugal
RORomania
SESweden
SISlovenia
SKSlovakia
UKUnited Kingdom

Appendix A

Figure A1. Evolution of European countries energy prices and spark ratio during 2008–2018.
Energies 13 03373 g0a1aEnergies 13 03373 g0a1bEnergies 13 03373 g0a1cEnergies 13 03373 g0a1dEnergies 13 03373 g0a1e
Figure A2. Seasonal representation of energy requirements and variation of energy cost in European countries during 2008–2018.
Energies 13 03373 g0a2aEnergies 13 03373 g0a2bEnergies 13 03373 g0a2cEnergies 13 03373 g0a2dEnergies 13 03373 g0a2e

References

  1. Bibbiani, C.; Fantozzi, F.; Gargari, C.; Campiotti, C.A.; Schettini, E.; Vox, G. Wood Biomass as Sustainable Energy for Greenhouses Heating in Italy. Agric. Agric. Sci Procedia 2016, 8, 637–645. [Google Scholar] [CrossRef]
  2. European Comission. EIP-AGRI Focus Group Circular Horticulture. Final Report. February 2019, pp. 1–36. Available online: https://ec.europa.eu/eip/agriculture/sites/agri-eip/files/eip-agri_fg_circular_horticulture_final_report_2019_en.pdf (accessed on 1 May 2020).
  3. Fernández, J.A.; Orsini, F.; Baeza, E.; Oztekin, G.B.; Muñoz, P.; Contreras, J.; Montero, J.I. Current trends in protected cultivation in Mediterranean climates. Eur. J. Hortic. Sci. 2018, 83, 294–305. [Google Scholar] [CrossRef]
  4. Ahamed, M.S.; Guo, H.; Taylor, L.; Tanino, K. Heating demand and economic feasibility analysis for year-round vegetable production in Canadian Prairies greenhouses. Inform. Process. Agric. 2019, 6, 81–90. [Google Scholar] [CrossRef]
  5. Marsh, L.S.; Singh, S. Economics of greenhouse heating with a mine air-assisted heat pump. Trans. Am. Soc. Agric. Eng. 1994, 37, 1959–1963. [Google Scholar] [CrossRef] [Green Version]
  6. Kantor Management Consultants & Embassy of the Kingdom of The Netherlands. Greece-Market Special. Developments in the Greek Horticulture Sector: Greenhouses and Agro Logistics; Rijksdienst voor Ondernemend: The Hague, The Netherlands, 2015. [Google Scholar]
  7. Santamouris, M.; Argiriou, A.; Vallindras, M. Design and operation of a low energy consumption passive solar agricultural greenhouse. Sol. Energy 1994, 52, 371–378. [Google Scholar] [CrossRef]
  8. Sethi, V.P.; Sharma, S.K. Survey and evaluation of heating technologies for worldwide agricultural greenhouse applications. Sol. Energy 2008, 82, 832–859. [Google Scholar] [CrossRef]
  9. Adaro, J.A.; Galimberti, P.D.; Lema, A.I.; Fasulo, A.; Barral, J.R. Geothermal contribution to greenhouse heating. Appl. Energy 1999, 64, 241–249. [Google Scholar] [CrossRef]
  10. Vourdoubas, J. Overview of Heating Greenhouses with Renewable Energy Sources a Case Study in Crete- Greece. J. Agric. Environ. Sci. 2015, 4, 70–76. [Google Scholar] [CrossRef] [Green Version]
  11. Compernolle, T.; Witters, N.; Van Passel, S.; Thewys, T. Analyzing a self-managed CHP system for greenhouse cultivation as a profitable way to reduce CO2-emissions. Energy 2011, 36, 1940–1947. [Google Scholar] [CrossRef]
  12. Tataraki, K.G.; Kavvadias, K.C.; Maroulis, Z.B. Combined cooling heating and power systems in greenhouses. Grassroots and retrofit design. Energy 2019, 189, 116283. [Google Scholar] [CrossRef]
  13. Singh, S.; Mittal, J.P.; Singh, M.P.; Bakhshi, R. Energy-use patterns under various farming systems in Punjab. Appl. Energy 1988, 30, 261–268. [Google Scholar] [CrossRef]
  14. Esengun, K.; Erdal, G.; Gündüz, O.; Erdal, H. An economic analysis and energy use in stake-tomato production in Tokat province of Turkey. Renew. Energy 2007, 32, 1873–1881. [Google Scholar] [CrossRef]
  15. Singh, S.; Singh, S.; Pannu, C.J.S.; Singh, J. Energy input and yield relations for wheat in different agro-climatic zones of the Punjab. Appl. Energy 1999, 63, 287–298. [Google Scholar] [CrossRef]
  16. Yilmaz, I.; Akcaoz, H.; Ozkan, B. An analysis of energy use and input costs for cotton production in Turkey. Renew. Energy 2005, 30, 145–155. [Google Scholar] [CrossRef]
  17. Çetin, B.; Vardar, A. An economic analysis of energy requirements and input costs for tomato production in Turkey. Renew. Energy 2008, 33, 428–433. [Google Scholar] [CrossRef]
  18. Singh, G.; Singh, S.; Singh, J. Optimization of energy inputs for wheat crop in Punjab. Energy Convers. Manag. 2004, 45, 453–465. [Google Scholar] [CrossRef]
  19. Ozkan, B.; Kurklu, A.; Akcaoz, H. An input-output energy analysis in greenhouse vegetable production: A case study for Antalya region of Turkey. Biomass Bioenergy 2004, 26, 89–95. [Google Scholar] [CrossRef]
  20. Mohammadi, A.; Omid, M. Economical analysis and relation between energy inputs and yield of greenhouse cucumber production in Iran. App. Energy 2010, 87, 191–196. [Google Scholar] [CrossRef]
  21. Ozkan, B.; Fert, C.; Karadeniz, C.F. Energy and cost analysis for greenhouse and open-field grape production. Energy 2007, 32, 1500–1504. [Google Scholar] [CrossRef]
  22. De Felice, M.; Kavvadias, K. ERA-NUTS: Time-series based on C3S ERA5 for European Regions (Version 1980–2018) Zenodo. 2019. Available online: http://doi.org/10.5281/zenodo.2650191 (accessed on 1 April 2020).
  23. Eurostat. Statistics Explained. Natural Gas Prices Statistics. Available online: https://ec.europa.eu/eurostat/statistics-explained/index.php/Natural_gas_price_statistics (accessed on 12 March 2020).
  24. Eurostat. Statistics Explained. Electricity Prices Statistics. Available online: https://ec.europa.eu/eurostat/statistics-explained/index.php/Electricity_price_statistics (accessed on 12 March 2020).
  25. European Cogeneration Roadmap, Cogeneration Observatory and Dissemination Europe 2-CODE 2. Belgium. January 2015. Available online: https://ec.europa.eu/energy/intelligent/projects/en/projects/code2 (accessed on 12 March 2020).
  26. Moreton, O.R.; Rowley, P.N. The feasibility of biomass CHP as an energy and CO2source for commercial glasshouses. Appl. Energy 2012, 96, 339–346. [Google Scholar] [CrossRef] [Green Version]
  27. American Society of Agricultural and Biological Engineers. Heating, Ventilating and Cooling Greenhouses; American Society of Agricultural and Biological Engineers: St. Joseph, MI, USA, 2008. [Google Scholar]
  28. Kittas, C.; Katsoulas, N.; Bartzanas, T. Energy needs and energy saving in Mediterranean greenhouses. Acta Hortic. 2014, 1054, 25–30. [Google Scholar] [CrossRef]
  29. Kittas, C.; Katsoulas, N.; Bartzanas, T. Structures: Design, technology and climate control, Part II. In Good Agricultural Practices for Greenhouse Vegetable Production in the South East European Countries for Greenhouse Vegetable; Food and Agriculture Organization of the United Nations: Rome, Italy, 2017; pp. 29–51. [Google Scholar]
  30. Agrawal, V. Climate and Soil Requirements for Vegetable Crops, Chapter 9. In Vegetable Crops at a Glance; Scientific Publishers: New Pali Road, Jodhpur, India, 2018. [Google Scholar]
  31. Wu, D.W.; Wang, R.Z. Combined cooling, heating and power: A review. Prog. Energy Combust. Sci. 2006, 32, 459–495. [Google Scholar] [CrossRef]
  32. Jradi, M.; Riffat, S. Tri-generation systems: Energy policies, prime movers, cooling technologies, configurations and operation strategies. Renew. Sustain. Energy Rev. 2014, 32, 396–415. [Google Scholar] [CrossRef]
  33. U.S. Energy Information Administration, U.S. Department of Energy. Distrib-Uted Generation and Combined Heat & Power System Characteristics and Costs in the Buildings Sector; U.S. Department of Energy: Washington, DC, USA, 2017; Report.
  34. ILF Consulting Engineers Austria GmbH, and AIT Austrian Institute of Technology GmbH. European Commission. Long Term (2050) Projections of Techno-Economic Performance of Large-Scale Heating and Cooling in the E.U.; Report 2017; Publications Office of the European Union: Luxembourg, 2017. [Google Scholar] [CrossRef]
  35. García, J.L.; De La Plaza, S.; Navas, L.M.; Benavente, R.M.; Luna, L. Evaluation of the feasibility of alternative energy sources for greenhouse heating. J. Agric. Eng. Res. 1998, 69, 107–114. [Google Scholar] [CrossRef]
Figure 1. Basic climatic characteristics of European countries (average values for the 2008–2018 time period).
Energies 13 03373 g001
Figure 2. Average, minimum, and maximum energy prices and spark ratios of European countries (values for the 2008–2018 time period).
Energies 13 03373 g002
Figure 3. Information flow diagram of the proposed mathematical model.
Energies 13 03373 g003
Figure 4. Summarized results of all EU countries. Annual heating and cooling requirements and number of days with heating, cooling, and no energy requirements. Average values for the 2008–2018 period.
Energies 13 03373 g004
Figure 5. Average unit cost for heating and cooling with combined cooling heat and power (CCHP) (average values for the 2008–2018 period).
Energies 13 03373 g005
Figure 6. Average annual total cost for heating and cooling per unit area with CCHP (average annual values during the 2008–2018 period).
Energies 13 03373 g006
Figure 7. Correlation between average annual energy requirements and energy cost with the use of CCHP (average values for the 2008–2018 period).
Energies 13 03373 g007
Figure 8. Evolution of seasonal greenhouse energy cost in Estonia during the 2008–2018 period. Summarized results of (a) climatic conditions, (b) evolution of energy prices, (c) energy requirements, and (d) evolution of energy cost.
Energies 13 03373 g008
Figure 9. Evolution of seasonal greenhouse energy cost in the Netherlands during the 2008–2018 period. Summarized results of (a) climatic conditions, (b) evolution of energy prices, (c) energy requirements, and (d) evolution of energy cost.
Energies 13 03373 g009
Figure 10. Evolution of seasonal greenhouse energy cost in Italy during the 2008–2018 period. Summarized results of (a) climatic conditions, (b) evolution of energy prices, (c) energy requirements, and (d) evolution of energy cost.
Energies 13 03373 g010
Table 1. Summary of technical data used in the mathematical model.
Technical Data
Greenhouse Characteristics
Overall heat loss coefficient U L 9.0W/m2K
Transmittance of the greenhouse cover τ 1 0.50-
Transmittance of greenhouse additional shadowing cover during hot days τ 2 0.10-
Absorbance of the greenhouse α 0.40-
Product Characteristics
Required product cultivation temperature T s p 20.0°C
Accepted cultivation range Δ T c ±5.0°C
Equipment Characteristics
Cogeneration electrical efficiency η e 0.35-
Cogeneration thermal efficiency η t h 0.50-
Coefficient of performance of the heat driven absorption chiller C O P a 0.70-
Economic Characteristics
Cogeneration maintenance cost C m 10€/MWh(el)
Table 2. Comparative representation of the annual energy greenhouse needs in the present study vs García et al. [35].
CountryHeating Needs in This Work (kWh/m2/y)Heating Needs in García et al. (kWh/m2/y)
United Kingdom335444 (Bedford)
Netherlands325424 (De Bilt)
Germany402453 (Braunschweig)
Italy203406 (Milano)
France268239 (Montpellier)
Spain15888 (Almeria)
Greece134198 (Aliartos)

