Abstract
In this study, various mixing and evaporation modeling assumptions typically considered for large-eddy simulation (LES) of the well-established Engine Combustion Network (ECN) Spray A are explored. A coupling between LES and Lagrangian particle tracking (LPT) is employed to simulate liquid n-dodecane spray injection into hot inert gaseous environment, wherein Lagrangian droplets are introduced from a small cylindrical injection volume while larger length scales within the nozzle diameter are resolved. This LES/LPT approach involves various modeling assumptions concerning the unresolved near-nozzle region, droplet breakup, and LES subgrid scales (SGS) in which their impact on common spray metrics is usually left unexplored despite frequent utilization. Here, multi-parametric analysis is performed on the effects of (i) cylindrical injection volume dimensions, (ii) secondary breakup model, particularly Kelvin–Helmholtz Rayleigh–Taylor (KHRT) against a no-breakup model approach, and (iii) LES SGS models, particularly Smagorinsky and one-equation models against implicit LES. The analysis indicates the following findings: (i) global spray characteristics are sensitive to radial dimension of the cylindrical injection volume, (ii) the no-breakup model approach performs equally well, in terms of spray penetration and mixture formation, compared with KHRT, and (iii) the no-breakup model is generally insensitive to the chosen SGS model for the utilized grid resolution.
1. Introduction
Multiphase flow mixing and evaporation phenomena play pivotal roles in various industrial and energy-related applications, such as fuel spray in engines of stationary energy and transportation sectors. Fuel spray is described by the injection of a high pressure and momentum liquid fuel into ambient gas. Mixing of the liquid fuel and ambient gas under engine-relevant conditions with the presence of turbulence is an intricate process, which requires specific considerations and simplifying assumptions in numerical simulations. In this study, different modeling assumptions with relevance to fuel spray mixing and evaporation in large-eddy simulation (LES) within the context of compression ignition (CI) engines are examined.
Mixing and evaporation process in fuel sprays has been the subject of studies since several decades ago, for instance c.f. [1,2,3,4]. These fundamental studies have described the details of multi-stage mixing, droplet transport, atomization, and evaporation of fuel sprays. In a typical fuel spray, the liquid core has similar properties to the potential core of a single-phase jet [5,6,7,8] and it is under a strong shear stress. This strong shear results in primary breakup or atomization, leading to the formation of irregular liquid ligaments along the surface of the liquid core. The rate of primary breakup tends to control the liquid core length, which is a function of the nozzle diameter (), and the spray-to-ambient relative density [8]. In engine-relevant fuel sprays, such as diesel spray, an elevated ambient gas density or pressure results into a shorter liquid core and a rapid atomization process [9]. After the onset of primary atomization, the resulting droplets along the surface of the liquid core are intrinsically unstable and may be subject to secondary breakup due to aerodynamic forces. The breakup pattern is governed by droplet Weber number () defined as , where , , , and denote the gas density, droplet diameter, droplet-to-gas slip velocity, and droplet surface tension, respectively. During the secondary breakup phase, droplets breakup until reaching a stable below 12 [10,11], after which they start to evaporate.
In droplet-laden (multiphase) fuel sprays, droplet atomization process plays an important role in mixing and evaporation. However, from the numerical modeling perspective, resolving near-nozzle length scales is challenging and there is insufficient experimental data available. We note that there have been some attempts to numerically resolve the primary breakup of dense sprays using e.g., the level-set method (LSM) [12] or volume of fluid (VoF) [13,14,15,16] approach, in addition to further strategies reviewed in [17]. However, in computationally expensive simulations such as reactive fuel sprays or even evaporative sprays with relatively long penetration lengths, it is a common practice to model the dispersed phase in the Lagrangian framework without resolving the liquid core and primary breakup. In these simulations, the gaseous phase is resolved in the traditional Eulerian framework. In particular for LES, a coupling between the Lagrangian particle tracking (LPT) and LES is usually utilized to model the atomized Lagrangian fuel droplets which lie in the subgrid range and to take their interactions with the surrounding carrier phase into account [18,19]. In addition, to avoid extreme computational costs, one common approach is to implicitly consider the primary breakup by introducing Lagrangian droplets with particular injection parameters and size distributions into a small cylindrical injection volume which is larger than actual fuel nozzle dimensions [20,21].
According to literature, LES/LPT approach has been studied in non-reacting fuel sprays by several researchers, e.g., [22,23,24,25], wherein droplet secondary breakup model was utilized under various spray and turbulence conditions. Moreover, limitations of the LPT approach in specific spray applications were addressed in [26]. Additionally, Vuorinen et al. [27,28,29,30] performed systematic studies using implicit LES (ILES) to model subgrid scales (SGS) for various droplet parameters, wherein LPT computational parcels were introduced into the quiescent gas through an injection disk area (not a cylindrical volume). Particularly, they demonstrated significant effects of droplet dispersion in terms of Sauter mean diameter (SMD), volume fraction, and Stokes number () on the spray shape, mixing quality, and global flow characteristics, compared to single phase jets. Additionally, in [31], the influence of droplets breakup due to the resonance were taken into account. In high ambient density conditions, Kaario et al. [32,33] studied fuel spray behavior using LES/LPT with a cylindrical injection volume approach and one-equation eddy diffusivity SGS model (K-model), concluding that SGS effects on particle dispersion are small. Furthermore, Kaario et al. [20] investigated mixing and evaporation of an engine-related selective catalytic reduction (SCR) system, modeled using LPT and a hybrid methodology using LES and Reynolds-averaged Navier-Stokes (RANS) models to account for spray-wall interactions. However, these numerical studies have investigated arbitrary or specific system configurations due to the lack of a unified benchmark data.
The Engine Combustion Network (ECN) collaboration provides well-documented baseline experimental/computational data for model validations in engine-related research. With relevance to this study, in ECN Spray A, a liquid n-dodecane is injected through a nozzle hole of diameter at high injection pressure (150 ) into hot quiescent ambient gas of temperature and density . Under non-reacting conditions and by assuming an inert ambient, several numerical studies utilized the LES/LPT approach against the ECN Spray A data. For instance, Wehrfritz et al. [34] and Xue et al. [35] investigated different secondary breakup models, including the Kelvin-Helmholtz Rayleigh-Taylor (KHRT) and the enhanced Taylor analogy breakup (ETAB) models, and different SGS models, including Smagorinsky, K-model, and ILES, respectively, for various grid resolutions. Tsang et al. [36] developed and validated a model that predicts the spray sub-grid dispersion velocity. Senecal et al. [37] additionally studied LES multi-realization uncertainties on global and local spray characteristics. Moreover, uncertainties in fuel properties, ambient conditions, and injection parameters on spray-related objective functions were investigated via the global sensitivity analysis method by Pei et al. [38]. Further studies with relevance to spray modeling parameter sensitivity can be revised in [39,40]. More recently, Kaario et al. [21] investigated fuel properties effects on the liquid spray formation by replacing n-dodecane in Spray A with other fuels. Seeking a more accurate modeling approach, Koukouvinis et al. [41] employed advanced thermophysical closure models to account for capturing complex details of the flow. Following a similar pathway, Matheis and Hickel [42] and Yang et al. [43] both accounted for real gas thermodynamics to investigate the co-existence of transcritical effects in the spray, while showing that surface tension effects still persist in the sub-critical regime. Under reacting conditions, various works employed different combustion models along with the LES/LPT approach to investigate ignition-related phenomena such as flame structure and stabilization [44,45,46,47,48,49,50], radiative heat transfer [51], as well as ignition modes and dynamics [52]. Additionally in [53,54,55,56,57], the cylindrical injection volume filtering concept was utilized together with the KHRT and ILES models, as discussed in [34].
Besides the aforementioned numerical studies, several experiments with relevance to the ECN Spray A conditions were conducted. For instance, the works by Pickett et al. [58], Payri et al. [59], and Kastengren et al. [60] delivered quantifications of various global spray metrics in the near-nozzle region using optical visualization techniques. Focusing on the internal nozzle flow effects, Daly et al. [61] and Payri et al. [62] considered, respectively, the nozzle temperature and geometry as design parameters. Also, Agarwal and Trujillo [63] demonstrated the effects of nozzle imperfection on generating stronger radial velocity components with shorter liquid core and faster primary atomization. With relevance to the high temperature and pressure environment in Spray A, Falgout et al. [64] reported evidences on the existence of supercritical effects in the mixing layer, thereby supporting the hypothesis which was previously investigated in [65,66,67] and theoretically established in [68,69]. On the other hand, recent observations by Crua at al. [70] demonstrated that droplets surface tension is yet clearly present, which is consistent with numerical observations in [42,43] as discussed above, hence the existence of spray classical atomization and evaporation processes. Additionally, angular dispersion effects, in terms of spreading angle variation, on mixing and evaporation processes were investigated by Jung et al. [71]. Spray shape and flame structure under reacting conditions were also discussed by several authors such as [72,73,74].
In the present numerical study utilizing LES, and following the baseline operating conditions of the ECN Spray A, we shift our attention towards some of the modeling assumptions that have been extensively utilized in recent numerical simulations while their details have never been elaborated. In particular, motivations of the present research are as follows. First, the volume filtering approach has been frequently utilized in literature to implicitly mimic the primary breakup in the near-nozzle region, but topological details of the cylindrical injection volume and the spray sensitivity to variations of the volume dimensions is missing. Second, although utilization of the no-breakup model approach for droplets secondary breakup has been reported in literature, a comparison between a classical breakup model (such as KHRT) and the no-breakup model on the spray liquid, vapor penetration and droplet evaporation has not been performed. Third, a study on the subgrid scale modeling effects when the no-breakup model approach is employed is absent from literature. Accordingly, the overarching goal of this study is to perform a systematic analysis to understand the sensitivity of simulations to such modeling parameter variations for the non-reactive baseline ECN Spray A. Therefore, the main objectives of the present study are to: (i) investigate details of the near-nozzle modeling for evaporative ECN Spray A, using the injection volume concept, and report the effect of cylindrical injection volume dimension variations on the spray characteristics, (ii) assess the importance of droplet secondary breakup model, by comparing the no-breakup model against the well-established KHRT model, and (iii) study the effect of SGS modeling (Smagorinsky, K-model, ILES) on the mixture formation, when the droplet no-breakup model is utilized.
2. Methodology
2.1. Gas Phase Governing Equations
Turbulent gaseous flow is described using the compressible Navier-Stokes equations in the Eulerian framework. The Favre filtered LES formulations for conservation of mass, species mass fractions, momentum, and energy are given as,
where , , p, , , and denote density, velocity component in direction, pressure, chemical specie k mass fraction, sensible enthalpy, and conventional viscous stress tensor assuming Stokes’ hypothesis for isotropic Newtonian fluid, respectively. The overbar and tilde (∼) are filtering operators denoting unweighted and density-weighted ensemble averages, respectively. Unity Schmidt number is assumed for all species, hence the mass diffusivity , wherein denotes the viscous diffusion rate of the gas mixture. The total enthalpy is defined as the summation of and specific kinetic energy. The filtered source terms , , , and correspond to coupling between liquid and gaseous phases with respect to mass, momentum, species and energy, respectively.
Equations (1)–(4) together with the thermodynamic and caloric state equations for ideal gas, are numerically solved using the finite volume method (FVM) within the OpenFOAM-6 framework [75]. Temporal advancing is based on a transient, second order implicit scheme. The coupling between pressure and momentum is resolved via the reacting PISO algorithm [76]. Pressure and diffusion terms are discretized by a second-order central scheme, whereas the interpolation of the convective flux terms are relevant to the subgrid terms implementation in LES, i.e., turbulence SGS modeling, which is further discussed in the following section. Further details on the source terms are provided in Spray Modeling section (Section 2.3).
2.2. Subgrid Scale Modeling
The present study employs three different closure models, namely the Smagorinsky model, one-equation eddy diffusivity model (K-model) and ILES model, for the unresolved turbulent subgrid scales. The residual SGS term for a quantity is defined as , which is incorporated for each mentioned variable in Equations (2)–(4). A brief discussion of the implemented SGS models is given in the following.
2.2.1. Smagorinsky Model
The Smagorinsky model [77] is one of the most popular SGS models in turbulent flows. The residual SGS stress tensor in the momentum conservation equation (Equation (2)) is decomposed into isotropic and deviatoric parts,
with denoting the SGS eddy diffusion coefficient, whereas ) is the resolved strain rate tensor. The approximation in Equation (5) is based on the eddy diffusivity assumption, postulating a linear relationship between the SGS shear stress and . The subgrid scale kinetic energy, , is defined as:
In OpenFOAM, the subgrid scale diffusivity is computed as
where is a default value for the model constant, and is the filter width, computed as the cubic root of the cell volume, which is a suitable choice considering the isotropy of the utilized hexahedral mesh. In Smagorinsky model, the SGS kinetic energy is computed by assuming a balance between the SGS energy production and dissipation, i.e.,
where (:) denotes the double dot product, and by default. The convective fluxes of the SGS terms as well as the resolved terms are herein discretized by a second-order central scheme.
2.2.2. One-Equation Eddy Diffusivity Model (K-Model)
As the name suggests, the present model utilizes the eddy diffusivity approximation, similar to Smagorinsky model, and the SGS stress tensor is evaluated from Equation (5). The difference between Smagorinsky model and the one-equation eddy diffusivity model (K-model) is that while the Smagorinsky model assumes a local equilibrium between the SGS energy production and dissipation to compute , the K-model solves a transport equation for from which it accounts for the SGS energy production, dissipation, and diffusion [78]. The transport equation for is given as
wherein the terms on the left-hand side denote temporal and spatial (convection) variations, and those on the right-hand side denote diffusion, production, and dissipation, respectively (from left to right).
We note that as in the Smagorinsky model, a second-order central difference scheme is utilized herein for numerical discretization of the convective flux terms, including the resolved and SGS terms, in addition to the fluxes emerging from the present model.
2.2.3. Implicit Model
As previously indicated, both the Smagorinsky and K-models introduce an additional dissipation term to the system via explicit SGS diffusivity . However, in the present implicit model, such a dissipative contribution is implicitly introduced and it is controlled locally by choosing a dissipative numerical scheme for discretization of convection terms. Following the previous works on spray A [34,53,54,55,56,57], ILES is implemented through a non-linear flux limiter termed as Gamma scheme [79].
The control parameter of the flux limiter is set to for discretization of the momentum convection, whereas a parameter value of unity is considered for scalars convection to ensure a bounded total variation diminishing (TVD) solution.
2.3. Spray Modeling
Diesel engine sprays are characterized by a short liquid core and rapid atomization [9]. Hence, it is more efficient to treat the dispersed liquid phase in the Lagrangian framework, without resolving the length scales below the nozzle diameter in the near-nozzle region. Moreover, the dilute suspension feature of liquid droplets allows for a two-way coupling between the two phases without inter-particle collisions [80]. From a modeling perspective, the computational LPT parcels (single phase n-dodecane) are injected from a cylindrical volume geometry, as depicted in Figure 1, with an initial droplet size distribution (IDSD) to implicitly consider the droplets after primary atomization. The injection cylindrical volume is detached few millimeters from the upstream wall of the ECN vessel, hence allowing an upstream hot ambient entrainment. In addition, the flow in the under-resolved near-nozzle region (maximum cells/injection cylinder diameter ) will become 3-dimensional downstream of the nozzle, with emerging vortical structures that allow further air entrainment into the spray. By considering such an injection volume approach, the near nozzle singularity is avoided with a computational gain.
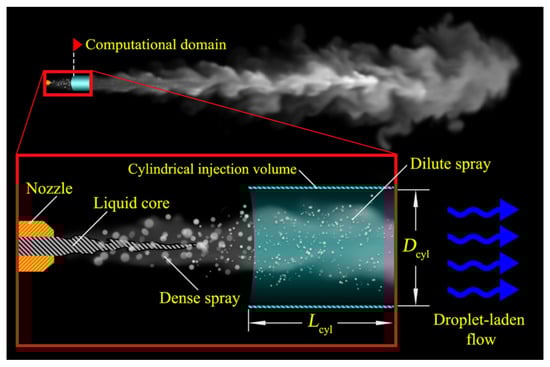
Figure 1.
Artistic illustration of the cylindrical injection volume concept.
The injection conditions, in terms of pressure and mass rate profile, for ECN Spray A are assumed to hold in the injection volume. The Eulerian source terms and from Equations (1) and (3) are computed from the droplet evaporation model [81] utilizing the ideal gas assumption. The momentum source term (Equation (2)) is evaluated from sphere drag forces with a coefficient based on [82]. The energy source term (Equation (4)) is based on the Ranz–Marshall correlation for heat transfer [83].
It is worth noting that the employed injection volume approach models a dilute spray and it is considered as the injection source. Moreover, it assumes that the nozzle is located within a fixed distance after the dense spray region, which is rather short under Spray A conditions. Therefore, it is expected that altering the location of the injection volume does not affect the global spray behavior, although it could have a significant upstream impact depending on the detachment distance from walls.
Secondary Breakup Modeling
The present study employs two different models for droplet secondary breakup, namely the KHRT model and the no-breakup model. The KHRT model is a hybrid approach comprising the Kelvin-Helmholtz (KH) wave model and the Rayleigh–Taylor (RT) accelerative instability normal to the droplet surface. The KH mechanism considers droplets as liquid jets that suffer stripping after being injected into a gaseous environment, whereas the RT mechanism is driven by the density variation along normal directions of the liquid-gas interface. Considering the KH model, on the basis of the perturbation growth rate and the wavelength corresponding to the fastest , a characteristic breakup time can be defined as
where r denotes the radius of initial droplets. The stable diameter is then computed as . The KH model constants and control the breakup time and wavelength, respectively, and the choice of such parameter values is addressed later. The size of injected droplets under ECN Spray A conditions is typically within few micro-meters, thereby, the corresponding KH wavelengths for the droplets surface waves are separated from grid scales, which are much larger (e.g., in this study). Considering the RT model, assuming a linear disturbance growth, a growth rate and wavelength can be determined. The RT breakup time is then obtained by the multiplicative inverse of the growth rate, i.e., , where is a correction factor to delay breakup under certain conditions. Numerically, the initial droplet size is modeled within the size range of = and . Such a droplet size range is chosen large enough to avoid immediate evaporation of the droplets. The IDSD is modeled according to the stochastic Rosin–Rammler distribution function [84].
Another approach to model the near nozzle region is the no-breakup model, which assumes that the droplets have already undergone primary and secondary breakup, and they are injected from with a constant initial droplet size. In fact, utilization of the no-breakup model idea originates from the observation in [34] for Spray A conditions, wherein droplets were noted to undergo breakup only up till distance from the nozzle exit, after which becomes too small for droplet breakup to take place. Moreover, numerical evidence reported that SMD of the droplets reduces rapidly till below 1 [34,85], and a similar observation was experimentally noted in [86,87] as well. It is worth noting that these observations could be clarified in the light of experimental [64,65,66,67,70] and numerical [42,43] evidences showing the co-existence of transcritical and supercritical states in Spray A conditions in which they affect the spray atomization process. Following the previous works by Kaario et al. [20,21], the droplets are herein injected from with a constant initial size for all droplets which corresponds to a stable Weber number (), hence no further breakup, and only evaporation is considered.
In both models (KHRT and no-breakup), the implementation of the LPT method in OpenFOAM incorporates the parcel approach, which groups physically similar droplets into a parcel. Therefore, such an algorithm reduces the computational cost, efficiently. The total number of injected parcels (about one million for an injection duration of ) is chosen to correspond to an average parcel mass of and a total injected mass of which follows injection rate recommendations by ECN [88], while a minimum parcel mass of is assumed. The parcels are randomly distributed within an injection cylinder of dimensions and and a half spray opening angle of . Such a chosen value for is based on numerical testing which revealed, as demonstrated in Appendix A, that global spray metrics are rather insensitive to small opening angle variations.
3. Numerical Setup
In the present work, simulations of liquid n-dodecane spray injection into an inert quiescent gaseous environment under the ECN Spray A operating conditions as noted in Table 1 are carried out. The computational domain, depicted in Figure 2, represents a circular cylinder of volume equivalent to the combustion vessel utilized for the ECN Spray A standard experiments by Sandia [9]. The domain is discretized into a background hexahedral mesh with a cell size (R1). Two additional spatially refined regions are considered, the coarse region with a grid size of 250 (R2), and the dense region with a resolution (R3).

Table 1.
Operating conditions based on ECN Spray A.
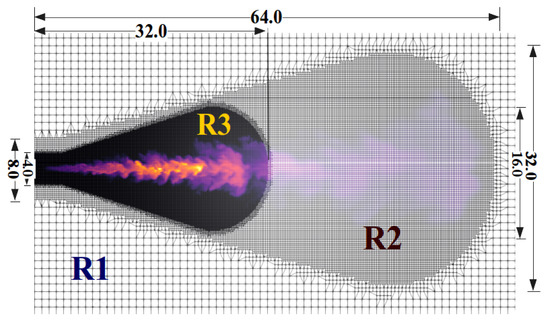
Figure 2.
Computational domain of the studied LES (dimensions in ). Refinement layers are indicated by R1, R2, R3 which correspond to cell sizes of 1000, 250, respectively.
Three main studies are considered herein. The first study uses KHRT secondary breakup model together with ILES to investigate the sensitivity of the near-nozzle modeling using the injection cylinder concept. In particular, five test cases are considered to vary the axial and radial dimensions of the injection cylinder. In the first three cases, the cylinder diameter () is varied while holding a constant volume (). In the remaining two cases, the cylinder length is altered with a constant diameter (). In the second study, the no-breakup model is compared to the KHRT secondary breakup model, with a fixed and using ILES. Moreover, two cases investigate the variation of KHRT characteristic breakup time (), with the model constants presented in (Table 2) to show the possible tunability of such parameters for the spray validation. The third study utilizes the no-breakup approach together with a fixed , but varying the SGS model between ILES, Smagorinsky, and K-model. A summary of the considered cases in these three studies are listed in Table 3.
Table 2.
KHRT model constants.
Table 3.
Summary of the large-eddy simulation (LES) test cases considered in the present work. Study-I investigates the cylindrical injection volume. Study-II investigates the droplets secondary breakup and assess the no-breakup model. Study-III investigates subgrid scale (SGS) models when no-breakup model is used. Most right column states the radial amount of cells within .
It is worth mentioning two important notes. First, the KH model constant in Table 2, which controls the stripping rate, does not hold a recommended value by default and several works have tuned this parameter according to the problem setup [89,90]. However, in diesel sprays, the value has been extensively used [34,91,92,93,94], hence the KHRT model utilizing such parameter value is herein referred to as the default KHRT model. Second, parameter values of in Table 3, which correspond to cylinder dimensions and , are selected based on the authors’ preference. However, these selected values are relevant to the a priori knowledge of the spatial information on primary breakup and droplets formation. The ratio in the table represents the number of grid cells within .
All the simulations are carried out for evaporative sprays under non-reacting conditions for simulation time. In the present numerical implementation, liquid penetration length is defined as the maximal axial distance to the location of % of the liquid volume fraction averaged over a volume of 1 characteristic length. Similarly, vapor penetration length denotes the axial distance from the nozzle to where fuel mass fraction is %. Validations for liquid and vapor penetration lengths are realized by comparing against the available experimental data for the ECN Spray A by Sandia [95,96,97], utilizing high-speed imaging techniques such as Mie scattering and diffused back-illumination (DBI) for the liquid length measurement, and the schlieren imaging for vapor length measurements. Experimental data utilized for fuel mixing validations are reported in [98,99] wherein Rayleigh scattering technique is employed.
4. Results and Discussion
4.1. Study-I—Cylindrical Injection Volume Dimensions
The first study investigated the effect of varying dimensions of the cylindrical injection volume, denoted by and , on the spray mixing and penetration lengths. As shown in Table 3, the first three cases A1–3 consider a constant with varying between and . Figure 3 depicts cutplanes of the mixture fraction (Z) field for each case at , , and (top to bottom) as well as the mean Z field averaged over the time interval of – (the bottom row). Two general observations can be noted: (1) the jet width downstream the nozzle became larger with larger , and (2) the jet penetration length became shorter with larger as can be seen from the first two time samples.
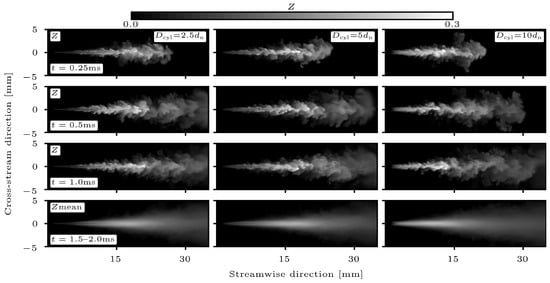
Figure 3.
Temporal evolution of mixture fraction (Z) for varied of the injection cylinder, while the total cylindrical injection volume () is fixed.
To further quantify mixing and evaporation in the mentioned sprays, liquid and vapor penetration lengths were plotted in time, and compared with the respective ECN Spray A data, as shown in Figure 4. It is observed that the introduced dimensions in cases A1 and A2 resulted in over-predicted liquid and vapor penetration lengths throughout the entire injection duration. Moreover, a slightly longer jet was noted for case A1, with the smallest , in comparison with case A2, while the liquid length was observed to be equivalent between both cases. Finally, when was enlarged to in case A3, a significant reduction in both liquid and vapor penetration lengths was observed, with a better convergence to the ECN Spray A data. Therefore, increasing was observed to reduce the jet penetration and it led to a faster liquid evaporation process.
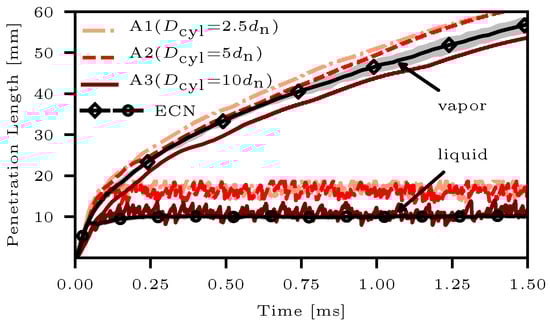
Figure 4.
Time-resolved liquid and vapor penetration for varied and constant , compared with ECN data. Filled region denotes ECN experimental uncertainty within an ensemble-average.
The previous observation, noted from Figure 3 and Figure 4, suggests the following. First, under the same injection parameters (injection pressure, , and total injected mass), the induced mass and momentum source terms, i.e., and in Equations (1) and (2), are also constant. Second, by radially extending the injection cylinder with a fixed volume, the droplets momentum distribution varies accordingly. In particular, for a larger , the axial magnitude of the momentum becomes weaker when both and are fixed. As a result, the jet axial penetration becomes shorter. The same holds for the liquid phase, where the collective mass flow rate of the droplets in the axial direction for larger and shorter results in a smaller of the cloud droplets in the axial direction, hence a shorter liquid length and a faster evaporation.
To understand the relationship between and the axial magnitude of the momentum with more details, the axial streamwise component of the mean velocity, averaged over –2 , is plotted in Figure 5 along the axial direction, normalized by , for cases A1–A3. In particular, a Favre averaging procedure is performed along the circumferential data points within a radial distance of . The spatial averaging procedure is done in both the radial and the circumferential directions, for each axial location of a grid size interval away from the nozzle. Here, as expected, a monotonic drop in the peak streamwise mean velocity is observed in the near-nozzle region (–40) from case A1, with the smallest and the highest peak, to case A3, with the largest and the smallest peak. The present plot is a clear evidence that variation of has a significant impact on the axial magnitude of the spray momentum, and thereby on the liquid and vapor penetration lengths.
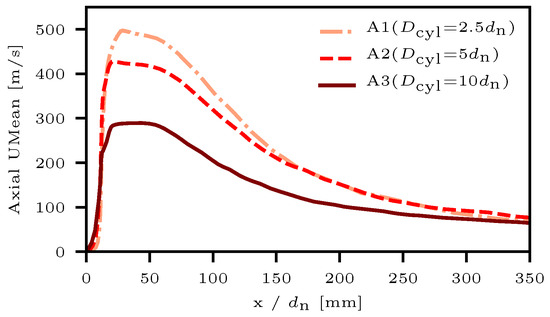
Figure 5.
Axial centerline streamwise component of the mean velocity, circumferentially averaged along the axial centerline within a radial distance of .
The previous discussion elaborates on the significant influence of the radial change of the injection cylinder dimensions with fixed on the liquid and jet penetration lengths. We complemented this study by further investigating the spray metrics when is axially varied. In particular, two additional test cases are herein considered, A4 and A5 from Table 3, where was varied between and while was fixed, hence was axially prolonged. Figure 6 depicts temporal evolution of liquid and vapor penetration lengths for cases A4 and A5, as compared to case A2 with the same and an intermediate value of . The figure shows a reduction in the jet length when was axially prolonged, while a mild reduction in the liquid length was attained. This observation can be referred to the droplet cloud distribution which became more relaxed with increased , hence a weaker momentum intensity since became distributed over a larger volume. According to the presented discussion, it is concluded that a radial change of had a stronger influence on both liquid and vapor penetration lengths when compared to the axial variation of . This behavior corresponded to the direction of change being aligned with the direction of the largest gradients in the cross stream direction, hence enhancing the mixing process, while smaller changes in scalar gradients were noted in the axial direction. Overall, varying with a fixed impacted the axial magnitude of , which played a significant role on the spray metrics.
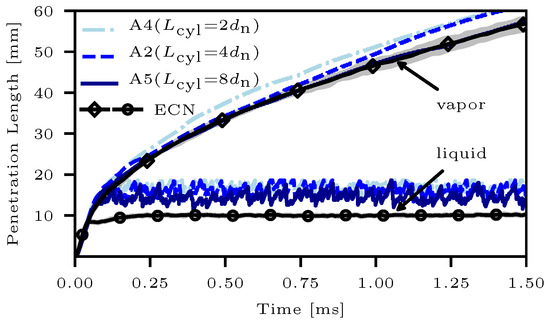
Figure 6.
Liquid and vapor penetration for cases with varied and constant , compared with Engine Combustion Network (ECN) data. Filled region denotes ECN experimental uncertainty within an ensemble-average.
According to these results, the injection volume characteristics, particularly the associated spatial parameters, play a significant role on the observed liquid length and vapor penetration. The relatively low amount of cells in the radial direction, c.f. cases A1–A3 in Table 3, leads to a resolution sensitivity in the near-nozzle region. Here, a reasonable compromise was observed with , having cells along the while avoiding the under-prediction of the vapor penetration and the relatively large jet width in the near-nozzle region with . Therefore, for the remainder of this work, the case with a constant is selected.
4.2. Study-II—Breakup Model Comparison
The second study investigated spray characteristics when the classical KHRT breakup model was utilized with two different model parameter sets (see Table 2). In addition, the KHRT model was compared to an approach without a breakup model, as described in Section 3. Accordingly, the considered test cases correspond to a slower atomization process (B1), a faster atomization process (B2), and a complete atomization (B3) of the spray.
Before progressing with analyses, a comparison of liquid droplet size distributions in the considered cases was depicted through the global SMD temporal evolution within the injection duration, Figure 7a, in addition to the probability density function (PDF) of droplets diameters at time after the start of injection (SOI), Figure 7b. First, the non-fluctuating nature of the temporal droplet size profile suggested that the corresponding PDFs did not alter their mean distributions during the entire injection duration. Second, it is observed that the average droplet sizes doubled between the three cases, particularly when moving from a complete atomization assumption in case B3 ( with constant droplet size) to the droplets breakup with a faster stripping rate assumption in case B2 (smaller value in Equation (10)) until the slower stripping rates in case B1. In addition, from the reported experimental [87,100] and numerical [101] works, the measured SMD ( sufficiently far from the nozzle) was found to be in close agreement with cases B2 and B3, compared with case B1.
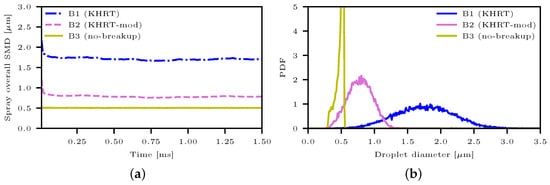
Figure 7.
(a) Temporal evolution of the global SMD of liquid droplets. (b) Probability density function (PDF) of liquid droplets diameters at time after SOI.
As a first analysis of the breakup model—or rather the droplet size—comparison, Figure 8 depicted liquid and vapor penetrations considering the respective three test cases B1, B2 and B3 in Table 3. The over-predicted spray penetration lengths could be adjusted by controlling the KHRT breakup time. In particular, a faster stripping rate implied a lower droplet and faster evaporation, with a better convergence to the ECN Spray A experimental data. More importantly, when the no-breakup model was used in case B3, the liquid penetration was observed to be similar to the modified KHRT model (case B2) and both cases presented a very good agreement with the experimental data.
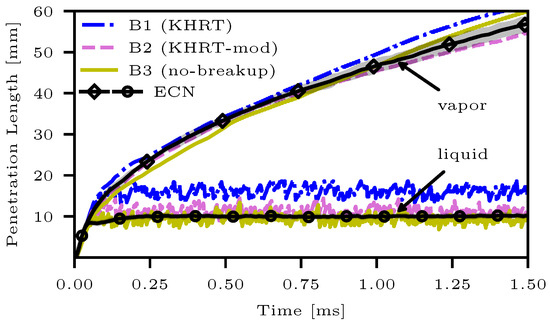
Figure 8.
Time-resolved liquid and vapor penetrations of different secondary breakup models utilizing implicit LES (ILES) and , compared with ECN data. Filled region denotes ECN experimental uncertainty within an ensemble-average.
To investigate the variation of mixture formation off the axial centerline, the radial distribution of Z at after SOI was plotted at a representative location of away from the nozzle. The field data points were interpolated and circumferentially averaged for the mentioned location. In addition, such an axial location was rather close to the liquid penetration in case B1 and thereby significant effects on the vapor phase were expected. As depicted in Figure 9, for case B1, there was a high concentration of Z near the axial centerline which then diffused away from the nozzle, i.e., an over-prediction compared with the ECN Spray A data. Such an over-prediction near the axial centerline was significantly improved in cases B2 and B3, i.e., with tuning parameter to a lower value or with the no-breakup model, respectively. Again, this observation can be justified from the droplet perspective. In particular, in case B1 with a large value, there was a slower KH stripping rate and delayed breakup, hence larger droplets as demonstrated earlier. As a result of the large droplets formation, the corresponding of the droplet cloud became larger and thereby a stronger influence on the turbulence with longer penetrations was achieved which, in turn, affected axial vapor spray concentrations. When a faster stripping rate was assumed () in case B2, the smaller obtained led to a stronger impact on the droplets cloud by turbulence, hence more fuel was diffused off the centerline with an improved mixing with ambient. The complete atomization of droplets (no-breakup model in case B3) resulted in a radial profile which was rather close to that in case B2, thereby closer mixing characteristics between both cases were recognized within this spatial region.
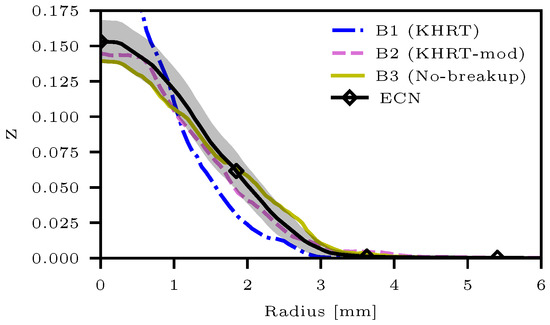
Figure 9.
Radial profile of Z at the time after SOI and axial location away from the nozzle, considering cases B1–B3 in Table 3. Data points are interpolated and circumferentially averaged for the considered axial location. Solid black lines and filled regions denote the ECN experimental counterparts of Z and its uncertainty, respectively.
After discussing the breakup model effects on spray penetrations and on radial distributions of Z, a further analysis is performed with relevance to the droplet heating and vaporization. As depicted in Figure 10, scattered data points of the temperature field are plotted in Z space for the spray region (conditioned by ) at time after SOI, and overlayed with conditional means (red curves) and standard deviations (filled regions). Two main observations can be herein noted. The first observation is the occurence of low temperature data points in case B1 within lean regions of the spray. This can be explained by the large droplet sizes, c.f. Figure 7, for case B1 with relatively long liquid lengths which implies stronger cooling effects away from the nozzle. Accordingly, having smaller droplet sizes in cases B2 and B3 would enhance mixing with the hot ambient and thereby the tendency of those lean regions to rapidly heat up, i.e., low temperature data points disappear, and approach the ambient temperature value. Interestingly, this breakup model-induced cooling effects could play an important role in reacting simulations, when most reactive zones and subsequently high temperature ignition kernels are realized within the spray periphery to identify the ignition delay. Following previous notes, the second observation is the larger Z magnitude in the case B3 with no-breakup model (smallest droplet sizes) which implies richer mixtures due to fast evaporation, hence the tendency to have a narrower Z distribution with larger droplet sizes, as noted in the case B1. It is important to mention that these observations were consistently noted afterwards throughout the injection duration, and only the data at after SOI is herein presented for brevity.

Figure 10.
Scattered data points of temperature fields in Z space for spray region (), overlayed with conditional means (red curves) and standard deviations (filled regions) for cases B1–B3 in Table 3.
It is worth acknowledging that ECN Spray A conditions may support a supercritical state [42,43,64,65,66,67,70], which is not directly accounted for in the present study. In fact, the rationale behind choosing small droplet sizes for this study is two-fold: (i) a modeling perspective, to match the ECN data on global spray metrics, and (ii) a physical perspective, particularly the transcritical/supercritical effects which indicate rapid atomization and phase change. The analysis in Study-II concludes that the no-breakup approach performs equally well in terms of predicting global Spray A metrics, compared with the KHRT model with tuned parameter. Moreover, from a numerical perspective, a no-breakup model approach offers parameter-free framework which only considers initial, constant, droplet size assumption, hence it avoids further uncertainties compared with the KHRT which require tuning various model constants. Based on that, we resume the analysis without a droplet breakup model in the next section for Study-III.
4.3. Study-III—Subgrid Scale Model Comparison
The third study investigates the spray characteristics when the SGS model is varied between ILES, Smagorinsky, and K-model, while utilizing the no-breakup model and a constant . Figure 11 depicts spray liquid and vapor penetrations for cases C1, C2 and C3 in Table 3. Overall, it is shown that all the mentioned cases with different SGS models perform equally well on predicting the liquid length, while a slight discrepancy is observed for the jet length, in comparison with the experimental data. We note that the similarity of results with different SGS approaches is related to the considered grid resolution of with which most of the important length scales are already resolved.
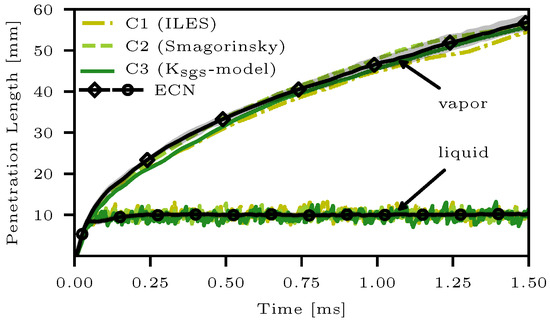
Figure 11.
Time-resolved liquid and vapor penetration for varied SGS models, using the no-breakup model and constant , compared to ECN data. Filled region denotes ECN experimental uncertainty within an ensemble-average.
In order to assess the spray mixing characteristics in the mentioned cases, first, the PDF of the mean mixture fraction was plotted in Figure 12. The sampled data considered only the spray region, which was identified by grid cell centers of value , and the PDF bins were weighted by normalized cell volumes. Here, the PDF analysis shows that the considered test cases with varied SGS models demonstrated equivalent distribution of the mean Z. This observation suggests that SGS effects were insignificant on the spray mixture characteristics since the measured quantity essentially depended on the resolved scales, and it was a function of the scalar mass transfer corresponding to droplet evaporation.
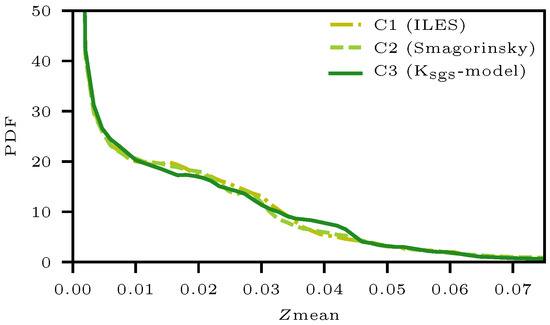
Figure 12.
PDF of mean mixture fraction for the spray region averaged over the interval – . Spray region is conditioned by .
To further analyze the spray mixing with direct relevance to SGS, statistics of the scalar dissipation rate, defined by where denotes the effective diffusivity, was examined by PDF calculations at in dense and coarse mesh resolutions of the spray, as shown in Figure 13. The dense and coarse mesh regions of the spray were conditioned by grid cells of value intersecting with those holding a cell volume below or above a threshold of , respectively. At this point, before discussing the plots, it is important to recall the following. First, the ILES model does not supplement system mass diffusivity D with any closure terms for turbulent subgrid scales (i.e., ). Second, represents a molecular mixing phenomenon which occurs mainly at the finest turbulent scales. Therefore, in contrast to kinetic energy dissipation, most of the scalar dissipation is usually modeled and not resolved [102]. Considering previous notes, it is necessary to choose a proper for computing such that the results of implicit and explicit SGS models are comparable. Accordingly, we first considered the effective diffusivity as the resolved one, i.e., , for evaluation of in explicit SGS cases (C2 and C3). The resulting PDFs utilizing the resolved D were plotted (dotted lines) and compared against the results from ILES (the yellow continuous line) in both spray mesh regions. Then, the SGS diffusivity contribution was considered in explicit models by utilizing the effective mass diffusivity as for evaluation of and the corresponding PDFs are plotted in both figures (continuous lines).
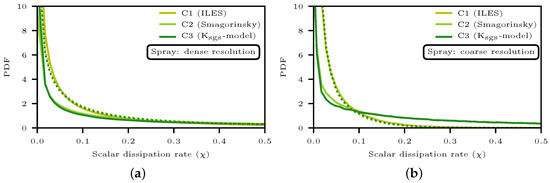
Figure 13.
PDF of scalar dissipation rate () at time for (a) the dense mesh region of the spray, and (b) the coarse region of the spray. Dense and coarse resolutions of the spray are identified as the intersection between cell indices holding and those of cell volumes below or above a threshold of , respectively. Dotted lines represent the resolved computed using , whereas continuous lines denote based on (In ILES, ).
In the dense mesh region of the spray, the corresponding PDF resulted in Figure 13a show that, first, without SGS contribution (), all the cases exhibit equivalent distribution of . In particular, since D held a similar value in the three cases and by considering the same mixture composition and thermal properties, the resulting PDFs demonstratde statistics of the magnitude of the resolved scalar gradients, , which were observed to be insensitive between the cases. Second, when accounting for SGS contributions (), it is observed that there was not a large difference between ILES and explicit models in most of the larger values, whereas notable variations were observed within a small range of low dissipation rates. Except for this narrow window of small values, this plot indicated that SGS effects on the prediction of were rather small in this dense resolution.
On the other hand, for the PDFs in the coarse mesh region of the spray, shown in Figure 13b, rather larger differences were observed when accounting for SGS contributions (). In particular, explicit SGS model cases showed emerged dissipation rates over a wide range of values. As stated earlier, scalar dissipation rate was a molecular phenomenon which occurs at the finest length scales and it was usually modeled. Additionally, SGS could be generally viewed as the sum of numerical diffusion and explicit model diffusion. Considering the existing coarse resolution, less resolved length scales impacted the value of the resolved D. Furthermore, in ILES (), the numerically diffusing schemes herein considered mainly affected the convection of the flow variables, without altering D. Thereby, in the present implementation, it was expected for scalar dissipation to be stronger in the explicit SGS models than the ones from ILES, for the specified grid resolution.
Overall, the combined observations from Figure 13a,b can be summarized as follows. First, without considering SGS effects, the resolved scalar gradients demonstrated similar statistics in all the cases. Second, in the dense resolution near the nozzle, SGS effects on the scalar dissipation rate were observed to be small. Third, in the coarse resolution further away from the nozzle, SGS contribution was noted to be larger with respect to ILES. However, such effects were located far away from the nozzle, and the corresponding variation in seemed to have an insignificant impact on the spray metrics such as vapor penetration, while the liquid length was already resolved within the dense resolution region.
In addition to the previous analysis on spray mixing characteristics, according to Khani et al. [103,104], the mixing character and efficiency seemed to be quite sensitive to the turbulent Prandtl number. In the present analysis, in explicit LES, it is noted that the turbulent Prandtl number was in the second decimal order, although the value of the resolved counterpart approached unity. Motivated by the mentioned works, a thorough analysis might be useful to conduct in the future for a further insight within the spray modeling framework.
After demonstrating SGS effects on molecular mixing and scalar dissipation rates, their effect on the dissipation of kinetic energy () is another criteria to be explored in assessing the LES overall quality. Here, spectra are demonstrated through a power spectral density (PSD) plot, depicted in Figure 14. The velocity signal, recorded for 2 simulation time with the sampling frequency , was probed at a location () away from the nozzle and 1 () off the spray centerline. The PSD was computed based on the Welch estimate [105] with modified Bartlett–Hann window [106] along multiple overlapping segments of the signal.
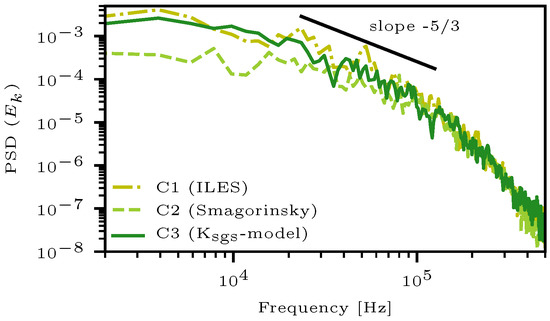
Figure 14.
Power spectral density of the kinetic energy. Velocity probe is located at distance away from the nozzle and off the spray centerline. Signal is recorded for 2 simulation time with sampling frequency of . PSD is computed based on Welch estimate.
It is worth noting that according to Taylor’s frozen turbulence hypothesis [107], wherein a linear relation between the signal’s frequency and streamwise wavenumber () is assumed, the dissipation pattern of , herein depicted, in the frequency domain can be compared with the Kolmogorov spectrum [108]. Accordingly, the inertial range of scales, which separate the large energy-containing scales from the small dissipative ones and is governed by the relation with denoting the dissipation rate, was demonstrated in the figure for the three cases with varied SGS models. The imperfect coincidence of the slope of a signal’s inertial range with respect to the /3 power law could be attributed to the accuracy of the employed numerical schemes, which would contribute to noise contaminations in the probed signal. Furthermore, in the higher frequency region corresponding to smaller dissipative range of scales, a coincidence between the three curves implied that all the SGS models were numerically stable without accumulations in and enstrophy, hence reliable quality LES was achieved. However, in the lower frequency range, significant discrepancies between the three cases were noted. In particular, the Smagorinsky SGS model was observed to damp at a wide range of low frequencies, which corresponded to larger length scales by Taylor’s hypothesis, compared with the remaining SGS models. In fact, this observation could rather elaborate on the relatively longer vapor length in the Smagorinsky case, c.f. Figure 11. Particularly, the dissipation in the corresponding larger length scales would imply less flow turbulence and subsequently higher concentration in the mean flow, hence the impact on fuel vapor mixing and penetration.
5. Conclusions
The Lagrangian particle tracking (LPT) approach coupled with large-eddy simulation (LES) was utilized to investigate the sensitivity of various modeling assumptions on the global characteristics of an evaporative fuel spray under the ECN Spray A baseline conditions. A volume filtering approach was employed to model the near-nozzle region using an injection cylinder of volume and dimensions larger than those of the nozzle. The droplet secondary breakup was modeled using the KHRT model with two different model parameter sets, and the no-breakup model with constant droplet sizes. The subgrid scales (SGS) were modeled using the implicit LES (ILES), Smagorinsky, and one-equation model (K-model). The sensitivity towards (i) varying the dimensions of while using ILES and KHRT, (ii) droplet no-breakup model, in comparison with KHRT model for droplet secondary breakup, and (iii) the SGS effects from different models when utilizing a droplet no-breakup approach, were all comprehensively investigated and compared to the ECN Spray A data. A summary of the main findings is highlighted as follows:
- (1)
- Spray metrics are sensitive to the injection cylinder dimensions. The cross-stream dimension of has a stronger influence on the spray characteristics, including spray penetration lengths, momentum intensity, and droplets evaporation.
- (2)
- The no-breakup model approach performs equally well compared with the tuned KHRT model.
- (3)
- With respect to global spray metrics, the no-breakup model approach is shown to be insensitive to the chosen SGS closure model.
- (4)
- According to statistical analyses on mixing indicators, explicit SGS models predict a wider range of scalar dissipation rates in coarse resolution regions compared with the ILES.
- (5)
- According to the PSD analysis, dampened energy spectra in the lower frequency range, which correspond to larger length scales by Taylor’s hypothesis, are produced by the Smagorinsky SGS model compared with the K-model and the ILES.
Author Contributions
Conceptualization, O.K. and V.V.; methodology, M.G., J.K. and B.T.; software, M.G. and B.T.; formal analysis, M.G.; investigation, M.G., O.K. and V.V.; writing—original draft preparation, M.G., J.K. and B.T.; writing—review and editing, S.K., O.K. and V.V.; visualization, M.G.; supervision, S.K., O.K. and V.V.; project administration, V.V.; funding acquisition, V.V. All authors have read and agreed to the published version of the manuscript.
Funding
This research was supported by the Academy of Finland, grant numbers 289592 and 297248.
Acknowledgments
The authors acknowledge CSC (Finnish IT Center for Science) for providing the computational resources.
Conflicts of Interest
The authors declare no conflict of interest.
Abbreviations
The following abbreviations are used in this manuscript:
| LES | large-eddy simulation |
| ECN | Engine Combustion Network |
| LPT | Lagrangian particle tracking |
| SGS | subgrid scales |
| CI | compression ignition |
| Weber number | |
| LSM | level-set method |
| VoF | volume of fluid |
| ILES | implicit large-eddy simulation |
| SMD | Sauter mean diameter |
| Stokes number | |
| SCR | selective catalytic reduction |
| RANS | Reynolds-averaged Navier–Stokes |
| KHRT | Kelvin-Helmholtz Rayleigh-Taylor |
| ETAB | enhanced Taylor analogy breakup |
| FVM | finite volume method |
| PISO | Pressure-Implicit with Splitting of Operator |
| TVD | total variation diminishing |
| IDSD | initial droplet size distribution |
| KH | Kelvin–Helmholtz |
| RT | Rayleigh-Taylor |
| DBI | diffused back-illumination |
| probability density function | |
| SOI | start of injection |
| PSD | power spectral density |
| kinetic energy |
Appendix A. Spray Half Cone Angle Variational Effects
Figure A1 depicts the temporal evolution of liquid and vapor penetration lengths of the spray when the injection half cone angle () is varied between 2–10. Spray sub-models for SGS and droplet breakup follow those in cases B3 or C1 from Table 3. The plots show that liquid length is insensitive to within the considered interval, whereas a mild variation is noted for vapor length, which is expected to be rather attributed to LES realization effects. Therefore, the present analysis justifies the choice of employed in this manuscript, since minimal effects on global spray metrics are noted for small variations in .

Figure A1.
Liquid and vapor penetration for cases with varied half cone angle () of the spray. Results are compared with ECN data, wherein the filled region denotes experimental uncertainty. Spray sub-models follow those in cases B3/C1.
Figure A1.
Liquid and vapor penetration for cases with varied half cone angle () of the spray. Results are compared with ECN data, wherein the filled region denotes experimental uncertainty. Spray sub-models follow those in cases B3/C1.

References
- Law, C. Recent advances in droplet vaporization and combustion. Prog. Energy Combust. Sci. 1982, 8, 171–201. [Google Scholar] [CrossRef]
- Sirignano, W.A. Fuel droplet vaporization and spray combustion theory. Prog. Energy Combust. Sci. 1983, 9, 291–322. [Google Scholar] [CrossRef]
- Wierzba, A.; Takayama, K. Experimental investigation of the aerodynamic breakup of liquid drops. AIAA J. 1988, 26, 1329–1335. [Google Scholar] [CrossRef]
- Faeth, G. Structure and atomization properties of dense turbulent sprays. Symp. Int. Combust. 1991, 23, 1345–1352. [Google Scholar] [CrossRef]
- Phinney, R.E. The breakup of a turbulent liquid jet in a gaseous atmosphere. J. Fluid Mech. 1973, 60, 689–701. [Google Scholar] [CrossRef]
- Hoyt, J.W.; Taylor, J.J. Turbulence structure in a water jet discharging in air. Phys. Fluids 1977, 20, S253. [Google Scholar] [CrossRef]
- Hoyt, J.W.; Taylor, J.J. Waves on water jets. J. Fluid Mech. 1977, 83, 119–127. [Google Scholar] [CrossRef]
- Chehroudi, B.; Chen, S.H.; Bracco, F.V.; Onuma, Y. On the intact core of full-cone sprays. SAE Trans. 1985, 764–773. [Google Scholar] [CrossRef]
- Siebers, D.L. Liquid-Phase Fuel Penetration in Diesel Sprays; SAE Technical Paper Series; SAE International: Warrendale, PA, USA, 1998. [Google Scholar] [CrossRef]
- O’Rourke, P.J.; Amsden, A.A. The TAB Method for Numerical Calculation of Spray Droplet Breakup; SAE Technical Paper Series; SAE International: Warrendale, PA, USA, 1987. [Google Scholar] [CrossRef]
- Wierzba, A. Deformation and breakup of liquid drops in a gas stream at nearly critical Weber numbers. Exp. Fluids 1990, 9, 59–64. [Google Scholar] [CrossRef]
- Ménard, T.; Tanguy, S.; Berlemont, A. Coupling level set/VOF/ghost fluid methods: Validation and application to 3D simulation of the primary break-up of a liquid jet. Int. J. Multiph. Flow 2007, 33, 510–524. [Google Scholar] [CrossRef]
- de Villiers, E.; Gosman, A.; Weller, H. Large eddy simulation of primary diesel spray atomization. SAE Trans. 2004, 113, 193–206. [Google Scholar]
- Xue, Q.; Battistoni, M.; Powell, C.; Longman, D.; Quan, S.; Pomraning, E.; Senecal, P.; Schmidt, D.; Som, S. An Eulerian CFD model and X-ray radiography for coupled nozzle flow and spray in internal combustion engines. Int. J. Multiph. Flow 2015, 70, 77–88. [Google Scholar] [CrossRef]
- Bravo, L.; Xue, Q.; Som, S.; Powell, C.; Kweon, C.B.M. Fuel Effects on Nozzle Flow and Spray Using Fully Coupled Eulerian Simulations. In Proceedings of the ASME 2015 Power Conference, San Diego, CA, USA, 28 June–2 July 2015; American Society of Mechanical Engineers: New York, NY, USA, 2015. [Google Scholar] [CrossRef]
- Trujillo, M.F.; Gurjar, S.; Mason, M.; Agarwal, A. Global characterization of the spray formation process. Atomiz. Sprays 2018, 28, 811–835. [Google Scholar] [CrossRef]
- Shinjo, J. Recent Advances in Computational Modeling of Primary Atomization of Liquid Fuel Sprays. Energies 2018, 11, 2971. [Google Scholar] [CrossRef]
- Rutland, C.J. Large-eddy simulations for internal combustion engines—A review. Int. J. Eng. Res. 2011, 12, 421–451. [Google Scholar] [CrossRef]
- Sanjosé, M.; Senoner, J.; Jaegle, F.; Cuenot, B.; Moreau, S.; Poinsot, T. Fuel injection model for Euler–Euler and Euler–Lagrange large-eddy simulations of an evaporating spray inside an aeronautical combustor. Int. J. Multiph. Flow 2011, 37, 514–529. [Google Scholar] [CrossRef]
- Kaario, O.; Vuorinen, V.; Zhu, L.; Larmi, M.; Liu, R. Mixing and evaporation analysis of a high-pressure SCR system using a hybrid LES-RANS approach. Energy 2017, 120, 827–841. [Google Scholar] [CrossRef]
- Kaario, O.; Vuorinen, V.; Kahila, H.; Im, H.G.; Larmi, M. The effect of fuel on high velocity evaporating fuel sprays: Large-eddy simulation of Spray A with various fuels. Int. J. Eng. Res. 2019, 21, 26–42. [Google Scholar] [CrossRef]
- Apte, S.; Gorokhovski, M.; Moin, P. LES of atomizing spray with stochastic modeling of secondary breakup. Int. J. Multiph. Flow 2003, 29, 1503–1522. [Google Scholar] [CrossRef]
- Vuorinen, V.; Larmi, M.; Antila, E.; Kaario, O.; El-Hannouny, E.; Gupta, S. Near Nozzle Diesel Spray Modeling and X-ray Measurements; SAE Technical Paper Series; SAE International: Warrendale, PA, USA, 2006. [Google Scholar] [CrossRef]
- Vuorinen, V.; Larmi, M.; Fuchs, L. Large eddy simulation of spray-originated turbulence production and dissipation. In Proceedings of the 6th International Conference on Multiphase Flow, Leipzig, Germany, 9–13 July 2007. [Google Scholar]
- Bharadwaj, N.; Rutland, C.J.; Chang, S. Large eddy simulation modelling of spray-induced turbulence effects. Int. J. Eng. Res. 2009, 10, 97–119. [Google Scholar] [CrossRef]
- Salewski, M.; Fuchs, L. Consistency issues of Lagrangian particle tracking applied to a spray jet in crossflow. Int. J. Multiph. Flow 2007, 33, 394–410. [Google Scholar] [CrossRef]
- Vuorinen, V.; Larmi, M.; Fuchs, L. Large-Eddy Simulation on the Effect of Droplet Size Distribution on Mixing of Passive Scalar in a Spray; SAE Technical Paper Series; SAE International: Warrendale, PA, USA, 2008. [Google Scholar] [CrossRef]
- Vuorinen, V.; Larmi, M.; Fuchs, L. Large-eddy simulation of particle size distribution effects on turbulence in sprays. In Proceedings of the 46th AIAA Aerospace Sciences Meeting and Exhibit, Reno, NV, USA, 7–10 January 2008; American Institute of Aeronautics and Astronautics: Reston, VA, USA, 2008. [Google Scholar] [CrossRef]
- Vuorinen, V.; Hillamo, H.; Kaario, O.; Larmi, M.; Fuchs, L. Large eddy simulation of droplet Stokes number effects on turbulent spray shape. Atomiz. Sprays 2010, 20, 93–114. [Google Scholar] [CrossRef]
- Vuorinen, V.; Hillamo, H.; Kaario, O.; Nuutinen, M.; Larmi, M.; Fuchs, L. Large eddy simulation of droplet Stokes number effects on mixture quality in fuel sprays. Atomiz. Sprays 2010, 20, 435–451. [Google Scholar] [CrossRef]
- Vuorinen, V.; Hillamo, H.; Kaario, O.; Nuutinen, M.; Larmi, M.; Fuchs, L. Effect of droplet size and atomization on spray formation: A priori study using large-eddy simulation. Flow Turbul. Combust. 2010, 86, 533–561. [Google Scholar] [CrossRef]
- Kaario, O.; Hulkkonen, T.; Vuorinen, V.; Wehrfritz, A.; Keskinen, K.; Larmi, M. Numerical and experimental investigation of fuel spray behaviour in very high density environment using LES. In Proceedings of the ICLASS 2012, 12th Triennial International Conference on Liquid Atomization and Spray Systems, Heidelberg, Germany, 2–6 September 2012. [Google Scholar]
- Kaario, O.; Vuorinen, V.; Hulkkonen, T.; Keskinen, K.; Nuutinen, M.; Larmi, M.; Tanner, F.X. Large eddy simulation of high gas density effects in fuel sprays. Atomiz. Sprays 2013, 23, 297–325. [Google Scholar] [CrossRef]
- Wehrfritz, A.; Vuorinen, V.; Kaario, O.; Larmi, M. Large eddy simulation of high-velocity fuel sprays: Studying mesh resolution and breakup model effects for Spray A. Atomiz. Sprays 2013, 23, 419–442. [Google Scholar] [CrossRef]
- Xue, Q.; Som, S.; Senecal, P.K.; Pomraning, E. Large eddy simulation of fuel-spray under non-reacting IC engine conditions. Atomiz. Sprays 2013, 23, 925–955. [Google Scholar] [CrossRef]
- Tsang, C.W.; Kuo, C.W.; Trujillo, M.; Rutland, C. Evaluation and validation of large-eddy simulation sub-grid spray dispersion models using high-fidelity volume-of-fluid simulation data and engine combustion network experimental data. Int. J. Eng. Res. 2018, 20, 583–605. [Google Scholar] [CrossRef]
- Senecal, P.K.; Pomraning, E.; Xue, Q.; Som, S.; Banerjee, S.; Hu, B.; Liu, K.; Deur, J.M. Large Eddy Simulation of Vaporizing Sprays Considering Multi-Injection Averaging and Grid-Convergent Mesh Resolution. J. Eng. Gas Turbines Power 2014, 136. [Google Scholar] [CrossRef]
- Pei, Y.; Davis, M.J.; Pickett, L.M.; Som, S. Engine Combustion Network (ECN): Global sensitivity analysis of Spray A for different combustion vessels. Combust. Flame 2015, 162, 2337–2347. [Google Scholar] [CrossRef]
- Solsjö, R.; Bai, X.S. Injection of Fuel at High Pressure Conditions: LES Study; SAE Technical Paper Series; SAE International: Warrendale, PA, USA, 2011. [Google Scholar] [CrossRef]
- Gong, C.; Jangi, M.; Lucchini, T.; D’Errico, G.; Bai, X.S. Large Eddy Simulation of Air Entrainment and Mixing in Reacting and Non-Reacting Diesel Sprays. Flow Turbul. Combust. 2014, 93, 385–404. [Google Scholar] [CrossRef]
- Koukouvinis, P.; Vidal-Roncero, A.; Rodriguez, C.; Gavaises, M.; Pickett, L. High pressure/high temperature multiphase simulations of dodecane injection to nitrogen: Application on ECN Spray-A. Fuel 2020, 275, 117871. [Google Scholar] [CrossRef]
- Matheis, J.; Hickel, S. Multi-component vapor-liquid equilibrium model for LES of high-pressure fuel injection and application to ECN Spray A. Int. J. Multiph. Flow 2018, 99, 294–311. [Google Scholar] [CrossRef]
- Yang, S.; Yi, P.; Habchi, C. Real-fluid injection modeling and LES simulation of the ECN Spray A injector using a fully compressible two-phase flow approach. Int. J. Multiph. Flow 2020, 122, 103145. [Google Scholar] [CrossRef]
- Jangi, M.; D’Errico, G.; Bai, X.S.; Lucchini, T. Numerical Simulation of the ECN Spray A Using Multidimensional Chemistry Coordinate Mapping: N-Dodecane Diesel Combustion; SAE Technical Paper Series; SAE International: Warrendale, PA, USA, 2012. [Google Scholar] [CrossRef]
- Pei, Y.; Hawkes, E.R.; Kook, S.; Goldin, G.M.; Lu, T. Modelling n-dodecane spray and combustion with the transported probability density function method. Combust. Flame 2015, 162, 2006–2019. [Google Scholar] [CrossRef]
- Pei, Y.; Som, S.; Pomraning, E.; Senecal, P.K.; Skeen, S.A.; Manin, J.; Pickett, L.M. Large eddy simulation of a reacting spray flame with multiple realizations under compression ignition engine conditions. Combust. Flame 2015, 162, 4442–4455. [Google Scholar] [CrossRef]
- Jangi, M.; Solsjo, R.; Johansson, B.; Bai, X.S. On large eddy simulation of diesel spray for internal combustion engines. Int. J. Heat Fluid Flow 2015, 53, 68–80. [Google Scholar] [CrossRef]
- Blomberg, C.K.; Zeugin, L.; Pandurangi, S.S.; Bolla, M.; Boulouchos, K.; Wright, Y.M. Modeling Split Injections of ECN “Spray A” Using a Conditional Moment Closure Combustion Model with RANS and LES. SAE Int. J. Eng. 2016, 9, 2107–2119. [Google Scholar] [CrossRef]
- Fang, X.H.; Ismail, R.; Bushe, K.; Davy, M. Simulation of ECN diesel spray A using conditional source-term estimation. Combust. Theory Model. 2020, 1–36. [Google Scholar] [CrossRef]
- Dalakoti, D.K.; Savard, B.; Hawkes, E.R.; Wehrfritz, A.; Wang, H.; Day, M.S.; Bell, J.B. Direct numerical simulation of a spatially developing n-dodecane jet flame under Spray A thermochemical conditions: Flame structure and stabilisation mechanism. Combust. Flame 2020, 217, 57–76. [Google Scholar] [CrossRef]
- Chishty, M.A.; Bolla, M.; Hawkes, E.; Pei, Y.; Kook, S. Assessing the Importance of Radiative Heat Transfer for ECN Spray A Using the Transported PDF Method. SAE Int. J. Fuels Lubr. 2016, 9, 100–107. [Google Scholar] [CrossRef]
- Krisman, A.; Hawkes, E.R.; Chen, J.H. A parametric study of ignition dynamics at ECN Spray A thermochemical conditions using 2D DNS. Proc. Combust. Inst. 2019, 37, 4787–4795. [Google Scholar] [CrossRef]
- Wehrfritz, A.; Kaario, O.; Vuorinen, V.; Somers, B. Large Eddy Simulation of n-dodecane spray flames using Flamelet Generated Manifolds. Combust. Flame 2016, 167, 113–131. [Google Scholar] [CrossRef]
- Kahila, H.; Wehrfritz, A.; Kaario, O.; Masouleh, M.G.; Maes, N.; Somers, B.; Vuorinen, V. Large-eddy simulation on the influence of injection pressure in reacting Spray A. Combust. Flame 2018, 191, 142–159. [Google Scholar] [CrossRef]
- Kahila, H.; Wehrfritz, A.; Kaario, O.; Vuorinen, V. Large-eddy simulation of dual-fuel ignition: Diesel spray injection into a lean methane-air mixture. Combust. Flame 2019, 199, 131–151. [Google Scholar] [CrossRef]
- Tekgül, B.; Kahila, H.; Kaario, O.; Vuorinen, V. Large-eddy simulation of dual-fuel spray ignition at different ambient temperatures. Combust. Flame 2020, 215, 51–65. [Google Scholar] [CrossRef]
- Kahila, H.; Kaario, O.; Ahmad, Z.; Masouleh, M.G.; Tekgül, B.; Larmi, M.; Vuorinen, V. A large-eddy simulation study on the influence of diesel pilot spray quantity on methane-air flame initiation. Combust. Flame 2019, 206, 506–521. [Google Scholar] [CrossRef]
- Pickett, L.M.; Manin, J.; Kastengren, A.; Powell, C. Comparison of Near-Field Structure and Growth of a Diesel Spray Using Light-Based Optical Microscopy and X-Ray Radiography. SAE Int. J. Eng. 2014, 7, 1044–1053. [Google Scholar] [CrossRef]
- Payri, F.; Payri, R.; Bardi, M.; Carreres, M. Engine combustion network: Influence of the gas properties on the spray penetration and spreading angle. Exp. Therm. Fluid Sci. 2014, 53, 236–243. [Google Scholar] [CrossRef]
- Kastengren, A.L.; Tilocco, F.Z.; Duke, D.J.; Powell, C.F.; Zhang, X.; Moon, S. Time-resolved x-ray radiography of sprays from Engine Combustion Network Spray A diesel injectors. Atomiz. Sprays 2014, 24, 251–272. [Google Scholar] [CrossRef]
- Daly, S.; Cenker, E.; Pickett, L.; Skeen, S. The Effects of Injector Temperature on Spray Characteristics in Heavy-Duty Diesel Sprays. SAE Int. J. Eng. 2018, 11, 879–891. [Google Scholar] [CrossRef]
- Payri, R.; Viera, J.P.; Gopalakrishnan, V.; Szymkowicz, P.G. The effect of nozzle geometry over the evaporative spray formation for three different fuels. Fuel 2017, 188, 645–660. [Google Scholar] [CrossRef]
- Agarwal, A.; Trujillo, M.F. The effect of nozzle internal flow on spray atomization. Int. J. Eng. Res. 2019, 21, 55–72. [Google Scholar] [CrossRef]
- Falgout, Z.; Rahm, M.; Wang, Z.; Linne, M. Evidence for supercritical mixing layers in the ECN Spray A. Proc. Combust. Inst. 2015, 35, 1579–1586. [Google Scholar] [CrossRef]
- Dahms, R.N.; Manin, J.; Pickett, L.M.; Oefelein, J.C. Understanding high-pressure gas-liquid interface phenomena in Diesel engines. Proc. Combust. Inst. 2013, 34, 1667–1675. [Google Scholar] [CrossRef]
- Dahms, R.N.; Oefelein, J.C. On the transition between two-phase and single-phase interface dynamics in multicomponent fluids at supercritical pressures. Phys. Fluids 2013, 25, 092103. [Google Scholar] [CrossRef]
- Manin, J.; Bardi, M.; Pickett, L.; Dahms, R.; Oefelein, J. Microscopic investigation of the atomization and mixing processes of diesel sprays injected into high pressure and temperature environments. Fuel 2014, 134, 531–543. [Google Scholar] [CrossRef]
- Dahms, R.N.; Oefelein, J.C. Liquid jet breakup regimes at supercritical pressures. Combust. Flame 2015, 162, 3648–3657. [Google Scholar] [CrossRef]
- Dahms, R.N.; Oefelein, J.C. Non-equilibrium gas–liquid interface dynamics in high-pressure liquid injection systems. Proc. Combust. Inst. 2015, 35, 1587–1594. [Google Scholar] [CrossRef]
- Crua, C.; Manin, J.; Pickett, L.M. On the transcritical mixing of fuels at diesel engine conditions. Fuel 2017, 208, 535–548. [Google Scholar] [CrossRef]
- Jung, Y.; Manin, J.; Skeen, S.; Pickett, L.M. Measurement of Liquid and Vapor Penetration of Diesel Sprays with a Variation in Spreading Angle; SAE Technical Paper Series; SAE International: Warrendale, PA, USA, 2015. [Google Scholar] [CrossRef]
- Payri, R.; García-Oliver, J.M.; Xuan, T.; Bardi, M. A study on diesel spray tip penetration and radial expansion under reacting conditions. Appl. Therm. Eng. 2015, 90, 619–629. [Google Scholar] [CrossRef]
- Maes, N.; Dam, N.; Somers, B.; Lucchini, T.; D’Errico, G.; Hardy, G. Experimental and Numerical Analyses of Liquid and Spray Penetration under Heavy-Duty Diesel Engine Conditions. SAE Int. J. Fuels Lubr. 2016, 9, 108–124. [Google Scholar] [CrossRef]
- Maes, N.; Meijer, M.; Dam, N.; Somers, B.; Toda, H.B.; Bruneaux, G.; Skeen, S.A.; Pickett, L.M.; Manin, J. Characterization of Spray A flame structure for parametric variations in ECN constant-volume vessels using chemiluminescence and laser-induced fluorescence. Combust. Flame 2016, 174, 138–151. [Google Scholar] [CrossRef]
- Weller, H.G.; Tabor, G.; Jasak, H.; Fureby, C. A tensorial approach to computational continuum mechanics using object-oriented techniques. Comput. Phys. 1998, 12, 620. [Google Scholar] [CrossRef]
- Issa, R.; Ahmadi-Befrui, B.; Beshay, K.; Gosman, A. Solution of the implicitly discretised reacting flow equations by operator-splitting. J. Comput. Phys. 1991, 93, 388–410. [Google Scholar] [CrossRef]
- Smagorinsky, J. General circulation experiments with the primitive equations. Mon. Weather Rev. 1963, 91, 99–164. [Google Scholar] [CrossRef]
- Yoshizawa, A. Statistical theory for compressible turbulent shear flows, with the application to subgrid modeling. Phys. Fluids 1986, 29, 2152. [Google Scholar] [CrossRef]
- Jasak, H.; Weller, H.; Gosman, A. High resolution NVD differencing scheme for arbitrarily unstructured meshes. Int. J. Num. Methods Fluids 1999, 31, 431–449. [Google Scholar] [CrossRef]
- Elghobashi, S. On predicting particle-laden turbulent flows. Appl. Sci. Res. 1994, 52, 309–329. [Google Scholar] [CrossRef]
- Zuo, B.; Gomes, A.; Rutland, C. Studies of superheated fuel spray structures and vaporization in GDI engines. In Proceedings of the Eleventh International Multidimensional Engine Modeling User’s Group Meeting, Detroit, MI, USA, 4 March 2000. [Google Scholar]
- Putnam, A. Integratable form of droplet drag coefficient. ARS J. 1961, 31, 1467–1468. [Google Scholar]
- Ranz, W.; Marshall, W. Evaporation from drops. Chem. Eng. Prog. 1952, 48, 141–146. [Google Scholar]
- Vesilind, P. The Rosin-Rammler particle size distribution. Resour. Recovery Conserv. 1980, 5, 275–277. [Google Scholar] [CrossRef]
- Bode, M.; Davidovic, M.; Pitsch, H. Multi-scale coupling for predictive injector simulations. In Lecture Notes in Computer Science; Springer International Publishing: Cham, Switzerland, 2017; pp. 96–108. [Google Scholar] [CrossRef]
- Crua, C.; Stetsyuk, V.; de Sercey, G.; Turner, J. Droplet and liquid size measurements in the near-nozzle region. In Proceedings of the Engine Combustion Network 4th Workshop, ECN4, Kyoto, Japan, 5–6 September 2015. [Google Scholar]
- Kastengren, A.; Ilavsky, J.; Viera, J.P.; Payri, R.; Duke, D.; Swantek, A.; Tilocco, F.Z.; Sovis, N.; Powell, C. Measurements of droplet size in shear-driven atomization using ultra-small angle x-ray scattering. Int. J. Multiph. Flow 2017, 92, 131–139. [Google Scholar] [CrossRef]
- Payri, R.; Salvador, F.; Gimeno, J.; Bracho, G. A new methodology for correcting the signal cumulative phenomenon on injection rate measurements. Exp. Tech. 2008, 32, 46–49. [Google Scholar] [CrossRef]
- Reitz, R.D. Modeling atomization processes in high-pressure vaporizing sprays. Atomisat. Spray Technol. 1987, 3, 309–337. [Google Scholar]
- Tanner, F.X. Liquid jet atomization and droplet breakup modeling of non-evaporating diesel fuel sprays. SAE Trans. 1997, 106, 127–140. [Google Scholar]
- Xin, J.; Ricart, L.; Reitz, R. Computer modeling of diesel spray atomization and combustion. Combust. Sci. Technol. 1998, 137, 171–194. [Google Scholar] [CrossRef]
- Reitz, R.D.; Beale, J.C. Modeling spray atomization with the Kelvin-Helmholtz/Rayleigh-Taylor Hybrid model. Atomiz. Sprays 1999, 9, 623–650. [Google Scholar] [CrossRef]
- Kärrholm, F.P.; Nordin, N. Numerical Investigation of Mesh/Turbulence/Spray Interaction for Diesel Applications; SAE Technical Paper Series; SAE International: Warrendale, PA, USA, 2005. [Google Scholar] [CrossRef]
- Kärrholm, F.P.; Weller, H.; Nordin, N. Modelling Injector Flow Including Cavitation Effects for Diesel Applications; Volume 2: Fora, Parts A and B; ASMEDC: New York, NY, USA, 2007. [Google Scholar] [CrossRef]
- Pickett, L.M.; Abraham, J.P. Computed and measured fuel vapor distribution in a diesel spray. Atomiz. Sprays 2010, 20, 241–250. [Google Scholar] [CrossRef]
- Pickett, L.M.; Genzale, C.L.; Manin, J. Uncertainty quantification for liquid penetration of evaporating sprays at diesel-like conditions. Atomiz. Sprays 2015, 25, 425–452. [Google Scholar] [CrossRef]
- Payri, R.; Salvador, F.J.; Gimeno, J.; de la Morena, J. Macroscopic behavior of diesel sprays in the near-nozzle field. SAE Int. J. Eng. 2008, 1, 528–536. [Google Scholar] [CrossRef]
- Idicheria, C.A.; Pickett, L.M. Quantitative Mixing Measurements in a Vaporizing Diesel Spray by Rayleigh Imaging; SAE World Congress & Exhibition; SAE International: Warrendale, PA, USA, 2007. [Google Scholar] [CrossRef]
- Pickett, L.M.; Manin, J.; Genzale, C.L.; Siebers, D.L.; Musculus, M.P.B.; Idicheria, C.A. Relationship between diesel fuel spray vapor penetration/dispersion and local fuel mixture fraction. SAE Int. J. Eng. 2011, 4, 764–799. [Google Scholar] [CrossRef]
- Magnotti, G.; Genzale, C. Detailed assessment of diesel spray atomization models using visible and X-ray extinction measurements. Int. J. Multiph. Flow 2017, 97, 33–45. [Google Scholar] [CrossRef]
- Pandal, A.; Payri, R.; García-Oliver, J.; Pastor, J. Optimization of spray break-up CFD simulations by combining Σ-Y Eulerian atomization model with a response surface methodology under diesel engine-like conditions (ECN Spray A). Comput. Fluids 2017, 156, 9–20. [Google Scholar] [CrossRef]
- Pitsch, H.; Steiner, H. Scalar mixing and dissipation rate in large-eddy simulations of non-premixed turbulent combustion. Proc. Combust. Inst. 2000, 28, 41–49. [Google Scholar] [CrossRef]
- Khani, S.; Waite, M.L. Buoyancy scale effects in large-eddy simulations of stratified turbulence. J. Fluid Mech. 2014, 754, 75–97. [Google Scholar] [CrossRef]
- Khani, S. Mixing efficiency in large-eddy simulations of stratified turbulence. J. Fluid Mech. 2018, 849, 373–394. [Google Scholar] [CrossRef]
- Welch, P. The use of fast Fourier transform for the estimation of power spectra: A method based on time averaging over short, modified periodograms. IEEE Trans. Audio Electr. 1967, 15, 70–73. [Google Scholar] [CrossRef]
- Ha, Y.H.; Pearce, J. A new window and comparison to standard windows. IEEE Trans. Acoust. Speech Signal Proc. 1989, 37, 298–301. [Google Scholar] [CrossRef]
- Taylor, G.I. The spectrum of turbulence. Proc. R. Soc. Lond. Ser. A Math. Phys. Sci. 1938, 164, 476–490. [Google Scholar] [CrossRef]
- Kolmogorov, A.N. The local structure of turbulence in incompressible viscous fluid for very large Reynolds numbers. C. R. Acad. Sci. URSS 1941, 30, 301–305. [Google Scholar]


© 2020 by the authors. Licensee MDPI, Basel, Switzerland. This article is an open access article distributed under the terms and conditions of the Creative Commons Attribution (CC BY) license (http://creativecommons.org/licenses/by/4.0/).