Impact of Sample Size and Maximum Aggregate Grain on the Representativeness of Concrete Samples

Abstract
:1. Introduction
2. Standard Criteria for Representativeness of Concrete Samples
3. Materials, Test Samples and Methods
3.1. Materials
3.2. Test Samples
3.3. Methods
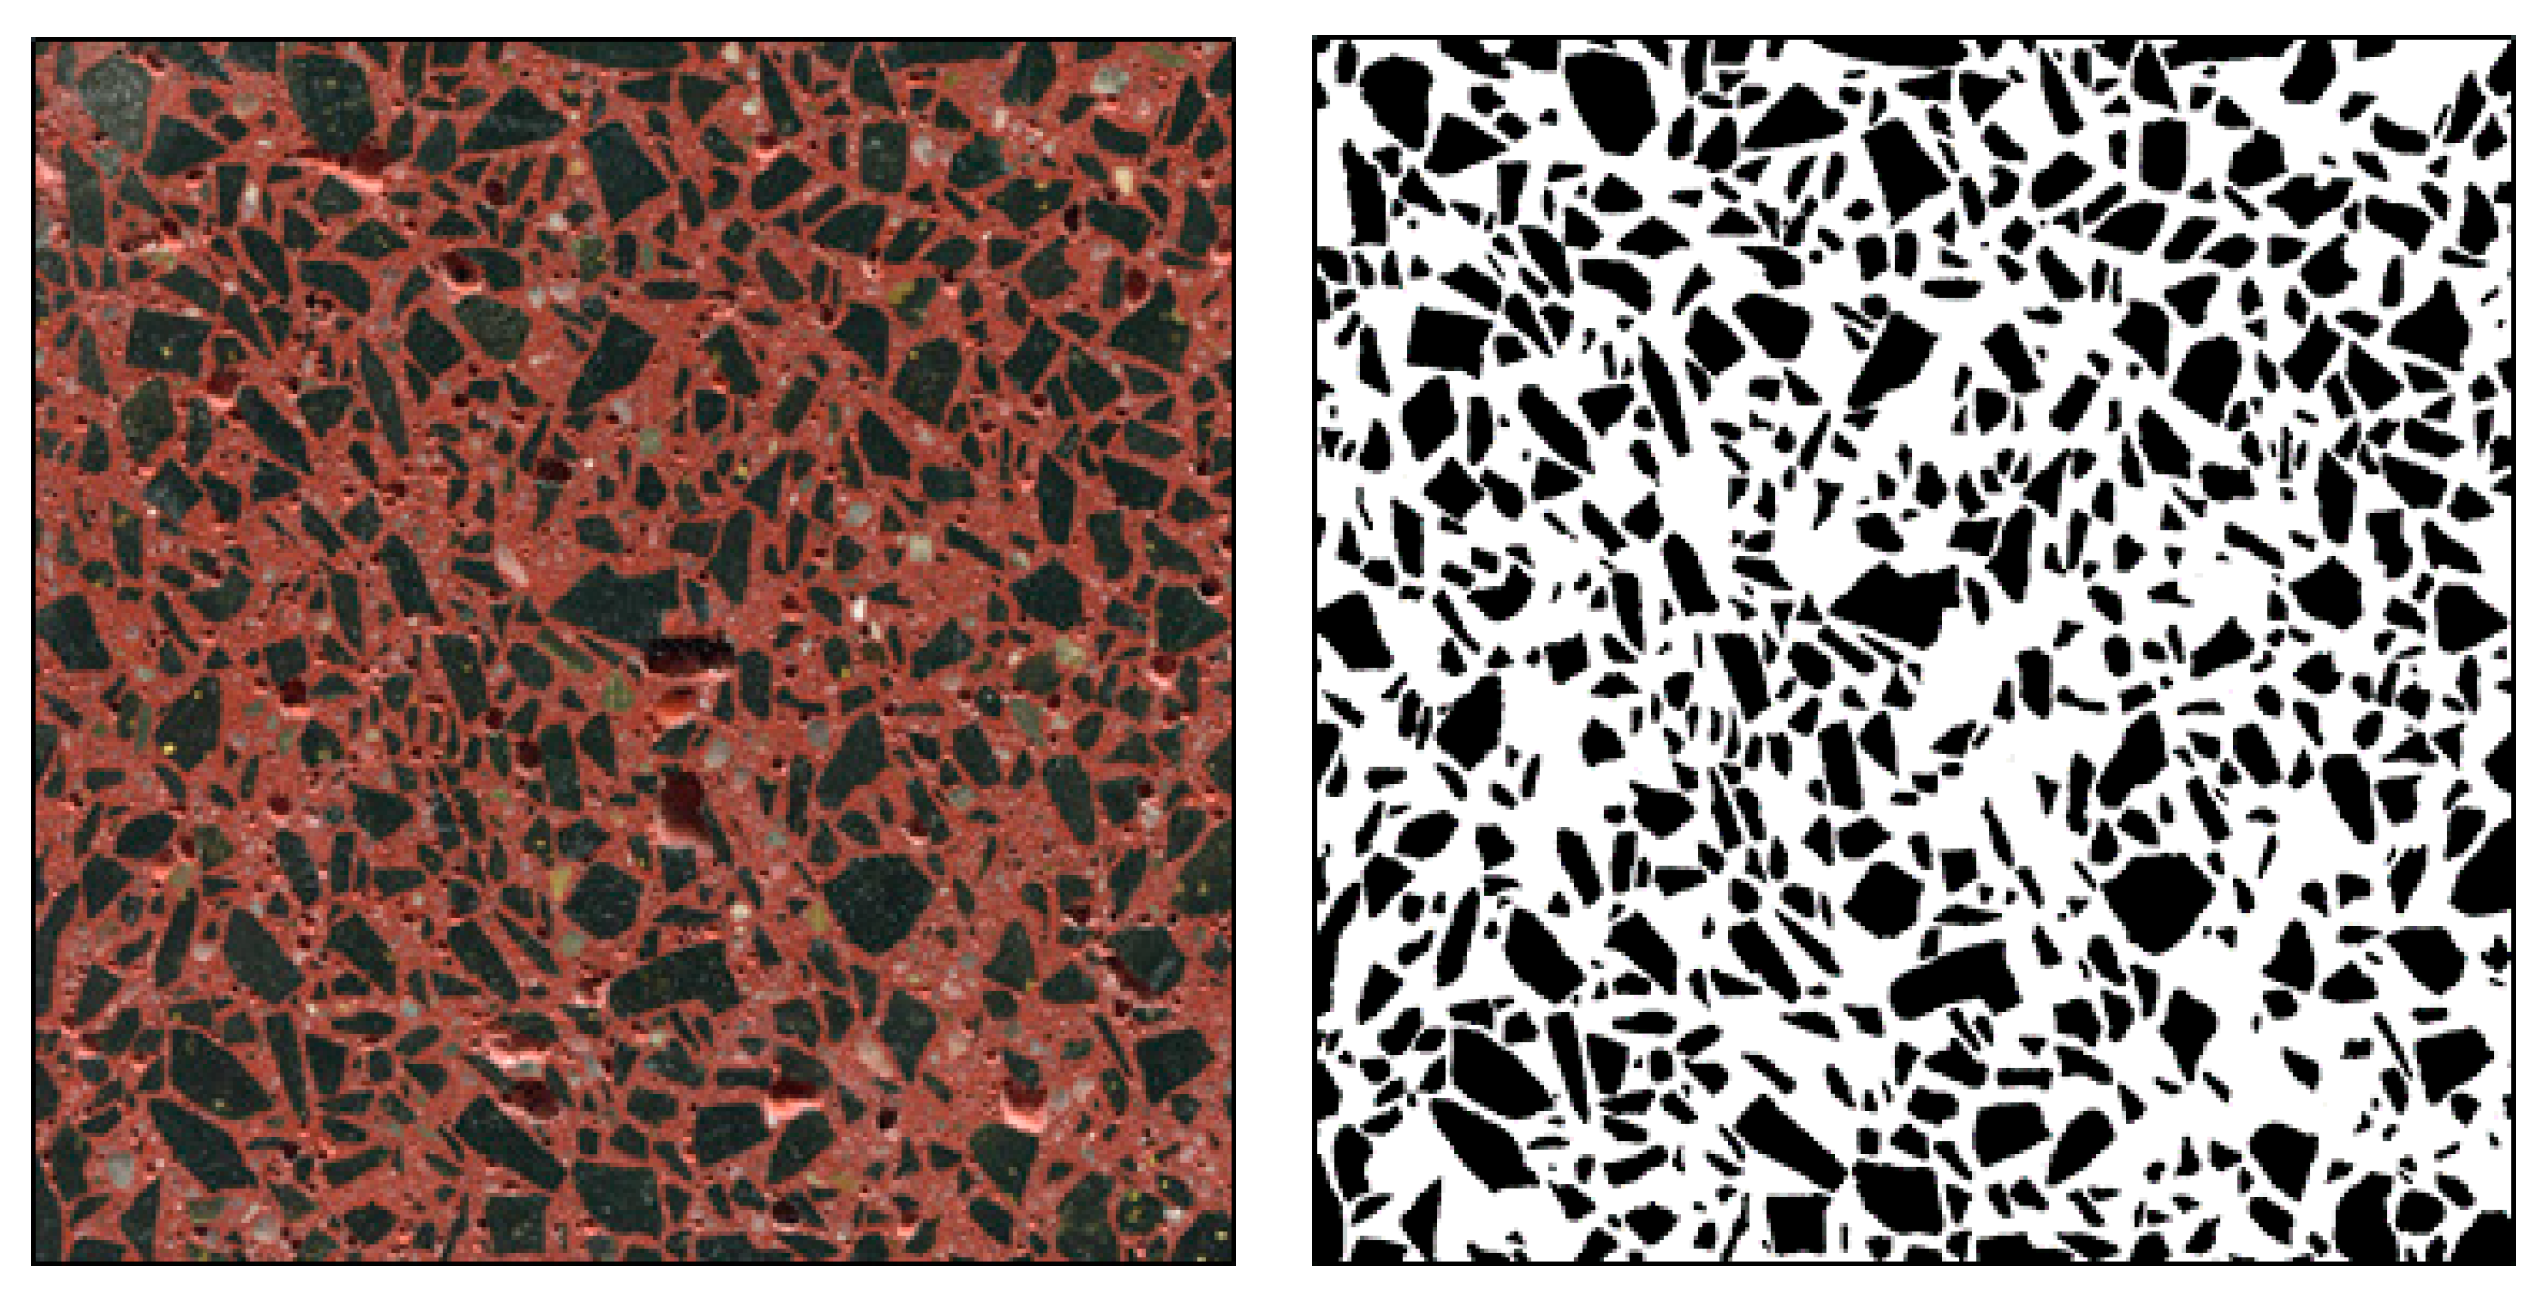
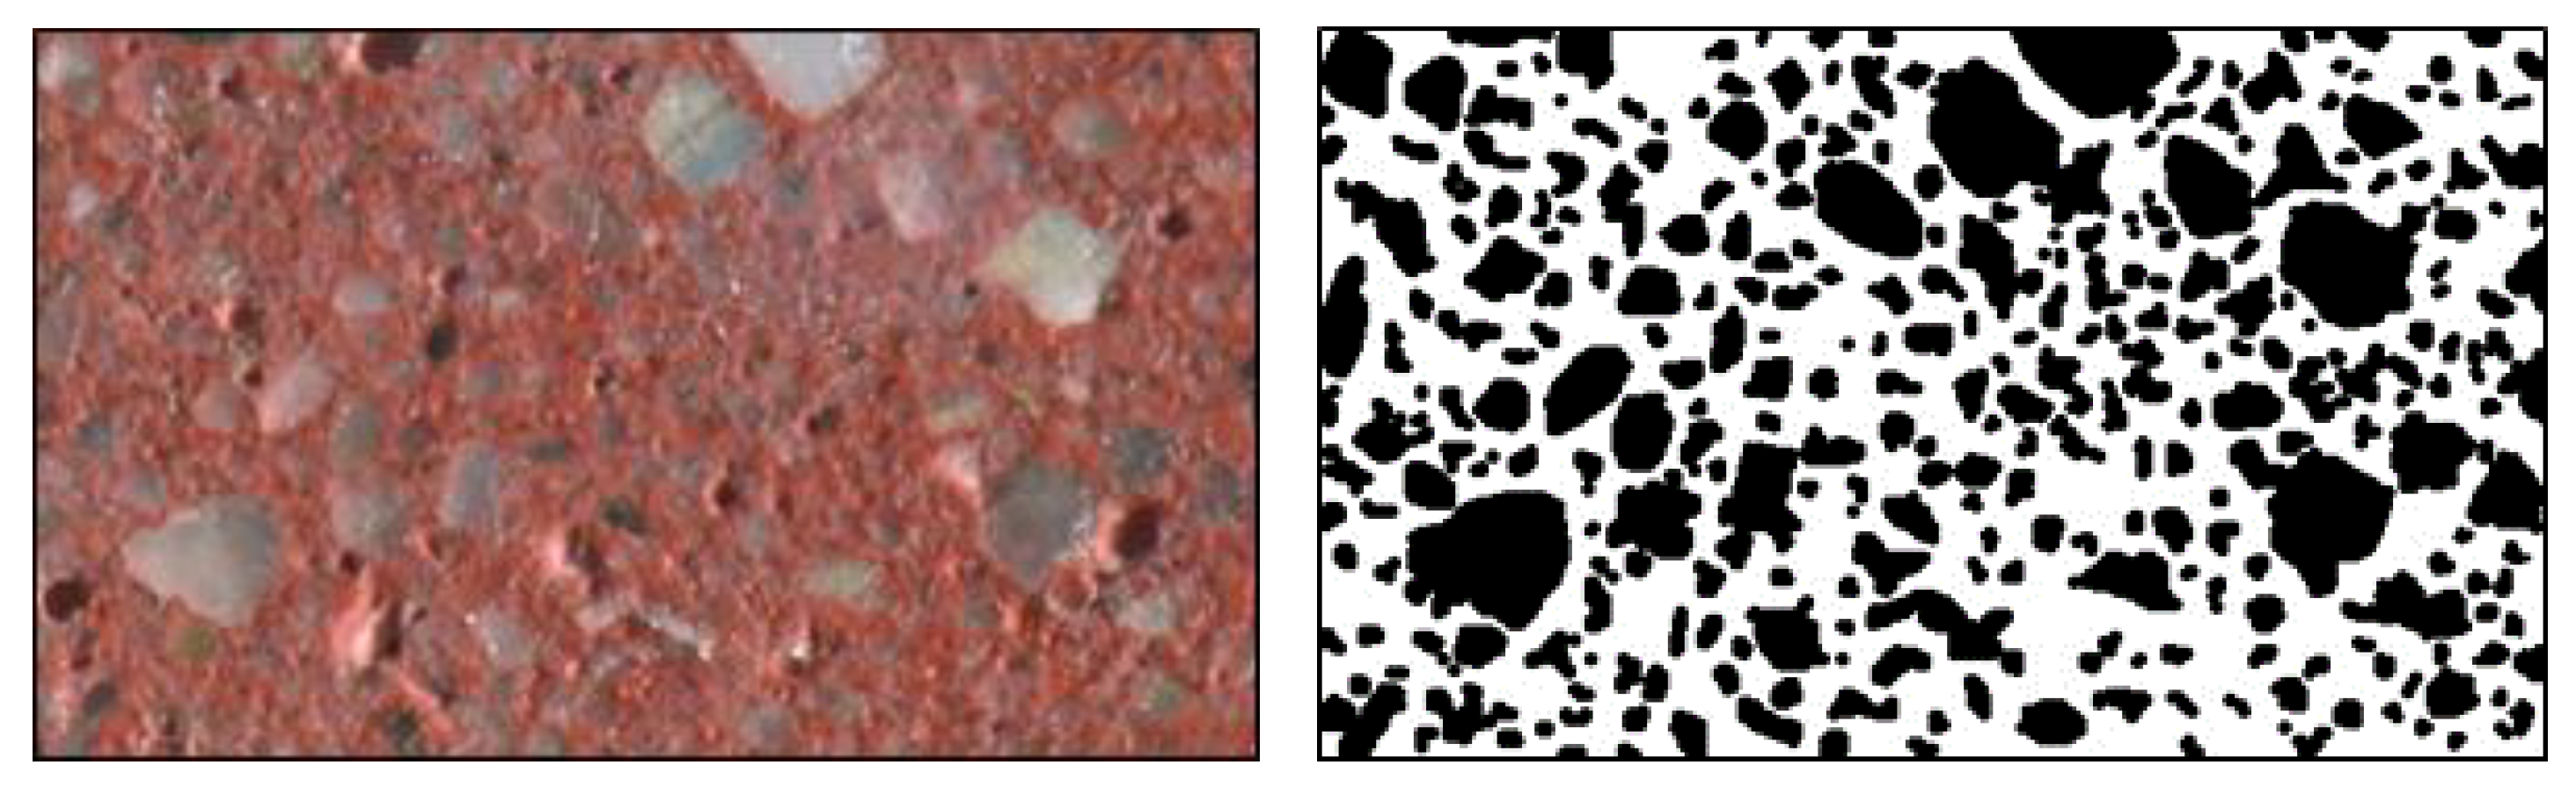
3.3.1. Preparing the Cross-Sectional Images of Samples
3.3.2. Image Analysis
4. Results
5. Discussion
5.1. General Remarks
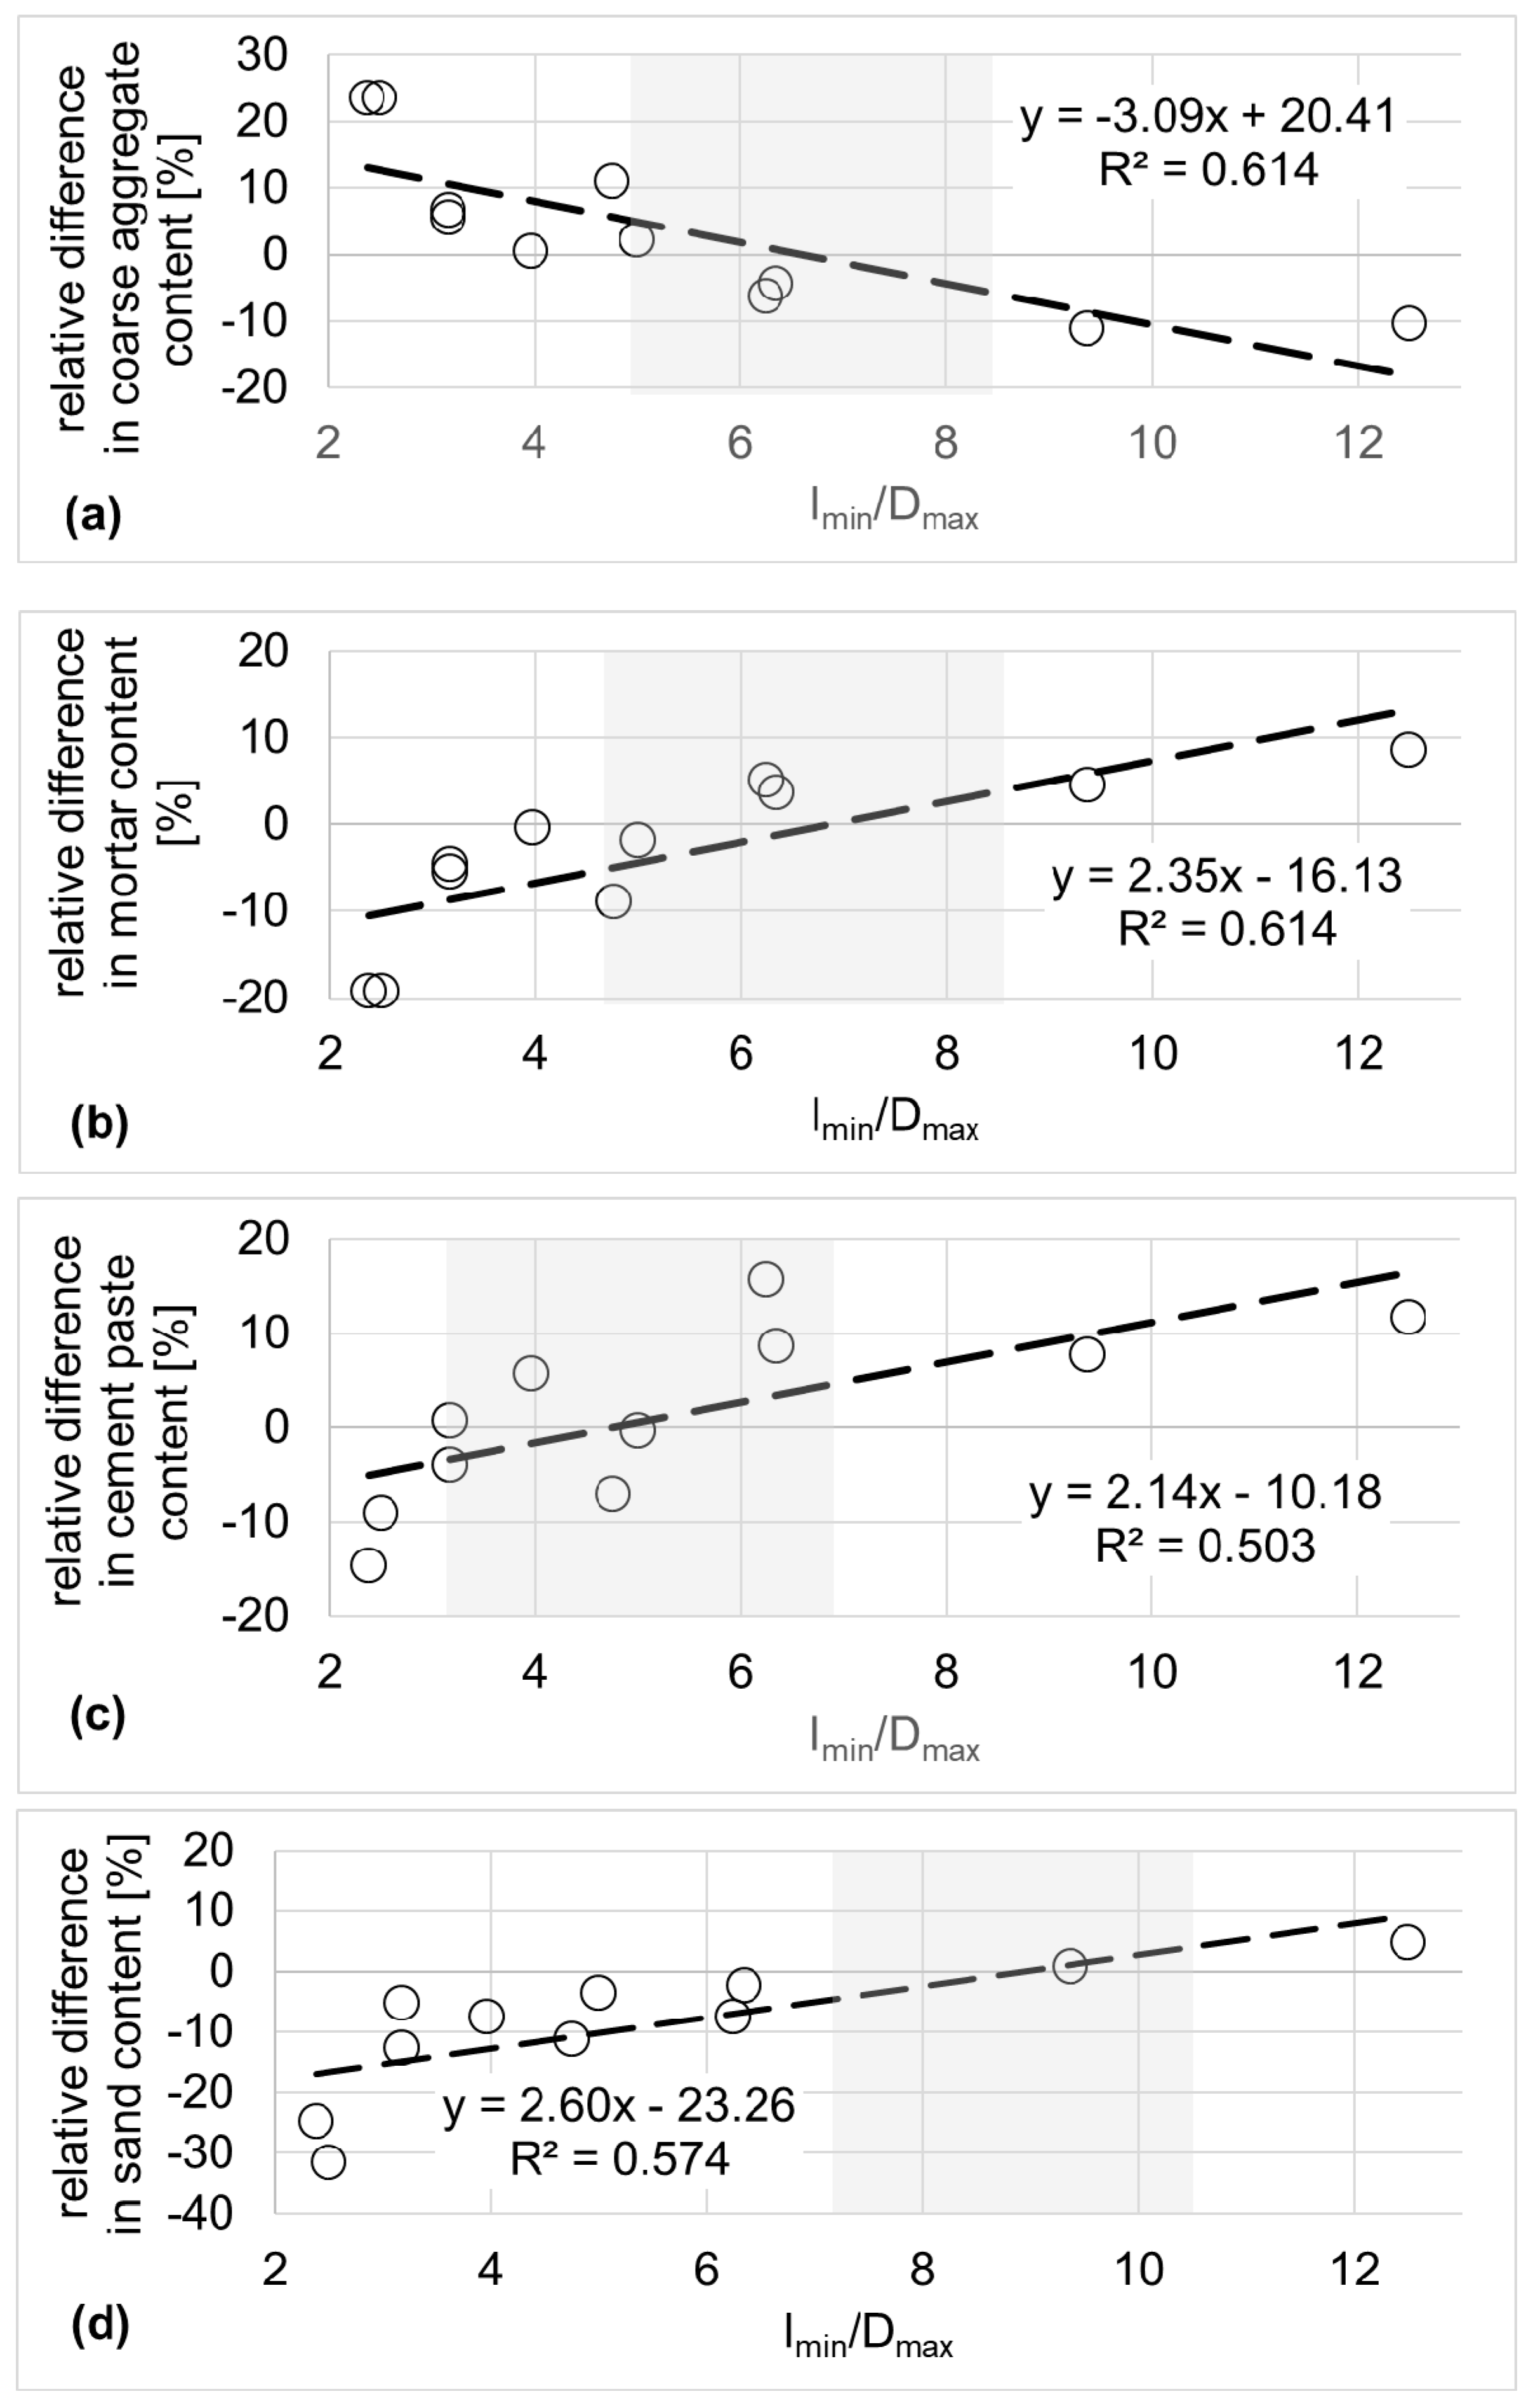
5.2. Variability of Coarse Aggregate and Mortar Content
5.3. Variability of Paste and Sand Content
6. Conclusions
- The relationship between sample size and maximum aggregate grain (lmin/Dmax) has a visible effect on the representativeness of the concrete samples as assessed by the similarity of the concrete composition of the sample and the controlled concrete.
- The differences between the concrete composition in the sample and that resulting from the concrete mix proportion are, particularly at the extremes of the lmin/Dmax ratio, so significant that they should be taken into account when selecting the sample size and interpreting the results of the controlled concrete properties.
- In light of the results of the tests and analyses, it seems reasonable to recommend the use of samples for which lmin/Dmax = < 5.0; 10.0 >.
- In existing standards, the use of samples that meet the requirement lmin/Dmax ≥ 3.0 or 3.5 is recommended. In light of the presented test results, this requirement is sufficient for the material strength parameters assessment (compressive and tensile strength) because those properties are not so sensitive to slight variation in concrete composition.
- The differences between concrete composition in the sample and in controlled concrete, found in this study, may significantly affect the assessment of properties that are sensitive to the concrete composition. Those properties, among others, are water absorption [4], water and gas permeability [5], and thermal properties [6,7].
Author Contributions
Funding
Conflicts of Interest
References
- Zheng, J.J.; Li, C.; Zhou, X. Thickness of interfacial transition zone and cement content profiles around aggregates. Mag. Concr. Res. 2005, 57, 397–406. [Google Scholar] [CrossRef]
- Stephan, F.F.; McCarthy, P.J. Sampling Options: An Analysis of Survey Procedure; Wiley: New York, NY, USA, 1958. [Google Scholar]
- Hill, R. Elastic properties of reinforced solids: Some theoretical principles. J. Mech. Phys. Solids 1963, 11, 357–372. [Google Scholar] [CrossRef]
- Tracz, T.; Śliwiński, J. Effect of cement paste content and w/c ratio on concrete water absorption. Cem. Wapno Beton 2012, 17, 131–137. [Google Scholar]
- Śliwiński, J.; Tracz, T.; Zdeb, T. Influence of selected parameters of cement concrete composition on its gas permeability, Recent advances in civil engineering: Building materials and building physics, Monograph 479, Cracow University of Technology. Civ. Eng. 2015, 479, 97–118. [Google Scholar]
- Kim, K.-H.; Jeon, S.-E.; Kim, J.-K.; Yang, S. An experimental study on thermal conductivity of concrete. Cem. Concr. Res. 2003, 33, 363–371. [Google Scholar] [CrossRef]
- Khan, M.I. Factors affecting the thermal properties of concrete and applicability of its prediction models. Build. Environ. 2002, 37, 607–614. [Google Scholar] [CrossRef]
- Gitman, I.; Askes, H.; Sluys, B. Representative volume: Existence and size determination. Eng. Fract. Mech. 2007, 74, 2518–2534. [Google Scholar] [CrossRef]
- Stroeven, M.; Askes, H.; Sluys, B. Numerical determination of representative volumes for granular materials. Comput. Methods Appl. Mech. Eng. 2004, 193, 3221–3238. [Google Scholar] [CrossRef]
- Yin, Y.; Ren, Q. Studying the representative volume of concrete using the entropy weight–grey correlation model. Mag. Concr. Res. 2018, 70, 757–769. [Google Scholar] [CrossRef]
- Ukrainczyk, N.; Koenders, E.A.B. Representative elementary volumes for 3D modeling of mass transport in cementitious materials. Model. Simul. Mater. Sci. Eng. 2014, 22, 35001. [Google Scholar] [CrossRef]
- Wu, Q.; Rougelot, T.; Burlion, N.; Bourbon, X. Representative volume element estimation for desorption isotherm of concrete with sliced samples. Cem. Concr. Res. 2015, 76, 1–9. [Google Scholar] [CrossRef]
- Yio, M.; Wong, H.S.; Buenfeld, N.R. Representative elementary volume (REV) of cementitious materials from three-dimensional pore structure analysis. Cem. Concr. Res. 2017, 102, 187–202. [Google Scholar] [CrossRef]
- Zhang, M.Z.; Ye, G.; van Breugel, K. A numerical-statistical approach to determining the representative elementary volume (REV) of cement paste for measuring diffusivity. Mater. Constr. 2010, 60, 7–20. [Google Scholar] [CrossRef]
- Tam, C.; Babu, D.S.; Li, W. EN 206 Conformity Testing for Concrete Strength in Compression. Procedia Eng. 2017, 171, 227–237. [Google Scholar] [CrossRef]
- EN 12390-1. Testing Hardened Concrete—Part 1: Shape, Dimensions and others Requirements for Specimens and Moulds; CEN: Brussels, Belgium, 2013. [Google Scholar]
- ASTM C 192/C 192M. Standard Practice for Making and Curing Concrete Test Specimens in the Laboratory; ASTM: West Conshohocken, PA, USA, 2000. [Google Scholar]
- EN-206. Concrete—Specification, Performance, Production and Conformity; CEN: Brussels, Belgium, 2013. [Google Scholar]
- EN-12390-2. Testing Hardened Concrete—Part 2: Making and Curing Specimens for Strength Tests; CEN: Brussels, Belgium, 2019. [Google Scholar]
- Mouton, P.R. History of Modern Stereology, IBRO History of Neuroscience. 2005. Available online: http://www.ibro.info/Pub/Pub_Main_Display.asp?LC_Docs_ID=3159 (accessed on 14 April 2020).
- Krekule, I.; Kubinova, L.; Karen, P. Evaluation of geometry of three-dimensional objects rendered from serial section and IBM PC implementation of appropriate stereological methods. Acta Vet. Brno 1996, 65, 247–252. [Google Scholar]
- GNU Image Manipulation Program (GIMP 2.20). Available online: https://docs.gimp.org (accessed on 11 June 2019).


| Component | Concrete Aggregate with Maximum Grain Size: | |||
|---|---|---|---|---|
| Dmax = 8 mm | Dmax = 16 mm | Dmax = 31.5 mm | Dmax = 63 mm | |
| CEM 42.5 cement | 365 kg/m3 (118 dm3/m3) | |||
| Water | 182 kg/m3 (182 dm3/m3) | |||
| Fine aggregate (river sand 0/2 mm) | 662 kg/m3(250 dm3/m3) | |||
| Coarse aggregate (basalt grits 2mm/Dmax with composition as presented in Table 2) | 1350 kg/m3 (450 dm3/m3) | |||
| Superplasticiser | 1.0–1.5% cement weight (not included in the volume balance) | |||
| Pigment | 5% cement weight (not included in the volume balance) | |||
| w/c ratio | 0.50 | |||
| Paste content | 300 dm3/m3 | |||
| Mortar content | 550 dm3/m3 | |||
| Components of Coarse Aggregate | Aggregate with Maximum Grain Size: | |||
|---|---|---|---|---|
| Dmax = 8 mm | Dmax = 16 mm | Dmax = 31.5 mm | Dmax = 63 mm | |
| Basalt grits 2/8 mm | 1350 kg/m3 (450 dm3/m3) | 745 kg/m3 (248 dm3/m3) | 443 kg/m3 (148 dm3/m3) | 242 kg/m3 (81 dm3/m3) |
| Basalt grits 8/16 mm | --- | 605 kg/m3 (202 dm3/m3) | 303 kg/m3 (101 dm3/m3) | 302 kg/m3 (101 dm3/m3) |
| Basalt grits 16/31.5 mm | --- | --- | 604 kg/m3 (201 dm3/m3) | 403 kg/m3 (134 dm3/m3) |
| Basalt grits 31.5/63 mm | --- | --- | --- | 403 kg/m3 (134 dm3/m3) |
| Sample | Sample Dimensions [mm] | Minimum Size lmin [mm] | Maximum Grain Size Dmax [mm] | lmin/Dmax |
|---|---|---|---|---|
| prism | 40 × 40 × 160 | 40 | 8 | 5 |
| 16 | 2.5 | |||
| cubes | 100 × 100 × 100 | 100 | 8 | 12.5 |
| 16 | 6.25 | |||
| 31.5 | 3.17 | |||
| 150 × 150 × 150 | 150 | 16 | 9.37 | |
| 31.5 | 4.76 | |||
| 63 | 2.38 | |||
| 200 × 200 × 200 | 200 | 31.5 | 6.35 | |
| 63 | 3.17 | |||
| 250 × 250 × 250 | 250 | 63 | 3.96 |
| Sample Cross-Section Dimensions [mm] | Maximum Aggregate Grain Size Dmax [mm] | lmin/Dmax | Component Content in the Sample [dm3/m3] (Mean Values [dm3/m3]/Coefficient of Variation [%]) | |||
|---|---|---|---|---|---|---|
| Coarse Aggregate | Sand | Cement Paste | Mortar | |||
| 150 × 150 | 63 | 2.38 | 556 (5.9) | 188 (5.7) | 256 (6.2) | 444 (7.4) |
| 40 × 40 | 16 | 2.50 | 556 (7.6) | 171 (7.1) | 273 (7.3) | 444 (9.5) |
| 100 × 100 | 31.5 | 3.17 | 475 (6.3) | 237 (5.9) | 288 (5.8) | 525 (5.7) |
| 200 × 200 | 63 | 3.17 | 80 (8.4) | 218 (4.6) | 302 (4.8) | 520 (7.7) |
| 250 × 250 | 63 | 3.97 | 452 (7.7) | 231 (4.3) | 317 (4.7) | 548 (6.3) |
| 150 × 150 | 31.5 | 4.76 | 499 (7.2) | 222 (5.6) | 279 (5.8) | 501 (7.2) |
| 40 × 40 | 8 | 5.00 | 460 (6.2) | 241 (5.7) | 299 (6.6) | 540 (5.3) |
| 100 × 100 | 16 | 6.25 | 422 (8.8) | 231 (4.5) | 347 (4.6) | 578 (6.4) |
| 200 × 200 | 31.5 | 6.35 | 430 (6.9) | 244 (4.9) | 326 (5.0) | 570 (5.2) |
| 150 × 150 | 16 | 9.37 | 425 (6.8) | 252 (6.0) | 323 (6.6) | 575 (5.1) |
| 100 × 100 | 8 | 12.5 | 403 (6.3) | 262 (5.6) | 335 (6.7) | 597 (4.2) |
© 2020 by the authors. Licensee MDPI, Basel, Switzerland. This article is an open access article distributed under the terms and conditions of the Creative Commons Attribution (CC BY) license (http://creativecommons.org/licenses/by/4.0/).
Share and Cite
Śliwiński, J.; Duży, P. Impact of Sample Size and Maximum Aggregate Grain on the Representativeness of Concrete Samples. Energies 2020, 13, 3358. https://doi.org/10.3390/en13133358
Śliwiński J, Duży P. Impact of Sample Size and Maximum Aggregate Grain on the Representativeness of Concrete Samples. Energies. 2020; 13(13):3358. https://doi.org/10.3390/en13133358
Chicago/Turabian StyleŚliwiński, Jacek, and Patrycja Duży. 2020. "Impact of Sample Size and Maximum Aggregate Grain on the Representativeness of Concrete Samples" Energies 13, no. 13: 3358. https://doi.org/10.3390/en13133358
APA StyleŚliwiński, J., & Duży, P. (2020). Impact of Sample Size and Maximum Aggregate Grain on the Representativeness of Concrete Samples. Energies, 13(13), 3358. https://doi.org/10.3390/en13133358