Article

Eco-Efficient Value Creation of Residential Street Lighting Systems by Simultaneously Analysing the Value, the Costs and the Eco-Costs during the Design and Engineering Phase

Department Design Engineering, Delft University of Technology, Landbergstraat 15, 2628 CE Delft, The Netherlands
*
Author to whom correspondence should be addressed.
Energies 2020, 13(13), 3351; https://doi.org/10.3390/en13133351
Submission received: 13 May 2020 / Revised: 22 June 2020 / Accepted: 28 June 2020 / Published: 30 June 2020
(This article belongs to the Special Issue Life Cycle & Technoeconomic Modeling)

Abstract

:
In search of sustainable business models, product innovation must fulfil a double objective: the new product must have a higher (market) value, and at the same time a lower eco-burden. To achieve this objective, it is an imperative that the value, the total costs of ownership, and the eco-burden of a product are analysed at the beginning of the design process (idea generation and concept development). The design approach that supports such a design objective, is called Eco-efficient Value Creation (EVC). This approach is characterised by a two-dimensional representation: the eco-burden at the y-axis and the costs or the value at the x-axis. The value is either the Willingness to Pay or the market price. The eco-burden is expressed in eco-costs, a monetised single indicator in LCA (Life Cycle Assessment): an app for IOS and Android, and excel look-up tables at the internet, enable quick assessment of eco-costs. A practical example is given: the design of a new concept of domestic street lighting system for the city of Rotterdam. This new concept results in a considerable reduction of carbon footprint and eco-costs, and shows the benefits for the municipality and for the residents, resulting in a viable business case.

1. Introduction

1.1. The Issue: Progress in Sustainable Product Innovation, and Circular Business Models

There is a general concern about the increasing concentration of greenhouse gases in our atmosphere, materials scarcity, degradation of biodiversity, the plastic soup in the oceans, and many other pollutants like fine dust and NOx. As politicians set stricter targets (Kyoto protocol, Paris Agreement), and citizens become more and more aware of the severe consequences, business people realise that they should innovate their products and services. New business proposals must have a double objective: the new product must have a higher customer value, and at the same time a lower eco-burden. The higher customer value is needed to make the introduction of the product at the market a success, without the need for state subsidies.
The fact is that sustainable product innovation and introduction of circular business models is not easy. Although circular business models became a hype in Western Europe after the introduction of the Cradle-to-Cradle philosophy [1], and the business aspects of it [2,3], real successful implementations are rather limited [4,5,6,7] for many commercial business reasons. In addition, the environmental gains of circular business models are often much lower than it is suggested, especially with regard to the shift to services [8]. White et al. [9] (p. 1) writes about services: “It is clear that the simplest and most optimistic view—a service economy is inherently clean economy—is insufficient and incorrect. Instead, the service economy is better characterized as a value-added layer resting upon a material-intensive, industrial economy”. Tukker [10] has drawn a similar conclusion on Product Service Systems (PSS) after the comprehensive SusProNet study: PSS did not bring the enormous change that was hoped for. PSS might support new business models, but are not the solution as such. White et al. conclude that, even though growth in services might be less environmentally damaging than growth in manufacturing: “If services are to produce a greener economy, it will be because they change the ways in which products are made, used and disposed of—or because services, in some cases, supplant products altogether” [8] (p. 1). Therefore, one of the crucial aspects of the innovative design of sustainable products or services is that people will buy it and use it (instead of unsustainable alternatives). That is why we focus in this paper on value creation in the fuzzy front end of the design process, since that is the moment where the real sustainable innovation can take place. It is the moment for designers to contemplate radically different product or service systems, e.g., identifying ‘functional result’ alternatives [9]. In user-centred design, value creation for the customer is the main aim [11]. In Ecodesign, sustainability is the main aim [12]. However, in sustainable product innovation we need a combination of both [13], where value creation and sustainability go hand in hand, and where the classical contradiction between ecology and economy is being reconciled in a clever way. Only LCA (Life Cycle Assessment) can reveal to what extent a new design of a product chain is better in terms of sustainability. A practical issue in design is that the classical LCA method is too laborious and complex to be doable in the early design stages. The result is that, especially in the early design stages, the aspect of sustainability is only dealt with on a qualitative ‘gut feeling’ basis, often leading to wrong conclusions. The LCA is then done (if at all) when the detailed design is ready. At that stage, however, it is too late for drastic changes, resulting in a product design that is far from the optimum. In eco-efficient value creation, this issue has been solved in a practical way by tools for ‘Fast Track LCA’, enabling the assessment of the environmental impacts of multiple design concepts in a quick way.

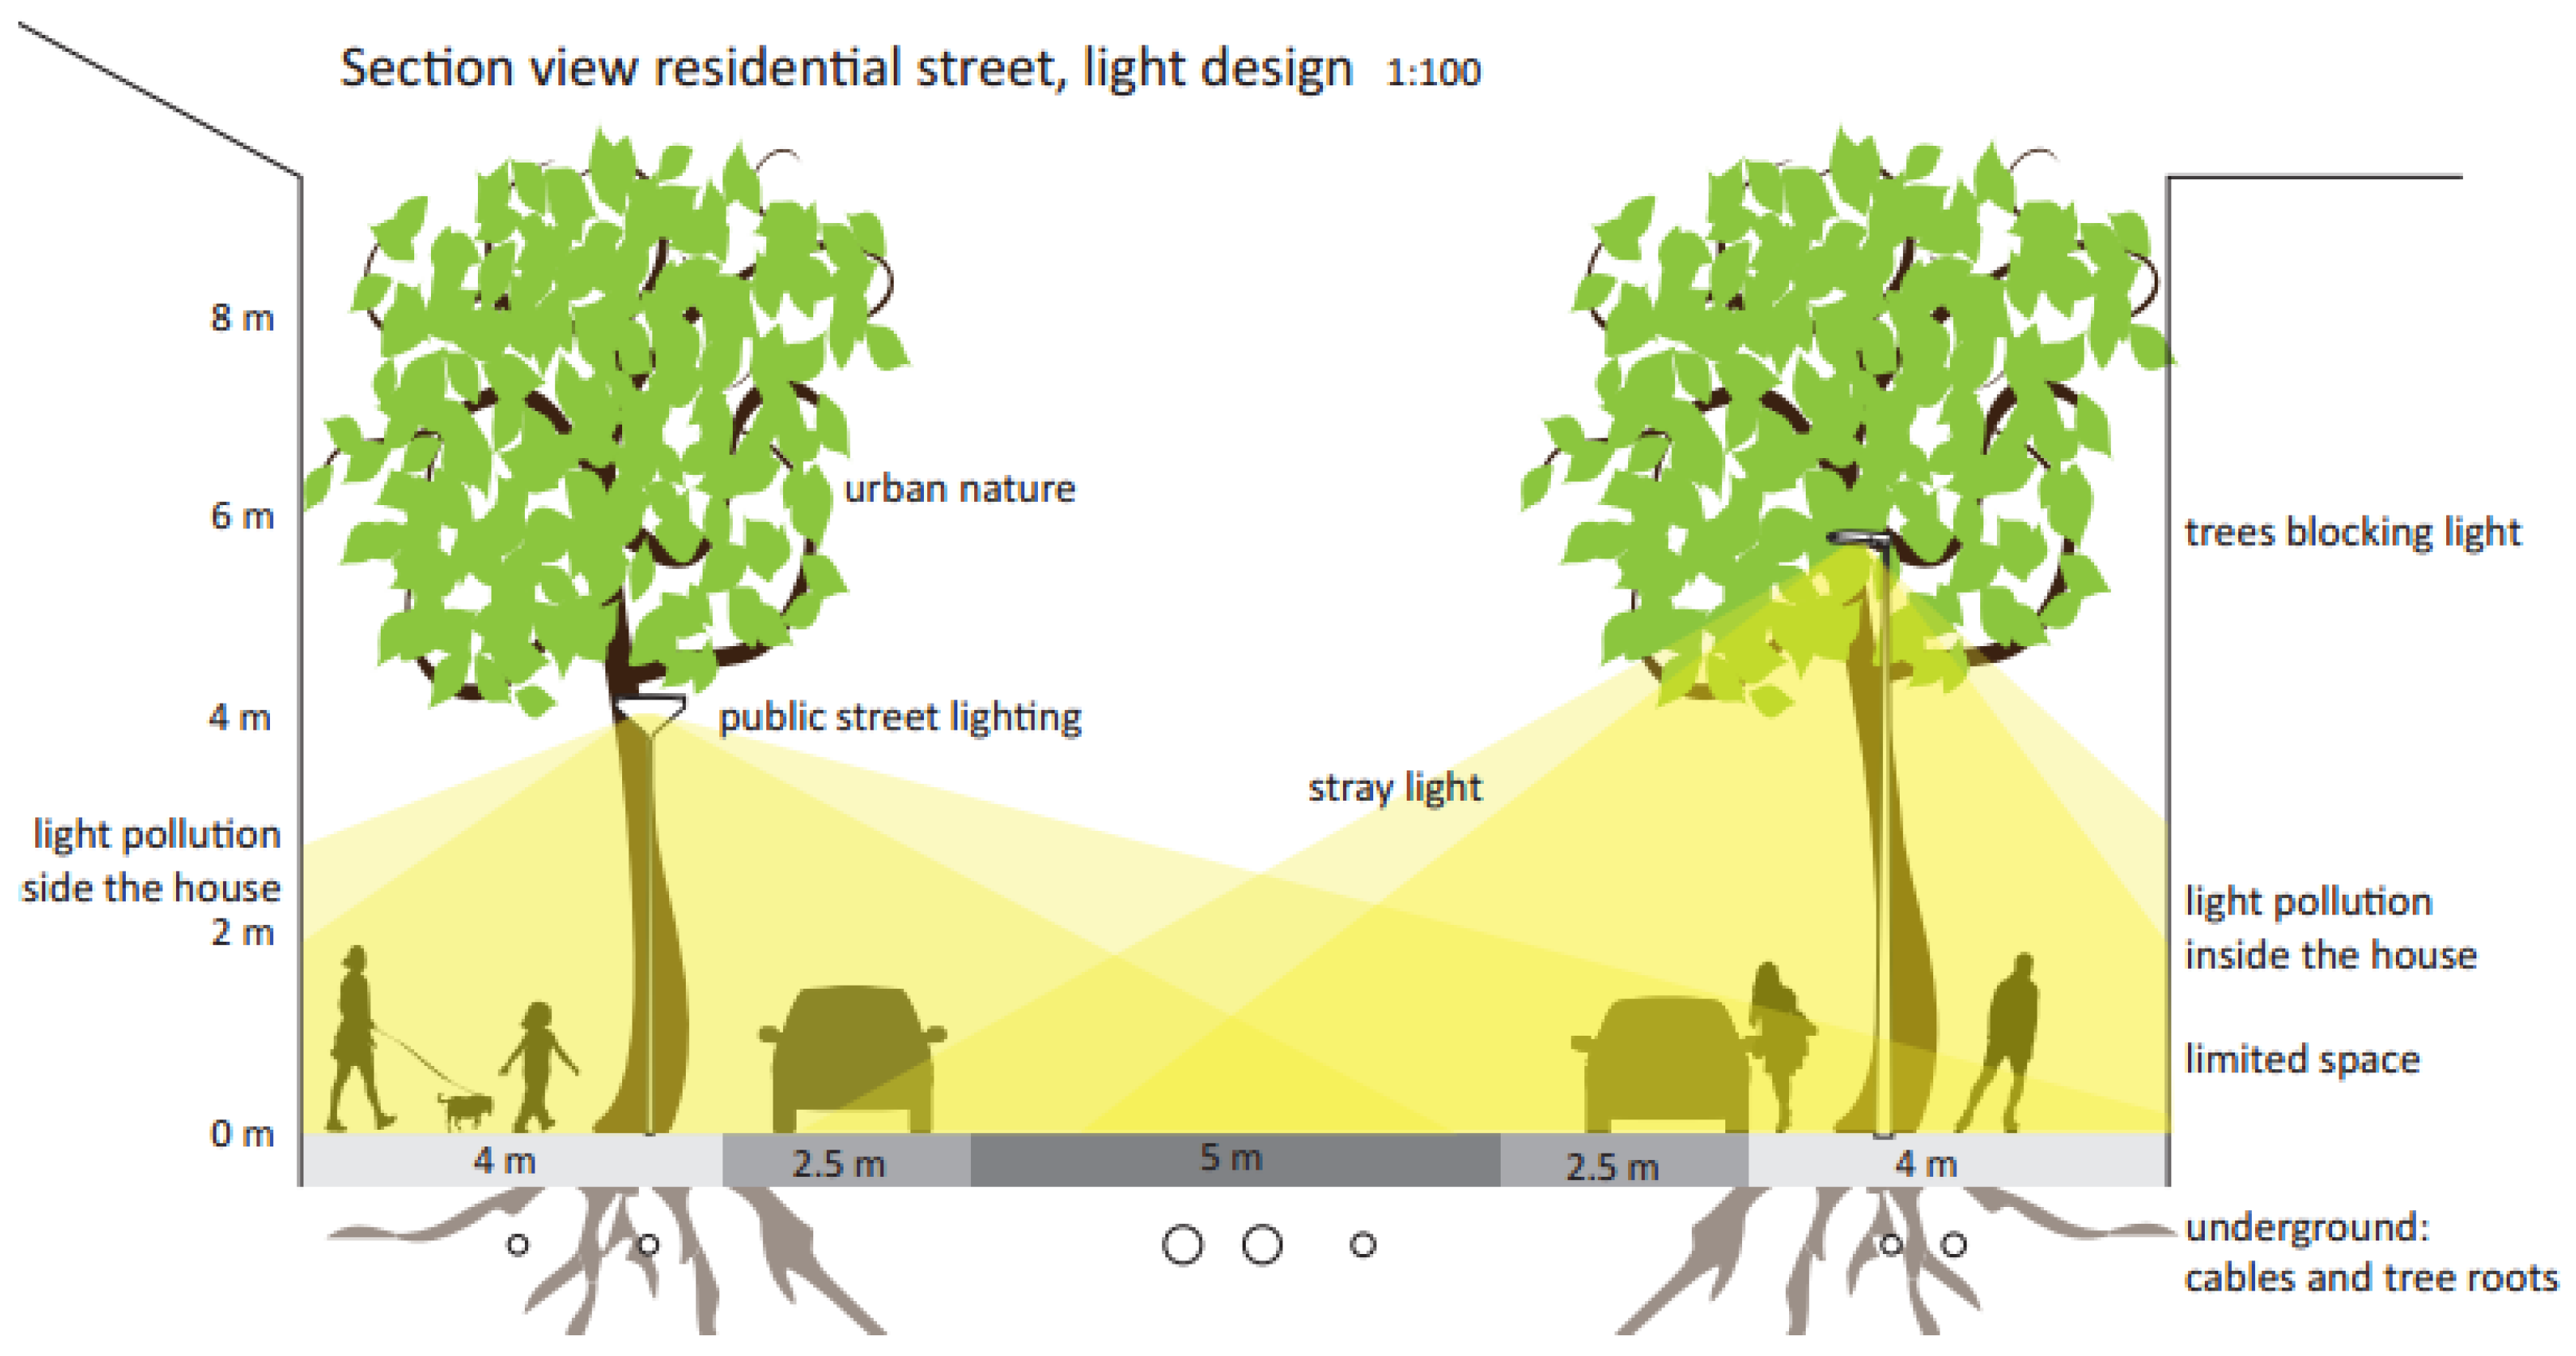
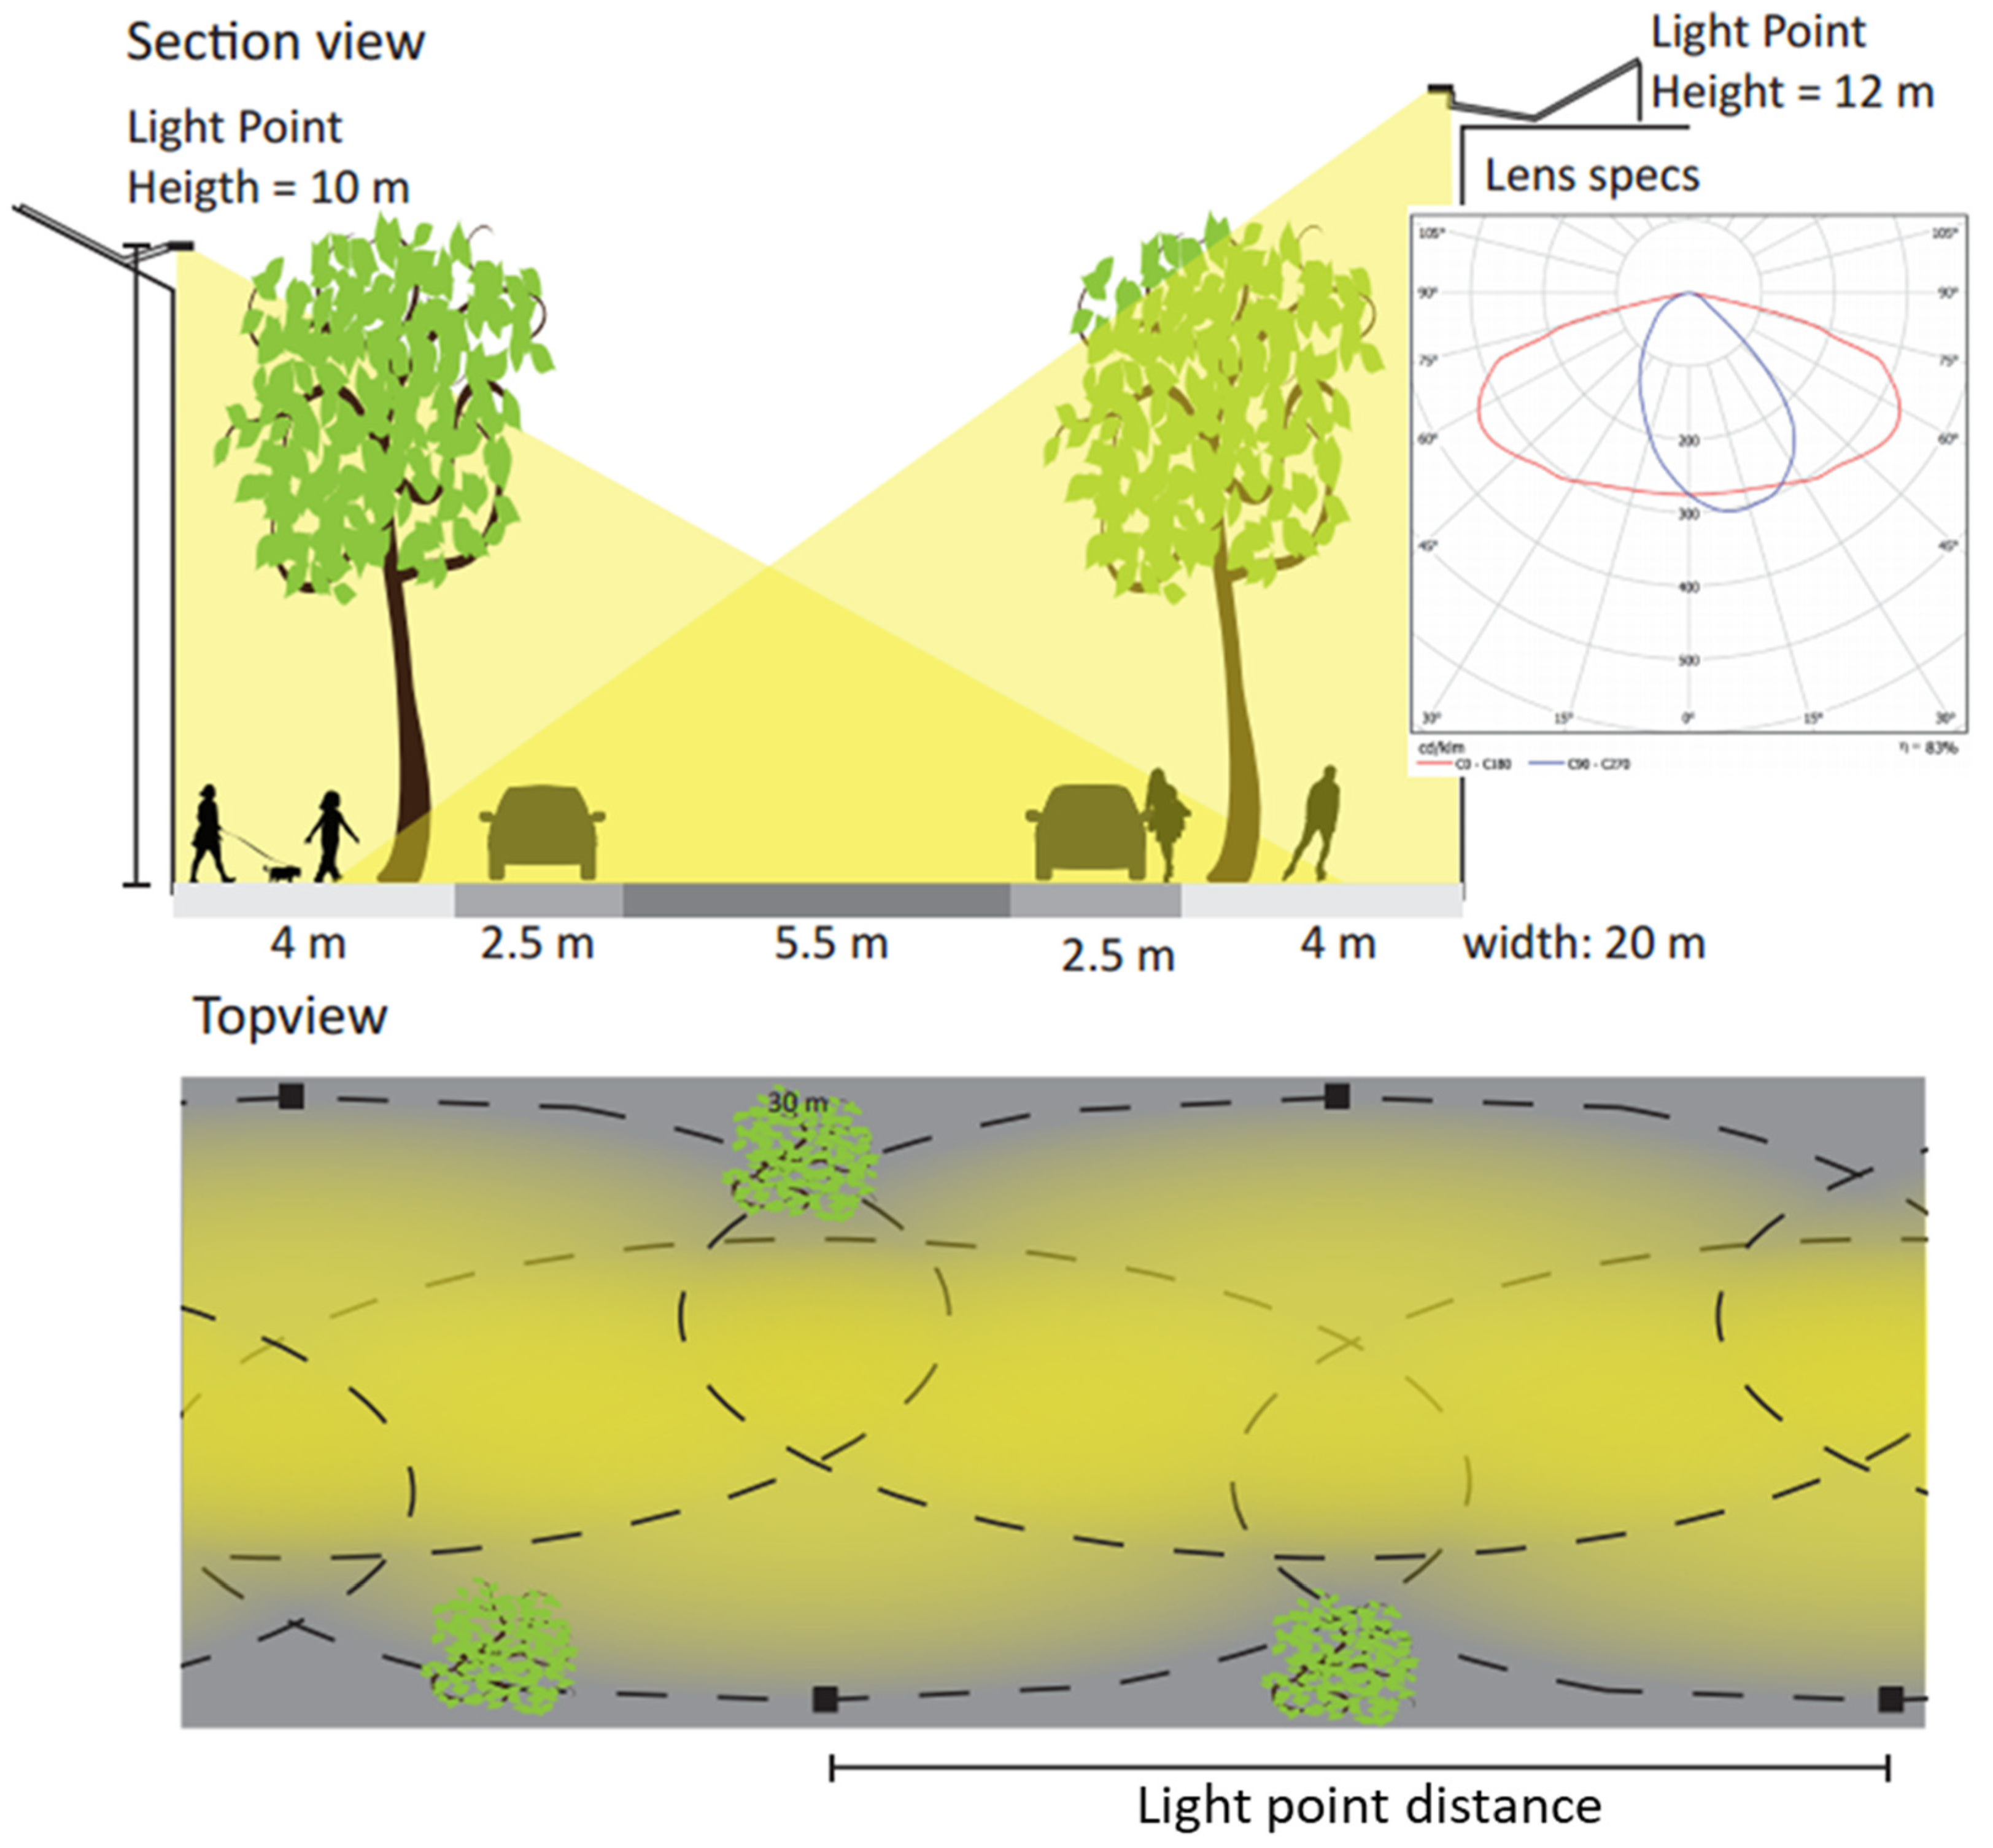
1.2. The Challenge: A Sustainable Street Lighting System for the City of Rotterdam

This paper presents the results of a practical case of eco-efficient value creation. It is the design of a street lighting system for a typical city in Western Europe: the city of Rotterdam.
Public street lighting has a major influence on safety [14,15], the perception of safety, and in general the atmosphere in the street. The municipality of Rotterdam has the desire to create a pleasant atmosphere in the city during both day and night by street lighting systems. An additional aspect of well-being in cities is the local presence of nature, i.e., trees [16,17]. So lighting and trees are both important aspects of the value for the citizens. However, in the conventional design of street lighting systems, there is a conflict below the ground: the roots of the trees interfere with the power cables, see Figure 1. This conflict causes difficulties during installation, maintenance and operation as well as end-of-life, which all lead to higher costs for the application of street lighting systems.
The underground conflict between tree roots and power cables can be solved in two different ways: (1) find other ways to create residential green, e.g., with plant boxes; or (2) redesign public street lighting. Within the first direction many solutions can be found, however, that is not the scope of this paper. To find acceptable solutions for the second direction is not easy. Since 1800, the lamppost has looked the same: a light source on a pole. Other forms such as hanging street lighting with hanging power cables above the ground are generally not regarded as desirable.
From the point of view of sustainability, the system requirement is obvious: the design must combine LED lighting with local PV cells as the source for the required electricity. Replacing the classic lamps by LED lamps is easy. Where to place the PV cells is less easy: (1) PV cells above the street will require expensive construction; (2) PV cells on the roof are a logical choice, but why would the owner of the building allow the municipality to attach the PV cells?
The design of a new street lighting system has to fulfil three value aspects for the 3 stakeholders: (1) the requirement of streetlights in combination with trees, which is the value for the citizens; (2) it must be affordable (not too expensive) for the municipality; (3) it must resolve the issue “what is in it for me?” for the house owner with regard to the PV cells. At the same time, the new system must have a (much) lower eco-burden score in LCA compared to the classical system of Figure 1.

2. The Methods

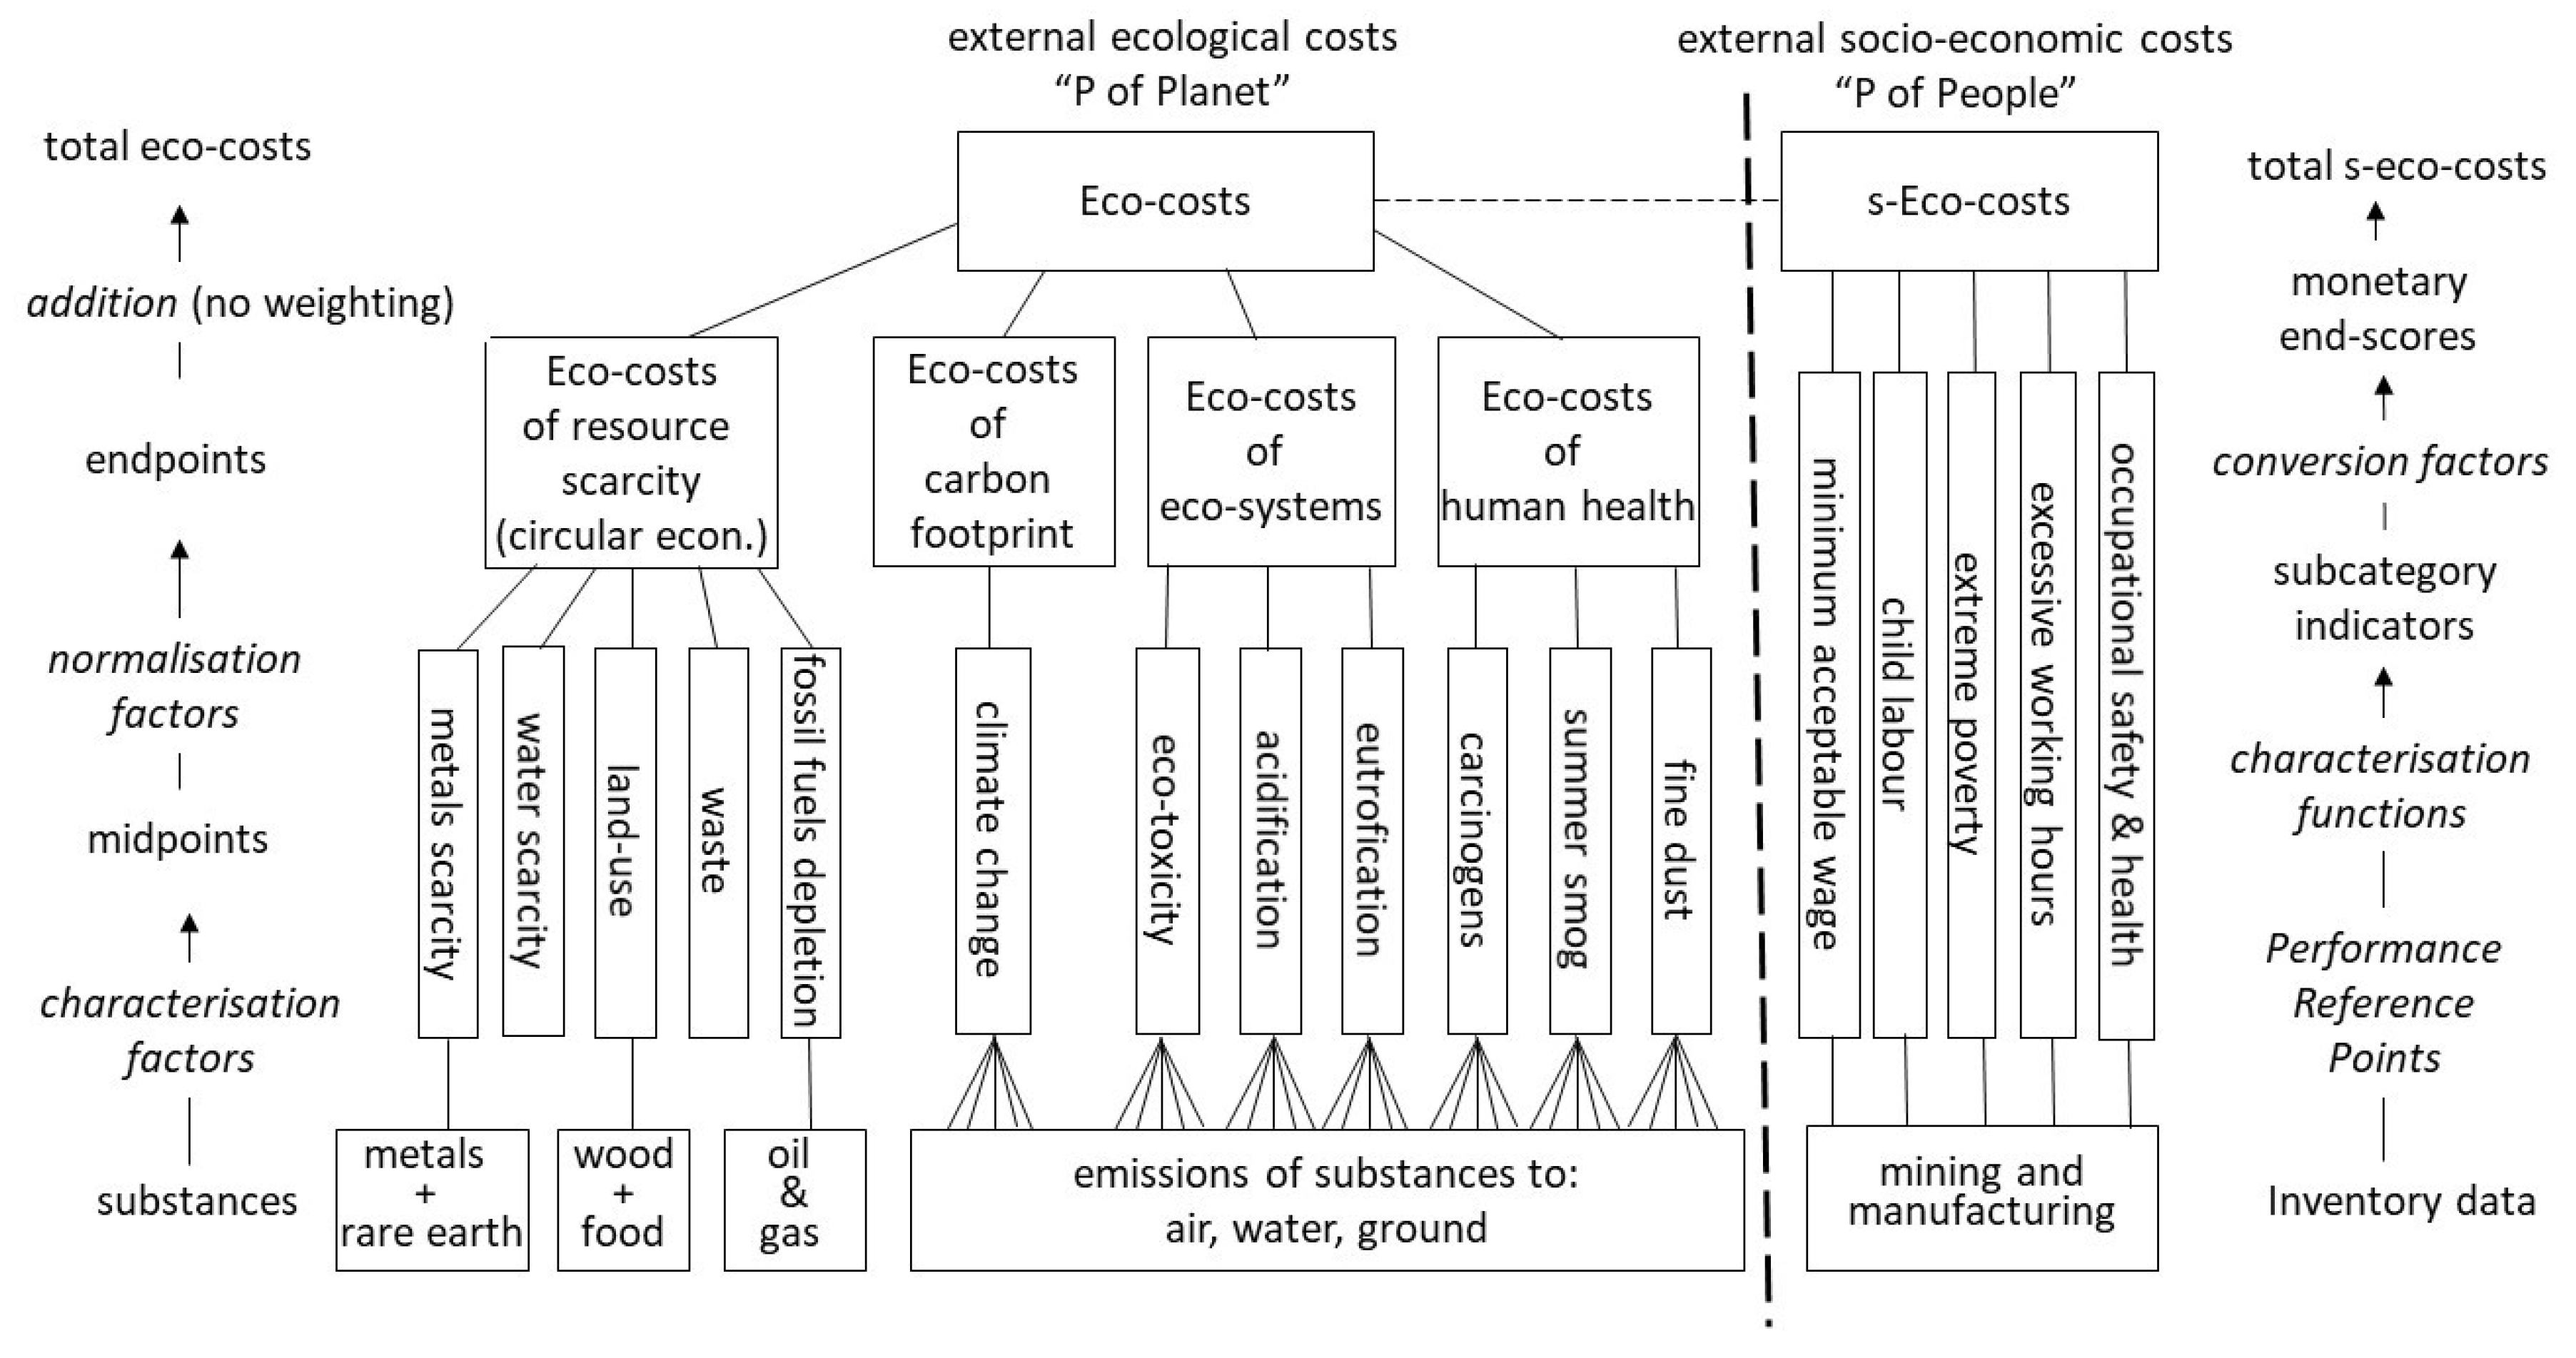
2.1. The Eco-Costs, a Monetized Single Indicator in LCA

The assessment of the eco-burden of a system is done by LCA. An important issue here is the choice of the indicator that is used for benchmarking. Such a benchmarking indicator can be a so called midpoint indicator (e.g., greenhouse gas, acidification, eutrification, fine dust, human toxicity, ecotoxicity), but the issue here is that every indicator leads to its own optimum choice in product design. A well-known example is the engineering of the Volkswagen diesel: by focusing on CO2 emissions only, and ignoring the consequences for NOx emissions, the strategic decisions of the company lead to losses of several billion euros.
The solution is to apply a so called endpoint indicator, which combines all midpoint indicators in one single score (i.e., damage based indicators like ReCiPe [18] and Ecological Footprint [19], both in ‘points’, or monetized scores like EPS [20] and eco-costs [21]). There is no single truth in single endpoint indicator systems, since such a system reflects a set of values and assumptions, but it is generally acknowledged that single score systems are needed in LCA benchmarking. A well-documented scientific single indicator system is always better than a set of many midpoint scores of which one or two are selected on the basis of a personal, subjective point of view [22,23].
It is useful to select a monetised single indicator in LCA, since it is related to the concept of ‘external costs’ (i.e., environmental costs to our society that are not included in the current product costs) and thus enables the comparison with the costs and the market value of the design. In the scientific literature there are two operational monetized systems that are widely applied in LCA: EPS 2015 (a damage-based indicator) [20] and Eco-costs 2017 (a prevention-based indicator) [21]. The advantage of monetized systems is that they do not suffer from the inaccuracies of the normalisation and weighting steps.
For the street lighting system study in Rotterdam, the eco-costs was selected as a monetised single indicator, since it is the most comprehensive system in terms of midpoints, see Figure 2, and it is the most applied system in science as well as design engineering.
The eco-costs system has been developed in the period 1999–2002 [24,25,26] and updated in 2007, 2012 and 2017 [27]. The system is in compliance with ISO 14008 [28]. A further description of the monetisation factors can be found in [29].
The way the total eco-costs of a system like street lighting are calculated, is explained by Figure 3. The first step in LCA is to determine the so called Life Cycle Inventory (LCI) list of all polluting emissions (CO2, SO2, NOx, fine dust, etcetera) and all required resources (metals, energy carriers, water, land). The system delivers a product or service as output (in this case light), and comprises a lot of subsystems and processes (in this case the lampposts, the cables, the light bulbs, the installation processes, and the end-of-life processes). All these subsystems and processes need material, transport and energy (electricity and heat) as input.
The second step in LCA is called the Life Cycle Impact Assessment (LCIA). The goal of this step is to provide a practical interpretation of the long list of emissions and required resources of Figure 3. According to ISO 14044 [30], this is done via the calculation structure of Figure 2. The substances of the list are classified in terms of their effect, multiplied by characterisation factors, and added up within their own ‘midpoint’ groups (i.e., climate change, eco-toxicity, acidification, fine dust, carcinogens, etcetera). Then the midpoint groups are combined to ‘endpoints’ (so called Areas of Protection) after either a monetisation step (e.g., eco-costs), or by ‘normalisation’ (e.g., ‘points’ in the ReCiPe system). In the case of monetisation, the ’endpoints’ can be added up to a total end-score, in our case eco-costs. (Non-monetised systems need an extra step to weight the relative importance of the points of the Areas of Protection).
LCA calculations can be made either with special software (e.g., Simapro, Gabi, Open LCA), or by means of look-up tables in excel. These tables are available for eco-costs of pure emissions, but also for the aggregated eco-costs at the level of materials (metals, plastics, wood etc.), manufacturing processes (deep drawing, turning, welding, extrusion, coating etc.), components (lamp bulbs, printed circuit boards, PV panels), transport, energy, and end-of-life processes [31]. These look-up tables have been calculated with the use of formal LCI databases, and enable a simplification of the final LCA calculation (without losing accuracy) in a way that is quite similar to cost accounting in projects (multiplying quantities with its eco-costs scores of supplies and processes, and adding it up to the total eco-costs). An example of such an LCA is given in Table 1. The table provides output data (in eco-costs and in CO2 equivalent) for one classical lamppost (type ‘Kegeltop’ on a 4 m pole). Note that the calculations in Section 3 (Results) show data per year, under the assumption that the lifespan of a lamppost is 40 years, and per street, under the assumption that a street has 100 lampposts.

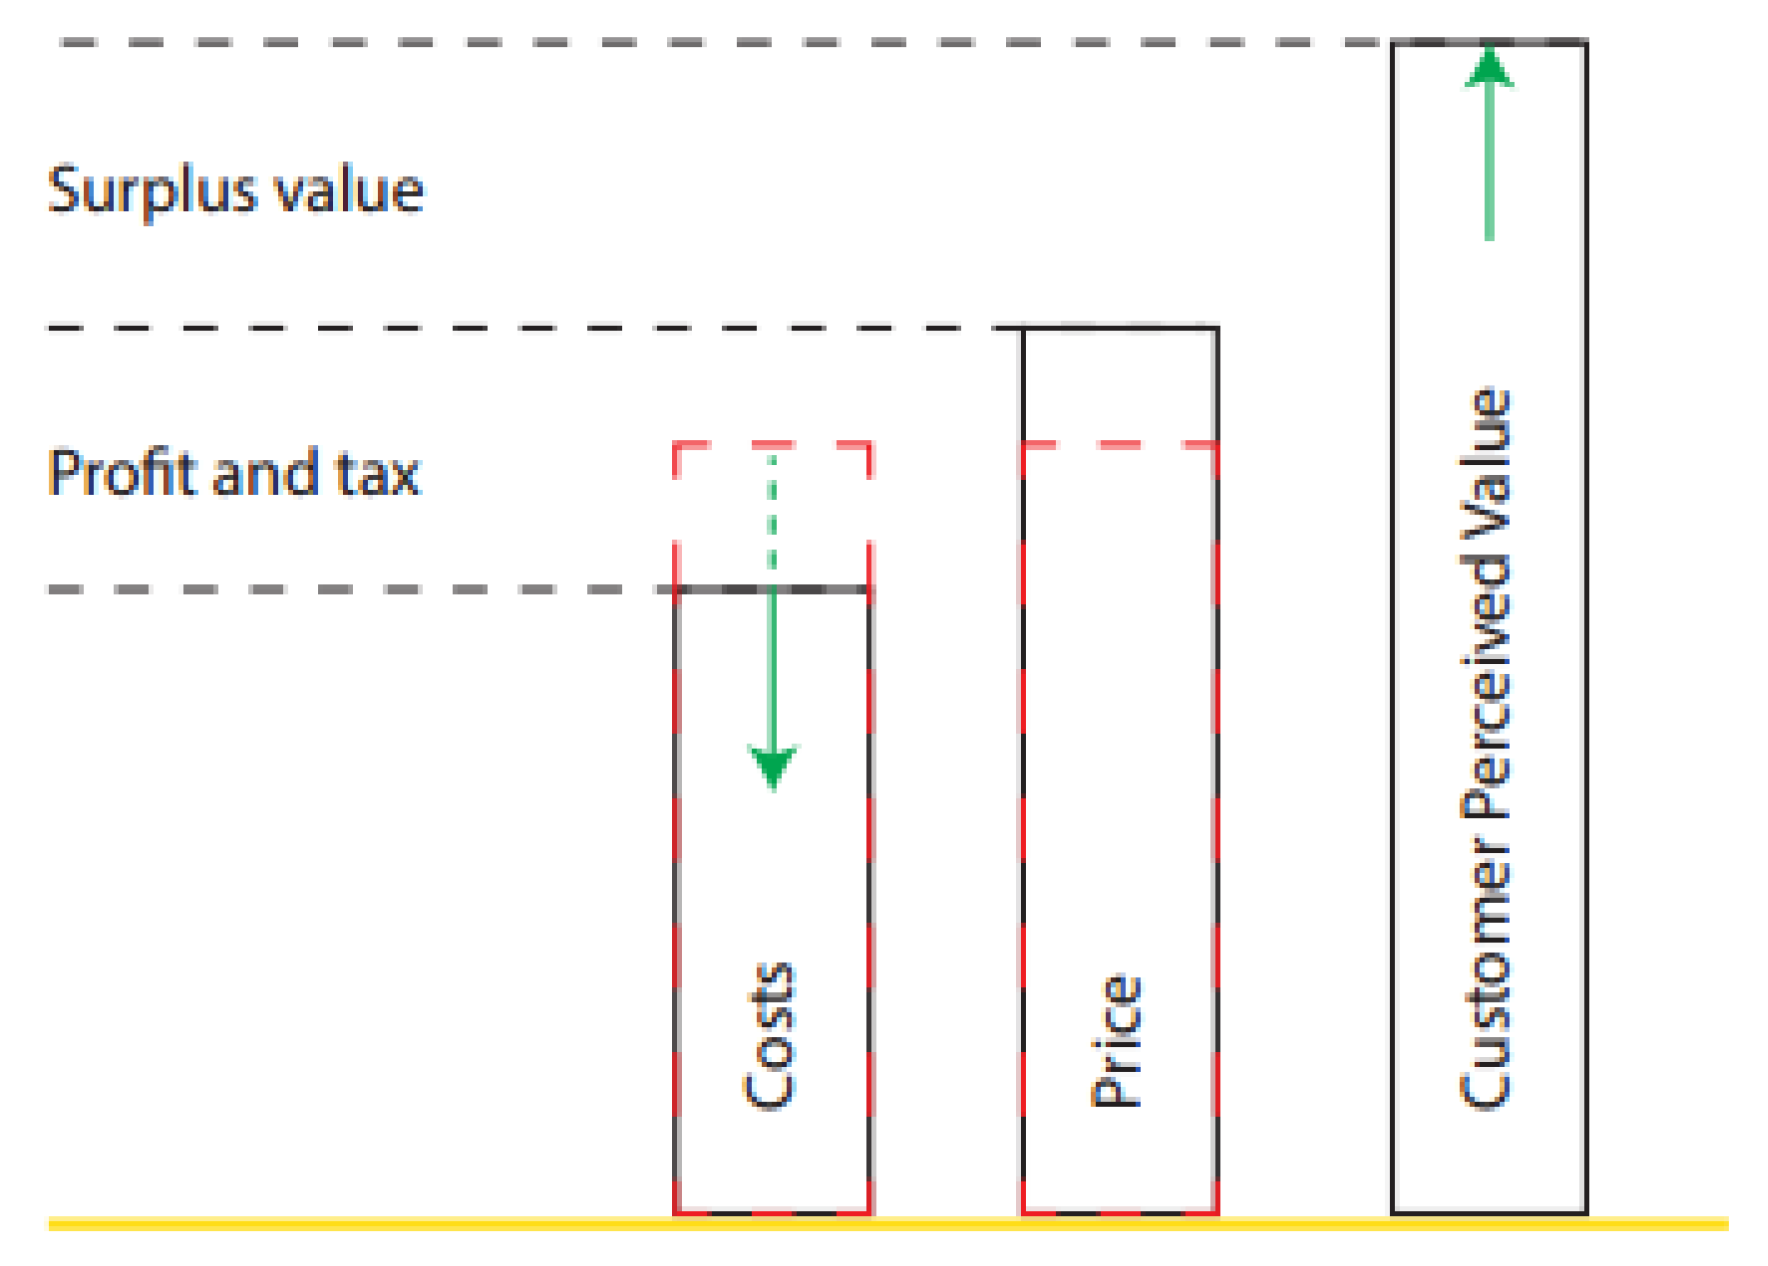
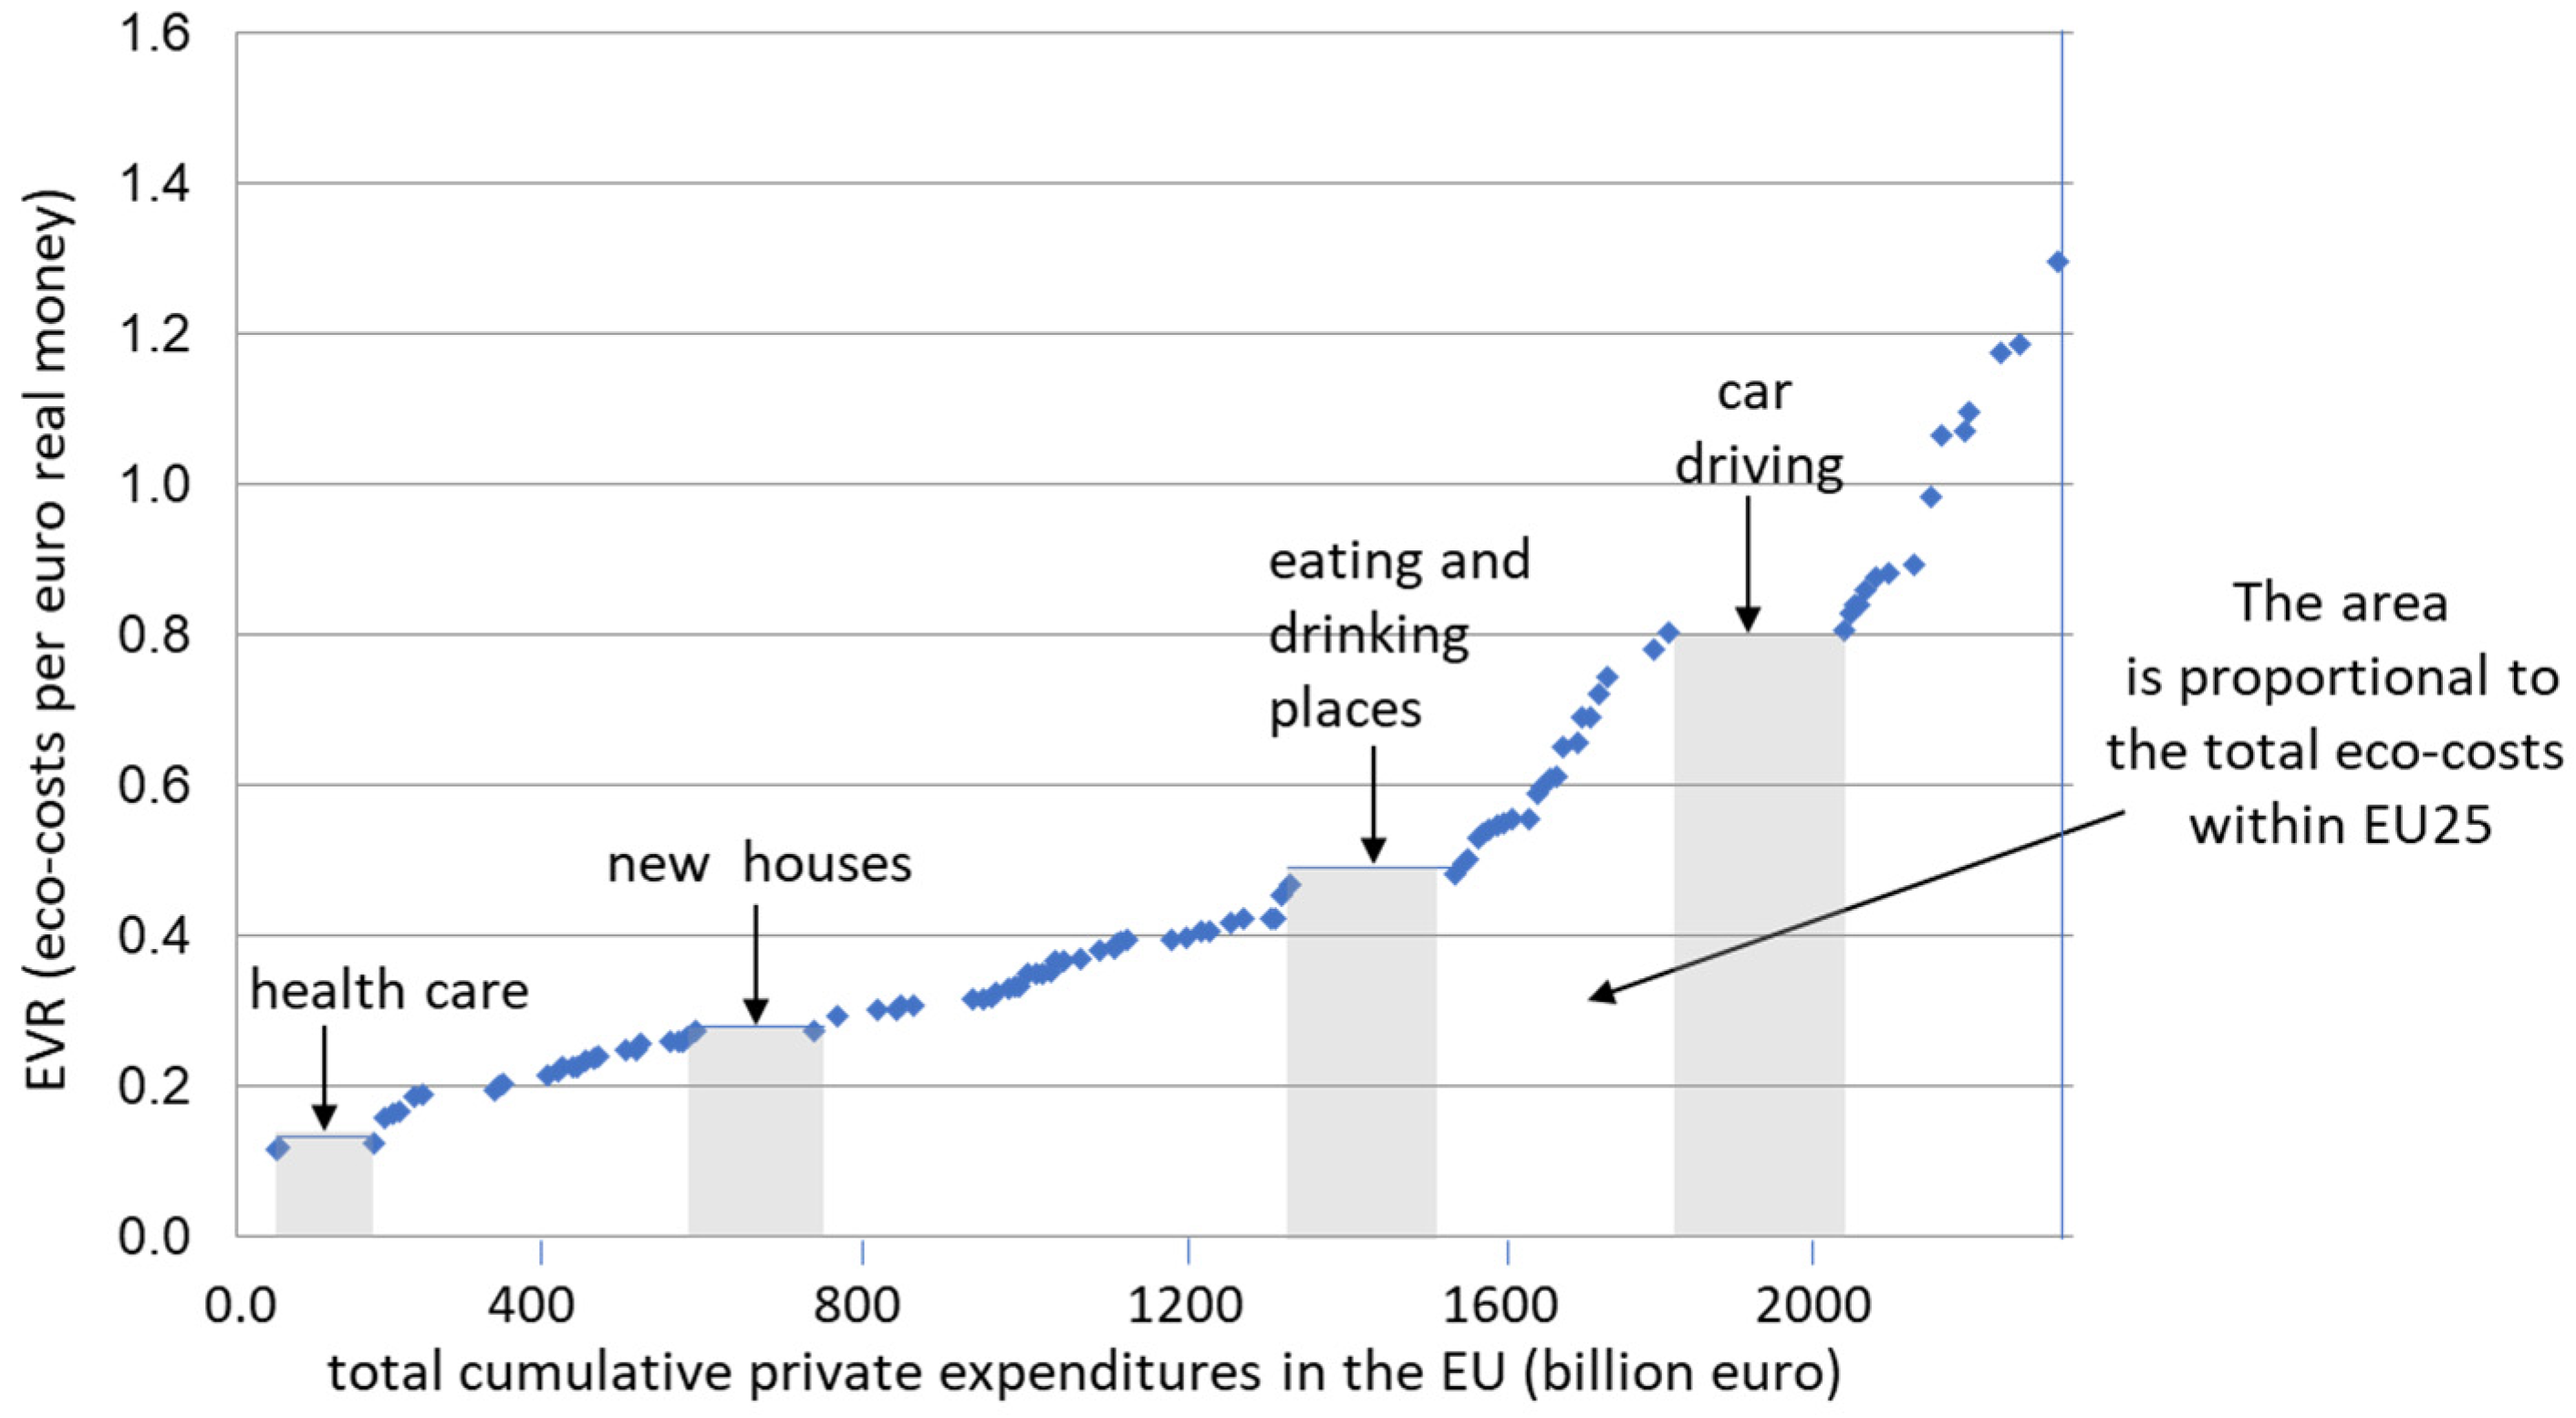
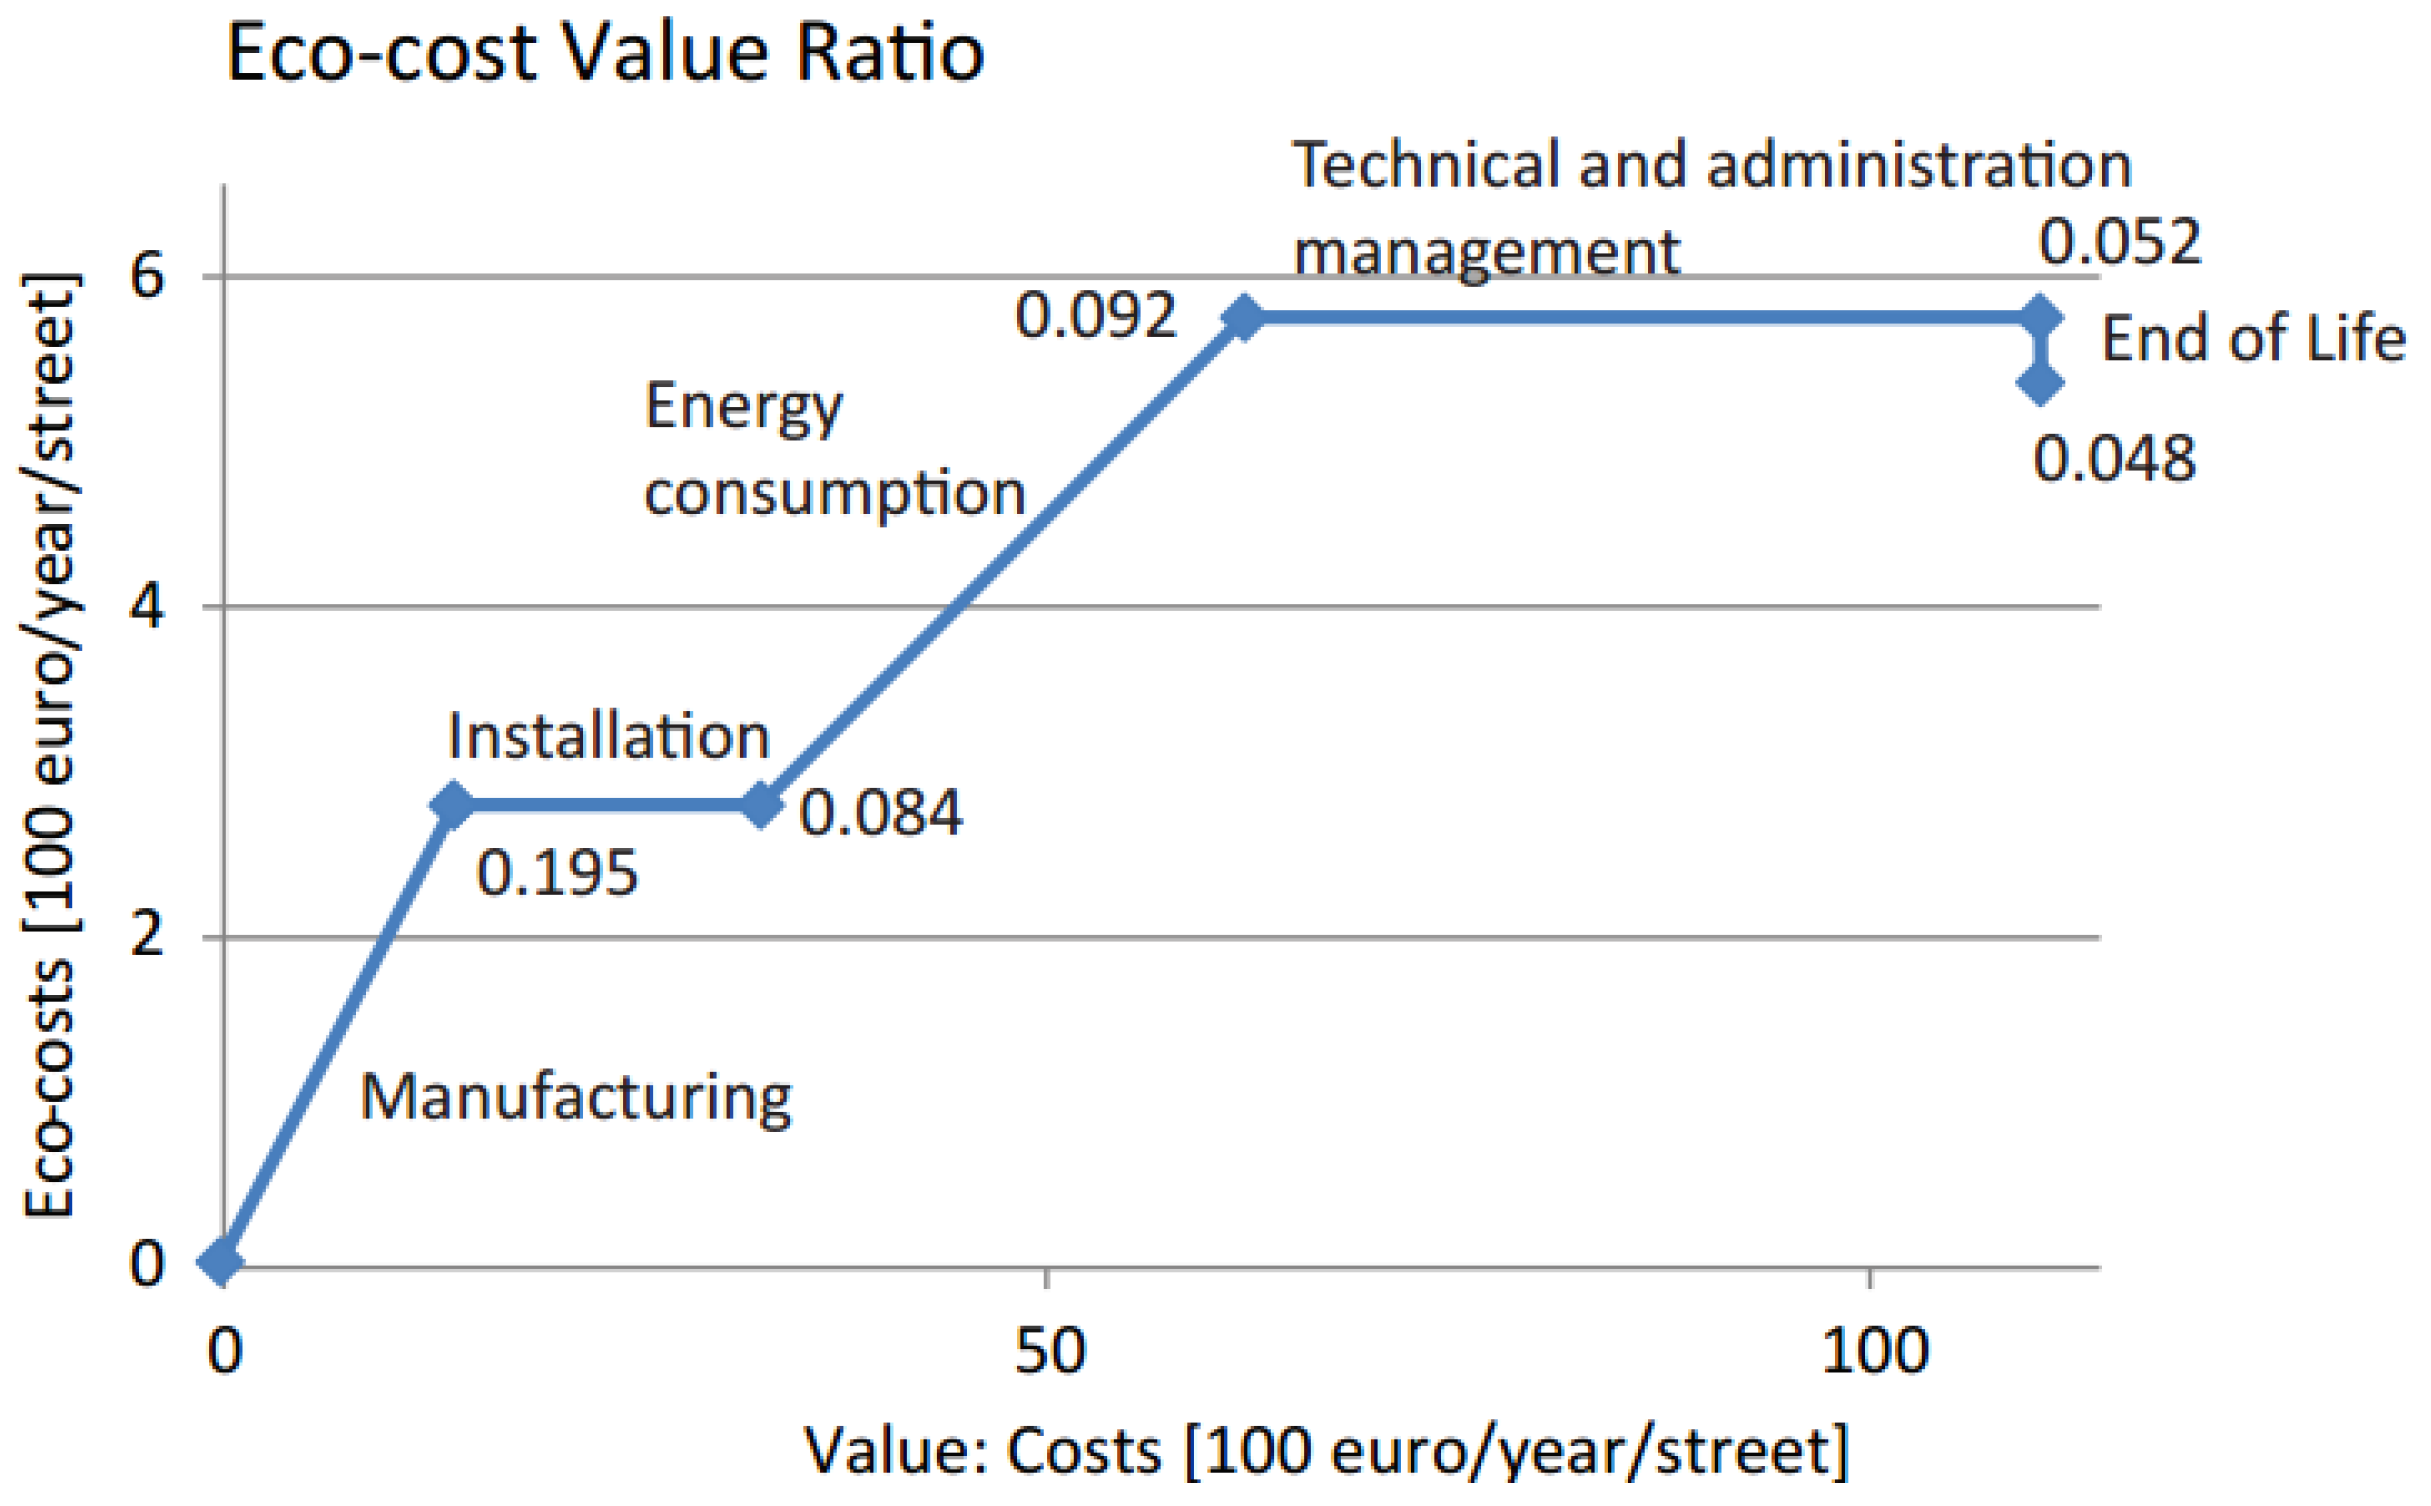
2.2. The Model of the Eco-Costs/Value Ratio

The basic idea of the model of the Eco-costs / Value Ratio (EVR) is to link the value chain of Porter [32], to the ecological product chain. In the value chain, the added value (in terms of money) and the added costs (from Life Cycle Costing, LCC) are determined for each step of the product chain, cradle-to-grave. Similarly, the ecological impact of each step in the product chain is expressed in terms of money, the eco-costs. See Figure 4.
The theory of Porter, and so Figure 4, deals with the manufacturing of (physical) products for end-users (consumers). In a slightly more complex form, this theory can also describe the ‘profit pool’ [34] of a circular business model, or a service, since industrial services are bundles of products that deliver a function to the end-user. Street lighting is an example of such a service: its main function is light at night to provide safety, delivered by a bundle of products and services (lampposts, electricity, and maintenance). It is important here to realise that the value (of a product or service) for an individual buyer is not equal to the market price. The value is the Customer Perceived Value (CPV) [35,36,37], also called Willingness to Pay. The relationship between the costs, the price and the CPV is depicted in Figure 5.
In our free market economy, the costs should be lower than the price, to support the profit of the company without subsidies. On the other hand, a product can only be marketed successfully when the CPV is higher than the market price, since people tend to buy things only when the perceived value for them is higher than the price they have to pay. The CPV can be defined as the benefit (utility plus joy) that is expected after the purchase. We call the difference between the price and the CPV the Surplus Value for the individual buyer. In the free market economy, the (market) price is set at a level that attracts sufficient buyers in order to reach an economy of scale that keeps the costs low enough.
For a municipality, costs and price are the same (red dotted lines in Figure 5), because they do not have the goal of making profit. However, the surplus value (for its citizens) must be positive, otherwise a project will not be accepted by the public.
In fact, the EVR model entails multiple dimensions. However, to show the build-up of the product in the chain, it is better in most cases to display only two dimensions at a time (see the figures in Section 3.1 and Section 3.2 as an example for the base case of streetlighting) to avoid complex 3-D charts: the eco-costs at the y-axis, and one of the financial dimensions at the x-axis.
Under the assumption that most of the households spend in their life what they earn in their life (the bank savings ratio is <5% in most countries), the total EVR of the spending of households is the key towards sustainability. Only when this total EVR of the spending is consistently lowered, the eco-costs related to the total spending will be reduced (even at a higher level of spending). This issue is explained by a short macro-economic analysis on what happens in the European Union. Figure 6 shows the EVR (= eco-costs/price) on the Y-axis as a function of the cumulative expenditures of all products and services of all citizens in the EU25 on the X-axis. The data is derived from the EIPRO study of the European Commission (EIPRO = environmental impact of products) [38].
The area underneath the curve is proportional to the total eco-costs of the EU25. Basically, there are two strategies to reduce the area under the curve:
  • force industry to reduce the eco-costs of their products (this will shift the curve downward);
  • try to reduce expenditures of consumers in the high end of the curve, by attractive offerings at the low end of the curve (this will shift the middle part of the curve to the right).
The question is now how designers and engineers can contribute to this required shift towards sustainability. Key is product innovation that fulfils the double objective of a higher CPV, and at the same time a lower eco-burden. To achieve this objective, it is an imperative that the designer must look at the CPV as well as the eco-costs at the beginning of the design process (i.e., idea generation and concept development). Eco-efficient Value Creation is a structured design method to achieve this.

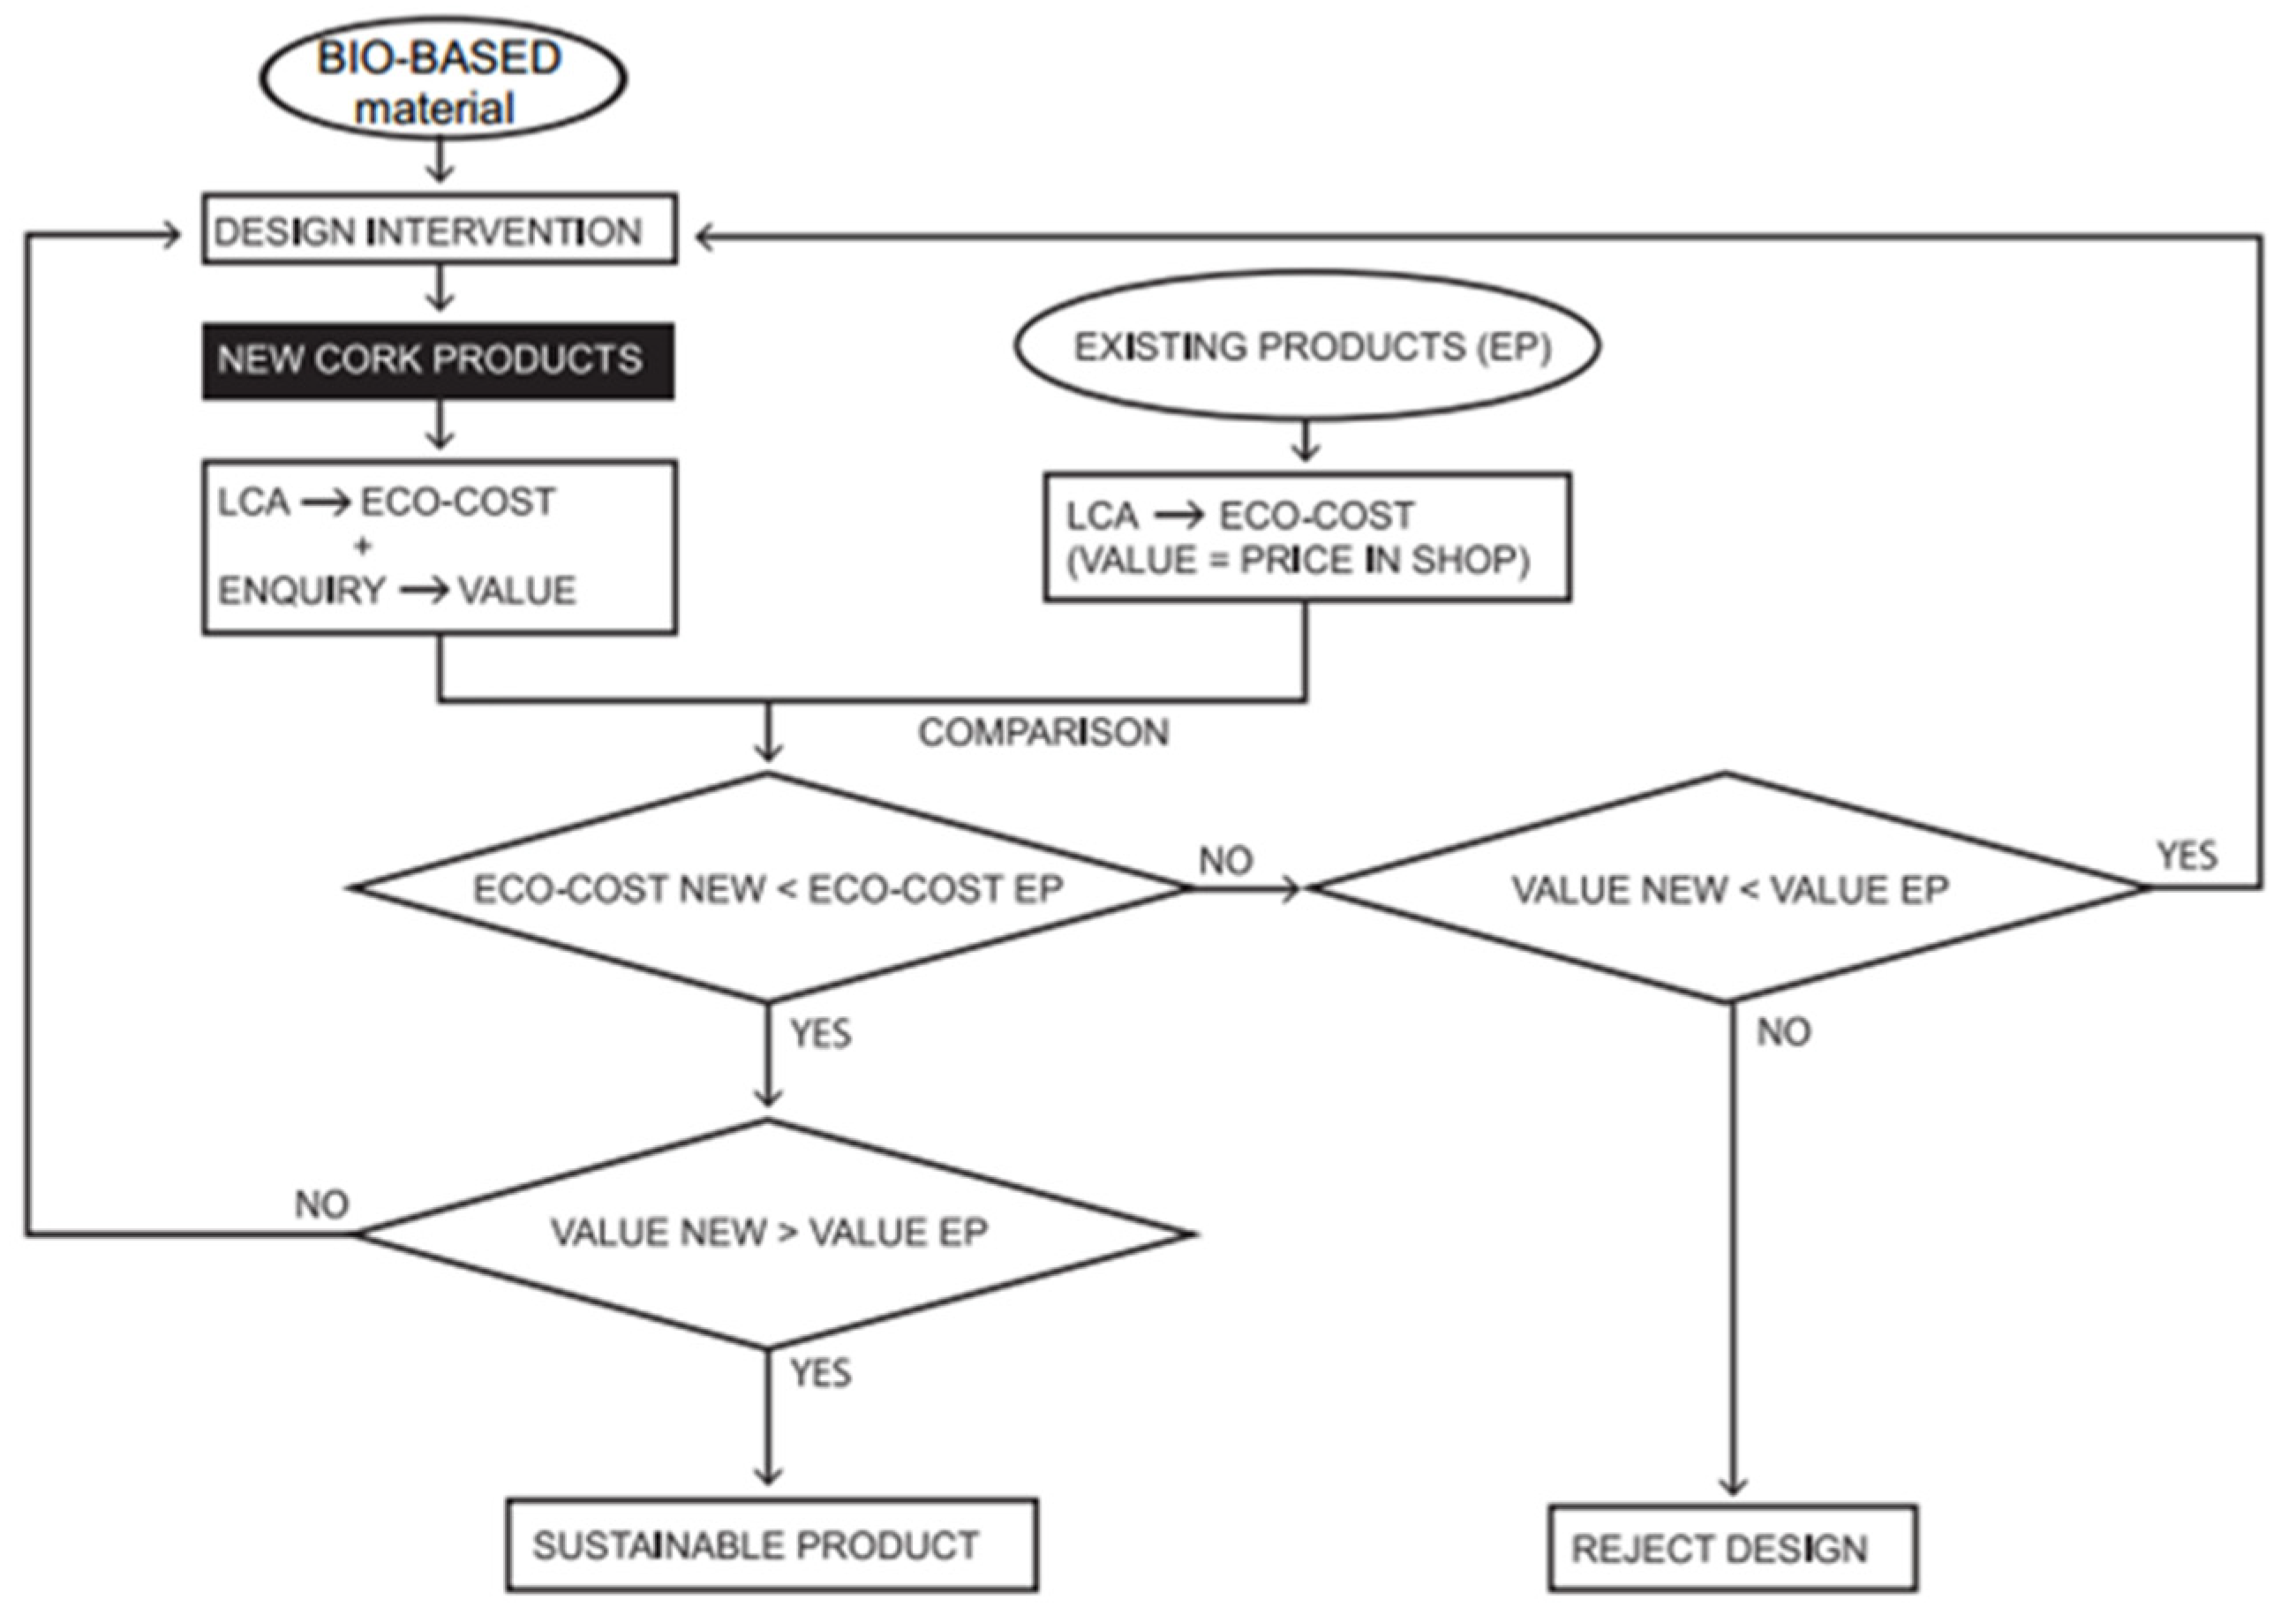
2.3. Eco-Efficient Value Creation

In search of sustainable business models, product innovation must fulfil the double objective of eco-efficiency [39,40,41]. To achieve this objective, it is an imperative that the value, the total costs of ownership, and the eco-burden of a product are analysed at the beginning of the design process (idea generation and concept development).
The successful design options for Eco-efficient Value Creation are:
  • to increase value where value is high (more quality, service, life span, and image);
  • to decrease the eco-costs where the eco-costs are high (a shift to bio-based materials, recycling and renewable energy).
End-of-life solutions are important as well. Landfill reduces the value of the total system, and leads to higher eco-costs. Recycling (as well as re-use and remanufacturing) results in an added value combined with lower eco-costs (‘end-of-life credits’ in LCA).
A comprehensive checklist on the reduction of eco-costs is provided by the LiDS Wheel of Eco-Design [12], but the real issue of eco-efficient value creation is how to enhance the Customer Perceived Value of a green product at the same time. Mestre [13] studied the eco-efficient value creation with cork as bio-based material, and described the basic principles for the fuzzy front end of the design, see Figure 7, where, according to Mestre, “it is the talent of the designer that creates the value of the product” (page 13). In fact, sometimes a bit more eco-costs must be allowed to enhance the value considerably, leading to a better EVR score of the design.
Figure 7 clearly shows that the transformation towards a circular economy fulfils the double obligation of eco-efficient value creation. However, it also shows that designing a sustainable circular system needs to address more than circularity only: other aspects such as clean production, minimum transport and optimal marketing play an important role as well. To assess the environmental aspects (eco-costs), LCA is an indispensable tool throughout all stages of product development, see Figure 8. However, the classical LCA approach is only doable at the final detailed design stage, because it is too laborious [42]. To enable LCA-based materials selection in the fuzzy front end of idea generation, excel look-up tables [31] and an app for IOS and Android have been developed [43]. A special version of this app can make Fast Track LCAs, to optimize the design in the concept development phase (e.g., to analyse the trade-off of choices on materials, transport distances, and required energies).
The approach of eco-efficient value creation can be characterised by 6 sequential steps:
Stpe 1
Life Cycle Thinking: At the start of the design process, the basic questions on circular design are whether or not the product must be suitable for easy repair, takeback + remanufacturing, or takeback + recycling of the materials. Note that circular designs are not always realistic in practice (because of long life times, high costs of return transport to the factory, low quantities, high remanufacturing costs, governmental regulations etc.). So Life Cycle Thinking must comprise many aspects that are on a higher level than the product chain itself [45].
Step 2
Functional requirements, and possible add-ons to enhance the CPV: Establish the ‘musts’ and the ‘wants’ in terms of functionalities, and in terms of enhancing the CPV [46].
Step 3
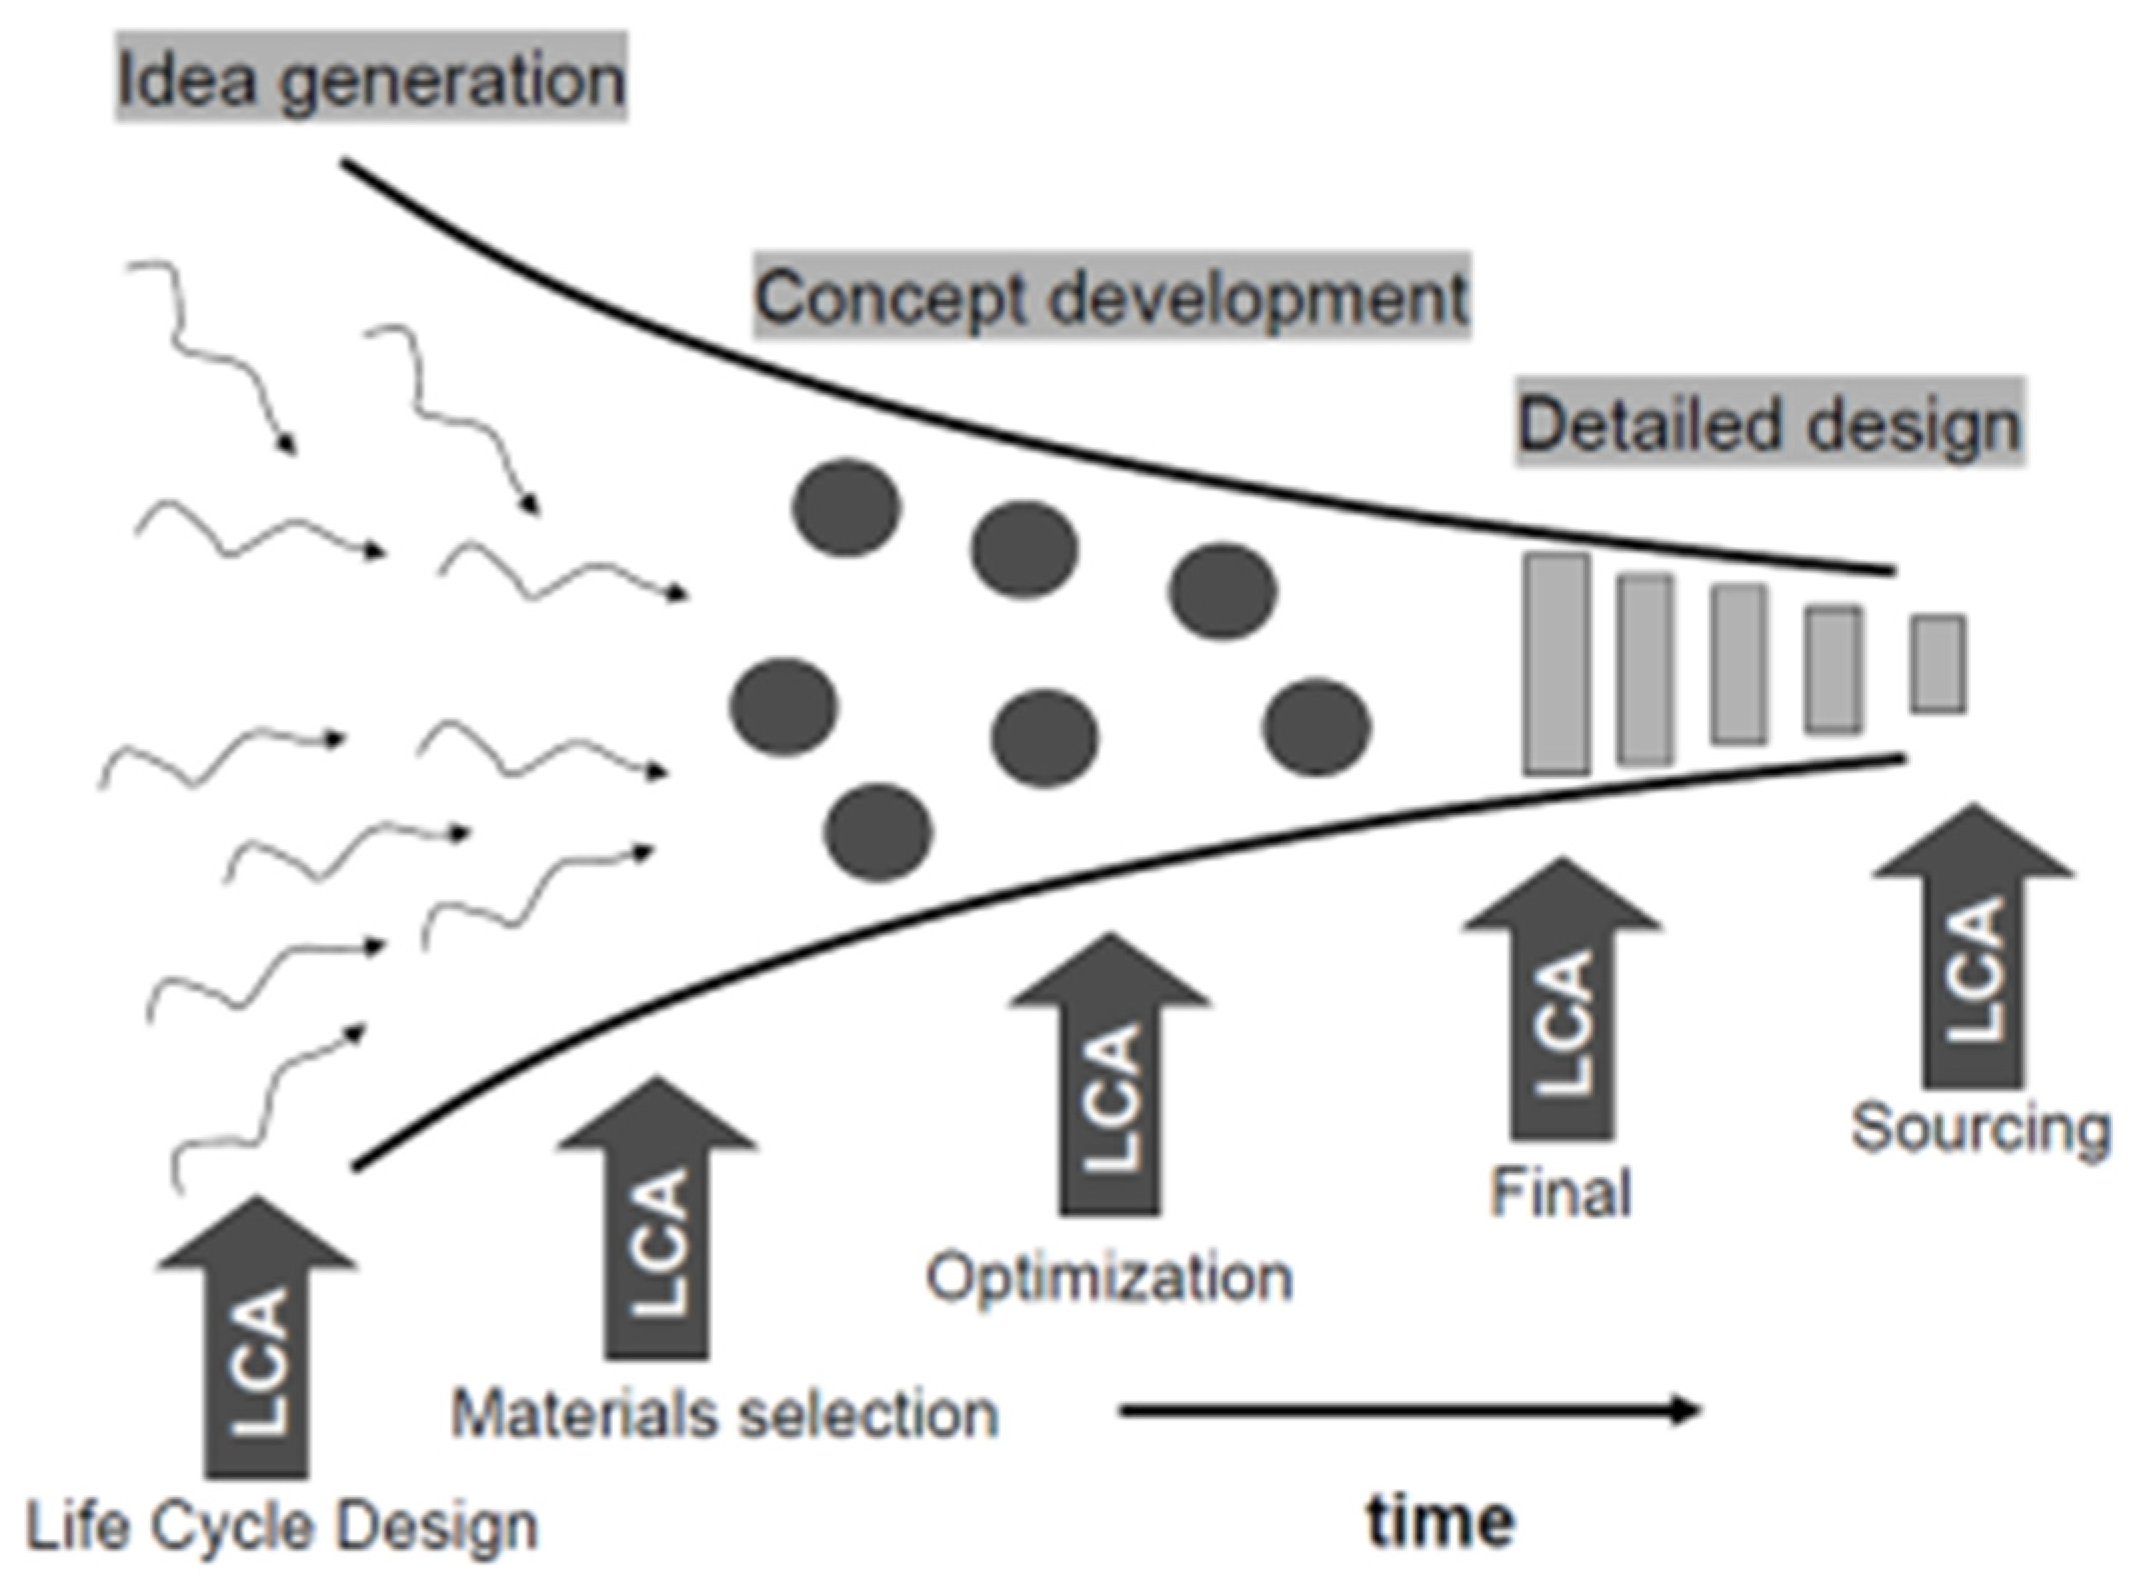
Idea generation and materials selection: The designer might be inspired by biomimicry, nature-inspired design, bio-inspired design, C2C, and other philosophies and design tools [47]. Since the choice of materials plays a governing role in this design stage [48], the LCA-based Idemat app for materials selection (specially developed to support eco-efficient value design) might be applied [43].
Step 4
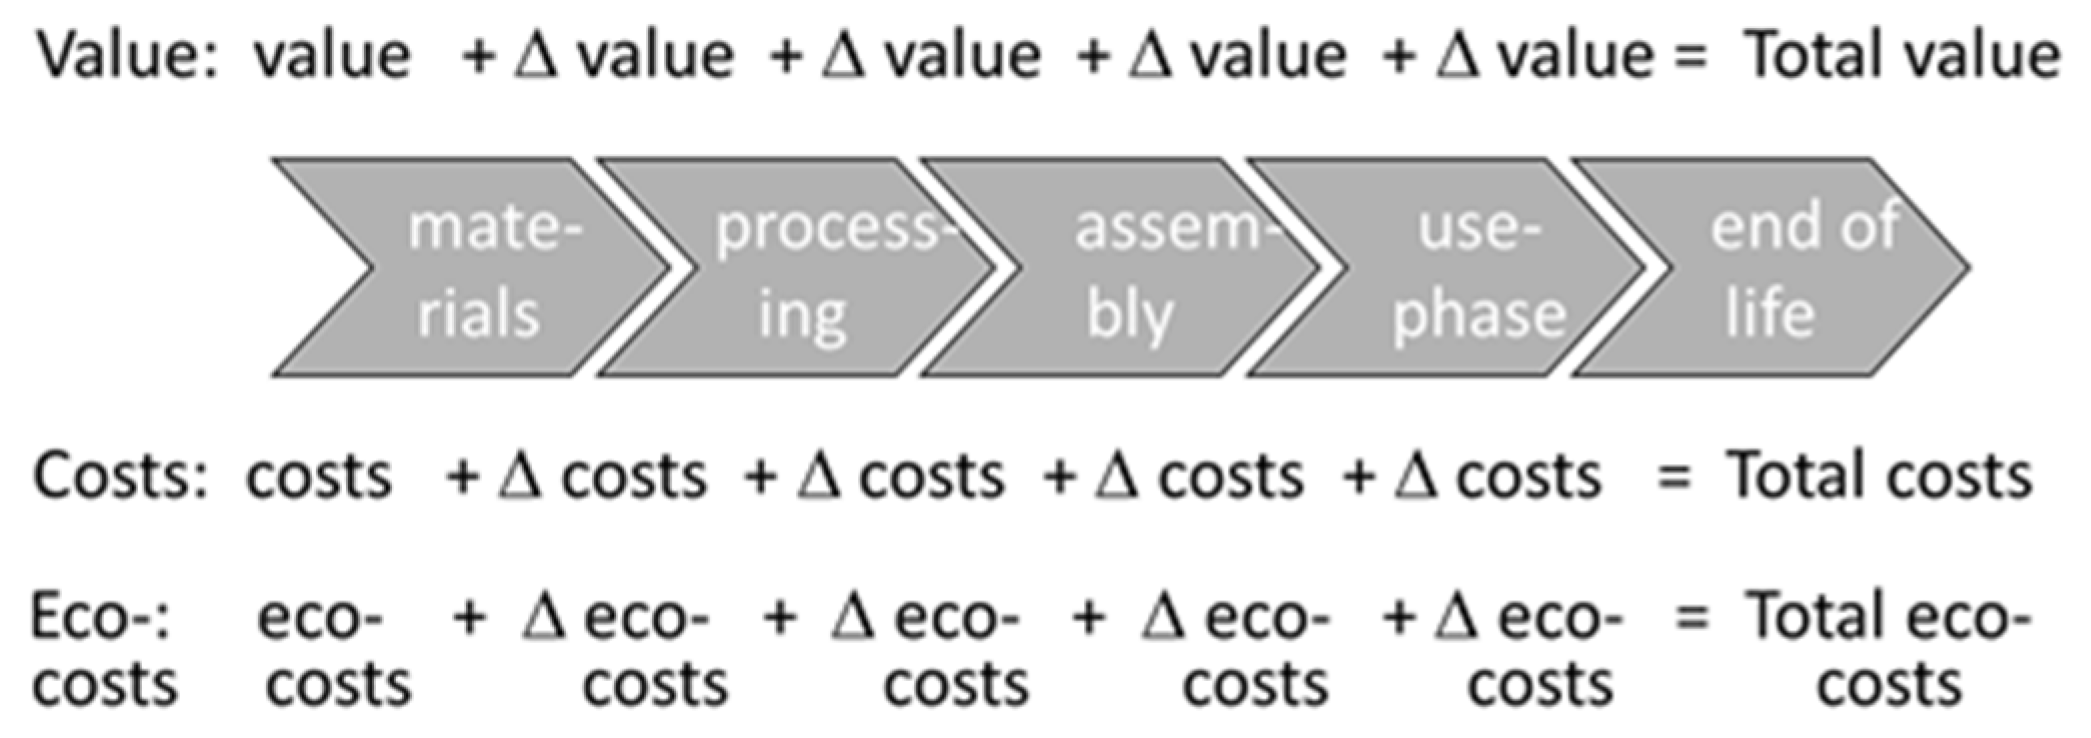
Concept development and design optimisation: This is a highly iterative process as depicted in Figure 7.
Step 5
Detailed design with a final product LCA and with sourcing of components (materials): This is the stage of the classical LCA, to find the environmental the hotspots of the final design.
Step 6
Selection of suppliers: At the stage of sourcing of the components and materials, LCA should be applied to select the preferred suppliers.

3. Results: Example of the Design of a Street Lighting System

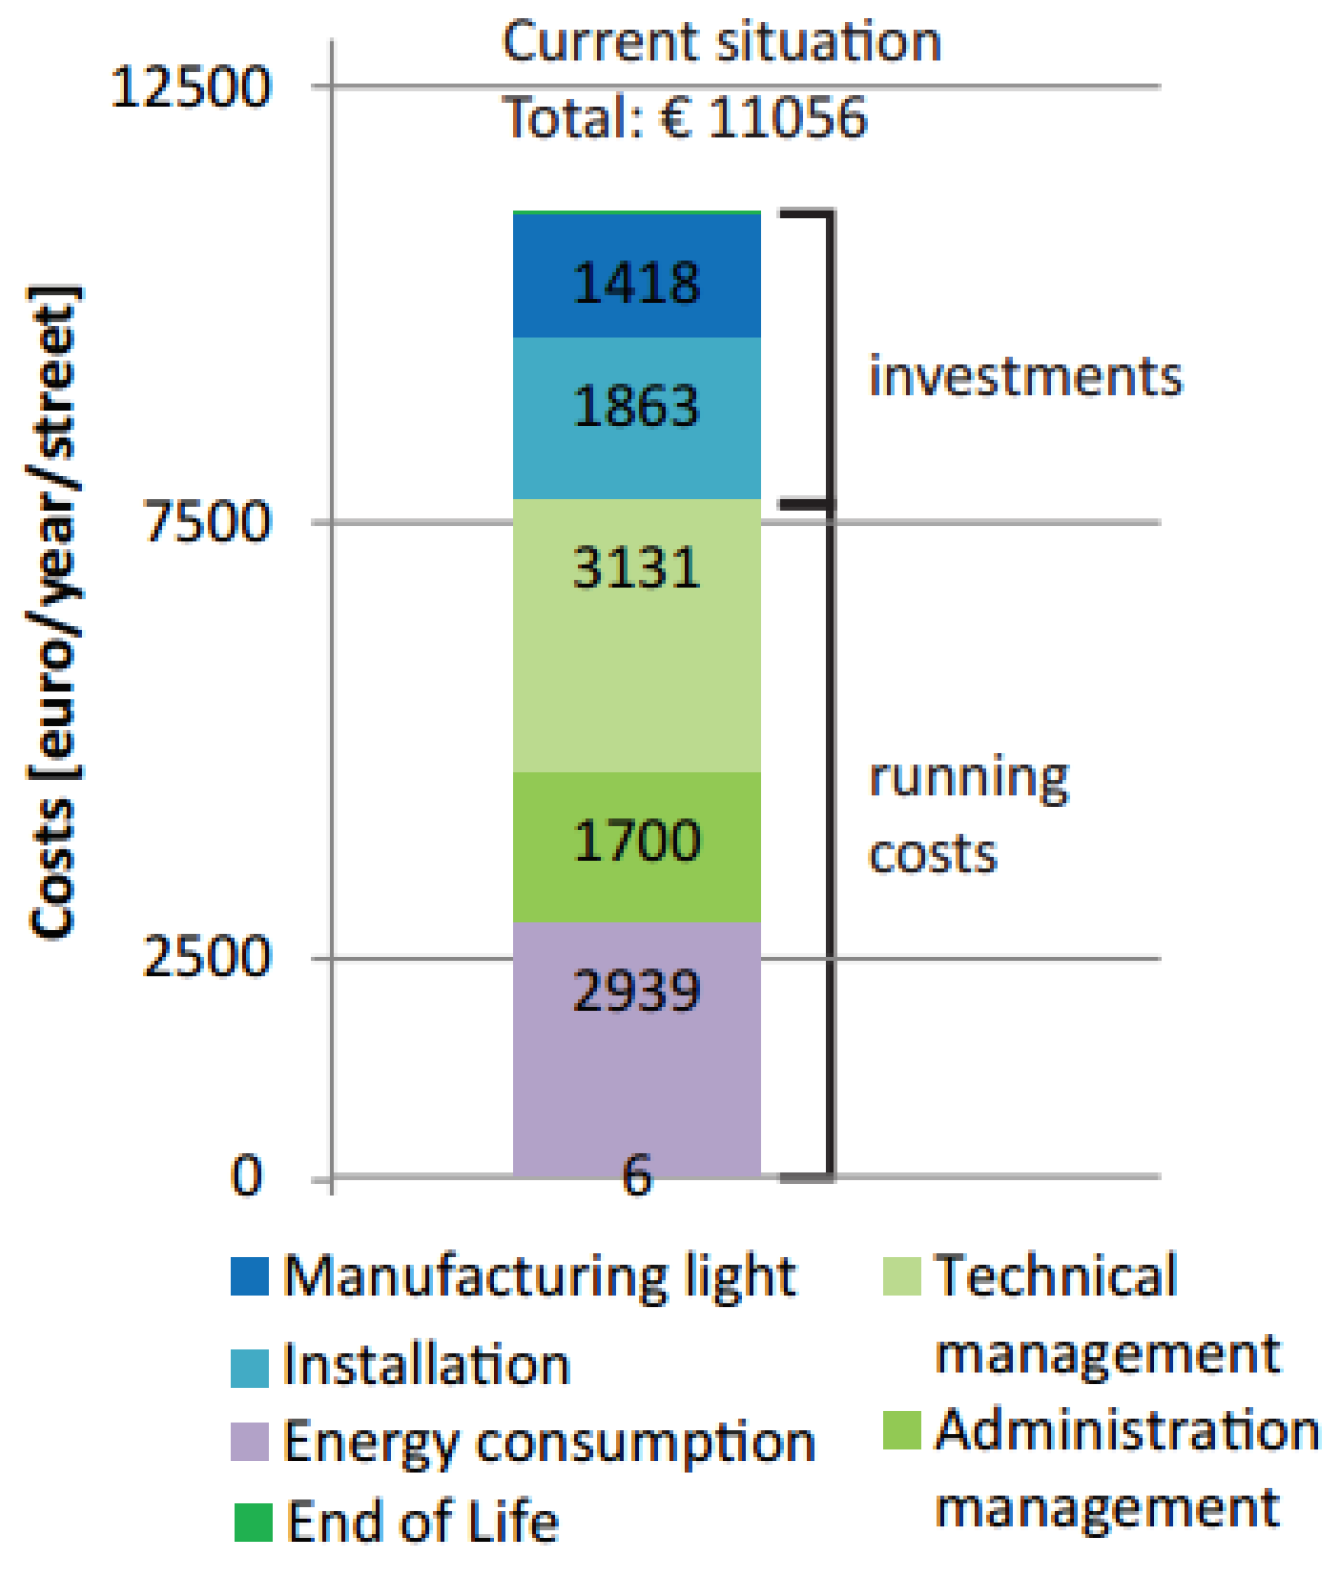
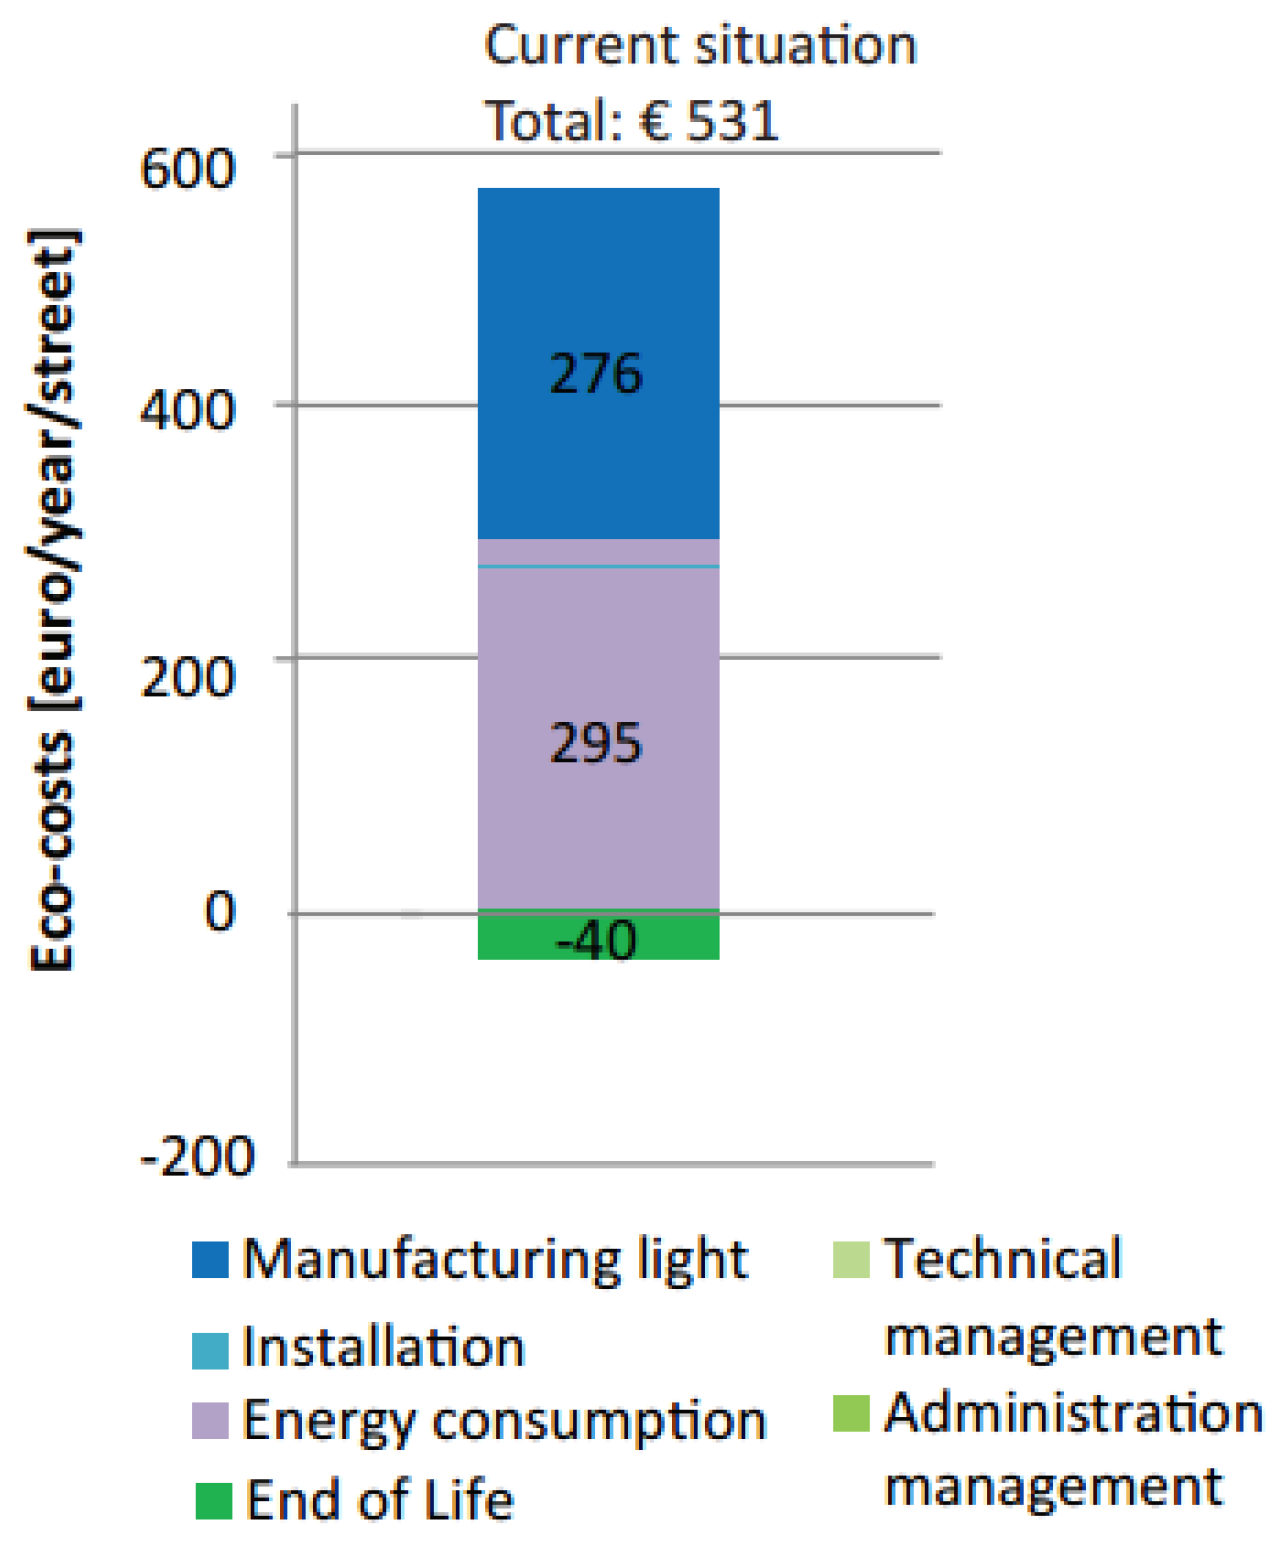
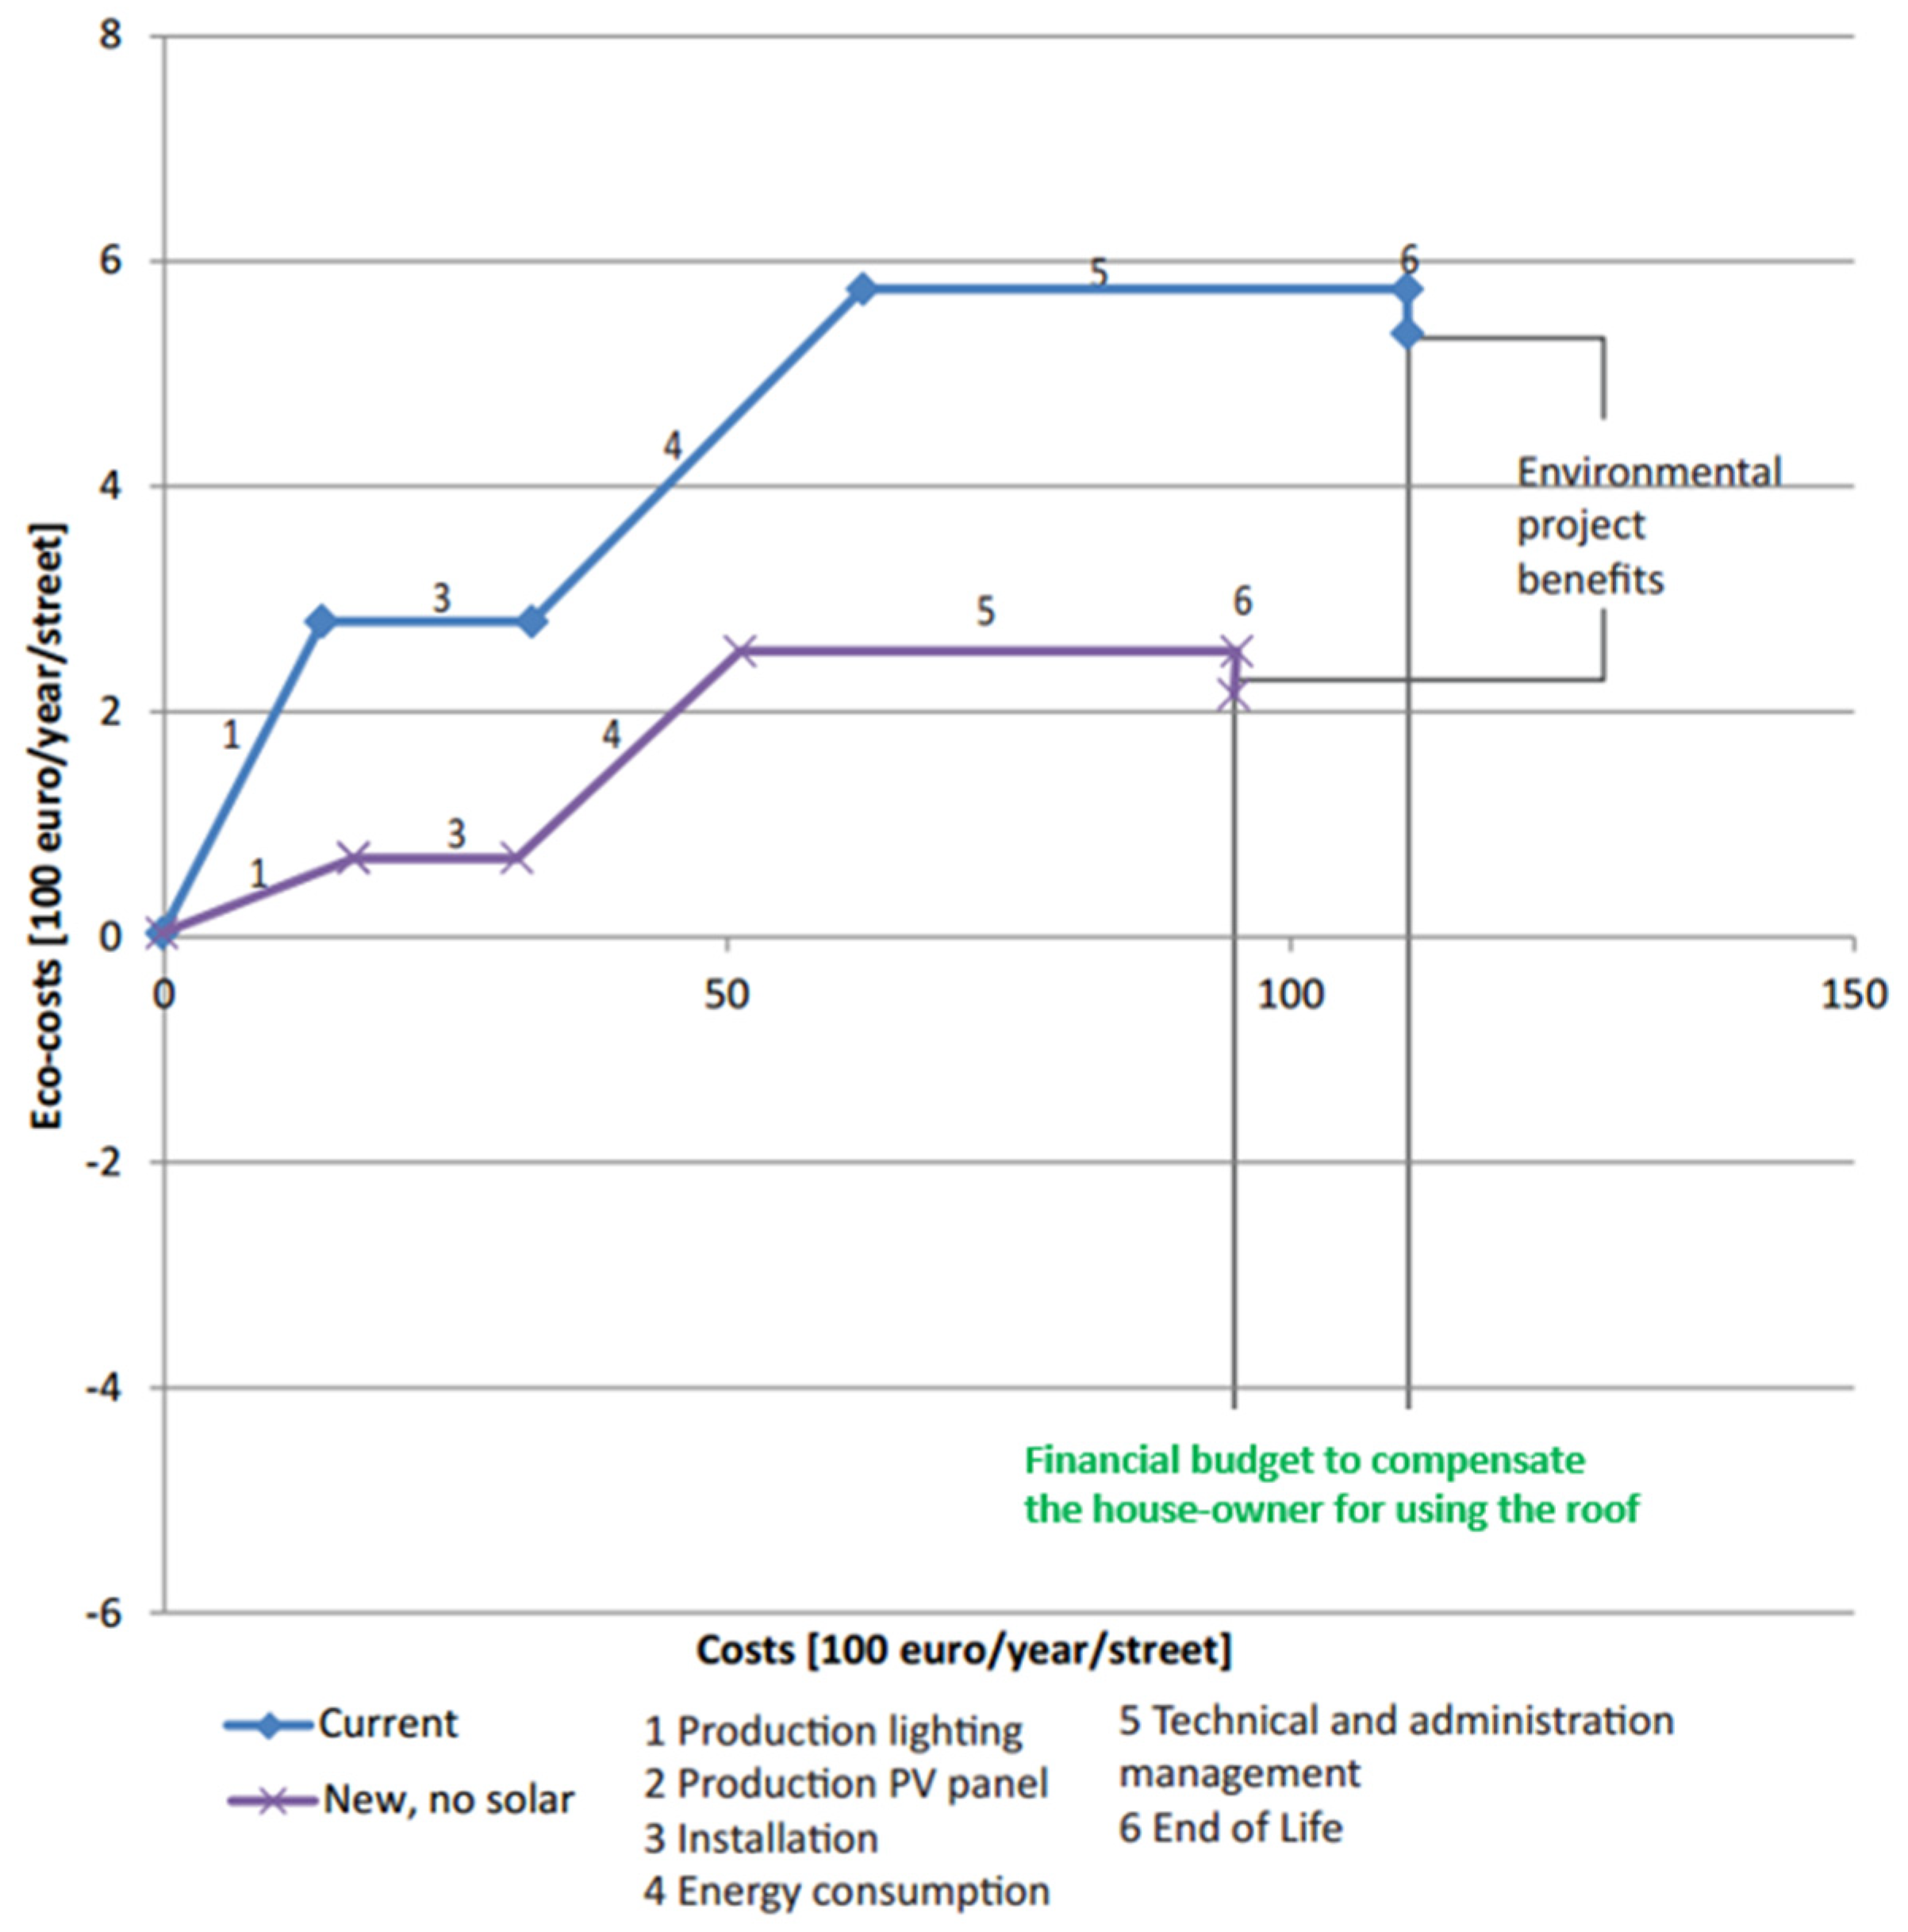
3.1. Base Case: the EVR of a Traditional Design in the City of Rotterdam

The base case for the design is the currently dominant existing system. The chosen lamppost for this base case is the “Kegeltop”, on a 4 m aluminium pole. This luminaire is one of the most used ones in residential streets in the Netherlands and is a well-known design.
The Functional Unit (FU) of the analysis is: (1) one street, 1200 × 20 m (2) one year with a light level according to regulations (minimum of 3 lux at street level and a uniformity rate of at least 25%). The life span of a lamp post system is set to 40 years. The life span of PV cells is assumed to be 20 years.
The Total Costs of Ownership (TCO) of the base case comprises:
  • Manufacturing and installation costs. These costs include the purchasing costs of the pole and luminaire and the working hours and administration costs of the installation process. Creating a grid connection, digging for cables and the pole are expensive: about 55% of the installing costs. Purchasing the pole and luminaire is the other 45%.
  • Technical management. This is mainly related to maintenance work, such as: replace light bulbs, repair electronics and cable failures (after accidents), clean luminaires.
  • Administrative management. These costs are related to desk work. Examples are: office expenses and taxes, inspections of luminaries and processing of the inspection reports.
  • Energy consumption. This is based on the most used light source for residential streets: 36 W PL fluorescent lamps. The yearly operating time of a single light bulb is 4200 h. In addition, some taxes are included in the energy consumption costs.
  • End of life. These are the costs for the removal tax of a pole and luminaire, and the removal costs of the current grid connection.
The TCO of the base case is depicted in Figure 9.
The eco-costs of lighting system is depicted in Figure 10. Not all issues of the TCO have relevant eco-costs: administration and technical management consist out of labour, which is usually not part of an LCA. Maintenance does require some car kilometres to be driven, but that can be neglected in the LCA. The eco-costs of the energy consumption are highest together with the eco-costs of manufacturing. The eco-costs of the End of Life phase are negative since the material of the pole (aluminium) is reused in the circular business model of the contractor.
The costs, which represent the value, and eco-costs are plotted against each other in Figure 11. This graph shows which life cycle steps are most harmful for the environment and which steps are most expensive. The EVR ratio is highest after the manufacturing phase followed by the energy consumption, installation phase and technical and administration management.
From this graph it can be concluded where improvements should be made. The ‘manufacturing’ and ‘energy consumption’ phase cause the biggest rise in eco-costs, so it makes sense to focus on these issues to reduce eco-costs in the design process. Costs can be saved mainly in ‘installation’, ‘energy consumption’, and ‘technical and administration management’.

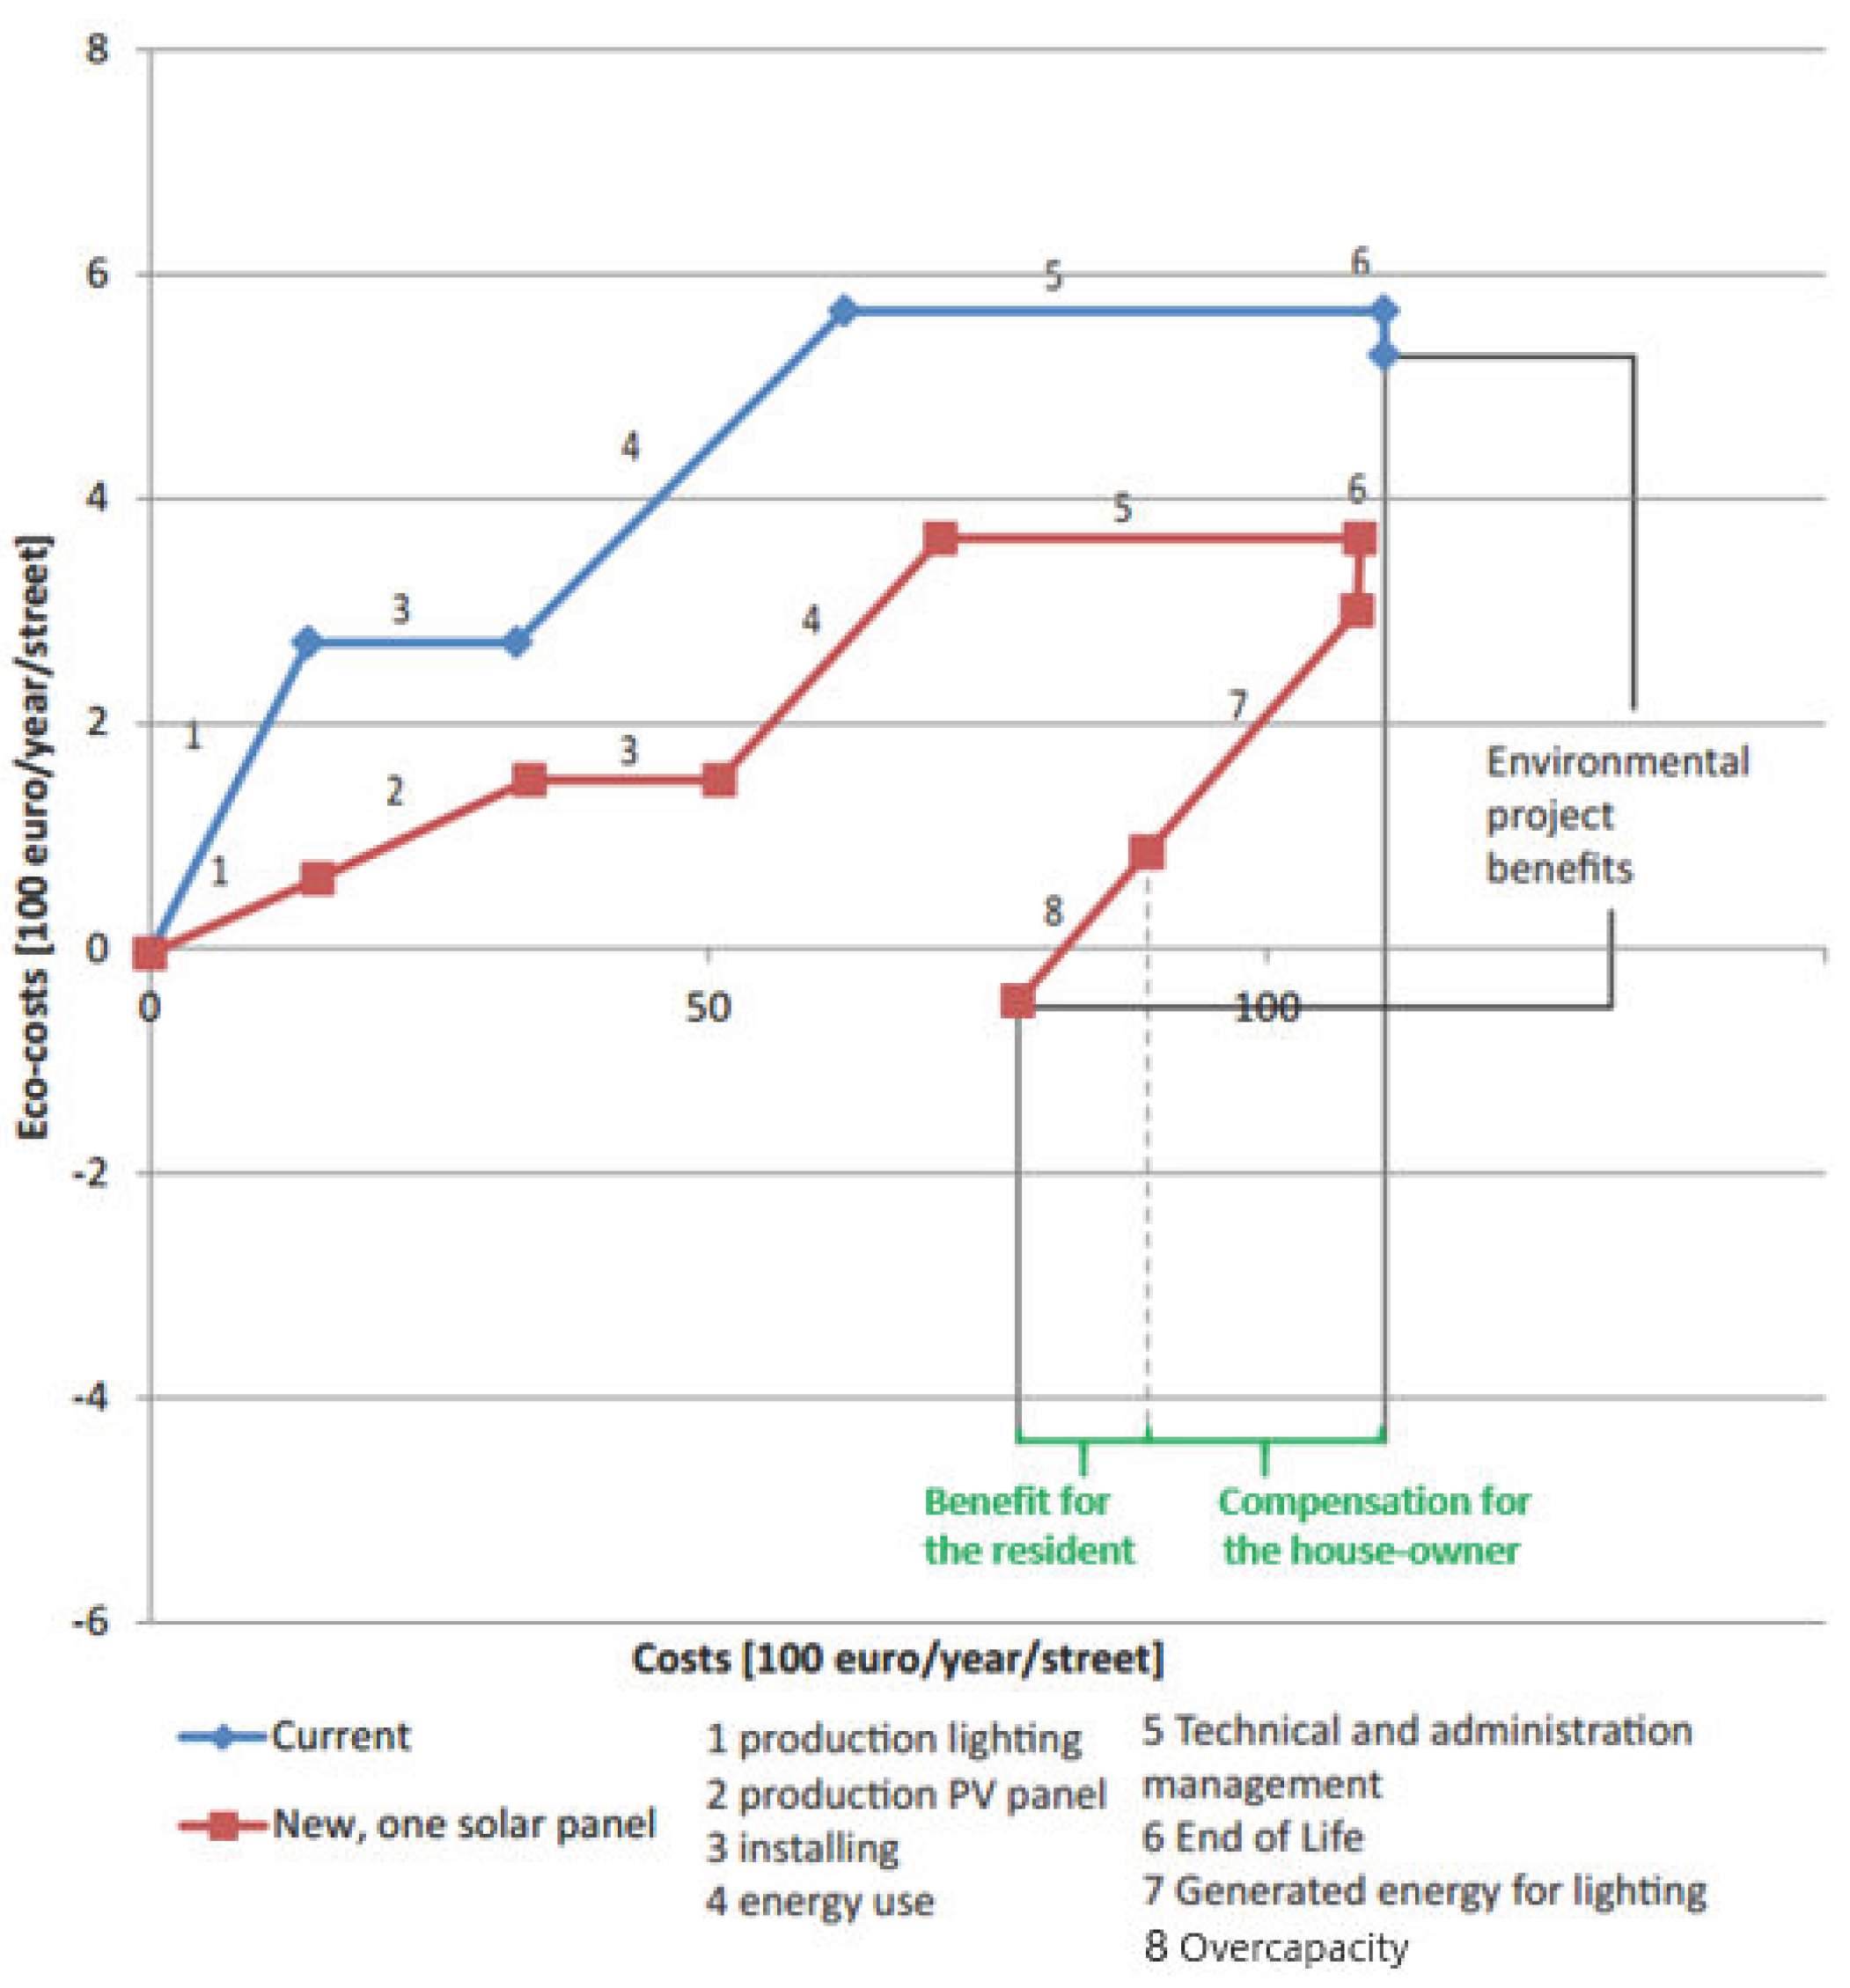
3.2. The Design of the New System

At the idea generation phase of the design, several ways were investigated to fulfil the functional requirements. This is the phase where designers look at all kinds of materials (look and feel [48], recycled or bio-based, shapes (Nature-Inspired Design) [47], and systems (C2C, Life Cycle Thinking). Designers focus on maximum value for the stakeholders. User groups are asked for their preferences.
The eco-burden of concepts at the idea generation phase are normally dealt with by gut feeling, however, this gut feeling is often not fully in line with the reality of LCA. Since the eco-costs of materials weigh heavy in the total eco-costs of the manufacturing of physical products, the LCA-based materials selection app [43] has been developed to give guidance to the designer. When transport and/or energy in the use phase is important, the LightLCA version of the app is required. With the aid of such an app, the environmental aspects of the design are readily available “at your finger tip”, so that the designer can focus on the most important aspect of the design at this stage: the creation of value.
In the case of the street lighting system in Rotterdam, the Customer Perceived Value relative to the base case was tested in a small user group for five design concepts: (1) surrounding light attached to the walls of the houses; (2) bamboo posts; (3) Arc light hanging above the street; (4) lamps attached to trees; (5) rooftop-mounted lamps. The rooftop-mounted lamps, see Figure 12, scored the best. A comparison with the base case is shown in Figure 13.
An important design issue of Figure 12 is the equal distribution of light, which is a major aspect of the perceived value of street lighting. Shades of shadow cause feelings of unsafety. The combination with trees in the street requires special attention in the system design.
Interesting observations in Figure 13 are: (1) the production costs of the rooftop system are not lower that the production costs of the lamp post system, however, the installation costs are lower; (2) the eco-costs of the rooftop system are considerably lower; (3) the replacement of the PL fluorescent lamps by LED results in less electricity (less costs as well as eco-costs); note that these savings could have been realised with a new lamp post system as well; (4) the benefit of the new system compared to the old system might be used to compensate the house-owner (in this case a housing association) for using the roof.
At a later moment in this project, in the concept development stage, the rooftop-mounted lamps were combined with one PV cell on the roof, a logical system extension in regard to sustainability. The comparison of such a system with the bases case is shown in Figure 14.
In the EVR approach, the cost savings of the PV cell (the delivered electricity) is depicted in an extra line at the end of the curve: line 7 + 8. This line has the same slope as line 4, since they are both electricity. At the end of line 7, the amount of electricity that is used by the lamp, is delivered by the PV cell. Line 8 depicts the overproduction of the PV cell. An interesting issue of Figure 15 is how to divide the benefit of a lower Total Costs of Ownership of the new system (compared to the base case) between the house-owner and the resident of the building (to compensate for the extra burden caused by the municipality). Such a division is arbitrary, and will result from negotiations, but the point between line 7 and line 8 might be a logical choice: the benefit for the resident is the overproduction of the PV cell.
It is obvious that the owner of the building, in this case a housing association, might take the opportunity of installing extra PV cells. That is kept outside this analysis, but is shown in Figure 15: the first prototype of a set of 2 PV cells plus lamp. This prototype has been redesigned for a test pilot in the Marconistraat 43 in Rotterdam (an industrial area). The test pilot is still operational.

4. Discussion and Conclusions

This project of street lighting systems reveals two important issues:
  • The sustainable innovation is not necessarily found in the application of radically new technologies, products or services. Sustainable innovation is the way in which existing technologies, products and services constitute a new sustainable product-service system with a viable business model that adds value to all the three stakeholders: (1) the municipality, by more value for the same costs; (2) the citizens in the street, by adding safety at night in combination with the trees in the street; (3) the owner and/or residents of the building, by reducing the costs of electricity.
  • the chosen solution actually has potentially a spin-off effect that might become even more important than the system itself: the design concept inspires end-users to place additional, privately owned, solar panels on their roofs, alongside the solar panel of the municipality. Note that this is a very cost-effective way, since the installation of extra panels hardly adds to the installation costs.
Fossil Energy-saving systems (e.g., insulation, heat pumps, windmills, PV cells), have the characteristic that the TCO is less than the investment costs. In the EVR charts, this is characterised by a line with a negative slope, since there are savings in eco-costs as well as costs (see Figure 14). These savings are developing over time. After the pay-back period of the system, the extra cost savings will have a rebound effect [49], since these savings will result in other expenditures (e.g., on cars or holidays). When the EVR of such an expenditure is more than the EVR of the savings, the net result is negative for the environment. When the EVR of the expenditure is less than the EVR of the savings, the net result for the environment is positive [49]. The net result of energy savings has, therefore, a behaviour aspect.
Products for consumer markets must have a surplus value at the moment of purchase, whereas in cases of non-profit organisations, the non-profit organisation has an intermediate position between the stakeholders that pay for the project, and the stakeholders that benefit from the project. As a consequence, eco-efficient value creation for non-profit organisations like a municipality, has two distinct project phases: (1) the choice of the system concept, and the trade-offs between the value (in this case the CPV of the citizens), the eco-burden, and the costs (TCO), are done prior to the start of the implementation project, leading to a budgetary TCO limit. (2) after the project approval, this TCO limit will restrict the further design freedom, however, the approach of eco-efficient value creation still continues for designing further details: creating maximum value at minimum eco-costs. The same situation exists for big infrastructural projects and building design.
The design of a new concept of domestic street lighting system for the city of Rotterdam is a practical example of the approach of Eco-efficient Value Creation. The new concept results in a considerable reduction of carbon footprint and eco-costs, shows the benefits for the municipality and for the residents, and results in a viable business case. The end-result might seem logical and obvious, as it is the case for many good innovations. For all parties that were involved in the design, however, it was clear that such an achievement was the result of the well-structured design process in combination with the establishment of the CPV and eco-costs for several design alternatives in the early design stages (see Supplementary Materials). The design project won the Future Ideas Thesis Competition.

Supplementary Materials

Author Contributions

Conceptualisation, N.K., B.F., A.S.; methodology, B.F., A.S.; writing—original draft preparation, N.K.; writing—review and editing, J.V.; All authors have read and agreed to the published version of the manuscript.

Funding

This research received no external funding.

Conflicts of Interest

The authors declare no conflict of interest.

References

  1. McDonough and Braungart. Cradle to Cradle: Remaking the Way We Make Things; North Point Press: New York, NY, USA, 2002. [Google Scholar]
  2. Ellen MacArthur Foundation. Towards the Circular Economy. Available online: www.ellenmacarthurfoundation.org (accessed on 30 August 2014).
  3. McKinsey. The Circular Economy: Moving from Theory to practice Special Edition, October 2016. Available online: https://www.mckinsey.com/~/media/McKinsey/Business%20Functions/Sustainability/Our%20Insights/The%20circular%20economy%20Moving%20from%20theory%20to%20practice/The%20circular%20economy%20Moving%20from%20theory%20to%20practice.ashx (accessed on 15 April 2020).
  4. Linder, M.; Williander, M. Circular Business Model Innovation: Inherent Uncertainties. Bus. Strategy Environ. 2017, 26, 182–196. [Google Scholar] [CrossRef]
  5. Geissdoerfer, M.; Vladimirova, D.; Evans, S. Sustainable business model innovation: A review. J. Clean. Prod. 2018, 198, 401–416. [Google Scholar] [CrossRef]
  6. Oghazi, P.; Mostaghel, R. Circular Business Model Challenges and Lessons Learned—An Industrial Perspective. Sustainability 2018, 10, 739. [Google Scholar] [CrossRef] [Green Version]
  7. Vogtlander, J.G.; Scheepens, A.E.; Bocken, N.M.P.; Peck, D. Combined analyses of costs, market value and eco-costs in circular business models: Eco-efficient value creation in remanufacturing. J. Rem. 2017, 7, 1–17. [Google Scholar] [CrossRef] [Green Version]
  8. Scheepens, A.E.; Vogtlander, J.G.; Brezet, J.C. Two life cycle assessment (LCA) based methods to analyse and design complex (regional) circular economy systems. Case: Making water tourism more sustainable. J. Clean. Prod. 2016, 114, 257–268. [Google Scholar] [CrossRef]
  9. White, A.L.; Stoughton, M.; Feng, L. Report. Servicing: The Quiet Transition to Extended Product Responsibility; U.S. Environmental Protection Agency, Office of Solid Waste: Washington, DC, USA, 1999; pp. 1–89. [Google Scholar]
  10. Tukker, A. Eight types of product–service system: Eight ways to sustainability? Experiences from SusProNet. Wiley Online Library. Bus. Strategy Environ. 2004, 13, 246–260. [Google Scholar] [CrossRef]
  11. Shluzas, L.A.; Steinert, M.; Katila, R. User-Centered Innovation for the Design and Development of Complex Products and Systems. In Design Thinking Research: Building Innovation Eco-Systems; Stanford University, Springer Science & Business Media: Berlin/Heidelberg, Germany, 2014; pp. 135–149. ISBN 978-3-319-01303-9. [Google Scholar]
  12. Brezet, J.C.; Van Hemel, C. Book Ecodesign: A Promising Approach to Sustainable Production and Consumption; United Nations Environment Programme, Industry and Environment, Cleaner Production: Paris, France, 1997. [Google Scholar]
  13. Mestre, A.; Vogtlander, J.G. Eco-efficient Value Creation of Cork products: An LCA based method for design intervention. J. Clean. Prod. 2013, 57, 101–114. [Google Scholar] [CrossRef]
  14. Welsh, B.C.; Farrington, D.P. Effects of Improved Street Lighting on Crime. Camb. Systematic. Rev. 2008. [Google Scholar] [CrossRef]
  15. Haans, A.; de Kort, Y.A.W. Light distribution in dynamic street lighting: Two experimental studies on its effects on perceived safety, prospect, concealment, and escape. J. Environ. Psychol. 2012, 32, 342–352. [Google Scholar] [CrossRef]
  16. Kardan, O.; Gozdyra, P.; Misic, B.; Moola, F.; Palmer, L.J.; Paus, T.; Berman, M.G. Neighborhood Greenspace and Health in A Large Urban Center. Sci. Rep. 2015, 5, nr 11610. Available online: https://www.nature.com/articles/srep11610 (accessed on 15 April 2020). [CrossRef] [Green Version]
  17. Schusler, T.M.; Weiss, L.; Treering, D.; Balderama, E. Research note: Examining the association between tree canopy, parks and crime in Chicago. Landsc. Urb. Plan. 2017, 170, 309–313. [Google Scholar] [CrossRef]
  18. Huijbregts, M.A.J.; Steinmann, Z.J.N.; Elshout, P.M.F.; Stam, G.; Verones, F.; Vieira, M.D.M.; Zijp, M.; Hollander, A.; van Zelm, R.E.F. ReCiPe2016: A harmonised life cycle impact assessment method at midpoint and endpoint level. Int. J. Life Cycle Assess. 2017, 22, 138–147. [Google Scholar] [CrossRef]
  19. Lehmann, A.; Bach, V.; Finkbeiner, M. Product environmental footprint in policy and market decisions: Applicability and impact assessment. Integr. Environ. Assess. Manag. 2015, 11, 417–424. [Google Scholar] [CrossRef] [PubMed] [Green Version]
  20. Environmental Priority Strategies (EPS). Available online: https://www.ivl.se/english/startpage/pages/our-focus-areas/environmental-engineering-and-sustainable-production/lca/eps.html (accessed on 15 April 2020).
  21. Vogtlander, J.G.; Baetens, B.; Bijma, A.; Brandjes, E.; Lindeijer, E.; Segers, M.; Witte, J.P.M.; Brezet, J.C.; Hendriks, C.F. LCA-based Assessment of Sustainability: The Eco-costs/Value Ratio (EVR); Delft Academic Press: Delft, The Netherlands, 2010; ISBN 9789065622334. [Google Scholar]
  22. Sala, S.; Cerutti, A.K.; Pant, R. Report. Development of a Weighting Approach for the Environmental Footprint; Publications Office of the European Union: Brussels, Belgium, 2019; Available online: https://ec.europa.eu/jrc/en/publication/development-weighting-approach-environmental-footprint (accessed on 30 June 2020).
  23. Olindo, R.; Schmitt, N.; Vogtlander, J.G. Electricity in LCA: Inconvenient uncertainties in leading databases, and the need for extra calculation rules. Cases: Calculations on battery electrical cars and hydrogen from electrolysis. Sustainability 2009. Unpublished. [Google Scholar]
  24. Vogtlander, J.G.; Bijma, A. The virtual pollution prevention costs ‘99: A single LCA-based indicator for emissions. Int. J. Life Cycle Assess. 2000, 5, 113–124. [Google Scholar] [CrossRef]
  25. Vogtlander, J.G.; Brezet, J.C.; Hendriks, C.F. The Virtual Eco-costs ‘99, a single LCA-based indicator for sustainability and the Eco-costs/Value Ratio (EVR) model for economic allocation. Int. J. LCA 2001, 6, 157–166. [Google Scholar] [CrossRef]
  26. Vogtlander, J.G.; Bijma, A.; Brezet, J.C. Communicating the eco-efficiency of products and services by means of the Eco-costs/Value Model. J. Clean. Prod. 2002, 10, 57–67. [Google Scholar] [CrossRef]
  27. Vogtländer, J.; Peck, D.; Kurowicka, D. The Eco-Costs of Material Scarcity, a Resource Indicator for LCA, Derived from a Statistical Analysis on Excessive Price Peaks. Sustainability 2019, 11, 2446. [Google Scholar] [CrossRef] [Green Version]
  28. ISO 14008:2019. Monetary Valuation of Environmental Impacts and Related Environmental Aspects; International Organization for Standardization: Geneva, Switzerland, 2019. [Google Scholar]
  29. The Model of the Eco-costs/Value Ratio (EVR): The concept of the eco-costs. Available online: https://www.ecocostsvalue.com/EVR/model/theory/subject/2-eco-costs.html (accessed on 15 April 2020).
  30. ISO 14044:2006. Environmental Management—Life Cycle Assessment—Requirements and Guidelines; International Organization for Standardization: Geneva, Switzerland, 2006. [Google Scholar]
  31. The Model of the Eco-costs/Value Ratio (EVR): Data on eco-costs, Carbon Footprint, and Other indicators: The Idematapp and Idemat Databases. Available online: https://www.ecocostsvalue.com/EVR/model/theory/subject/5-data.html (accessed on 15 April 2020).
  32. Porter, M.E. Competitive Advantage: Creating and Sustaining Superior Performance; Simon and Schuster: New York, NY, USA, 1985; ISBN 9781416595847. [Google Scholar]
  33. Vogtlander, J.G.; Mestre, A.; Van de Helm, R.; Scheepens, A.; Wever, R. Eco-efficiënt Value Creation, Sustainable Strategies for the Circular Economy, 2nd ed.; Delft Academic Press: Delft, The Netherlands, 2014; ISBN 9789065623683. [Google Scholar]
  34. Gadiesh, O.; Gilbert, J.L. Profit Pools: A Fresh Look at Strategy. Harv. Bus. Rev. 1998, 76, 139–148. [Google Scholar]
  35. McDougall, G.H.G.; Levesque, T. Customer satisfaction with services: Putting perceived value into the equation. J. Serv. Market. 2000, 14, 392–410. [Google Scholar] [CrossRef]
  36. Lin, C.; Sher, P.J.; Shih, H. Past progress and future directions in conceptualizing customer perceived value. Int. J. Serv. Ind. Manag. 2005, 16, 318–336. [Google Scholar] [CrossRef]
  37. Gautama, N.; Singhb, N. Lean product development: Maximizing the customer perceived value through design change (redesign). Int. J. Prod. Econ. 2008, 114, 313–332. [Google Scholar] [CrossRef]
  38. EU Joint Research Centre. Environmental Impact of Products: EIPRO, Analysis of the Life Cycle Environmental Impacts Related to the Final Consumption of the EU-25. Joint Research Centre, European Commission. 2006. Available online: https://ec.europa.eu/environment/ipp/pdf/eipro_report.pdf (accessed on 15 April 2020).
  39. Huppes, G.; Ishikawa, M. A Framework for Quantified Eco-efficiency Analysis. J. Ind. Ecol. 2005, 9, 25–41. [Google Scholar] [CrossRef]
  40. Caiado, R.G.G.; de Freitas Dias, R.; Mattos, L.V.; Quelhas, O.L.G.; Leal Filho, W. Towards sustainable development through the perspective of eco-efficiency—A systematic literature review. J. Clean. Prod. 2017, 165, 890–904. [Google Scholar] [CrossRef]
  41. Huguet Ferran, P.; Heijungs, R.; Vogtländer, J.G. Critical Analysis of Methods for Integrating Economic and Environmental Indicators. Ecol. Econ. 2018, 146, 549–559. [Google Scholar] [CrossRef]
  42. Lofthouse, V. Ecodesign tools for designers: Defifining the requirements. J. Clean. Prod. 2006, 14, 1386–1395. [Google Scholar] [CrossRef] [Green Version]
  43. Available online: www.idematapp.com (accessed on 15 April 2020).
  44. Vogtlander, J.G. A practical Guide to, L.C.A. In For Students, Designers and Business Managers; Cradle-to-crave and Cradle-to-cradle, 5th ed.; Delft Academic Press: Delft, The Netherlands, 2017; ISBN 9789065623614. [Google Scholar]
  45. Rivas-Hermann, R.; Köhler, J.A.; Scheepens, A.E. Innovation in product and services in the shipping retrofit industry: A case study of ballast water treatment systems. J. Clean. Prod. 2015, 106, 443–454. [Google Scholar] [CrossRef] [Green Version]
  46. Osterwalder, A.; Pigneur, Y.; Bernarda, G.; Smith, A. Value Proposition Design; Wiley: London, UK, 2014; ISBN 9781118968055. [Google Scholar]
  47. Van Boeijen, A.; Daalhuizen, J.; Zijlstra, J.; Van de Schoor, R. Delft Design Guide; BIS Publishers: Amsterdam, The Netherlands, 2017; ISBN 9789063693275. [Google Scholar]
  48. Karana, E. Meanings of Materials. Ph.D. Thesis, Delft University of Technology, Delft, Netherland, 29 May 2009. Available online: https://repository.tudelft.nl/islandora/object/uuid:092da92d-437c-47b7-a2f1-b49c93cf2b1e (accessed on 15 April 2020).
  49. Scheepens, A.E.; Vogtlander, J.G. Insulation or Smart Temperature Control for Domestic Heating: A Combined Analysis of the Costs, the Eco-Costs, the Customer Perceived Value, and the Rebound Effect of Energy Saving. Sustainability 2018, 10, 3231. [Google Scholar] [CrossRef] [Green Version]
Figure 1. Conflict between residential street lighting systems and trees: the power cables are entangled in the roots.
Energies 13 03351 g001
Figure 2. The total eco-cost system in life-cycle assessment.
Energies 13 03351 g002
Figure 3. The system components of Life Cycle Assessment.
Energies 13 03351 g003
Figure 4. The basic idea of the Eco-costs/Value Ratio (EVR): combining the value chain with the ecological chain [33].
Energies 13 03351 g004
Figure 5. The costs, the price, and the Customer Perceived Value (CPV) of a product.
Energies 13 03351 g005
Figure 6. The EVR and the total expenditures of all consumers in the EU25 (from the environmental impact of products (EIPRO) study [38]).
Energies 13 03351 g006
Figure 7. The basics of eco-efficient value creation in the fuzzy front end of the design [13].
Energies 13 03351 g007
Figure 8. The use of LCA during all product development stages [44].
Energies 13 03351 g008
Figure 9.  Costs (Total Costs of Ownership, TCO) for lighting: one street for one year of the base case.
Energies 13 03351 g009
Figure 10.  Eco-costs costs for lighting: one street for one year of the base case.
Energies 13 03351 g010
Figure 11. The 2-dimensional representation of costs and eco-costs of the base case (one street, one year). The absolute EVR is provided at each point of the curve.
Energies 13 03351 g011
Figure 12.  Light design proposal with small and asymmetric beam to avoid light shining into houses.
Energies 13 03351 g012
Figure 13. The rooftop lighting system (without PV cell) compared to the base case (one street one year).
Energies 13 03351 g013
Figure 14. The rooftop lighting system, with one PV cell, compared to the base case.
Energies 13 03351 g014
Figure 15. A prototype of set 2 PV cells plus lamp.
Energies 13 03351 g015
Table 1. An example of an excel LCA table, based on the BOM (bulk of materials) of the base case of a classical lamppost in a street (type ‘Kegeltop’ on a 4 m pole, per lamppost).
UnitAmount for 1 FULCI Database LineEco-Costs Per UnitCO2e Per UnitEco-Costs Per FUCO2e Per FU
kg3.52Aluminium trade mix (45% prim 55% sec)2.126.267.522.0
kg34.93Steel (21% sec = market mix average)0.601.6120.856.2
kg2.10Polyester (unsaturated) 70%2.047.464.315.7
kg0.90Glass fibre 30%0.100.480.10.4
kg1.78PC pellets2.057.783.713.9
kg0.07Copper trade mix (56% prim 44% sec)2.701.820.20.1
kg0.31PP pellets1.051.970.30.6
kg0.04ABS pellets 50%1.323.400.10.1
kg0.04PC pellets 50%2.057.780.10.3
kg1.50Glass, uncoated0.220.980.31.5
kg0.08PWB desktop, including components and Ics60.71160.414.912.8
m16.60Electric cord, 1000 W, 3 × 0.5 mm2, domestic0.070.141.22.3
kg0.06Crude iron0.421.510.00.1
kg0.002Silicon2.2110.590.00.0
kg0.0767SiCr5, spring-steel0.771.850.10.1
kg0.55X5CrNi18 (Stainless steel 304)2.663.851.52.1
kg0.41PVC0.7022.0060.30.8
Material supplies 45129
Production processes
kg34.00Drawing of pipe, steel0.1700.3605.812.2
m210.25Electroplating Zinc, outside use, per 10 years5.4792.97456.230.5
m22.56Powder coating, steel/RER S1.1054.5702.811.7
kg5.43Injection molding plastics0.2641.3331.47.2
kg2.02Casting, aluminium0.0180.1570.00.3
kg1.50Cold transforming Al0.0190.1040.00.2
kg0.99Deep drawing steel0.0650.3160.10.3
Manufacturing processes 6662
Material supplies + manufacturing processes excluding transport and installation 112192

