Article

Voltage Flicker Detection Based on Probability Resampling

1
College of Electrical and Electronic Engineering, Anhui Science and Technology University, Bengbu 233030, China
2
Marine Engineering College, Dalian Maritime University, Dalian 116026, China
3
Department of Electrical Engineering and Automation, Aalto University, 02150 Espoo, Finland
4
College of Engineering, Peking University, Beijing 100871, China
5
Shenzhen Pluke Intelligent Test Equipment Co., Ltd., Shenzhen 518068, China
*
Author to whom correspondence should be addressed.
Energies 2020, 13(13), 3350; https://doi.org/10.3390/en13133350
Submission received: 18 May 2020 / Revised: 21 June 2020 / Accepted: 24 June 2020 / Published: 30 June 2020

Abstract

:
Digital flicker detection devices need to store a large amount of evaluation data during measurement process, which leads to high requirements for hardware resources and algorithm execution efficiency. In this paper, a digital flicker detection method based on probability resampling is studied. In particular, before statistical evaluation, probability resampling is applied to screen the instantaneous flicker visual sensitivity data to compress redundant data. Additionally, the effectiveness of the method was numerically simulated and experimentally tested. The results show that the proposed method can accurately measure the voltage flicker value and can effectively compress the redundant evaluation data to be evaluated and has significant advantages in releasing hardware storage space, in improving algorithm execution efficiency and real-time performance, and in reducing processor workload. This method provides an engineering application reference for designing digital flicker detectors, especially for the software upgrade of traditional power quality testing equipment.

Graphical Abstract

1. Introduction

Fluctuating load affects the power supply quality of the power system and threatens the reliable operation of other equipment in the power grid. With the rapid development of high-speed railways and increasing utilization of clean energy, electrified railways with large fluctuations in traction load and clean energy network have become essential parts of the power grid [1,2,3,4,5]. Voltage flicker is a subjective perception of the fluctuations in lamp illuminance caused by voltage fluctuations. It is an important parameter for measuring power quality and a significant cause of failure of power supply and electrical equipment. Therefore, effective detection of essential indicators such as voltage fluctuations and flickers is a prerequisite for improving the power supply quality of the power grid and for ensuring the safe operation of power equipment [6,7,8,9].
In the standards formulated by the International Electrotechnical Commission (IEC), flicker detection is standardized in the form of a block diagram and the analog transfer function of each module is provided [10,11,12,13]. With the development of modern science and technology, new detection methods have emerged in addition to the IEC method. For example, Reference [14] proposed a Hilbert transform method to realize the demodulation of flicker envelope signals, but it is susceptible to noise. References [15,16] estimated flicker parameters based on different window interpolation Fourier transforms and achieved accurate measurement of single flicker frequencies at high frequencies and multiple flicker frequencies at distant intervals. Reference [17] proposed a flicker measurement method based on the Chirp-Z transform, which can improve the frequency resolution without increasing the sampling time, but there are problems of spectral leakage and fence effect. Reference [18] improved the energy operator on this basis and improved the accuracy of flicker detection under noise interferences. These new methods improve the measurement accuracy of flicker to a certain extent but often suffered from the complicated calculation, high sampling frequency, large data volume, and high requirements for hardware configuration. Therefore, they are more suitable for occasions with sufficient hardware resources such as running in computers and industrial computers.
With the development of microelectronics, signal processing, communication, and other technologies, flicker detection algorithms usually need to run in embedded systems to achieve the portability and networking of detection equipment. For example, Reference [19] designed an Field Programmable Gate Array (FPGA) chip-based power quality detection instruments. Reference [20] introduced an Advanced RISC Machines (ARM) flicker detector. Reference [21] compared the performance of power quality instruments designed by CPU and FPGA and concluded that the FPGA algorithm execution process is flexible. Reference [22] designed a dual-core power quality measurement terminal based on Digital Signal Processor (DSP) and ARM to achieve online monitoring of the network. We found that the IEC flicker detection method is simple and easy to implement digitally. Compared with the new detection methods, it is more suitable for running on embedded system instruments.
To ensure measurement accuracy, the IEC flicker detection devices often use a high sampling frequency, resulting in a significant increase in the data to be stored in the flicker statistical evaluation process and a longer flicker measurement period. For example, a short-term flicker requires a continuous recording of 10 min of data. The increase in data scale puts higher requirements on the operating efficiency and memory resources of embedded processors, which brings difficulties to the development of digital flicker instruments, especially the upgrade of traditional power quality detection instruments. Since the flicker statistical evaluation step is graded probability statistics, the number of data participating in the statistics is not strict, which provides the possibility of data compression. In order to solve the above problems, this paper proposes a probability resampling method that compresses the data before the detection process to reduce the resource requirements in the digitalization of IEC flicker detection. Furthermore, the effect of IEC flicker detection using the probability resampling is verified through both simulation and experiments.
The remainder of this paper is organized as follows. In Section 2, we present the fundamentals of flicker detection principles. A digital flicker detection method based on probability resampling is introduced in Section 3. Section 4 validates the method before we conclude the paper in Section 5.

2. Flicker Detection Principle

2.1. IEC Flicker Detection Design Specification

The flicker detection method proposed by IEC needs 5 steps, as shown in Figure 1 [23,24,25].
Firstly, in step 1, the voltage signal of the power grid is reduced and matched with the instrument and a self-test signal can be generated. Steps 2–4 are used for lamp–eye–brain simulation. Among them, step 2 simulates the flicker of the lamp. Combined with the band-pass filter in step 3, the fluctuation in the power frequency voltage can be demodulated by the square detection method. The pass frequency range of the band-pass filter is from 0.05 Hz to 35 Hz, and its transfer function is shown as follows:
H p 1 ( s ) = s / ω 1 + s / ω
B ( s ) = [ 1 + i = 1 6 b i ( s / ν ) i ] 1
where ω = 2 π × 0.05 , ν = 2 π × 35 , b 1 = b 5 = 3.864 , b 3 = 9 . 141 , b 2 = b 4 = 7.464 , b 6 = 1 .
The transfer function of the weighted filter, used to simulate the human perception of different voltage fluctuations, is written as
K ( s ) = k ω 1 s s 2 + 2 λ s + ω 1 2 · 1 + s / ω 2 ( 1 + s / ω 3 ) ( 1 + s / ω 4 )
where ω 1 = 2 π × 9.015494 , ω 2 = 2 π × 2.27979 , ω 3 = 2 π × 1.22535 , ω 4 = 2 π × 21.9 , k = 1.74082 , and λ = 2 π × 4.05981 .
The signal sent by the band-pass filter is squared to simulate the response of the brain’s response to the vision, and the memory effect of the human brain can be simulated as
H p 2 ( s ) = 1 1 + 0.3 s
After filtering the voltage fluctuation signal in steps 2–4, the subjective visual reflection S ( t ) of the fluctuation of illumination caused by the voltage fluctuation is obtained, which is called instantaneous flicker sensation level.
Step 5 is used to make online statistics of the value sent by the previous steps, and according to the cumulative probability, Equation (5) is applied to calculate the short-term flicker value and, further, the long-term flicker is obtained.
p st = 0.031 4 p 0 . 1 + 0.052 5 p 1 + 0.065 7 p 3 + 0.28 p 10 + 0.08 p 50
where p 0.1 , p 1 , p 3 , p 10 , and p 50 denote S ( t ) of Cumulative Distribution Function (CPF) exceeding 0.1%, 1%, 3%, 10%, and 50%, respectively.

2.2. Principle of Probability Resampling

The basic principle of probability resampling can be described as in Figure 2.
The measured analog adaptation signal is processed by the signal sampling step (completed by the A/D converter), and the analog signal is converted into a corresponding data stream and sent to the digitized lamp–eye–brain filter for processing. The output is the flicker visual sensitivity discrete value S [ n ] , where n = 1 , 2 , 3 . The size and speed of the data volume are proportional to the sampling frequency of the signal f s .
Let P k S [ n ] denote a sequence consisting of N consecutive points taken from S [ n ] , which is presented as
P k = [ S 0 k , S 1 k , S 2 k , , S N 1 k ]
where k = 1 , 2 , 3 .
Through probability resampling, the data in the sequence of Equation (6) is sampled, which is presented as
S [ k ] = S round ( rand · ( N 1 ) ) k
where round() is a function that returns the value of a number rounded to the nearest integer, and function rand() means to generate a random number evenly distributed on the interval [ 0 , 1 ] .
After continuous sampling, the sequence S [ k ] is generated to participate in statistical evaluation, so as to obtain flicker measurement values and to achieve data compression. The probability resampling of data takes N as a period and maintains the consistency of S [ k ] and S [ n ] , and the sampling speed is determined by the compression ratio δ N , which is written as
δ N = 1 N , 1 N N max , N Z

2.3. Procedure of Probability Resampling Flicker Detection

Flicker detection based on the probability resampling method can be presented by the flowchart shown in Figure 3, and the specific execution steps are described as follows:
Step 1:
Sample the measured signal x ( t ) to obtain the discrete signal x [ n ] ;
Step 2:
Square detection of the discrete signal x [ n ] to obtain voltage fluctuation signals that humans perceive from the range of 0.05–35 Hz;
Step 3:
Simulate the subjective visual reflection of the voltage fluctuation signal by a digital filter to obtain instant flicker visual sensitivity S [ n ] ;
Step 4:
Probability resample S [ n ] and compress redundant data to obtain S [ k ] , and then sort and store S [ k ] ;
Step 5:
Determine whether the measurement time reaches 10 min; if not, return to step 2; otherwise, go to step 6;
Step 6:
Statistical calculation of short-term flicker value.

3. Methods

3.1. Selection of Sampling Frequency

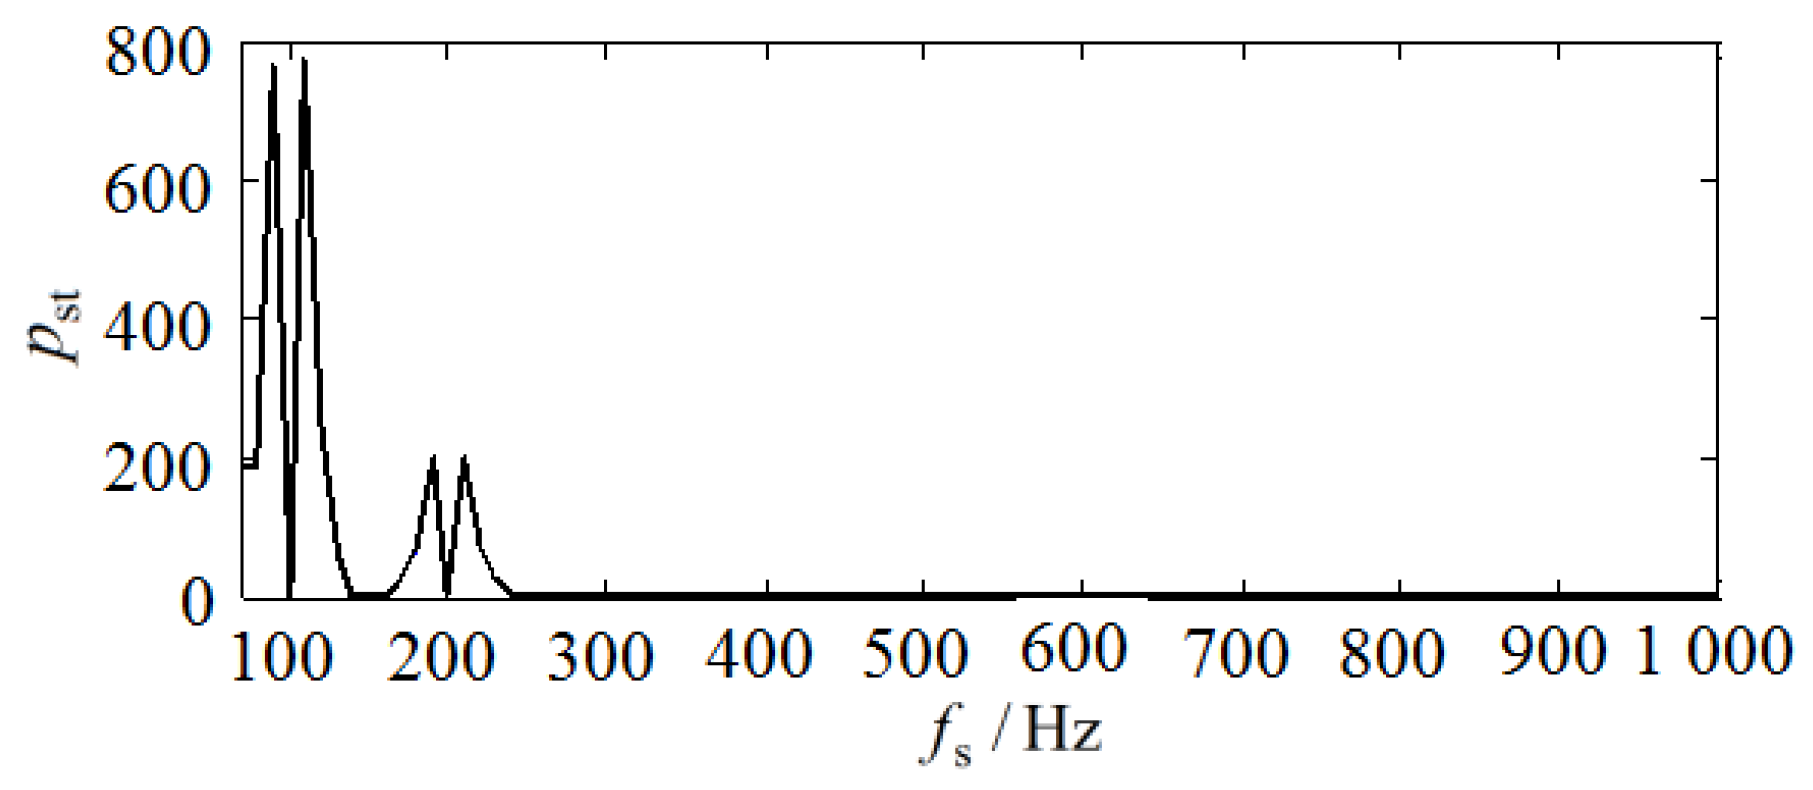
Theoretically, the measurement results can be more accurate by increasing the sampling frequency f s . We observe that this method will increase the amount of data calculation and will reduce the execution efficiency through the investigation of short-term flicker and sampling frequency of rectangular voltage fluctuation signals with different fluctuation amplitudes at different frequencies, as shown in Figure 4.
We can observe from Figure 4 that, due to the interference of false frequency components caused by harmonics or because the sampling frequency is too low, it cannot meet the requirements of the sampling theorem, resulting in large fluctuations in the short-term flicker value p s t in the low-frequency sampling interval. The short-term flicker value of the sampling frequency p s t starts to converge at 250 Hz with small errors and tends to be stable at 350 Hz. Therefore, it is unnecessary to use a very high sampling rate in the A/D conversion. In order to leave enough margin, 500 Hz or 600 Hz can be used to meet the accuracy requirements.

3.2. Voltage Fluctuation Detection

The power frequency voltage with fluctuation components can be expressed as
u ( t ) = A [ 1 + j = 1 s m j cos ( Ω j t + ϕ j ) ] cos ( ω 0 t + ϕ 0 )
where A denotes the amplitude, ω 0 and Ω j denote the power frequency and the angular velocity of each amplitude modulation wave component, respectively, and ϕ 0 and ϕ j denote their corresponding start phases.
Normalizing A, a simpified form of Equation (9) is arranged as
u ( t ) = ( 1 + m cos Ω t ) cos ω t
where m represents the amplitude of the voltage fluctuation with an angular frequency of Ω and ω is the angular velocity of the power frequency.
The signal expressed by
2 [ 2 u 2 ( t ) u 4 ( t ) ] = 5 4 + m cos Ω t + cos 2 ω t 1 4 cos 4 ω t m cos Ω t cos 4 ω t
is filtered by a 0.05 Hz–35 Hz band-pass filter to obtain the voltage fluctuation component m cos Ω t . Compared with the square detection method, this method eliminates the error caused by frequency 2 ω Ω and has higher accuracy.

3.3. Filter Digitization

From the flicker detection design specification of IEC, the digital flicker detector cannot be directly designed. It is necessary to discretize all s domain transfer functions G ( s ) to become digital domain transfer functions H ( s ) . The bilinear transformation method has the advantages of overcoming multi-mapping, of eliminating the spectrum aliasing distortion existing in the impulse response invariant method, and of maintaining excellent analog system characteristics. Therefore, this paper uses this method to discretize the analog filter of each step. The function [ n u m d , d e n d ] = bilinear ( n u m , d e n , f s ) in Matlab is used to achieve the conversion of the s domain transfer function to the z domain, where f s is the sampling frequency.
The s domain transfer function H ( s ) is transformed into
H ( s ) = n u m ( 1 ) s n + + n u m ( n ) s + n u m ( n + 1 ) d e n ( 1 ) s m + + d e n ( m ) s + d e n ( m + 1 )
where n u m and d e n are matrices of numerator and denominator coefficients, which can be expressed as n u m = [ n u m ( 1 ) , n u m ( 2 ) , , n u m ( n + 1 ) ] , d e n = [ d e n ( 1 ) , d e n ( 2 ) , , d e n ( m + 1 ) ] .
After executing bilinear , the coefficient matrix sum of the transfer function of the discrete system is obtained as n u m d = [ b ( 1 ) , b ( 2 ) , , b ( n b + 1 ) ] , d e n d = [ 1 , a ( 2 ) , , a ( n a + 1 ) ] .
Then, the transformed digital filter transfer function can be obtained as follows:
H ( z ) = b ( 1 ) + b ( 2 ) z 1 + + b ( n b + 1 ) z n b 1 + a ( 2 ) z 1 + + a ( n a + 1 ) z n a

3.4. Probability Resampling Frame Format

Due to the limitation of accuracy, it is necessary to select a relatively high sampling frequency for the digital processing of voltage fluctuation signals. For example, if f s = 500 Hz , defined by short-time flicker measurement, continuous sampling for 10 min is required; that is, 300,000 instantaneous flicker visual acuity data are obtained to participate in statistical evaluation. Also, in order to ensure the accuracy of the operation, a longer storage type is required for data storage and operation. The huge amount of data reduces the calculation efficiency and increases the cost of hardware resources. In order to solve this problem, the probability resampling method is applied, and the data extraction process is shown in Figure 5.
As we can see from Figure 5, after the processing of light–eye–brain simulation, the obtained instantaneous flicker visual acuity S [ n ] is first divided into k frames, each of which is composed of N data. Then, each frame of data is extracted by a uniform probability to form S [ k ] , so that the data involved in the statistical evaluation is reduced to 1 / N of the original. In order to improve the measurement speed, the method is run by simultaneous sampling and processing under the premise of a suitable sampling window.

4. Method Validation

4.1. Simulation Verification and Discussion

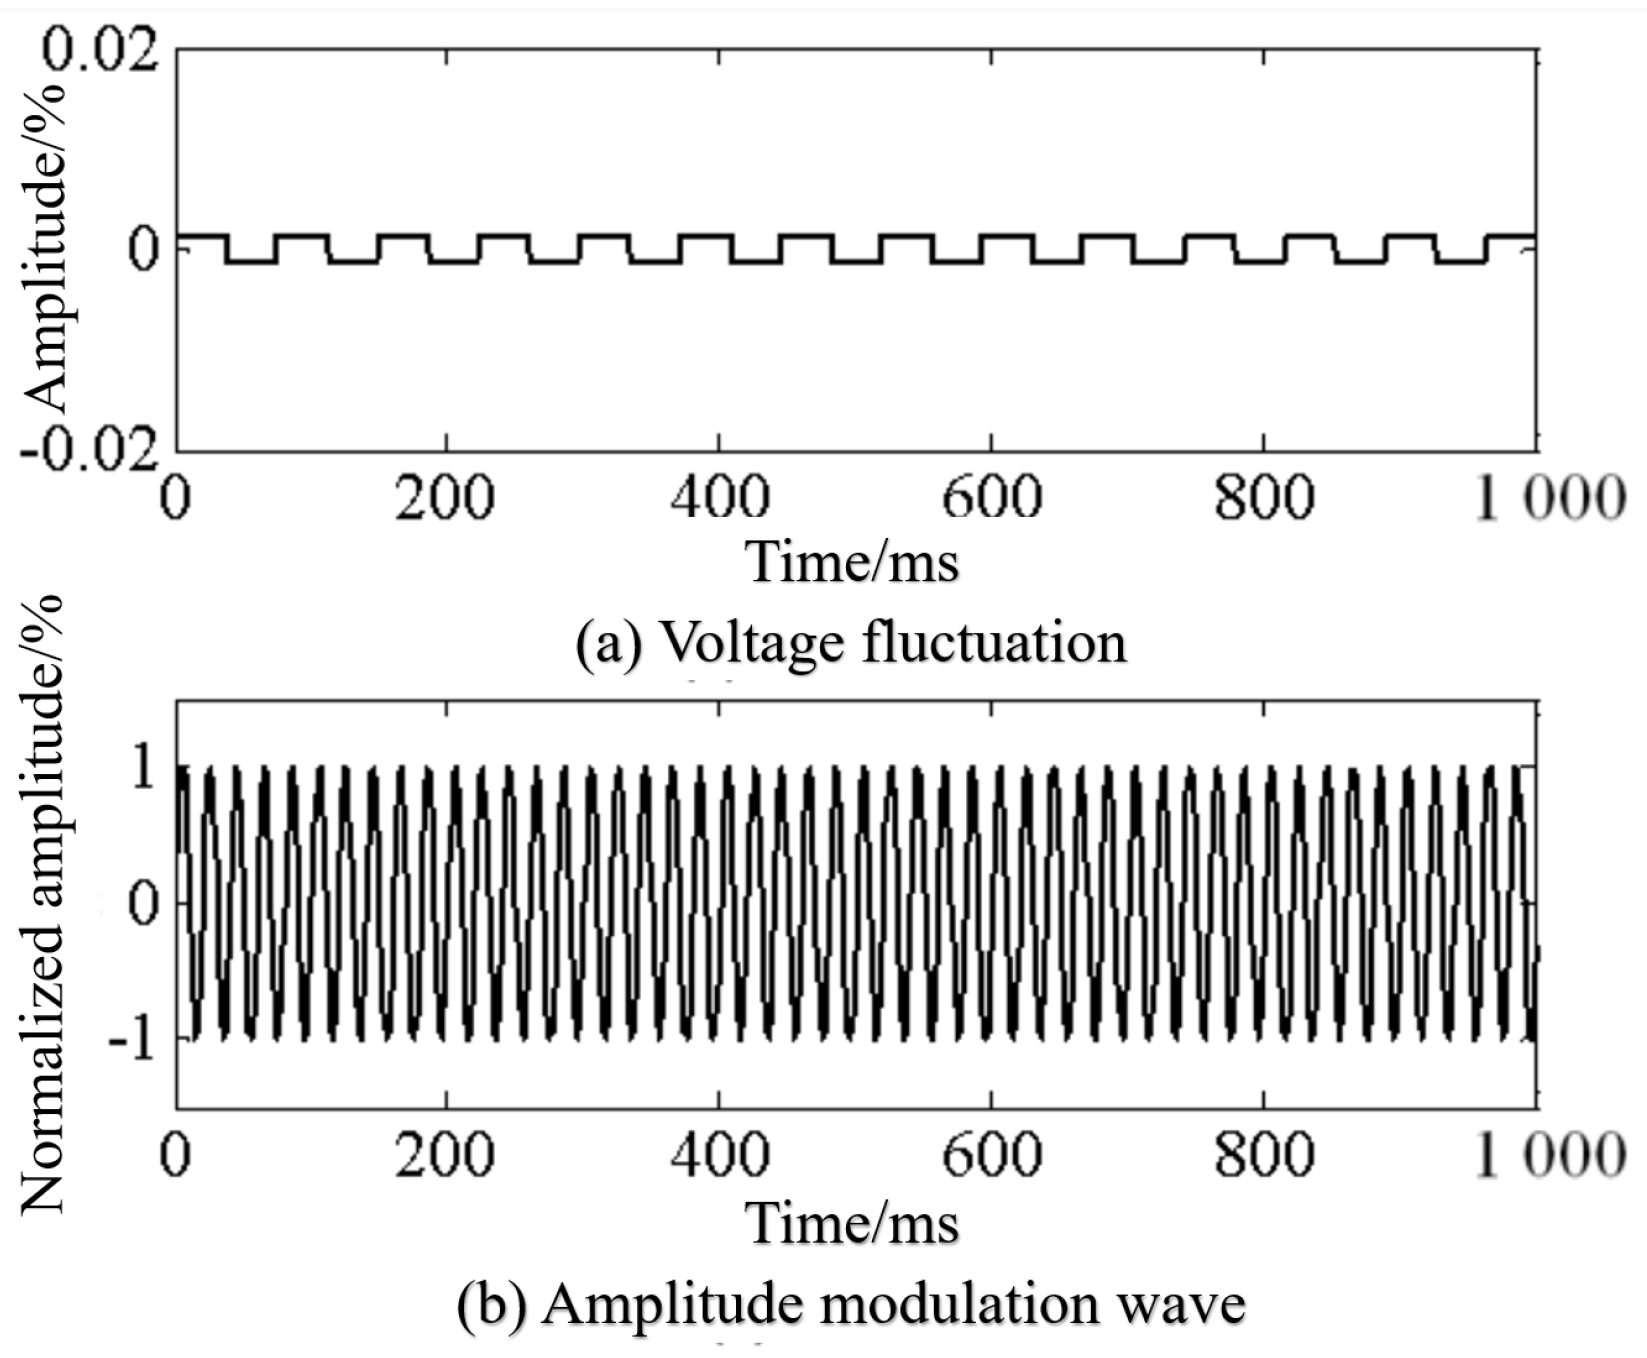
To verify the effectiveness of the probability resampling-based digital flicker detection method, this paper simulates and analyzes the detection results of a series of standard fluctuation signals. A square wave with a fluctuation amplitude of 0.402% and a fluctuation frequency of 13.5 Hz is selected as the verification signal. The normalized voltage fluctuation and amplitude modulation waveforms are shown in Figure 6.
The amplitude modulation signal shown in Figure 6 is sampled and sent to the light–eye–brain simulation, and probability resampling and statistical evaluation steps are shown in Figure 2 for processing. The sampling frequency is set to f s = 600 Hz , and the compression ratio is set to δ N = 1 / 60 . To avoid the filter convergence time, the sampling time window is set to 11 min and the short-time flicker is calculated 10 min after selection. The simulation results are that the error is −0.09%, within 0.95∼1.05 (specified in the international standard of IEC, the error is within ± 5 % × 5 % ).
In order to further verify the effectiveness of the method, under the same simulation conditions, low-, medium-, and high-frequency fluctuations and amplitude-modulated waves with different fluctuation amplitudes were selected for numerical simulation calculations. The results are shown in Table 1.
It can be seen from Table 1 that the flicker values of modulated signals with different amplitudes and frequency of fluctuation are within the allowable range of error. Therefore, it is feasible to use the probability resampling method to measure the flicker caused by voltage fluctuation digitally.
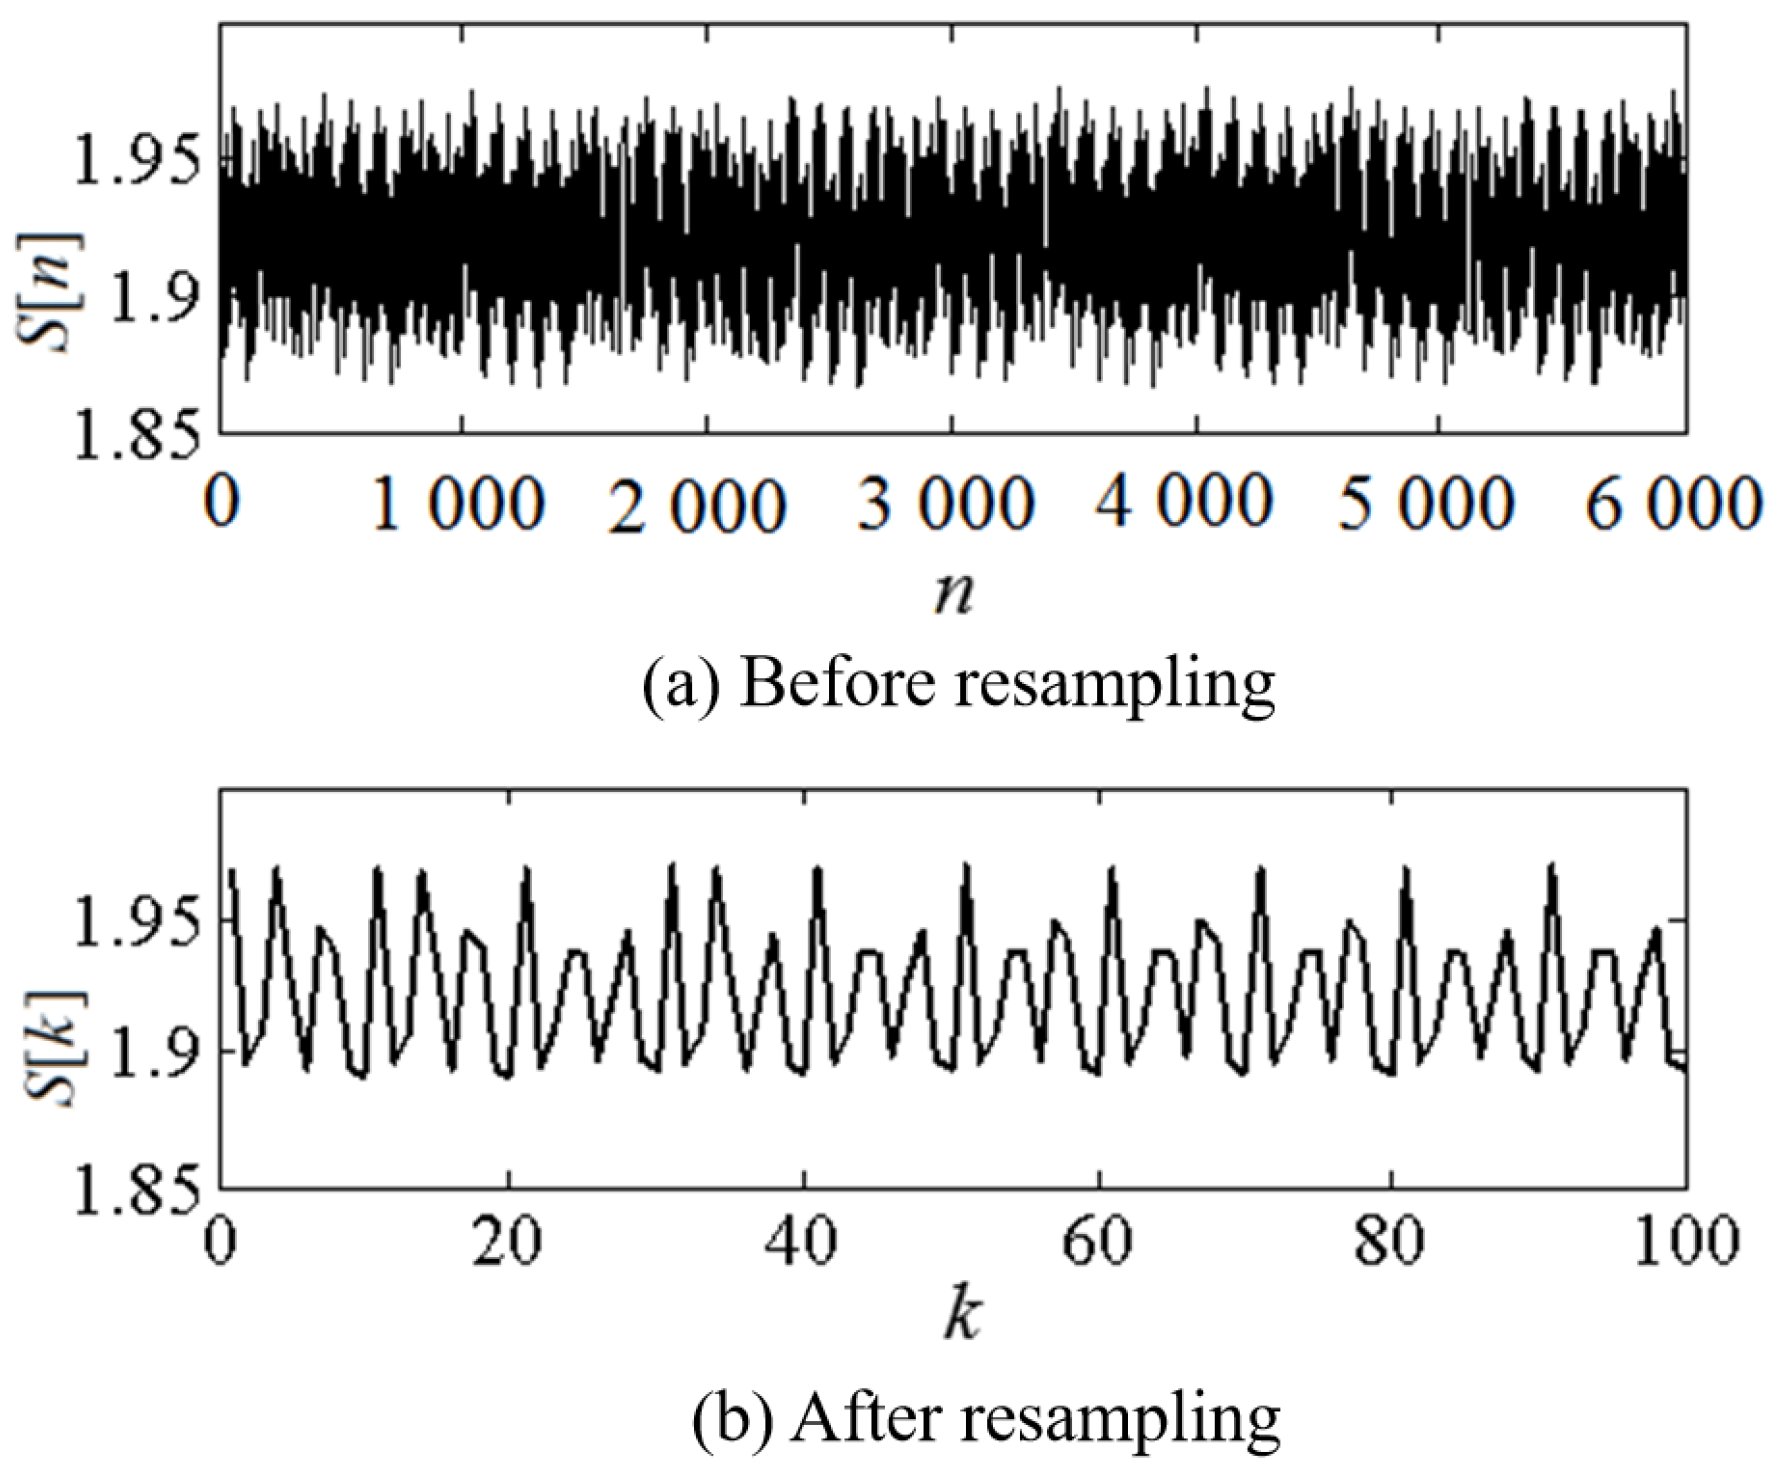
Figure 7 shows the instantaneous flicker visual acuity before and after the probability resampling in the simulation process. Compared with Figure 7a,b, we observe that the data density after probability resampling is reduced, which is 1/60 of the original, and greatly saves data storage space involved in statistical evaluation.
The sampling frequency is set to f s = 600 Hz , and double-precision floating-point number (double, 8 Byte) is used to store instant flicker visual acuity, a short-term flicker measurement test was carried out (the length of measurement time was 10 min). The data volume, hardware storage space, and algorithm execution efficiency before and after the probability resampling algorithm are listed in Table 2.
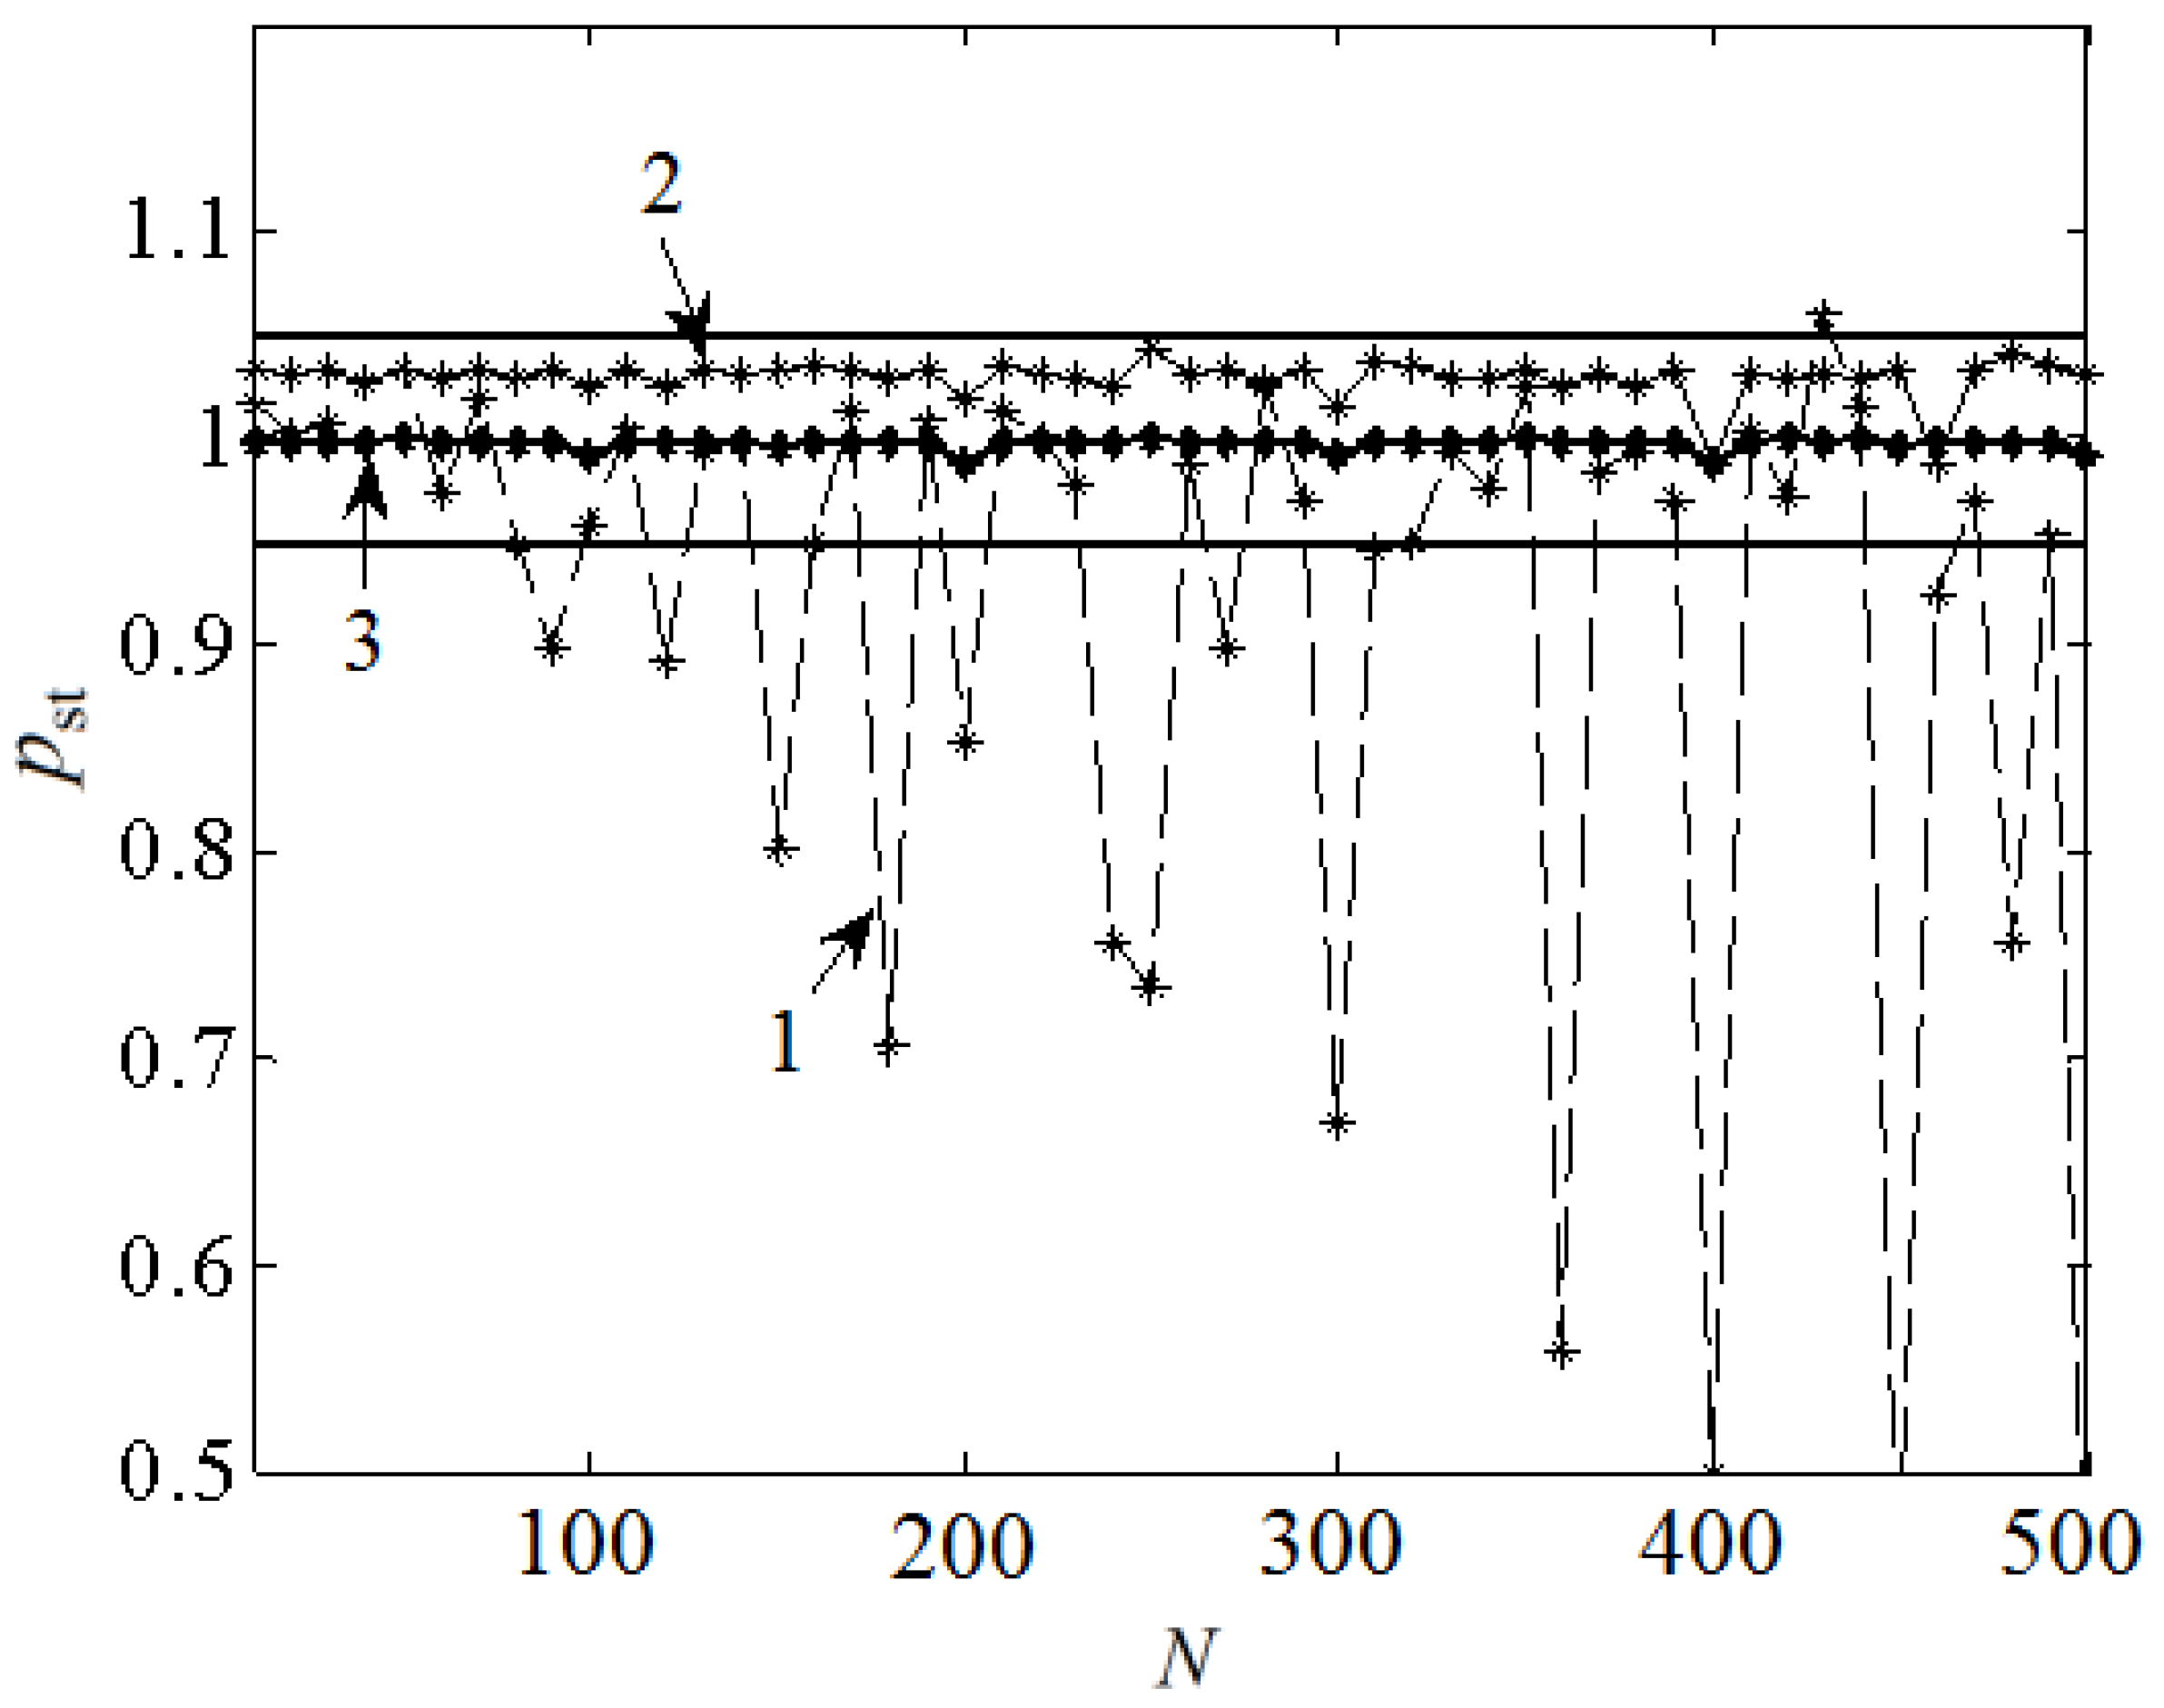
From Table 2, we can observe that, when δ N = 1 , it means that the probability resampling method is not applied to flicker detection. In that case, the corresponding instantaneous flicker visual sensitivity data is 360,000, occupying 2.75 MB of data storage space, and the time complexity of data statistical sorting is O ( 360 , 00 0 2 ) . When δ N = 1 / 20 , the probability resampling method is used, so that the corresponding instantaneous flicker visual sensitivity data and the amount of data storage space are reduced to 1/20 of the original and the time complexity is reduced to O ( 180 , 00 0 2 ) . With the reduction of compression ratio δ N , the corresponding number of instantaneous flicker visual acuity data, the amount of storage space required, and the complexity of sorting time will be further reduced. At the same time, due to the large reduction in the amount of data that participates in the sorting statistics during the operation of the algorithm, the time for data access and sorting operation is shortened and the real-time performance of the algorithm operation is greatly improved. In addition, the storage space can be further reduced by increasing N. However, the larger N is, the less information is involved in the statistics, and the error will definitely increase. To select a reasonable compression ratio, the corresponding relationship between the accuracy of p s t and the value of δ N of the first three typical signals in Table 1 is studied, and the results are shown in Figure 8.
Figure 8 shows that precision with small fluctuations is sensitive to the change of N. When N < 90 , the value of p s t is within the upper and lower limits of error, and with the increase of N, the value of p s t is free from the error range and the fluctuation range is increasing. With the increase of voltage fluctuation frequency, the error caused by the change of p s t to N is less obvious, but the voltage fluctuation signal is not a single frequency fluctuation. Therefore, it is necessary to consider the case that all kinds of frequency fluctuations are undistorted, that is, to choose p s t of small fluctuations as the final compression ratio.

4.2. Engineering Tests and Discussion

The digital flicker detection method based on probability resampling proposed in this paper has been applied to the flicker detection of PITETM series power quality analyzers. The main parameters are set as f s = 600 Hz , N = 60 , and δ N = 1 / 60 . The instrument uses a dual-core master–slave structure. The main controller is the LPC2478 microprocessor; the slave processor is TMS320VC5402, an external 128kB 61LV6416DRAM memory chip equipped with a 12-bit TI high-speed A/D conversion chip, a high-precision signal conversion circuit and touch screen, and other peripherals module. The main hardware structure of the system is shown in Figure 9.
The professional inspection agency Guangdong Electronic and Electrical Product Supervision and Inspection Institute, Guangdong, China and Guangdong Electronic Product Quality Supervision and Inspection Station, Guangdong, China were entrusted with inspecting the flicker detection quality of the equipment. The inspection results are shown in Table 3.
From Table 3, we can see that the flicker detection results meet the technical standards of IEC, indicating the correctness and feasibility of the proposed flicker detection method in engineering application. It should be noted that the actual detection error is slightly larger than that of the simulation due to the influence of the accuracy of the A/D conversion chip, signal conversion circuit, program variable setting, etc.

5. Conclusions

This paper proposed a probability resampling data compression method to solve the problem of data redundancy in IEC flicker detection digitization. In particular, uniform probability distribution resampling is applied before statistical evaluation to compress redundant data to reduce storage space and to improve algorithm execution efficiency. Both numerical simulation and engineering tests were carried out to verify the feasibility and correctness of the method. The results show that the proposed method has an excellent data compression ratio and that the measurement accuracy meets the requirements of international standards. As discussed earlier, a higher sampling frequency is desired in the digitalization process of IEC flicker detection, with the cost of increased data volume and resource burden to the system. Therefore, selection of the compression ratio in the validation takes the sampling frequency and measurement accuracy factors into consideration. The flicker detection method based on probability resampling overcomes the shortcomings of the low efficiency of algorithms and the high requirements of hardware resources brought by the traditional flicker digital measurement, which has excellent economic significance and practical impact for both new developments of digital flicker detection instruments and upgrades of traditional power quality instruments.

Author Contributions

H.G. and J.T. conceived and designed the research; H.G. and P.X. designed and performed the simulation experiment; S.H. and R.W. performed the engineering validation; H.G., P.X., J.T., S.H., R.W. and Q.Z. wrote the manuscript. All authors have read and agreed to the published version of the manuscript.

Funding

This research was funded by the Natural Science Foundation of Anhui Province, China (no. 1808085MF183); by the University Natural Science Research Key Project Foundation of Anhui Province, China (no. KJ2016A169); by the Talents Program Foundation of Anhui Science and Technology University, China (no. ZRC2014444); and by the Academy of Finland (no. 315660).

Conflicts of Interest

The authors declare no conflict of interest.

References

  1. Wei, L.J.; Zhan, P.; Liu, Z.G.; Tao, Y.H.; Yue, D.L. Modeling and analysis of maximum power tracking of a 600 kW hydraulic energy storage wind turbine test rig. Processes 2019, 7, 706. [Google Scholar] [CrossRef] [Green Version]
  2. Al-Shetwi, A.Q.; Hannan, M.A.; Jern, K.P.; Alkahtani, A.A.; PG Abas, A.E. Power quality assessment of grid-connected PV system in compliance with the recent integration requirements. Electronics 2020, 9, 366. [Google Scholar] [CrossRef] [Green Version]
  3. Castello, P.; Muscas, C.; Pegoraro, P.A.; Sulis, S. PMU’s behavior with flicker-generating voltage fluctuations: An experimental analysis. Energies 2019, 12, 3355. [Google Scholar] [CrossRef] [Green Version]
  4. Von Meier, A.; Stewart, E.; McEachern, A.; Andersen, M.; Mehrmanesh, L. Precision micro-synchrophasors for distribution systems: A summary of applications. IEEE Trans. Smart Grid 2017, 8, 2926–2936. [Google Scholar] [CrossRef]
  5. Redondo, K.; Gutiérrez, J.J.; Azcarate, I.; Saiz, P.; Leturiondo, L.A.; Ruiz de Gauna, S. Experimental study of the summation of flicker caused by wind turbines. Energies 2019, 12, 2404. [Google Scholar] [CrossRef] [Green Version]
  6. Jumani, T.A.; Mustafa, M.W.; Rasid, M.M.; Anjum, W.; Ayub, S. Salp swarm optimization algorithm-based controller for dynamic response and power quality enhancement of an islanded microgrid. Processes 2019, 7, 840. [Google Scholar] [CrossRef] [Green Version]
  7. Nieto, A.; Vita, V.; Maris, T.I. Power quality improvement in power grids with the integration of energy storage systems. Int. J. Eng. Res. 2016, 7, 438–443. [Google Scholar]
  8. Santos, E.; Khosravy, M.; Lima, M.A.A.; Cerqueira, A.S.; Duque, C.A.; Yona, A. High accuracy power quality evaluation under a colored noisy condition by filter bank ESPRIT. Electronics 2019, 8, 1259. [Google Scholar] [CrossRef] [Green Version]
  9. Lodetti, S.; Azcarate, I.; Gutiérrez, J.J.; Leturiondo, L.A.; Redondo, K.; Sáiz, P.; Melero, J.J.; Bruna, J. Flicker of modern lighting technologies due to rapid voltage changes. Energies 2019, 12, 865. [Google Scholar] [CrossRef] [Green Version]
  10. IEC. International Electrotechnical Vocabulary—Part 614: Generation, Transmission and Distribution of Electricity— Operation; IEC 60050-614; International Electrotechnical Commission (IEC): Geneva, Switzerland, 2016. [Google Scholar]
  11. IEC. Electromagnetic Compatibility (EMC)—Part 4-15: Testing and Measurement Techniques-Flickermeter-Functional and Design Specifications; IEC 61000-4-15 Ed.2; International Electrotechnical Commission (IEC): Geneva, Switzerland, 2010. [Google Scholar]
  12. IEC. Electromagnetic Compatibility (EMC)—Part 3-7: Limits—Assessment of Emission Limits for the Connection of Fluctuating Installations to MV, HV and EHV Power Systems; IEC 61000-3-7; International Electrotechnical Commission (IEC): Geneva, Switzerland, 2008. [Google Scholar]
  13. IEC. Electromagnetic Compatibility (EMC)—Part 4-30: Testing and Measurement Techniques—Power Quality Measurement Methods; IEC 61000-4-30 Ed.3; International Electrotechnical Commission (IEC): Geneva, Switzerland, 2015. [Google Scholar]
  14. Tse, N.; Chan, J.; Lau, W.H.; Lai, H. Hybrid wavelet and Hilbert transform with frequency-shifting decomposition for ower quality analysis. IEEE Trans. Instrum. Meas. 2012, 12, 3225–3233. [Google Scholar] [CrossRef]
  15. Gao, Y.; Li, F.; Chen, J.; Teng, Z.; Cao, Y. Voltage flicker measurement method using improved teagerkaiser energy operator based on Nuttall window spectral correction. Chin. J. Sci. Instrum. 2014, 4, 67–75. [Google Scholar]
  16. Wu, C.J.; Chen, Y.J. A novel algorithm for precise voltage flicker calculation by using instantaneous voltage vector. IEEE Trans. Power Deliv. 2006, 3, 1541–1548. [Google Scholar] [CrossRef]
  17. Li, H.; Kang, W.; Yan, X.; Zhang, L. Voltage flicker measurement based on Chirp-Z transform. Trans. China Electrotech. Soc. 2009, 3, 209–215. [Google Scholar]
  18. Li, L.; Gao, Y.; Zhang, Y.; Wu, C.; Cao, Y. Voltage flicker envelope tracking based on improved k-value energy operator and improved Chirp-Z transform. Trans. China Electrotech. Soc. 2018, 11, 2636–2646. [Google Scholar]
  19. Srinivasan, S.; Krishnamoorthy, M.; Pongiannan, R.; Jeyasudha, S. Real time assessment of power quality issues in 11 kV/440 V distribution feeder using distribution static synchronous compensator. T I Meas. Control. 2020. [Google Scholar] [CrossRef]
  20. Moallem, P.; Zargari, A.; Kiyoumarsi, A. Improving IEC flickermeter for implementation by an ARM microcontroller-based digital system. T I Meas. Control. 2013, 3, 342–352. [Google Scholar] [CrossRef]
  21. Cifredo-Chacón, M.-Á.; Perez-Peña, F.; Quirós-Olozábal, Á.; González-de-la-Rosa, J.-J. Implementation of processing functions for autonomous power quality measurement equipment: A performance evaluation of CPU and FPGA-based embedded system. Energies 2019, 12, 914. [Google Scholar] [CrossRef] [Green Version]
  22. Zhu, J.; Zhu, M.; He, C.; Liao, G. Design of power quality on-line monitoring system based on dual CPU. Autom. Instrum. 2014, 11, 54–56. [Google Scholar]
  23. International Electrotechnical Commission. Electromagnetic Compatibility (EMC)—Part 4-15: Testing and Measurement Techniques—Flickermeter—Functional and Design Specifications; IEC Int. Std. 61000-4-15; International Electrotechnical Commission: Geneva, Switzerland, 2011. [Google Scholar]
  24. Wiczynski, G. Estimation of Pst indicator values on the basis of voltage fluctuation indices. IEEE Trans. Instrum. Meas. 2017, 66, 2046–2055. [Google Scholar] [CrossRef]
  25. Gao, H.T.; Zhu, E.L.; Huang, S.H. A method of digitized implement for IEC flicker detection standard. Proceedings of IEEE 8th Annual International Conference on CYBER Technology in Automation, Control, and Intelligent Systems; IEEE: Tianjin, China, 2018; pp. 879–882. [Google Scholar]
Figure 1. Block diagram of the International Electrotechnical Commission (IEC) flicker detection method.
Energies 13 03350 g001
Figure 2. Basic principle of probability resampling.
Energies 13 03350 g002
Figure 3. Flowchart of probability resampling flicker detection.
Energies 13 03350 g003
Figure 4. Curve of f s and p s t .
Energies 13 03350 g004
Figure 5. Frame format.
Energies 13 03350 g005
Figure 6. Voltage fluctuation and amplitude modulation.
Energies 13 03350 g006
Figure 7. Instantaneous flicker sensation level.
Energies 13 03350 g007
Figure 8. Effect of N on p s t .
Energies 13 03350 g008
Figure 9. Hardware structure.
Energies 13 03350 g009
Table 1. Simulation results of p s t .
Voltage Fluctuation Range (%)Square Wave Fluctuation Frequency (Hz)Unused Probability Resampling ( p st )Probability Resampling ( p st )Target Value
2.210.0166671.01560.97520.95∼1.05
0.9050.3251.03221.02840.95∼1.05
0.40213.50.99830.99910.95∼1.05
1.5 × 0.9050.3251.54811.54251.425∼1.575
3.3 × 2.210.0166673.33883.20633.135∼3.465
Table 2. Comparison of data volume, storage space, and execution efficiency before and after method application.
δ N 11/201/301/401/501/60
Data number (n)360,00018,00012,000900072006000
Storage capacity (Byte)2.75 M140.6 K93.8 K70.3 K6.3 K6.9 K
Time complexity ( O ( n 2 ) ) O ( 36000 0 2 ) O ( 1800 0 2 ) O ( 1200 0 2 ) O ( 900 0 2 ) O ( 720 0 2 ) O ( 600 0 2 )
Table 3. Test results of flicker.
Voltage Fluctuation Range (%)Square Wave Fluctuation Frequency (/min) Measurements Target Value
Phase APhase BPhase C
2.72410.980.971.010.95∼1.05
2.21121.011.021.030.95∼1.05
1.45971.010.970.980.95∼1.05
0.906391.020.970.960.95∼1.05
0.7251101.010.981.040.95∼1.05
0.40216201.020.970.990.95∼1.05
2.40040000.970.981.020.95∼1.05