Abstract
Due to the hot air recirculation, the inlet air enthalpy h1 of mechanical draft wet cooling towers (MCTs) was usually greater than the ambient air enthalpy ha. To realize the cooling performance and accurate design of MCTs, this paper clarified the feasibility of the inlet air enthalpy empirical formula presented by the Cooling Technology Institute (CTI) of the USA. A three-dimensional (3D) numerical model was established for a representative power plant, with full consideration of MCTs and adjacent main workshops, which were validated by design data and published test results. By numerical simulation, the influence of different wind directions and wind speeds on hot air recirculation (HAR) and the influence of HAR on the cooling performance of the MCTs were qualitatively studied based on the concept of hot air recirculation rate (HRR), and the correction value of HRR was compared with the calculated value of the CTI standard. The evaluation coefficient ηh, representing the ratio of the corrected value to the calculated value was introduced to evaluate the applicability of the CTI formula. It was found that HAR was more sensitive to ambient crosswind, and an increase in HRR would deteriorate the tower cooling performance. When the crosswind speed increased from 0 to 15 m/s, ηh, changed from 2.42 to 80.18, and the calculation error increased accordingly. It can be concluded that the CTI empirical HRR formula should be corrected when there are large buildings around the MCTs, especially under high-speed ambient crosswind conditions.
1. Introduction
The cooling tower is a commonly used heat rejection device for thermal power plants [1,2,3]. According to the way the air passes through the cooling towers, they can be divided into natural draft and mechanical draft cooling towers (MCTs). The MCTs draw air into the inlet of the towers through fans and exchange heat with high-temperature liquids to achieve the purpose of heat exchange. MCTs are widely used as one of the most economical, efficient, and energy-efficient ways to remove heat. Theoretical studies on the performance of cooling towers began in the 1970s [4]. To better serve cooling tower buyers and designers, the Cooling Technology Institute (CTI) of the USA issued a series of specifications and standards. At the same time, the details of hot air recirculation (HAR) of the cooling towers are defined, and the specific calculation formula of hot air recirculation rate (HRR) is given. However, there are many influencing factors affecting the HAR of the cooling towers, which will also affect the inlet air enthalpy h1. Among them, the ambient wind and the buildings around the cooling towers have a great impact on the HAR of the cooling towers; hence, the results obtained by ignoring these influencing factors are inaccurate. In this paper, a three-dimensional (3D) numerical model was established for a group of four adjacent MCTs, with full consideration of the adjacent main workshops in the power plant. This paper proposed to use the difference between the corrected h’1 and the ambient enthalpy ha (h1 − ha) and compared it with the calculated value of (h1 − ha) from the formula of the CTI. In particular, the evaluation coefficient ηh was introduced to evaluate the applicability of the CTI formula, which explains the applicable conditions of the CTI formula and provides a theoretical basis of reference for engineering design and basic data for the correction of subsequent formulas.
When the MCTs are in normal operation, they are often accompanied by the phenomenon of HAR. That is, the hot gas discharged from the cooling towers will be partially re-inhaled into the inlet and enter the cooling towers again to participate in heat exchange. This part of the hot and humid air is mixed with the ambient gas to increase the heat of the air entering the cooling towers, which reduces the cooling performance of the cooling towers. The MCTs studied in this paper are all operating under steady conditions, but the inlet and outlet air conditions and air flow of the towers are affected by surrounding buildings and ambient winds [5,6,7,8]. A. Chahine et al. [9] and Lu et al. [10] studied the effects of crosswinds on cooling tower performance and plume diffusion by experiments and numerical simulations. They found that crosswinds sometimes cause HAR while reducing cooling tower performance. Xiu Xiong et al. [11] numerically simulated the effect of HAR on the cooling performance of cross-flow cooling towers and counter-flow cooling towers. Liu [12] and Wang [13] simulated the phenomenon of hot air reflow and proposed valuable suggestions to reduce these adverse effects. Z. Zhai et al. [14] and Y. Lu et al. [5] established a windbreaker inside the cooling tower, which weakened the adverse effects of crosswind.
Ambient wind mainly affects the thermal performance of the cooling towers by causing HAR. Different crosswind speeds and crosswind directions can change the state of the air flowing into the cooling towers; emissions recycling in the cooling towers increases the incoming air wet bulb temperature, thereby reducing the thermal performance of the cooling towers [15]. Kroger et al. [16,17] studied the performance of several industrial cooling towers under windy conditions. The results show that with the increase of crosswind speed, the cooling performance shows a monotonous downward trend. Saud Ghani et al. [18] numerically studied the impact of different incident wind speeds and incident directions on HAR and proposed measures to mitigate HAR. Zhou yu et al. [19] numerically simulated the comparative study of the heat transfer characteristics of the traditional A-shaped and new round-table air-cooled units under different environmental wind speeds. Moore et al. [20] and Gu et al. [21] found that the ambient wind is closely related to the HAR of the cooling tower. The field test results showed that as the wind speed increases, the recirculation gradually increases until the maximum recirculation value is reached, and the recirculation amount decreases as the wind speed increases. Becker et al. [6] used a numerical model to study the plume recirculation in the cooling tower. The study found that factors such as intake speed, exhaust speed, wind speed, and wind direction have a significant impact on the HAR. Zhao et al. [22] pointed that the ambient crosswind deteriorated the cooling performance of natural draft dry cooling tower with vertical delta radiators under constant heat load seriously.
In a thermal power plant, in the actual operation of the cooling towers, there are often many buildings around them. The presence of surrounding buildings will affect the HAR and thereby affect the thermal performance of the cooling towers. J.H. Lee et al. [4] studied the HAR and plume generation of a row of cooling towers with obstacles around them, but most of the research focused on water content. The presence of obstacles affects the temperature and humidity of the air at the air inlet of the cooling towers. There is a lot of literature on the use of computational fluid dynamics (CFD) technology to study the effect of windbreak walls on the thermal performance of cooling towers [17,23,24,25]. Lee et al. [4] conducted a three-dimensional parametric study of the gap between the cooling tower entrance area and the obstacle. Fan and Dong [26] studied the effect of MCTs on the cooling performance of air-cooled condensers in complex environments. Al-Waked [27] studied the effect of wind on the performance of the cooling tower and concluded that a separate cooling tower has better performance than a cooling tower with buildings around it. The above research results show that the performance will be affected when there are buildings around the cooling towers.
As we know, in most of the research related to HAR, whether it is on mechanical draft cooling towers, natural draft cooling towers, or air-cooled condensers, the calculation of their HRR is based on the formula of the CTI [28], without considering the applicable conditions of this formula; so far, research on the applicability of the CTI formula has not been involved. It is even more urgent to study the applicability of the formula and even propose a new calculation formula. In addition, the terrain and structure of the power plant are relatively complicated. If the circumfluence and disturbance of exhaust wet air from the cooling tower is ignored, the accuracy of the design and calculation of the cooling tower will be greatly affected. Zhang [29] and Li [30] made corrections to the backflow and interference of the humid air at the inlet of the cooling tower, and the formulas used were also from the CTI. However, the results obtained ignoring the applicability of the formula are inaccurate, and the deviation of the calculation results will have a huge impact on the economic evaluation and construction of the entire power plant.
Taking an actual representative power plant as an example, and taking into account buildings such as the gas booster station, cooling water pump room, cooling tower pump station, steam turbine house, and center control room, the calculation method of the calculated air enthalpy difference (h1−ha) is applied to evaluate the cooling performance of MCTs, and the corrected value of (h1 − ha) is compared with the calculated value of (h1 − ha) from the formula of the CTI. The applicability of the formula is illustrated by using the evaluation coefficient ηh. The CTI formula is adapted to the windless condition, without considering the influence of HAR on the inlet air of the cooling tower, and there is no building around the cooling tower. The final results show that the CTI empirical HRR formula should be corrected when there are large buildings around the MCTs, especially under high-speed ambient crosswind conditions, which provides a reference for engineering design and basic data for the correction of subsequent formulas.
Firstly, the numerical model and boundary conditions are introduced in Section 2. Then in Section 3, the influence of ambient crosswind on HAR and the influence of the HAR on the cooling performance of the MCTs are discussed, and the applicability of the CTI formula is analyzed. Finally, Section 4 summarized the work as a whole.
The research gap of the applicability of the CTI formula is filled in this paper. A large amount of basic data provides reference for further studies. The research plays an important role in the accurate calculation of the cooling performance of the cooling tower.
2. Numerical Model
2.1. Physical Model
Figure 1 shows MCTs and their surrounding buildings, which are composed of a gas booster station, cooling water pump room, cooling tower pump station, steam turbine house, and center control room. There are four sets of MCTs, which are arranged back to back in the shape of a field, and the arrangement orientation is parallel to the summer-dominant crosswind direction. MCTs and surrounding buildings actually exist. We modeled them according to the actual size to ensure the accuracy of the calculation results. The main dimensions of the studied MCT with S-wave fill are shown in Table 1.
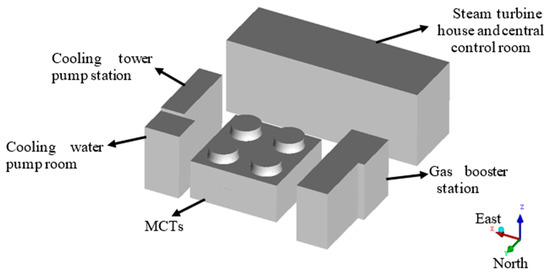
Figure 1.
Physical model.

Table 1.
The main dimensions of the studied mechanical draft wet cooling towers (MCTs).
2.2. Assumptions
Heat and mass transfer occur at the air–water interface;
Air is saturated at the air–water interface;
There is no resistance in the mass transfer process;
The temperature gradient is zero at the air–water interface;
The fluid of wind fields is incompressible ideal gas, and the flow is steady.
2.3. Grid Analysis and Computation Method
As shown in Figure 2, the calculation domain is a cylinder with a height of 1400 m and a diameter of 700 m, much larger than the size of the MCTs. The inner area of the MCTs is divided into air inlet, water collecting zone, rain zone, fill zone, spray zone, drift eliminator, and tower wall. In order to get accurate results, the mesh of the heat and mass transfer zone is small and compact. In addition, a boundary layer is provided to capture the airflow characteristics near the tower shell. The mesh density in the area around the fill zone, the air inlet, and the air duct is very large, and the mesh density gradually becomes sparser from the tower to the ambience in order to shorten the calculation time. There are three sets of grid densities (2,500,000, 3,300,000, 4,100,000) of the numerical grid independence testing. Their calculation error is less than 1%. In order to shorten the calculation time and improve the accuracy, the final grid number of 3.3 million was adopted for the simulation of the entire project modeling.
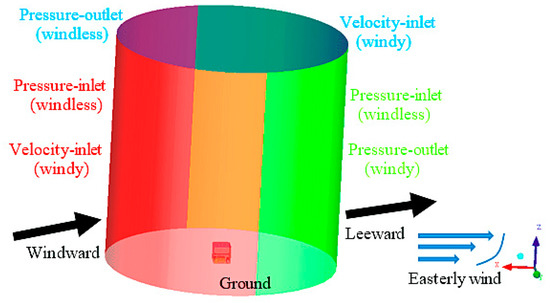
Figure 2.
Computation domain and its air flow boundaries for MCTs.
According to the control-volume discretization method [31], the continuous equation and the momentum equation in the governing equation are solved by the simple algorithm for pressure–velocity coupling. The second-order upwind schemes are used for convection terms in discrete momentum, energy, and turbulence equations, and the central difference scheme is used for diffusive terms.
2.4. Mathematical Model
The airflow field inside and outside the MCTs can be described by steady-state Reynolds-averaged Navier–Stokes equations when the unit load, meteorological conditions, and circulating water volume are stable. Then, the general governing equations for the airflow field are as follows:
The mass conservation equation is defined as:
where ρ and represent the density and velocity vectors of air, respectively.
Moreover, the momentum conservation equation is written as:
where p is the gas pressure; , g, and denote the stress tensor, gravity acceleration, and the resistance of the gas, respectively.
The energy conservation equation reads as:
In Equation (3), h is air enthalpy, μt and σ represent turbulent viscosity coefficient and the Prandtl number, respectively [32]. T is the temperature, Sh is the source term of energy, and hj and Jj represent the air enthalpy and diffusion flux of the j component, respectively.
The gas state equation can be written as follows:
where R is the universal gas constant, and Yj and Mw, j represent the quality score and molecular weight of the j component, respectively.
Because the standard k–ε turbulence model has many applications, a moderate amount of calculation, more data accumulation, and higher accuracy, this model is used in general engineering calculations, and its convergence and calculation accuracy can meet the general engineering calculation requirements; hence, the Reynolds stress average term is turbulently closed using the standard k–ε turbulence model, where k and ε represent the turbulent kinetic energy per units mass and turbulence dissipation rate, respectively. Hence, the k–ε equation can be written as:
In Equations (5) and (6), μ is the dynamic viscosity coefficient of air, and σk and σε represent the turbulent Prandtl number of the k equation and the ε equation, respectively. C1ε, C2ε, and C3ε are turbulence model constants. Gk is the kinetic energy generation term caused by the average velocity gradient, and Gb is the turbulent flow energy caused by buoyancy.
The component transport equation can be expressed as follows:
where Sj is the production rate of the j component. Other symbols have the same meaning as those in the equation above.
In Equations (2), (3), and (6), we can calculate , ut, h, hj, and C3ε by the following equations.
where I is the unit vector, cp, j is the constant pressure specific heat coefficient of the j component, Tref is the reference Darwin temperature (the value is 298.15 K), and Cμ is the turbulence model constant. u, v, and w are velocity components in the x-, y-, and z-direction, respectively.
Finally, the coefficients of the standard k-ε turbulence model are given in Table 2.
Table 2.
Coefficients for standard k-ε turbulence model.
For the studied MCTs, the adopted fill has the following cooling characteristic number N and pressure drop ∆p characteristic:
where Δpa is pressure drop, ρa is air-specific gravity, and q is water density. Here, Af and nf are obtained by the experimental data of the fill [33,34,35,36].
2.5. Boundary Conditions
The calculation area is divided into two areas, namely the inner and outer areas of the MCTs. The outer area of the MCTs is divided into a building area and an environment area, and the environment area has eight boundary surfaces and a top boundary surface. The detailed boundary settings are shown in Figure 2, in which the corresponding parameters are set according to each working condition, and the turbulence intensity and viscosity ratio are set as 0.1% and 0.1, respectively [10]. The air inlet and the outlet of the MCTs are set to internal boundaries, the fill region is set as a porous medium region, and the resistance coefficient is set according to Equations (15) and (16). The spray section is set as the raindrop launching surface, and the circulating water volume and the inlet water temperature are set in the raindrop injection setting. In this paper, the initial velocity of the water droplets at the bottom of the fill is 0.4 m/s, and the initial velocity of the water droplets in the spray zone is 3.5 m/s. The change in diameter of the water droplets during the falling process is very complicated, so the equivalent diameter obtained by experiments is used for thermodynamic calculation and resistance calculation, respectively [25].
The main function of the axial fan is to blow the surrounding cooling air into the heat exchanger. Taking the FLUENT software 6.3 [37], as an example, in the fan model of FLUENT, the fan is simplified into an infinitely thin layer that causes discontinuous pressure rise to overcome flow resistance and the discontinuous pressure rise by the fan is specified as a function of the fan speed. The relationship between them may be a constant, a polynomial, a piecewise linear function, a piecewise polynomial function, or a custom function [38].
In the case of a polynomial, the relationship is expressed as:
where ∆P is the pressure jump, and v is the local fluid velocity normal to the fan. fn is the pressure-jump polynomial coefficient with f1 = 391.72, f2 = −14.139, f3 = −1.9366.
2.6. Validation of the Numerical Model
In order to verify the accuracy of the numerical model of MCTs, we compared and verified the out-of-the-tower water temperature under two windless working conditions. The numerical results are compared with the design values as shown in Table 3. The consistency of the MCTs out of the tower water temperature shows that simplifications associated with the mechanical ventilation cooling towers and the computational methods are reliable enough for the purpose of this investigation.
Table 3.
Comparisons of the simulated and design values of the outlet water temperature under three windless conditions.
3. Results and Discussion
The ambient cooling air circumventing the MCTs and their surrounding buildings, concurrently with hot and humid air escaping from the outlet of the MCTs, fosters a very complex flow field around the MCTs, namely the interaction and disturbance between the humid air and separated vortex. Due to the interaction between the MCTs and the inertia-force action of local air streams, some of the higher temperature humid air returns to the air-inlet of the MCTs, which will lead to a rise of the air temperature of the air-inlet of the MCTs. This phenomenon is called hot air recirculation, which has a great influence on the thermal performance of the MCTs. HRR is generally used to characterize the strength of the HAR; for quantitative analysis of thermal reflow, the HRR of the CTI is defined as follows:
where Ti is the average air temperature of the air-inlet of the MCTs, Ta is the ambient air temperature, and To is the average outlet temperature of the MCTs.
Effects of ambient wind direction under the crosswind speed of 2.3 m/s were investigated by considering eight approaching angles (θ = 0°, 45°, 90°, 135°, 180°, 225°, 270°, and 315°) with ambient crosswind approaching from the north given a zero approach angle (θ = 0°). At the same time, at a wind direction of E (θ = 90°), five wind speeds (vE = 2.3, 5, 10, 15, 21 m/s) were investigated. In addition, the effect of the HAR on the cooling performance of MCTs was also studied. Finally, the applicability of the CTI formula is discussed.
3.1. Effect of Wind Directions
The working principle of the cooling tower is that the gas exchanges heat with the high temperature liquid after entering the air inlet of the cooling tower. As the gas passes through the hot liquid, it carries away the heat, so as to reduce the temperature of the liquid. The water temperature of the cooling tower is generally used as an indicator to measure the performance of the cooling tower. Due to the complexity of the structure of the cooling tower itself and the complexity of the layout of the surrounding buildings, the flow field around the cooling tower is very complicated. The presence of ambient wind can cause HAR, which will increase the water temperature of the cooling tower. Therefore, it is very valuable to understand or determine the effect of different ambient winds on HRR and water temperature of the cooling tower. Based on meteorological data in several recent years, a wind speed of 2.3 m/s was selected, against eight different wind directions. The flow fields around the MCTs and their surrounding buildings were numerically simulated.
In this case, the ambient temperature (Ta) and the inlet water temperature are 11 °C and 35.62 °C, respectively. Figure 3 shows how the HRR and water temperature vary with the wind directions angle θ. It is found that under different wind direction angles, the water temperature range is 22.02–22.73 °C, and the difference between the highest outlet water temperature and the lowest outlet water temperature is 0.71 °C. When the wind direction is SW (θ = 225°), the water temperature is the lowest, and the HRR is also the lowest. At this time, the height of the buildings in the upwind direction and the downwind direction is low, and the air flow passages on both sides of the MCTs are unobstructed, which can effectively prevent the hot air from flowing back to the air-inlet of the MCTs. When the wind direction is E (θ = 90°), the water temperature is the highest, and the HRR is also quite high. The air temperature of the MCT’s edge air-inlet will suffer from the effect of the hot air. The main reason is that due to the taller buildings in the upwind direction, the wind direction is at an angle of about 45° to the length of the buildings. After the air flows around the buildings, a negative pressure zone is formed near the MCTs. When the wind direction occurs in the range of θ = 45°–135° or 225°–360°, the HRR gradually increases and the water temperature rises volatility. In addition, at θ = 0°–45° or 135°–225°, the HRR has a larger decreasing trend, and the water temperature has a similar wave change. From the above analysis, we can see that the height of the buildings and the smooth flow of the airflow around the MCTs are important factors affecting the HRR; among them, the water temperature is affected by the HAR, and HRR has a similar change rule with the water temperature. Hence, these factors will further affect the water temperature of the MCTs. However, the performance of the MCTs is not only affected by the wind directions, but also the wind speeds, which has a great impact on HRR. This phenomenon is discussed later.
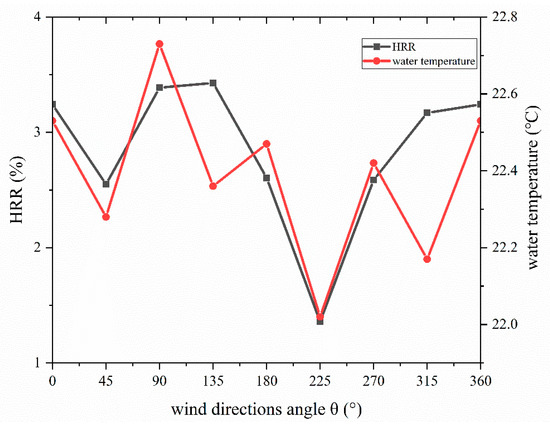
Figure 3.
The related curve showing that the hot air recirculation rate (HRR) and water temperature vary with the wind directions.
3.2. Effect of Wind Speeds
From the above results, it is found that the most unfavorable wind directions occur at θ = 90° (easterly wind); hence, we selected five wind speeds (vE = 2.3, 5, 10, 15, 21 m/s) for the numerical calculation in this wind direction, so as to further understand the effect of the unfavorable wind condition on the HAR. In addition to this, the ambient temperature (Ta) and the inlet water temperature are also 11 °C and 35.62 °C, respectively.
In the absence of ambient wind (vE = 0 m/s), when the air flows through the rain zone, it exchanges heat with hotter water droplets and loses some momentum because of the drag effect. As the air spreads up the rain zone, it becomes hotter, slower, and damp. Consequently, the temperature and humidity of the air at the centerline of the tower are the highest, but the velocity is the lowest [37]. When the ambient wind speed increases, the hot air spots begin to move toward the windward side of the cooling tower [39]. At this time, the temperature and humidity distribution of the air in the cooling tower changed greatly compared to the windless condition, under the influence of ambient wind. This change will eventually affect the cooling performance of the cooling tower, which is reflected in the change of HRR and water temperature. Figure 4a shows the curve of the variation of the HRR with increasing wind speed. It can be easily seen that at a wind speed below 15 m/s, the HRR keeps increasing with the increase of wind speed, and the peak of HRR occurs when the wind speed is 15 m/s. Figure 4b shows the curve of the variation of the water temperature with increasing wind speed. Compared with Figure 4a, these two curves have a similar trend. Generally speaking, as the wind speed increases, the wind vortex range under the MCTs becomes larger, which exacerbates the HAR, so that a large amount of hot exhaust air gets into the air-inlet of the MCTs, resulting in an increase in the HRR and a gradual increase in the water temperature. However, when the wind speed exceeds 15 m/s, the HRR and water temperature will decrease with the increase of wind speed, which is consistent with the research by Moore et al. [17] and Gu et al. [18]. The main reason is that the intensity of mixing between hot exhaust air and ambient wind increases, and the hot exhaust air is diluted by a large amount of ambient air. It leads to a decrease of the air temperature of the air-inlet of the MCTs and a reduction of the water temperature and the HRR of the MCTs.
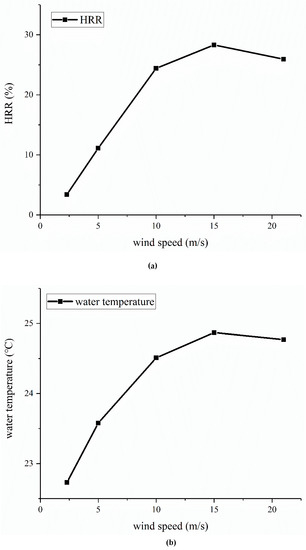
Figure 4.
The variation of the HRR and water temperature with the increase of wind speed. (a) The variation of the HRR with the increase of wind speed. (b) The variation of the water temperature with the increase of wind speed.
3.3. Effect of HAR on Heat Transfer Performance of MCTs
In the above discussions, we understood the impact of wind direction and wind speed on the HAR. Next, we need to analyze the impact of the HAR on the MCTs. For the convenience and accuracy of the study, we selected the unfavorable wind direction of E (θ = 90°) and the typical wind speed of 2.3 m/s to focus on the impact of the HAR on the cooling performance of the MCTs. Figure 5 shows the temperature distribution of the MCTs, from which we can see that the temperature of the hot exhaust air decreases as the emission height increases, and the high temperature zone is inclined to the leeward zone. Figure 6 shows the velocity distribution of MCTs. It can be seen from the figure that the air-inlet of the MCTs generates an eddy current under the influence of ambient wind. This may cause the hot exhaust air to enter the air-inlet of the MCTs again, reducing the cooling performance of the MCTs. From Figure 7, we can clearly see that the hot and humid air at the outlet of the MCTs is partially returned to the air-inlet under the influence of ambient wind. Due to the HAR, the dry bulb temperature and the wet bulb temperature at the air-inlet of the MCTs increase, resulting in an increase in the outlet water temperature, thereby reducing the cooling performance of the MCTs. The influence of the HAR was studied in the literature [9,10], and no more detailed introduction will be made here.
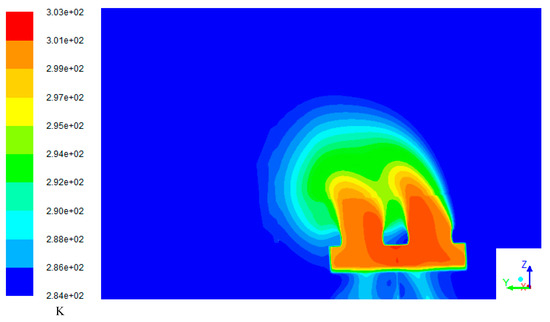
Figure 5.
Temperature distribution of MCTs.
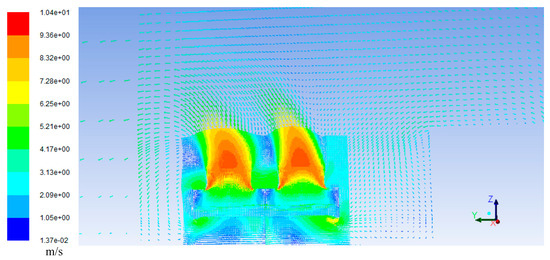
Figure 6.
Velocity distribution of MCTs.
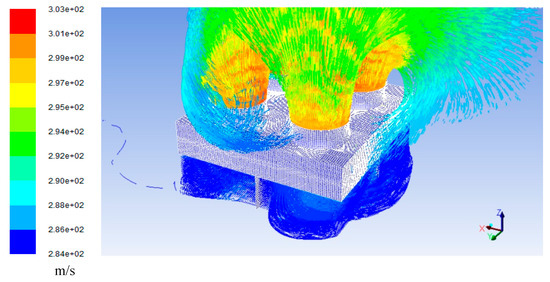
Figure 7.
MCT outlet air streamline diagram.
3.4. Design Correction under the Influence of HAR
In the above results, we studied the influence of ambient wind on the HAR and the impact of the HAR on the MCTs. Due to the HAR, the inlet air enthalpy h1 of the MCTs was usually greater than the ambient air enthalpy ha. In order to calculate the HRR more accurately, we now need to consider the effect of the HAR on the inlet air enthalpy of the MCTs and make a design correction. In Equation (18), we use the air temperature to define the formula for HRR; however, under the influence of the HAR, the air at the air-inlet of the MCTs will inevitably be mixed with some hot exhaust air, which will cause the temperature and enthalpy of the air at the air-inlet of the MCTs to increase. Therefore, the HRR calculated by the formula without considering the influence of the mixed inlet air is inaccurate. Figure 8 shows the air enthalpy at the inlet and outlet of MCTs. From the CTI of the USA, we know that the air around the tower needs to maintain a heat balance; hence, the air enthalpy can be used to represent the HRR, as shown in Equation (19).
where G is mass air flow; h1, h2 and ha denote air enthalpy at the inlet of the MCTs, air enthalpy at the outlet of the MCTs, and ambient air enthalpy, respectively.
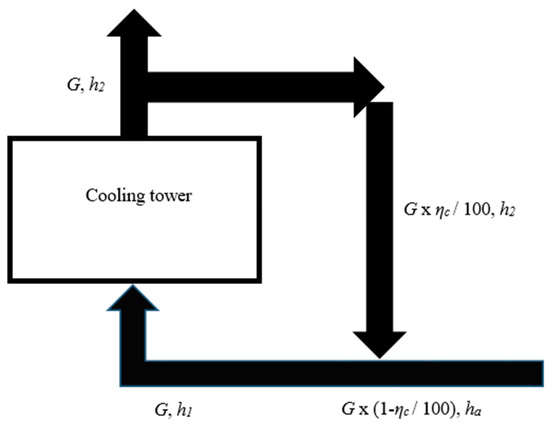
Figure 8.
Schematic diagram of air enthalpy at the inlet and outlet of MCTs.
In the cooling tower, the outlet air enthalpy can be accurately calculated using the inlet air enthalpy value as shown below:
where cw is the specific heat capacity of circulating water; λ, t1, and t2 denote the gas–water ratio, inlet water temperature, and outlet water temperature, respectively. In addition, the change of the parameters cw and λ in the process is not obvious, and they are treated as a constant.
With the simultaneous Equations (19) and (20), we can get the relationship between the corrected value of the inlet air enthalpy (h1) and the HRR (ηc).
It can be seen from the above formulas that the HRR (ηc) directly affects the difference between the inlet air enthalpy (h1) of the tower and the ambient air enthalpy (ha). Therefore, it is convenient to evaluate the cooling performance of the MCTs by using the correction method of calculating the air enthalpy difference (h1 − ha), which can be used to correct the true inlet air enthalpy h’1 and get the corrected HRR. Based on the ambient air enthalpy, ha is constant. Therefore, we use the air enthalpy difference (h1 − ha) to represent the corrected HRR. We revised the six working conditions (C1, C2, C3, C4, C5, and C6) to make the data more convincing, and the results are shown in Table 4. It can be seen from the results that the air enthalpy difference (h1 − ha) is greatly affected by the ambient wind speed, which is similar to the change law of HRR. Therefore, a new cooling tower design guideline is given here, which brings a great convenience.
Table 4.
Corrected value based on numerical calculation results.
3.5. Comparison of Calculation Results with the Calculation Method of Reflux Compensation of the CTI of the USA
The CTI of the USA has done a lot of research on the hot air reflow of cooling towers, and many subsequent studies followed this standard. In the actual operation of the cooling tower, its performance is affected by many factors, and the ambient wind and surrounding buildings have a great impact on the cooling performance of the cooling tower. Therefore, using the formula of CTI to calculate the HRR will produce a certain deviation. Table 4 gives the corrected values of HRR under various working conditions. It is necessary to compare these corrected values with the values calculated from the CTI formula to verify its reliability and applicable conditions. The CTI further deduced Equation (21), estimated the HRR (ηc) based on tower type, and obtained the following correction formula without the HRR (ηc), which can correct the inlet air enthalpy of the tower when HRR (ηc) is unknown.
where gpm, Rc, and L/G denote circulation water flow rate (gallons per minute), cooling range, and liquid-to-gas ratio, respectively.
Because the formula in CTI is a US unit, this paper converts it according to the international cooling tower calculation rules, and converts Equation (22) to the following:
where Q is circulation water flow rate (tons per hour).
The CTI of the USA uses Equation (22) to calculate (h1 − ha), which is a purely numerical calculation, ignoring the environmental conditions of the cooling towers and the impact of HAR on the inlet air condition. Table 5 shows the comparison between the corrected value of (h1 − ha) and HRR with the calculated value of the CTI under various working conditions. In order to eliminate the interference of errors and make the data more convincing, two operating conditions were selected for each group of wind speeds. Figure 9 shows the comparison of the (h1 − ha) corrected value with the calculated value under different working conditions, and it can be seen that under the windless condition, the difference between the inlet air enthalpy of the tower and the ambient air enthalpy (h1 − ha) is basically the same order of magnitude, and the corrected value of (h1 − ha) is slightly higher than the calculated value of (h1 − ha), which is very reasonable. It was proven in many studies that the presence of buildings around the cooling towers will lead to a larger HRR. Therefore, the existence of the buildings will make the calculated value of the CTI formula deviate, but the deviation is not large. The value of the corrected value of (h1 − ha) increases as the wind speed increases, gradually widening the gap from the calculated value of (h1 − ha).
Table 5.
Comparison of (h1 − ha) and HRR corrected values with calculated values under various working conditions.
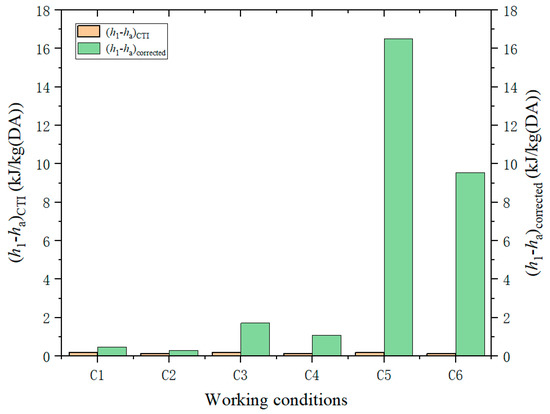
Figure 9.
Comparison of (h1 − ha) corrected value with calculated value under different working conditions.
3.6. Evaluation of the Applicability of the CTI Formula
In order to more directly see the effect of ambient wind speed on the (h1 − ha) calculated by the CTI formula, we introduce the evaluation coefficient, and the calculation formula is as follows.
where ηh is the evaluation coefficient, which is used to evaluate the deviation between the corrected value of (h1 − ha) and the calculated value of (h1 − ha), and the deviation increases with the increase of ηh.
In order to reduce the calculation error, we averaged the two data corresponding to each wind speed to obtain the average ηh. From Figure 10 we can see that ηh increases sharply with the increase of crosswind speed. When the crosswind speed increases from 0 to 15 m/s, ηh changes from 2.42 to 80.18, accordingly. That is, the corrected value of (h1 − ha) is much larger than the calculated value of (h1 − ha) from the CTI formula as the crosswind speed increases. The peak appears when the crosswind speed is 15 m/s and the multiple is 80.18. Therefore, when the crosswind speed is large, using the CTI formula to calculate the HRR will obviously produce a large error, which will have a great impact on the economic evaluation and construction of the power plant. At this time, the CTI formula is not suitable for the calculation of the HRR. From Section 3.5, we know the existence of the buildings also makes the calculated value of the CTI formula deviate; hence, we can conclude that the CTI empirical HRR formula should be corrected when there are large buildings around the MCTs, especially under high-speed ambient crosswind conditions.
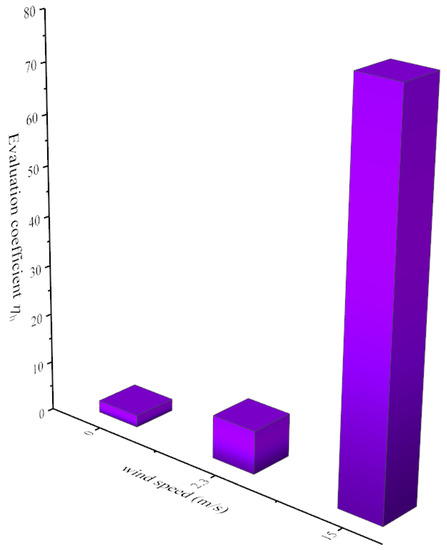
Figure 10.
Relationship between evaluation coefficient and wind speed.
4. Conclusions
The present study using CFD FLUENT numerically investigated the effects of the recirculation of exhaust air on the thermal performance of mechanical drafted cooling towers, where the towers are adjacent to buildings and subjected to wind conditions. The following useful conclusions are obtained, which provides a very valuable reference for the design operation of power plants and basic data for the correction of subsequent formulas.
(1) The HRR and water temperature are strongly affected by crosswind direction. When the wind direction is E (θ = 90°), the water temperature is the highest, and the HRR is also quite high.
(2) In the case of wind direction of 90°, when the wind speed is lower than 15 m/s, the HRR varies in proportion to the wind speeds, and the peak value of HRR appears at 15 m/s. However, when the speed exceeds 15 m/s, a downtrend appears in the HRR.
(3) The temperature of the air dry and wet bulb at the air-inlet of the MCTs is increased by HAR, which leads to an increase in the outlet water temperature and a decrease in the cooling performance of the MCTs.
(4) In the absence of wind, the correction value is slightly higher than the calculated value due to the existence of the buildings. As the wind speed increases, the calculated value from the CTI formula is much lower than the corrected value.
(5) The CTI empirical HRR formula should be corrected when there are large buildings around the MCTs, especially under high-speed ambient crosswind conditions, leaving a data base for the subsequent new HRR calculation formula.
This work contributes to revealing the importance of the wind and surrounding buildings on the performance of the MCTs. A large amount of basic data provides a solid foundation for future related research, and the research would play an important role in the accurate calculation of the cooling performance of the cooling tower.
Author Contributions
Conceptualization, Y.Z.; Funding Acquisition, Y.Z.; Formal Analysis, H.D.; Writing-Original Draft Preparation, H.D.; IValidation, T.C.; nvestigation, S.G.; Project Administration, D.W., and M.L. All authors have read and agreed to the published version of the manuscript.
Funding
The financial supports for this research, from the Key Technology Research and Development Program of Shandong Province (Grant No. 2017GGX40122) and the National Natural Science Foundation of China (Grant No. 51606112), are both gratefully acknowledged.
Conflicts of Interest
In my opinion, there is no conflict of interest in the submission of this manuscript, and all authors agree to publish the manuscript.
Nomenclature
| a | Altitude (m) |
| C1ε, C2ε, C3ε | Turbulence model constant |
| Cμ | Turbulence model constant |
| cp, j | Constant pressure specific heat coefficient of the j component |
| cw | Specific heat capacity of circulating water |
| Resistance of the gas | |
| fn | Pressure-jump polynomial coefficients |
| g | Gravity acceleration |
| gpm | Circulation water flow rate (gallons per minute) |
| G | Mass air flow |
| Gb | Turbulent flow energy caused by buoyancy |
| Gk | Kinetic energy generation term caused by the average velocity gradient |
| h | Air enthalpy |
| h1 | Air enthalpy at the inlet of the cooling tower |
| h2 | Air enthalpy at the outlet of the cooling tower |
| ha | Ambient air enthalpy |
| hj | Air enthalpy of the j component |
| I | Unit vector |
| Jj | Diffusion flux of the j component |
| k | Turbulent kinetic energy per unit mass |
| L/G | Liquid-to-gas ratio |
| Mw, j | Molecular weight of the j component |
| N | Cooling characteristic number |
| ΔP | Pressure drop |
| p | Gas pressure |
| Q | Circulation water flow rate (tons per hour) |
| R | Universal gas constant |
| Rc | Cooling range |
| Sh | Source term of energy |
| Sj | Production rate of the j component |
| T | Ambient temperature |
| t1 | Inlet water temperature |
| t2 | Outlet water temperature |
| Tref | Reference Darwin temperature, 298.15 K |
| Ta | Ambient air temperature |
| To | Average temperature of the cooling towers outlet |
| Ti | Average air temperature of the air-inlet of the cooling towers |
| Velocity vectors of air | |
| V | Local velocity normal to the fan |
| Yj | Quality score of the j component |
| Greek Letters | |
| ρ | Air density |
| λ | Gas–water ratio |
| ε | Turbulence dissipation rate |
| μ | Dynamic viscosity coefficient of air |
| μt | Turbulent viscosity coefficient |
| σ | Prandtl number |
| σk | Turbulence Prandtl number of the k equation |
| σε | Turbulence Prandtl number of the ε equation |
| Stress tensor | |
| Subscripts | |
| i | Inlet |
| a | Ambient |
| o | Outlet |
References
- Stanford, H.W., III. HVAC Water Chillers and Cooling Towers Fundamentals, Application, and Operation, 2nd ed.; CRC Press: Baton Rouge, LA, USA, 2011. [Google Scholar]
- Ndlovu, M.; Majozi, T. Design and Optimisation of Power Plant Utility Systems. In Computer Aided Chemical Engineering; Elsevier: Amsterdam, The Netherlands, 2014. [Google Scholar]
- Bahadori, A. Cooling, Tower and Cooling Water Circuits; Elsevier: Amsterdam, The Netherlands, 2016. [Google Scholar]
- Lee, J.H.; Moshfeghi, M.; Choi, Y.K.; Hur, N. A numerical simulation on recirculation phenomena of the plume generated by obstacles around a row of cooling towers. Appl. Therm. Eng. 2014, 72, 10–19. [Google Scholar] [CrossRef]
- Lu, Y.; Guan, Z.; Gurgenci, H.; Zou, Z. Windbreak walls reverse the negative effect of crosswind in short natural draft dry cooling towers into a performance enhancement. Int. J. Heat Mass Transf. 2013, 63, 162–170. [Google Scholar] [CrossRef]
- Becker, B.R.; Stewart, W.E., Jr.; Walter, T.M.; Becker, C.S. A numerical model of cooling tower plume recirculation. Math. Comput. Model. 1989, 12, 799–819. [Google Scholar] [CrossRef]
- Yang, L.J.; Wang, M.H.; Du, X.Z.; Yang, Y.P. Trapezoidal array of air-cooled condensers to restrain the adverse impacts of ambient winds in a power plant. Appl. Energy 2012, 99, 402–413. [Google Scholar] [CrossRef]
- Du Preez, A.F.; Kröger, D.G. Effect of wind on performance of a dry-cooling tower. Heat Recovery Syst. CHP 1993, 13, 139–146. [Google Scholar] [CrossRef]
- Chahine, A.; Matharan, P.; Wendum, D.; Musson-Genon, L.; Bresson, R.; Carissimo, B. Modeling atmospheric effects on performance and plume dispersal from natural draft wet cooling towers. J. Wind Eng. Ind. Aerodyn. 2015, 136, 151–164. [Google Scholar] [CrossRef]
- Lu, Y.; Guan, Z.; Gurgenci, H.; Hooman, K.; He, S.; Bharathan, D. Experimental study of crosswind effects on the performance of small cylindrical natural draft dry cooling towers. Energy Convers. Manag. 2015, 91, 238–248. [Google Scholar] [CrossRef]
- Xiong, X.; Li, L.; Zhou, X.Q. Numerical Analysis and Optimization Research on Backflow Effect of Cooling Tower. Procedia Eng. 2017, 205, 2003–2010. [Google Scholar] [CrossRef]
- Liu, P.; Duan, H.; Zhao, W. Numerical investigation of hot air recirculation of air-cooled condensers at a large power plant. Appl. Therm. Eng. 2009, 29, 1927–1934. [Google Scholar] [CrossRef]
- Wang, Q.W.; Zhang, D.J.; Zeng, M.; Lin, M.; Tang, L.H. CFD simulation on a thermal power plant with air-cooled heat exchanger system in north China. Eng. Comput. 2008, 25, 342–365. [Google Scholar] [CrossRef]
- Zhai, Z.; Fu, S. Improving cooling efficiency of dry-cooling towers under cross-wind conditions by using wind- break methods. Appl. Therm. Eng. 2006, 26, 1008–1017. [Google Scholar] [CrossRef]
- Ge, G.; Xiao, F.; Wang, S.; Pu, L. Effects of discharge recirculation in cooling towers on energy efficiency and visible plume potential of chilling plants. Appl. Therm. Eng. 2012, 39, 37–44. [Google Scholar] [CrossRef]
- Kröger, D.G. Air-Cooled Heat Exchangers and Cooling Towers; Pennwell Corp: Tulsa, Oklahoma, 2004. [Google Scholar]
- Du Preez, A.F.; Kröger, D.G. The effect of the heat exchanger arrangement and wind-break walls on the performance of natural draft dry-cooling towers subjected to cross-winds. J. Wind Eng. Ind. Aerodyn. 1995, 58, 293–303. [Google Scholar] [CrossRef]
- Ghani, S.; Gamaledin, S.M.A.; Bakochristou, F.; El-Bialy, E.; Mohamed, M.M.; Elsawi, R.M.E.H. Numerical and wind tunnel investigation of Hot Air Recirculation across Liquefied Natural Gas Air Cooled Heat Exchangers. J. Wind Eng. Ind. Aerodyn. 2018, 172, 409–422. [Google Scholar] [CrossRef]
- Zhou, Y.; Shi, H.; Cheng, Y.; Luo, K. Study on Influence of Ambient Air Upon Heat Transfer Characteristics of a New Air Cooling Unit. Turbine Technol. 2019, 61, 123–126. [Google Scholar]
- Moore, R.D.; Wheeler, D.E.; Wilber, K.R.; Johnson, A.E. An evaluation of schemes for the prediction of recirculation on crossflow rectangular mechanical draft cooling towers. In Proceedings of the Cooling Tower Institute Annual Meeting, New Orleans, Louisiana, 28–30 January 1979; pp. 22–24. [Google Scholar]
- Gu, Z.; Chen, X.; Lubitz, W.; Li, Y.; Luo, W. Wind tunnel simulation of exhaust recirculation in an air-cooling system at a large power plant. Int. J. Therm. Sci. 2007, 46, 308–317. [Google Scholar] [CrossRef]
- Zhao, Y.; Sun, F.; Li, Y.; Long, G.; Yang, Z. Numerical study on the cooling performance of natural draft dry cooling tower with vertical delta radiators under constant heat load. Appl. Energy 2015, 149, 225–237. [Google Scholar] [CrossRef]
- Al-Waked, R.; Behnia, M. The performance of natural draft dry cooling towers under crosswind: CFD study. Int. J. Energy Res. 2004, 28, 147–161. [Google Scholar] [CrossRef]
- Al-Waked, R.; Behnia, M. The effect of windbreak walls on the thermal performance of natural draft dry cooling towers. Heat Transf. Eng. 2005, 26, 50–62. [Google Scholar] [CrossRef]
- Bender, T.; Bergstrom, D.; Rezkallah, K. A study on the effects of wind on the air intake flow rate of a cooling tower: Part 2. Wind wall study. J. Wind Eng. Ind. Aerodyn. 1996, 64, 61–72. [Google Scholar] [CrossRef]
- Fan, J.; Dong, H.; Xu, X.; Teng, D.; Yan, B.; Zhao, Y. Numerical Investigation on the Influence of Mechanical Draft Wet-Cooling Towers on the Cooling Performance of Air-Cooled Condenser with Complex Building Environment. Energies 2019, 12, 4560. [Google Scholar] [CrossRef]
- Al-Waked, R. Crosswinds effect on the performance of natural draft wet cooling towers. Int. J. Therm. Sci. 2010, 49, 218–224. [Google Scholar] [CrossRef]
- GBJ102-87, Code for Design of Cooling for Industrial Recirculating Water; China Planning Press: Beijing China, 1 January 1988.
- Zhang, L. Calculation of Wet Air Backflow Disturbance in Arranging Cooling Towers; Industrial Water and Wastewater: Anhui, China, 2002. (In Chinese) [Google Scholar]
- Dandan, L.; Zhenyan, L.; Xiaoni, Q. Design program of cooling tower with the influence of circumfluence. Ind. Water Treat. 2006, 5, 20. (In Chinese) [Google Scholar]
- Patankar, S.V. Numerical Heat Transfer and Fluid Flow; CRC Press: Boca Raton, FL, USA, 1980. [Google Scholar]
- Jones, W.P.; Launder, B.E. The prediction of laminarization with two-equation model of turbulence. Int. J. Heat Mass Transf. 1972, 15, 301–314. [Google Scholar] [CrossRef]
- Kloppers, J.C.; Kröger, D.G. A critical investigation into the heat and mass transfer analysis of counterflow wet-cooling towers. Int. J. Heat Mass Transf. 2005, 48, 765–777. [Google Scholar] [CrossRef]
- Kloppers, J.C.; Kröger, D.G. Loss coefficient correlation for wet-cooling tower fills. Appl. Therm. Eng. 2003, 23, 2201–2211. [Google Scholar] [CrossRef]
- ASHRAE. Cooling towers. In The 4th HVAC System and Equipment of ASHRAE Handbook; IIR: Paris, France, 2000. [Google Scholar]
- China National Development and Reform Commission. DL/T933-2005, Test Methods for Determining the Performance of Cooling Tower of Transfer Packing, Drift Eliminator and Sprayer; Power Station Steam Turbine Standardization Technology Committee of the People’s Republic of China: Beijing, China, 2005. [Google Scholar]
- FLUENT Incorporated. FLUENT User’s Guide v6.1; Fluent Inc: New Hampshire, Lebanon, February 2003. [Google Scholar]
- Zhao, Z. Cooling Tower; Chinese Water and Electricity Press: Beijing, China, 1994. (In Chinese) [Google Scholar]
- Al-Waked, R.; Behnia, M. CFD simulation of wet cooling towers. Appl. Therm. Eng. 2006, 26, 382–395. [Google Scholar] [CrossRef]


© 2020 by the authors. Licensee MDPI, Basel, Switzerland. This article is an open access article distributed under the terms and conditions of the Creative Commons Attribution (CC BY) license (http://creativecommons.org/licenses/by/4.0/).