Next Article in Journal
Geometry Optimization of Top Metallic Contacts in a Solar Cell Using the Constructal Design Method
Previous Article in Journal
Internet of Things (IoT) Platform for Multi-Topic Messaging
 
 
Correction published on 17 November 2023, see Energies 2023, 16(22), 7626.
Article

A Drone Based Transmission Line Components Inspection System with Deep Learning Technique

1
Department of Computer Science & Engineering, Sogang University, 35 Baekbeom-ro, Mapo-gu, Seoul 04107, Korea
2
Department of Electronic Engineering, NED University of Engineering & Technology, Karachi-75270, Pakistan
*
Author to whom correspondence should be addressed.
Energies 2020, 13(13), 3348; https://doi.org/10.3390/en13133348
Submission received: 12 June 2020 / Revised: 26 June 2020 / Accepted: 28 June 2020 / Published: 30 June 2020 / Corrected: 17 November 2023
(This article belongs to the Section F: Electrical Engineering)

Abstract

:
Defects in high voltage transmission line components such as cracked insulators, broken wires rope, and corroded power line joints, are very common due to continuous exposure of these components to harsh environmental conditions. Consequently, they pose a great threat to humans and the environment. This paper presents a real-time aerial power line inspection system that aims to detect power line components such as insulators (polymer and porcelain), splitters, damper-weights, and power lines, and then analyze these transmission line components for potential defects. The proposed system employs a deep learning-based framework using Jetson TX2 embedded platform for the real-time detection and localization of these components from a live video captured by remotely controlled drone. The detected components are then analyzed using novel defect detection algorithms, presented in this paper. Results show that the proposed detection and localization system is robust against highly cluttered environment, while the proposed defect analyzer outperforms similar researches in terms of defect detection precision and recall. With the help of the proposed automatic defect analyzing system, manual inspection time can be reduced.

Graphical Abstract

1. Introduction

The basic components of the electricity transmission system or grids include transmission power line, transmission towers, insulators, balisor beacon, sag adjusters, etc., play an important role in the safe transmission of electricity between a grid station and a local distribution station [1]. These components bear extreme weather conditions (direct exposure to sunlight all day, strong winds, snow, rain, etc.), high mechanical tension, and extreme temperature due to high voltage, and thus, are prone to physical defects [2]. Due to the high uncertainty in the duration of life of these components, these electrical components are subject to periodic inspection throughout the year. Conventional inspection methods include a manual visual inspection by a trained electric repairman who climbs the transmission tower and visually looks for defects or inspects the electrical health of the components using probing methods, which is not only time-consuming, expensive, and labor-intensive but also life-threatening [3]. According to the Occupational Safety and Health Organization (OSHA), 576 fatalities and accidents related to electric repairmen were reported between May 2016 and April 2017, only in North America [4]. To avoid such incidents, electrical companies are now incorporating patrolling helicopters for inspection and repairing operations of these electrical components in remote areas and ground vehicles in urban areas to take high-resolution pictures or videos of the power lines, transmission towers, and insulators, and then analyze them for their potential defects [5].
Recently, thanks to the exciting progress in the field of image processing and computer vision techniques, there has been a lot of development for automatically detecting power line components such as power lines [6,7,8,9], electric poles [10,11,12], and insulators [13,14,15,16], and analyzing their defects [1,17] using aerial or ground images. Most of these schemes process recorded videos offline by extracting hand-crafted features and then using sliding window-based techniques.
The related studies on electrical component detection can be classified into three categories, depending upon the modalities of feature description and localization schemes:

1.1. Handcrafted Feature-Based Detection (Do not Include Any Learning)

A simple and preliminary method that is only limited to detect tempered glass insulators was proposed by [16]. The method involves binarizing the image with a set threshold and then applying morphological operations, but this method does not address varying lighting conditions. Some other simple methods limited to detect glass insulators only are presented in [13,14]. These methods suggested the use of color features for insulator detection. Other than the transmission line insulators, a recent study [18] proposed a deformable part model (DPM) for detecting rod-insulators in high-speed railway catenary systems. The image acquisition system for this method is mounted on the top of the inspection vehicle, which takes close-shot images of the insulators from a fixed distance. The image acquisition system is also equipped with light illuminators, which really help in pre-processing of the insulator images. Although this method shows good recall (above 98%), it suffers low precision (approximately three false positives per image). Li et al. [2] proposed to use local and global saliency maps [19] for separating the insulator region from a non-insulator region. Yu et al. [20] presented an insulator segmentation method that evolves a curve iteratively using texture and shape priors. However, these methods [2,19,20] only work when the texture and intensity of the background and the foreground regions are distinctive. This condition normally occurs only when aerial images of insulators are taken from closer proximity.
Edge-based feature extractor was proposed in [15] to detect porcelain insulators from images taken from unmanned aerial vehicles (UAV). However, [15] did not present sufficient experimental results to support the robustness of their proposed methods against cluttered backgrounds.
In order to localize multiple insulators jointly, Zhao et al. [21] proposed a Markov Random Field (MRF) model by grouping the appearance similarities of the glass and porcelain insulators. Although the proposed method is robust against the complex background, its effectiveness is guaranteed only when a group of insulators appear together in the image, which limits the application of this method.
In situations where sufficient training data is not available, these methods can provide a basic level of component detection. However, these methods are very prone to failure in case of slight variations in illumination and view point, which are inevitable in outdoor environments.

1.2. Handcrafted Feature-Based Detection (Include Learning)

Liao and An [22] proposed a new multiscale and multi-feature (MSMF) descriptor to detect polymer insulators from aerial images, by matching them with saved features in visual vocabulary. In [23], Haar-like rectangular features and AdaBoost were used for insulator detection. However, a 3D graphics software was used to generate positive samples of insulators to train the Adaboost classifier, instead of using real insulator images which reduce the robustness of the system. Zuo et al. [24] also proposed Haar features and cascade of classifiers to detect glass insulators from aerial images and then segment the insulator using color features. The basic problem with using Haar features in insulator detection is that Haar features cannot handle large rotation and view-point changes.
Li et al. [25] trained Support Vector Machines (SVM) classifiers using vertical profile projection curve features to detect insulators in a sliding window fashion. Wang et al. [26] used Gabor features to train binary SVM classifiers to detect insulators. To avoid the sliding-window-based approach, [26] proposed to binarize the input image and apply SVM classifier to the areas where the possibility of having an insulator is high, followed by morphological operations to segment the insulator. Both of the shape features in [25,26] rely upon the repeating pattern on the insulator, which is well observed only when the insulator images are taken at a near frontal viewpoint, hence making these methods vulnerable to viewpoint changes. Jabid and Uddin [27] trained SVM classifiers using a local directional pattern (LDP) to detect insulators in images taken from streets.
These sliding window-based component detection methods lack generalizability and suffer from low detection speeds, because these methods scale and rotate the input image to multiple sizes and multiple orientations in order to address the size and rotation variations.
Oberweger et al. [28] presented a novel approach to detect insulators in aerial images, based on discriminative training of local gradient-based descriptors and a subsequent voting scheme. They also addressed the flashover and splits defect detection in polymer insulators. Their method computes a dissimilarity score between a faulty cap and the rest of the caps in the same insulator by using the distance of a descriptor to the k-nearest neighbors as an estimate for local descriptor density, considering that the outlier (i.e., faulty cap) has a lower local density in high dimensional space. However, the supposition becomes invalid if the fault is present in multiple caps of an insulator.

1.3. Convolutional Neural Network-Based (CNN) Detection

Due to the enormous variations of the appearances of insulators caused by scale, viewpoint, color, and occlusion, developing an effective transmission line component inspection system becomes a challenging problem [21]. Cluttered backgrounds also increase the complexity of the manifold nature of the problem and often increase the computational cost. Besides, the viewpoint, arbitrary in and out-of-plane rotation makes the detection problem highly challenging. A large number of existing insulator detection methods address just a subset of the variations without having the capacity of dealing with every one of them. In contrast, CNN-based object detectors such as YOLO (You Only Look Once) [29], Faster-RCNN (Region-based Convolution Neural Network) [30] and SSD (Single Shot Detector) [31] have not only shown high detection accuracies on unconstrained object detection datasets but also shown their robustness by effectively solving more general computer vision tasks such as scene recognition, object attribute detection, with minimal architectural changes [32]. This is one of the major motivations of using CNN for the detection of transmission line components in our work. Given the power of CNN features, this research aims to automatically aggregate the best set of numerous low-level features for various types of components in the CNN training routine. Some of the recent studies has also used CNN-based frameworks [5,33] and shown improved performances. Moreover, recent advances in deep learning algorithms and graphic processing hardware (GPUs) have paved ways to develop robust image processing algorithms on embedded platforms, enabling real-time processing.

Convolutional Neural Network (CNN)

Convolutional neural networks are a class of deep, feed-forward (not recurrent), special type of artificial neural networks popular in the field of image processing for their robustness [32]. In contrast to the simple neural networks or multilayer perceptron (MLP), where the output of a neuron is decided by the scalar product operation between the weights of the connections and the outputs of the previous neurons, convolutional neural networks employs convolutional layers followed by an activation function to decide the output of the neurons. Unlike MLPs, the CNNs also add pooling layers to successively reduce the feature dimensions and to reduce the number of parameters in the network. Due to the fully-connected layers at the input of MLPs, they are not translation invariant, and hence not ideal to be used in image processing. CNNs, however, employs variant-sized sliding filters that are updated during the training process to add translation and scale invariance properties, making them ideal choice for image processing. Variants of CNNs also use fully-connected layers at the final stage of the network in order to aggregate the information generated from the final convolutional features and to generate final classification.
The task of object detection from images involves predicting the location and the category label or class name of the object in the image. The location of the object is usually represented by a bounding box (using the coordinates of the corners of the bounding box). In order to train the CNN-based object detectors, the images are passed as input to the network. During the training process, the network predicts the location and class name of the objects in each image, which is compared with the ground truth bounding box annotations for that image using a loss function. The output of the loss function is back-propagated to the network which in turn updates the weights of the convolutional filters to predict better results. The training is stopped when the output of the loss function becomes very small or saturated.
For power line detection, most of the related work uses edge detection followed by post-processing and then the Hough line algorithm to detect lines in the edge map. Alka et al. [34] presented a scheme that shows the superiority of using the Canny filter over the Gabor filter for power line detection. In another study [7], an edge drawing algorithm (EDLines) is proposed to draw lines using a gradient map. The algorithm extracts line segments by connecting local maxima with other responses after sliding a 3 × 3 kernel. Liu et al. [8] proposed a power line detection algorithm for guiding unmanned aerial vehicle (UAV). The method applies a steerable filter to the input image and then uses connected component analysis to connect the ridge points. Finally, collinear line segments are linked to form a long line by using the line fitting algorithm. The images are taken from right above the power lines, by flying the UAV 20 to 60 m exactly above the power lines, hence the power lines appear parallel to each other. However, flying the UAV exactly above the power lines is not recommended due to safety reasons. Again, these methods report the accuracies on a very small dataset, i.e., eight images [34], 29 images [7], six images [8], which do not guarantee the robustness of the algorithm. While general line detection methods like Hough and Line Segment Detector (LSD) [35], when applied to power line detection [8] result in many false positives due to manual parameter selection. A method to alert pilots to avoid hitting into power line is proposed in [36], however, the method only detects the presence or absence of the power line in a given frame of the video using a trained SVM classifier.
With the rapidly expanding scale of power grids, conventional methods of manual inspection using electro-magnetic field meters are far from satisfying the growing demand, because of the vulnerability to bad weather conditions, high prices, and low accessibility [37,38,39]. Even though there are a number of proposed systems for automatic insulator detection from aerial images taken using patrolling helicopters and power line robots [40,41], the high price, low stability, and less robust algorithms make them less viable.
Hence, this paper proposes a complete real-time transmission line components inspection framework that can detect power lines and various kinds of electrical components including insulators, splitters, connectors, etc. from live video, taken from a drone quad-copter, and can be subsequently examined for potential defects. In order to assist the camera system to detect transmission line components in live video, a CNN-based transmission line components detector is trained and embedded on an NVIDIA Jetson TX2 board (NVIDIA Corporation, Santa Clara, CA, USA). To the best of authors’ knowledge, there has been no study where CNN is ported to GPU-equipped embedded platform to detect and classify different types of power line components from a live video. In addition, the embedded platform also detects the power line using proposed power line detection algorithm. The proposed transmission line components detection and defect analysis system is highly robust against the cluttered background, occlusion, arbitrary orientations, diverse lighting conditions, and viewpoint changes.
The main contributions of this study are:
  • Unlike earlier studies that use handcraft features, this study explores the robustness of the CNN features and uses them for the task of multi-type HV transmission line components detection in a highly cluttered environment.
  • Successful implementation of an embedded system for real-time processing of drone videos with CNN-based transmission line components detection framework. Unlike previous CNN-based transmission line component detection frameworks where the CNN-based detector is just focused to detect one type of insulator and GPU resources are left unused, this article successfully demonstrated the feasibility of using real-time transmission line component detector that is trained to detect nine different transmission line components with above 90% recall. Moreover, the CNN-based detector is optimized to fully utilize the GPU resources and exhibit real-time processing capabilities.
  • A light-weight and robust power line detection algorithm is also proposed in this paper.
  • A novel defect analysis method is proposed that can detect multiple defects in transmission line components, such as broken sheds in insulators, balisor fading, broken wires, rust in sag adjustors, splits in insulator, etc. Other than broken shed defects, these transmission line component defect analyzing methods have never been covered in previous studies.
  • A complete transmission line component inspection system is presented and its robustness and real-time performance are evaluated.
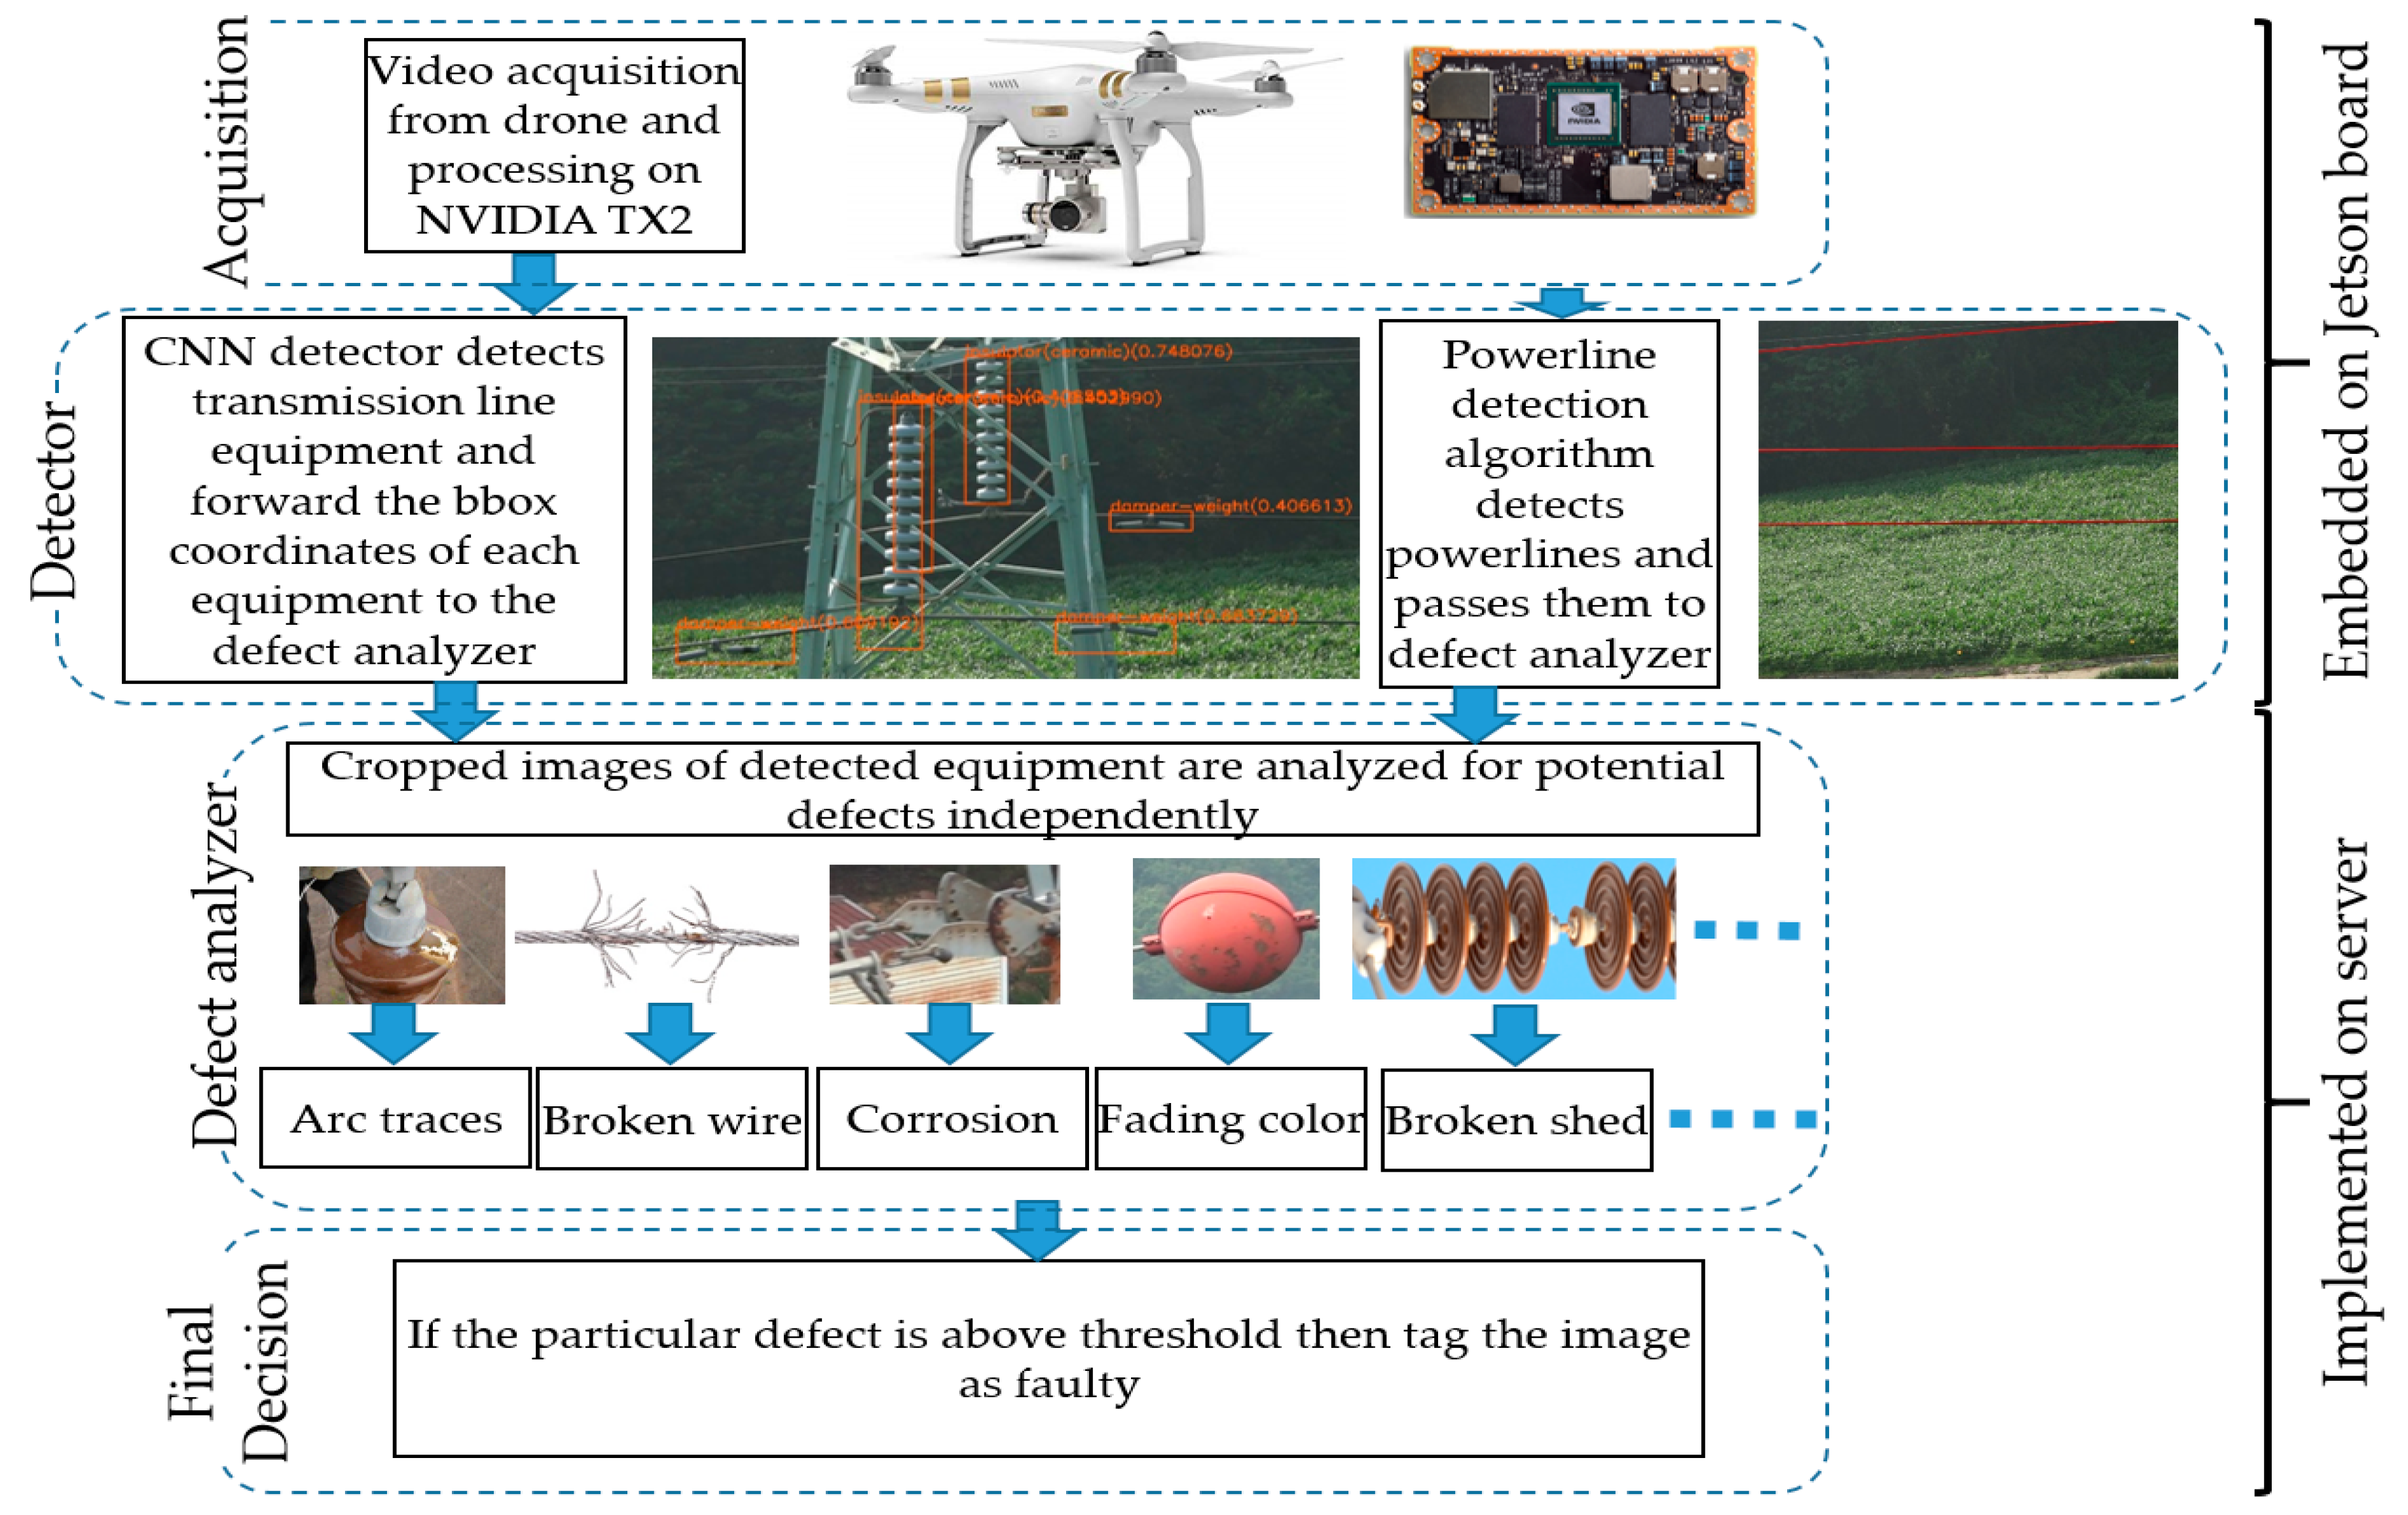
The rest of this paper is organized as follows. In Section 2, a detailed overview of the proposed system is provided. In Section 3, the CNN-based electrical components detection mechanism and the experimental setups used to train those detectors are discussed. The proposed power line detection algorithm, and the explanation of novel algorithms to detect the different types of transmission line components defects are also presented in Section 3. With the comparison to the state-of-the-art, the experimental results and performance analysis of the complete transmission line components detection and defect analysis system is provided in Section 4. Finally, this study is concluded with future directions.

2. Proposed System

This section presents a detailed overview of the proposed system. Figure 1 gives a brief introduction to familiarize the reader with the visual properties (i.e., shape, color, etc.) of the transmission line components discussed in this paper. The actual functionality of these components is beyond the scope of this paper. As shown in Figure 1, the proposed system can detect nine different types of transmission line components, having different colors, sizes, and shapes. It is worth mentioning that the proposed system is scalable (can detect more types of electrical components) and requires minor modifications in training and detecting routines.
The overall system diagram of the proposed transmission line components inspection system is shown in Figure 2. Based on the implementation details, the inspection system is partitioned into two modules: (i) detection module and (ii) defect analysis module. The capturing and detection module is embedded on the Jetson TX2 board (does real-time processing), while the defect analysis module is implemented on the server machine (for offline processing).
Video acquisition is the first step of the overall inspection process which involves capturing the video of transmission line components using a camera mounted on a drone. The videos captured and analyzed in this paper are taken in the rural areas of the Gyeonggi-do province of South Korea. These areas are full of mountains, forests, and fields, making it difficult for any ground vehicle to cover the area. A drone has the benefit of flying to the top of transmission towers, which are normally higher than trees, hence avoiding any obstacles. Next, in the detector stage, the frames of the video are processed by a real-time CNN-based rotation invariant transmission line components detector embedded on the Jetson TX2 board which is mounted on the drone. Jetson TX2 is a fast and power-efficient (7.5-watt) embedded AI computing device, equipped with 8GB RAM, a dual-core 64-bit CPU, a quad-core ARM processor and a 256-core NVIDIA Pascal GPU. The detected components are passed to the defect analyzer that inspects each type of defect independently. Once a particular defect is detected at the defect analysis stage, the defect analyzer returns the probability of having that defect which is then compared with a predefined threshold value to decide the severity of the defect.
In addition to the transmission line components detected by the proposed CNN-based detection framework, the electrical power line is detected using a novel algorithm, which is presented in Section 2.2. In contrast to [8], the drone is flown 10~20 m away from the power line, which also prevents any possible damage to power line in case of sudden failure. In summary, the proposed system detects ten transmission line components and analyzes their defects. In the later sections, detailed explanations of those steps shown in Figure 2 are given.

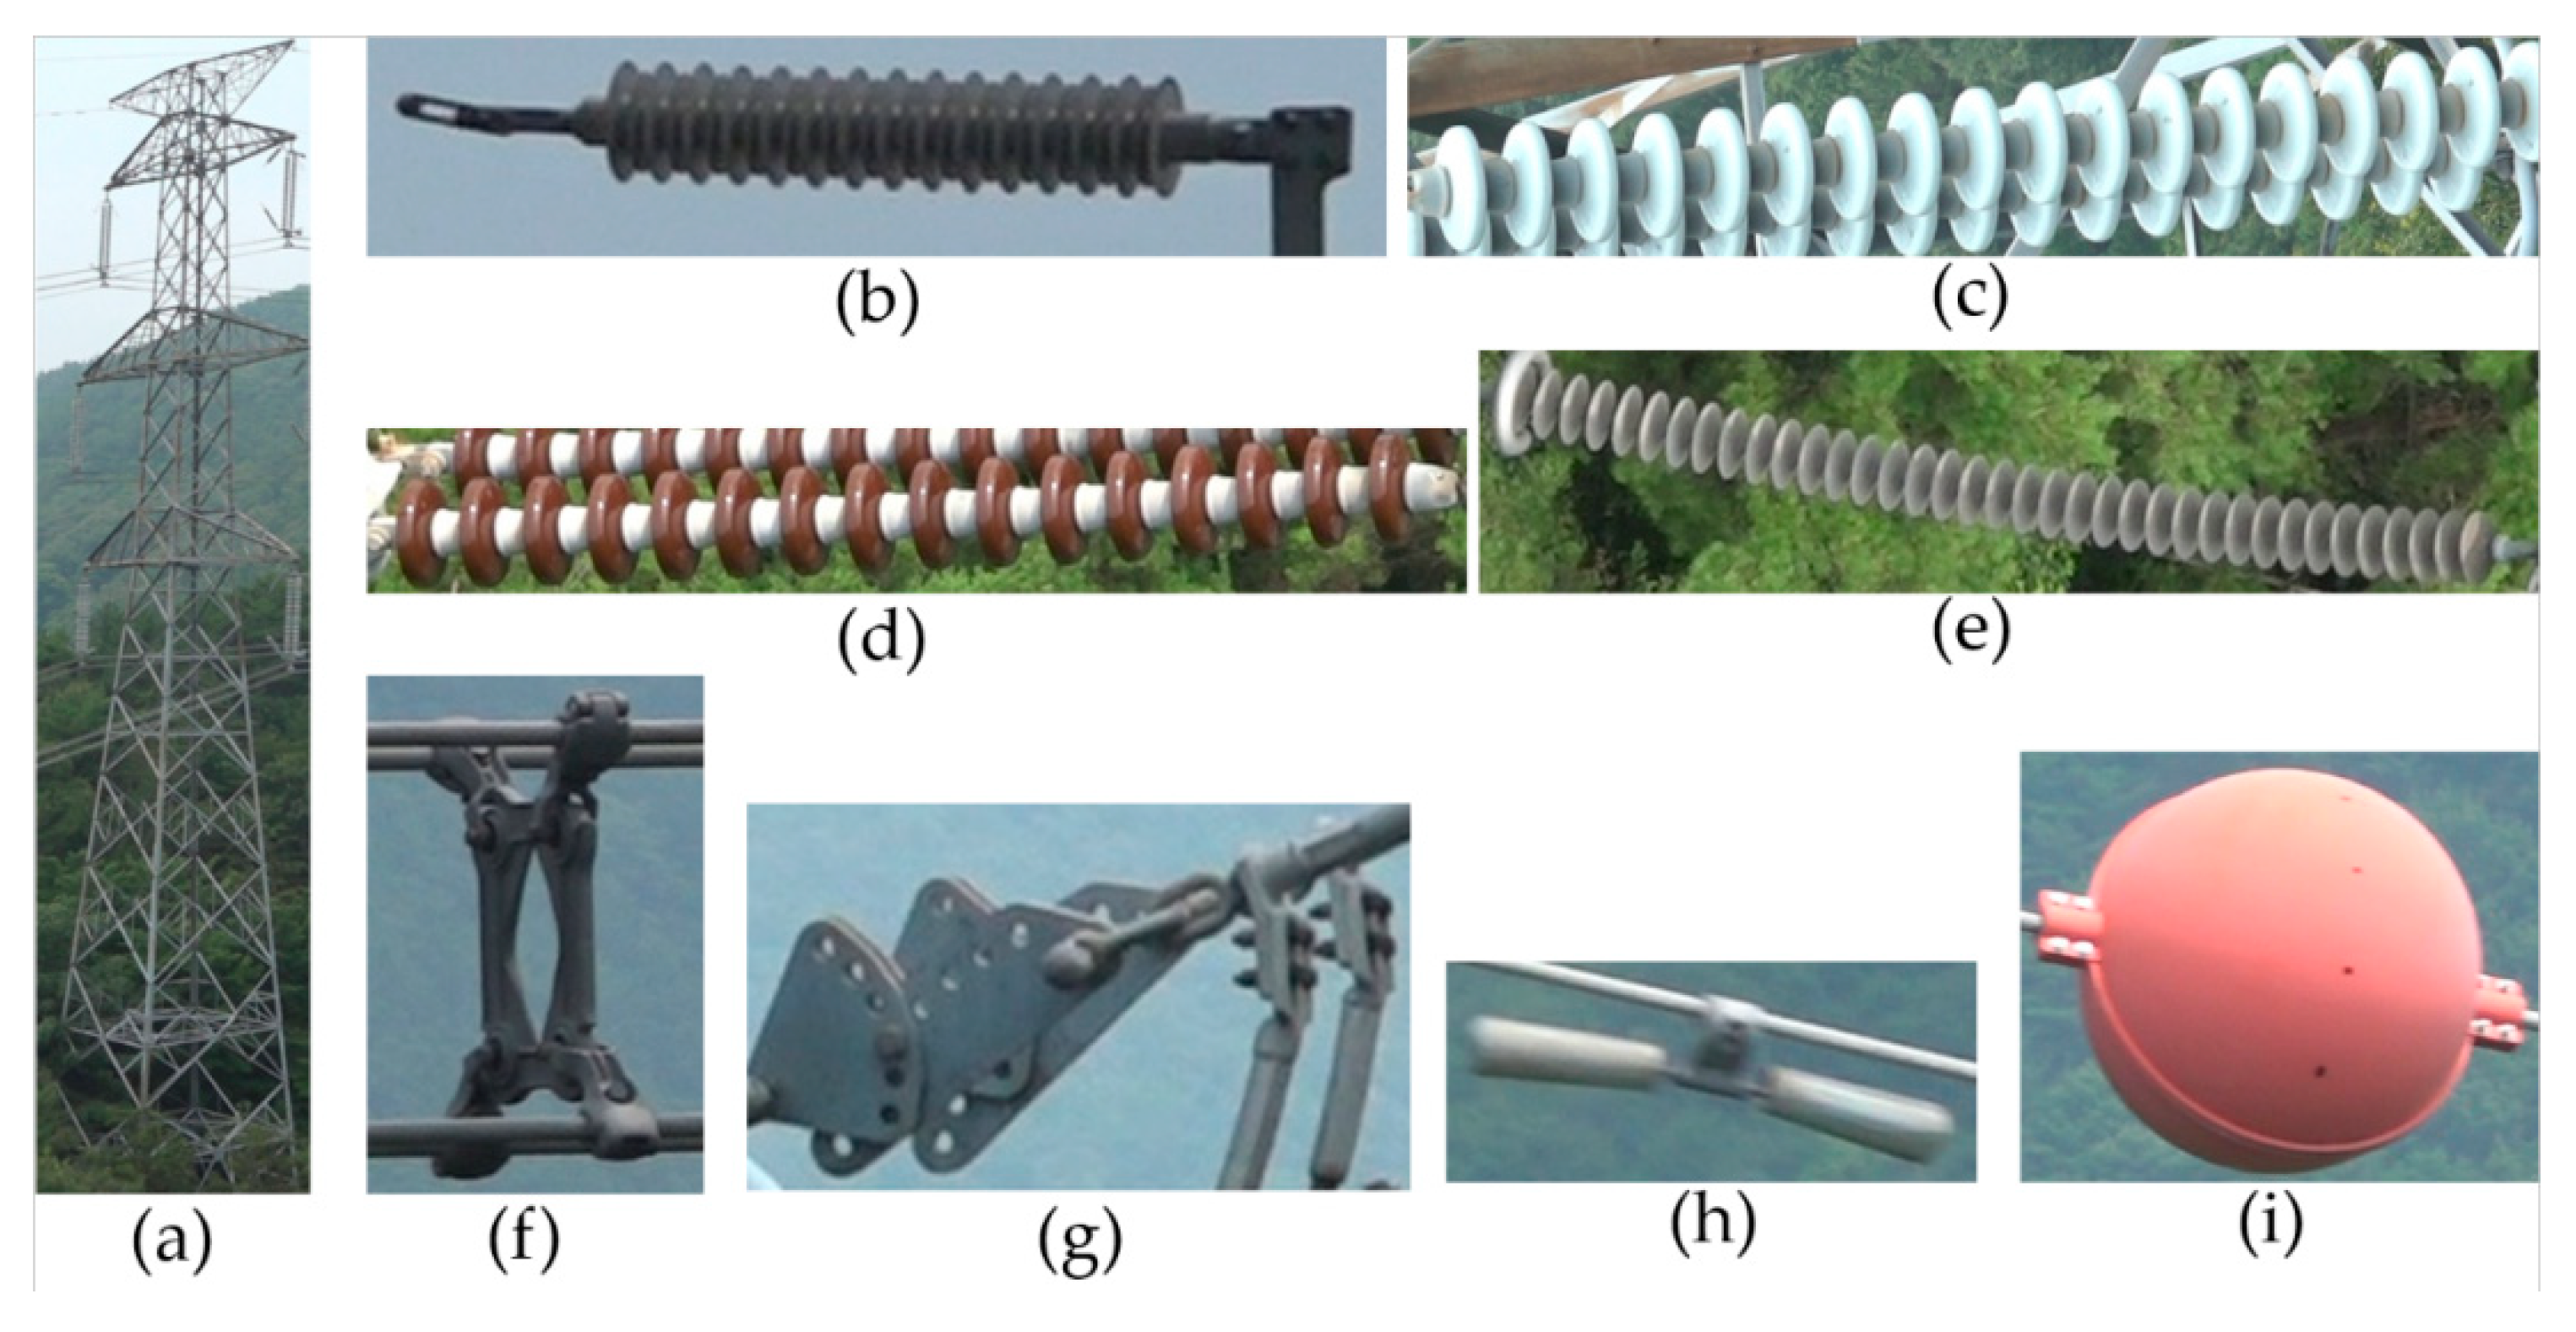
2.1. CNN Based Robust Transmission Line Components Detector

Handcraft features, such as Histogram of Oriented Gradient (HOG) and Scale Invariant Feature Transform (SIFT) descriptors produced large performance gains a decade ago. However, due to diversity of appearance, illumination conditions, and background, it is difficult to manually design a robust feature descriptor to perfectly describe all kinds of objects. Currently, deep convolutional features are providing a better breakthrough in object detection, classification, etc. With several experiments using off-the-shelf-CNN (originally trained for ImageNet) and trained SVM classifiers, Razavian et al. [32] showed that CNN features proved to be a strong competitor to the most sophisticated and highly tuned state-of-the-art image classification and recognition methods. Therefore, in contrast with the handcraft features used in the previous studies, the proposed system uses CNN for the difficult task of detecting different types of transmission line components from highly cluttered videos. Training CNN for detection requires a large dataset of annotated transmission line image data which is one of the reasons why CNN was not used in previous related studies. However, in this work, a large and diverse set of aerial videos of the transmission line system is acquired and annotated to train the CNN-based transmission line components detector.
Deep learning-based object detection frameworks usually contain a region proposal network (RPN) [30] in order to detect objects in all possible locations within an image, avoiding the classical sliding window-based approach. Still, the RPN-based object detection is computationally expensive, and hence their implementation on embedded systems does not meet the speed requirements. Darknet’s open-source neural network framework and object detection system, YOLO version 3 [42] is used in the research, which is the state-of-the-art, real-time object detection method. The high detection speed of YOLO reaches 30 frames per second on NVIDIA Titan X GPU (NVIDIA Corporation, Santa Clara, CA, USA), which makes it a suitable candidate to develop real-time applications. The high detection speed comes from the fact that YOLO divides the whole image into fixed-sized regions and predicts bounding boxes and confidence scores for each region, rather than generating the region proposals first and then applying the detection network to those regions separately [29].
The CNN-based transmission line components detector presented in this paper is trained to detect nine different types of transmission line components, i.e., transmission towers, LA, porcelain suspension type insulators (with red caps (PorSTI-R), and with white caps (PorSTI-W)), polymer suspension type insulators (PolSTI), power line spacers, balisors, vibration dampers, and sag adjusters. The original Darknet-53 network of YOLO V3 scales the object to three different levels during the training and testing time, and the applies a 1 × 1 filter to detect the object in three different scales, which, although improve the overall detection accuracy, but also increases the detection time. On the NVIDIA Jetson TX2 board, this results in a detection rate of 3 fps. In the inspection videos of transmission line components, it is observed that whenever the drone moves toward the transmission towers, components are detected at multiple scales. But detecting the same components at multiple scales in consecutive frames of the inspection video is a redundant operation. Therefore the scaling layers of the Darknet-53 network are removed.
The proposed CNN-based framework divides the input video frame into fixed-sized S × S regions, and from each region, it predicts 11 bounding boxes using 11 anchor boxes. To generate good anchor box priors, the ground-truth bounding box sizes are clustered into 11 groups using K-means clustering [42]. The decision to cluster the size priors into 11 groups is based upon the aspect ratios in which these transmission line components can appear. Figure 1b–e shows similar aspect ratios while Figure 1a shows an entirely different aspect ratio.
As both the PorSTI-R and PorSTI-W suffer from the same defects, they need not be differentiated at the detection step. Hence, the CNN-based transmission line component detector is trained with eight classes combining PorSTI-R and PorSTI-W into one class. The detector is taught with a faster learning rate for the first half of the network training process so that the network can quickly learn to distinguish between different types of components. In the next stage, the learning rate is slowed by a factor of 10 after every 1000 iterations for the remainder of the training process, which allows the network to slowly learn the details of the shape, color, and context of each component. Figure 3 shows example detection results of the trained network.
As shown in Figure 3, the CNN-based rotation invariant multi-type transmission line components detector is robust against various viewing angles, scales, aspect ratios, partial occlusions, lighting variations, and cluttered environments.
The CNN-based transmission line components detector returns a confidence score [ 0 ,   1 ] (indicated with brackets in Figure 3) along with the bounding box coordinates of the detected components. Detection results with a low confidence score are rejected by applying a detection threshold.

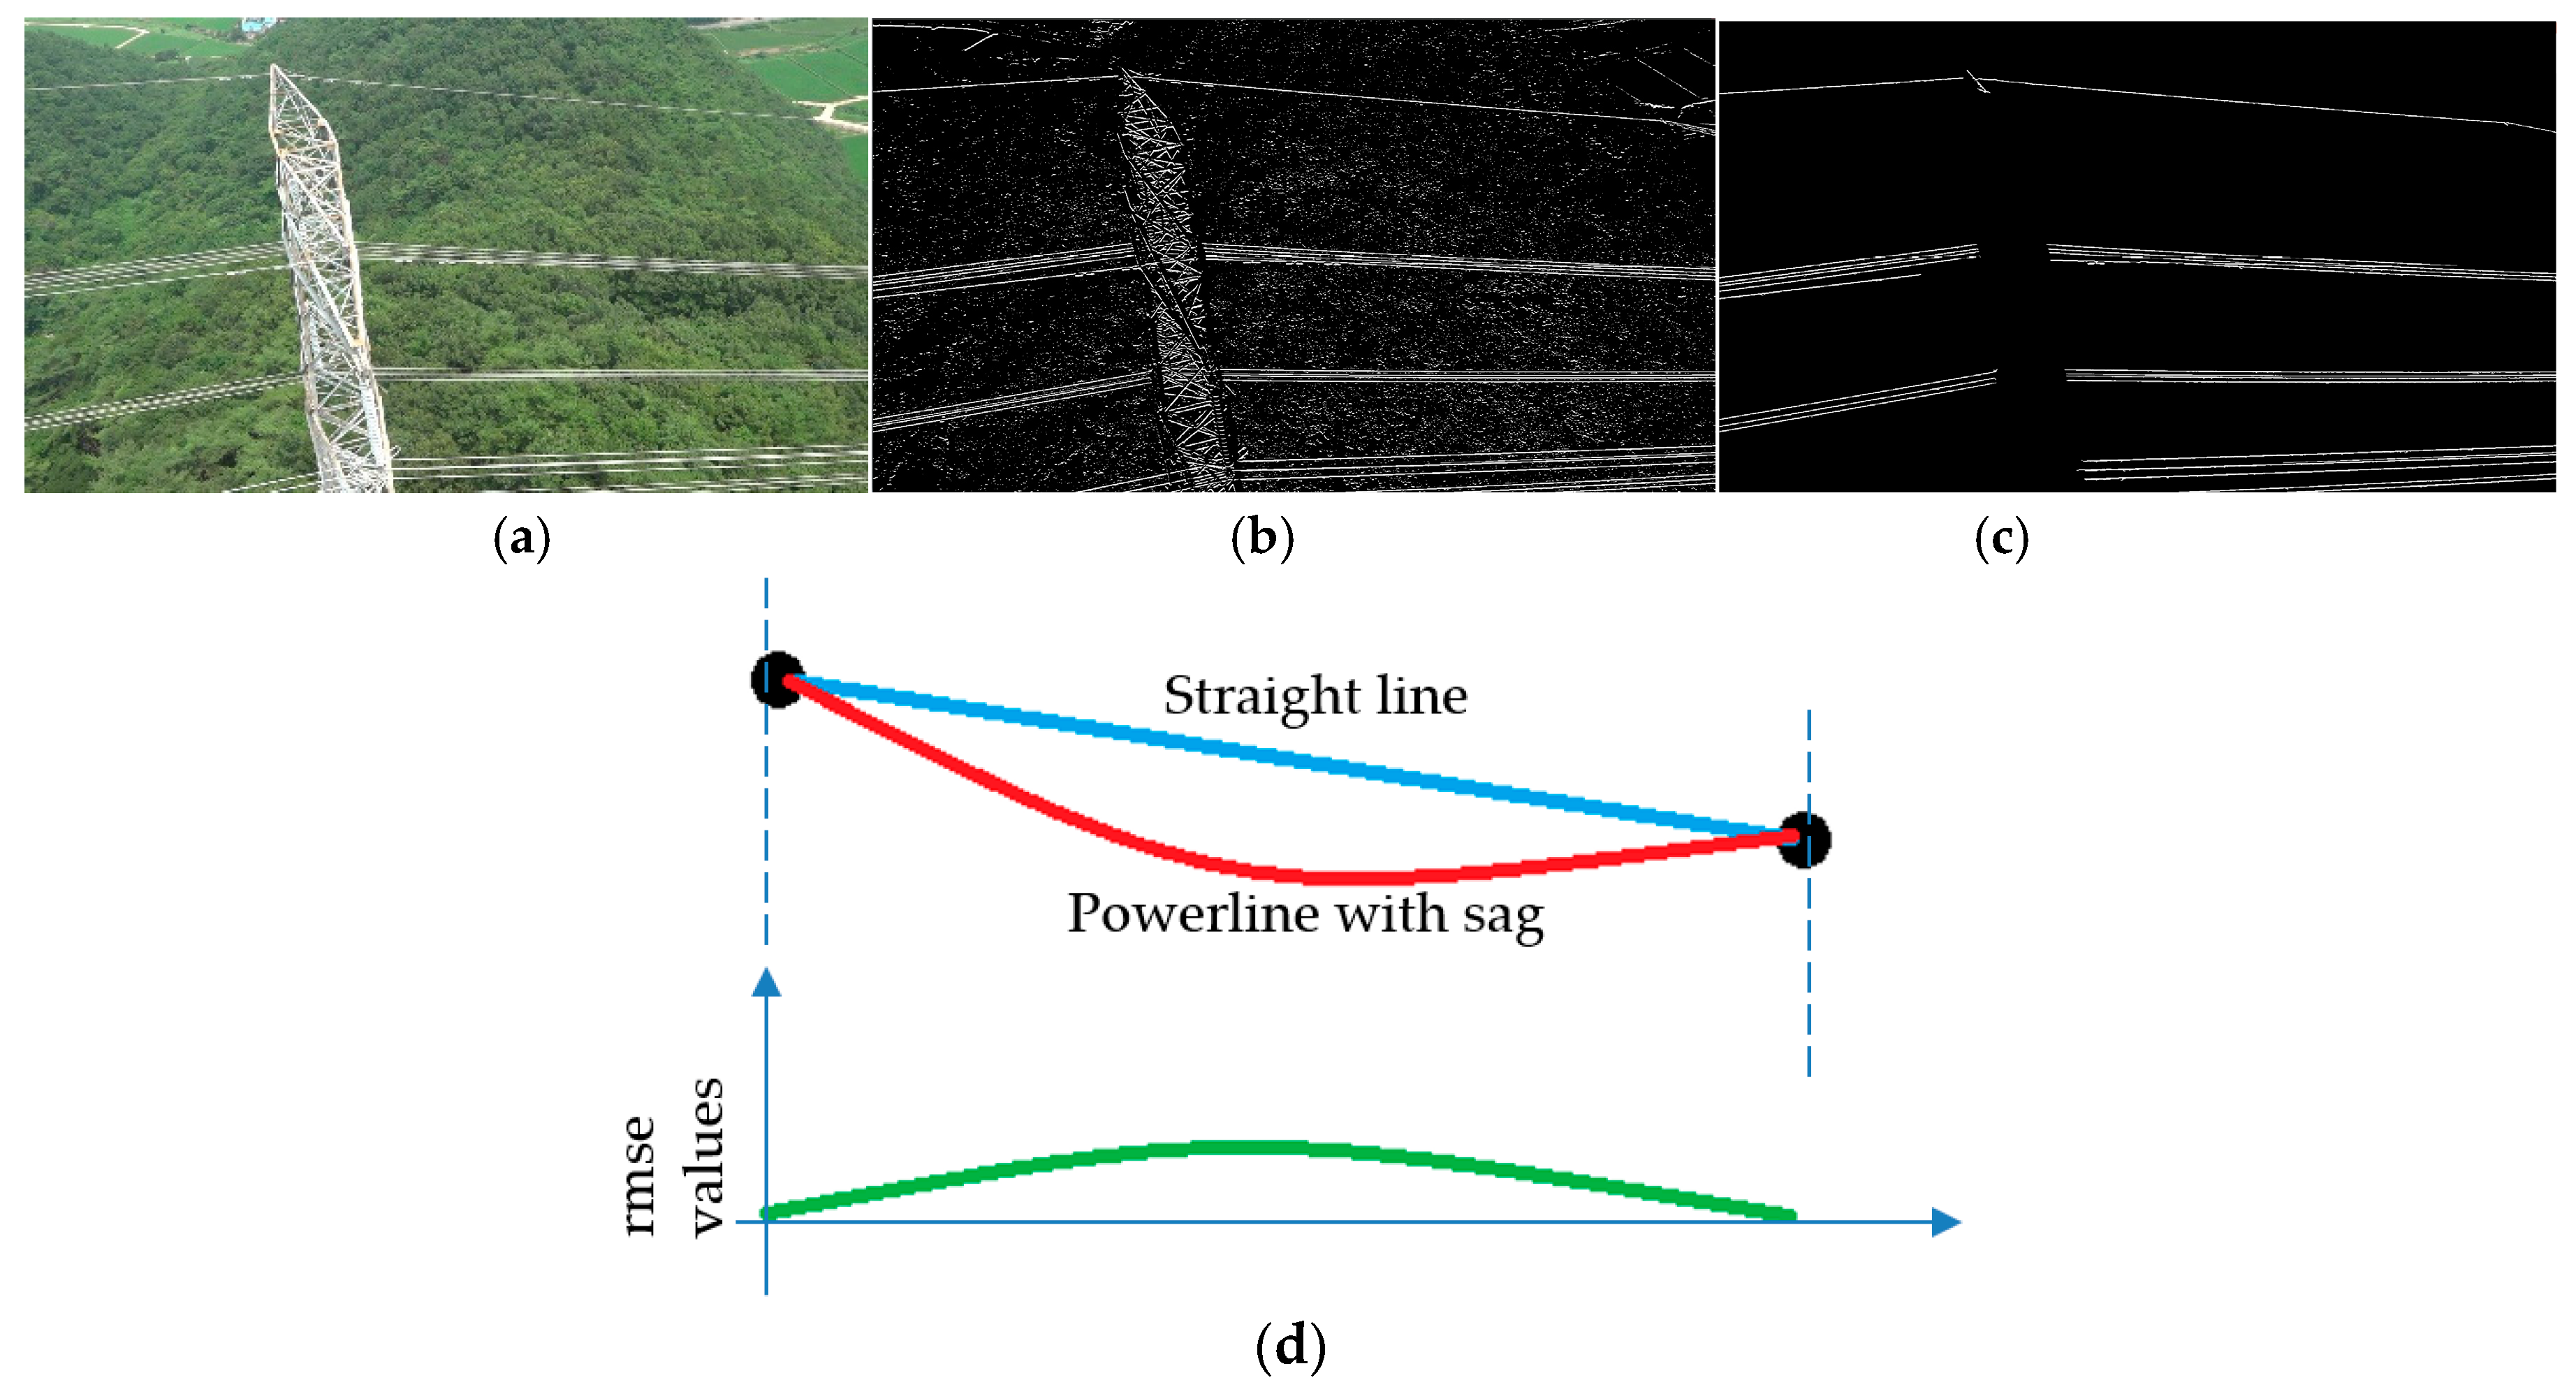
2.2. Power Line Detection

Detection of a power line (rope wire) from aerial images is also a challenging task because of the cluttered background. The fields, trees, bushes, and mountains causes enormous noise in the edge maps (shown in Figure 3 and Figure 4a). Moreover, because of the natural sag in the power line, the edge equivalent of the power line is not a straight line (Figure 4b). Consequently, the power line detection methods that use Hough lines [34] end with large false positive detections. However, it can be observed from the inspection videos that these power lines appear as the connected components that are horizontal to the camera (due to drone’s flying position). Hence, a custom-shaped kernel to compute the edge map (Figure 4c) is proposed in this paper. The algorithm to detect power line is given in Algorithm 1.
As given in Algorithm 1, the input image is first converted to grayscale, and a customized kernel is convolved with the grayscale image to get the edge map. The edge map is thresholded so that the weak and noisy edges are eliminated. Next, connected component analysis is applied, and edges having a length smaller than a specified threshold ( t h e d g e _ l e n g t h ), and edges that appear vertically in the edge map, are removed, because these edges have a very small probability of being part of a power line. The endpoints of the remaining edges are found, and the equation of a straight line is computed using the two endpoints of the edge. Next, the root mean square error (RMSE) between the straight line and all the points on the edge is computed. Finally, the algorithm selects the edges as a valid power line if the value of RMSE is smaller than the specified threshold ( t h r m s e ).
Algorithm 1 Power Line Detection.
Input:   I i n p u t = input image, I k e r n e l = 2D edge filter, t h e d g e = For thresholding edge image, t h e d g e _ l e n g t h = threshold for selecting only longer edges, thrmse = threshold for goodness of fit of the line and points on the line
Output: l i s t e n d _ p o i n t s _ o f _ c o n t o u r _ f i n a l = list of end points of line
Preprocessing:  I g r a y     c o n v e r t   I i n p u t   t o   g r a y s c a l e
         I e d g e   c o n v o l v e   I g r a y   w i t h   I k e r n e l
         I t h r e s h o l d e d   I e d g e > t h e d g e
       l i s t c o n t o u r s a p p l y   c o n n e c t e d   c o m p o n e n t   a n a l y s i s   o n   I t h r e s h o l d e d
Main algorithm:
for   i d x = 1   n u m b e r   o f   c o n t o u r s   i n   l i s t c o n t o u r s   do
   B r e c t   get bounding rectangle around contour in ( l i s t c o n t o u r [ i d x ] )
   L e n c o n t get length of contour in pixels from ( l i s t c o n t o u r [ i d x ] )
  If ( L e n c o n t > t h e d g e _ l e n g t h )   A N D ( w i d t h   o f     B r e c t > h e i g h t   o f   B r e c t )
   Append l i s t b i g _ c o n t o u r s l i s t c o n t o u r s [ i d x ]
   Append l i s t e n d _ p o i n t s _ o f _ c o n t o u r f i n d   e n d   p o i n t s   o f   c o n t o u r s   f r o m  
   Find end points of contours from l i s t b i g c o n t o u r s
    a p p e n d   l i s t l i n e s a i d x x + b i d x y + c i d x = 0   g e t   l i n e   u s i n g   l i s t e n d _ p o i n t s _ o f _ c o n t o u r  
  End of if
End of for
for m = 1     n u m b e r   o f   c o n t o u r s   i n   l i s t b i g c o n t o u r s do
  for n = 1   p o i n t   o n   c o n t o u r   i n   l i s t b i g c o n t o u r s [ m ] do
    x   X c o o r d i n a t e   f r o m   l i s t b i g c o n t o u r [ m ] [ n ]
    y   Y c o o r d i n a t e   f r o m   l i s t b i g c o n t o u r [ m ] [ n ]
    s q u a r e   o f   t h e   d i s t a n c e   f r o m   p o i n t   t o   l i n e + =   ( a m ( x ) + b m ( y ) + c m ) 2 a m 2 + b m 2
  End of for
   r m s e = s q u a r e   o f   t h e   d i s t a n c e   f r o m   p o i n t   t o   l i n e l e n g t h   o f   c o n t o u r   l i s t b i g _ c o n t o u r [ m ] i n   p i x e l s
  Append l i s t e n d _ p o i n t s _ o f _ c o n t o u r _ f i n a l     if ( r m s e > t h r m s e AND is curve up)
End of for
Return l i s t e n d _ p o i n t s _ o f _ c o n t o u r _ f i n a l
The natural sag in the power line causes the value of RMSE to increase, resulting in the low recall of power line, hence another parameter called the curvature of the edge is introduced. The sag in power line is always produced in a downward direction, resulting in a curved edge with an upward curvature (Figure 4d). Accordingly, the proposed power line detection algorithm computes the curvature of the final edges and verifies that the curvature of the edge is in an upward direction.
The proposed power line detection algorithm shows good detection results even with the cluttered background, harsh lighting conditions, and sag in the power line, as shown in Figure 5.

2.3. Defect Analyzer

Previous sections presented the methods to detect transmission line components from the live videos taken using a drone. Once, the components are detected, their cropped images are passed to the defect analyzer. Defects in HV transmission line components can occur due to inferior design, improper manufacturing or use of substandard quality materials during manufacturing, misemployment of the insulator, or extreme mechanical forces linked to weather (rain, storms, snow, hails, moisture, extreme cold or hot temperature, and UV rays), vandalism, wildlife, extreme electrical activity, or mishandling. These defects alter the appearance of the electrical components, like changing its color (due to flashovers and extreme heat, etc.), shape (splits, punctures, completely broken cap, etc.) and/or texture (shattering, chipping, cracks, etc.) [43]. The proposed defect analyzer provides a qualitative measure that reflects to what degree the particular type of transmission line component is close to faulty. The proposed defect analyzer can detect deformation defects of seven different types of transmission line components. Following subsections present the proposed defect detection algorithms.

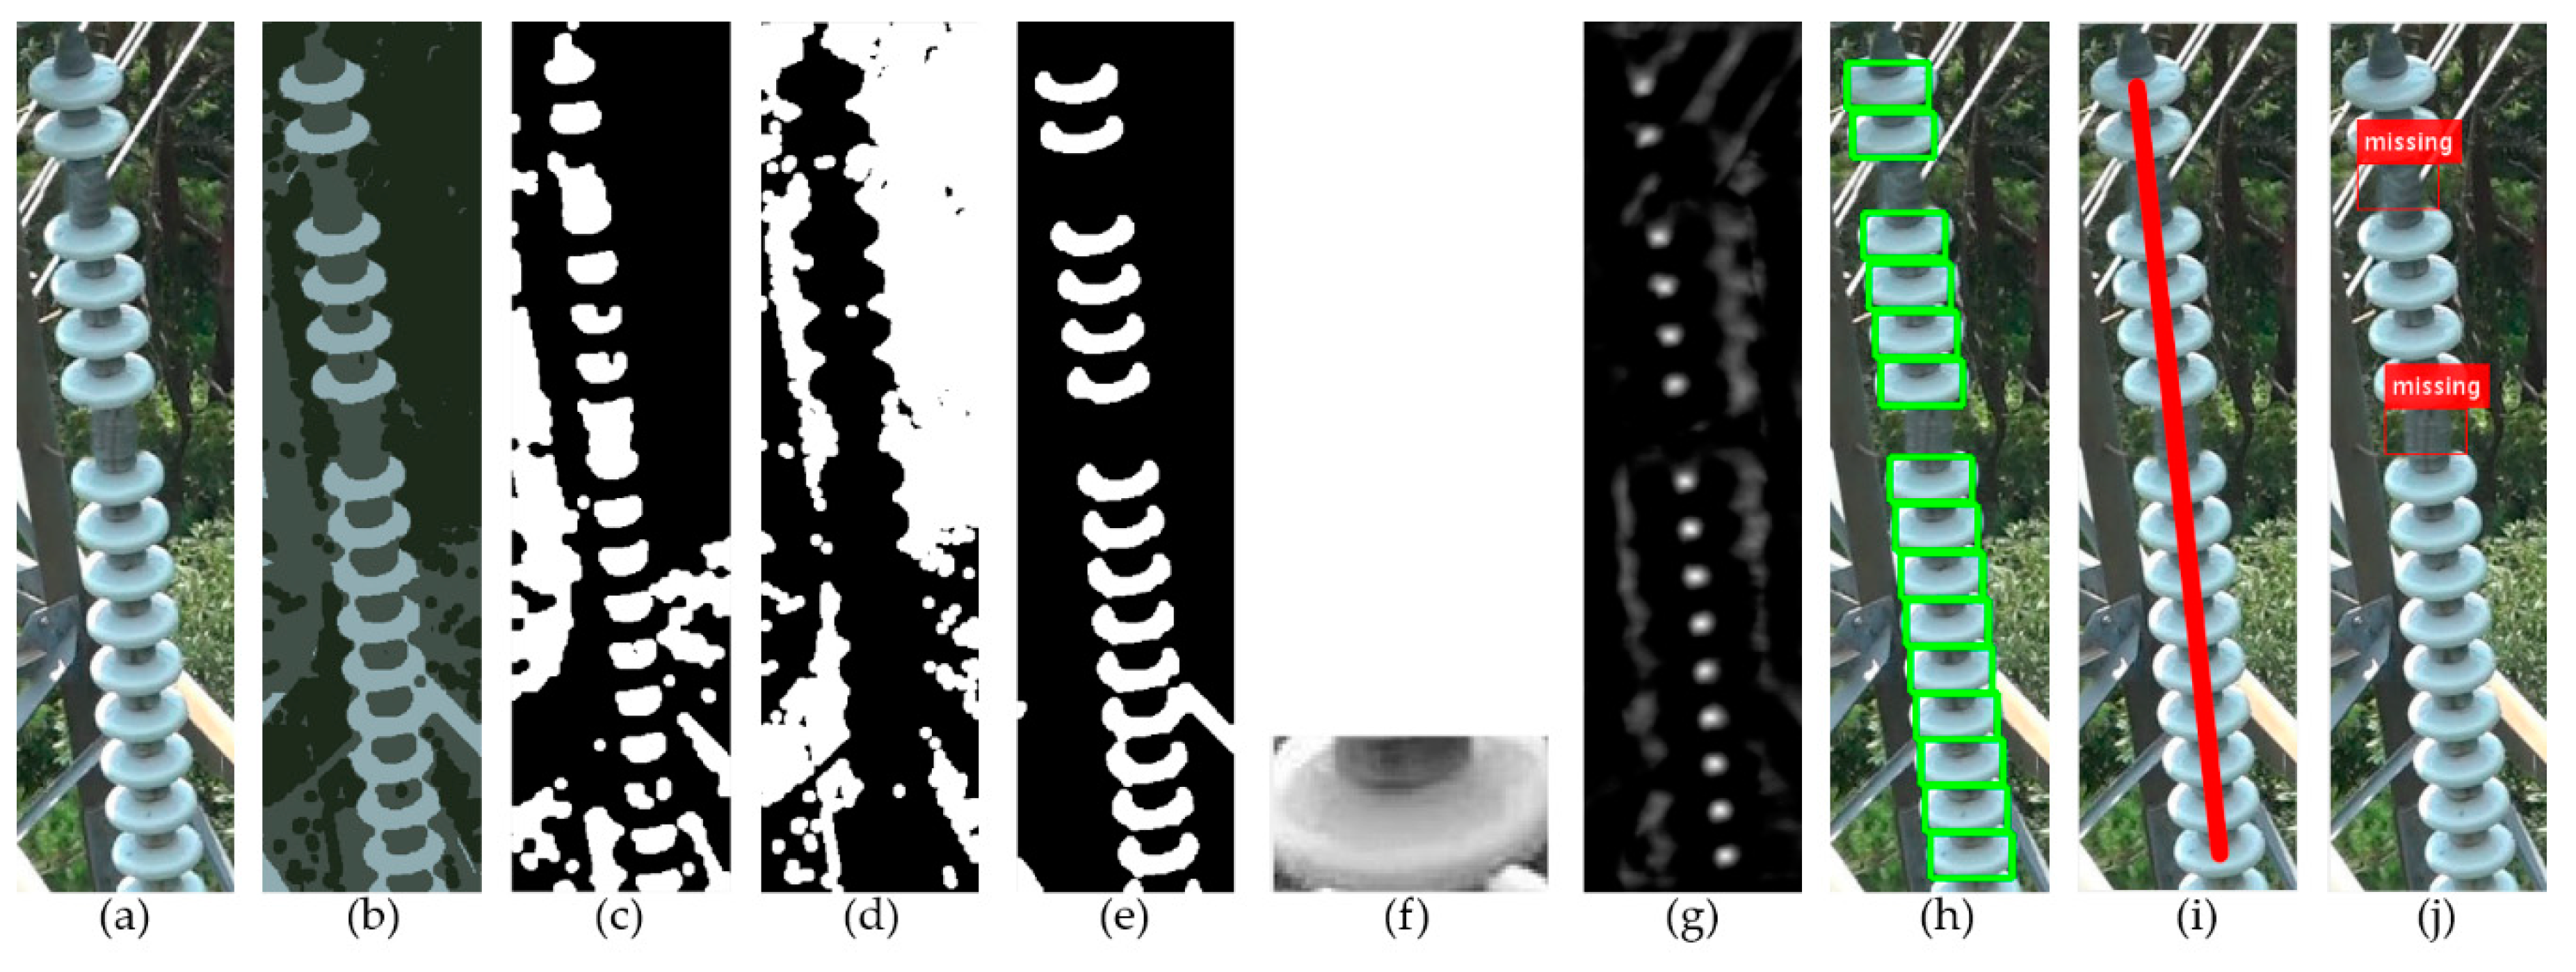
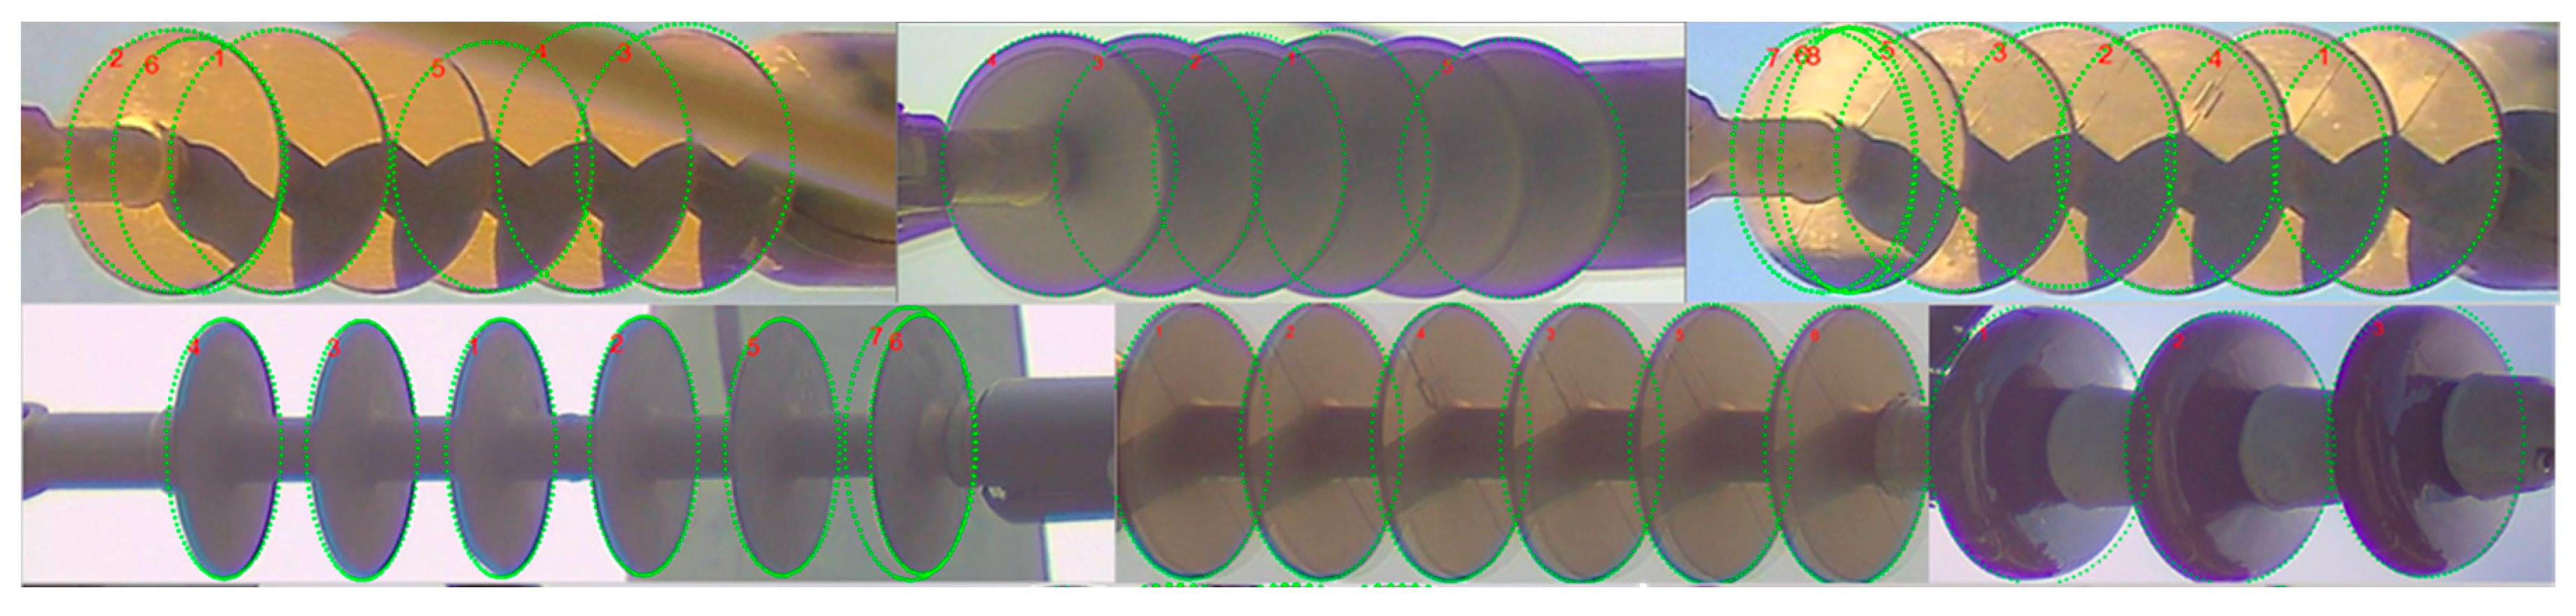
2.3.1. Broken Shed or Disk in PorSTI-W and PorSTI-R

In every type of insulator shown in Figure 1b–d, the repeating circular-shaped part is called the “shed” or “cap”. Broken shed defect in PorSTI-W and PorSTI-R starts with small cracks on the ceramic disk surface, caused by thermal stress or uneven heating [44]. These cracks grow over time due to strong winds and mechanical tension, resulting in completely breaking away of individual disks, as shown in Figure 6a.
In order to detect the broken or missing ceramic disk in cropped insulators images, the appearance symmetry property of the insulators’ shape and the spatial context information is used. As the sheds of the insulator appear as equally spaced repeating patterns, the proposed algorithm iteratively searches for the missing shed using sample templates of the ceramic shed, obtained from the input insulator image. The missing shed/disk detection algorithm is elaborated in Figure 6.
The proposals for sample templates are first generated by color clustering (Figure 6b) the input image and then apply morphological operations to find the blobs of the potential templates, and then further refined using context priors (Figure 6c–e shows the three refined clusters). The connected component analysis is applied to the three refined clusters to get the shape statistics of the blobs inside the cluster. The algorithm selects the cluster that has the most equal-sized and equal-spaced blobs (in this case Figure 6e). Template proposals are then drawn (Figure 6f) from the selected cluster and each of the template proposals is convolved with the input insulator image in a sliding window fashion, and the maximum response regions (Figure 6g) are grouped (Figure 6h). Next, the algorithm fits the maximum response regions to a straight line and computes the fitting error (Figure 6i). If the fitting error is greater than the specified threshold value (determined on validation dataset) then the algorithm rejects the proposal as well as the maximum responses as false positives, while if the fitting error is smaller than the specified threshold value, then the algorithm considers the maximum responses as the detected sheds/disks of the insulator. The algorithm then calculates the pairwise distance between the centers of the sheds/disks and clusters them into two groups. The smaller group is considered as the outlier and space between the outlier pairs is marked as missing or broken shed/disk (Figure 6j).

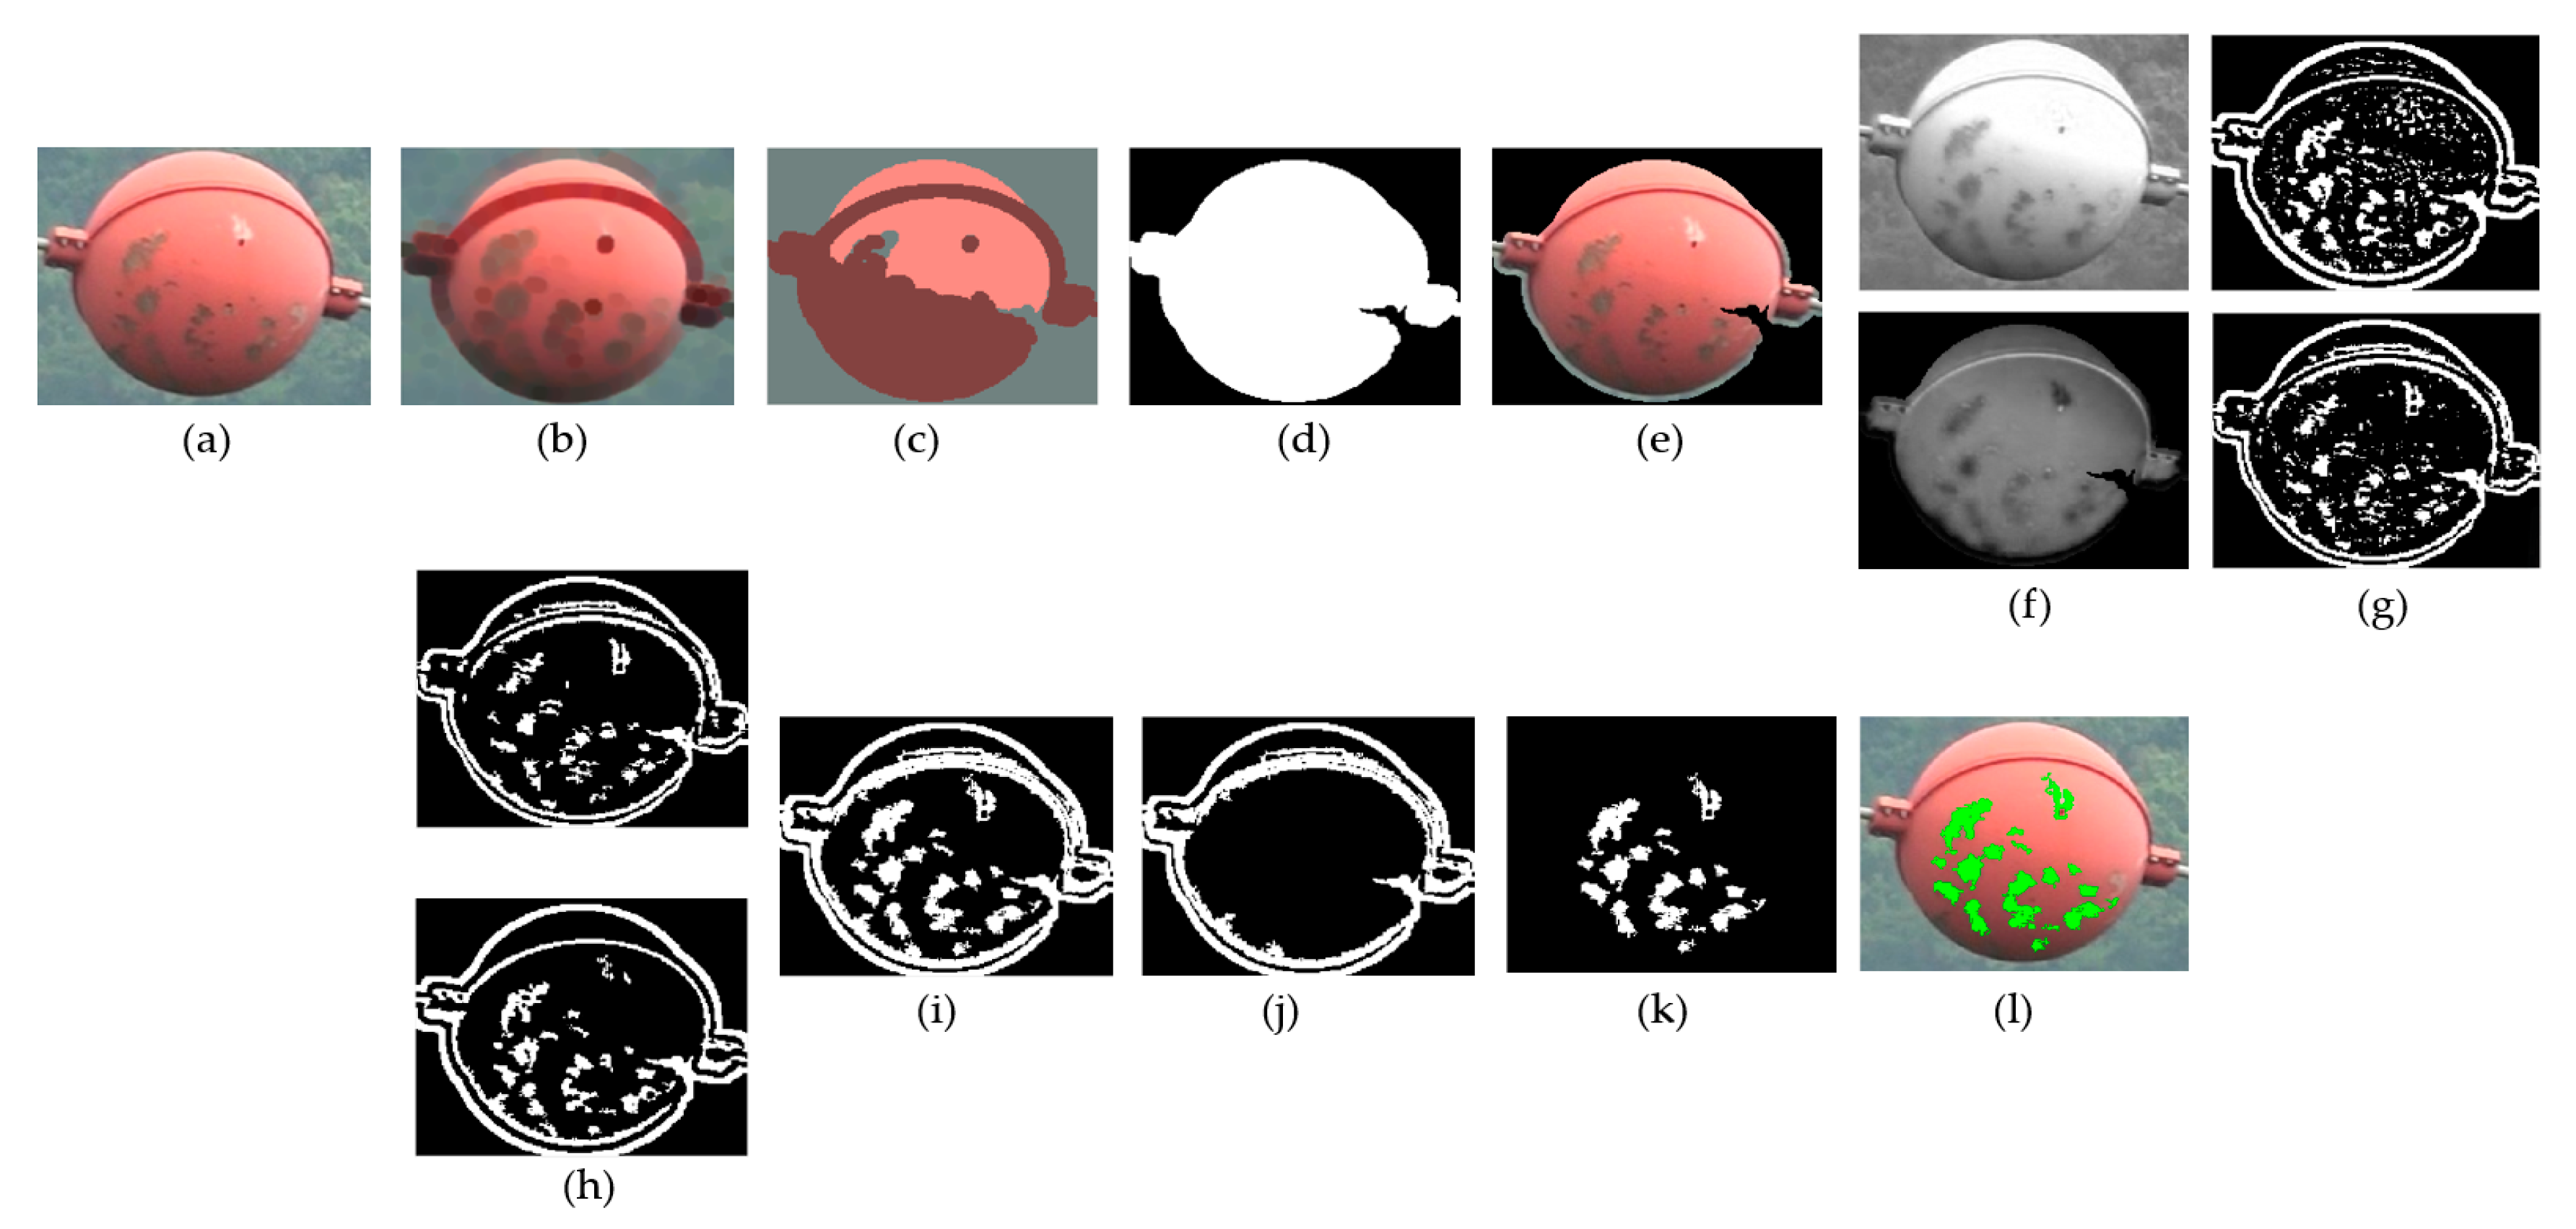
2.3.2. Balisor Color Fading Defect

A balisor, also known as a balisor beacon, is a colorful ball-shaped transmission line component that is attached to transmission power line. The purpose of balisor is to give a visual warning to the low-flying objects so that they don’t run into them [45]. Their long term usage, dust, strong winds, and rain can cause their shiny coating to fall-off, which decreases their visibility, creating a potential threat to low-flying objects.
To identify the fading color defect in balisor, first, the spherical balisor body is tightly cropped from the detection result. In order to mask out the noisy background, the balisor image is eroded so that the range of the color variation in the foreground (balisor body) and background is reduced (Figure 7b). It is assumed that the balisor image is mainly comprised of three color clusters, i.e., background, the upper part of the balisor (brighter than the lower part of the balisor), and the lower part of the balisor. Based on this assumption, the image is clustered into three color clusters (Figure 7c) and the two clusters are selected as a foreground that shows a high probability value of recall in the center part of the image (Figure 7d). The foreground is masked, as shown in Figure 7e, and then a LoG (Laplacian of Gaussian) filter is applied to detect the areas of rapid intensity change. The filter is applied to the red-color and saturation-color space, as these color spaces are the most discriminant color spaces for detecting the balisor defects, as shown in Figure 7f–h. After removing noise and the boundary regions, the areas with the defect are highlighted, as shown in Figure 7l.

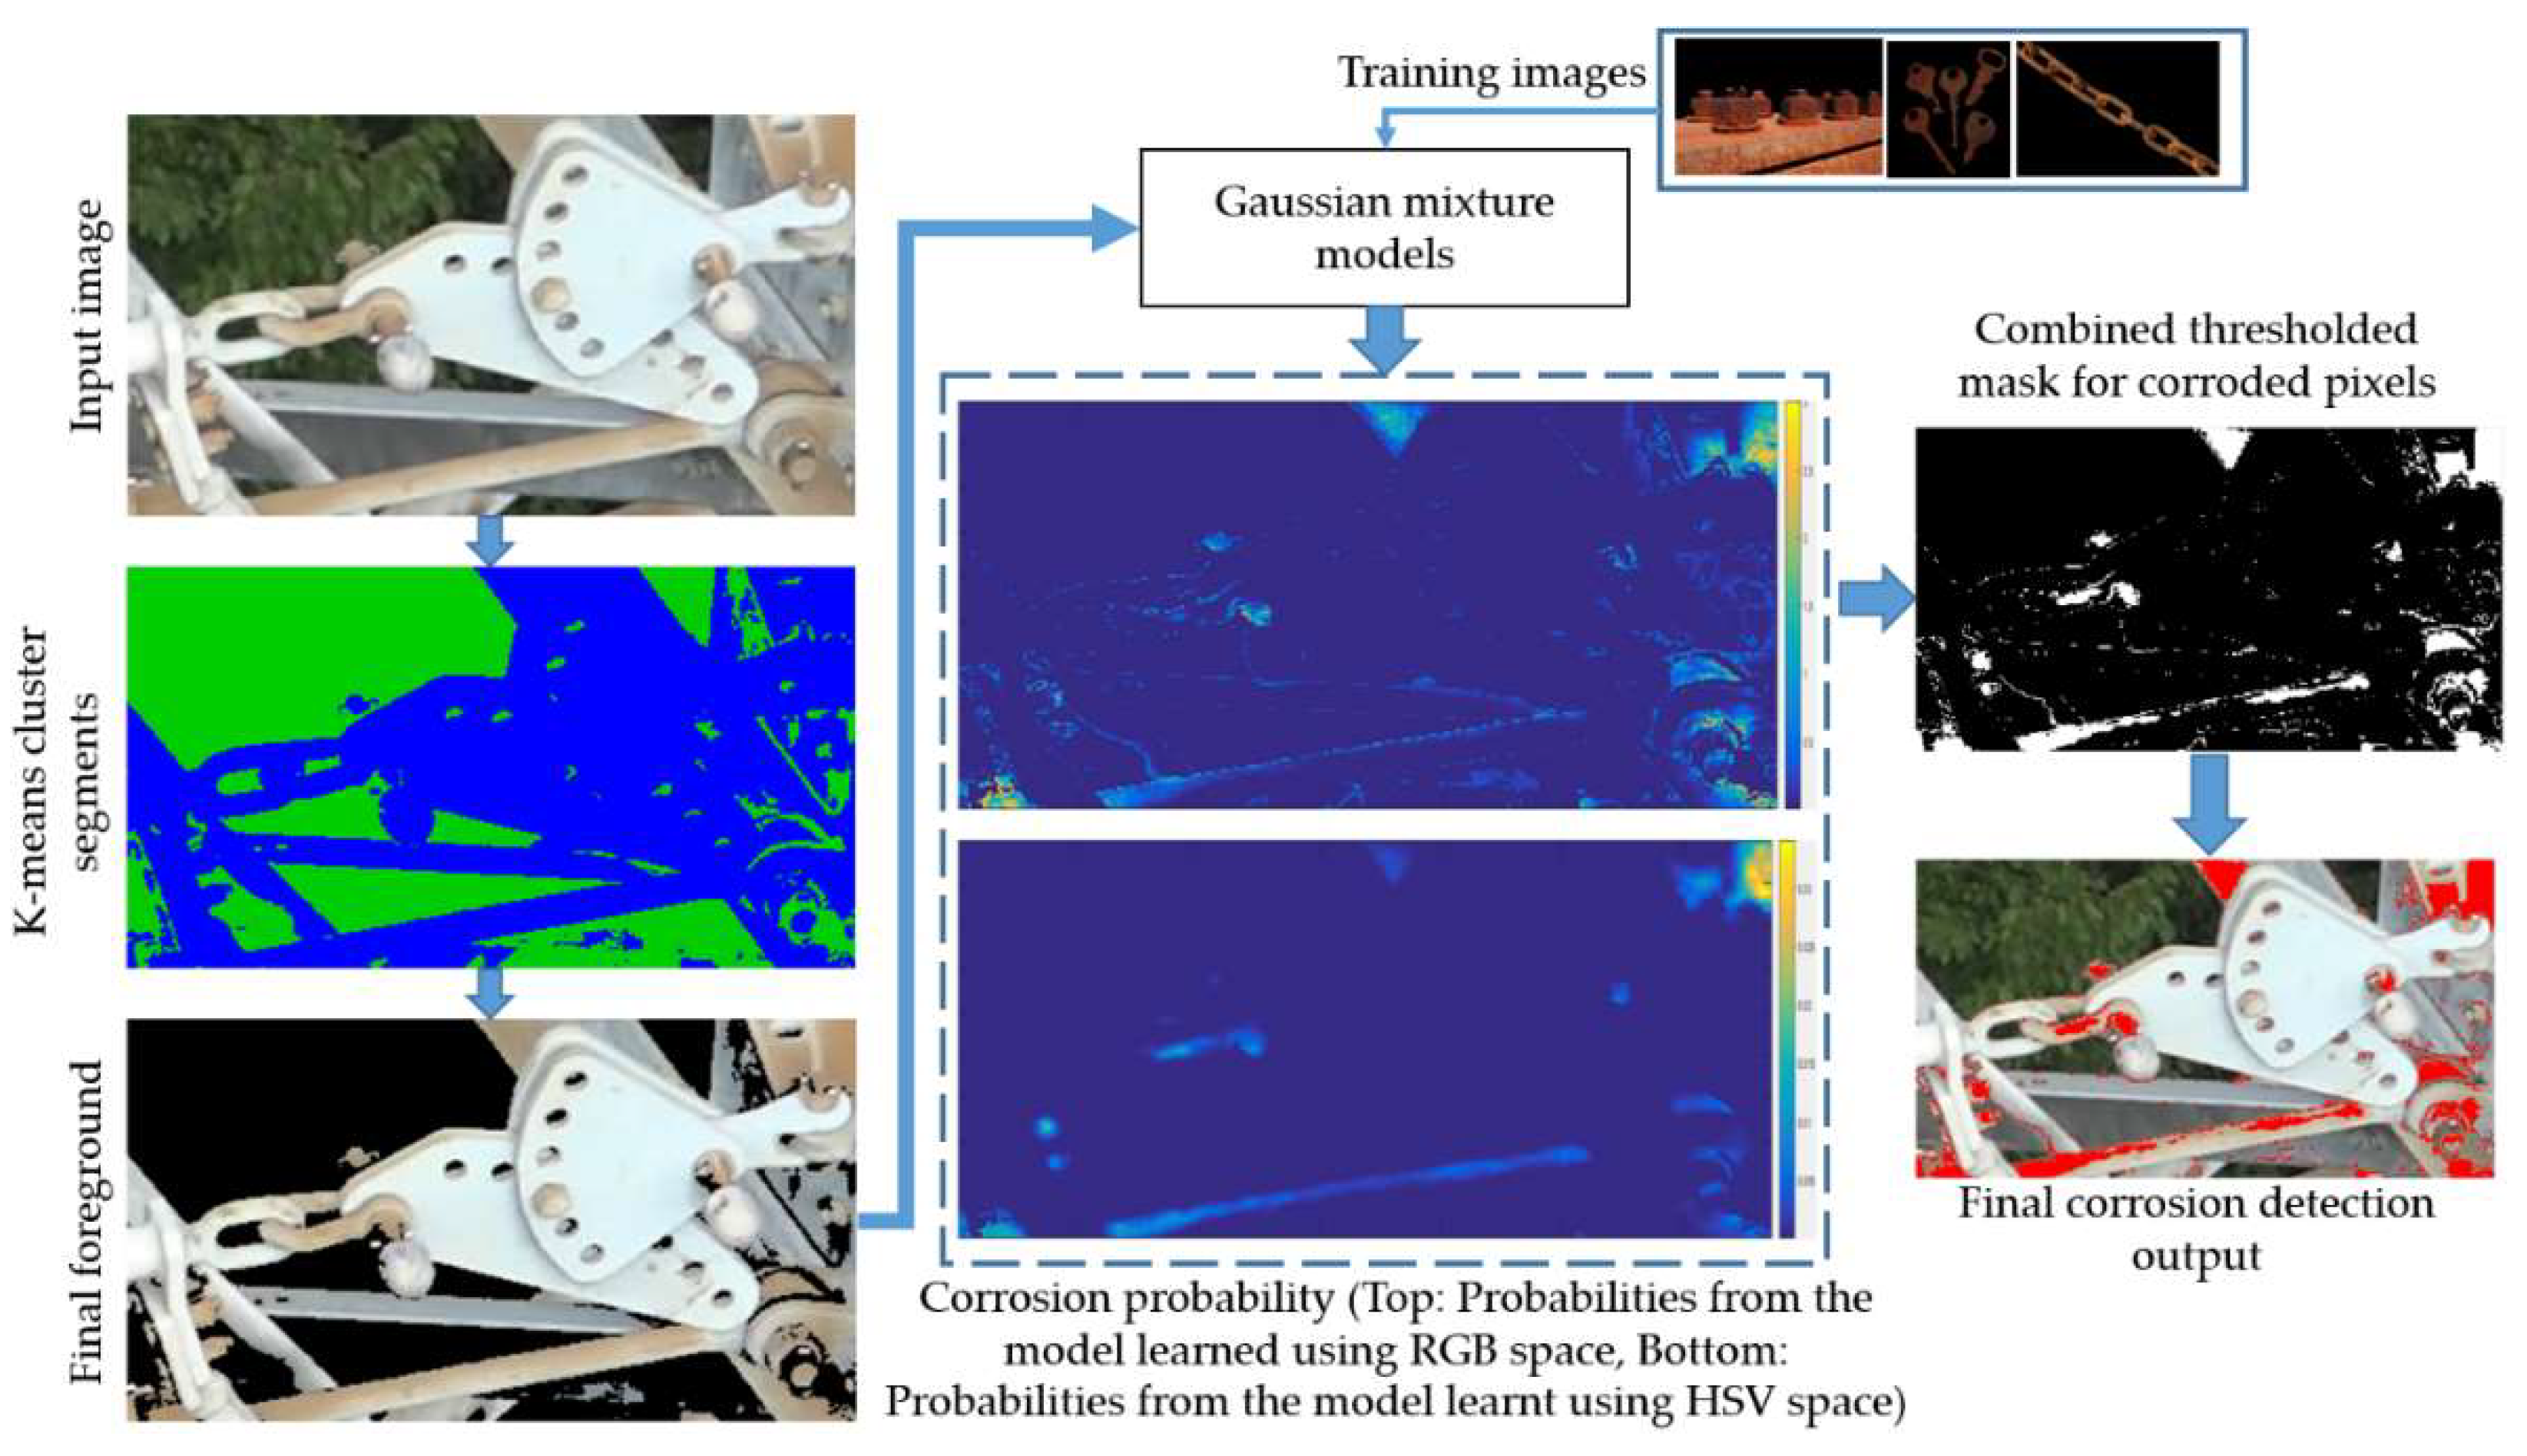
2.3.3. Corrosion Defect in Sag Adjusters

As their name suggests, sag adjusters are used to adjust the sagginess in the transmission power line. The utilization of substandard coating material coupled with the extreme weather conditions may cause corrosion in sag adjusters. Corrosion weakens the material strength of the sag adjuster that endures the weight and stress of power line, leading to cracks, rupture, and permanent break-away of the sag adjuster.
In order to detect corroded regions in the sag adjuster, the proposed algorithm first segments the sag adjuster from the background using k-mean clustering. As the sag adjuster color is very discriminant with respect to the background (which is mostly fields, and trees), hence the algorithm clusters the RGB image into two clusters, where the larger cluster constitutes the background. The Gaussian Mixture Models (GMM) are trained using the means and covariance from the RGB and HSV space of the corroded regions of train images (random rusty images downloaded from the internet). The algorithm trains two GMM models using each color space and it fuses the regions with a high probability of corrosion using a weighted sum approach. Figure 8 illustrates the corrosion detection algorithm.

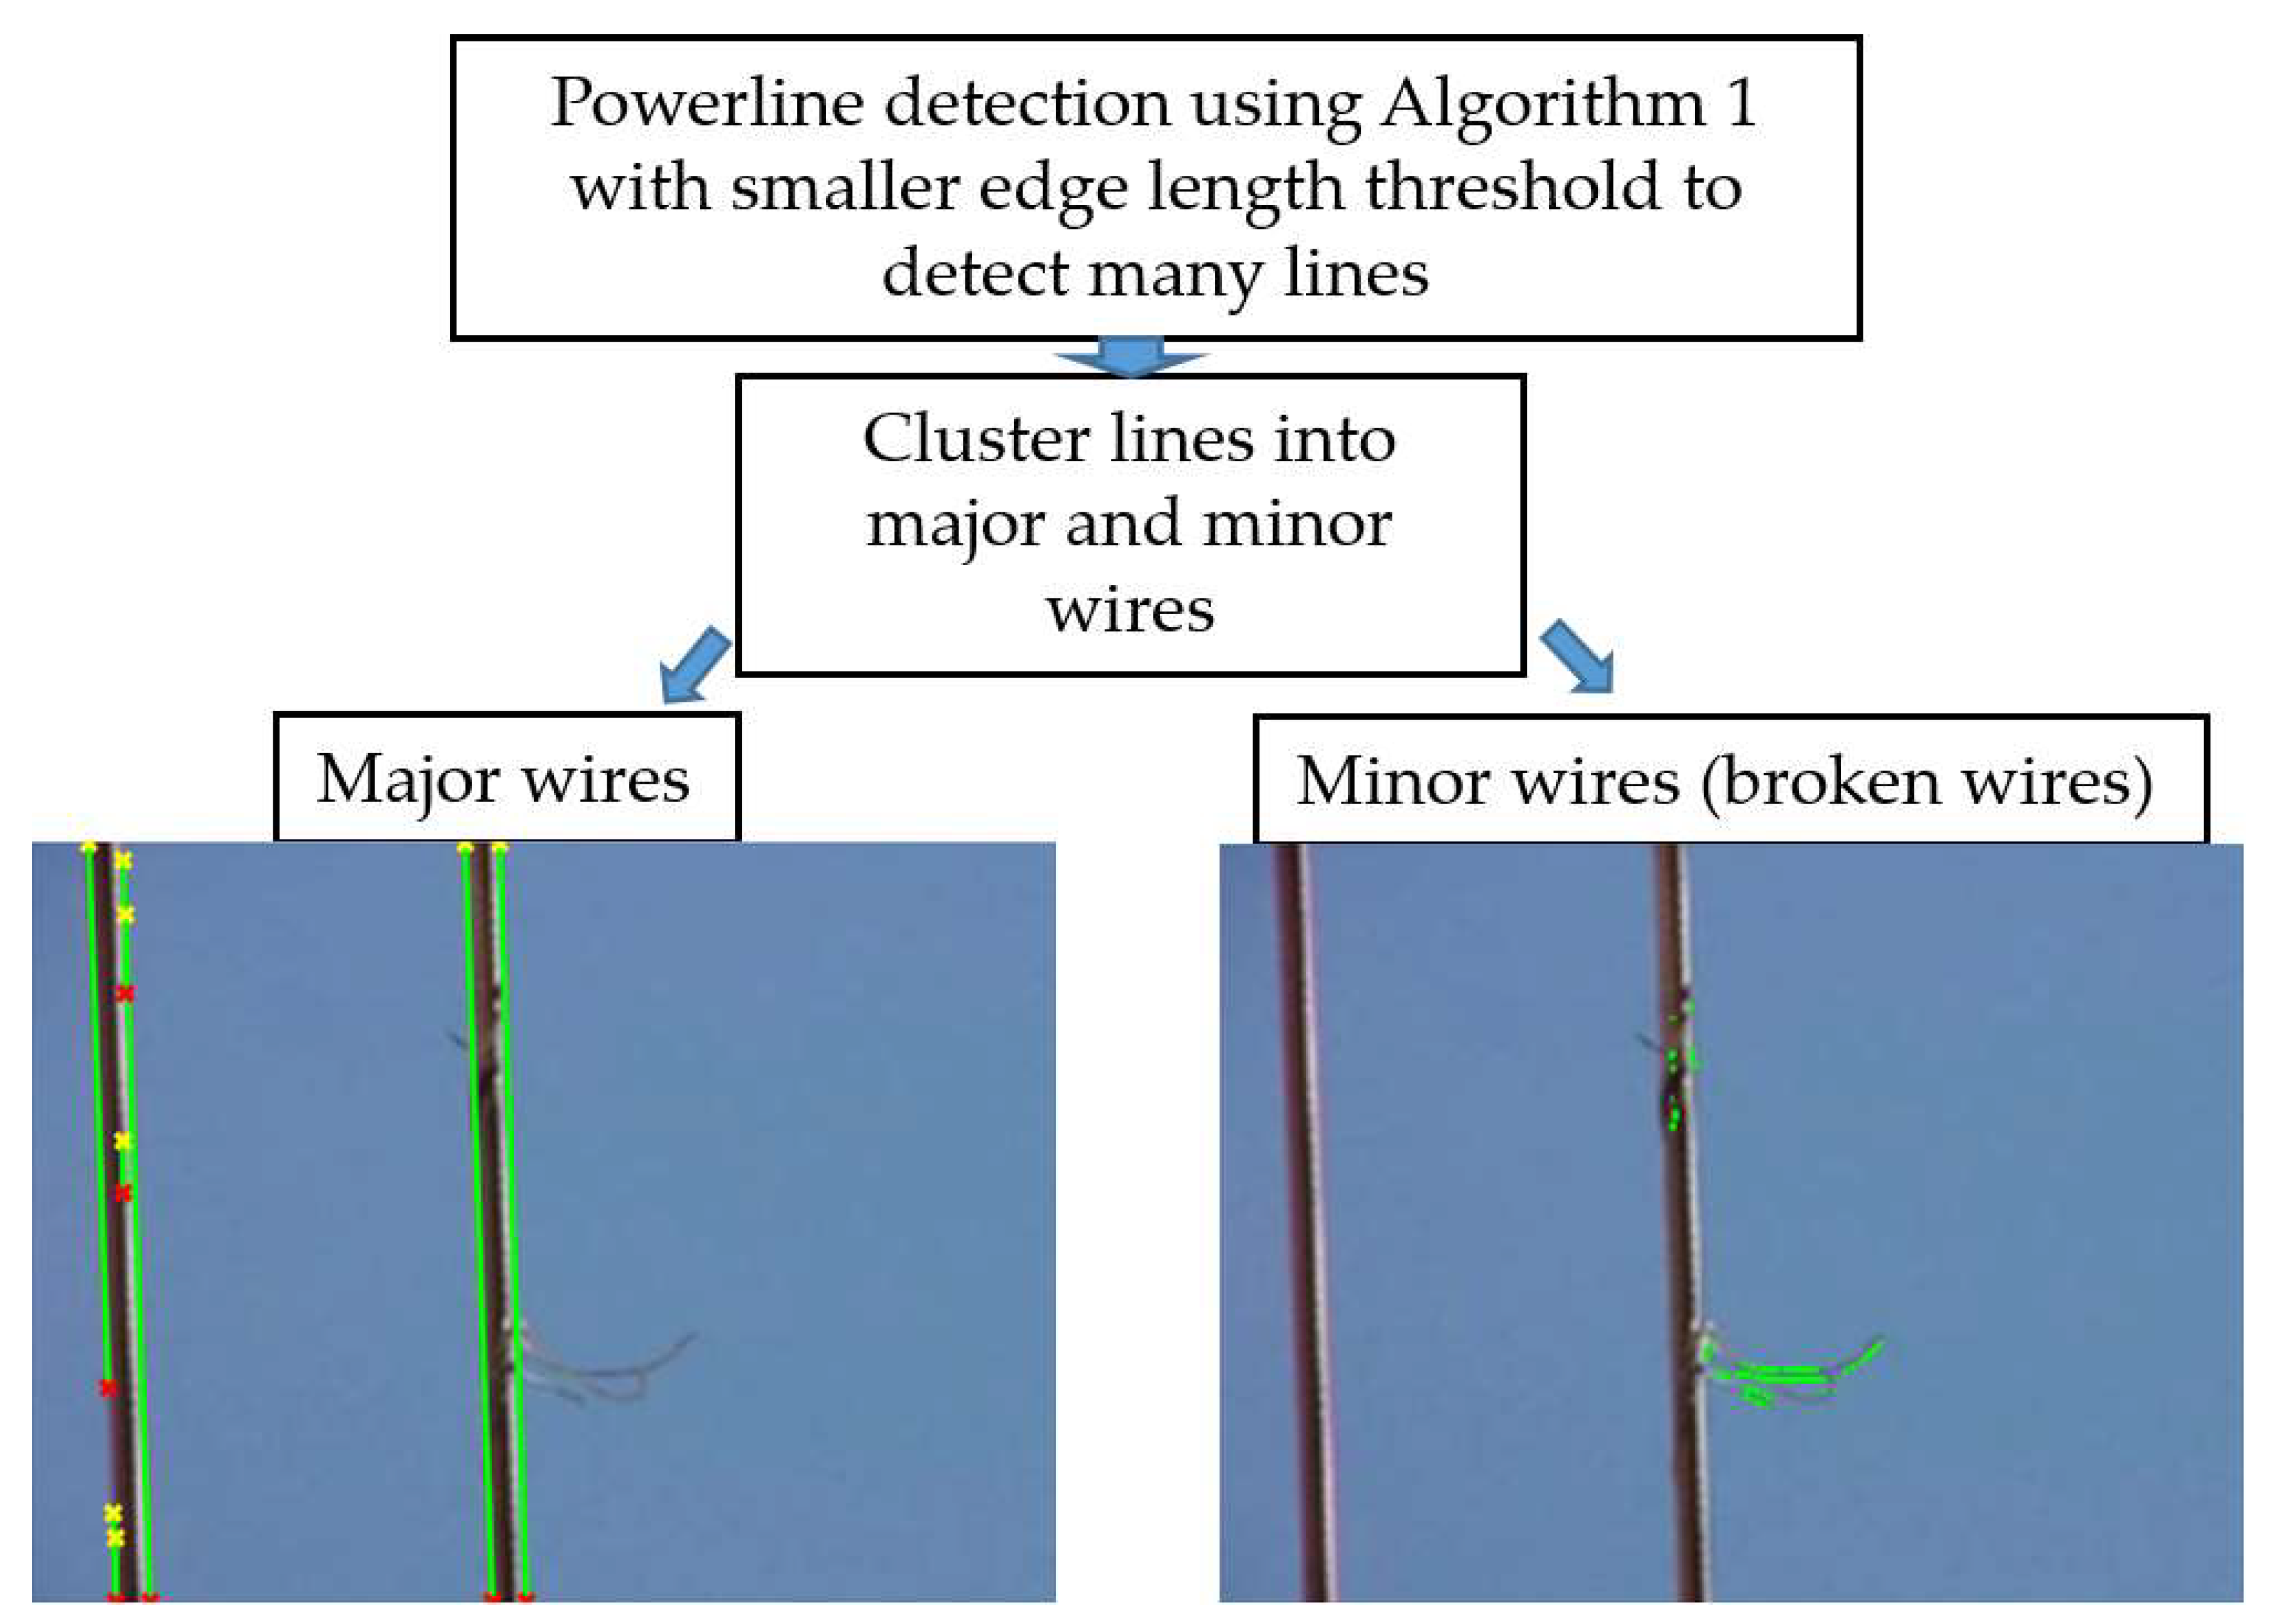
2.3.4. Broken Power Line/Wire-Rope Detection

The power lines are made up of thin wires, tied together as a wire-rope [46]. The weight of the power line, as well as the extreme weather conditions, can cause the thin wires in the power line to break-up gradually, leading to sparks, fire, and sometimes completely breaking the power line. An immediate repair or substitution is usually done to avoid catastrophic results.
Due to the unavailability of a large dataset of broken power line images, the proposed scheme currently works with a simple background. The algorithm relies upon the basic assumption that the power lines are parallel to each other. In an ideal condition, if a line segment detection algorithm is applied, the angles of the detected line segments (power line) with respect to the horizontal axis will be the same. On the other hand, a broken power line detected as a line segment can take any arbitrary angle values. Hence, the power line detection algorithm (proposed in Section 2.2) is applied to detect power lines as line segments. During power line detection, the value of the line length threshold is kept to be small, so that the small broken wires can easily be detected. This also causes the power line to be detected as a set of small line segments, rather than one big straight line. According to our assumption, the angle with the most votes (angle which is most repeated) is the angle of the true power line, while all other arbitrary angles are caused by the broken wires, as shown in Figure 9.

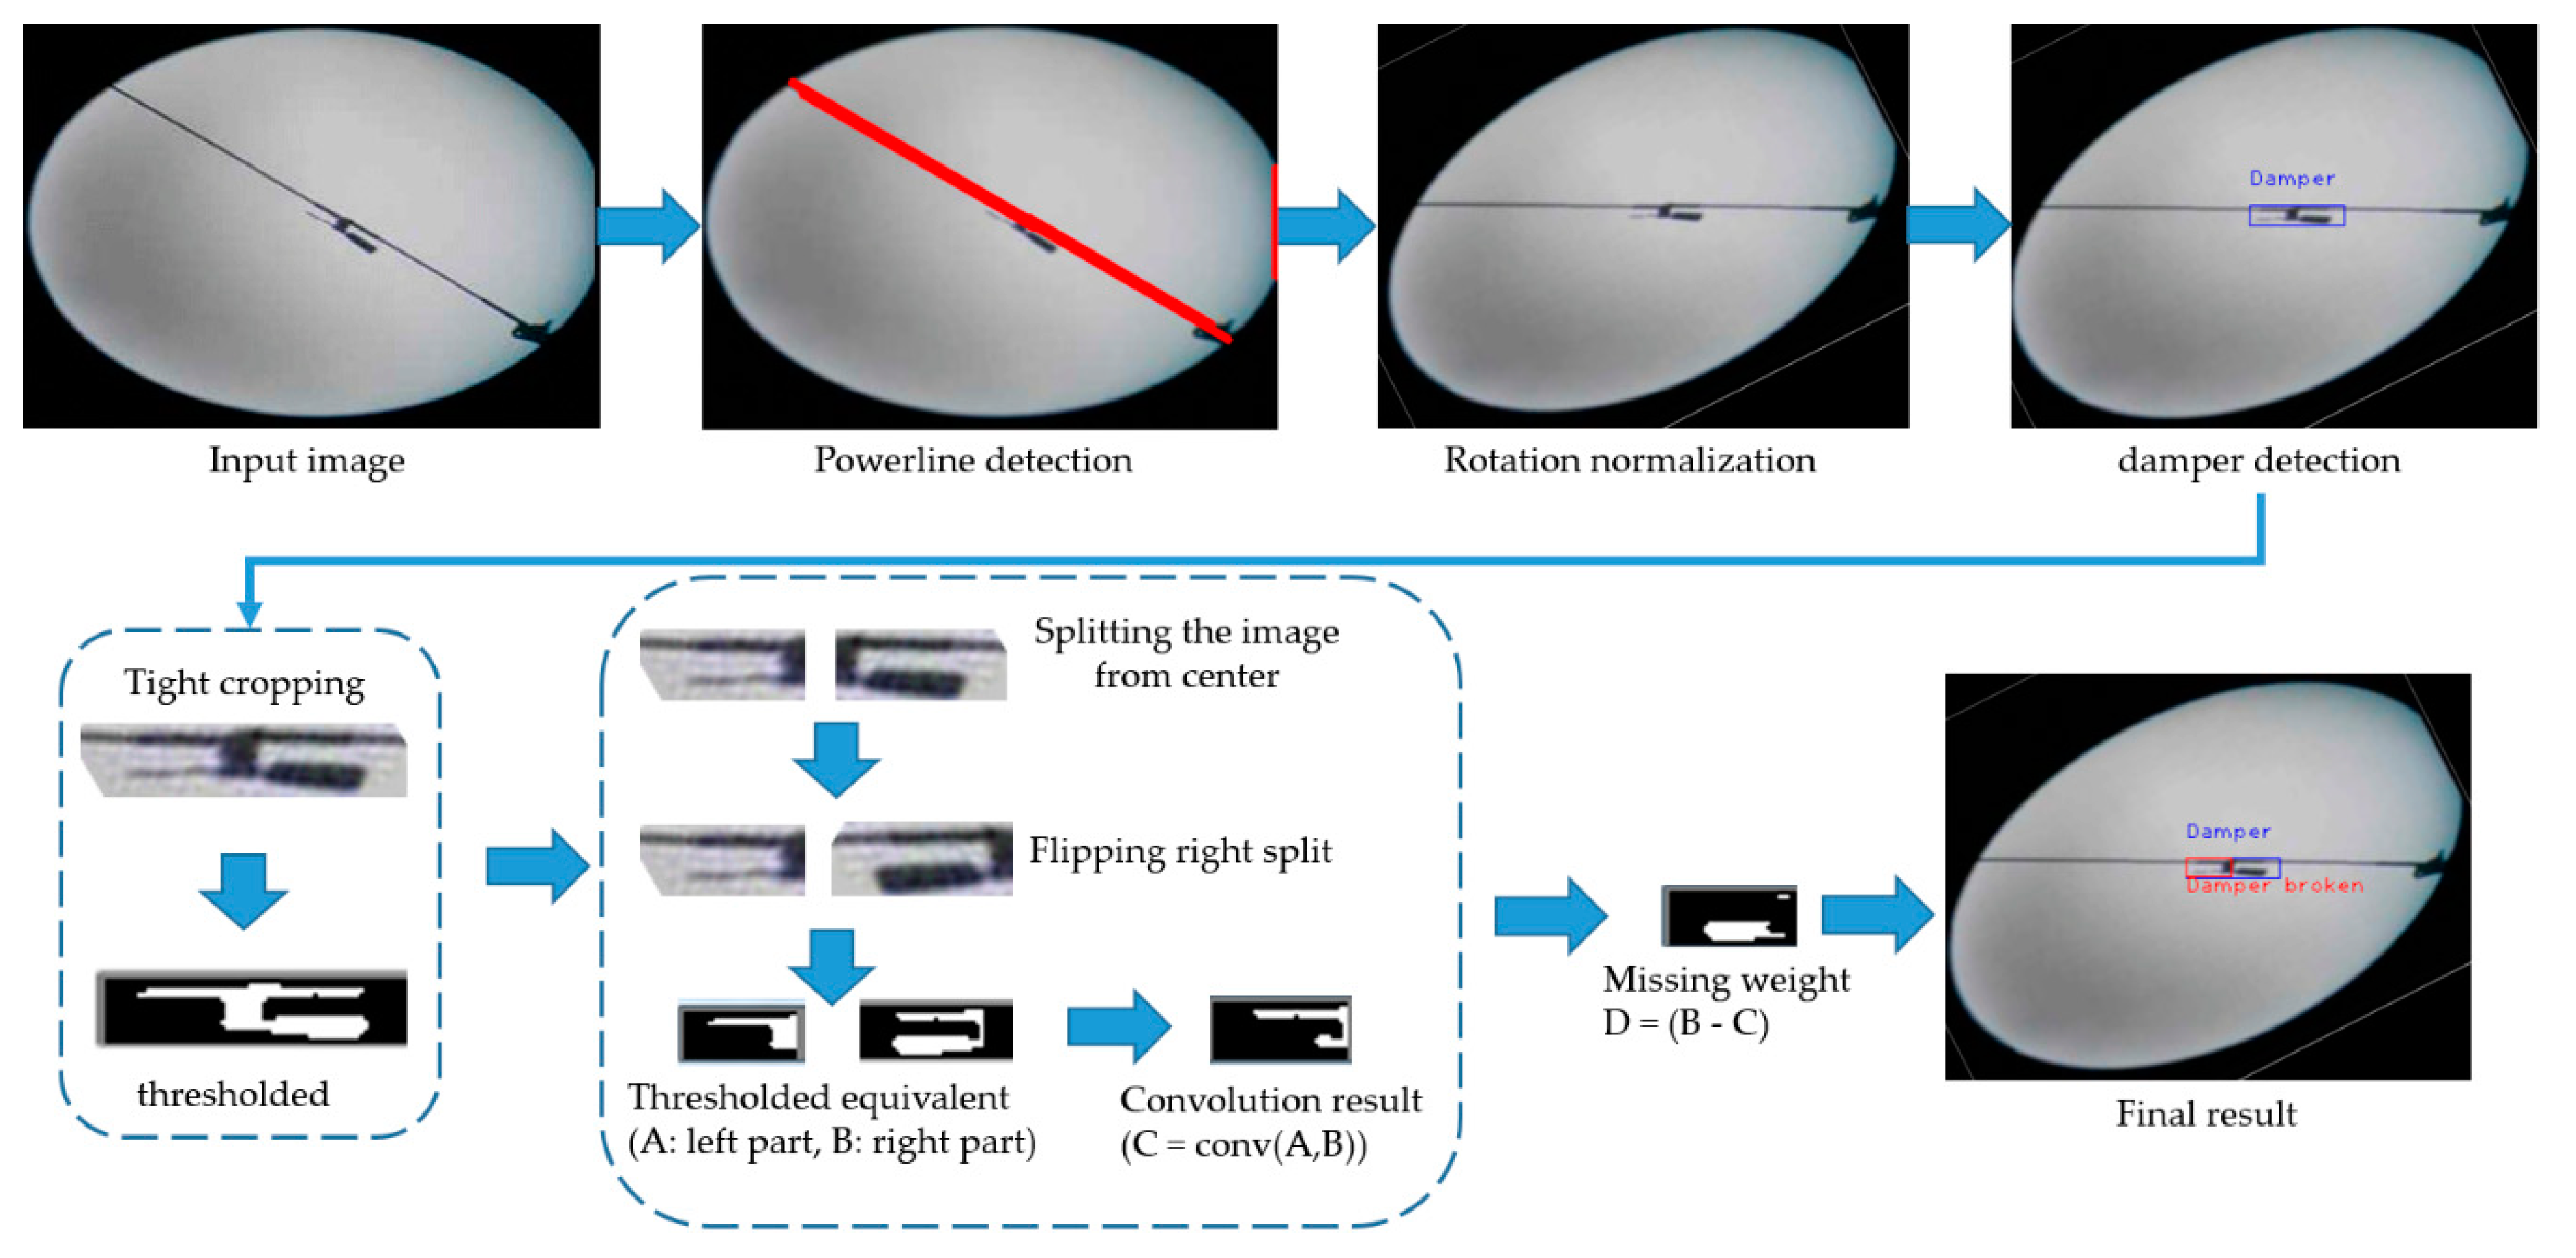
2.3.5. Broken Vibration Damper

The purpose of a vibration damper is to protect power line from wind-induced vibrations that can cause mechanical fatigue to the power line. As the vibration damper consists of moving parts, they are at the danger of break-away after their aging and mechanical fatigue. Again, because of the unavailability of a large number of defected vibration damper images, we proposed a handcrafted algorithm to detect the broken vibration damper.
As can be observed from Figure 1h, the left and right sides of the vibration damper are symmetric, hence the proposed algorithm utilizes the shape symmetry property to detect the broken vibration damper. First, the algorithm normalizes the orientation of the vibration damper by detecting the power line with which the vibration damper is attached, using Algorithm 1. Next, a foreground mask is created to extract only vibration damper from the background by applying a similar segmentation algorithm as described in Section 2.3.3. Then, the image is split from its center and one of the splits is vertically flipped and the two regions are convolved to find the dissimilar regions in the image, as shown with different steps in Figure 10.

2.3.6. Splits and Puncture Detection in Polymer Insulator

Splits can appear in polymer insulators because of several reasons, including low-quality manufacturing material or process, miss-handling during transportation or installation process, vandalism, birds, etc. In any of these cases, the splits grow towards the core of the insulator (radially), causing the metal rod to expose and hence posing potential electrical hazards to the surrounding environment [43].
Due to the elliptical appearance of the caps of the insulators, it is proposed to segregate the caps of the insulator using ellipse detection algorithm, and then apply the splits detection algorithm on individual caps. The ellipse detection algorithm [5] assumes that the input image of the insulator is rotation normalized, and hence rotation normalization of the insulator images is the first step in the proposed splits detection algorithm, which is presented in [5]. Some of the caps detection results (after rotation normalization) using the author’s ellipse detector are shown in Figure 11.
With the help of detected ellipse, the algorithm masks the caps of the insulator and applies the splits detection algorithm on individual caps. The splits detection algorithm starts by computing the edge map of the cap and then removing the boundaries of the caps in its edge map. Next, the algorithm iterates through all the edges inside the cap, and if the edges are found near boundaries of the cap, it closes the contour and computes the area of the closed contour otherwise it considers the edge as noise. The steps of the splits detection algorithm are depicted in Figure 12.

3. Experimental Results and Discussion

This section presents the experimental results of the transmission line components inspection system.

3.1. Database Acquisition

There is no publicly available transmission line image dataset and only a few studies presented quantitative evaluation results of the system performance using a self-acquired database. For experiments in this paper, a large, unconstrained dataset of transmission line inspection videos captured using a drone is gathered. The drone is flown alongside the power line and transmission towers to include as many types of transmission line components, such as balisor, spacer, damping weights, LA, sag adjustor, and insulators on transmission towers. Moreover, this paper also proposes to detect the power line and transmission towers, in order to navigate the drone autonomously (in the future). In total, 43 videos containing 700 frames on average are captured. A training set of 30 videos, a test set of 10 videos, and a validation set of three videos is annotated. The videos were captured during the daytime, between 11 a.m. to 3 p.m., and under two lighting conditions, i.e., sunny and cloudy. The authors believe that the dataset is unbiased, unconstrained, and sufficiently large enough to validate the reliability and effectiveness of the proposed system.

3.2. Components Detection

Unavailability of publicly available datasets restricts the comparison of the presented results with those of the state-of-the-art methods. Among the published studies, only [27,28,33,47,48,49,50] presented their detection performance on power line insulators using the same standard metric as used in this paper, i.e., Pascal score [51].
The well-known Pascal score [51] is used to evaluate the performance of the proposed transmission line components detector. The Pascal score is calculated by taking the Intersection-over-Union ( I o U ) of the detected bounding box B B d e t e c t e d and the ground-truth bounding box B B g t as:
I o U = P ( B B d e t e c t e d ,   B B g t ) = A r e a ( B B d e t e c t e d     B B g t ) A r e a ( B B d e t e c t e d     B B g t )
According to the criteria in [51], an object is considered correctly detected if P ( B B d e t e c t e d ,   B B g t ) t h I o U where t h I o U is typically set as 0.5. Based on this criterion, the results of CNN-based transmission line components detector are presented in Table 1, under two settings: (1) when YOLO V3 is used and (2) when multi-scaling is removed from YOLO V3 (proposed).
Table 1 also tabulates the statistics of the train and test dataset used to train the CNN-based transmission line components detector. It is also evident from Table 1 that the CNN-based transmission line components detector is robust against extreme scale and shape variations. Transmission-tower is the most difficult object in our dataset, as it appears in many different scales and orientations. However, the CNN-based detector shows reasonable detection performance for the transmission-tower class. Moreover, the CNN-based detector shows perfect detection results for balisor class, even with a very small number of training samples.
The performance comparison in Table 1 also shows that removing the multi-scaling from YOLO V3 improved the overall detection performance. The precisions and recalls are highly improved in the case of components of smaller sizes because the system is able to reject more false positive cluttered objects and its training is more focused on detecting these objects at a single scale.
Table 2 presents the comparison of the proposed transmission line components detection method with the published studies. In each of these studies listed in Table 2, the evaluation dataset is different in terms of number of test samples, resolution of images, evaluation metric, and hence they cannot be compared directly. However, the comparison shows that the proposed CNN-based embedded detector performs best among the similar studies. The term average precision in Table 2 refers to average of the precision at different values of recall, and can also be referred as the area under the Precision-Recall curve.

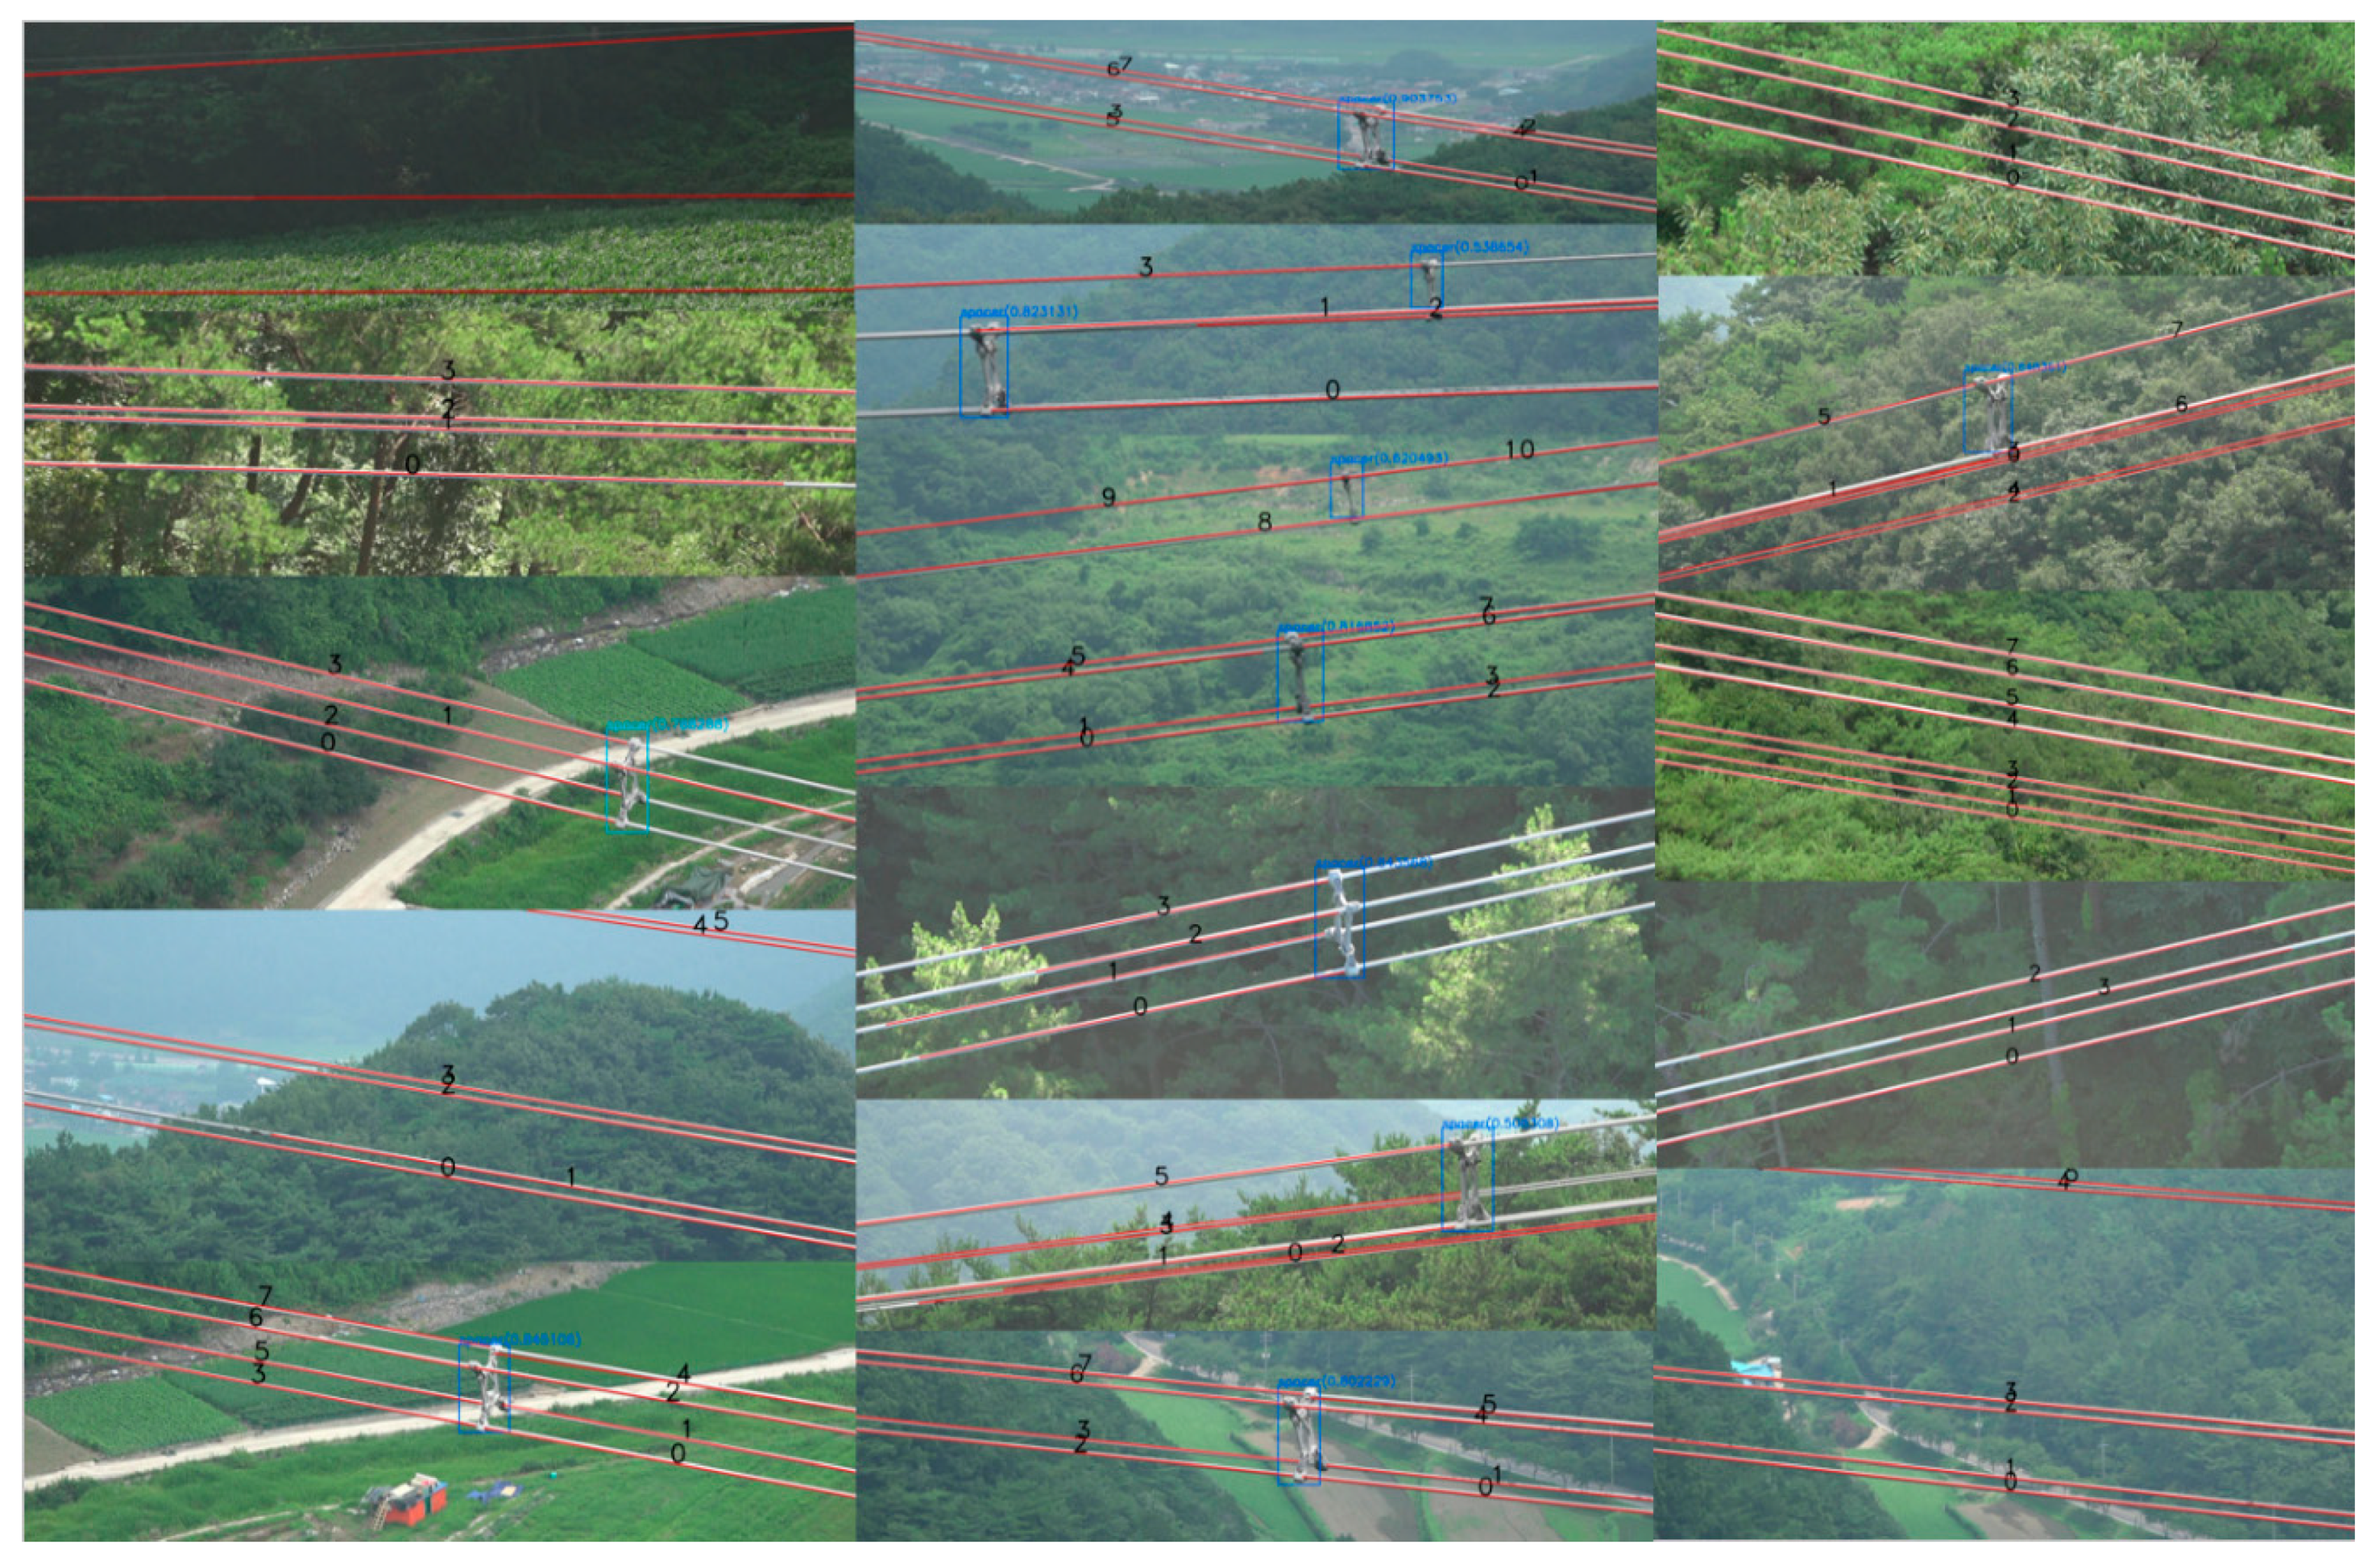
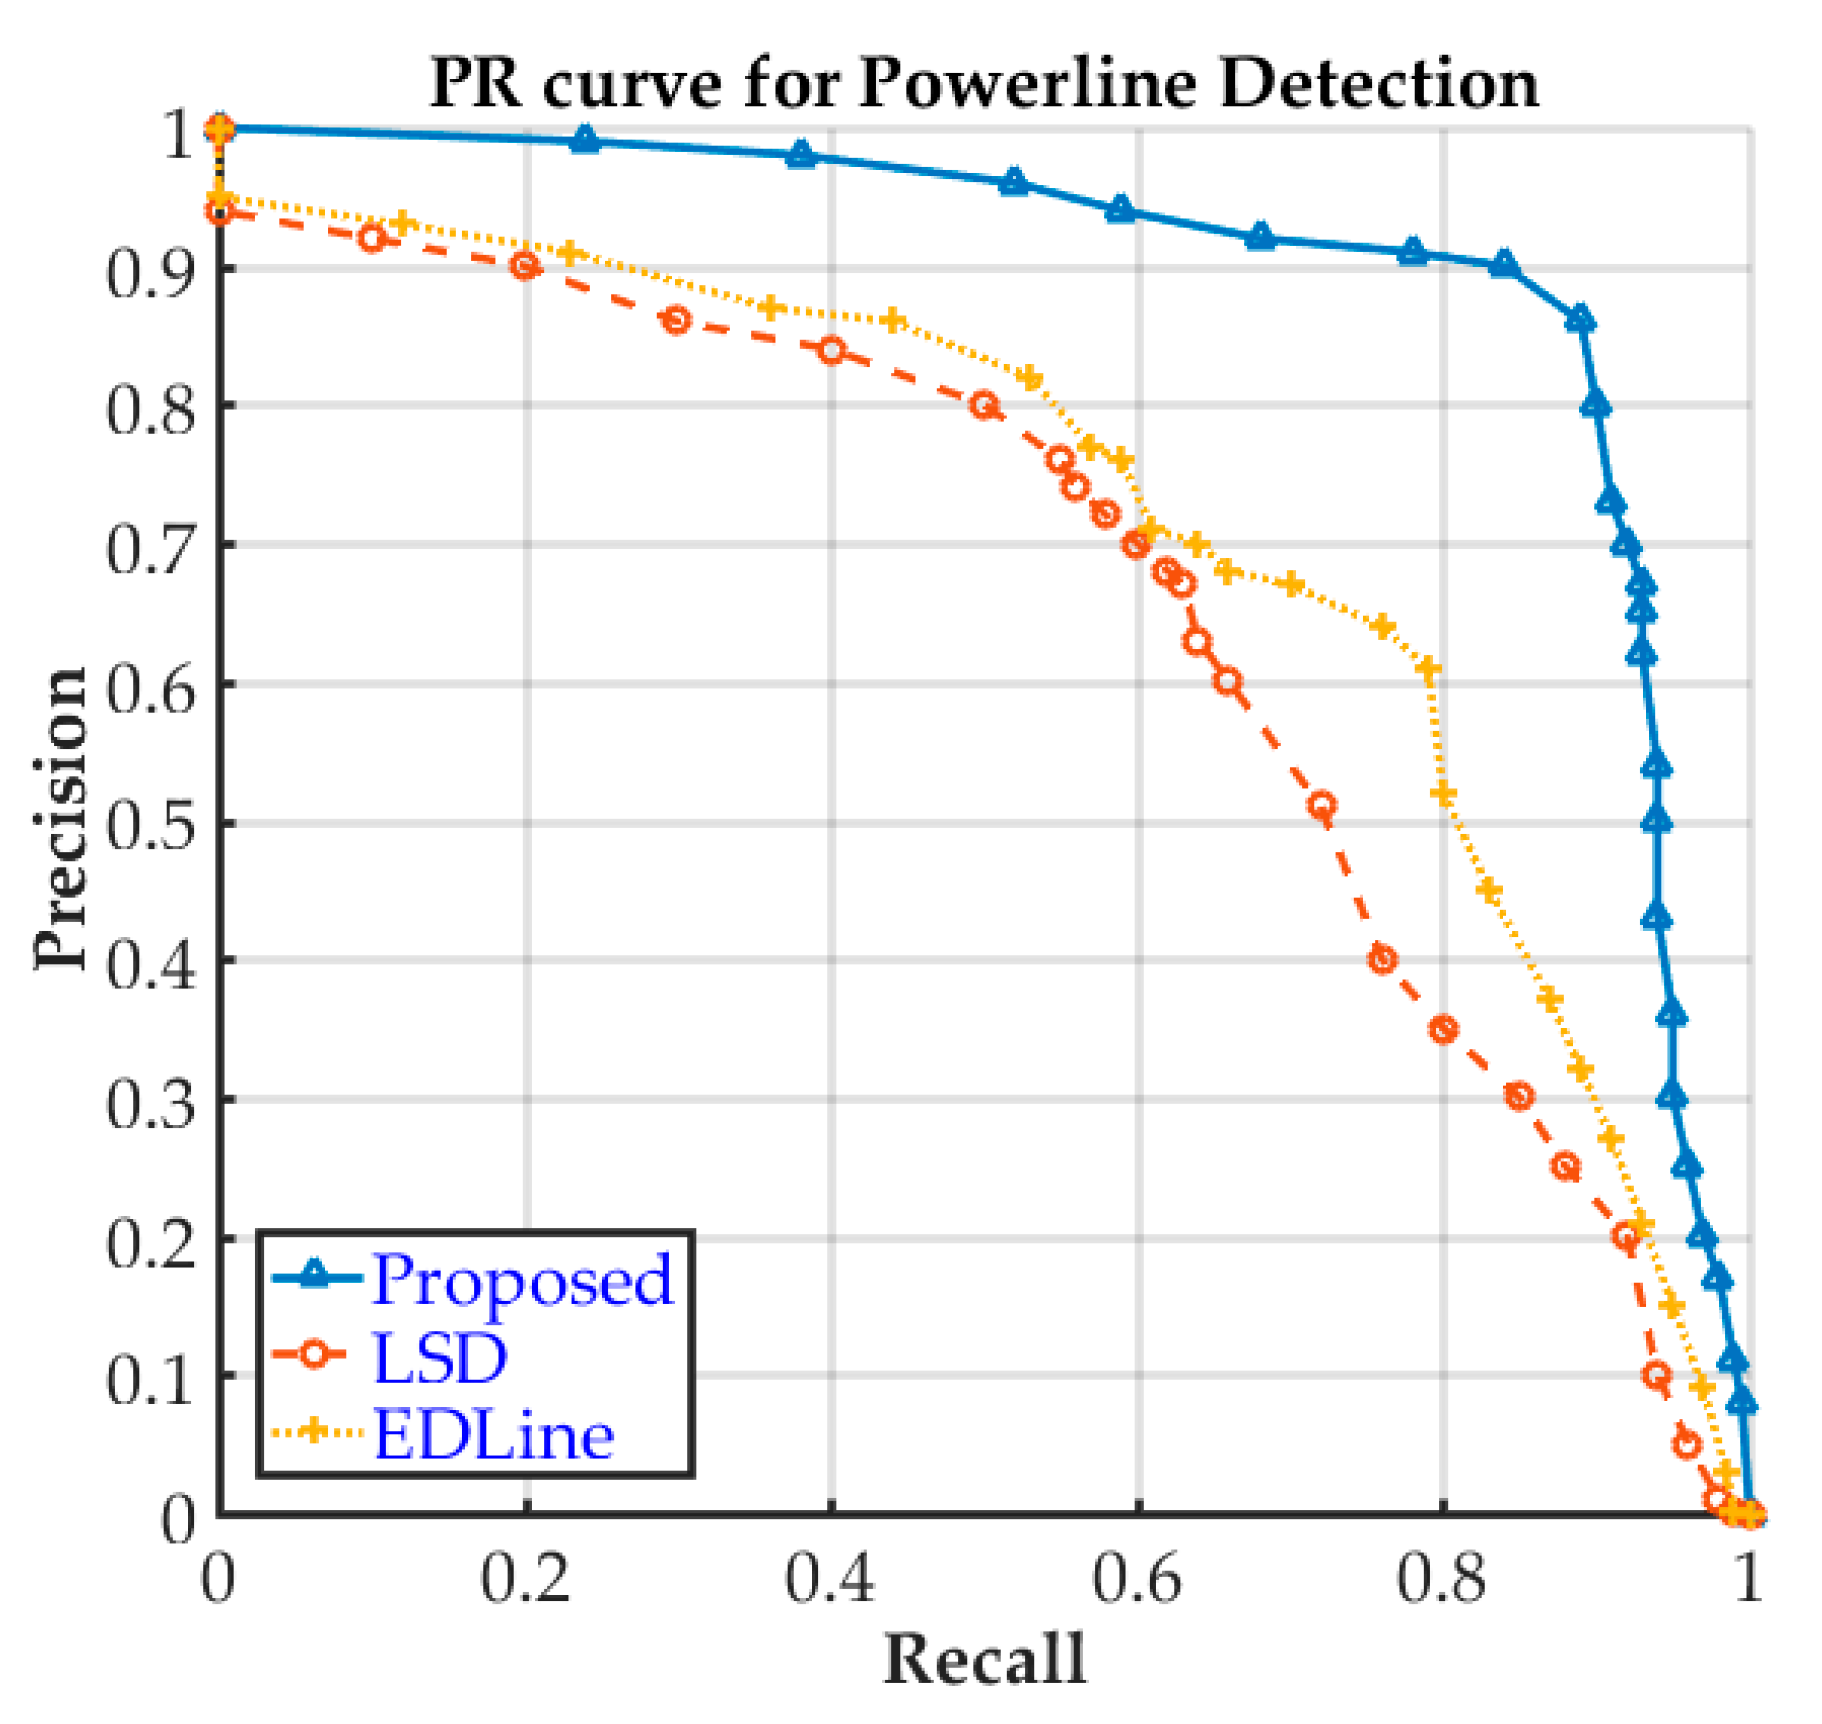
3.3. Power Line Detection

The proposed power line detection method is compared with the related work by computing the detection time and accuracy on the acquired dataset. The implementation of LSD in [53] and EDLines implementation in [54] is used for the comparison. For the purpose of evaluation, three videos of the power line inspection are annotated. For each power line, a two-pixel wide line connecting the endpoints of the power line is drawn in a given frame, and then a binary mask of the annotated image is saved as ground truth. The evaluation metric involves finding the intersection-over-union between the ground-truth line and the detected line, and if the overlap is above 50%, the line is considered as a true positive. Unlike the pascal score, where the IoU is computed using the area of the bounding boxes, here the area of the line is computed by its pixel count. The overlap is computed by counting the pixels on detected lines that are collinear to the ground truth line. The performance comparison of the proposed power line detection algorithm and two of the related state-of-the-art schemes is given in Table 3. It is evident that the proposed power line detector outperforms the state-of-the-art methods, in terms of accuracy and detection speed.
One of the reasons why EDLines and LSD show poor power line detection results on this dataset is that the power lines do not appear as straight lines, rather they appear a little curved due to the natural sag of the power lines, and hence the EDLines and LSD end up detecting them as multiple straight lines, resulting in the high recall at very low precision (precision–recall curve in Figure 13). The proposed scheme takes into account the natural sag of the power lines, and hence shows superior performance over the state-of-the-art schemes. For evaluating the detection speed, the EDLines, the LSD, and the proposed method is performed on image with a size of 1920 × 1080. The proposed algorithm is also fastest among the three methods because the proposed algorithm uses custom Sobel filters, which results in a relatively cleaner edge map than EDLines and LSD. Furthermore, the noise removal stage further reduces the search space for the proposed algorithm. Figure 14 shows the power line detection performance of the three schemes. LSD (first row: Figure 14) yields more false positives, and hence is the slowest of all. EDLines (second row: Figure 14) performs better than LSD, owing to better noisy-edge removal capability than that of LSD. However, EDLines also yields many false positives on transmission tower (second row, second column, Figure 14) as compared to the proposed scheme.

3.4. Defect Analysis

One of the reasons that a CNN-based solution for defect detection in transmission line components is not feasible is the difficulty in collecting a large number of faulty component images. Table 4 presents the defect detection results of balisor fading, rust in sag adjustors, splits detection in polymer insulators, and broken shed defects. The results of the proposed broken shed detection method are also compared with the state-of-the-art.
Broken shed defect detection is proposed in [49,50,55,56,57], out of which [49,50] presented CNN-based defect detection methods while [55,56,57] proposed handcrafted feature-based approaches. As shown in Table 4, the proposed method outperforms all the previous methods [49,50,55,56,57] in terms of detection speed, while it shows superior precision and recall over handcrafted feature-based approaches [50,56], and comparable precision and recall with CNN-based methods [49,50]. As compared to the proposed method, the CNN-based methods in [49,50] are very slow and also require 16 and 28 hours of training and a GPU, respectively. With no training required, the proposed method effectively closes the performance gap between handcrafted feature-based approaches and CNN-based methods. It can also be observed from Table 4, that the faster method in [49] which uses VGG-16 as base network not only shows poor performance but also is slower than the proposed approach.
As far as the overall performance of these defect analyzers is concerned, other than the splits defect analyzer, the three defect detection schemes show that there is good hope in the future development of these algorithms. The splits detection algorithm shows very low precision because the algorithm heavily depends upon the quality of edge detection. Noisy edges due to shadows, occluding objects, polymer surface deformations, diverse illumination conditions, and improper cap detections yield more false positives.
For better results, it is suggested that the inspection videos are captured at the time of the day when the illumination conditions are mild, such as between 8 a.m. to 11 a.m. and 1 p.m. to 5 p.m. (on a sunny day). At these times, the lighting conditions are neither harsh nor dark. On a cloudy day, the videos can be taken at any time of the day when the visibility is good. Although, the inspection drones are designed to fly in extreme weather conditions (e.g., heavy rain, snow, winds), the authors do not recommend the inspection videos are taken in such weather due to the chance for accidents.

4. Conclusions and Future Directions

In this paper, an automatic transmission line component detection and defect analysis system is proposed. The proposed system can detect nine different types of transmission line components from videos taken by a drone using an embedded CNN-based components detector. The detection performance of the modified YOLO V3 approach is shown to outperform the performance of the baseline model. The system can also detect electrical power line using the proposed power line detection algorithm. The proposed power line detection algorithm shows superior performance on the given dataset as compared with the LSD and EDlines methods, both in terms of speed and accuracy. Once the power line components are detected, a defect analysis system checks for potential defects. The performance of the proposed defect analyzers suggests that handcrafted, feature-based approaches can be used to detect some of the types of defects in situations where the availability of a large number of defect samples is not viable.
In order to support real-time operations, the proposed drone-based system is accelerated by an NVIDIA’s Jetson TX2 GPU and uses OpenCV, CUDA, and cudNN libraries along with Darknet’s CNN framework. The proposed system is tested on a large, unbiased, unconstrained evaluation dataset of transmission line components images.
The proposed automatic inspection system provides practical solutions to meet the major requirements of the modern electric transmission system. The feasibility of using a drone along with a robust real-time CNN-based object detector can eliminate the danger associated with the duties of electric workers physically climbing transmission towers on regular basis or use of expensive patrolling helicopters to inspect the conditions of transmission line components. The proposed defect analysis system can also help in reducing the time to identify the faulty components. The proposed balisor fading defect detector has a 100% recall rate which means it does not miss any faulty components, while the 76% precision rate means that only 24% of the detection can be a false alarm. Hence, even if the second round of inspection is required, the proposed inspection system can save up to 76% of the manual inspection work. Overall, the proposed inspection system not only offers ease of implementation and scalability but also gives an economical advantage over the manual inspection counterpart.
The system pipeline presented in this work provides a natural guide to future research, which includes pushing existing CNN models to learn different types of transmission line components at deeper levels and formalizing for the detection of additional types of defects. Future research will consider combining the detection module and the defect analysis module under a unified CNN architecture for improved overall performance. At present, the drone is operated by a human operator. Future modifications will also be made towards autonomous drone by developing a mechanism that efficiently establish a collaboration between the power line detection algorithm, transmission tower detection algorithm, collision avoidance sensors, and the directional actuators (rotter).

Author Contributions

Conceptualization, U.P. and Z.A.S.; methodology, U.P. and Z.A.S.; software, Z.A.S.; validation, Z.A.S. and U.P.; formal analysis, U.P.; investigation, U.P.; data curation, Z.A.S.; writing—original draft preparation, Z.A.S.; writing—review and editing, U.P.; supervision, U.P.; project administration, U.P.; funding acquisition, U.P. All authors have read and agreed to the published version of the manuscript

Funding

This research was supported by a grant (20PQWO-B153358-02) from the Smart Road Lighting Platform Development and Empirical Study on Test-bed Program, funded by Korean Ministry of the Interior and Safety.

Conflicts of Interest

The authors declare no conflict of interest.

References

  1. Mei, X.; Lu, T.; Wu, X.; Zhang, B. Insulator surface dirt image detection technology based on improved watershed algorithm. In Proceedings of the Asia-Pacific Power and Energy Engineering Conference, Shanghai, China, 27–29 March 2012. [Google Scholar] [CrossRef]
  2. Junfeng, L.; Min, L.; Qinruo, W. A Novel Insulator Detection Method for Aerial Images. In Proceedings of the 9th International Conference on Automation Engineering (ICCAE), Sydney, Australia, 18–21 February 2017. [Google Scholar] [CrossRef]
  3. Ali, Z.; Park, U. Real-time Safety Monitoring Vision System for Linemen in Buckets Using Spatio-temporal Inference. Int. J. Control. Autom. Syst. 2020, in press. [Google Scholar] [CrossRef]
  4. Occupational Safety and Health Administration (Fatality Inspection Data), United States Department of Labor Website. Available online: https://www.osha.gov/dep/fatcat/fy17_federal-state_summaries.csv (accessed on 11 June 2020).
  5. Siddiqui, Z.A.; Park, U.; Lee, S.-W.; Jung, N.-J.; Choi, M.; Lim, C.; Seo, J.-H. Robust Powerline Equipment Inspection System Based on a Convolutional Neural Network. Sensors 2018, 18, 3837. [Google Scholar] [CrossRef] [PubMed]
  6. Yang, T.W.; Yin, H.; Ruan, Q.Q.; Han, J.; Qi, J.T.; Yong, Q.; Wang, Z.T.; Sun, Z.Q. Overhead Power Line Detection from UAV Video Images. In Proceedings of the 19th International Conference on Mechatronics and Machine Vision in Practice (M2VIP), Auckland, New Zealand, 28–30 November 2012; Available online: https://ieeexplore.ieee.org/stamp/stamp.jsp?tp=&arnumber=6484570&isnumber=6484553 (accessed on 11 June 2020).
  7. Yetgin, O.E.; Senturk, Z.; Gerek, O.N. A comparison of line detection methods for power line avoidance in aircrafts. In Proceedings of the 2015 9th International Conference on Electrical and Electronics Engineering (ELECO), Bursa, Turkey, 26–28 November 2015. [Google Scholar] [CrossRef]
  8. Liu, Y.; Mejias, L.; Li, Z. Fast power line detection and localization using steerable filter for active uav guidance. ISPRS - Int. Arch. Photogramm. Remote. Sens. Spat. Inf. Sci. 2012, 491–496. [Google Scholar] [CrossRef]
  9. Correa, A.C.; Mondragon, I.F.; Ortiz, F.A.P. Towards visual based navigation with power line detection. In Advances in Visual Computing, ISVC 2014, Lecture Notes in Computer Science; Bebis, G., Boyle, R., Parvin, B., Koracin, D., McMahan, R., Jerald, J., Zhang, H., Drucker, S.M., Kambhamettu, C., Choubassi, M.E., et al., Eds.; Springer: Cham, Switzerland, 2014; Volume 8887, pp. 827–836. [Google Scholar] [CrossRef]
  10. Sampedro, C.; Martínez, C.; Chauhan, A.; Campoy, P. A supervised approach to electric tower detection and classification for power line inspection. In Proceedings of the 2014 International Joint Conference on Neural Networks (IJCNN), Beijing, China, 6–11 July 2014. [Google Scholar] [CrossRef]
  11. Han, B.; Wang, X. Learning for Tower Detection of Power Line Inspection. DEStech Trans. Comput. Sci. Eng. 2017. [Google Scholar] [CrossRef]
  12. Martínez, C.; Sampedro, C.; Chauhan, A.; Campoy, P. Towards autonomous detection and tracking of electric towers for aerial power line inspection. In Proceedings of the 2014 International Conference on Unmanned Aircraft Systems (ICUAS), Orlando, FL, USA, 27–30 May 2014. [Google Scholar] [CrossRef]
  13. Lin, J.; Han, J.; Chen, F. Defects Detection of Glass Insulator Based on Color Image. Power Syst. Technol. 2011, 35, 127–133. Available online: http://en.cnki.com.cn/Article_en/CJFDTOTAL-DWJS201101023.htm (accessed on 11 June 2020).
  14. Huang, X.; Zhang, Z. A method to extract insulator image from aerial image of helicopter patrol. Power Syst. Technol. 2010, 34, 194–197. Available online: http://en.cnki.com.cn/Article_en/CJFDTotal-DWJS201001038.htm (accessed on 11 June 2020).
  15. Li, W.; Ye, G.; Huang, F.; Wang, S.; Chang, W. Recognition of insulator based on developed MPEG-7 texture feature. In Proceedings of the IEEE 3rd Intern. Congress on Image and Signal Processing (ICISP), Yantai, China, 16–18 October 2010. [Google Scholar] [CrossRef]
  16. Zhang, X.; An, J.; Chen, F. A Simple Method of Tempered Glass Insulator Recognition from Airborne Image. In Proceedings of the 2010 International Conference on Optoelectronics and Image Processing (ICOIP), Haikou, China, 11–12 November 2010; Volume 1, pp. 127–130. [Google Scholar]
  17. Prasad, S.; Reddy, B.S. Digital image processing techniques for estimating power released from the corona discharges. IEEE Trans. Dielectr. Electr. Insul. 2017, 24, 75–82. [Google Scholar] [CrossRef]
  18. Han, Y.; Liu, Z.; Lee, D.-J.; Liu, W.; Chen, J.; Han, Z. Computer vision–based automatic rod-insulator defect detection in high-speed railway catenary system. Int. J. Adv. Robot. Syst. 2018, 15, 1–15. [Google Scholar] [CrossRef]
  19. Zhai, Y.; Cheng, H.; Chen, R.; Yang, Q.; Li, X. Multi-Saliency Aggregation-Based Approach for Insulator Flashover Fault Detection Using Aerial Images. Energies 2018, 11, 340. [Google Scholar] [CrossRef]
  20. Yu, Y.; Cao, H.; Wang, Z.; Li, Y.; Li, K.; Xie, S. Texture-and-Shape Based Active Contour Model for Insulator Segmentation. IEEE Access 2019, 7, 78706–78714. [Google Scholar] [CrossRef]
  21. Zhao, J.; Liu, X.; Sun, J.; Lei, L. Detecting insulators in the image of overhead transmission lines. In Intelligent Computing Technology, ICIC 2012, Lecture Notes in Computer Science; Huang, D.S., Jiang, C., Bevilacqua, V., Figueroa, J.C., Eds.; Springer: Berlin/Heidelberg, Germany, 2012; Volume 7389. [Google Scholar] [CrossRef]
  22. Liao, S.; An, J. A Robust Insulator Detection Algorithm Based on Local Features and Spatial Orders for Aerial Images. IEEE Geosci. Remote. Sens. Lett. 2015, 12, 963–967. [Google Scholar] [CrossRef]
  23. Zhai, Y.; Wu, Y.; Chen, H.; Zhao, X. A Method of Insulator Detection from Aerial Images. Sensors Transducers 2014, 177, 7–13. Available online: http://www.sensorsportal.com/HTML/DIGEST/august_2014/Vol_177/P_2159.pdf (accessed on 11 June 2020).
  24. Zuo, D.; Hu, H.; Qian, R.; Liu, Z. An insulator defect detection algorithm based on computer vision. In Proceedings of the 2017 IEEE International Conference on Information and Automation (ICIA), Macau, China, 18–20 July 2017. [Google Scholar] [CrossRef]
  25. Li, B.; Wu, D.; Cong, Y.; Xia, Y.; Tang, Y. A Method of Insulator Detection from Video Sequence. In Proceedings of the International Symposium on Information Science and Engineering (ISISE), Shanghai, China, 20–22 December 2012. [Google Scholar] [CrossRef]
  26. Wang, X.; Zhang, Y. Insulator identification from aerial images using Support Vector Machine with background suppression. In Proceedings of the 2016 International Conference on Unmanned Aircraft Systems (ICUAS), Arlington, VA, USA, 7–10 June 2016. [Google Scholar] [CrossRef]
  27. Jabid, T.; Uddin, Z. Rotation invariant power line insulator detection using local directional pattern and support vector machine. In Proceedings of the 2016 International Conference on Innovations in Science, Engineering and Technology (ICISET), Dhaka, Bangladesh, 28–29 October 2016. [Google Scholar] [CrossRef]
  28. Oberweger, M.; Wendel, A.; Bischof, H. Visual recognition and fault detection for power line insulators. In Proceedings of the 19th Computer Vision Winter Workshop, Krtiny, Czech Republic, 3–5 February 2014; Kukelov, Z., Heller, J., Eds.; Available online: http://cmp.felk.cvut.cz/cvww2014/papers/19/19.pdf (accessed on 11 June 2020).
  29. Redmon, J.; Farhadi, A. YOLO9000: Better, Faster, Stronger. In Proceedings of the IEEE Conference on Computer Vision and Pattern Recognition (CVPR), Honolulu, HI, USA, 21–26 July 2017. [Google Scholar] [CrossRef]
  30. Ren, S.; He, K.; Ross, G.; Sun, J. Faster R-CNN: Towards real-time object detection with region proposal networks. In Proceedings of the 28th International Conference on Neural Information Processing Systems – Volume 1, Montreal, ON, Canada, 7–12 December 2015. [Google Scholar] [CrossRef]
  31. Liu, W.; Anguelov, D.; Erhan, D.; Szegedy, C.; Reed, S.; Fu, C.-Y.; Berg, A.C. SSD: Single shot multibox detector. In Computer Vision - ECCV 2016, Lecture Notes in Computer Science; Leibe, B., Matas, J., Sebe, N., Welling, M., Eds.; Springer: Cham, Switzerland, 2016; Volume 9905, pp. 21–37. [Google Scholar]
  32. Razavian, A.S.; Azizpour, H.; Sullivan, J.; Carlsson, S. CNN features off-the-shelf: An astounding baseline for recognition. In Proceedings of the IEEE on Computer Vision and Pattern Recognition Workshops, Columbus, OH, USA, 23–28 June 2014. [Google Scholar] [CrossRef]
  33. Zhao, Z.; Zhen, Z.; Zhang, L.; Qi, Y.; Kong, Y.; Zhang, K. Insulator Detection Method in Inspection Image Based on Improved Faster R-CNN. Energies 2019, 12, 1204. [Google Scholar] [CrossRef]
  34. Alka, N.U.; Jiya, J.D.; Anenne, E.C.; Haruna, Y.S.; Hamid, M.A. An effective algorithm for power line detection from UAV images. Int. J. Adv. Res. Electr. Electron. Instrum. Eng. 2018, 7, 3607–3616. [Google Scholar]
  35. Von Gioi, R.; Jakubowicz, J.; Morel, J.-M.; Randall, G. LSD: A Fast Line Segment Detector with a False Detection Control. IEEE Trans. Pattern Anal. Mach. Intell. 2008, 32, 722–732. [Google Scholar] [CrossRef] [PubMed]
  36. Ma, Q.; Goshi, D.S.; Shih, Y.-C.; Sun, M.-T. An Algorithm for Power Line Detection and Warning Based on a Millimeter-Wave Radar Video. IEEE Trans. Image Process. 2011, 20, 3534–3543. [Google Scholar] [CrossRef]
  37. Lecuna, R.; Castro, P.; Manana, M.; Laso, A.; Domingo, R.; Arroyo, A.; Martinez, R. Non-contact temperature measurement method for dynamic rating of overhead power lines. Electr. Power Syst. Res. 2020, 185, 106392. [Google Scholar] [CrossRef]
  38. Phillips, A.J.; Engelbrecht, C.S.; Major, J.M.; Lynch, R.C. Leakage Current Sensor for Suspension Type Insulator. US Patent US20160018455A1, 27 December 2012. [Google Scholar]
  39. Wydra, M.; Kacejko, P. Power system state estimation using wire temperature measurements for model accuracy enhancement. In Proceedings of the IEEE PES Innovative Smart Grid Technologies Conference Europe (ISGT-Europe), Ljubljana, Slovenia, 9–12 October 2016. [Google Scholar] [CrossRef]
  40. Qin, X.; Wu, G.; Lei, J.; Fan, F.; Ye, X.; Mei, Q. A Novel Method of Autonomous Inspection for Transmission Line based on Cable Inspection Robot LiDAR Data. Sensors 2018, 18, 596. [Google Scholar] [CrossRef]
  41. Qin, X.; Wu, G.; Lei, J.; Fan, F.; Ye, X. Detecting Inspection Objects of Power Line from Cable Inspection Robot LiDAR Data. Sensors 2018, 18, 1284. [Google Scholar] [CrossRef]
  42. Redmon, J. Darknet: Open Source Neural Networks in C. Available online: http://pjreddie.com/darknet/ (accessed on 30 May 2020).
  43. Electric Power Research Institute. Field Guide: Visual Inspection of Polymer Insulators. EPRI 2014. Available online: https://www.epri.com/#/pages/product/3002003720/ (accessed on 11 June 2020).
  44. Rosli, H.; Othman, N.A.; Jamail, N.A.M.; Ismail, M.N. Potential and Electric Field Characteristics of Broken Porcelain Insulator. Int. J. Electr. Comput. Eng. (IJECE) 2017, 7, 3114. [Google Scholar] [CrossRef]
  45. HAVAD Industrial Limited (Warning Sphere). Available online: https://www.warningspheres.com/pdf/warning-sphere.pdf (accessed on 30 May 2020).
  46. Dolan, S.E.; Ziehm, M.W.; Kuhns, E.C.; Lombardo, M.J.R. Electroceramic Coating of a Wire for Use in a Bundled Power Transmission Cable. US Patent US9953747B2, 6 February 2017. [Google Scholar]
  47. Liu, X.; Jiang, H.; Chen, J.; Chen, J.; Zhuang, S.; Miao, X. Insulator detection in aerial images based on faster regions with convolutional neural network. In Proceedings of the 2018 IEEE 14th International Conference on Control and Automation (ICCA), Anchorage, AK, USA, 12–15 June 2018. [Google Scholar] [CrossRef]
  48. Miao, X.; Liu, X.; Chen, J.; Zhuang, S.; Fan, J.; Jiang, H. Insulator Detection in Aerial Images for Transmission Line Inspection Using Single Shot Multibox Detector. IEEE Access 2019, 7, 9945–9956. [Google Scholar] [CrossRef]
  49. Tao, X.; Zhang, D.; Wang, Z.; Liu, X.; Zhang, H.; Xu, D. Detection of Power Line Insulator Defects Using Aerial Images Analyzed With Convolutional Neural Networks. IEEE Trans. Syst. Man, Cybern. Syst. 2020, 50, 1486–1498. [Google Scholar] [CrossRef]
  50. Han, J.; Yang, Z.; Zhang, Q.; Chen, C.; Li, H.; Lai, S.; Hu, G.; Xu, C.; Xu, H.; Wang, D.; et al. A Method of Insulator Faults Detection in Aerial Images for High-Voltage Transmission Lines Inspection. Appl. Sci. 2019, 9, 2009. [Google Scholar] [CrossRef]
  51. Everingham, M.; Van Gool, L.; Williams, C.K.I.; Winn, J.; Zisserman, A. The Pascal Visual Object Classes (VOC) Challenge. Int. J. Comput. Vis. 2009, 88, 303–338. [Google Scholar] [CrossRef]
  52. Wu, Q.; An, J. An Active Contour Model Based on Texture Distribution for Extracting Inhomogeneous Insulators from Aerial Images. IEEE Trans. Geosci. Remote. Sens. 2013, 52, 3613–3626. [Google Scholar] [CrossRef]
  53. Github. Available online: https://github.com/primetang/LSD-OpenCV-MATLAB (accessed on 3 March 2020).
  54. Github. Available online: https://github.com/mtamburrano/LBD_Descriptor/blob/master/EDLineDetector.cpp (accessed on 3 March 2020).
  55. Zhai, Y.; Zhang, M.; Guo, F.; Wang, D.; Wang, J. Fault detection of insulator based on saliency and adaptive morphology. Multimedia Tools Appl. 2016, 76, 12051–12064. [Google Scholar] [CrossRef]
  56. Zhai, Y.; Chen, R.; Yang, Q.; Li, X.; Zhao, Z. Insulator Fault Detection Based on Spatial Morphological Features of Aerial Images. IEEE Access 2018, 6, 35316–35326. [Google Scholar] [CrossRef]
  57. Cheng, H.; Zhai, Y.; Chen, R.; Wang, D.; Dong, Z.; Wang, Y. Self-Shattering Defect Detection of Glass Insulators Based on Spatial Features. Energies 2019, 12, 543. [Google Scholar] [CrossRef]
Figure 1. Example images of various types of transmission line components that can be detected by the proposed system. (a) Transmission tower; (b) lightning arrester (LA); (c) suspension-type—white porcelain insulator; (d) suspension type red porcelain insulator; (e) polymer insulator; (f) spacer; (g) sag adjuster with bolted tension clamp; (h) vibration damper; and (i) balisor.
Energies 13 03348 g001
Figure 2. Overall system diagram.
Energies 13 03348 g002
Figure 3. Detection results of the different types of electrical components, (a,b) PorSTI-W and damper weights, (c,d) PorSTI-R and PolSTI, (e) spacer, (f) balisor, (g) LA and PorSTI-W, (h) sag adjusters and PorSTI-R, and (i,j) transmission towers, by the trained transmission line components detector. Each component appears with a random orientation, view point, lighting conditions, shapes, colors, and scales, yet it is detected by the CNN-based detector robustly.
Energies 13 03348 g003
Figure 4. (a) Aerial view of the transmission tower with power line. (b) The edge equivalent is very noisy due to the presence of trees and cluttered objects in the background. (c) The use of custom shaped Sobel kernel helps in removing the noise. (d) Imaginary straight blue line connecting the endpoints of the power line (red) having a sag. Green curve shows the root mean square error (RMSE) values computed between the straight line and the power line.
Energies 13 03348 g004
Figure 5. Power line detection results. The proposed power line detection algorithm shows robustness against cluttered background and different lighting conditions Detected power lines are marked in red and labelled with ID numbers.
Energies 13 03348 g005
Figure 6. Steps of the broken shed detection. (a) Detected insulator image from CNN-based detector, (b) output of color clustering based segmentation, (ce) segmentation masks of the three clusters, (f) candidate template after connected component analysis and max voting for finding most repeating pattern, (g) activation map of the template matching, (h) results of template matching, (i) fitting the centers of the template matching result to a straight line, and (j) final detected defect.
Energies 13 03348 g006
Figure 7. Steps to detect defects in balisor. (a) Input image after detection using CNN, (b) after eroding, (c) color clustering, (d) foreground mask after cluster selection and region filling, (e) masked foreground, (f) balisor image in red and saturation color space, (g) after filtering (f), (h) after removing noise from (g), (i) combination of red and saturation space outputs in (h), (j) mask for boundary regions, (k) removing boundary regions, (l) marking the defect regions.
Energies 13 03348 g007
Figure 8. Schematic of the corrosion detection algorithm.
Energies 13 03348 g008
Figure 9. Schematic of the broken power line detection algorithm.
Energies 13 03348 g009
Figure 10. Schematic of the broken vibration damper detection algorithm.
Energies 13 03348 g010
Figure 11. Ellipse detection results on different types of insulators. Ellipses with the highest detection confidence are numbered in ascending order, represented with red color.
Energies 13 03348 g011
Figure 12. The process of splits detection in polymer insulator. (a) The input image, (b) ellipse detection result, (c) one of the segmented cap, (d) edge map, (e) edge map after boundary removal, and (f) splits detection result.
Energies 13 03348 g012
Figure 13. PR-curve for power line detection shows superior performance in the proposed power line detection scheme.
Energies 13 03348 g013
Figure 14. Example power line detection results. First row: LSD, second row: EDLines, and third row: proposed scheme.
Energies 13 03348 g014
Table 1. Summary of performances of the real-time CNN-based detector embedded on Jetson TX2.
Components Type YOLO V3YOLO V3 (Multi-Scaling Removed)
#Train Samples#Test SamplesTotal #SamplesPrecision (%)Recall (%)Precision (%)Recall (%)
Transmission-tower40021458546080.8684.0381.8185.46
Spacer2692464315678.8786.9381.992.96
Balisor31682398100.00100.00100.00100.00
Lightning-arrester2982454343683.9189.4284.9390.75
PorSTI-W+PorSTI-R7404990839491.8797.0793.4297.47
Insulator (polymer)8004884892.2395.3693.3596.21
Damper-weight4088352444077.1975.0079.8381.45
Sag adjuster1830334216471.8586.6475.4587.2
Avg.24,114418228,29684.6089.3186.3491.44
Table 2. Comparison of proposed CNN-based detector with the state-of-the-art insulator detectors.
MethodEvaluation Dataset SizeRecall (%)Precision (%)Avg. Precision (%)
Wu and An [52]5086.4785.5986.03
Liao and An [22]10091.0087.0089.00
Oberweger et al. [28]37598.0033.0065.50
Jabid [27]50094.2489.5491.89
Zhao et al. [33]38075.0085.0080.00
Liu et al. [47]50087.5394.4090.96
Miao et al. [48]20090.0093.7591.87
Tao et al. [49]38596.6090.4093.50
Han et al. [50]135687.3689.9688.66
Proposed99097.4793.4295.45
Table 3. Performance comparison between proposed power line detection algorithm and state-of-the-art schemes.
MethodPrecision @ 80% RecallSpeed (ms)
EDLines [7]52.3378.25
LSD [35]35.12415.00
Proposed90.5630.21
Table 4. Summary of the performance of the defect detection schemes.
Method# of Test SamplesPrecision (%)Recall (%)Processing Time (s)Training Time and GPU
Broken shedResNet [49]6091.0095.800.14916 h on GTX-1080
VGG-16 [49]41.5062.900.080
[50]9091.7095.000.12728 h on Titan X
[55]9067.2043.570.525Not required
[56]9077.7752.100.667Not required
[57]6792.5492.870.580Not required
proposed7587.5093.330.065Not required
Balisor fadingProposed7576.19100.000.102Not required
Rust in sag adjustersproposed7670.2792.310.073Not required
Splits in PolSTIproposed54738.8493.750.153Not required

