The Influence of Luminaire Photometric Intensity Curve Measurements Quality on Road Lighting Design Parameters


Abstract
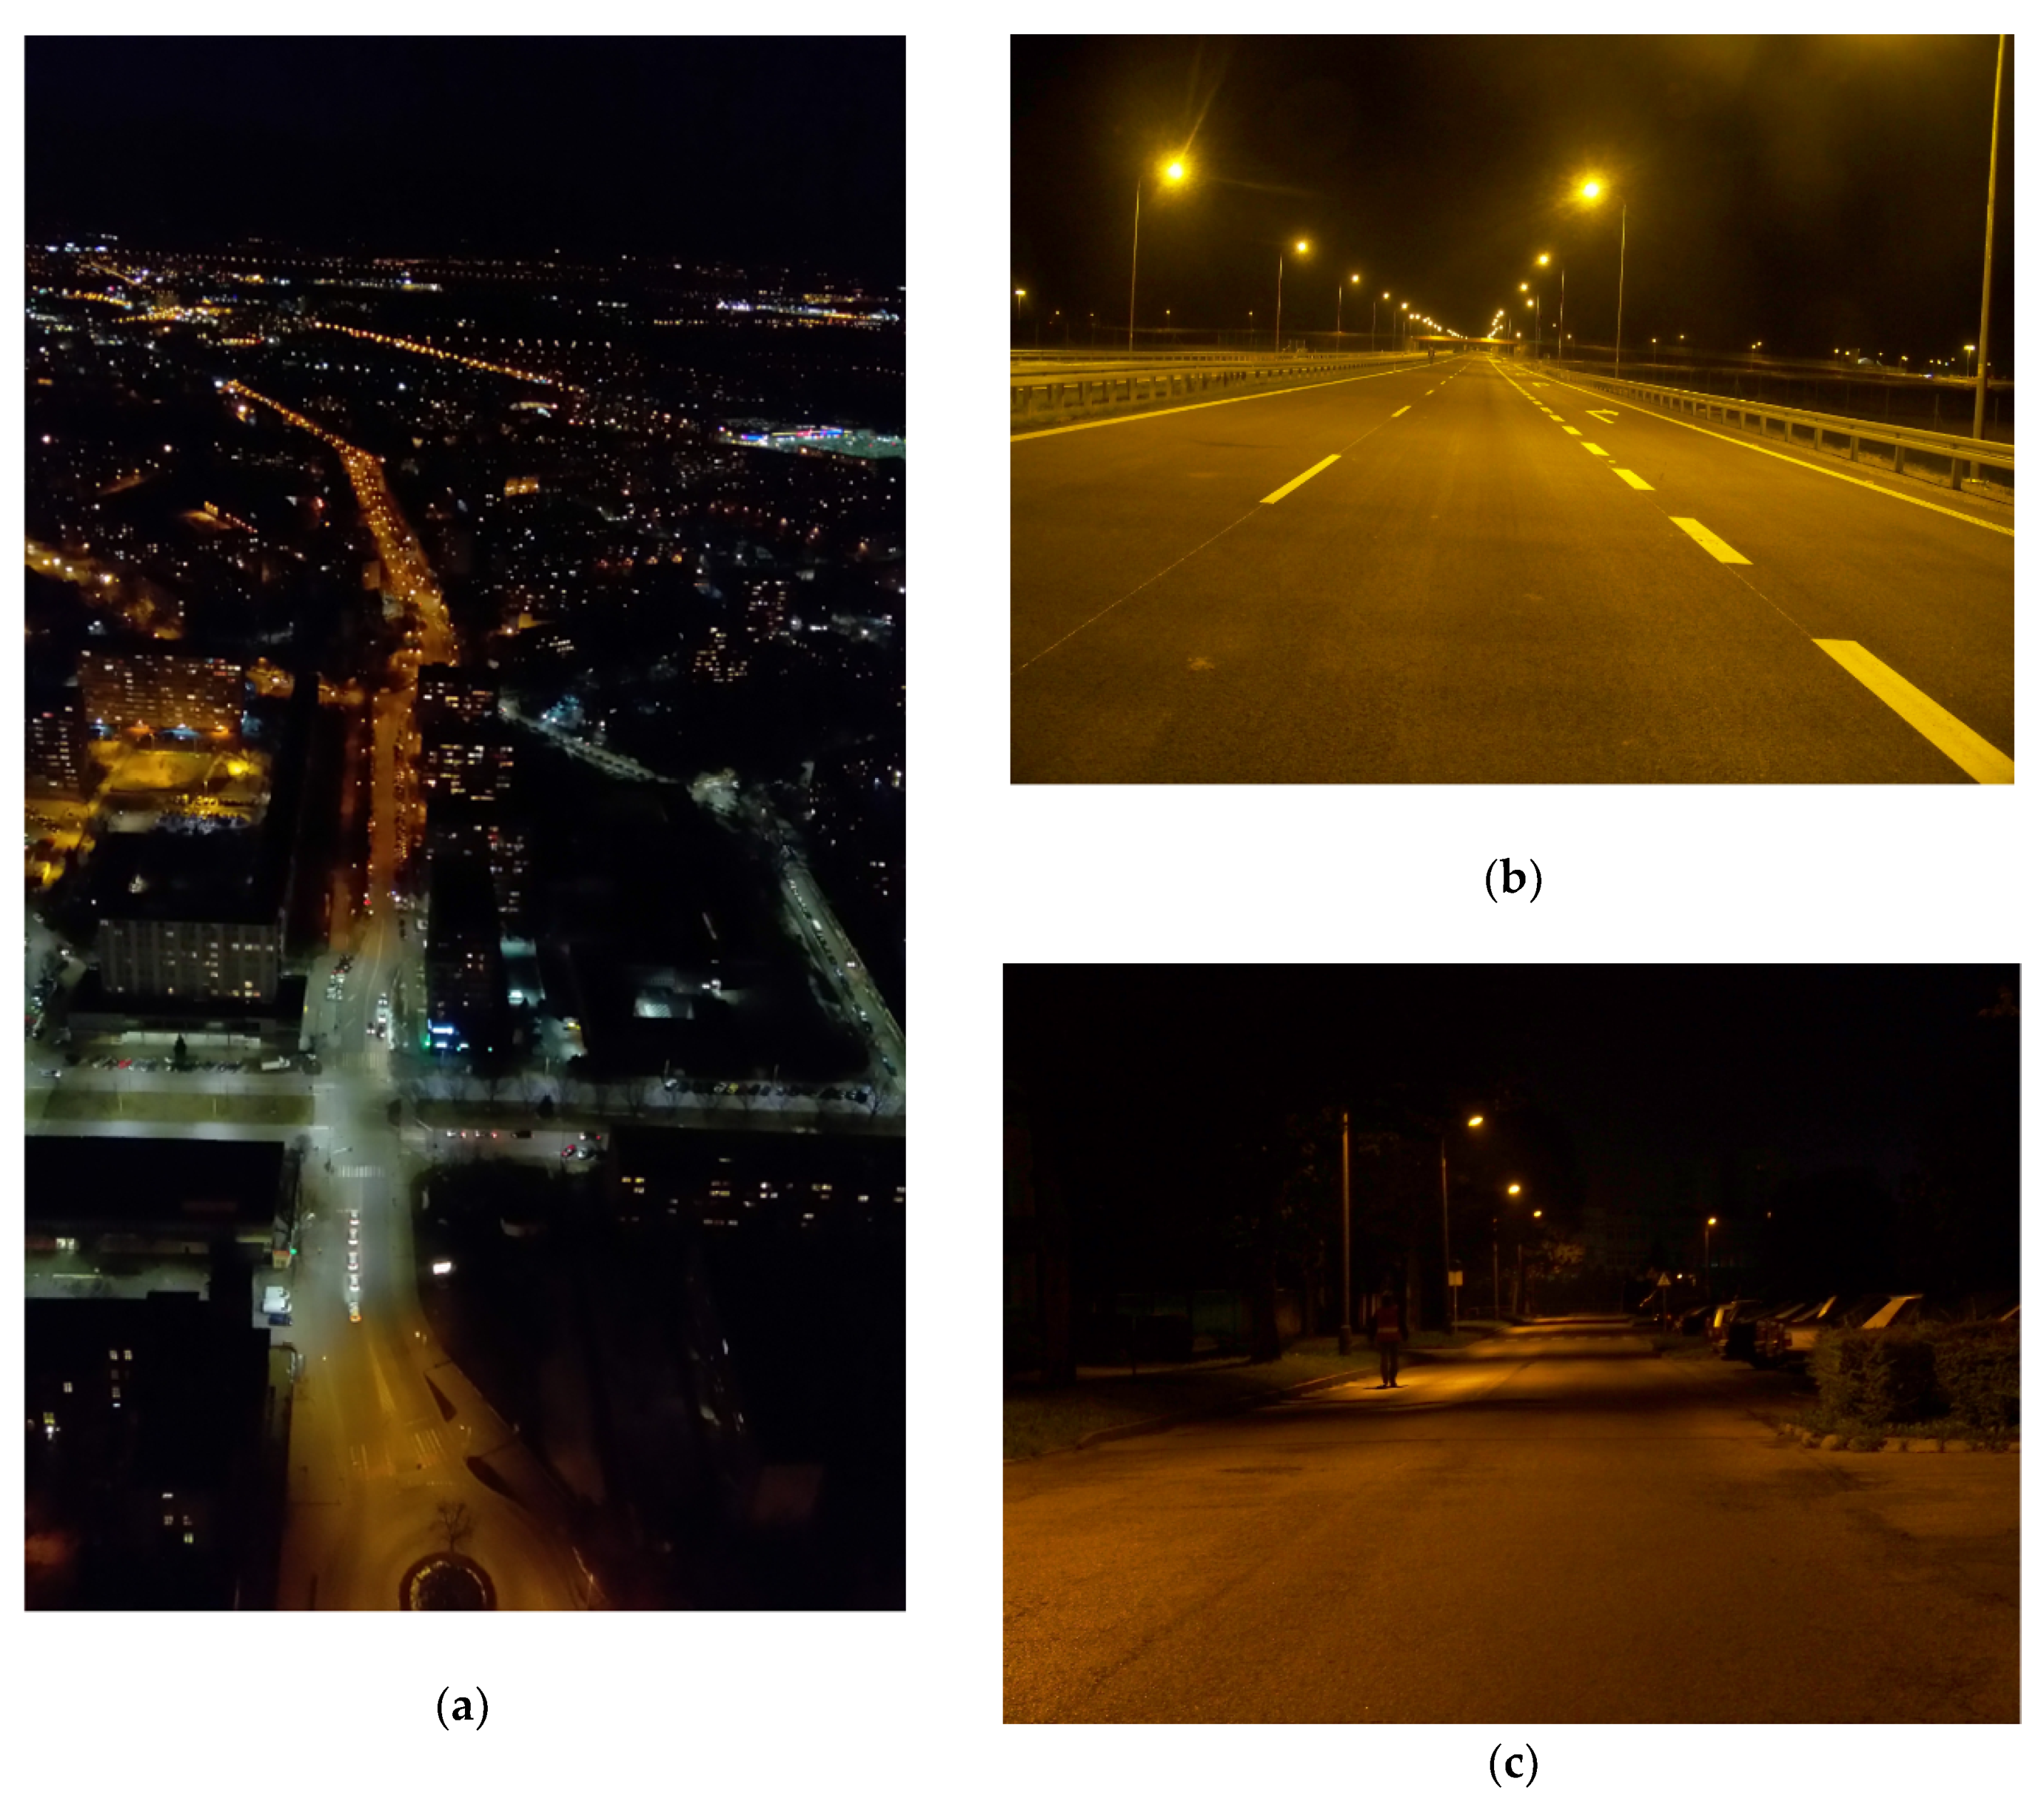
1. Introduction
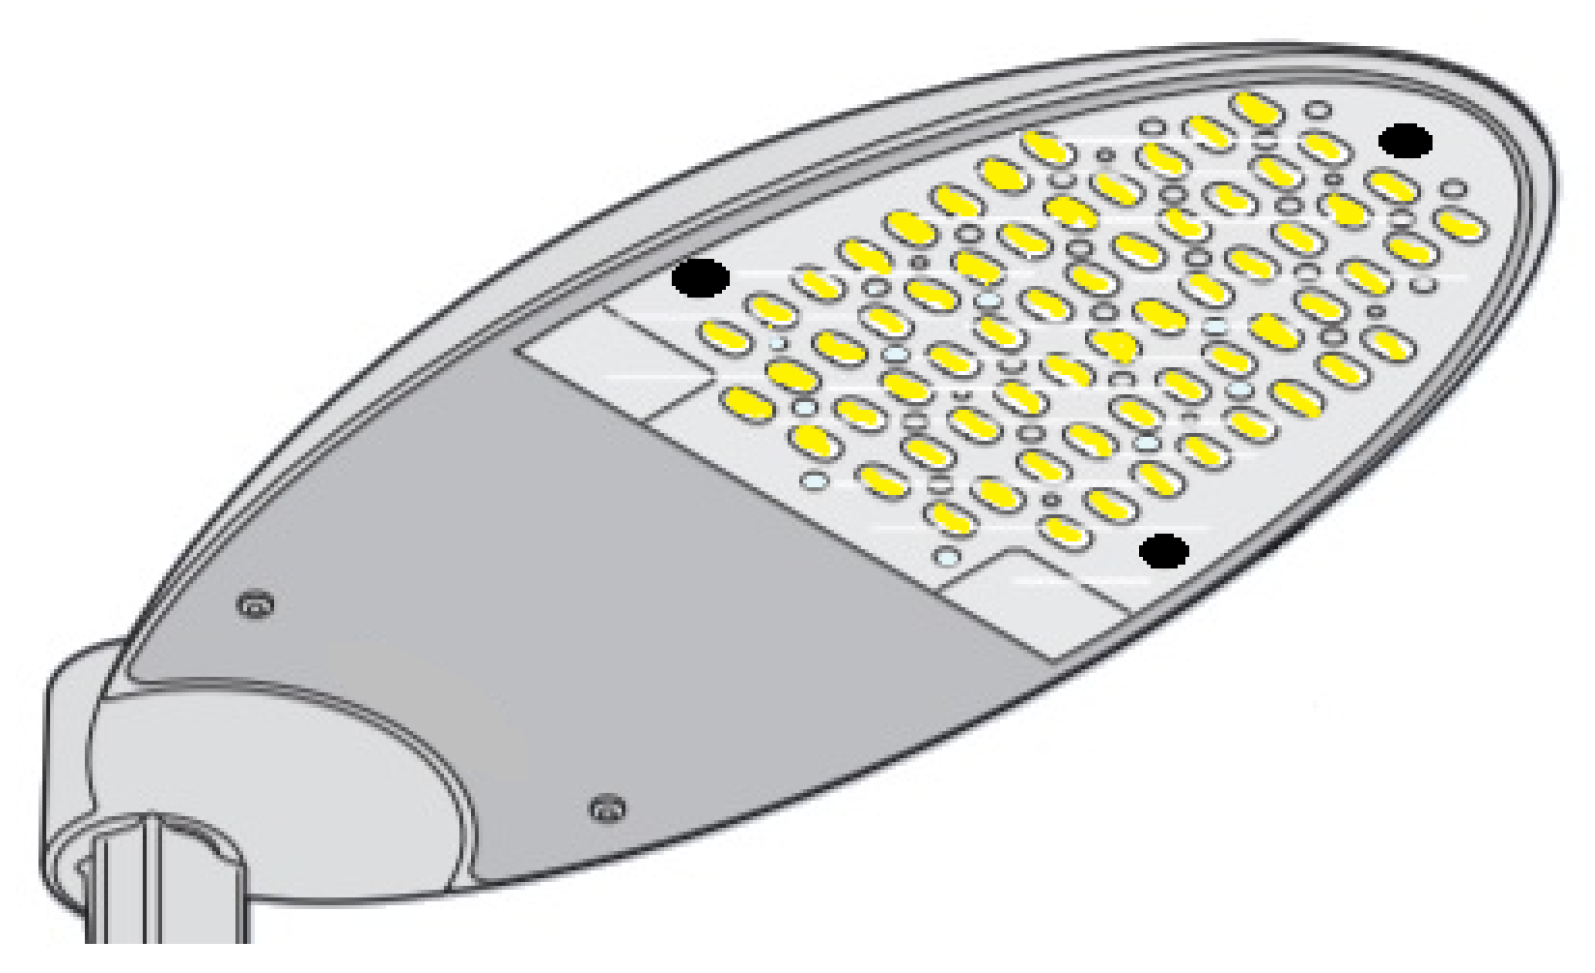
2. Materials and Methods
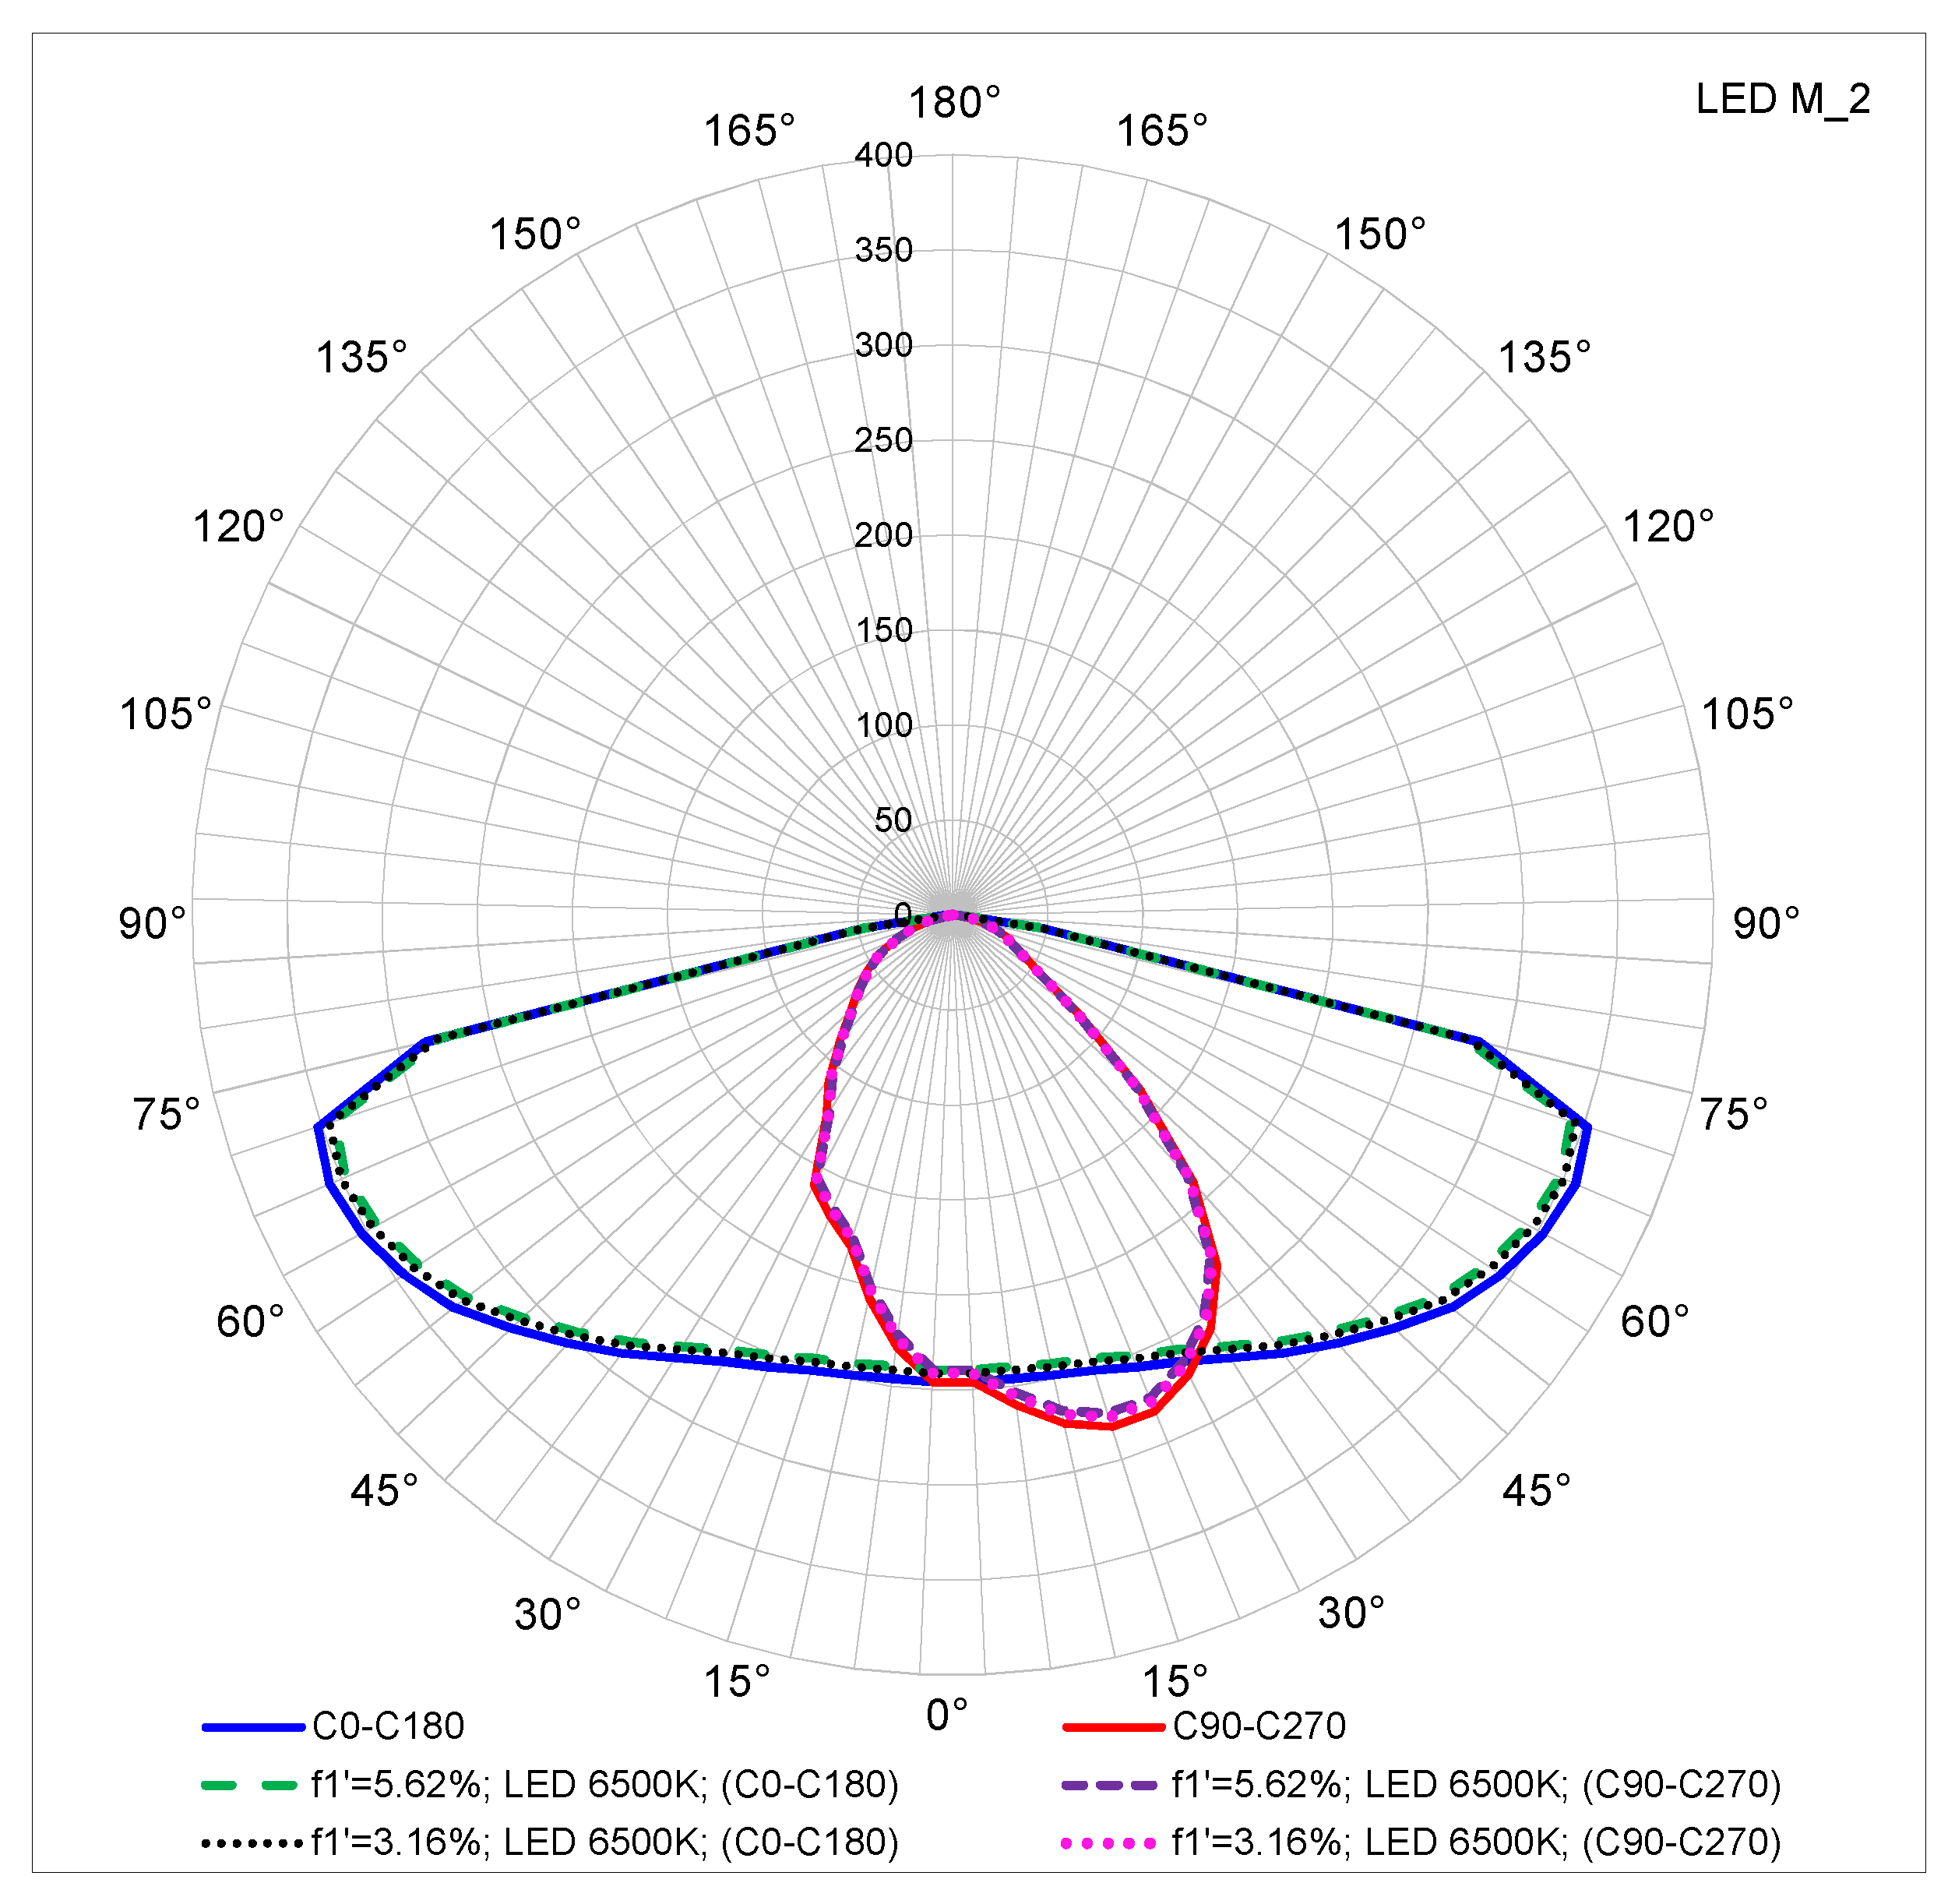
3. Results
4. Discussion
5. Conclusions
Author Contributions
Funding
Acknowledgments
Conflicts of Interest
References
- Güler, Ö.; Onaygil, S. The effect of luminance uniformity on visibility level in road lighting. Lighting Res. Tech. 2003, 35, 199–213. [Google Scholar] [CrossRef]
- AbouElhamd, A.R.; Saraiji, R.A. Contrast Based Calculation Method for Roadway Lighting. Leukos 2018, 14, 193–211. [Google Scholar] [CrossRef]
- Technical Report CIE 031:1976. Glare and Uniformity in Road Lighting Installations; CIE: Vienna, Austria, 1976. [Google Scholar]
- Lin, Y.; Liu, Y.; Sun, Y.; Zhu, X.; Lai, J.; Heynderickx, I. Model predicting discomfort glare caused by LED road lights. Opt. Express 2014, 22, 18056–18071. [Google Scholar] [CrossRef] [PubMed]
- Schmidt-Clausen, H.J.; Bindels, J.T.H. Assessment of discomfort glare in motor vehicle lighting. Lighting Res. Tech. 1974, 6, 79–88. [Google Scholar] [CrossRef]
- Fotios, S.; Unwin, J.; Farrall, S. Road lighting and pedestrian reassurance after dark: A review. Lighting Res. Tech. 2015, 47, 449–469. [Google Scholar] [CrossRef]
- Eloholma, M.; Ketomaki, J.; Orrevetelainen, P.; Halonen, L. Pedestrian Visibility in Road; Lighting Conditions. In Proceedings of the Illuminat 2003, 2nd International Lighting Conference, Cluj-Napoca, Romania, 26–28 September 2016. [Google Scholar]
- Uttley, J.; Fotios, S. The effect of ambient light condition on road traffic collisions involving pedestrians on pedestrian crossings. Accid. Anal. Prev. 2017, 108, 189–200. [Google Scholar] [CrossRef]
- Wanvik, P.O. Effects of road lighting: An analysis based on Dutch accident statistics 1987–2006. Accid. Anal. Prev. 2009, 41, 123–128. [Google Scholar] [CrossRef]
- Technical Report CIE 115-2010. Lighting of Roads for Motor and Pedestrian Traffic; CIE: Vienna, Austria, 2010. [Google Scholar]
- Standard EN-13201:2015. Road Lighting; CEN: Bruxelles, Belgium, 2015. [Google Scholar]
- Standard ANSI/IESNA RP-8-00. Roadway Lighting; Illuminating Engineering Society of North America: New York, NY, USA, 2000. [Google Scholar]
- Technical Report CIE 150-2017. Guide on the Limitation of the Effects of Obtrusive Light from Outdoor Lighting Installations; CIE: Vienna, Austria, 2017. [Google Scholar]
- Czyżewski, D. Monitoring of the lighting conditions of a street illuminated with road lights equipped with LEDs. Prz. Elektrotech. 2010, 86, 170–172. [Google Scholar]
- Ylinen, A.M.; Tähkämö, L.; Puolakka, M.; Halonen, L. Road Lighting Quality, Energy Efficiency, and Mesopic Design–LED Street Lighting Case Study. Leukos 2011, 8, 9–24. [Google Scholar] [CrossRef]
- Jägerbrand, A.K. Synergies and Trade-Offs Between Sustainable Development and Energy Performance of Exterior Lighting. Energies 2020, 13, 2245. [Google Scholar] [CrossRef]
- Green Paper. Lighting the Future Accelerating the Deployment of Innovative Lighting Technologies; European Commission: Brussels, Belgium, 2015. [Google Scholar]
- Boyce, P.R.; Fotios, S.; Richards, M. Road lighting and energy saving. Lighting Res. Tech. 2009, 41, 245–260. [Google Scholar] [CrossRef]
- Peña-García, A. Towards Total Lighting: Expanding the Frontiers of Sustainable Development. Sustainability 2019, 11, 6943. [Google Scholar] [CrossRef]
- Jägerbrand, A.K. LED (Light-Emitting Diode) Road Lighting in Practice: An Evaluation of Compliance with Regulations and Improvements for Further Energy Savings. Energies 2016, 9, 357. [Google Scholar] [CrossRef]
- Commission Regulation (EC) No 245/2009; 24.3.2009, L 76/17; Official Journal of the European Union: Brussels, Belgium, 2009.
- Lewin, I.; Box, P.; Start, R. An Economic Study of Three Light Sources for Roadway Lighting. Leukos 2005, 1, 73–80. [Google Scholar] [CrossRef]
- Li, F.; Chen, Y.; Liu, Y.; Chen, D. Comparative in Situ Study of LEDs and HPS in Road Lighting. Leukos 2012, 8, 205–214. [Google Scholar] [CrossRef]
- Tetri, E.; Chenani, S.B.; Räsänen, R.-S.; Baumgartner, H.; Vaaja, M.; Sierla, S.; Tähkämö, L.; Virtanen, J.-P.; Kurkela, M.; Ikonen, E.; et al. Tutorial: Road Lighting for Efficient and Safe Traffic Environments. Leukos 2017, 13, 223–241. [Google Scholar] [CrossRef]
- Czyżewski, D. Luminance distribution of LED luminous surface. Prz. Elektrotech. 2009, 86, 166–169. [Google Scholar]
- Czyżewski, D. Comparison of luminance distribution on the lighting surface of power LEDs. Photonics Lett. Pol. 2019, 11, 118–120. [Google Scholar] [CrossRef]
- Davidovic, M.; Djokic, L.; Cabarkapa, A.; Kostic, M. Warm white versus neutral white LED street lighting: Pedestrians’ impressions. Lighting Res. Tech. 2019, 51, 1237–1248. [Google Scholar] [CrossRef]
- Fryc, I.; Tabaka, P. Outdoor Areas Lighting with LEDs–the Competition Between Scotopic Efficacy and Light Pollution. Photonics Lett. Pol. 2019, 11, 75–77. [Google Scholar] [CrossRef]
- Czyżewski, D. The street lighting luminaires with LEDs. Prz. Elektrotech. 2009, 85, 283–288. [Google Scholar]
- Ge, A.; Shu, H.; Chen, D.; Cai, J.; Chen, J.; Zhu, L. Optical design of a road lighting luminaire using a chip-on-board LED array. Lighting Res. Tech. 2017, 49, 651–657. [Google Scholar] [CrossRef]
- Nelson, M.A.; Anderson, B.P.; Cai, H. Selection Methods and Procedure for Evaluation of LED Roadway Luminaires. Leukos 2017, 13, 159–175. [Google Scholar] [CrossRef]
- Güler, Ö. Determination of necessary criteria for calculations of road lighting based on visibility level. PhD Thesis, Istanbul Technical University, Istanbul, Turkey, 2001. [Google Scholar]
- Pachamanov, A.; Pachamanova, D. Optimization of the light distribution of luminaries for tunnel and street lighting. Engin. Opt. 2008, 40, 47–65. [Google Scholar] [CrossRef]
- Lai, W.; Chen, W.M.; Liu, X.M.; Lei, X.H. Optimal design of light distribution of LED luminaries for road lighting. SPIE 2011, 8123, 81231P. [Google Scholar]
- Technical Report CIE 121-1996. The Photometry & Goniophotometry of Luminaires; CIE: Vienna, Austria, 1996. [Google Scholar]
- Standard CEN-EN 13032-2:2017. Light and Lighting-Measurement and Presentation of Photometric Data of Lamps and Luminaires–Part 2: Presentation of Data for Indoor and Outdoor Work Places; European Committee for Standardization (CEN): Brussels, Belgium, 2017. [Google Scholar]
- Gassmann, F.; Krueger, U.; Bergen, T.; Schmidt, F. Comparison of luminous intensity distributions. Lighting Res. Tech. 2017, 49, 62–83. [Google Scholar] [CrossRef]
- Thorseth, A.; Lindén, J.; Dam-Hansen, C. A Comparison of Goniophotometric Measurement Facilities. In Proceedings of the CIE 2016 “Lighting Quality and Energy Efficiency”, CIE—International Commission on Illumination, Vienna, Austria, 3–5 March 2016; pp. 547–554. [Google Scholar]
- Standard ISO/CIE 19476:2014. Characterization of the Performance of Illuminance Meters and Luminance Meters; CIE: Vienna, Austria, 2014. [Google Scholar]
- Technical Report CIE 231:2019. CIE Classiffication System of Illuminance and Luminance Meters; CIE: Vienna, Austria, 2019. [Google Scholar]
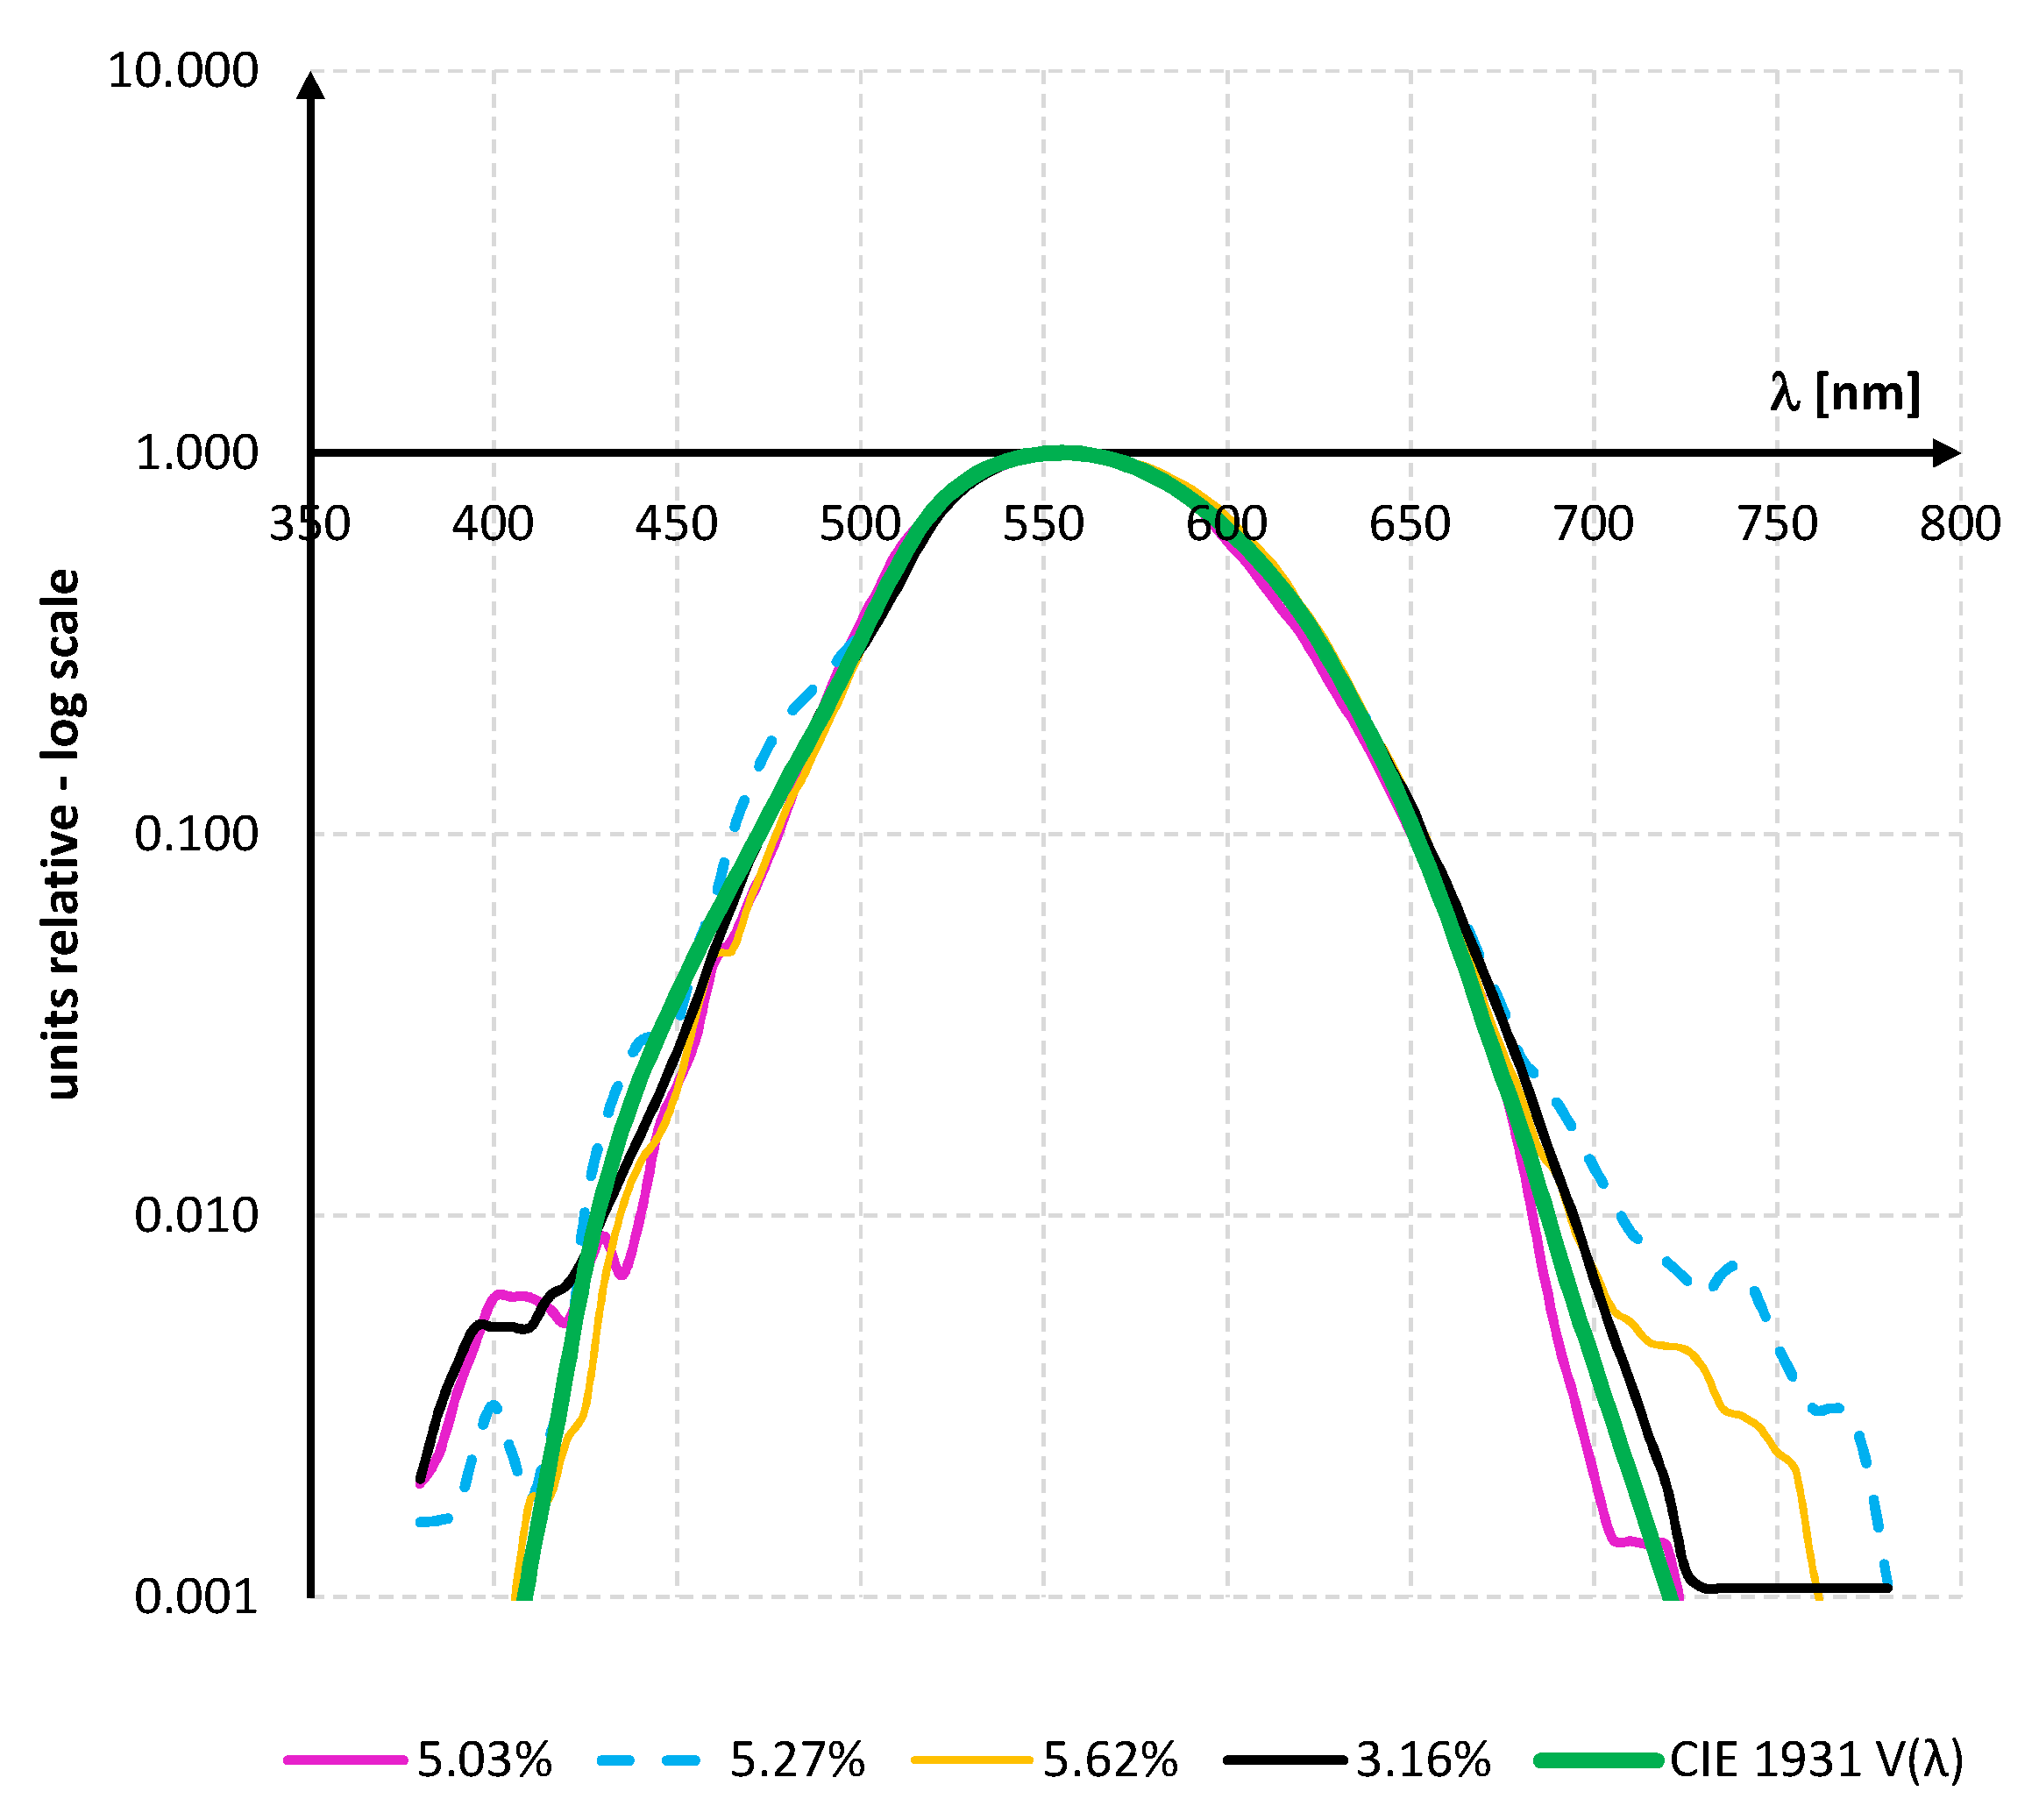
- Krüger, U.; Blattner, P. Spectral Mismatch Correction Factor Estimation for White LED Spectra Based on the Photometer’s f1’ Value. CIE x038:2013. In Proceedings of the CIE Centenary Conference “Towards a New Century of Light”, Paris, France, 15–16 April 2013. [Google Scholar]
- Fryc, I. An analysis of the equation which is describing the spectral quality of photometer. Prz. Elektrotech. 2008, 84, 143–146. [Google Scholar]
- Fryc, I.; Dimitrova-Grekow, T. An Automated System for Evaluation of the Quality of Light Sources. In Proceedings of the IEEE Lighting Conference of the Visegrad Countries Lumen V4, Karpacz, Poland, 13–16 September 2016. [Google Scholar]
- Fryc, I. Errors of spectral correction caused by the diffusing element of the photometric meter head during illuminence measurement. In Proceedings of the SPIE 2001, 4517, Lightmetry: Metrology, Spectroscopy, and Testing Techniques Using Light, Pułtusk, Poland, 10 August 2001. [Google Scholar] [CrossRef]
- Technical Report CIE 154-2003. The Maintenance of Outdoor Lighting Systems; CIE: Vienna, Austria, 2003. [Google Scholar]
- Technical Report CIE 239:2020. Goniospectroradiometry of Optical Radiation Sources; CIE: Vienna, Austria, 2020. [Google Scholar]
- Jakubowski, P.; Fryc, I. Metrological requirements for measurements of circadian radiation. Opt. Appl. 2018, 48, 697–704. [Google Scholar] [CrossRef]
- Kuusk, J.; Ansko, I.; Bialek, A.; Vendt, R.; Fox, N. Implication of Illumination Beam Geometry on Stray Light and Bandpass Characteristics of Diode Array Spectrometer. IEEE J. Sel. Top. Appl. Earth Obs. Remote. Sens. 2018, 11, 2925–2932. [Google Scholar] [CrossRef]
- Jakubowski, P.; Kowalska, J.; Supronowicz, R.; Fryc, I. The Influence of Spectral Measurements Uncertainty of Fluorescent Lamps on Calculated Value of their Relative Melanopic Weighted Irradiance and Colour Quality Parameters. In Proceedings of the 7th Lighting Conference of the Visegrad Countries: LUMEN V4, Třebíč, Czech Republic, 18–20 September 2018. [Google Scholar]
- Moore, J.R.; Stott, P.; Davees, I.F.; Halstead, M.B.; Large, F.E. The effect of measurement uncertainty on the colour rendering indices of fluorescent lamps. Light Res. Technol. 1973, 5, 17–28. [Google Scholar] [CrossRef]
- Shaw, M.; Goodman, T. Array-based goniospectroradiometer for measurement of spectral radiant intensity and spectral total flux of light sources. Appl. Opt. 2008, 47, 2637–2647. [Google Scholar] [CrossRef]
- Schinke, C.; Franke, M.; Bothe, K.; Nevas, S. Implementation and uncertainty evaluation of spectral stray light correction by Zong’s method. Appl. Opt. 2019, 58, 9998–10009. [Google Scholar] [CrossRef] [PubMed]
- Barlier-Salsi, A. Stray light correction on array spectroradiometers for optical radiation risk assessment in the work place. J. Radiol. Prot. 2014, 34, 915–930. [Google Scholar] [CrossRef] [PubMed]
- Zong, Y.; Brown, S.W.; Johnson, B.C.; Lykke, K.R.; Ohno, Y. Simple spectral stray light correction method for array spectroradiometers. Appl. Opt. 2006, 45, 1111–1119. [Google Scholar] [CrossRef] [PubMed]
- Fryc, I.; Czyzewski, D. Chosen parameters of CCD type spectroradiometers. Prz. Elektrotech. 2009, 8, 276–277. [Google Scholar]
- Fryc, I. Spectral Correction of Detector Used in Illuminance Measurements. In Proceedings of the Volume 3820, 11th Slovak-Czech-Polish Optical Conference on Wave and Quantum Aspects of Contemporary Optics, Stara Lesna, Slovakia, 21–25 September 1998. [Google Scholar]
- Slominski, S. Typical Causes of Errors during Measuring Luminance Distributions in Relation to Glare Calculations. In Proceedings of the 7th Lighting Conference of the Visegrad Countries: LUMEN V4, Třebíč, Czech Republic, 18–20 September 2018. [Google Scholar]


| Lighting Classes | Average luminance Lav [cd/m2] (Minimum Maintained) | Overall Uniformity Uo [-] (Minimum) | Longitudinal Uniformity Ui [-] (Minimum) | Threshold Increment fTI [%] (Maximum) | Edge Illuminance Ratio REI [-] (Minimum) |
|---|---|---|---|---|---|
| M2 | 1.50 | 0.40 | 0.70 | 10 | 0.35 |
| M4 | 0.75 | 0.40 | 0.60 | 15 | 0.30 |
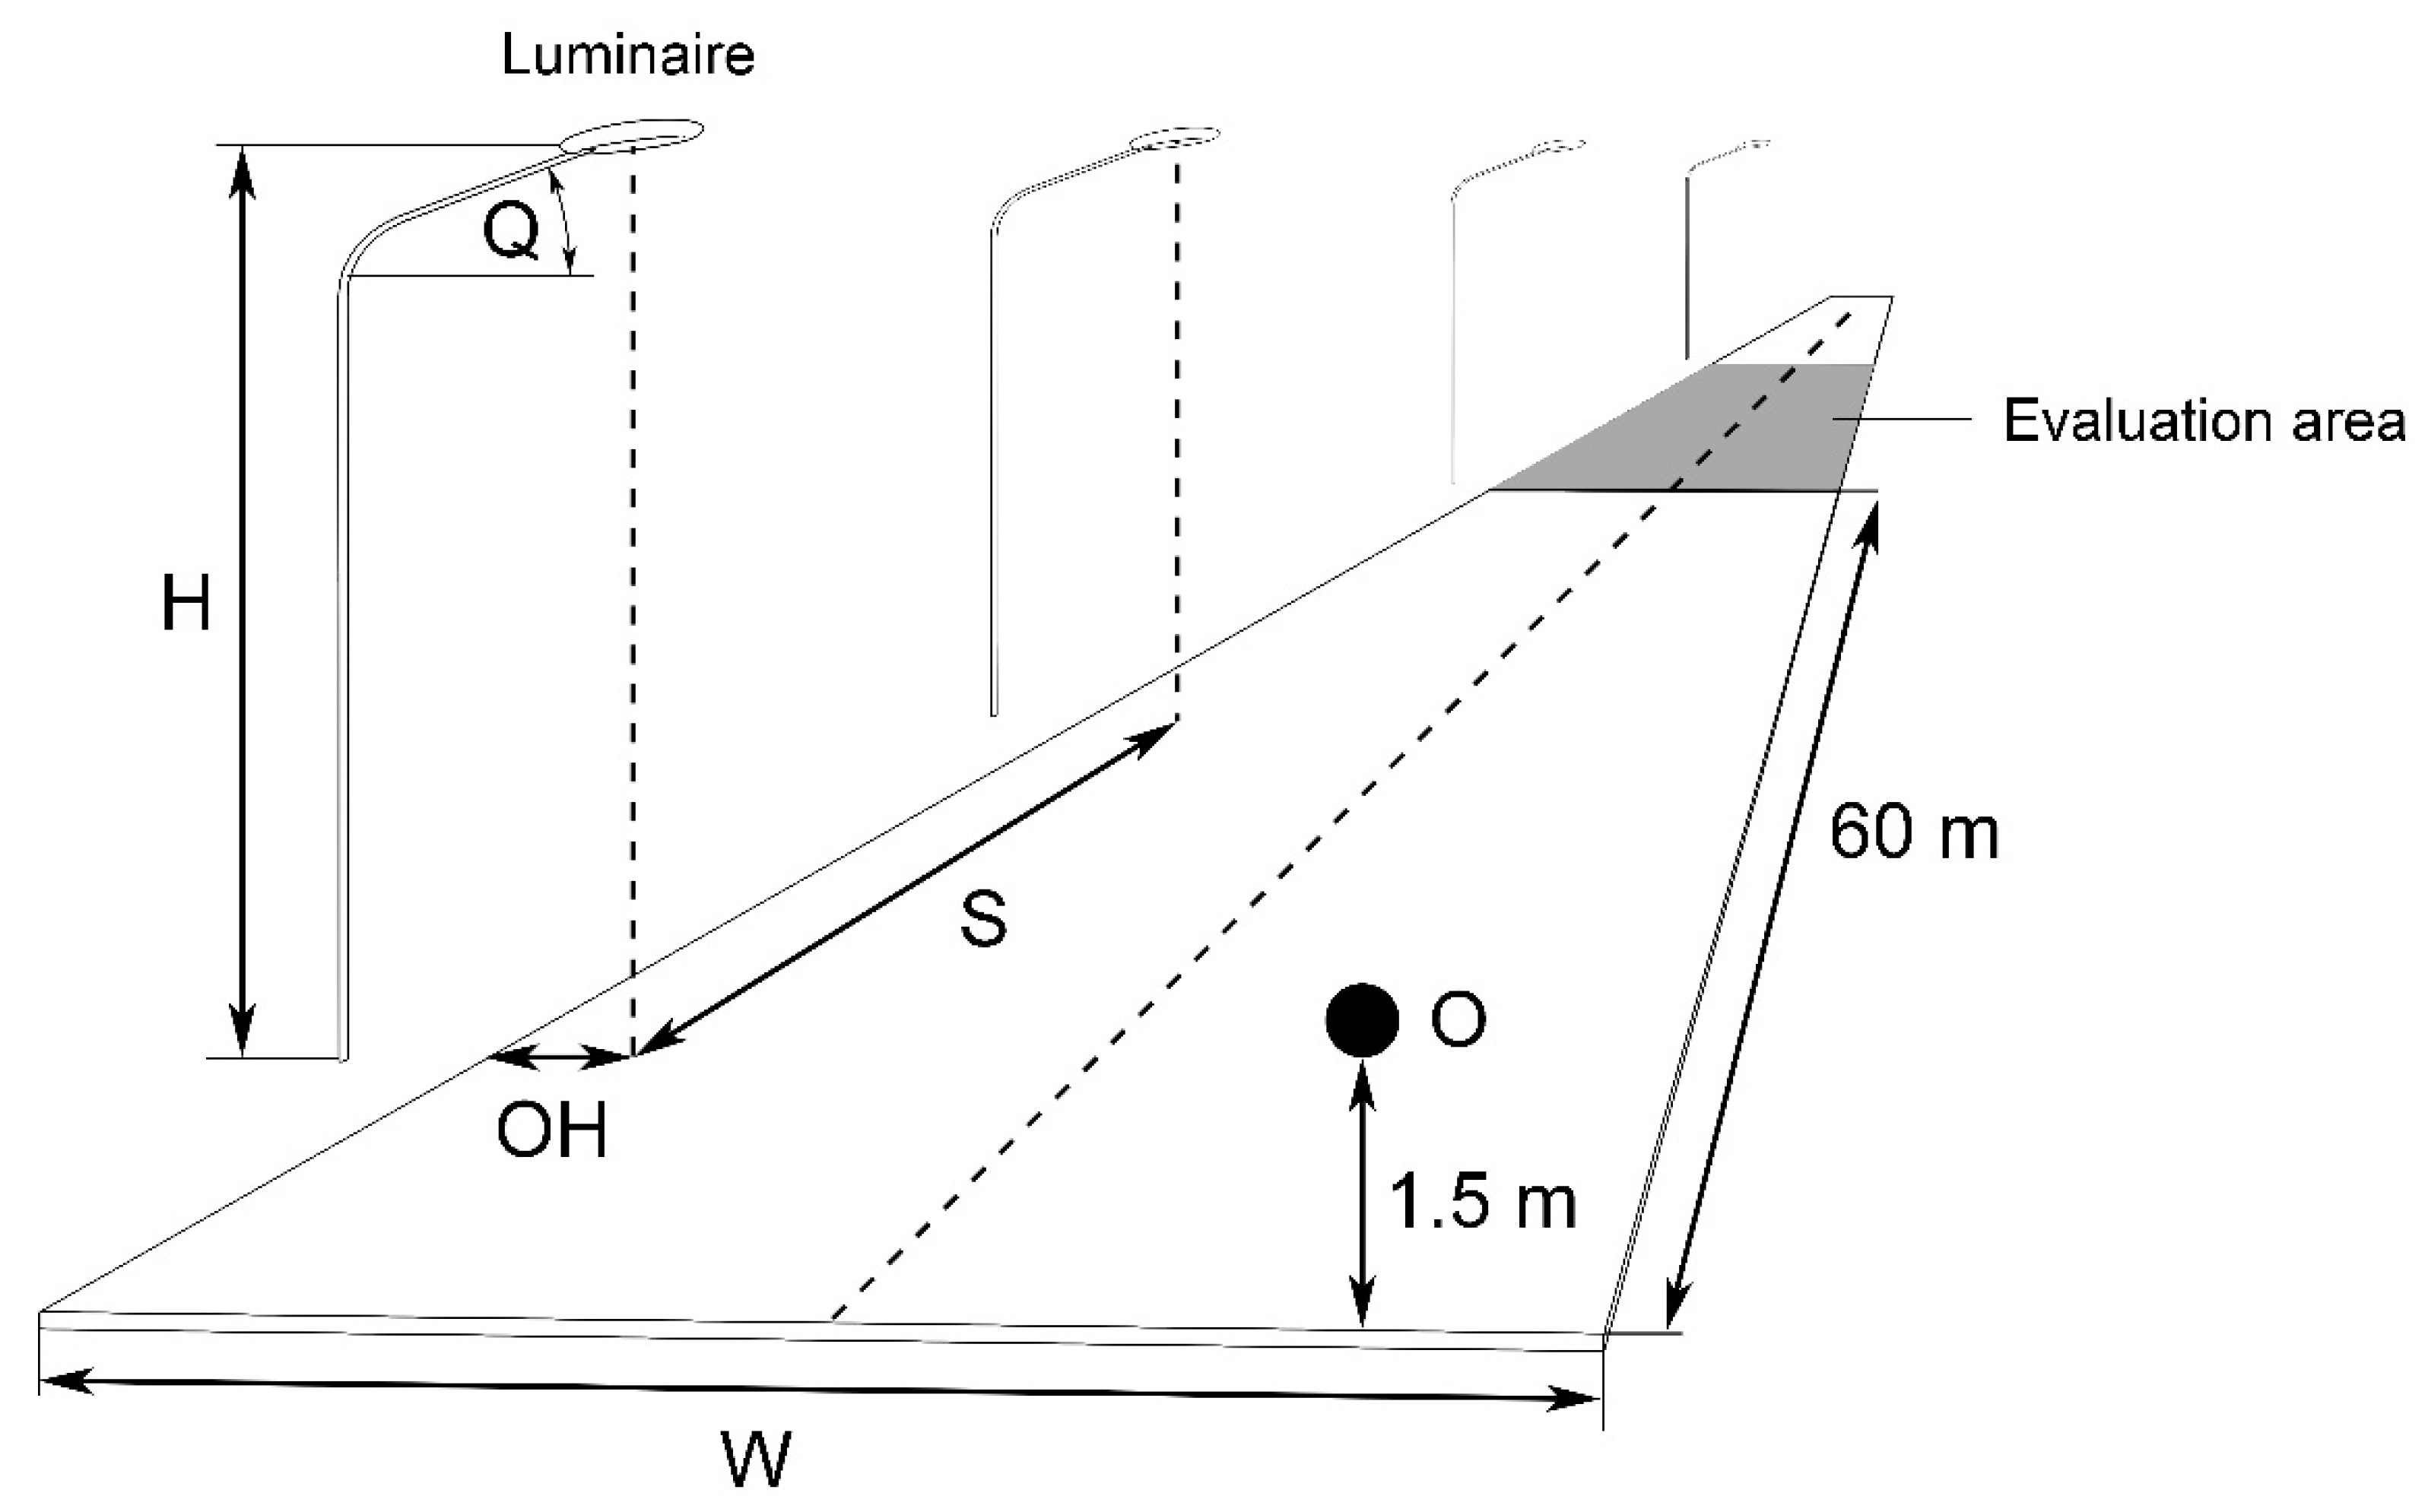
| Geometric Parameters of Luminaire Settings | Road M2 Class (10.5 m) | Road M4 Class (7.0 m) |
|---|---|---|
| Module (S) | 40 ÷ 50 m | 40 ÷ 50 m |
| Luminaire mounting height (H) | 9 ÷ 14 m | 6 ÷ 10 m |
| Overhang (OH) | 0 ÷ 2.5 m | 0 ÷ 2 m |
| Tilt (Q) | 0° | 0° |
| Technical Parameter | Luminaire for M4 Class (LED_M4) | Luminaire for M2 Class (LED_M2) |
|---|---|---|
| Light source type | LED | LED |
| Number of LEDs | 64 | 128 |
| Luminaire luminous flux | 9002 [lm] | 25,571 [lm] |
| Luminaire power | 75 [W] | 195 [W] |
| Parameter | Description |
|---|---|
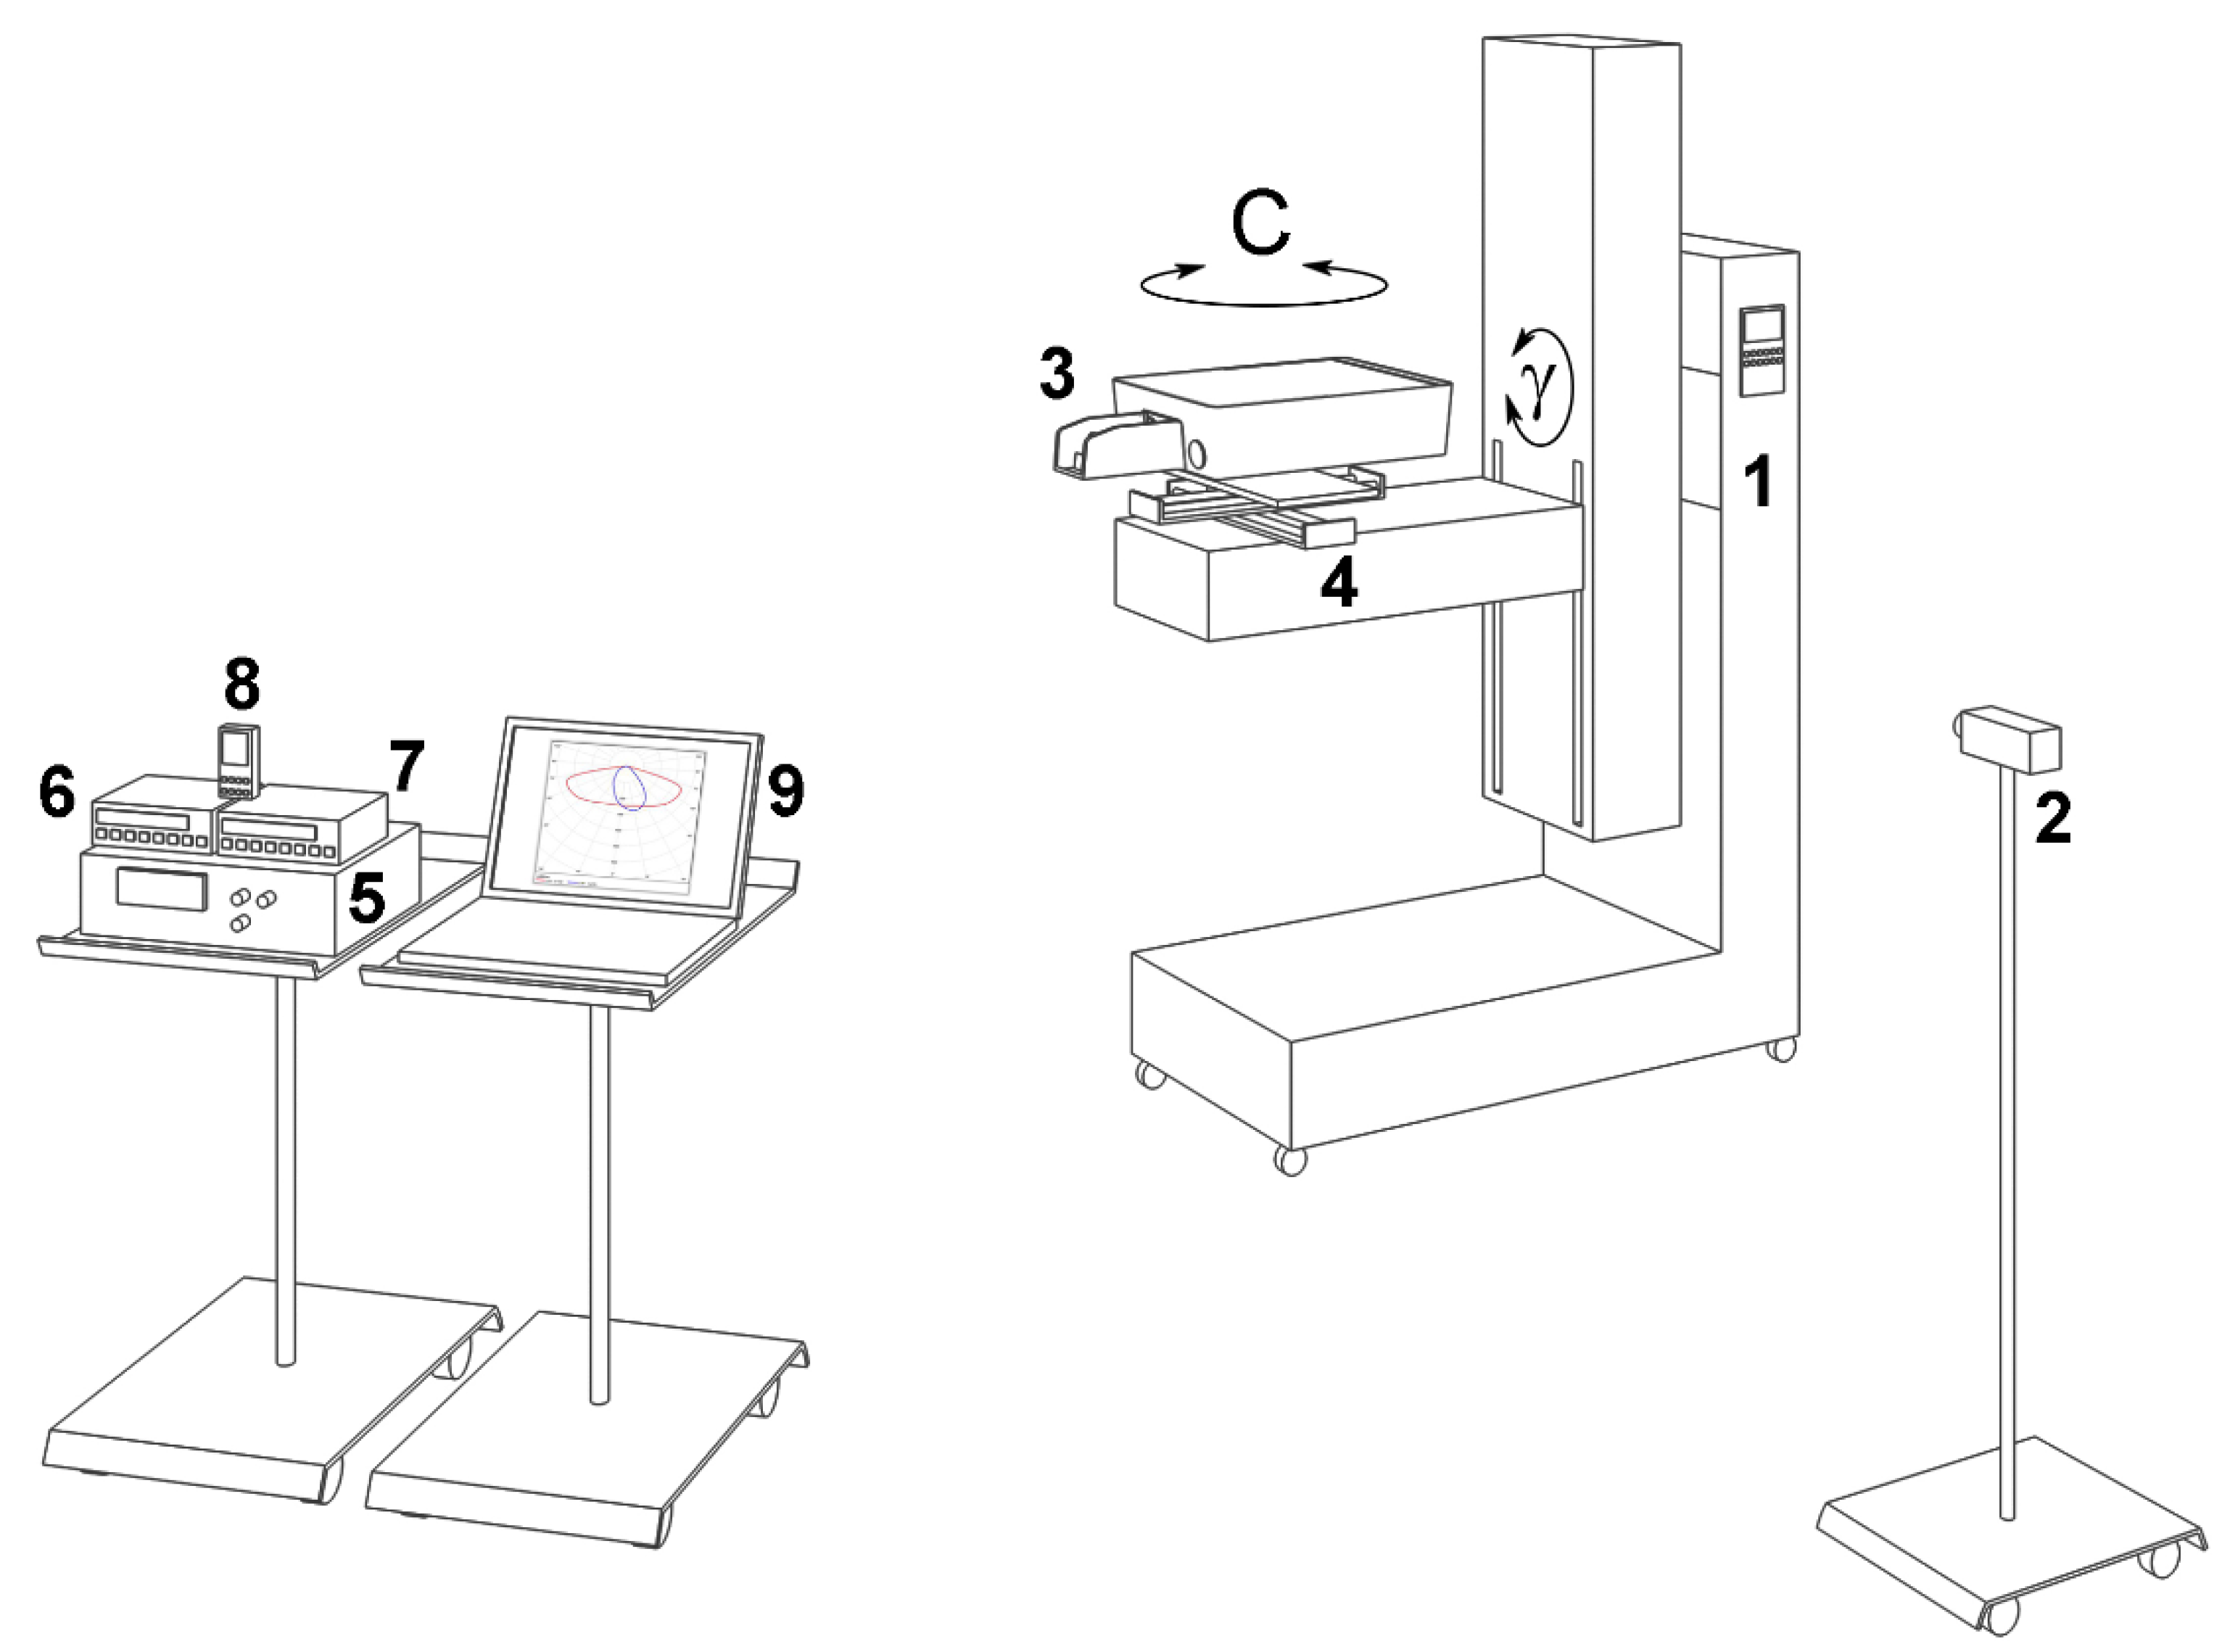
| Size of measuring object | <= 1200 mm diameter of luminous area <= 1220 mm mechanical diameter |
| Space required | LxWxH = 2000 × 1800 × 400 [mm] |
| Movement | Illumination meter placed in front of the goniometer on a tripod (the lamp two independent axes arranged vertically to each other (C, )) |
| Measuring position of the tested object | Normal position, no movement of the tested object. The whole goniometer can be swiveled which permits different measuring positions to be set |
| Measuring distance | No limit |
| Travel path | C = 0°... 360°, γ = 0°... 180° |
| Positioning accuracy | C < 0.02°, γ < 0.05° |
| Repetitive accuracy | C < 0.01°, γ < 0.02° |
| Material | Steel and aluminum coated with special black paint |
| Drives and control | Drives and servo amplifier |
| Gears | High precision |
| Geometric Parameters of Luminaire Settings | Road M2 Class (10.5 m) | Road M4 Class (7.0) m |
|---|---|---|
| Module (S) | 49.5 m | 43.5 m |
| Luminaire mounting height (H) | 12.5 m | 8.5 m |
| Overhang (OH) | 2.5 m | 1.5 m |
| Tilt (Q) | 0° | 0° |
| Average Luminance Lav [cd/m2] (Minimum Maintained) | Overall Uniformity Uo [-] (Minimum) | Longitudinal Uniformity Ul [-] (Minimum) | Threshold Increment FTI [%] (Maximum) | Edge Illuminance Ratio REI [-] (Minimum) | |
|---|---|---|---|---|---|
| Reference installation | 0.75 | 0.50 | 0.63 | 13 | 0.58 |
| Lighting requirements | 0.75 | 0.40 | 0.60 | 15 | 0.30 |
| Average Luminance Lav [cd/m2] (Minimum Maintained) | Overall Uniformity Uo [-] (Minimum) | Longitudinal Uniformity Ul [-] (Minimum) | Threshold Increment FTI [%] (Maximum) | Edge Illuminance Ratio REI [-] (Minimum) | |
|---|---|---|---|---|---|
| Reference installation | 1.50 | 0.51 | 0.85 | 10 | 0.60 |
| Lighting requirements | 1.50 | 0.40 | 0.70 | 10 | 0.35 |
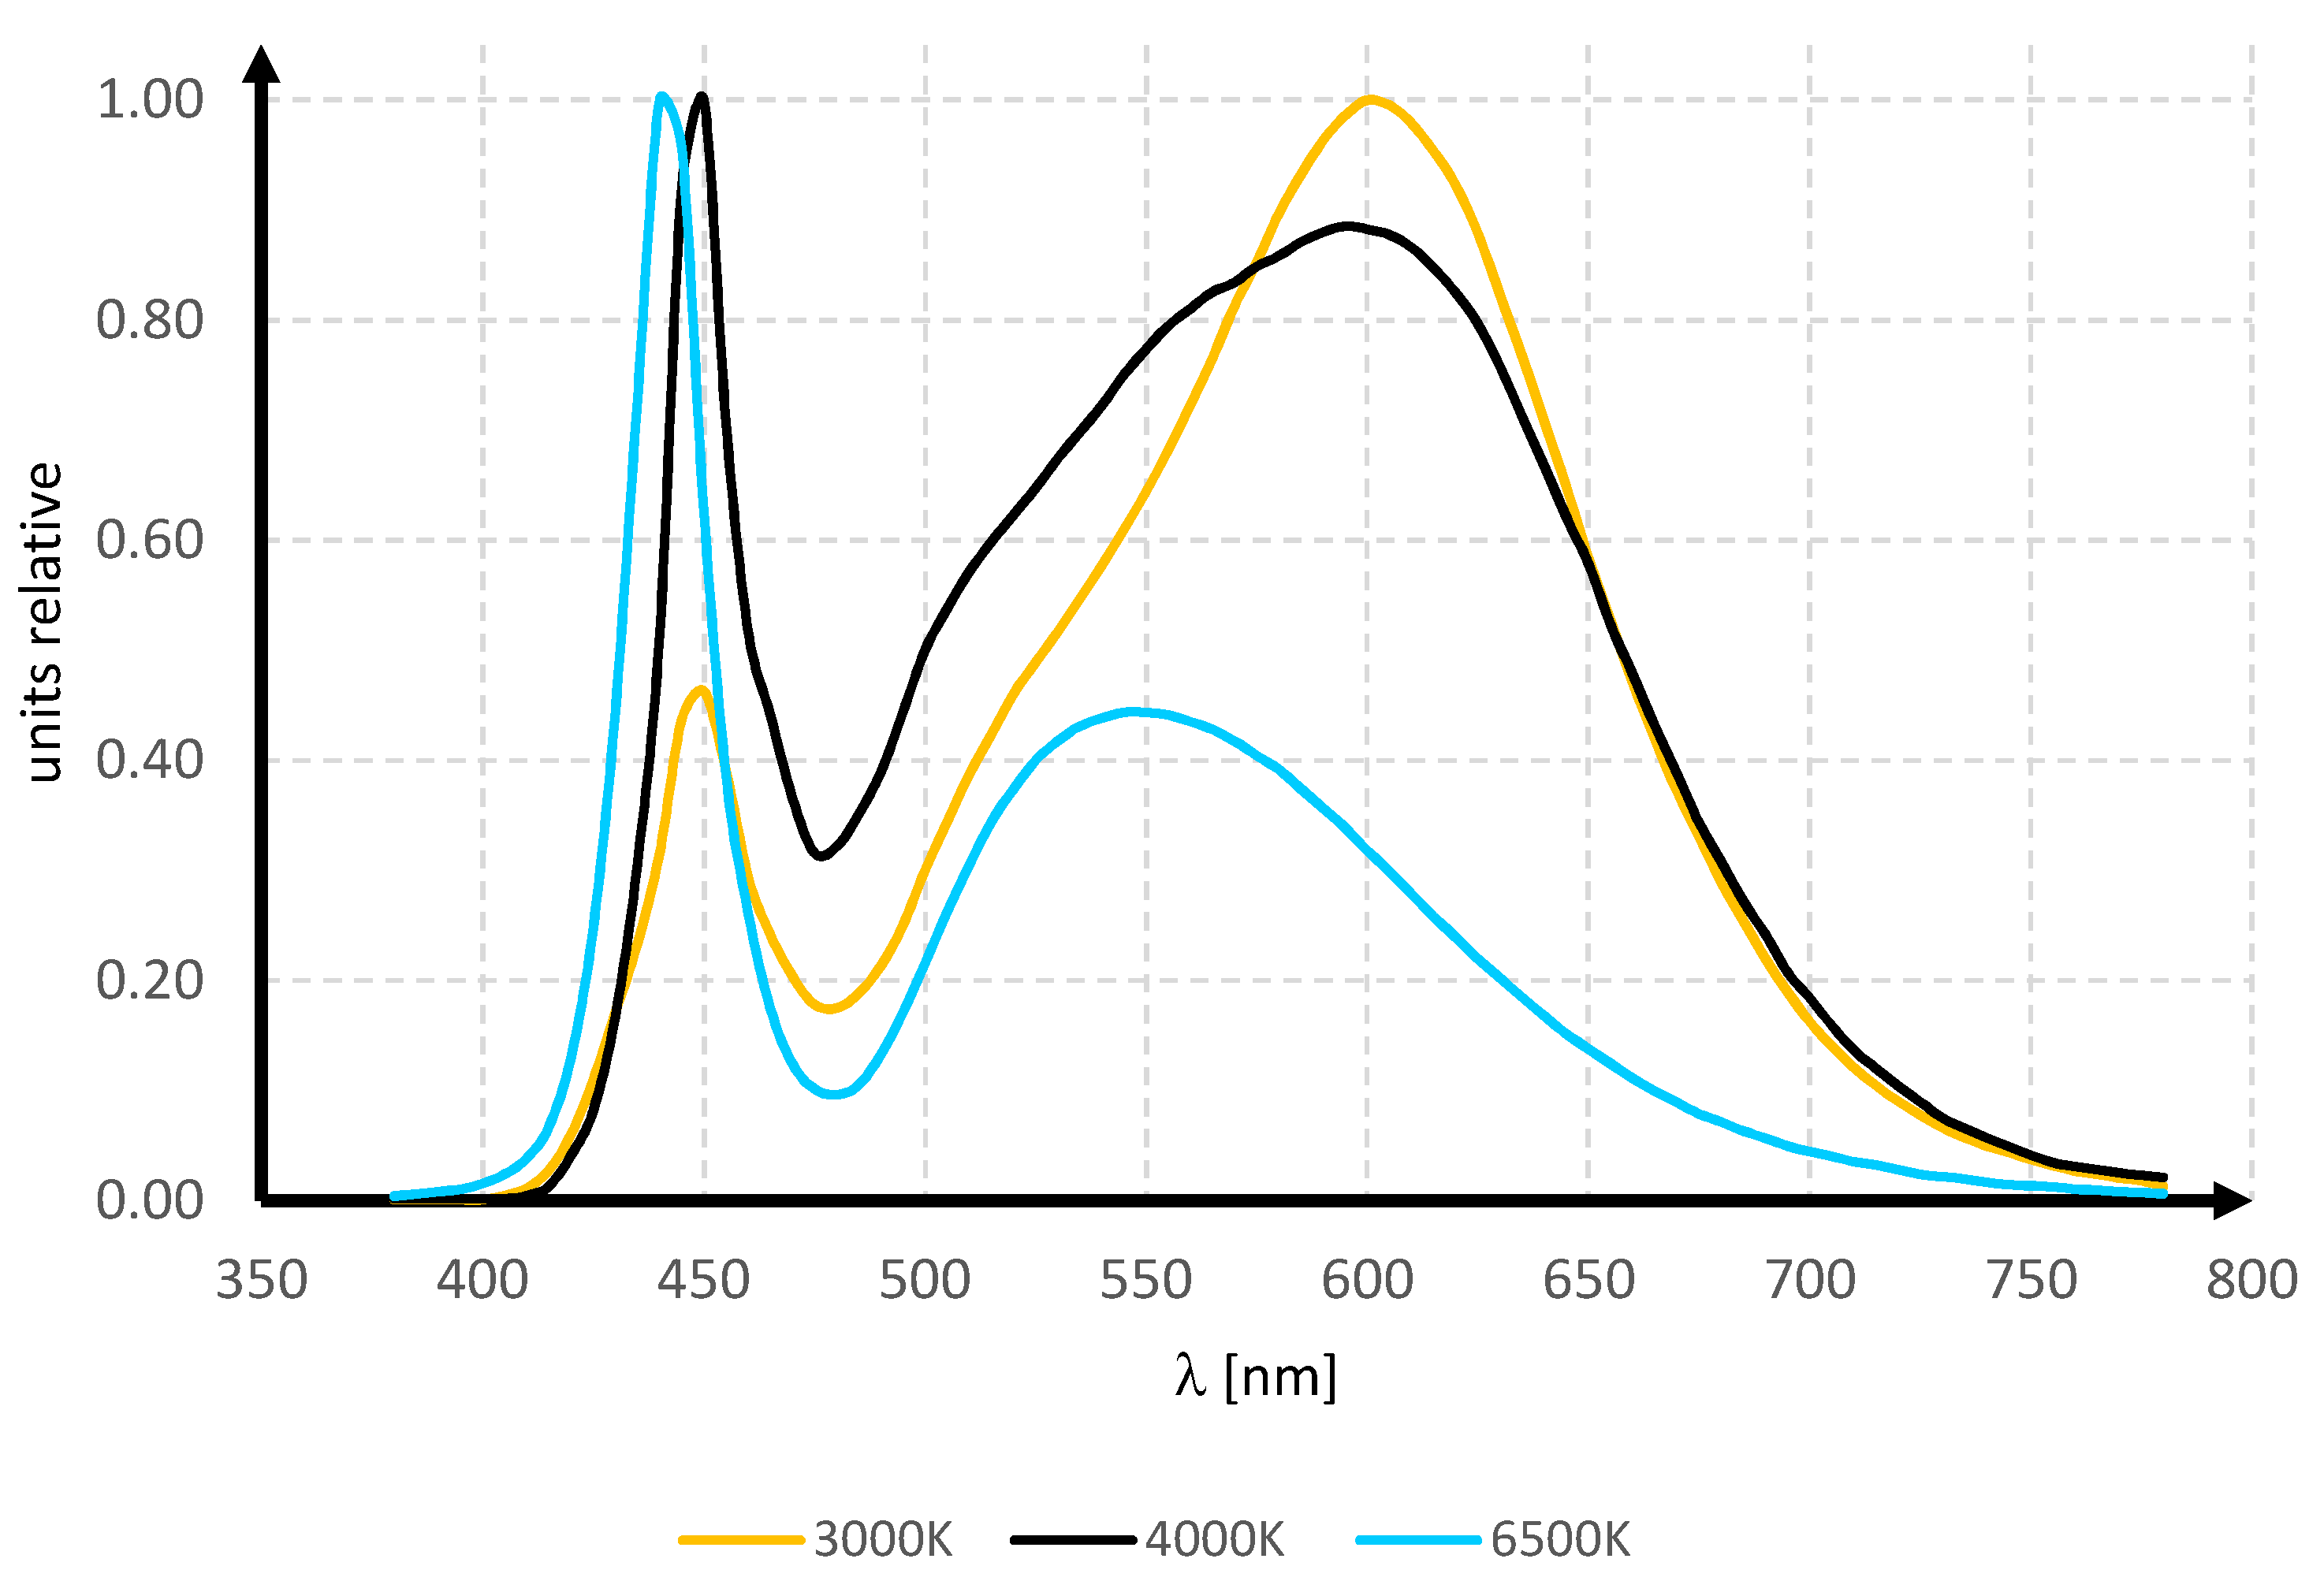
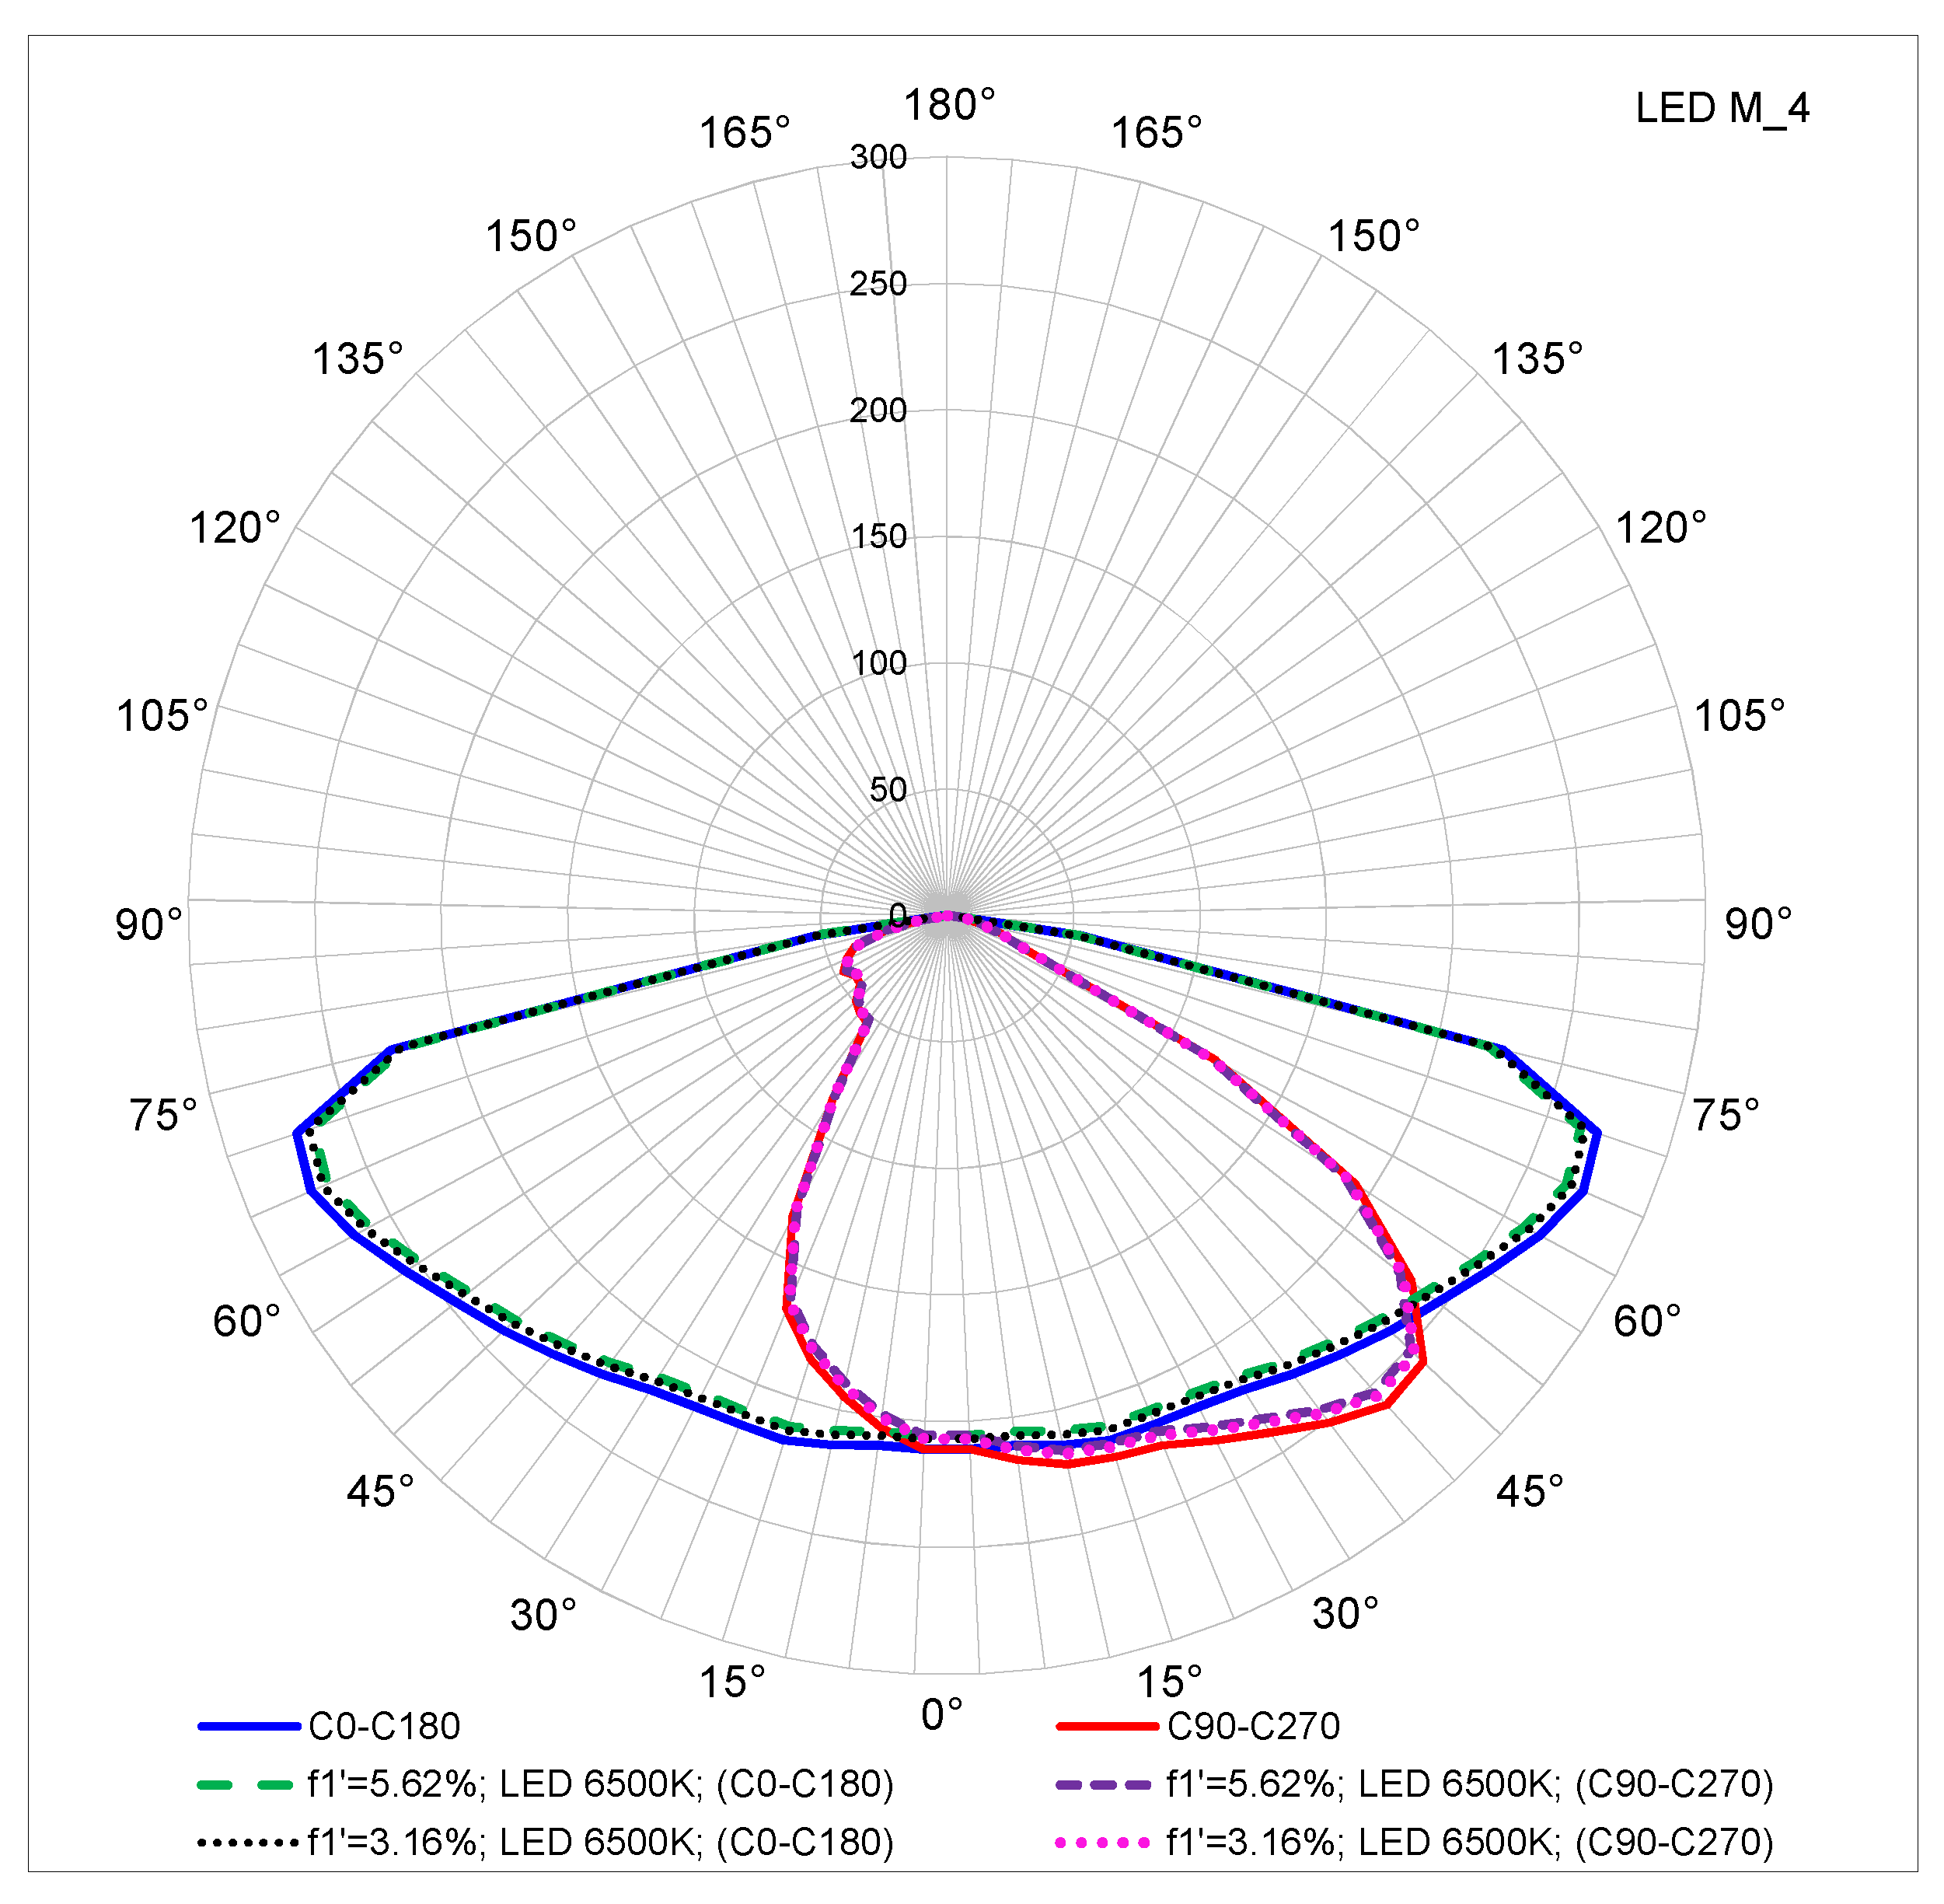
| Case No. | CCT LED | Geometry (S/H/Q/OH) | Lav [cd/m2] | Uo [-] | Ul [-] | FTI [%] | REI [-] | De [kWh/m2 year] | Dp [mW/(lx m2)] |
|---|---|---|---|---|---|---|---|---|---|
| Reference | 43.5/8.5/0/1.5 | 0.75 | 0.50 | 0.63 | 13 | 0.58 | 0.985 | 23.8 | |
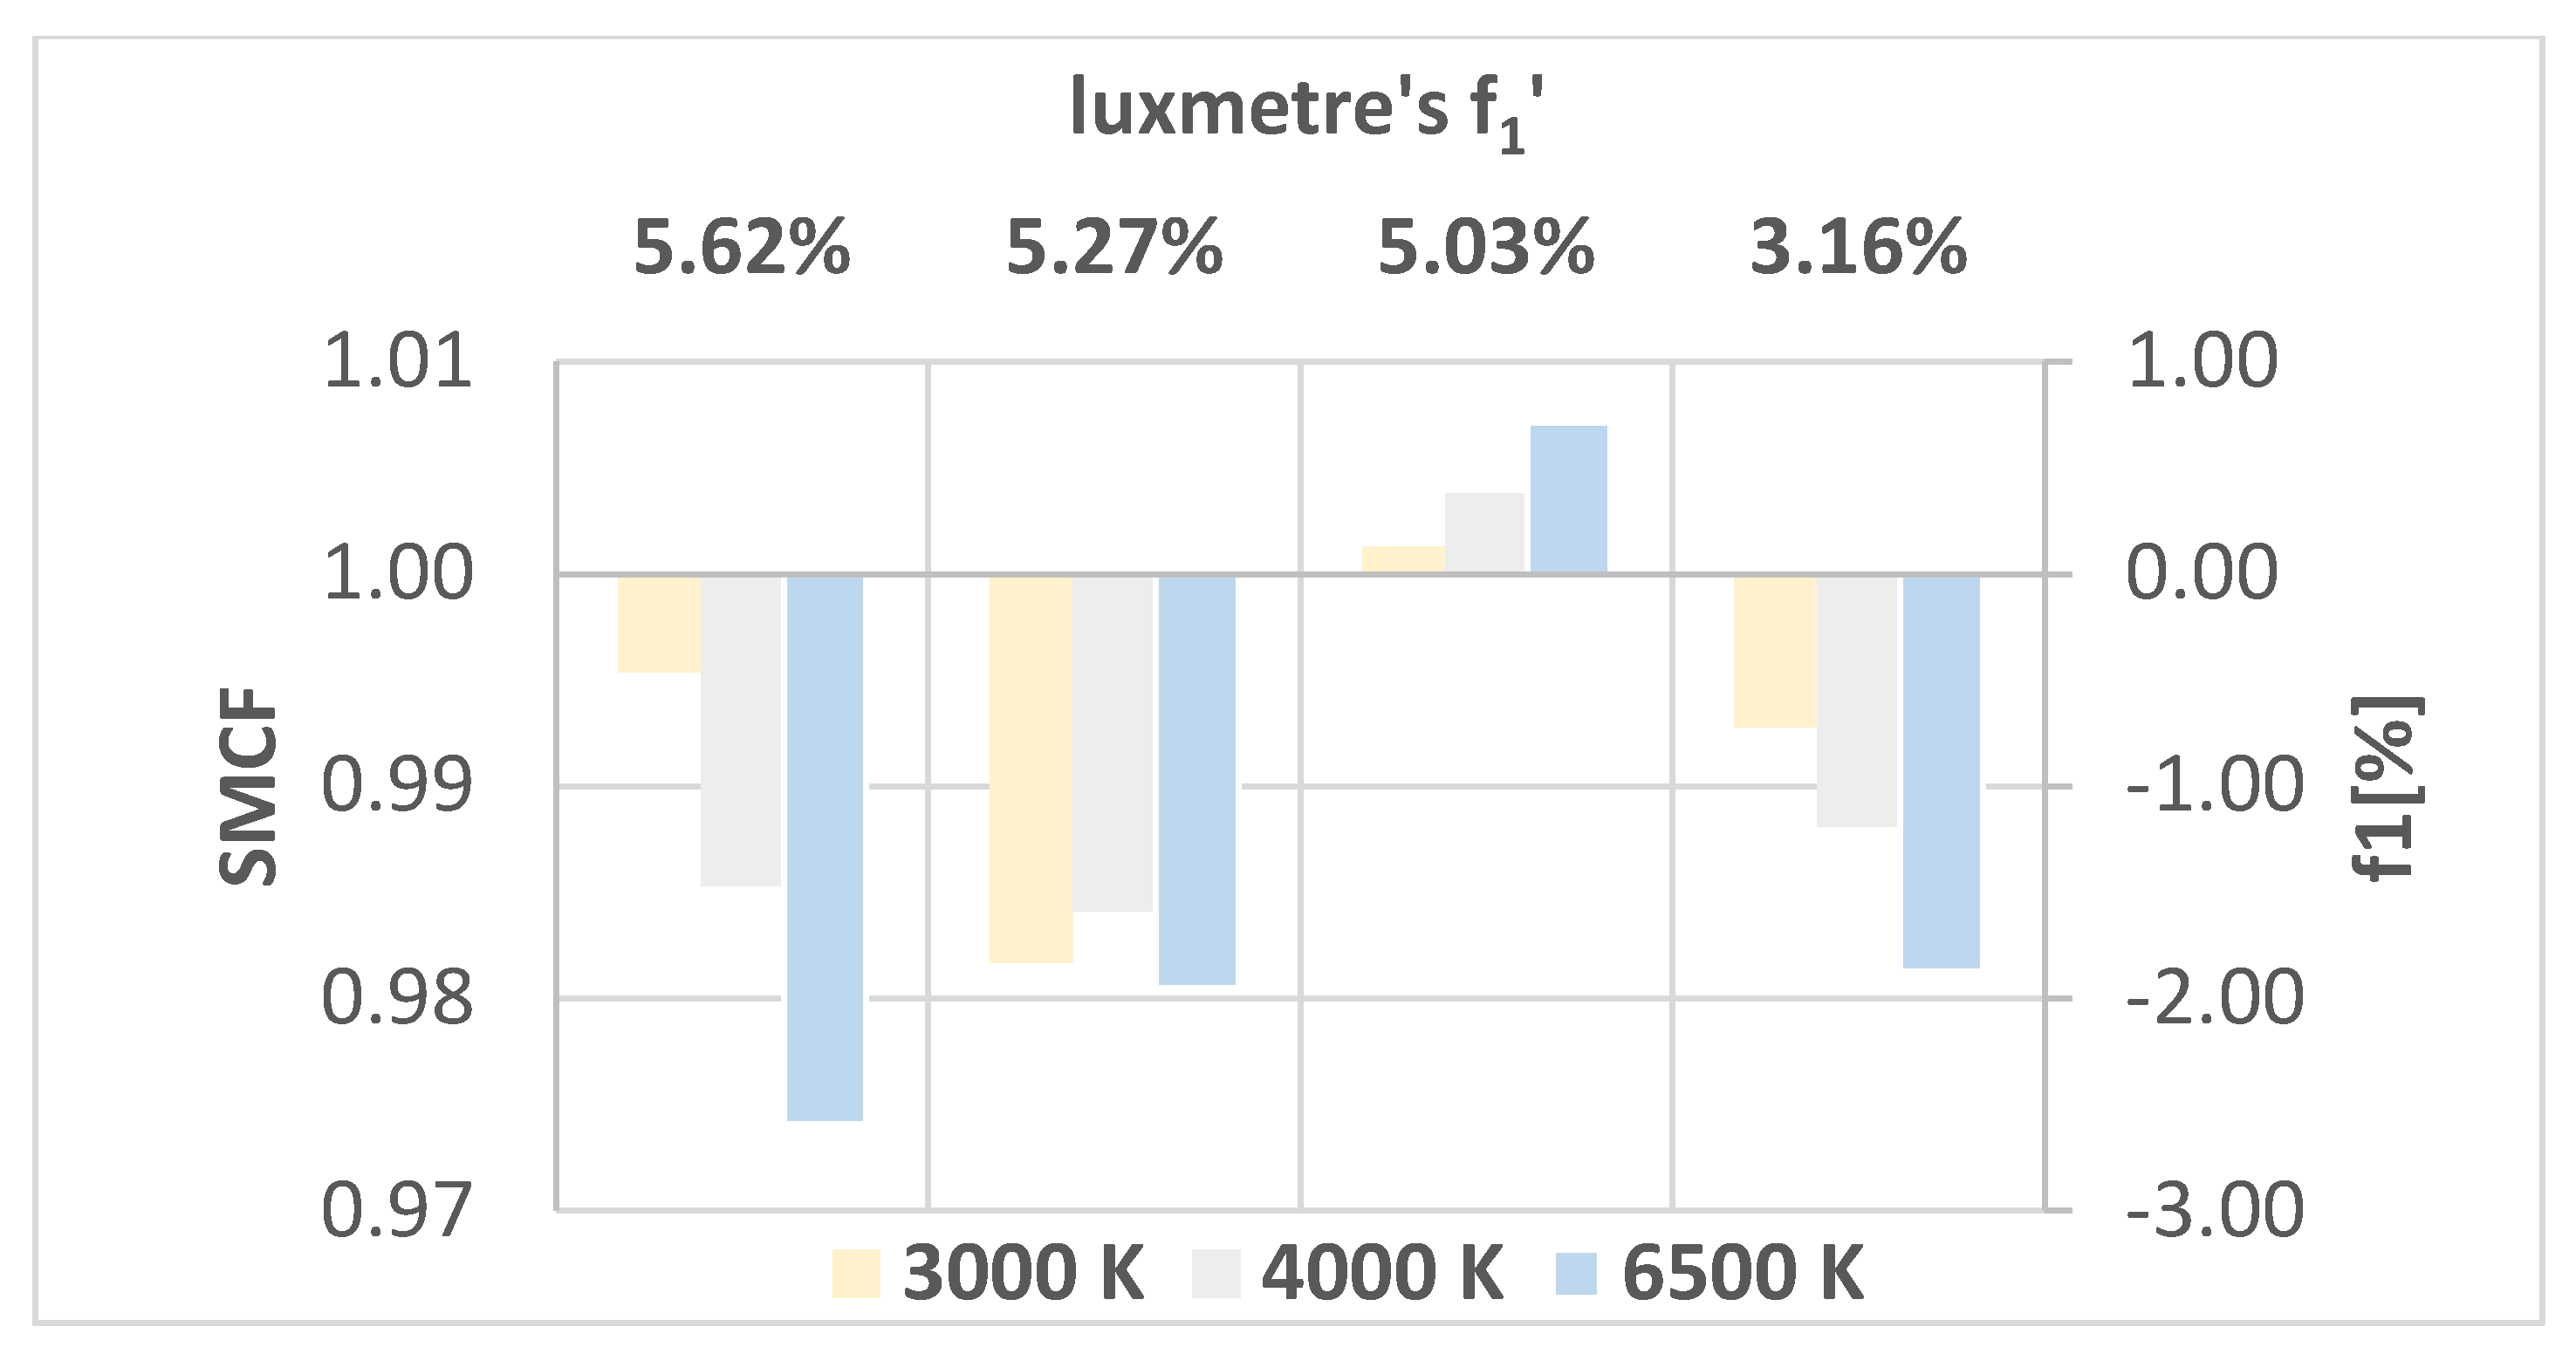
| Class B (f1′ = 3.16%) | |||||||||
| 1 | 3000 K | 43.5/8.5/0/1.0 | 0.74 | 0.55 | 0.63 | 13 | 0.64 | 0.985 | 23.6 |
| 2 | 4000 K | 44.0/8.5/0/1.5 | 0.74 | 0.50 | 0.62 | 13 | 0.58 | 0.974 | 23.8 |
| 3 | 6500 K | 44.5/8.5/0/1.5 | 0.73 | 0.49 | 0.60 | 13 | 0.58 | 0.963 | 23.8 |
| Class B (f1′ = 5.03%) | |||||||||
| 4 | 3000 K | 43.5/8.5/0/1.5 | 0.75 | 0.50 | 0.63 | 13 | 0.58 | 0.985 | 23.8 |
| 5 | 4000 K | 43.0/8.5/0/1.0 | 0.75 | 0.56 | 0.64 | 12 | 0.64 | 0.997 | 23.6 |
| 6 | 6500 K | 43.0/8.5/0/1.0 | 0.75 | 0.56 | 0.64 | 12 | 0.64 | 0.997 | 23.6 |
| Class B (f1′ = 5.27%) | |||||||||
| 7 | 3000 K | 44.0/8.5/0/1.0 | 0.74 | 0.55 | 0.61 | 13 | 0.64 | 0.974 | 23.6 |
| 8 | 4000 K | 44.0/8.5/0/1.0 | 0.74 | 0.55 | 0.61 | 13 | 0.64 | 0.974 | 23.6 |
| 9 | 6500 K | 44.5/8.5/0/1.5 | 0.73 | 0.49 | 0.6 | 13 | 0.58 | 0.963 | 23.8 |
| Class B (f1′ = 5.62%) | |||||||||
| 10 | 3000 K | 43.5/8.5/0/1.0 | 0.74 | 0.55 | 0.63 | 13 | 0.64 | 0.985 | 23.6 |
| 11 | 4000 K | 44.0/8.5/0/1.0 | 0.74 | 0.55 | 0.61 | 13 | 0.64 | 0.974 | 23.6 |
| 12 | 6500 K | 44.5/8.5/0/1.0 | 0.73 | 0.55 | 0.60 | 13 | 0.64 | 0.963 | 23.6 |
| Case No. | CCT LED | Geometry (S/H/Q/OH) | Lav [cd/m2] | Uo [-] | Ul [-] | FTI [%] | REI [-] | De [kWh/m2 year] | Dp [mW/(lx m2)] |
|---|---|---|---|---|---|---|---|---|---|
| Reference | 49.5/12.5/0/2.5 | 1.50 | 0.51 | 0.85 | 10 | 0.60 | 1.50 | 17.3 | |
| Class B (f1′ = 3.16%) | |||||||||
| 1 | 3000 K | 49.5/12.5/0/2.5 | 1.51 | 0.51 | 0.85 | 10 | 0.60 | 1.50 | 17.3 |
| 2 | 4000 K | 49.5/12.5/0/2.0 | 1.49 | 0.49 | 0.86 | 10 | 0.61 | 1.50 | 17.3 |
| 3 | 6500 K | 50.0/12.5/0/2.0 | 1.48 | 0.48 | 0.85 | 10 | 0.61 | 1.49 | 17.3 |
| Class B (f1′ = 5.03%) | |||||||||
| 4 | 3000 K | 49.5/12.5/0/2.5 | 1.50 | 0.51 | 0.85 | 10 | 0.60 | 1.50 | 17.3 |
| 5 | 4000 K | 49.5/12.5/0/2.5 | 1.50 | 0.51 | 0.85 | 10 | 0.60 | 1.50 | 17.3 |
| 6 | 6500 K | 49.0/12.5/0/2.5 | 1.52 | 0.52 | 0.86 | 10 | 0.60 | 1.52 | 17.3 |
| Class B (f1′ = 5.27%) | |||||||||
| 7 | 3000 K | 50.0/12.5/0/2.0 | 1.48 | 0.48 | 0.85 | 10 | 0.61 | 1.49 | 17.3 |
| 8 | 4000 K | 50.0/12.5/0/2.0 | 1.48 | 0.48 | 0.85 | 10 | 0.61 | 1.49 | 17.3 |
| 9 | 6500 K | 50.0/12.5/0/2.0 | 1.48 | 0.48 | 0.85 | 10 | 0.61 | 1.49 | 17.3 |
| Class B (f1′ = 5.62%) | |||||||||
| 10 | 3000 K | 49.5/12.5/0/2.0 | 1.49 | 0.49 | 0.86 | 10 | 0.61 | 1.50 | 17.3 |
| 11 | 4000 K | 50/12.5/0/2.0 | 1.48 | 0.48 | 0.85 | 10 | 0.61 | 1.49 | 17.3 |
| 12 | 6500 K | 50/12.5/0/1.5 | 1.46 | 0.46 | 0.86 | 10 | 0.59 | 1.49 | 17.4 |
| CCT LED | E1km [MWh/km] | ΔE1km [MWh/km] | ΔE10km [MWh/10km] | ΔE100km [MWh/100km] |
|---|---|---|---|---|
| Reference | 6.6 | - | - | - |
| Class B (5.03%) | ||||
| 4000 K | 6.6 | 0 | 0.9 | 8.1 |
| 6500 K | 6.6 | 0 | 0.9 | 8.1 |
| CCT LED | E1km [MWh/km] | ΔE1km [MWh/km] | ΔE10km [MWh/10km] | ΔE100km [MWh/100km] |
|---|---|---|---|---|
| Reference | 15.6 | - | - | - |
| Class B (5.03%) | ||||
| 6500 K | 15.6 | 0 | 1.56 | 15.6 |
© 2020 by the authors. Licensee MDPI, Basel, Switzerland. This article is an open access article distributed under the terms and conditions of the Creative Commons Attribution (CC BY) license (http://creativecommons.org/licenses/by/4.0/).
Share and Cite
Czyżewski, D.; Fryc, I. The Influence of Luminaire Photometric Intensity Curve Measurements Quality on Road Lighting Design Parameters. Energies 2020, 13, 3301. https://doi.org/10.3390/en13133301
Czyżewski D, Fryc I. The Influence of Luminaire Photometric Intensity Curve Measurements Quality on Road Lighting Design Parameters. Energies. 2020; 13(13):3301. https://doi.org/10.3390/en13133301
Chicago/Turabian StyleCzyżewski, Dariusz, and Irena Fryc. 2020. "The Influence of Luminaire Photometric Intensity Curve Measurements Quality on Road Lighting Design Parameters" Energies 13, no. 13: 3301. https://doi.org/10.3390/en13133301
APA StyleCzyżewski, D., & Fryc, I. (2020). The Influence of Luminaire Photometric Intensity Curve Measurements Quality on Road Lighting Design Parameters. Energies, 13(13), 3301. https://doi.org/10.3390/en13133301