Article

Life Cycle Assessment of a Reversible Heat Pump–Organic Rankine Cycle–Heat Storage System with Geothermal Heat Supply

1
Laboratory of Computer Networks and Communication Systems, Friedrich-Alexander-University Erlangen-Nürnberg (FAU), Martensstr 3, 91058 Erlangen, Germany
2
Institute of Engineering Thermodynamics, Friedrich-Alexander-University Erlangen-Nürnberg (FAU), Am Weichselgarten 8, 91058 Erlangen-Tennenlohe, Germany
3
Institue of Energy Process Engineering, Friedrich-Alexander-University Erlangen-Nürnberg (FAU), Fürther Strasse 244f, 90429 Nürnberg, Germany
*
Author to whom correspondence should be addressed.
Energies 2020, 13(12), 3253; https://doi.org/10.3390/en13123253
Submission received: 22 May 2020 / Revised: 10 June 2020 / Accepted: 11 June 2020 / Published: 23 June 2020
(This article belongs to the Section B: Energy and Environment)

Abstract

:
The life cycle assessment of components is becoming increasingly important for planning and construction. In this paper, a novel storage technology for excess electricity consisting of a heat pump, a heat storage and an organic rankine cycle is investigated with regards to its environmental impact. Waste heat is exergetically upgraded, stored in a hot water storage unit and afterwards reconverted to electricity when needed. Such a pilot plant on a lab scale is currently built in Germany. The first part of this paper focuses on geothermal energy as a potential heat source for the storage system and its environmental impact. For a large scale application, geothermal hotspots in Germany are further investigated. The second part analyzes the storage technology itself and compares it to the impacts of commonly used battery storage technologies. Especially during the manufacturing process, significantly better global warming potential values are shown compared to lithium-ion and lead batteries. The least environmental impact while operating the system is with wind power, which suggests an implementation of the storage system into the grid in the northern part of Germany.

1. Introduction

Due to climate change, the issue of sustainability and environmental impacts is becoming increasingly dominant. In the field of energy supply, a focus on renewable energy sources is indispensable, especially wind and solar power are experiencing a rapid expansion. The problem of weather dependency can be reduced with the help of storage facilities, as it is possible to smoothen the fluctuating feed-in into the grid or to shift the energy to a later time period.
Probably the best known as well as most efficient power storage devices are batteries. Due to their continual improvement, they have a power-to-power efficiency of 85% or higher and a high level of technological maturity [1]. Batteries are one of the most commonly used energy storage devices and witness a significant market growth over the last few years. Depending on which battery technology is used, they still have major limitations like high costs, a short life span or consisting of limited available raw materials [1].
In contrast, thermal storages, such as pressurized hot water storages, have a long lifetime and low cost, which makes them economically competitive with batteries. The concept behind a thermal storage system is the charging or discharging of thermal energy to the storage medium, so that the stored energy can be used later. The simplest type of thermal storage systems are sensible heat storages, where the medium is just changing its temperature but not undergoing any phase change. The most popular storage medium is water. It is used in either residential or industrial applications due to its cheap nature, high storage density and zero toxicity. Possible heat sources to charge the storage can be for example industrial waste heat, solarthermal or geothermal energy [2].
At the Energie Campus Nürnberg, Germany, the main focus of an ongoing joint research project is a new pumped thermal energy storage (PTES) consisting of a heat pump (HP), hot water storage and organic rankine cycle (ORC) [3]. A laboratory system with a storage capacity of up to 1 MWh is being built and further developed there, which general performance parameters are used for this study. By evaporating a working fluid with low temperature heat and raising its pressure with a compressor, the condensation temperature of the working fluid is raised above the targeted storage temperature of 120 °C and charges the thermal energy storage during its condensation in the storage heat exchanger. Contrary to the counter clockwise heat pump cycle, the discharging of the thermal energy storage is realised by means of a clockwise organic rankine cycle. In this clockwise process the same working fluid as in the HP is used. The pressurised fluid is evaporated in the storage heat exchanger by the heat extracted out of the thermal energy storage. Afterwards the pressurized vapour is expanded in a working machine to convert the stored energy back to electricity. The overall efficiency of the system is around 50% [4].
Since a later use of the storage system is planned for significantly larger storage capacities, the question of a reliable waste heat source must be clarified. For this purpose a heat supply from geothermal energy is best suited as it is available without time restrictions. Studies on the geothermal energy potential in Germany have existed for a long time [5,6], which should be made available as a digital atlas following the proposal of Paschen [7]. Since 2005 an open-access atlas called Geothermal Information System GeotIS (www.geotis.de) [8] exists. GeotIS is now funded by the German Federal Ministry of Economic Affairs and Energy and includes more than 30,000 drillings throughout Germany. With this data base, temperature profiles can be created vertically or horizontally down to a depth of 5000 m. In addition to the data sets and maps of geothermal energy use published by Suchi [9] in 2014, Weber [10] updated them for the period 2016–2018. In order to facilitate the selection of a location for the heat storage system and its heat demand, a potential analysis of possible locations in Germany was carried out. For this purpose, selected locations in the known hotspot regions in Germany were analysed in detail and compared with each other. Creating an overview of the known hotspots based on different published data sets is therefore the first contribution in this paper.
The environmental impact of a product or service is obtained by a life cycle assessment (LCA). An LCA considers the entire life cycle of the product and takes into account all the environmental impacts that occur. Figure 1 shows such a cycle. Starting with the extraction of raw materials, it continues through processing and production to the use phase. Once the product has reached the end of its life, some or all of it can be recycled and thus reused. The more parts of the product end up as waste, the greater the environmental impact of the product can be. The entire methodology of an LCA is very complex, which is why the European standard EN ISO 14044 [11] was developed and contains instructions for the implementation of an LCA.
Differences in the setup of a geothermal plant or uncertainties of geological conditions of the site are two major factors that make the evaluation with an LCA a difficult task. However, Frick [12] comes to the conclusion that general statements can be drawn. The LCA is significantly influenced by the construction, which includes the plant itself and drilling. The environmental impact can therefore be reduced even before construction if efforts are made to access the heat reservoir with as few boreholes as possible. Similar results can be found in Karlsdottir [13], Praitiwi [14] and McCay [15], with the construction phase dominating most impacts. Our second contribution in this paper are correlations for the individual environmental impacts as a function of characteristic parameters of the plant.
After the heat supply has been examined for its environmental influences, a more detailed analysis of the heat storage system must be carried out. Results published in the literature so far refer either to individual components or a partial combination, not to a combination of HP, heat storage and ORC. LCAs for heat storages with different storage mediums were performed by Koroneos [16] and Piemonte [17]. Depending on the heat sources, Simons [18] has carried out an LCA for various heat pump systems and a hot water storage tank, whereas Gracia [19] investigated the environmental impact of heat pumps and storage tanks with phase-change materials as storage medium. In addition to the analysis of the environmental impact of an ORC for waste heat recovery described by Liu [20], a solar-assisted storage system with hybrid combined cooling heating and power system was investigated bye Wang [21]. It is not possible to combine these individual results because of different assumptions they made or due to different setups which include components that are not part of the novel pumped thermal energy storage. Therefore, an LCA is performed for the entire pumped thermal energy storage system which represents the third contribution in this paper. Finally, these results were compared with the environmental impact of lithium ion batteries as well as lead acid batteries. Since the environmental influences of geothermal energy presented in this paper only represent one possible heat source, these results are not included in the direct comparison between the batteries and the pumped thermal heat storage. Both industrial waste heat and solar thermal energy are also potential heat sources, which would distort the results of the study if any heat source is included in the comparison.

2. Technical Concept

In this section we give a short introduction for the thermal storage system. The technical concept is based on [3] and will be summed up briefly in this paper. The main advantage of this pumped thermal energy storage is, that it becomes more efficient if excess electricity is not converted directly into heat but used to operate a heat pump. Waste heat, which under normal circumstances would have no use anymore, can therefore be exergetically upgraded and stored in a hot water storage. Excess electricity stored as heat can thus be recovered more efficiently with an ORC. With no limiting factors except for the available heat, the size of the PTES can theoretical be upscaled up to a power rating of a conventional power plant. For this a change of the working machines from scroll, piston or screw towards turbo machines would be necessary, which would also increase the power-to-power (P2P) efficiency of the system due to isentropic efficiencies.
In addition to the use of waste heat sources, a further significant advantage of this particular PTES, compared to other systems with separated charging and discharging processes, are the reduced investment costs. Most components can be used for both heat pump and ORC operation. Especially the expensive heat exchangers can be used for both modes. A further option, depending on the design, might be the use of the compressor also as an expander although this may reduce the overall efficiency. Here, the possible investment costs must be compared to the loss of efficiency. Additionally, a throttle and a pump distinguish between the two operating modes (see Figure 2).
The storage capacity can be increased not only with increasing temperature spread between charging and discharging temperature, but also with the storage temperature itself. High storage temperatures increase the Carnot efficiency of the ORC process, allowing the storage volume to be reduced. In contrast, the coefficient-of-performance (COP) of the heat pump decreases as the storage tank temperature increases. Thus, either the investment costs and the economic efficiency of the system or the desired environmental effects determine the optimum of the system parameters.
The overall efficiency of the system, also known as power-to-power efficiency ( η P 2 P ), is therefore better when existing waste heat is upgraded with excess electricity P e x c e s s , for example from solar or wind power. Consequently, significantly better efficiencies are achieved if the surplus electricity is used to operate a heat pump. The resulting exergetically upgraded heat flow Q ˙ is fed into the heat storage tank. If a loss-free heat storage tank is assumed, the heat flow can be converted back into electricity with the ORC ( P O R C ). Thus the P2P efficiency depends directly on the coefficient of performance of the heat pump ( C O P H P ) as well as on the efficiency of the ORC ( η O R C ).
η P 2 P = P O R C P e x c e s s = η O R C · Q ˙ Q ˙ / C O P H P = η O R C · C O P H P
In Equation (1) the losses of the heat storage are not considered. They depend mainly on the storage period and are negligible for a daily operation. If the storage tank is well insulated, the losses to the environment are negligible in comparison to the storage tank capacity. Only internal mixing and loss of the thermal layers cause large exergetic losses, which can be minimized to a large extent by the storage design [22,23]. While small scale applications might use industrial waste heat as a heat source, big scale applications have to rely on energy sources with a scalable output, for example geothermal energy.

3. Geothermal Potential in Germany

Without a continuous (waste) heat supply, the heat storage cannot be operated. In addition to the potential of industrial waste heat or solar thermal heat as sources, geothermal energy can be used to ensure a permanent heat supply for the system, especially on a bigger scale. The analysis of geothermal hotspots in Germany is based on the data available in GeotIS. The main focus is on temperatures for direct power generation, although lower temperature values (85 °C or higher) could also be used to operate the heat pump.
The main focus is on deep geothermal energy, which can be divided into hydrothermal and petrothermal systems [24]. In hydrothermal systems, the heated groundwater in so-called aquifers is used for heat transfer. From a water temperature of approx. 100 °C, electricity can be produced from it [25]. Petrothermal systems on the other hand, mainly use the energy stored in the deep earth rock without access to aquifers. By means of hydraulic stimulation a kind of underground heat exchanger is created [24]. To generate electricity from petrothermal energy, the rocks should have a temperature of at least 150 °C [25].
In Figure 3 the most promising areas in Germany for a geothermal application are colored in orange: The North German basin, the rhine valley in the southwest and the molasse basin in the south. No efficient analysis can be made for the central part of Germany, where geothermal use would also be interesting, as there is simply almost no data available for this area at present [26].
A total of 66 sites in Germany for deep geothermal use were analysed and evaluated. The main criterion is a high temperature gradient, whereby a high temperature is already reached at a shallow depth. Depending on the underlying system (hydrothermal or petrothermal), the depth will vary significantly. Additionally, drilling deeper into the ground also means that the costs for the entire project will increase. Since the construction of a geothermal plant is largely determined by economic viability, thermal anomalies are best suited for geothermal sites. The red dots in Figure 3 represent the best locations for the respective regions. Due to the number of sites considered, only the three best locations per region will be further discussed.
Table 1 shows the results for the hydrothermal analysis of the GeotIS data of Germany. In the North German basin, in the areas of Parchim, Perleberg or Anklam, the necessary temperature of 100 °C is reached at around 2200 m. All other analysed places show similar results in the North German basin with necessary depths between 2200 m and 2700 m. Similarities are found within the Molasse Basin for Mühldorf am Inn, Mindelheim or München, where the depth is around 2000 m. Compared to these two regions, the Rhine Valley is by far the best and can be considered a real hotspot. Landau an der Pfalz represents a real exception. It has the best temperature gradient for hydrothermal systems as it reaches a temperature of 100 °C at around one kilometer. Böhl-Iggelheim aswell as Darmstadt are still good choices, but reach the necessary temperature at a depth of around 1.5 km.
The petrothermal potential looks a bit different for each region. As Table 2 shows, the Molasse basin has no petrothermal potential according to the underlying data of GeotIS. The reason is, that the average temperature for this region is 140 °C for an average depth of 4000 m. With data only available for depths between 4000 and 5000 m and a necessary temperature of at least 150 °C, no further analysis could be made for the Molasse Basin. For the North German Basin, the three best spots completely changed to Vechelde, Celle and Hannover. Here, the temperature of 150 °C is reached at around 3700 km. Even though the top three changed, Parchim, Perleberg and Anklam are still considered good spots as they are in the range between 3900 and 4200 m with several other spots. The Rhine Valley is again the best choice compared to the other regions. Landau an der Pfalz again is significantly better with a required depth of 2150 m. At Böhl-Iggelheim a distance of around 2400 m is required. This time, Karlsruhe takes the third spot for best petrothermal potential in this region

4. Life Cycle Assessment and Environmental Impact

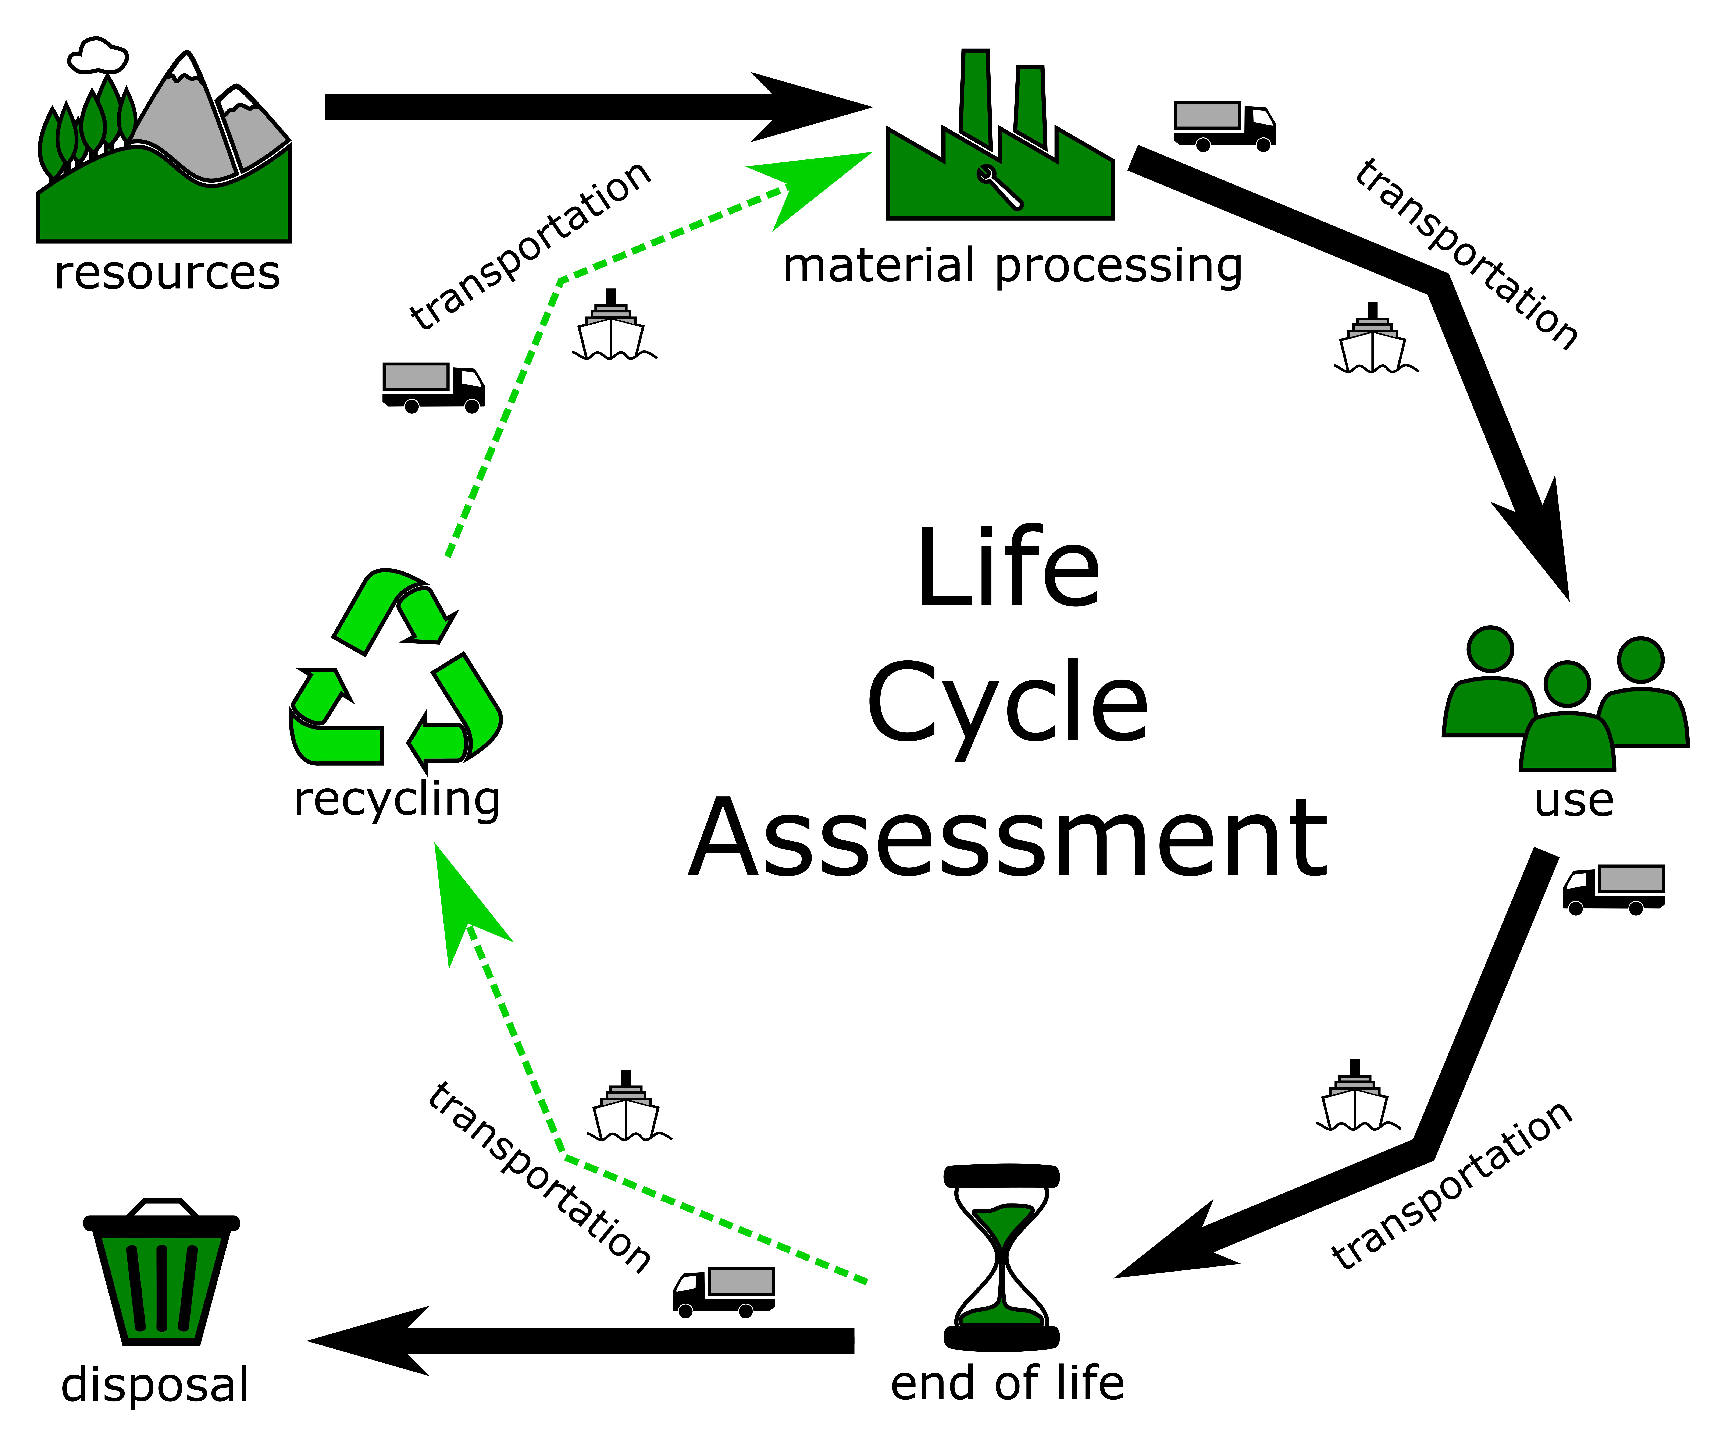
In this section, the general approach of an LCA is further detailed. After that, the methods of an LCA are applied to geothermal stations and the heat storage system.
Overall, an LCA can be divided into the following four phases: definition of the objective and scope of the study, life cycle inventory, impact assessment and, finally, the evaluation. At the beginning, the scope of the investigation and the objective of a project are described. For this purpose, a functional unit is defined which acts as a measurable reference value for standardisation. With this functional unit, a comparison to similar systems can be made. Furthermore, the system boundary is determined to consider all the contained processes. The life cycle inventory describes phase two, in which both input and output data are gathered for the entire life cycle. This includes material and energy flows as well as emissions. These values are standardised to the functional unit so that a comparison with other LCAs is possible in the impact assessment (phase three). For the impact assessment, so-called impact categories are defined according to [27], since the EN ISO 14044 standard does not specify any requirements for this. These categories include for example climate change, ozone formation or acidification. Each category can thus be assigned an equivalent, for example a kg CO2 equivalent for the global warming potential. Finally, the evaluation takes place in three steps. First, significant parameters are determined which have the biggest influence on the results. Then a sensitivity and consistency check is performed and finally a conclusion is drawn from the results.
In this paper an LCA was performed for geothermal stations and the heat storage system. All LCAs were created with the open source software OpenLCA (www.openlca.org). Since there was no access to established, fee-based databases such as Ecoinvent, it was necessary to fall back on the free databases. In these free databases, not every single component was available. If this was the case, other datasets of similar materials were used which get as close as possible to the desired material. This means that the following results will change slightly when using a more detailed database but still provides a good insight into the environmental impacts per se. Furthermore, transport as well as recycling rates for components are included whenever possible. In general, recycling rates were only used if several literature sources made a similar statement, otherwise pessimistic calculations were made with a recycling rate of 0%. Likewise, the extraction and processing of raw materials was based entirely in Germany. As no usable data was available for transport by rail, all transport routes were planned with trucks.
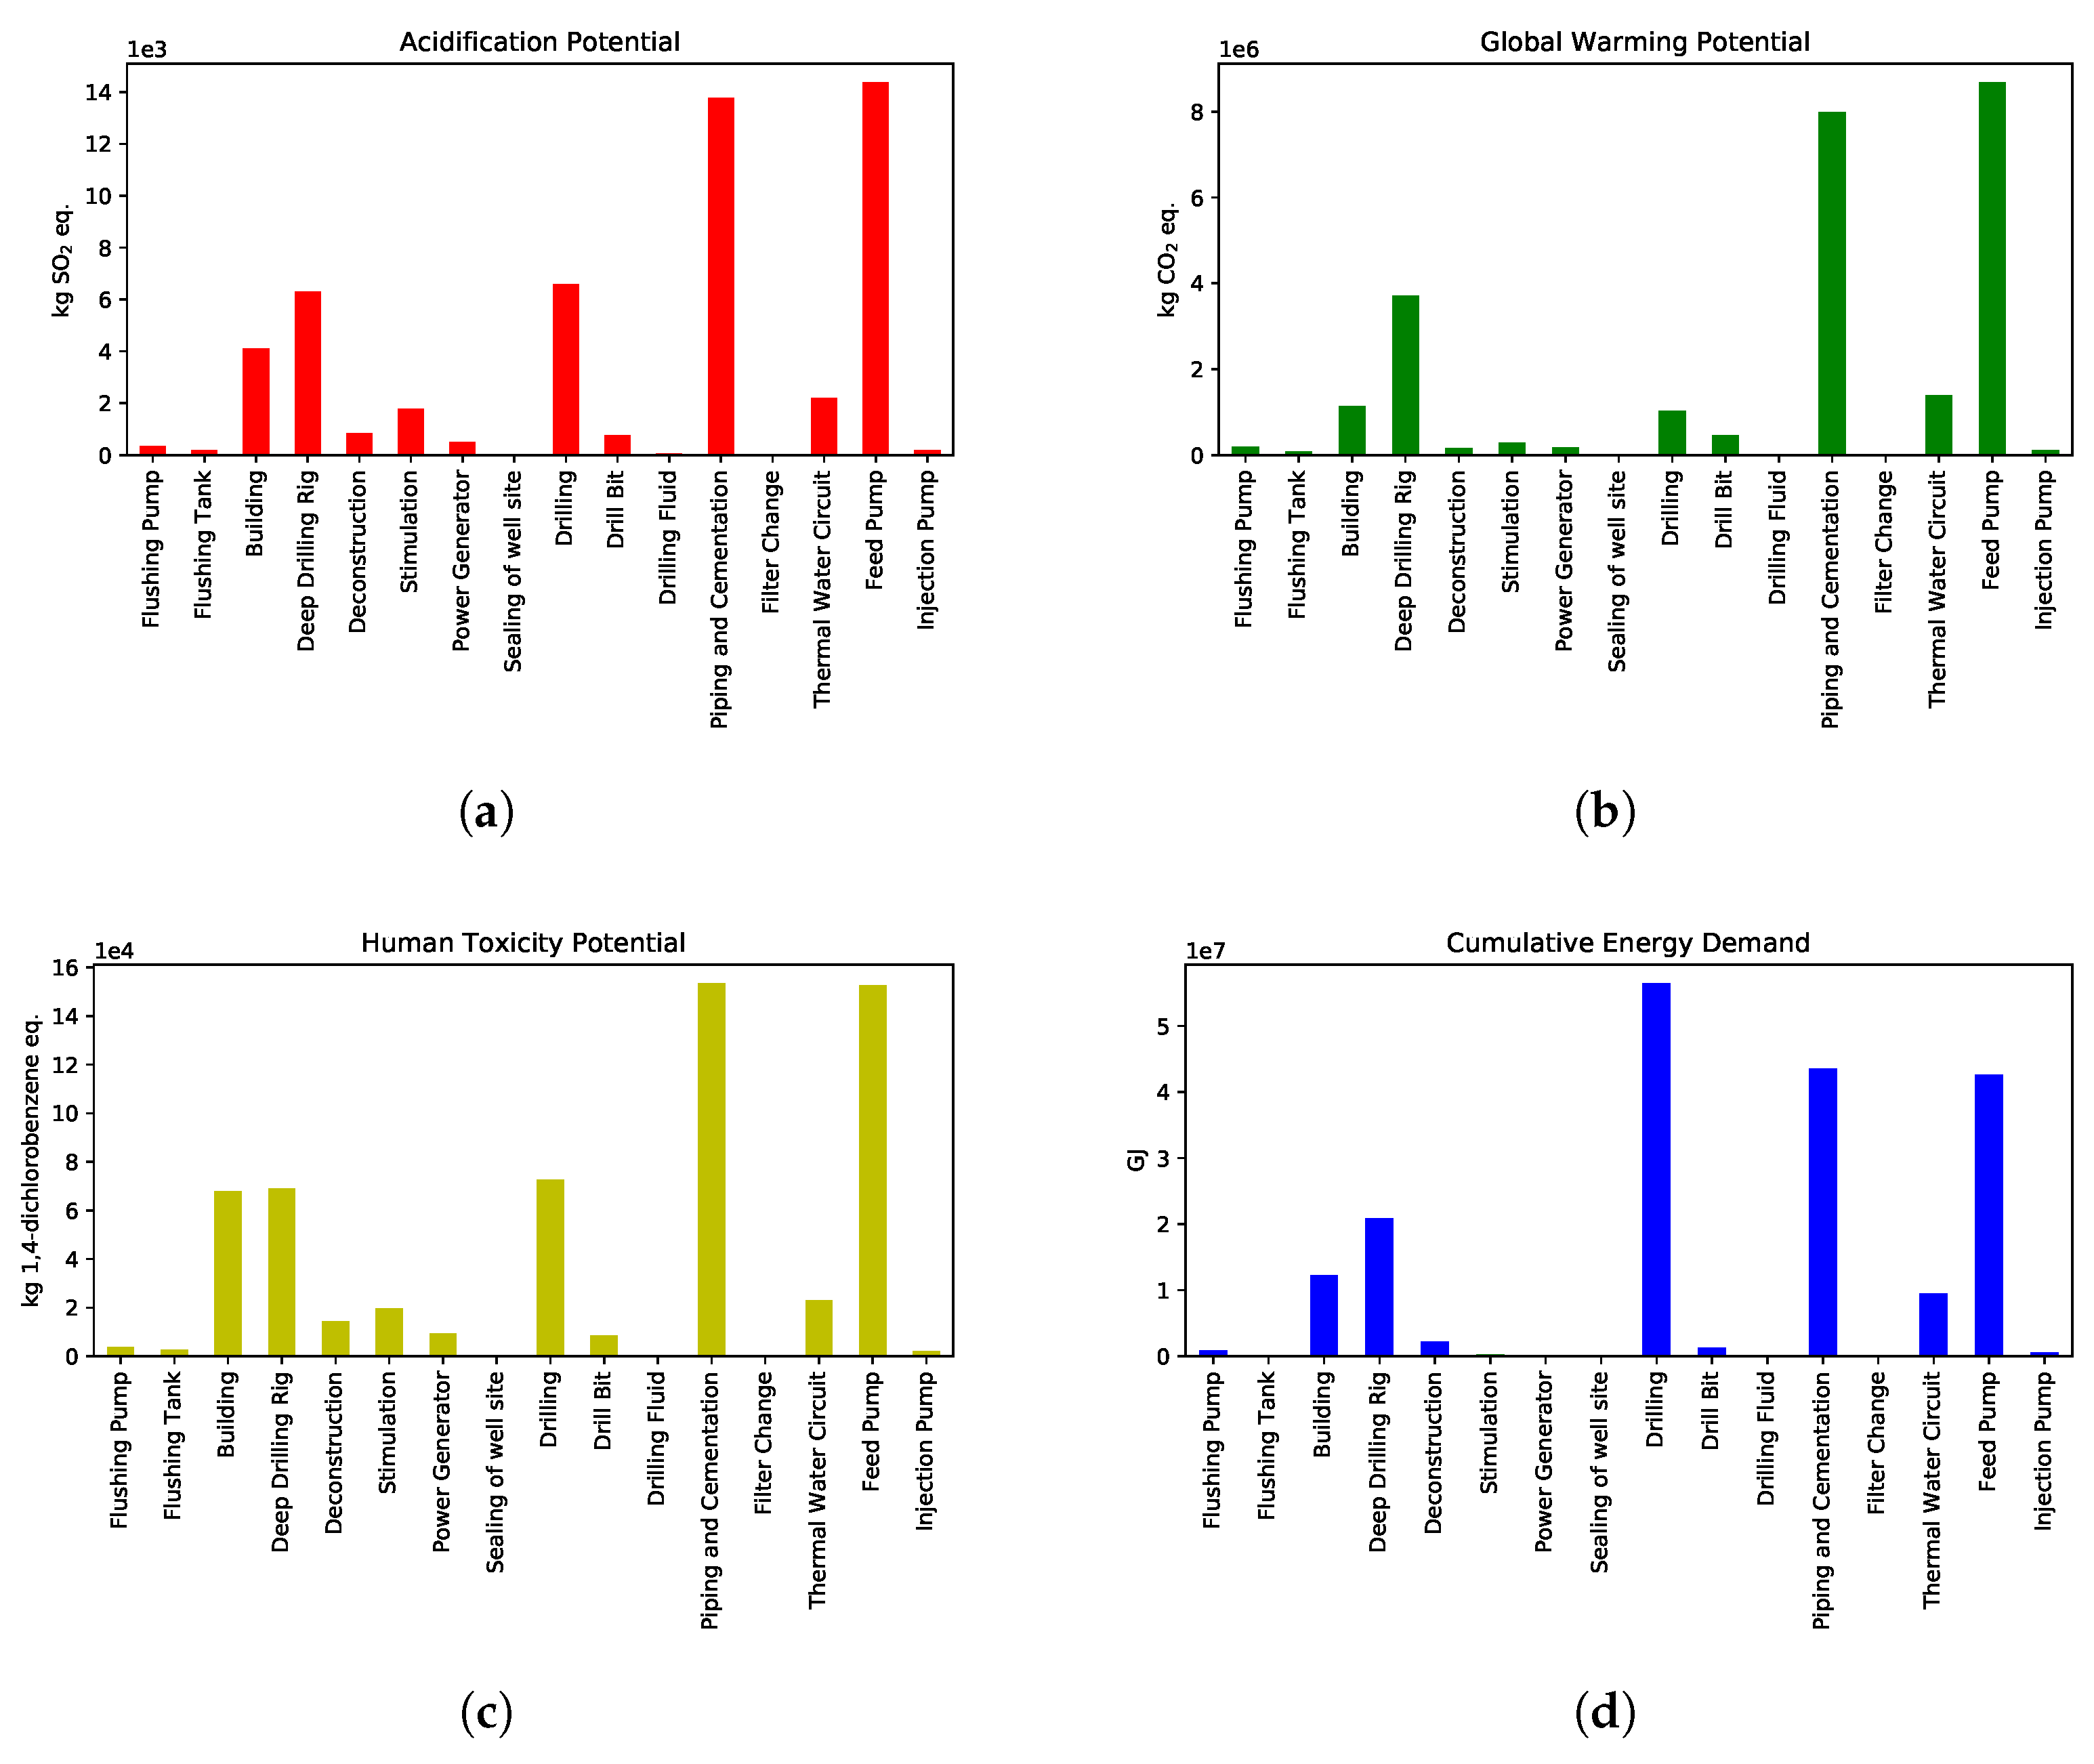
The analysis of the environmental influences was limited to the four probably most important factors: Acidification Potential (AP), Global Warming Potential (GWP), Human Toxicity Potential (HTP) and the Cumulative Energy Demand (CED). The AP is expressed in kg SO2 equivalents and describes the promotion of acidification, which leads to acidification of lakes or soils. The GWP is a measure of the greenhouse gas potential of a gas and is converted into kg CO2 equivalents. The HTP represents the toxicity of substances to humans and refers to 1,4-dichlorobenzene equivalents in kg. The last considered influence is the CED, which describes the energy input for the production of the product in GJ.

4.1. Geothermal Station

Geothermal stations are a huge project in terms of planning and implementation, therefore the right location must be chosen carefully. Since the potential analysis already provides help for the choice of location, the goal is to develop a kind of simplified mathematical representation of LCAgeo. In principle, the LCA for geothermal stations can be represented as written in Equation (2).
L C A g e o ( x [ m ] , v [ m 3 h ] ) = L C A s t a t i c + L C A d e p t h ( x ) + L C A t h e r m a l ( v )
In addition to a static part (LCAstatic), there are also dependancies on the depth x (LCAdepth) and volume flow v (LCAthermal). With LCAstatic, influences are taken into account which remain mostly the same for each geothermal station. These include, for example, the building itself or the stimulation of the subsoil. The first variable part, LCAdepth, depends on the depth of the borehole. A deeper borehole inevitably means more wear of the drill bit and drill head as well as more pipes and cementing necessary for the borehole. However, the drilling depth is linearly included in the overall result, which allows a linear interpolation to be made. The second variable component, LCAthermal, describes the thermal power output. A larger volume flow rate results in a higher thermal output of the system but the pumping effort also increases.
To be able to perform the LCA, a few boundary conditions must be established. The first is an optimistic assumption, namely that two drillings per site can be carried out without complications. Furthermore, a new drilling rig is expected for each location and is assigned to the static part of the LCA. Although a drilling rig can be used several times, this pessimistic assumption takes into account a possible fluctuation in the static part, for example for a larger building or complications with the foundation. The observation period of the whole system and its corresponding operation phase is set to 30 years according to [28].
For the static part, the most important materials with their necessary weigth are summarized in Table 3. It includes the flushing pumps [29], flushing tanks [30], the building [31], the deep drilling rig [32], deconstruction [33], stimulation [31], power generators [34] and the sealing of the well site [33].
For the depth-dependent part of the LCA, the most important materials can be summarized as shown in Table 4. For this purpose, the drilling [35], drilling bit [36], drilling fluid [31] aswell as piping and cementation [31] were taken into account. For the performance-dependent part, no simple representation can be made, since many individual components have a different influence. The filter change [12], thermal water circuit [31], feed pump [37] as well as the injection pump [38] were considered for that part.
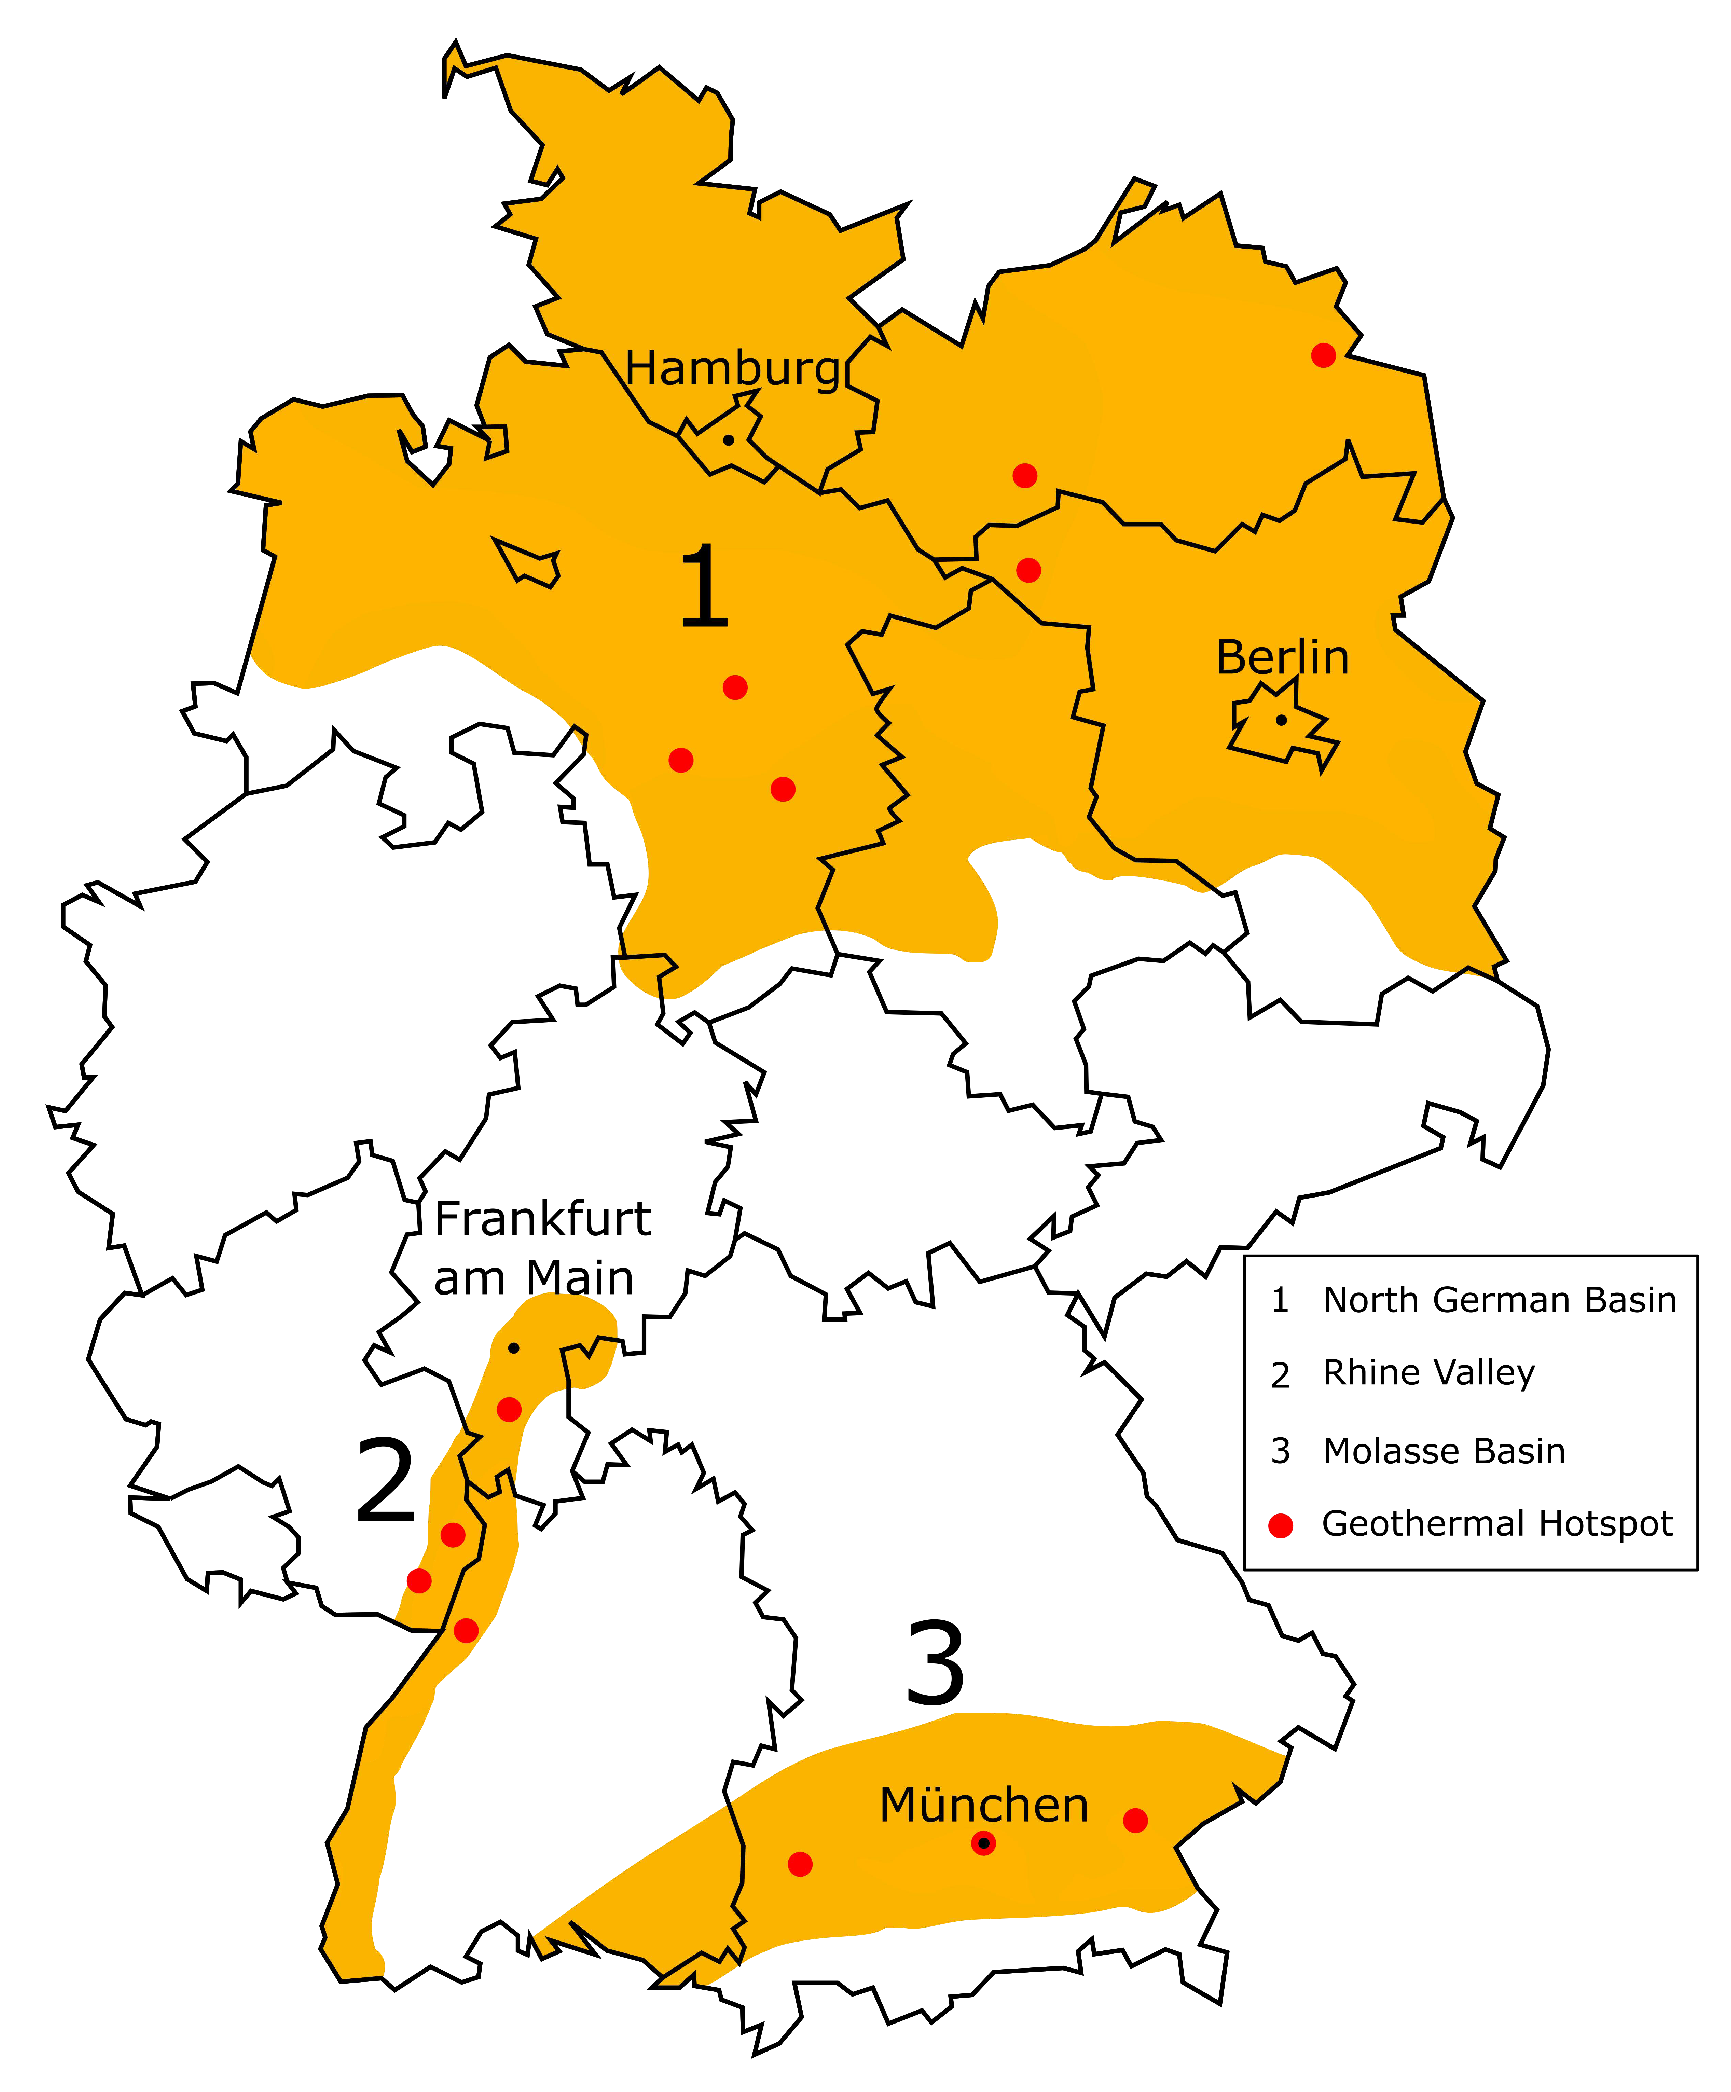
Due to the geological conditions in Germany there are currently far more petrothermal hotspots known than hydrothermal ones, which is why the focus is shifted to them for the detailed LCA analysis. In order to make a statement that is as representative as possible, the LCA is not carried out for the top candidates in the Rhine Valley but for Perleberg in the North German Basin. Perleberg is neither a good nor bad candidate compared to the other locations of that region, which allows a more general statement. The required depth for 150 °C is about 4200 m. Furthermore a thermal power of 38 MW was selected, which corresponds to a thermal volume flow of approx. 241 m 3 /h. This represents the average thermal power of a new geothermal plant. In Figure 4 the results of the LCA for the four investigated environmental influences are compared.
When comparing the results from Figure 4 with each other, it is obvious that the components feed pump, piping and cementation, drilling and drilling rig have the greatest environmental impact. As already mentioned, the drilling rig is based on the pessimistic assumption so its actual influence should be lower. As it is the biggest impact in the static part, influences of a bigger building can therefore be neglected. The strong influence of the feed pump can be explained by its short life time during continuous operation for geothermal stations, which makes it a component that has to be replaced regularly during the 30 years of operation. Piping and cementation mainly occur at the beginning of the project but represent enormous material expenses. The drilling process itself is by far the biggest part in the CED but has a much smaller part in the GWP. This is due to the excessive energy necessary (converted to diesel) which results in equally high values for AP and HTP. Furthermore, components like pressurized tanks or noise barriers were also not included in the figures but included in the final results for Perleberg shown in Table 5.
The results from Table 5 are splitted in the mentioned static and variable parts and displayed in Table 6.
To get a first rough approximation for different locations, mathematical equations were developed based on the results of Perleberg in Table 6. The goal was to shape the equations like Equation (2) with a static part and two variable parts, dependant on the depth x and the volume flow v. For each variable part, a different curve is fitted according to the LCA results. The LCA results dependant on the depth x are linear interpolated, contrary to the volume flow dependant values. The power equation of a pump is a third degree polynomial, which represents the second variable part in Equation (2). The results after fitting the seperate parts to a curve and combining them into one equation are displayed in Equations (3)–(7), with the different parts separated in brackets. With these equations the effects of a geothermal station can be roughly calculated depending on the drilling depth and desired thermal output. For a simpler overview, a part of the volume flow dependent equation was summarized in D ( v ) .
-
Volume flow dependant D
D ( v [ m 3 h ] ) = 5 . 22 · 10 13 · v · ( 136 , 417 · v 2 + 60 )
-
Acidification in kg SO 2 eq
L C A A P ( x [ m ] , v [ m 3 h ] ) = 14 , 867 + ( x · 5 . 07 ) + ( 37 . 92 + v · 8 . 95 + D ( v ) · 14 , 569 )
-
Global Warming in kg CO 2 eq
L C A G W P ( x [ m ] , v [ m 3 h ] ) = 5 , 981 , 086 + ( x · 2268 . 27 ) + ( 8221 . 43 + v · 5767 . 87 + D ( v ) · 8 , 791 , 870 )
-
Human Toxicity in kg 1,4-db eq
L C A H T P ( x [ m ] , v [ m 3 h ] ) = 199 , 175 + ( x · 56 . 17 ) + ( 526 . 64 + v · 93 . 69 + D ( v ) · 154 , 775 )
-
Cumulative Energy Demand in MJ
L C A C E D ( x [ m ] , v [ m 3 h ] ) = 38 , 835 , 085 + ( x · 24 , 227 ) + ( 30 , 507 + v · 39 , 631 + D ( v ) · 43 , 151 , 385 )
First, the necessary depth for 150 °C is determined for the desired location. Then the depth in meters is used for x and the wanted flow rate in m 3 /h for v.
The results of the equations are compared with the results determined in OpenLCA and examined for their deviation from one another (Table 7).
A direct comparison was made between the already existing results of Perleberg (4.1 km and 241 m 3 /h) and the results of the equations. The error of about 0.1% is due to possible rounding errors. To illustrate the influence of x, the depth was reduced by almost 1 kilometer while maintaining the same volume flow. Although the deviation increases minimally, it still remains at roughly 0.1%. The same was done for v, with only the flow rate being reduced from 241 to 95. A greater influence on the error can be seen with deviations between 1 and 1.5%. Finally, the equations were compared with the results for another potential location. The LCA for Rheinau in the Rhine Valley is calculated with OpenLCA and the estimations for a depth of 3192 m and a flow rate of 95. Overall, the error is less than 2%. Therefore it is shown that the equations designed allow the results of the LCA to be calculated relatively well and accurately. For a first estimation of the results a deviation of about 2% is acceptable.

4.2. Pumped Thermal Energy Storage

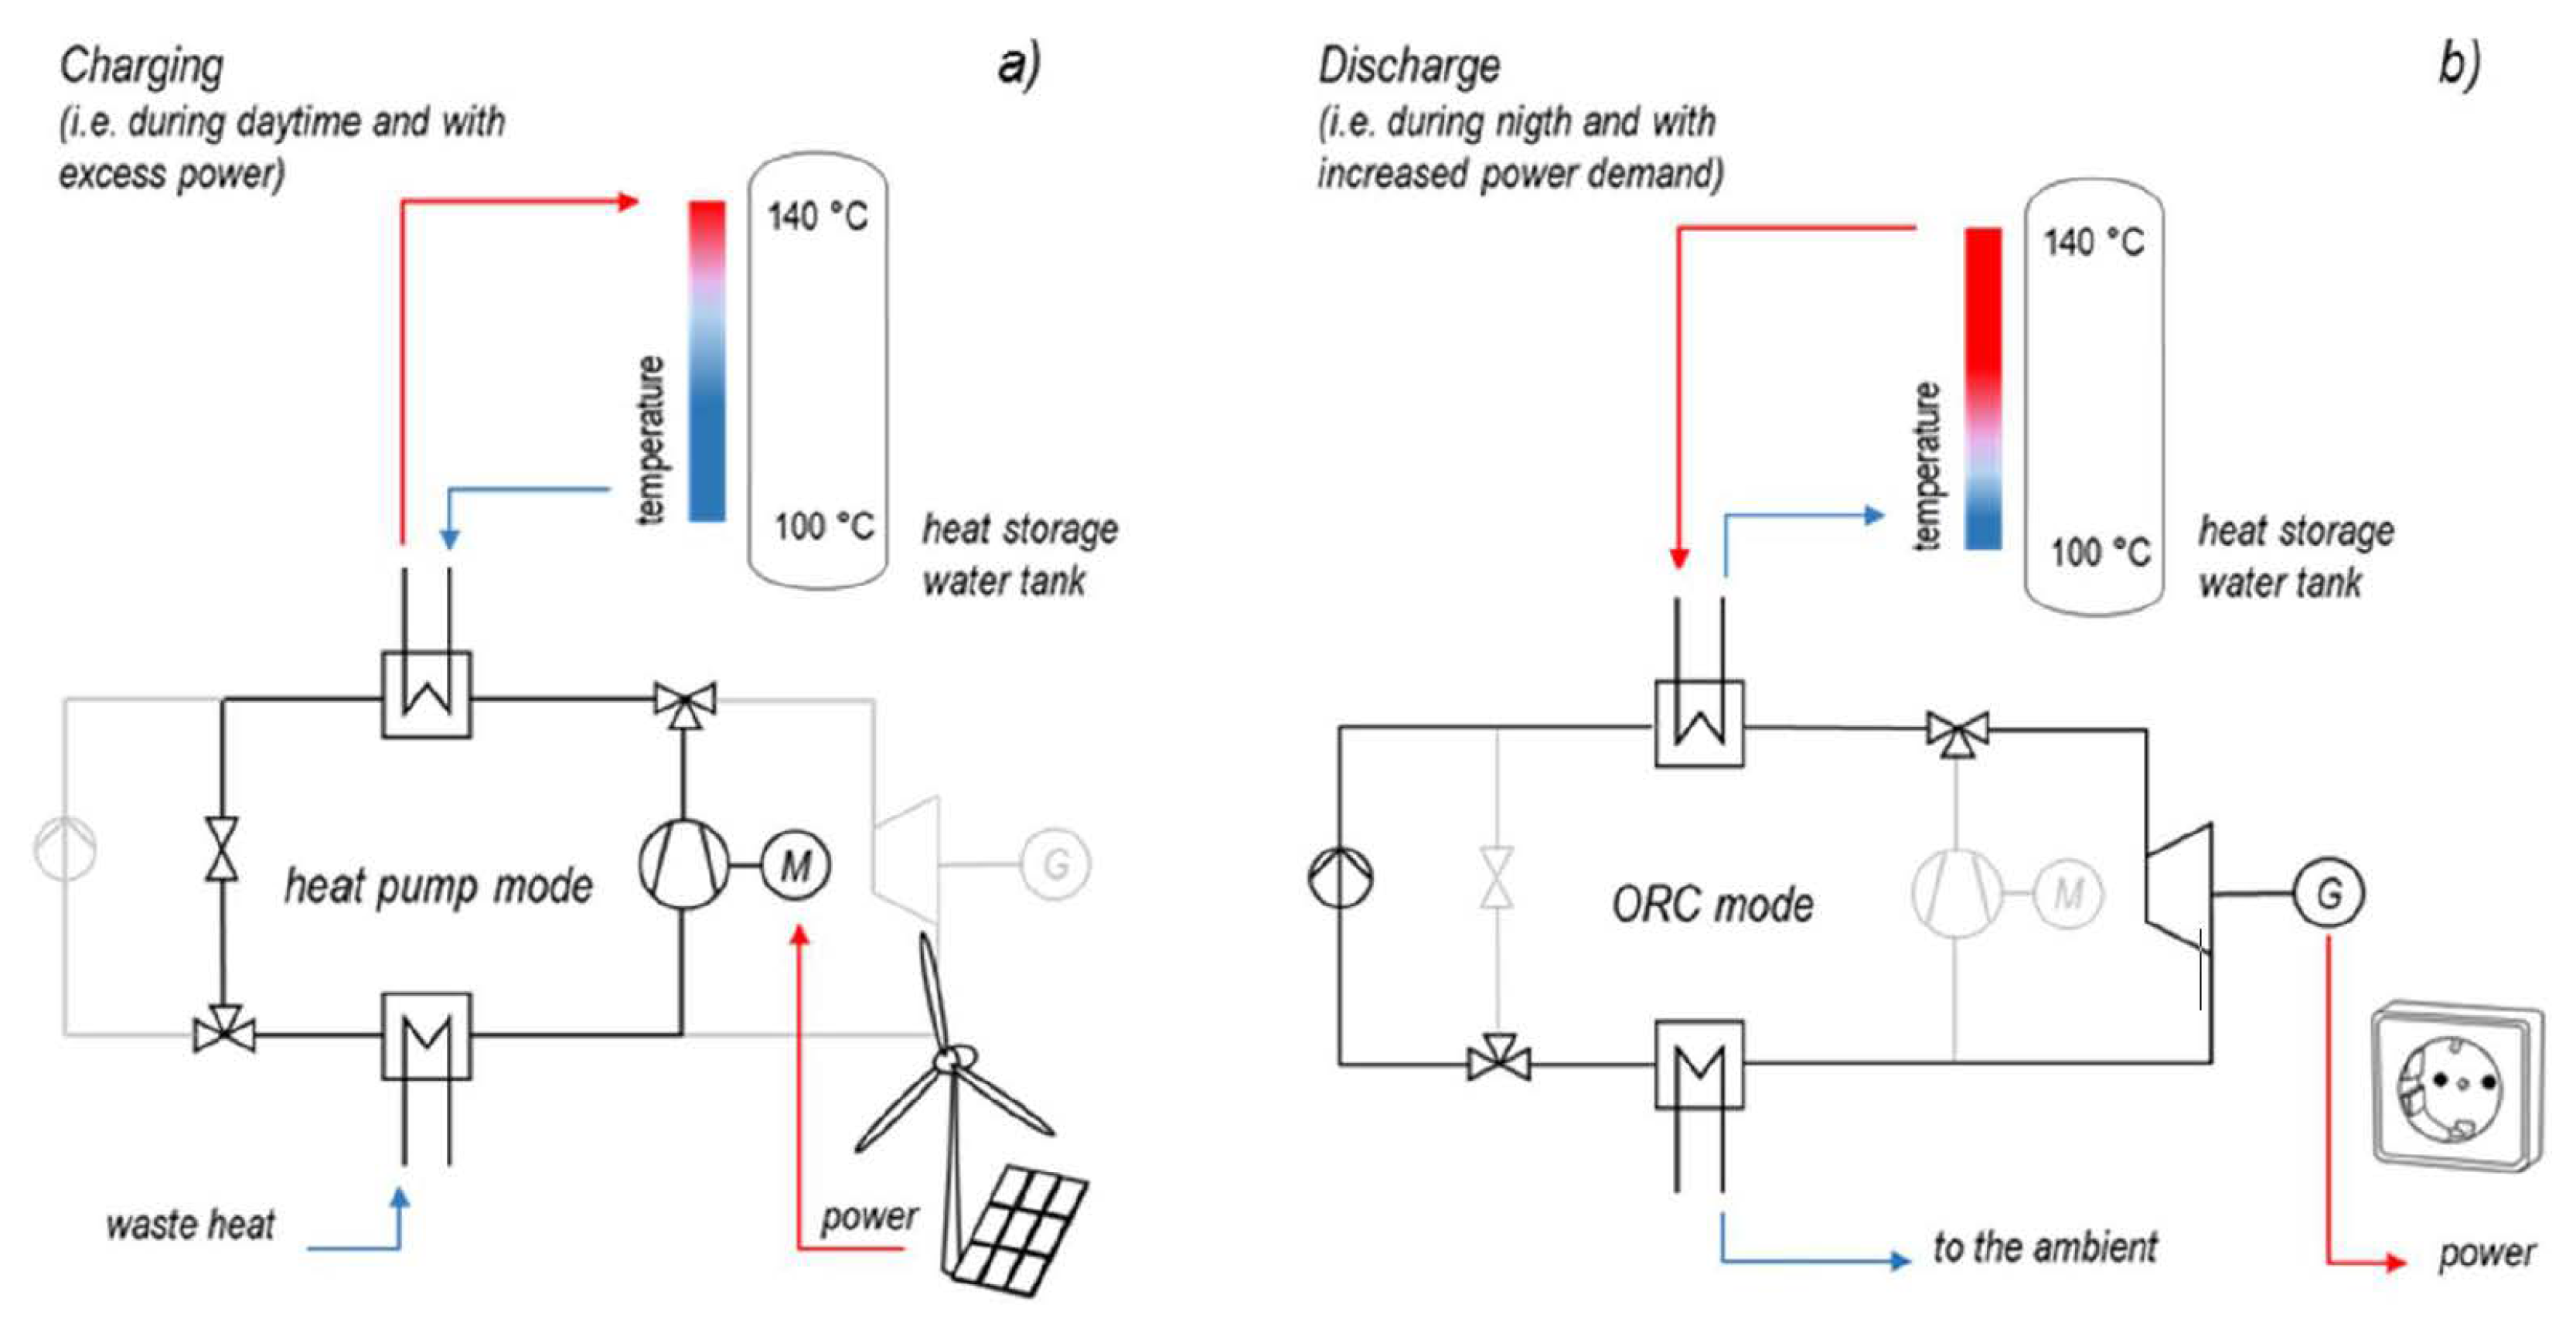
The basic aim of the pumped thermal energy storage is its use as a base load storage unit. This means that the storage tank can be constantly charged and discharged over a period of several hours. For this purpose, the components of the heat pump and the ORC are designed so that a period of 10 hours of constant charging or discharging is guaranteed. For the determination of the COP of the HP and efficiency of the ORC, the model provided in [
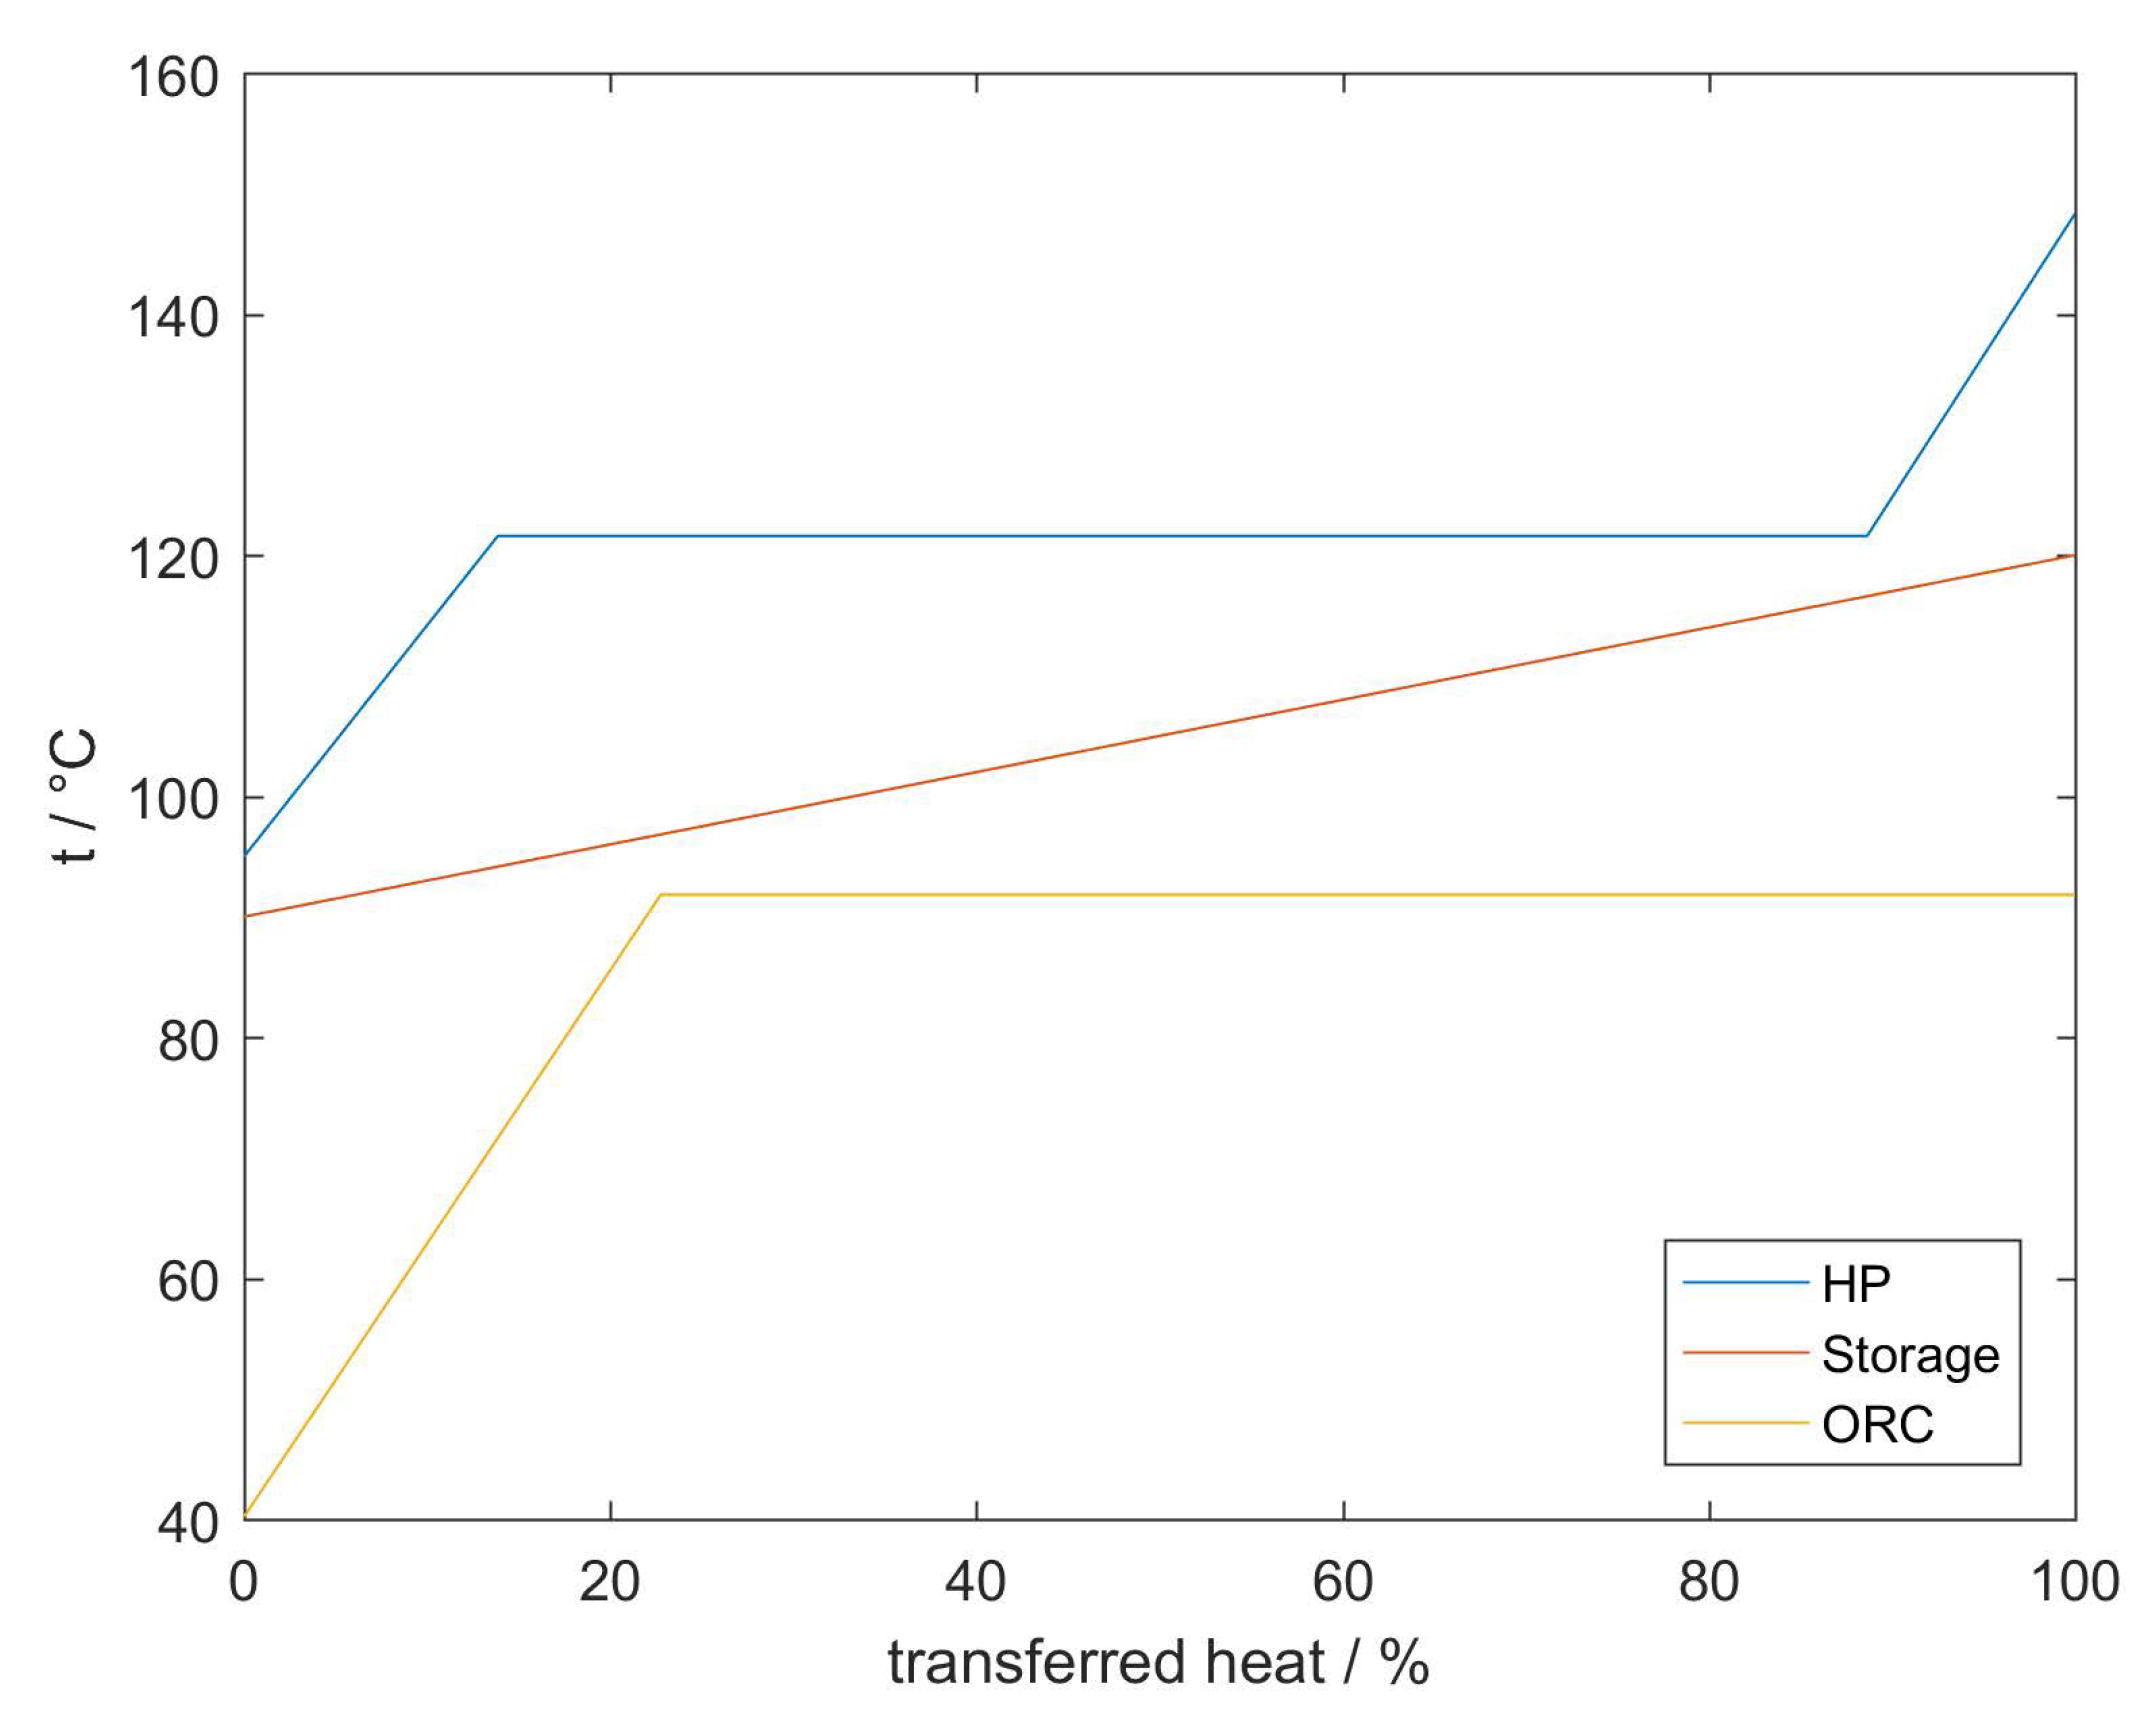
4] was used. The following assumptions for the boundary conditions are involved: a heat source inlet temperature of 85 °C, an outlet temperature of 70 °C after the heat pump evaporator, an evaporation temperature of 65 °C in the heat pump evaporator for the working fluid cyclopentane and a condensation temperature of 121 °C in the heat storage. Together with an isentropic efficiency of 0.7 for the compressor and a pinch point of 5 K in all heat exchangers, this results in a COP of 4.88. For the ORC an evaporation temperature of 91.8 °C and a condensation temperature of 30 °C achieved the best results with an efficiency of 10.25%. The isentropic efficiency is again 0.7. The P2P efficiency is therefore 50.02% for the entire system. In Figure 5 the heat storage heat exchanger is shown in detail with a t-Q-diagram providing the exact temperatures along both ways for the charging and discharging process.
The storage capacity is thus chosen as the functional unit, as the necessary parameters of individual components can be determined based on the storage size. The following components were included in the analysis: generator [34], compressor [39], pump [40], turbine, piping and apparatuses [41], heat exchanger [42], water reservoir [30] as well as the working fluid [43].
In Table 8 an overview of the different compositions for the working machines is given. An identical composition was used for both the compressor and the turbine as they are very similar in their construction but separate machines were considered for the setup. For the required heat exchangers it was assumed that they are mainly made of steel. Therefore, the heat exchangers of the pilot plant were weighed and normalized for their power. The plant section “piping and accessories” is split into two parts for better clarity. The first part describes the pipes themselves, for which estimates of the required overall length are also made based on the pilot plant. The second part describes the accessories which can be described in a simplified way as part of the pipe, for example the throttle or valves. The heat storage is by far the largest component of the system. With a storage capacity of 1 MWh and a temperature difference of 30 °C between charging and discharging, about 28,500 litres of water are required. Assuming a cylindrical water storage tank, the necessary amount of insulating material (rock wool) is calculated in addition to steel. The working fluid of the heat pump and the ORC is cyclopentane.
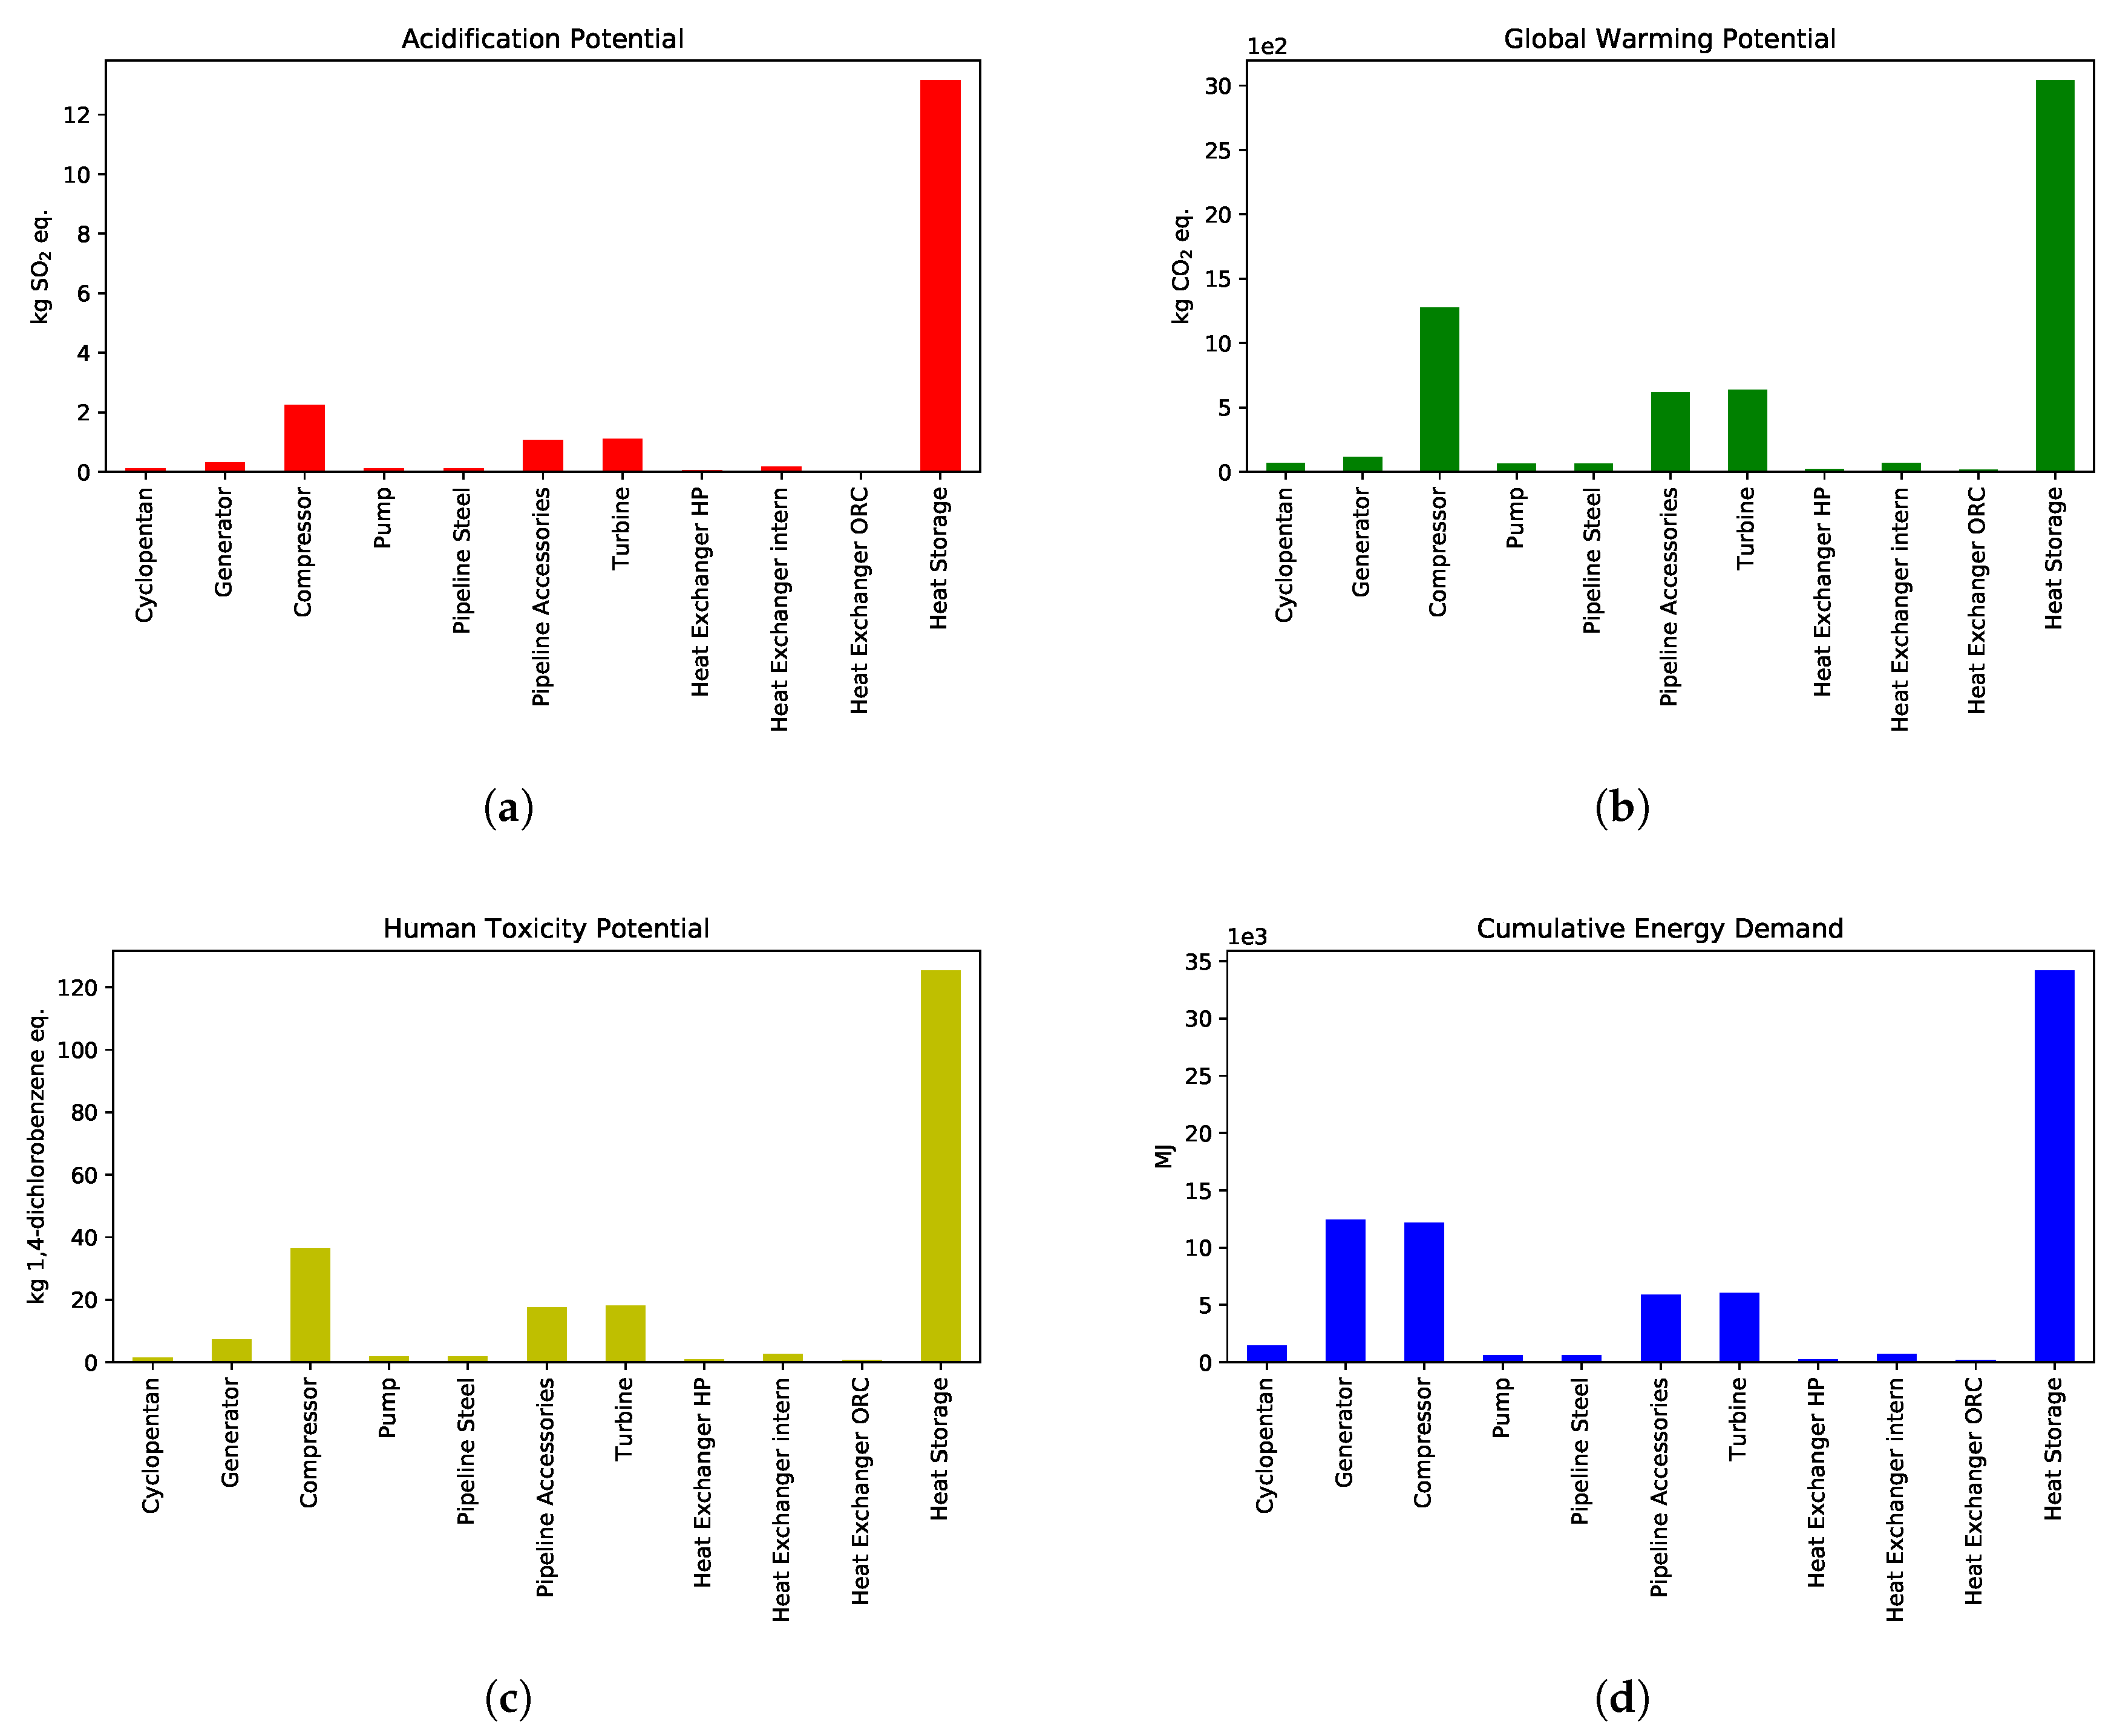
The results of the LCA are shown in Figure 6. It can be clearly seen that the heat storage system has by far the greatest impact on the environment. The mass of steel to be melted, water to be purified and insulation to be produced exceeds the impact of all other plant components by far. In second place is the compressor, which is twice as large as the turbine of the plant. Throttle, valves and other accessories in the piping show that they also make up a proportion not to be underestimated compared to the working machines. Since the P2P efficiency is specified as 50%, the choice of the working fluid does not enter in the LCA as a function of operating parameters, but in those of the construction of the plant. The energy required for the production of cyclopentane was calculated based on [43]. For the calculation of the GWP, an equivalent of 11 kg carbon dioxide per 1 kg of cyclopentane was included in the calculations.
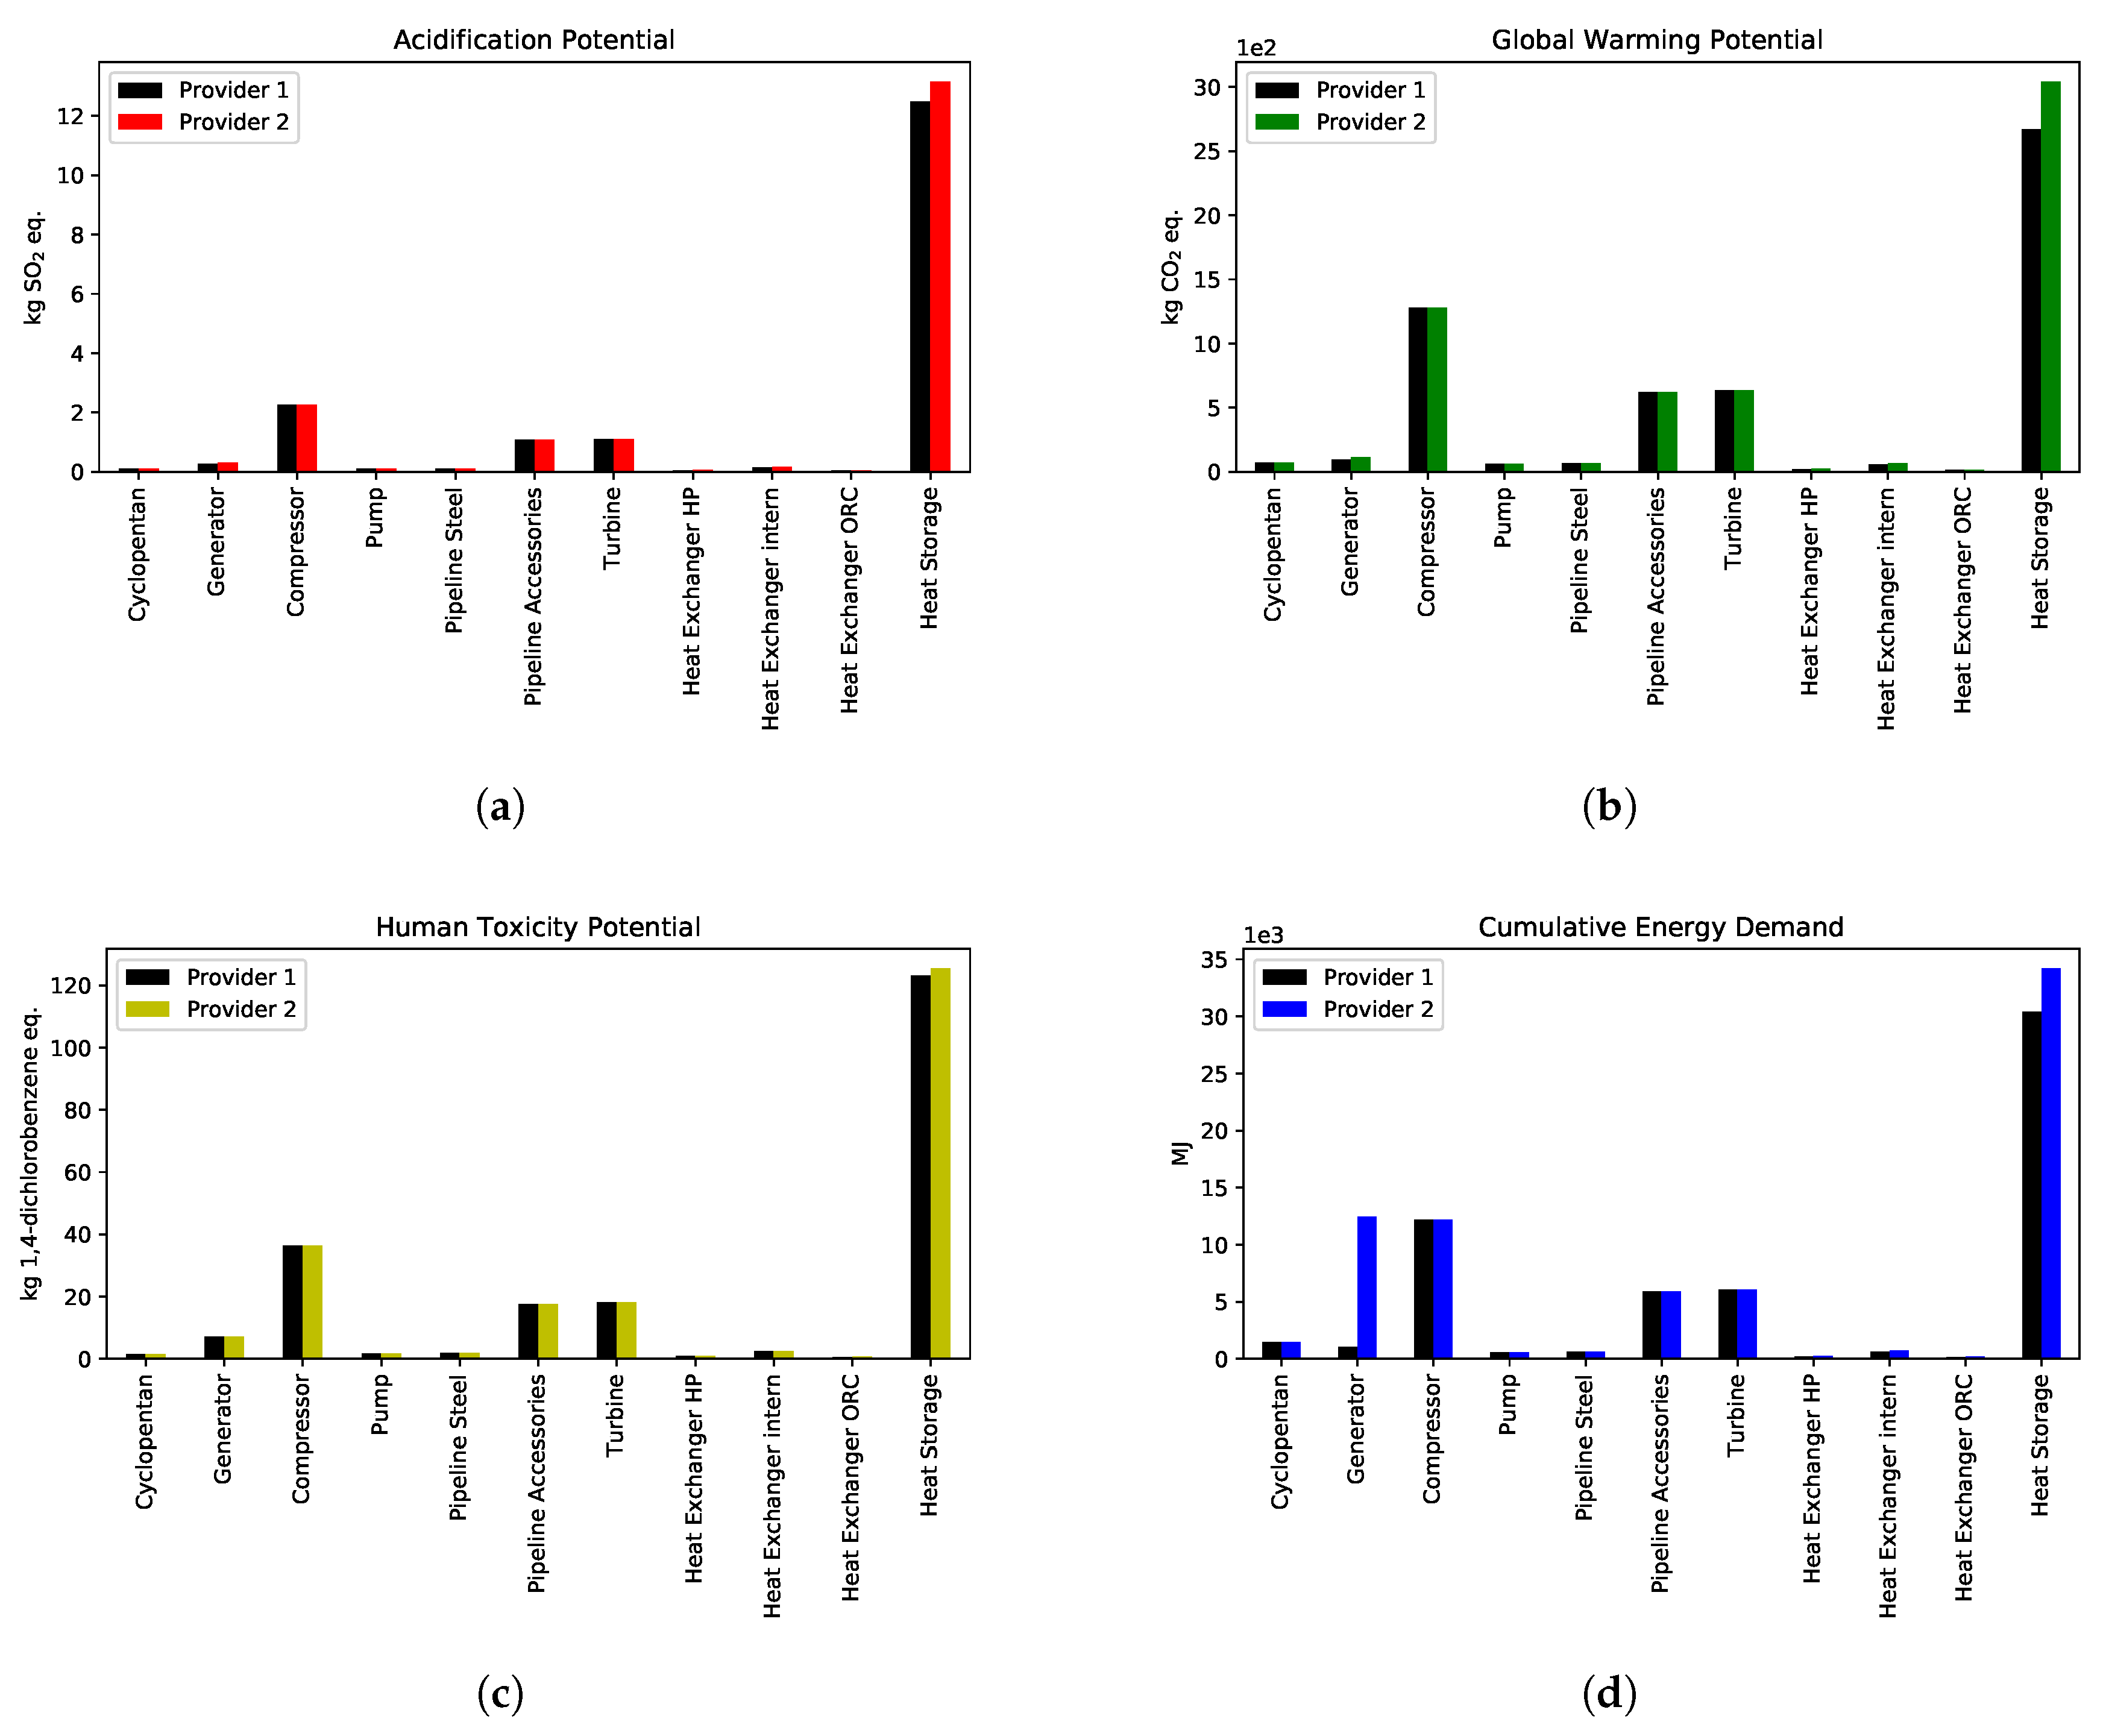
Many results depend on the provider used for steel in the software OpenLCA. A provider contains necessary data of a material to calculate the environmental impact of a process. With another provider available for steel in the free databases used, a sensitivity analysis is recommended. The results of both providers are displayed in Figure 7 and show that there are hardly any differences across the storage components between the two providers. Only for the heat storage unit itself are small differences visible. As the differences between the providers are unknown, the more pessimistic provider 2 was used for the calculations due to the many simplifications already made.
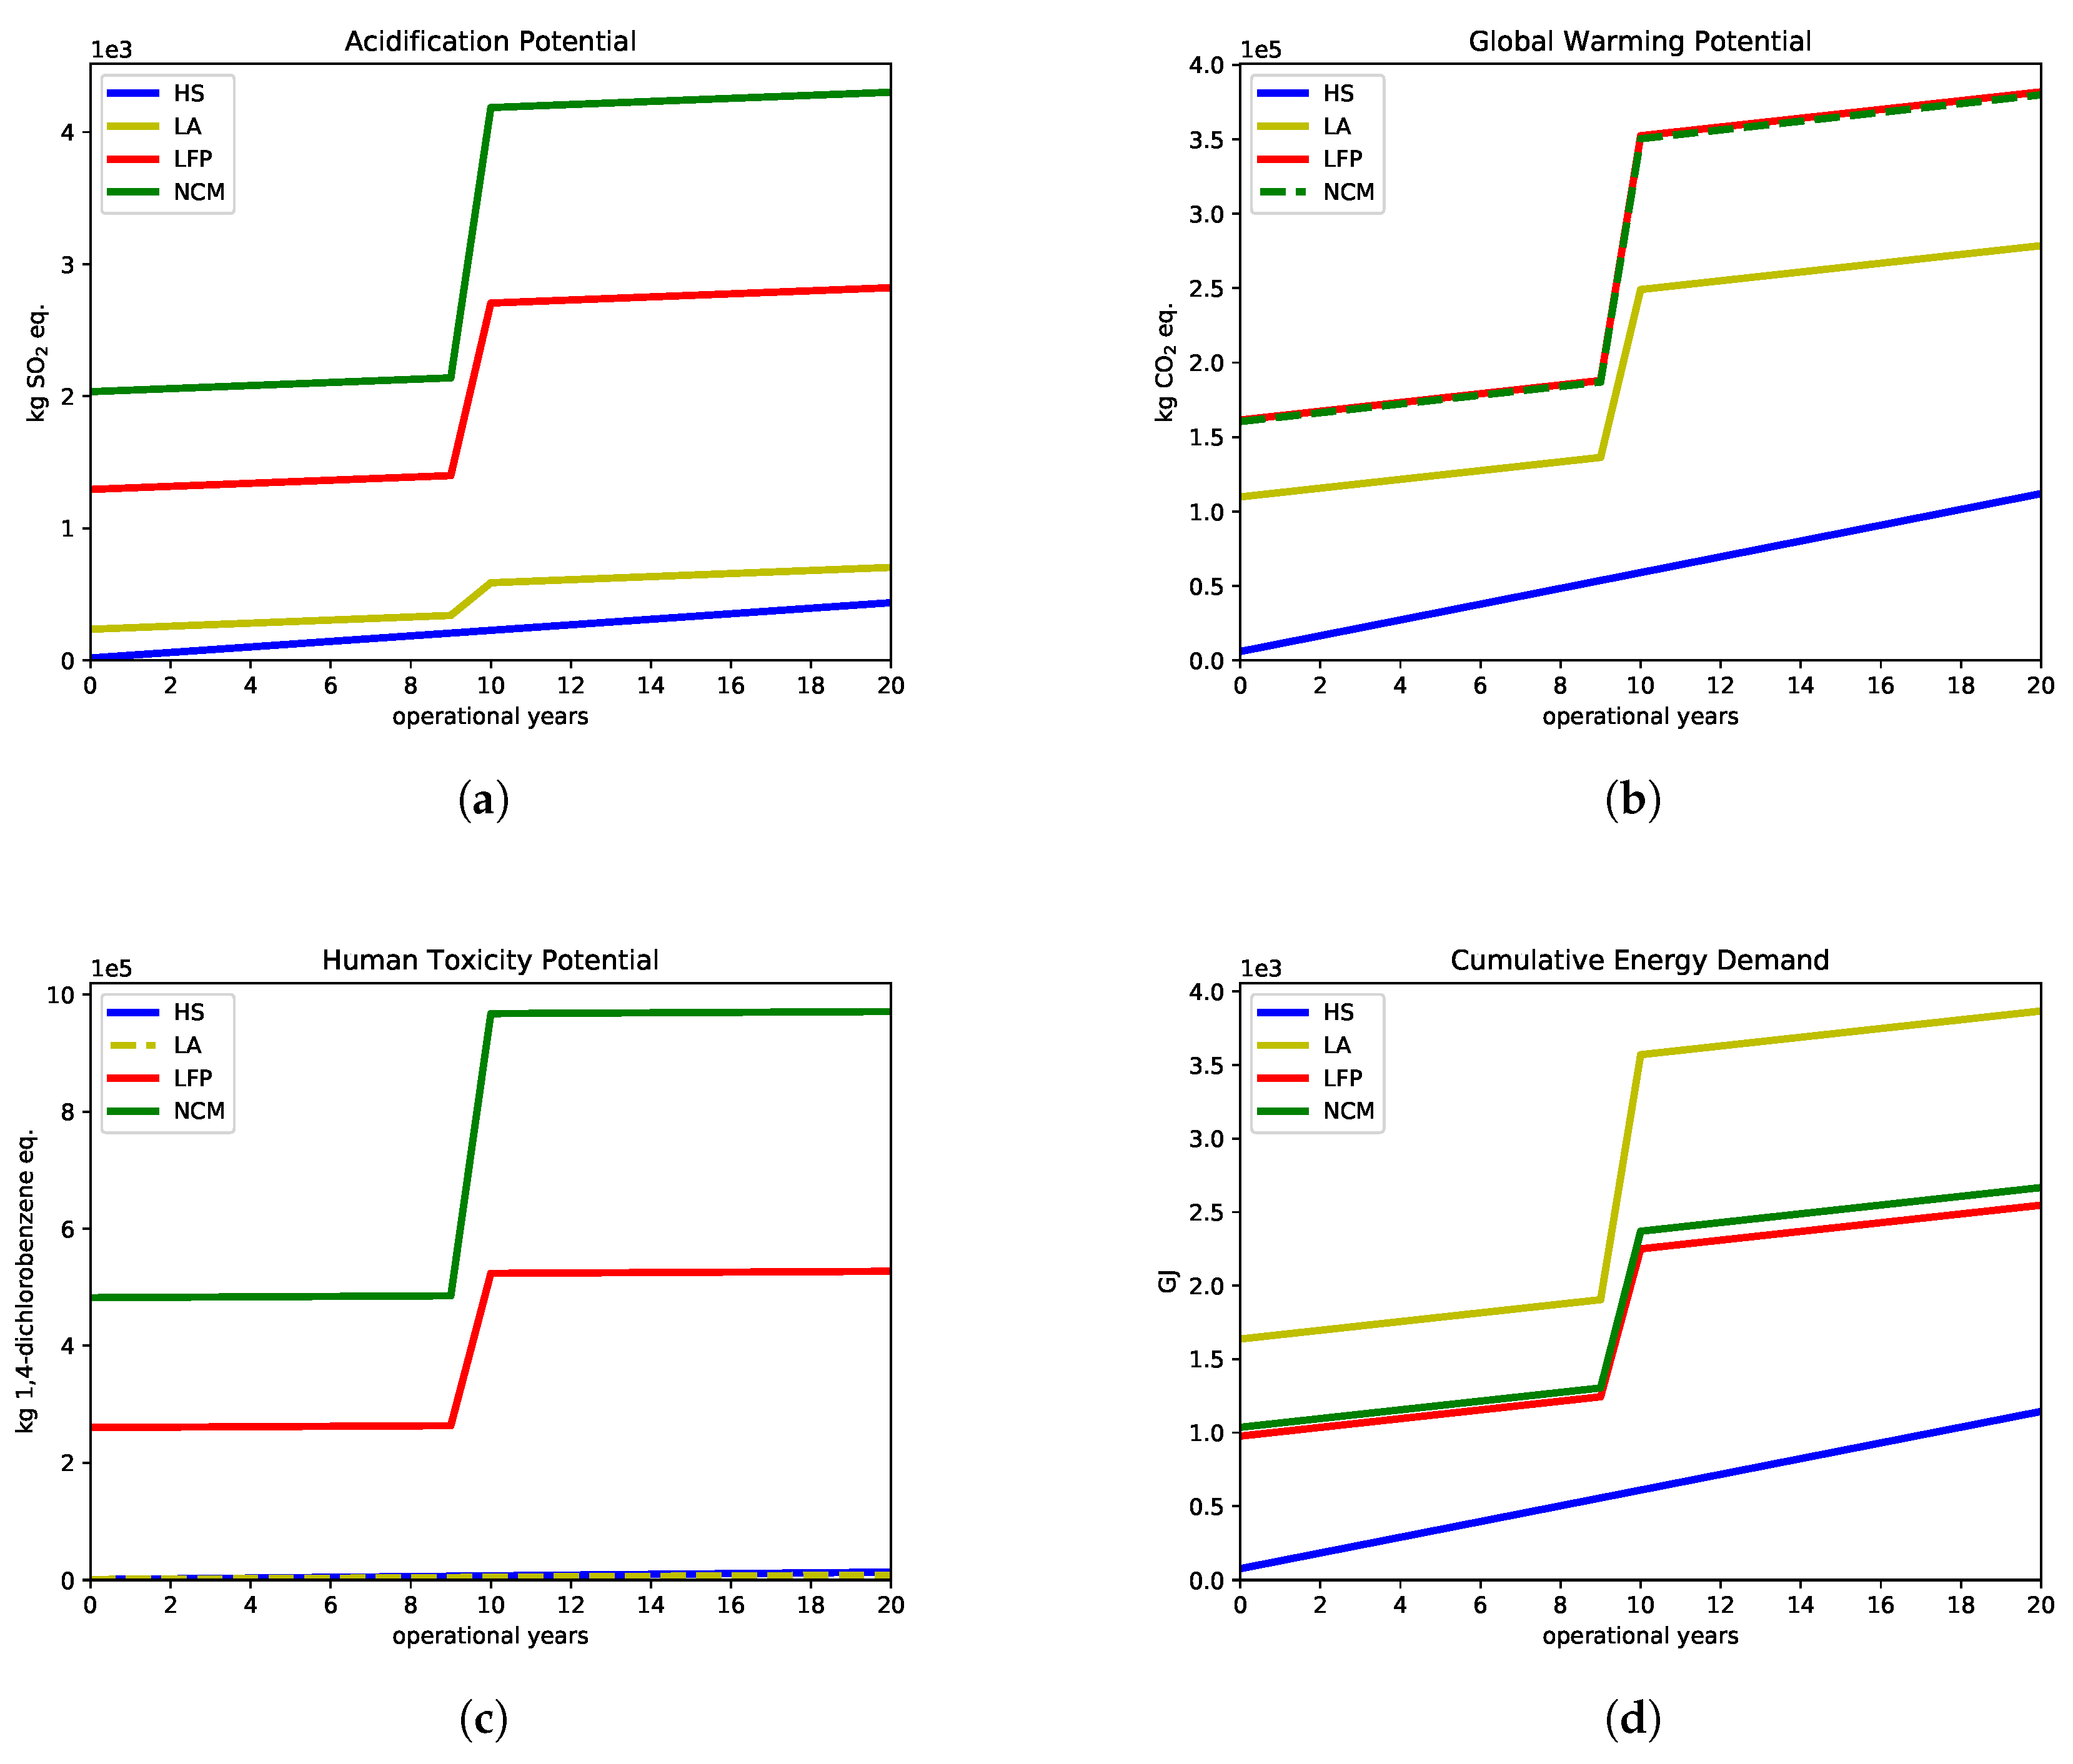
In summary, it can be said that, with regard to the production of the storage system, the heat storage is the decisive component for environmental pollution. In addition to its production, the operation of the storage system must also be examined. According to the sources cited, all components have a service life of 15 to 30 years, therefore the service life of the entire system is set at 20 years for further consideration. For the analysis of the operation, three different power-mix scenarios were examined and compared. The first one represents a mix of renewable and fossil energy sources according to ELCD database 2.0. The next is photovoltaic electricity from monocrystalline silicon modules, based on the NEEDS database of 2003. The last case considers electricity from wind power, also according to ELCD database 2.0. According to [44], a stationary energy storage system for the integration of renewable energies experiences 400 full storage cycles per year. At a P2P efficiency of 50% and a storage capacity of 1 MWh, the electricity input amounts to 800 MWh per year. The output and the losses are both 400 MWh each. In Table 9 the environmental factors for the production as well as for the operation with different power sources are compared. It can be clearly seen that the production of the storage system is surpassed by its operation in one year. As expected, the electricity mix shows the worst results, as it still contains a high proportion of fossil fuels. Since the data for photovoltaic electricity is based on a dataset from 2003, better values are very likely to be expected with the current state of the art, but it is unlikely that the values from wind power can be surpassed. This can be explained by the fact that the energy-intensive production and processing of silicon is not comparable to the construction of a wind turbine.

5. Comparison with Batteries

In order to better evaluate the LCA of the heat storage system, it is compared with the most common battery systems without the influence of any heat source. Lead-acid batteries as well as lithium-ion batteries are used as a reference. The lead battery has been used for many years in motor vehicles as well as stationary power storage in industry and residential buildings. Lithium ion batteries are widely used in the portable sector but are also increasingly used as stationary energy storage devices. For lithium ion batteries, only the lithium iron phosphate battery (LFP) and the lithium nickel cobalt manganese oxide battery (NCM) are considered in detail.
For the three battery systems all displayed results are literature values. They refer to a functional unit of 1 kWh electricity output and were scaled linearly to 1 MWh for a better comparison. Since the literature values also contain no or hardly any transport for use, similar transport routes like for the heat storage system are added. The data used are shown in Table 10 and are based for the lead acid battery on the results of [45,46,47], for LFP and NCM on [48]. In the categories considered, it can be seen that the lead-acid battery only performs worse than the lithium-ion battery in the CED.
The operating phase is analysed in the same way as the heat storage tank but the focus is now only on wind power. The analysis with a mix of fossil and renewable electricity served to illustrate the immense influence of fossil versus renewable power generation on the environment. Similarly, an analysis with photovoltaic electricity is not included as the free database used is outdated and would therefore distort the comparison. The P2P efficiency of all battery systems is set at 90% with a life span of 10 years [44].
The operating time as well as the annual number of cycles is assumed to be identical to the pumped thermal energy storage system, which means that two battery storage units are necessary over the course of 20 years. This necessity can be seen in the results in Figure 8 between years 9 and 10. None of the four curves in the individual diagrams start from zero, as this represents the production of the storage systems. The higher the starting value of a curve, the greater the impact of this system on the environment. Accordingly, the jump in the curve is equal to the start value. In comparison, lithium-ion batteries are by far the biggest environmental polluters in the AP, GWP and HTP categories. Only in terms of CED they are better than lead-acid batteries. The lead-acid battery is closer to the lithium-ion batteries in the GWP, but has very similar values to the heat storage in the AP and HTP categories. Overall, the pumped thermal energy storage performs best in all categories analysed.

6. Conclusions

In Germany, the geothermal potential is widely available for petrothermal systems. The Rhine Valley region performs best, but the North German Basin with its large spatial extension and high number of thermal anomalies should not be underestimated. The LCA for geothermal stations estimates the environmental impact for an operating time of 30 years. Correlations for a first rough estimation of the environmental impacts AP, GWP, HTP and CED of geothermal stations were developed. It turned out that there is a static part and two variable influences. The first variable is the drilling depth of the plant and thus the desired temperature level. It was also shown that the drilling and associated work steps such as the cementing of the borehole are among the largest sources of environmental impact. During operation, the production pump with its short service life dominates, which primarily describes the second variable part: the thermal output of the station.
An LCA was also carried out in accordance with the European standard for the new type of heat storage system presented, because despite the simpler design, no comparable LCA for a storage system of this type was found in the literature. Although the LCA could only be analysed with free databases, there is a first good approximation for the environmental impacts of this storage system. In all categories examined, it was found that the heat storage unit itself has the greatest environmental impact compared to the other components. This is mainly explained by the high mass of steel and insulation material. A more detailed analysis of the operating phase shows, that production is not the dominant factor. Due to the low P2P efficiency of 50%, the emissions in the second year of operation already exceed the effects of production, regardless of the electricity mix. Finally, the comparison with battery storage systems showed that when operated with electricity from pure wind power, the pumped thermal energy storage system is consistently more environmentally friendly than the lithium-ion or lead-acid batteries under consideration. This is the impact of rare earths and quantities of different chemicals in the battery systems compared to a storage with hot water and made out of steel. This topic will be part of a future work. The efficiencies of the heat pump as well as the ORC have a decisive influence on the P2P efficiency of the storage system. A more detailed analysis should show in which order of magnitude the environmental influences can be reduced if the P2P efficiency can be increased to 60% or even 70%.
The LCA results are based on data sets available free of charge, so they should only be used as a first rough guide. They can be further specified or improved with commercially available data sets such as Ecoinvent. However, these initial findings show that a potential large-scale use of the storage system is best in northern Germany in terms of an environmental impact. Heat anomalies in the North German Basin as well as off- and onshore wind farms in the North of Germany can cover the electricity and heat demand of the storage system in the most environmentally friendly way. The supply of heat or electricity are both limiting factors for the storage system, which is why for future work the focus will be shifted away from Germany to a more international level. Other countries such as Indonesia or Turkey use geothermal energy far more successfully, which makes the use of the system in these countries more interesting. Besides an analysis of the heat supply in other countries, the supply of surplus electricity is also a factor that influences the operation of the storage a lot. A worldwide potential analysis for different applications of the system should answer these questions in the future.

Author Contributions

D.S., B.E., P.S., J.Z., P.B., J.K., S.W., M.P. and R.G. developed the concept and work on the research project; D.S., B.E., P.S. and J.Z. did the calculations and simulations; D.S., P.S. and J.Z. wrote the paper. All authors have read and agreed to the published version of the manuscript.

Funding

We acknowledge support by the Bavarian Ministry of Economics through funding of the Energy Campus Nuremberg (EnCN) and Deutsche Forschungsgemeinschaft and Friedrich-Alexander-University Erlangen-Nürnberg (FAU) within the funding programme Open Access Publishing.

Conflicts of Interest

The authors declare no conflict of interest.

References

  1. Ogunniyi, E.; Pienaar, H.C. Overview of Battery Energy Storage Systems Advancement for Renewable (Photovoltaic) Energy Applications. In Proceedings of the International Conference Towards sustainable energy solutions for the developing world, Cape Town, South Africa, 4–5 April 2017. [Google Scholar]
  2. Sarbu, I.; Sebarchievici, C. A Comprehensive Review of Thermal Energy Storage. Sustainability 2017, 10, 191. [Google Scholar] [CrossRef] [Green Version]
  3. Staub, S.; Bazan, P.; Braimakis, K.; Müller, D.; Regensburger, C.; Scharrer, D.; Schmitt, B.; Steger, D.; German, R.; Karellas, S.; et al. Reversible Heat pump-Organic Rankine Cycle Systems for the Storage of Renewable Electricity. Energies 2018, 11, 1352. [Google Scholar] [CrossRef] [Green Version]
  4. Eppinger, B.; Zigan, L.; Will, S. Simulation of a pumped thermal energy storage based on a reversible hp-orc system. In Proceedings of the 5th International Seminar on ORC Power Systems, Athens, Greece, 9–11 September 2019. [Google Scholar]
  5. Haenel, R.; Staroste, E. Atlas of Geothermal Resources in the European Community, Austria and Switzerland; The Schaefer: Hannover, Germany, 1988. [Google Scholar]
  6. Jung, R.; Röhling, S.; Ochmann, N.; Rogge, S.; Schellschmidt, R.; Schulz, R.; Thielemann, T. Abschätzung des technischen Potenzials der geothermischen Stromerzeugung und der geothermischen Kraft-Wärmekopplung (KWK) in Deutschland; Archiv-Nr. 122 458; Büro für Technikfolgenabschätzungen beim Deutschen Bundestag: Berlin, Germany, 2002. [Google Scholar]
  7. Paschen, H.; Oertel, D.; Grünwald, R. Möglichkeiten geothermischer Stromerzeugung in Deutschland; Arbeitsbericht Nr. 84; Büro für Technikfolgenabschätzungen beim Deutschen Bundestag: Berlin, Germany, 2003. [Google Scholar]
  8. Agemar, T.; Alten, J.A.; Ganz, B.; Kuder, J.; Kühne, K.; Schuhmacher, S.; Schulz, R. The Geothermal Information System for Germany—GeotIS. Zeitschrift der Deutschen Gesellschaft für Geowissenschaften 2014, 165, 129–144. [Google Scholar] [CrossRef]
  9. Suchi, E.; Dittmann, J.; Knopf, S.; Müller, C.; Schulz, R. Geothermie-Atlas zur Darstellung möglicher Nutzungskonkurrenzen zwischen CO2-Einlagerung (CCS) und Tiefer Geothermie in Deutschland. German J. Geosci. 2014, 165, 439–453. [Google Scholar]
  10. Weber, J.; Born, H.; Moeck, I.S. Geothermal Energy Use, Country Update for Germany 2016–2018. In Proceedings of the European Geothermal Congress 2019, Den Haag, The Netherlands, 11–14 June 2019. [Google Scholar]
  11. EN ISO 14044. Environmental Management—Life Cycle Assessment—Requirements and Guidelines; ISO: Geneva, Switzerland, 2006. [Google Scholar]
  12. Frick, S.; Kaltschmitt, M.; Schröder, G. Life cycle analysis of geothermal binary power plants using enhanced low temperature reservoirs. Energy 2010, 35, 2281–2294. [Google Scholar] [CrossRef] [Green Version]
  13. Karlsdottir, M.R.; Heinonen, J.; Palsson, H.; Palsson, O.P. Life cycle assessment of a geothermal combined heat and power plant based on high temperature utilization. Geothermics 2020, 84, 101727. [Google Scholar] [CrossRef]
  14. Pratiwi, A.; Ravier, G.; Gentner, A. Life-cycle climate-change impact assessment of enhanced geothermal system plants in the Upper Rhine Valley. Geothermics 2018, 75, 26–39. [Google Scholar] [CrossRef]
  15. McCay, A.T.; Feliks, M.E.J.; Roberts, J.J. Life cycle assessment of the carbon intensity of deep geothermal heat systems: A case study from Scotland. Sci. Total Environ. 2019, 685, 208–219. [Google Scholar] [CrossRef]
  16. Koroneos, C.J.; Nanaki, E.A. Life cycle environmental impact assessment of a solar water heater. J. Clean. Prod. 2012, 37, 154–161. [Google Scholar] [CrossRef]
  17. Piemonte, V.; Falco, M.D.; Tarquini, P.; Giaconia, A. Life Cycle Assessment of a high temperature molten salt concentrated solar power plant. Sol. Energy 2011, 85, 1101–1108. [Google Scholar] [CrossRef]
  18. Simons, A.; Firth, S.K. Life-cycle assessment of a 100% slar fraction thermal supply to a European apartment building using water-based sensible heat storage. Energy Build. 2011, 43, 1231–1240. [Google Scholar] [CrossRef] [Green Version]
  19. Gracia, A.d.; Rincón, L.; Castell, A.; Jiménez, M.; Boer, D.; Medrano, M.; Cabeza, L.F. Life Cycle Assessment of the inclusion of phase change materials (PCM) in experimental buildings. Energy Build. 2010, 42, 1517–1523. [Google Scholar] [CrossRef]
  20. Liu, C.; He, C.; Gao, H.; Xie, H.; Li, Y.; Wu, S.; Xu, J. The environmental impact of organic Rankine cycle for waste heat recovery through life-cycle assessment. Energy 2013, 56, 144–154. [Google Scholar] [CrossRef]
  21. Wang, J.; Yang, Y.; Mao, T.; Sui, J.; Jin, H. Life cycle assessment (LCA) optimization of solar-assisted hybrid CCHP system. Appl. Energy 2015, 146, 38–52. [Google Scholar] [CrossRef]
  22. Haller, M.Y.; Cruickshank, C.A.; Streicher, W.; Harrison, S.J.; Andersen, E.; Furbo, S. Methods to determine stratification efficiency of thermal energy storage processes—Review and theoretical comparison. Sol. Energy 2009, 83, 1847–1860. [Google Scholar] [CrossRef]
  23. Alva, G.; Liu, L.; Huang, X.; Fang, G. Thermal energy storage materials and systems for solar energy applications. Renew. Sustain. Energy Rev. 2017, 68, 693–706. [Google Scholar] [CrossRef]
  24. Schulz, R.; Suchi, E.; Öhlschläger, D.; Dittmann, J.; Knopf, S.; Müller, C. Geothermie-Atlas zur Darstellung Möglicher Nutzungskonkurrenzen Zwischen CCS und Tiefer Geothermie. Available online: https://www.geotis.de/homepage/sitecontent/info/publication_data/final_reports/final_reports_data/Endbericht_Geothermie_Atlas.pdf (accessed on 22 June 2020).
  25. Stober, I.; Fritzer, T.; Obst, K.; Schulz, R. Tiefe Geothermie–Nutzungsmöglichkeiten in Deutschland. Project Report 2011. Available online: https://www.mags-projekt.de/MAGS/DE/Downloads/BMU_Nutzung.pdf?__blob=publicationFile&v=1 (accessed on 22 June 2020).
  26. Agemar, T.; Schellschmidt, R.; Schulz, R. Subsurface Temperature Distribution of Germany. Geothermics 2012, 44, 65–77. [Google Scholar] [CrossRef]
  27. Klöpffer, W.; Grahl, B. Ökobilanz (LCA): Ein Leitfaden für Ausbildung und Beruf; Wiley-VCH Verlag GmbH & Co. KGaA: Weinheim, Germany, 2009. [Google Scholar]
  28. Ondrak, R.; Wenderoth, F.; Scheck, M.; Bayer, U. Integrated geothermal modeling on different scales in the Northeast German basin. Geol. Rundsch. 1998, 87, 32–42. [Google Scholar] [CrossRef]
  29. Company Sulzer. Environmental Product Declaration—EPD: MD 150–360 High Pressure Stage Casing Pump with Skid; Company Sulzer: Winterthur, Switzerland, 2010. [Google Scholar]
  30. Shah, K.N.; Varandani, N.S.; Panchani, M. Life Cycle Assessment of Household Water Tanks—A Study of LLDPE, Mild Steeland RCC Tanks. J. Environ. Prot. 2016, 7, 760–769. [Google Scholar] [CrossRef] [Green Version]
  31. Frick, S.; Schröder, G.; Rychtyk, M.; Bohnenschäfer, W.; Kaltschmitt, M. Umwelteffekte einer geothermischen Stromerzeugung—Analyse und Bewertung der klein- und großräumigen Umwelteffekte einer geothermischen Stromerzeugung; Research Project of the German Federal Environment Agency: Dessau-Roßlau, Germany, 2007. [Google Scholar]
  32. Company Anger. Geothermie Tiefbohrungen. In H. Angers Söhne Bohr- und Brunnenbau GmbH; Company Anger: Hessisch Lichtenau, Germany, 2014. [Google Scholar]
  33. Kayser, M. Energetische Nutzung hydrothermaler Erdwärmevorkommen in Deutschland—Eine energiewirtschaftliche Analyse. Ph.D. Thesis, University of Stuttgart, Stuttgart, Germany, 1999. [Google Scholar]
  34. Company ABB. Environmental Product Declaration: AC Low Voltage Cast Iron Motor, Type M3BP 315; Company ABB: Vaasa, Finland, 2003. [Google Scholar]
  35. Legarth, B.A.; Saadat, A. Energy Consumption for Geothermal Wells. In Proceedings of the World Geothermal Congress, Antalya, Turkey, 24–29 April 2005. [Google Scholar]
  36. Bianco, I. Life Cycle Inventory of cutting technologies in the ornamental stone supply chain. Ph.D. Thesis, University of Turin, Turin, Italy, 2018. [Google Scholar]
  37. Company Sulzer. Environmental Product Declaration—EPD: XFP PE4 Submersible Sewage Pump; Company Sulzer: Winterthur, Switzerland, 2012. [Google Scholar]
  38. Feck, N. Monte-Carlo-Simulation bei der Lebenszyklusanalyse eines Hot-Dry-Rock-Heizkraftwerks. Ph.D. Thesis, University of Bochum, Bochum, Germany, 2007. [Google Scholar]
  39. Biswas, W.; Rosano, M. A life cycle greenhouse gas assessment of remanufactured refrigeration and air conditioning compressors. Int. J. Sustain. Manuf. 2011, 2, 222–236. [Google Scholar] [CrossRef]
  40. Company Sulzer. Environmental Product Declaration—EPD: Environmental and Economic Life Cycle Performance Including Climate-Related Data; Company Sulzer: Winterthur, Switzerland, 2012. [Google Scholar]
  41. Recio, J.M.B.; Guerrero, P.J.; Ageitos, M.G.; Narváez, R.P. Estimate of Energy Consumption and CO2 Emission Associated With the Preoduction, Use and Final Disposal of PVC, HDPE, PP, Ductile Iron and Concrete Pipes; Universitat Politécnica de Catalunya: Barcelona, Spain, 2005. [Google Scholar]
  42. Adolfsson, M.; Rashid, S. Life Cycle Assessment and Life Cycle Cost of Heat Exchangers—A Case for Inter Terminals Sweden AB Located in Port of Gothenburg. Master’s Thesis, Chalmers University of Technology, Gothenburg, Sweden, 2016. [Google Scholar]
  43. Katz, S.; Lindner, A.S. A life-cycle comparison of several auxiliardy blowing agents used for the manufacture of rigid polyurethane foam. J. Air Waste Manag. Assoc. 2003, 53, 469–477. [Google Scholar] [CrossRef] [PubMed]
  44. Rastler, D. EPRI Project Manager. Electricity Energy Storage Technology Options—A White Paper Primer on Applications, Costs and Benefits; Electric Power Research Institute: Palo Alto, CA, USA, 2010. [Google Scholar]
  45. Chen, S.; Lian, Z.; Li, S.; Kim, J.; Li, Y.; Cao, L.; Liu, Z. The Environmental Burdens of Lead-Acid Batteries in China: Insights from an Integrated Material Flow Analysis and Life Cycle Assessment of Lead. Energies 2017, 10, 1969. [Google Scholar] [CrossRef] [Green Version]
  46. Liu, W.; Sang, J.; Chen, L.; Tian, J.; Zhang, H.; Palma, G.O. Life cycle assessment of lead-acid batteries used in electric bicycles in China. J. Clean. Prod. 2015, 108, 1149–1156. [Google Scholar] [CrossRef]
  47. Wang, Q.; Liu, W.; Yuan, X.; Tang, H.; Tang, Y.; Wang, M.; Zuo, J.; Song, Z.; Sun, J. Environmental Impact Analysis and Process Optimization of Batteries Based on Life Cycle Assessment. J. Clean. Prod. 2017, 174, 1262–1273. [Google Scholar] [CrossRef]
  48. Peters, J.F.; Baumann, M.; Zimmermann, B.; Braun, J.; Weil, M. The environmental impact of Li-Ion batteries and the role of key parameters—A review. Renew. Sustain. Energy Rev. 2017, 67, 491–506. [Google Scholar] [CrossRef]
Figure 1. Simplified Life Cycle Assessment.
Energies 13 03253 g001
Figure 2. System setup for the reversible HP / ORC storage system during: (a) charging and (b) discharging [3].
Energies 13 03253 g002
Figure 3. Map of Germany with potential geothermal hotspots.
Energies 13 03253 g003
Figure 4. LCA results of a geothermal station for: (a) AP; (b) GWP; (c) HTP and (d) CED.
Energies 13 03253 g004
Figure 5. t-Q-diagram for the heat storage heat exchanger for HP and ORC.
Energies 13 03253 g005
Figure 6. Life Cycle Assessment results of the heat storage system per MWh storage capacity for: (a) AP; (b) GWP; (c) HTP and (d) CED.
Energies 13 03253 g006
Figure 7. Sensitivity Analysis of different steel providers per MWh storage capacity for: (a) AP; (b) GWP; (c) HTP and (d) CED.
Energies 13 03253 g007
Figure 8. Analysis of use phase for pumped thermal energy storage and batteries per MWh storage capacity for: (a) AP; (b) GWP; (c) HTP and (d) CED.
Energies 13 03253 g008
Table 1. Minimum depth for hydrothermal usage (100 °C).
North German Basinm Rhine Valleym Molasse Basinm
Parchim2130 Landau in der Pfalz1020 Mühldorf am Inn1920
Perleberg2200 Böhl-Iggelheim1460 Mindelheim1950
Anklam2270 Darmstadt1600 München2060
Table 2. Minimum depth for petrothermal usage (150 °C).
North German Basinm Rhine Valleym Molasse Basinm
Vechelde3660 Landau in der Pfalz2150 --
Celle3780 Böhl-Iggelheim2400 --
Hannover3780 Karlsruhe3120 --
Table 3. Materials used for the “static” part of a geothermal station in t.
UnitDieselCementConcreteWoodGravelLow-alloy SteelDecalcified WaterQuartz SandInsulation
t9.321.32798119.7176166.2 260 · 10 3 6076
Table 4. Materials used for the “variable” part of a geothermal station in kg per meter depth.
UnitDieselCementSteelTungsten CarbideDecalcified WaterLow-Alloy SteelHigh-Alloy Steel
kg/m154.572.980.00786886934
Table 5. Life Cycle Assessment results for Perleberg with 4181 m and 241 m 3 /h.
AP in t SO 2 eq.GWP in t CO 2 eq.HTP in t 1.4-DB eq.CED in GJ
52.825,658612192,895
Table 6. Static and variable parts of the LCA for Perleberg with 4181 m and 241 m 3 /h.
Environmental InfluenceLCAstaticLCAdepthLCAthermal
AP in t SO2 eq.14.821.216.7
GWP in t CO2 eq.5981948510,191
HTP in t 1.4-DB eq.199235178
CED in GJ38,835101,31652,743
Table 7. Error in % for calculated LCA results with formula approach.
Environmental InfluencePerleberg 4181 m + 241 m 3 /hPerleberg 3192 mPerleberg 95 m 3 /hRheinau 3192 m + 95 m 3 /h
AP0.110.121.171.34
GWP0.120.131.441.65
HTP0.090.101.041.17
CED0.090.111.041.23
Table 8. Used physical composition for a generator, compressor and pump in kg pro kW.
MaterialGeneratorCompressor/TurbinePump
Electrical Sheet3.98--
Steel0.681.12.01
Cast Iron0.129.91.3
Aluminium0.120.21-
Copper0.450.53-
Table 9. Comparison between storage and source of electricity.
Evaluated FeatureAP in kg SO 2 eq.GWP in kg CO 2 eq.HTP in kg 1.4-DB eq.CED in GJ
Heat Storage18.515998.6213.9574.6
PV36870,98283,926838
Wind21530063753.5
Mix970566,15115,9765357
Table 10. LCA for different battery systems per MWh storage capacity.
BatteryAP in kg SO 2 eq.GWP in kg CO 2 eq.HTP in kg 1.4-DB eq.CED in GJ
Lead-Acid235109,8253731636
LFP1294161,463260,015976
NCM2034160,463482,0151036

